danareksa market outlook 2011
TRANSCRIPT
E Q U I T Y R E S E A R C H
www.danareksa.com See important disclosure on the back of this report
Market Outlook2011 roadmap
OVERWEIGHT
JCI Index 3,581YE11F target 4,100Mkt Cap Rp tn 3,123in US$bn 346
09 10E 11F
GDP growth, % 4.5 6.1 6.43mth Deposit, % 7.5 6.6 6.2Inflation MoM, % 2.8 6.3 6.0Inflation YoY, % 2.8 6.5 6.2Rp/US$ YE 9,400 9,071 9,304Rp/US$ average 10,356 9,099 9,214
Indonesia Economic Indicators
Equity Research TeamHead of Equity ResearchBonny B. Setiawan CFA(62-21) 2352 [email protected]
AnalystsChandra S. Pasaribu(62-21) 351 [email protected]
Lydia Suwandi(62-21) 350 9888 ext. [email protected]
Merlissa P.Trisno(62-21) 350 9888 ext. [email protected]
Peter P. Sutedja(62-21) 350 9888 ext. [email protected]
Indra P. Yudison(62-21) 350 9888 ext. [email protected]
Metty F. Wardhani(62-21) 350 9888 ext. [email protected]
Research AssistantsEdwin Sabam S/Vina Hosea(62-21) 350 9888 ext. 3505/[email protected]@danareksa.com
EditorMartin R. Jenkins(62-21 350 9888 ext. [email protected]
The market has shown strong performance in 2010, with the JCI up 41.3% YTD, at a 14.9x 12-mth forward PER, thanks to strong earnings growth amidst brisk economic expansion.Indeed, our economic cycle is still at an early phase of a 7-year cycle, meaning strong earningsgrowth to come. We now set our FY11E index target at 4,100, based on a bottom-up approach,implying 16.3x 2011 PER. Our conviction is supported by continuation of benign inflationand therefore record low interest rates, sustainable earnings growth of 24.8% and anupsurge in FDI-led investment growth. Our estimate of 2011 GDP growth remains at 6.4%,buoyed by robust investment aside from the higher consumption growth. Bank lending hasbeen supportive as well, with loans growth likely to reach 18.6% next year. Upside is froma potential upgrade in the sovereign rating and realization of infrastructure projects, whiledownside risks are potential global economic slowdown and a sudden upsurge in inflation.
22 December 2010
Cut off data December 17,2010

2
2011 Outlook
Recommendation Page
Market outlook OVERWEIGHT 3Automotive parts OVERWEIGHT 13Banking sector OVERWEIGHT 15Coal sector OVERWEIGHT 19Consumer sector NEUTRAL 23Plantation sector OVERWEIGHT 27Property sector OVERWEIGHT 31
Recommendation Target Price PageRp/share
ACE Hardware Indonesia HOLD 2,550 35Adaro Energy BUY 2,950 39AKR Corporindo SELL 1,340 43Alam Sutera Realty BUY 400 47Astra Agro Lestari HOLD 24,500 51Astra International HOLD 58,500 57Bakrie Telecom HOLD 240 61Bank Central Asia HOLD 7,000 65Bank Danamon BUY 8,050 69Bank Mandiri BUY 8,300 73Bank Negara Indonesia BUY 5,700 77Bank Rakyat Indonesia BUY 14,400 81Bayan Resources SELL 9,700 85Bukit Asam BUY 26,650 89Bumi Resources BUY 3,625 93Bumi Serpong Damai BUY 890 97BW Plantation BUY 1,350 101Ciputra Development BUY 450 107Gajah Tunggal BUY 3,125 111Gudang Garam BUY 55,000 115Holcim Indonesia BUY 3,170 119Indika Energy BUY 4,825 123Indo Tambangraya Megah HOLD 55,300 127Indocement Tunggal Prakarsa BUY 19,820 131Indofood CBP HOLD 5,500 135Indofood Sukses Makmur BUY 6,000 139Indosat SELL 6,400 143Jasa Marga BUY 4,300 147Kalbe Farma HOLD 3,500 151Lippo Karawaci BUY 1,272 155London Sumatera BUY 14,850 159Mayora Indah HOLD 13,000 165Mitra Adiperkasa HOLD 2,600 169Multistrada Arah Sarana BUY 530 173Perusahaan Gas Negara BUY 5,400 177Ramayana Lestari Sentosa BUY 1,120 181Sampoerna Agro BUY 3,700 185Selamat Sempurna BUY 1,500 191Semen Gresik BUY 10,875 195Sorini Asia Corporindo SELL 2,350 199Summarecon Agung HOLD 1,400 203Telkom Indonesia BUY 9,550 207Tempo Scan Pacific BUY 2,050 211Unilever Indonesia SELL 15,000 215United Tractors BUY 27,250 219XL Axiata BUY 7,500 223
Table of contents
3
2011 Outlook
Market Outlook2011 roadmap
New index target set at 4,100The market has shown strong performance in 2010, with the JCI up 41.3% YTD, at a 14.9x 12-mthforward PER, thanks to strong earnings growth amidst brisk economic expansion. Indeed, oureconomic cycle is still at an early phase of a 7-year cycle, meaning strong earnings growth to come.We now set our FY11E index target at 4,100, based on a bottom-up approach, implying 16.3x 2011PER. Our conviction is supported by continuation of benign inflation and therefore record lowinterest rates, sustainable earnings growth of 24.8% and an upsurge in FDI-led investment growth.Our estimate of 2011 GDP growth remains at 6.4%, buoyed by robust investment aside from thehigher consumption growth. Bank lending has been supportive as well, with loans growth likelyto reach 18.6% next year. Upside is from a potential upgrade in the sovereign rating and realizationof infrastructure projects, while downside risks are potential global economic slowdown and asudden upsurge in inflation.
The macro outlook looks rosyWhile inflation carries a big risk to our economy, the recent years of economic expansion havetended to insulate consumers from rising costs. We estimate inflation to rise to 6.2% by YE11, nota big jump from the current year’s 6.0%, although we may see some upward pressure mid-year.The BI rate is likely to be kept at 6.5% - that’s assuming BI’s inflation-targeting policy still stands.Continuity in food supplies – specifically rice, is one of the big risks, we believe, given a lack ofinfrastructure. Yet market operations and the likelihood the government doesn’t obstruct importsmay ease demand-pull inflation. Concerns over the growing base money (M0), and thereforepotentially higher inflation, appear to be unfounded, as well. This is especially true given the briskrate of GDP growth. Besides, one needs to consider the unused government account in BIamounting to Rp169trn as of October.
So, what may derail our inflation forecast? Well, food supply issues aside, efforts to reduce theconsumption of subsidized fuel is a challenge. Only recently, the nation’s parliament approveda long-awaited measure curbing fuel subsidies. By the end of March next year, subsidized fuel shallonly be available for public transport vehicles and motorcycles. As a result, inflation is likely toincrease by 0.3%, not much, we think; although that’s assuming that only private cars are prohibitedfrom using subsidized fuel.
Investment driven growthThe key theme for economic expansion remains investment growth and government spending.So far, FDI has increased by 27.5% YoY to about US$11.9bn and by 43.6% for domestic investment.Despite the economic expansion, production utilization is relatively unchanged, which in a waysuggests that demand has kept pace with the investment growth. What remains a bottleneck toour economy is realization of infrastructure projects, although around US$47bn are expected tobe tendered over the next 5 years. Next year, investment growth should reach a strong 12.9% -after a good start this year. Much will hinge on the ability of banks to lend aggressively. Thus far,lending has been robust, and as the economy continues to expand, loans growth is expected tostay above 15% p.a.
OVERWEIGHT
JCI Index 3581YE11 target 4,100Mkt Cap Rp tn 3,123in US$mn 346
09 10E 11FGDP growth, % 4.5 6.1 6.43mth Deposit, % 7.5 6.6 6.2Inflation MoM, % 2.8 6.3 6.0Inflation YoY, % 2.8 6.5 6.2Rp/US$ YE 9,400 9,071 9,304Rp/US$ average 10,356 9,099 9,214
Economic Indicators
4
2011 Outlook
Cyclical stocks likely to outperformEarnings growth shall stay firm next year, reaching 25.1% on a yearly basis. Cyclical stocksexposed to commodities shall drive earnings expansion, although we also remain upbeaton the prospects for property stocks – which stand to book strong revenues thanks torobust marketing sales this year, aside from sustained bank lending. In regard tocommodity stocks, supply constraints on the back of harsh weather may drive commodityprices further up, helped by strong demand from China and India. The plantation sectorshall see earnings expand by 46.9% next year, while the mining sector’s earnings are forecastto grow by 34.6%. On that note, our top picks include ADRO, UNTR, LSIP and BWPT. Yet thestrength of the economy remains domestic consumption. And buoyed by the early phaseof economic expansion, INDF and GGRM are two major beneficiaries. Other stocks exposedto domestic consumption that we like are BBRI, INTP, JSMR and ASRI. Among the smallerstocks, we like MASA.
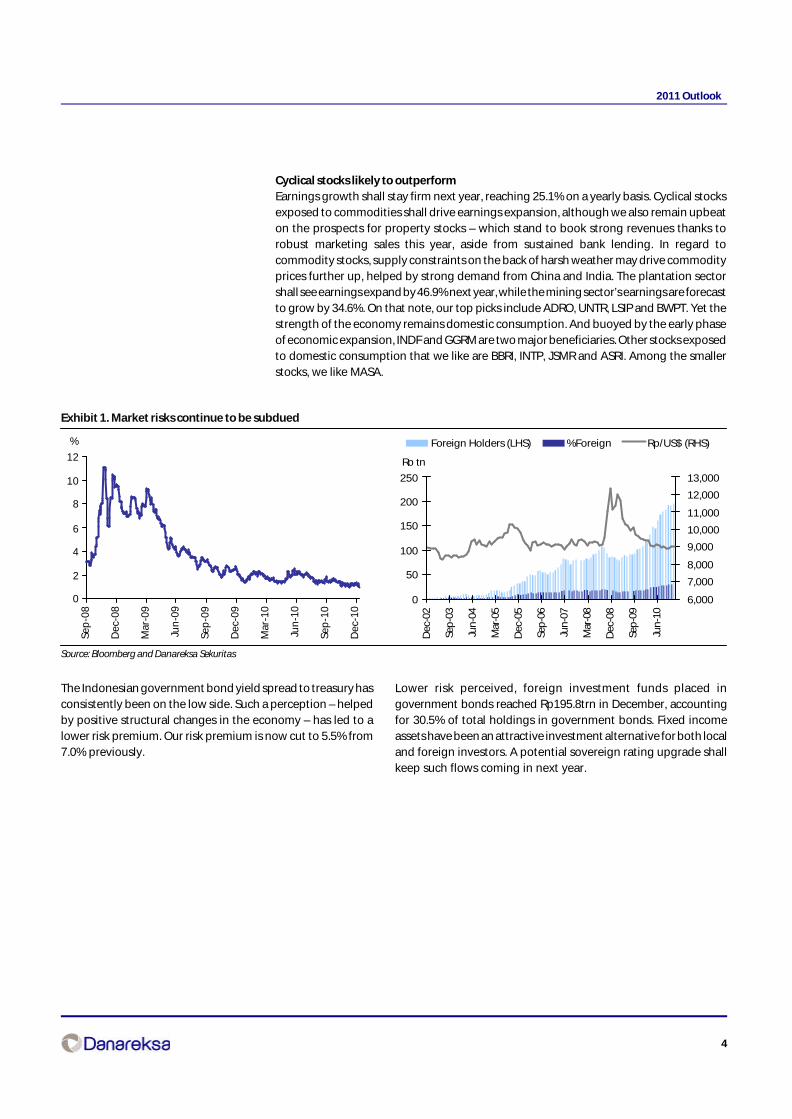
Exhibit 1. Market risks continue to be subdued
Source: Bloomberg and Danareksa Sekuritas
0
2
4
6
8
10
12
Sep
-08
Dec
-08
Mar
-09
Jun
-09
Sep
-09
Dec
-09
Mar
-10
Jun
-10
Sep
-10
Dec
-10
%
0
50
100
150
200
250
Dec
-02
Sep
-03
Jun
-04
Mar
-05
Dec
-05
Sep
-06
Jun
-07
Mar
-08
Dec
-08
Sep
-09
Jun
-10
6,000
7,000
8,000
9,000
10,000
11,000
12,000
13,000
Foreign Holders (LHS) %Foreign Rp/US$ (RHS)
Rp tn
The Indonesian government bond yield spread to treasury hasconsistently been on the low side. Such a perception – helpedby positive structural changes in the economy – has led to alower risk premium. Our risk premium is now cut to 5.5% from7.0% previously.
Lower risk perceived, foreign investment funds placed ingovernment bonds reached Rp195.8trn in December, accountingfor 30.5% of total holdings in government bonds. Fixed incomeassets have been an attractive investment alternative for both localand foreign investors. A potential sovereign rating upgrade shallkeep such flows coming in next year.
5
2011 Outlook
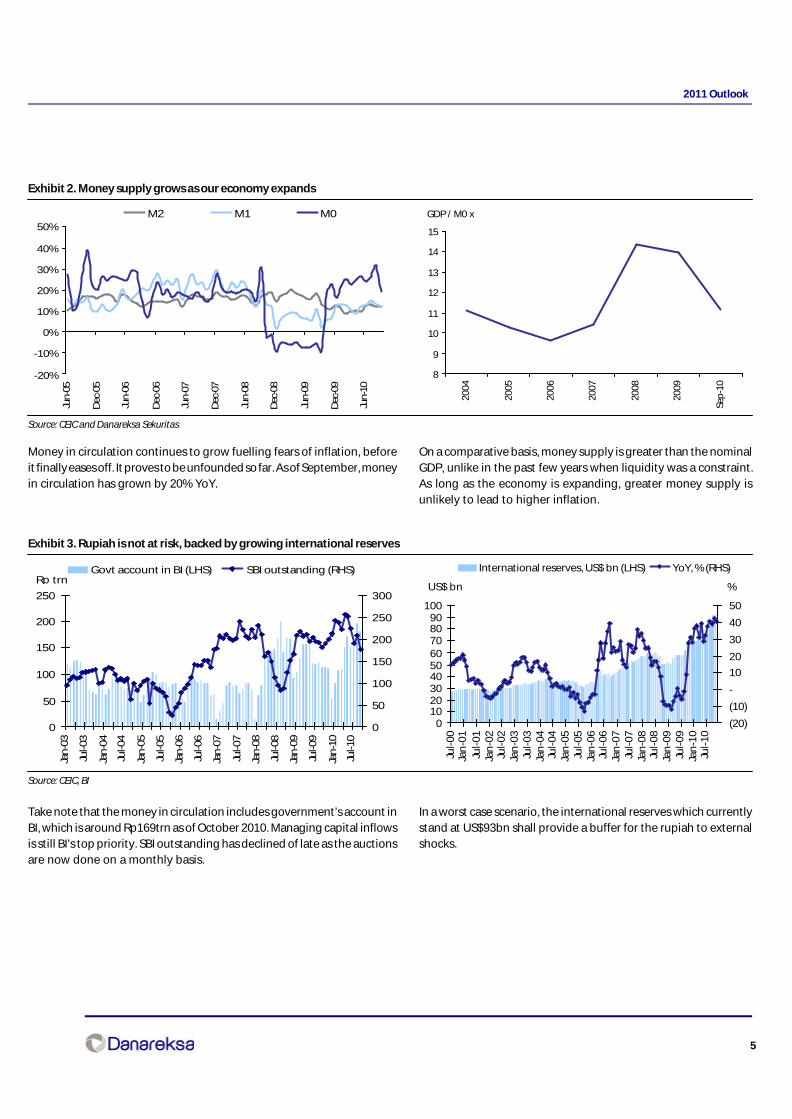
Exhibit 2. Money supply grows as our economy expands
Source: CEIC and Danareksa Sekuritas
Money in circulation continues to grow fuelling fears of inflation, beforeit finally eases off. It proves to be unfounded so far. As of September, moneyin circulation has grown by 20% YoY.
On a comparative basis, money supply is greater than the nominalGDP, unlike in the past few years when liquidity was a constraint.As long as the economy is expanding, greater money supply isunlikely to lead to higher inflation.
Exhibit 3. Rupiah is not at risk, backed by growing international reserves
Source: CEIC, BI
Take note that the money in circulation includes government’s account inBI, which is around Rp169trn as of October 2010. Managing capital inflowsis still BI’s top priority. SBI outstanding has declined of late as the auctionsare now done on a monthly basis.
In a worst case scenario, the international reserves which currentlystand at US$93bn shall provide a buffer for the rupiah to externalshocks.
-20%
-10%
0%
10%
20%
30%
40%
50%
Jun-
05
Dec
-05
Jun-
06
Dec
-06
Jun-
07
Dec
-07
Jun-
08
Dec
-08
Jun-
09
Dec
-09
Jun-
10
M2 M1 M0
8
9
10
11
12
13
14
15
2004
2005
2006
2007
2008
2009
Sep
-10
GDP / M0 x
0
50
100
150
200
250
Jan
-03
Jul-0
3
Jan
-04
Jul-0
4
Jan
-05
Jul-0
5
Jan
-06
Jul-0
6
Jan
-07
Jul-0
7
Jan
-08
Jul-0
8
Jan
-09
Jul-0
9
Jan
-10
Jul-1
0
0
50
100
150
200
250
300
Govt account in BI (LHS) SBI outstanding (RHS)Rp trn
0102030405060708090
100
Jul-
00
Jan
-01
Jul-
01
Jan
-02
Jul-
02
Jan
-03
Jul-
03
Jan
-04
Jul-
04
Jan
-05
Jul-
05
Jan
-06
Jul-
06
Jan
-07
Jul-
07
Jan
-08
Jul-
08
Jan
-09
Jul-
09
Jan
-10
Jul-
10
(20)
(10)
-
10
20
30
40
50
International reserves, US$ bn (LHS) YoY, % (RHS)
US$ bn %

6
2011 Outlook
Exhibit 4. Economy growth remains firm
Source: CEIC and Danareksa Research Institute
Our GDP growth forecasts are 6.0% and 6.4%, respectively, forFY10-11. 3Q10’s GDP growth of 5.8% is the sixth straightquarterly increase, with consumption growing at 5.2%, a slightimprovement from 2Q10’s 5.0%. We expect consumption tostay firm next year, posting 5.0% growth by YE11. By 2014, SBYtargets 7.0-7.7% GDP growth..
October’s exports jumped 16.7% MoM to US$14.22bn, largely drivenby oil & gas related items. On a YoY basis, Jan-Oct exports rose by35.5%. The largest export growth for non oil and gas related itemscame from rubber, +95% YoY, and mining, +33% YoY, whileagricultural exports only grew 34% YoY. As of October, the tradebalance was a surplus of US$13.5bn.
Exhibit 5. Investment realization has picked up
Source: Investment Cordinating Board
The strength of the economy relies on investment growth. FDIreached US$11.9bn in 9M10, up 27.5% YoY, far exceeding thepre-crisis level. What remains a bottleneck is realization ofinfrastructure projects, with around US$47bn to be tenderedover the next 5 years.
Meanwhile, domestic investment realization was more than Rp40.4trnin 9M10 or +43.6% YoY. It has reached an historic high.
0.0
1.0
2.0
3.0
4.0
5.0
6.0
7.0
8.0
Mar
-02
Sep
-02
Mar
-03
Sep
-03
Mar
-04
Sep
-04
Mar
-05
Sep
-05
Mar
-06
Sep
-06
Mar
-07
Sep
-07
Mar
-08
Sep
-08
Mar
-09
Sep
-09
Mar
-10
Sep
-10
Mar
-11
Sep
-11
-5.0
0.0
5.0
10.0
15.0
20.0
GDP (LHS) Private (RHS) Investment (RHS)
% %
-5,000
10,000
15,000
20,00025,000
30,000
35,00040,000
45,000
Mar
-08
Jun
-08
Sep
-08
Dec
-08
Mar
-09
Jun
-09
Sep
-09
Dec
-09
Mar
-10
Jun
-10
Sep
-10
-1,0002,000
3,000
4,0005,000
6,000
7,0008,000
9,000
Imports Export Trade balanceUS$ mn US$ mn
Source: BPS
0.0
2.0
4.0
6.0
8.0
10.0
12.0
14.0
16.0
1990
1991
1992
1993
1994
1995
1996
1997
1998
1999
2000
2001
2002
2003
2004
2005
2006
2007
2008
2009
9M10
-100%
-50%
0%
50%
100%
150%
200%
250%
Foreign investment, US$ bn (LHS) YoY growth, % (RHS)
Rp trn
0.05.0
10.015.020.025.0
30.035.040.045.0
19
90
19
91
19
92
19
93
19
94
19
95
19
96
19
97
19
98
19
99
20
00
20
01
20
02
20
03
20
04
20
05
20
06
20
07
20
08
20
09
9M10
-80%-60%-40%-20%0%20%40%60%80%100%120%
Domestic investment, Rp trn (LHS) YoY growth, % (RHS)
Rp trn
7
2011 Outlook
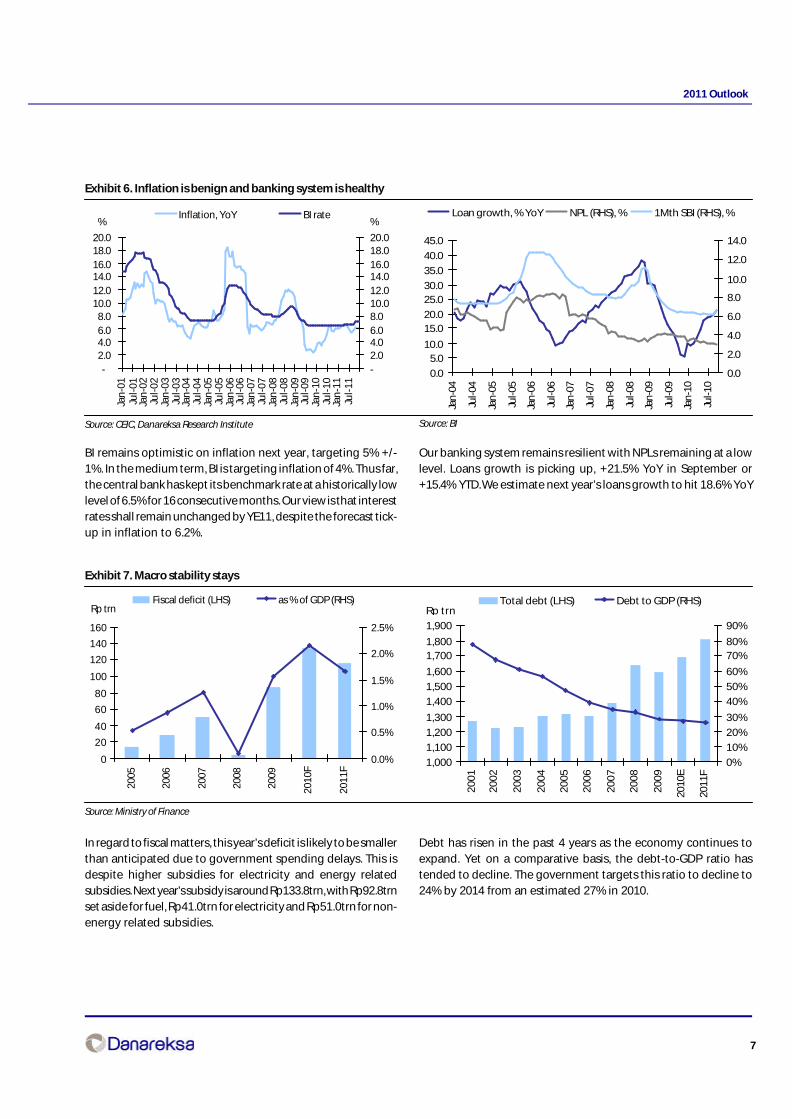
Exhibit 6. Inflation is benign and banking system is healthy
Source: CEIC, Danareksa Research Institute
BI remains optimistic on inflation next year, targeting 5% +/-1%. In the medium term, BI is targeting inflation of 4%. Thus far,the central bank has kept its benchmark rate at a historically lowlevel of 6.5% for 16 consecutive months. Our view is that interestrates shall remain unchanged by YE11, despite the forecast tick-up in inflation to 6.2%.
Our banking system remains resilient with NPLs remaining at a lowlevel. Loans growth is picking up, +21.5% YoY in September or+15.4% YTD. We estimate next year’s loans growth to hit 18.6% YoY
Exhibit 7. Macro stability stays
Source: Ministry of Finance
In regard to fiscal matters, this year’s deficit is likely to be smallerthan anticipated due to government spending delays. This isdespite higher subsidies for electricity and energy relatedsubsidies. Next year’s subsidy is around Rp133.8trn, with Rp92.8trnset aside for fuel, Rp41.0trn for electricity and Rp51.0trn for non-energy related subsidies.
Debt has risen in the past 4 years as the economy continues toexpand. Yet on a comparative basis, the debt-to-GDP ratio hastended to decline. The government targets this ratio to decline to24% by 2014 from an estimated 27% in 2010.
Source: BI
-2.04.06.08.0
10.012.014.016.018.020.0
Jan
-01
Jul-
01Ja
n-0
2Ju
l-02
Jan
-03
Jul-
03Ja
n-0
4Ju
l-04
Jan
-05
Jul-
05Ja
n-0
6Ju
l-06
Jan
-07
Jul-
07Ja
n-0
8Ju
l-08
Jan
-09
Jul-
09Ja
n-1
0Ju
l-10
Jan
-11
Jul-
11
-2.04.06.08.010.012.014.016.018.020.0
Inflation, YoY BI rate% %
0.0
5.010.0
15.020.0
25.030.0
35.0
40.0
45.0
Jan
-04
Jul-0
4
Jan
-05
Jul-0
5
Jan
-06
Jul-0
6
Jan
-07
Jul-0
7
Jan
-08
Jul-0
8
Jan
-09
Jul-0
9
Jan
-10
Jul-1
0
0.0
2.0
4.0
6.0
8.0
10.0
12.0
14.0
Loan growth, % YoY NPL (RHS), % 1Mth SBI (RHS), %
0
20
40
60
80
100
120
140
160
2005
2006
2007
2008
2009
2010
F
2011
F
0.0%
0.5%
1.0%
1.5%
2.0%
2.5%
Fiscal deficit (LHS) as % of GDP (RHS)Rp trn
1,000
1,100
1,200
1,300
1,400
1,500
1,600
1,7001,800
1,900
20
01
20
02
20
03
20
04
20
05
20
06
20
07
20
08
20
09
2010
E
2011
F
0%
10%
20%
30%
40%
50%
60%
70%80%
90%
Total debt (LHS) Debt to GDP (RHS)Rp trn
8
2011 Outlook
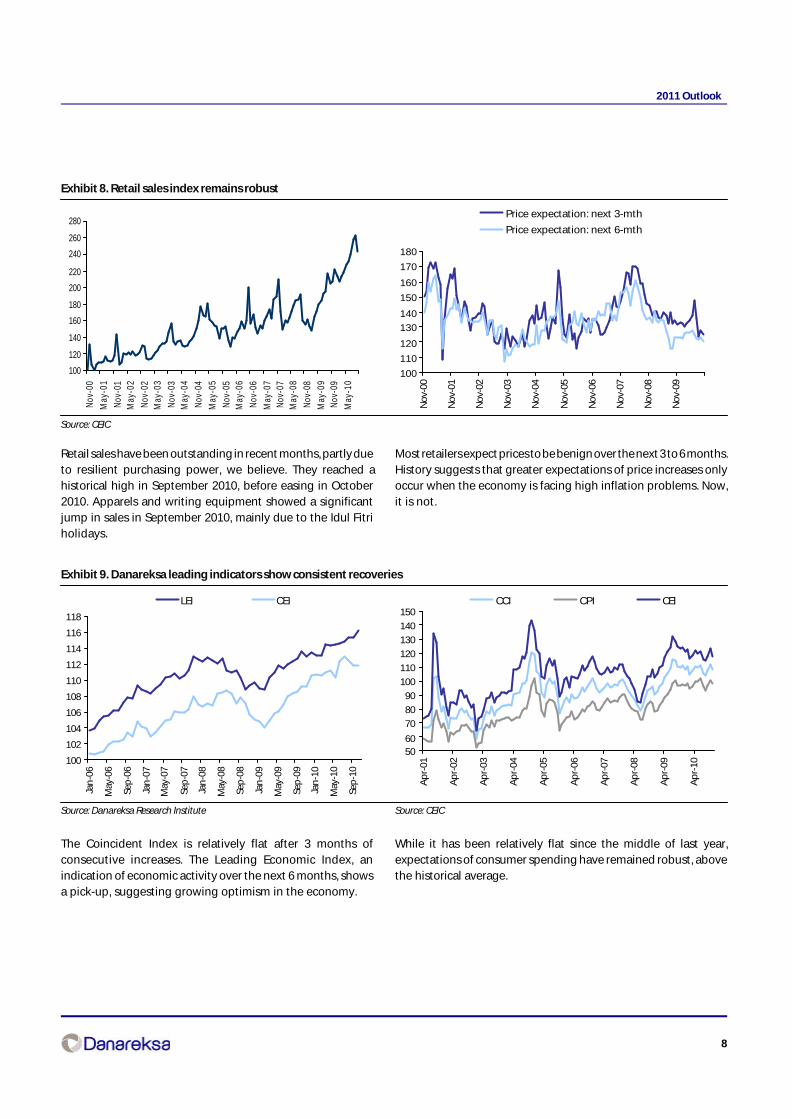
Exhibit 8. Retail sales index remains robust
Source: CEIC
Retail sales have been outstanding in recent months, partly dueto resilient purchasing power, we believe. They reached ahistorical high in September 2010, before easing in October2010. Apparels and writing equipment showed a significantjump in sales in September 2010, mainly due to the Idul Fitriholidays.
Most retailers expect prices to be benign over the next 3 to 6 months.History suggests that greater expectations of price increases onlyoccur when the economy is facing high inflation problems. Now,it is not.
100
110
120
130
140
150
160
170
180
No
v-00
No
v-01
No
v-02
No
v-03
No
v-04
No
v-05
No
v-06
No
v-07
No
v-08
No
v-09
Price expectation: next 3-mth
Price expectation: next 6-mth
100
120
140
160
180
200
220
240
260
280
Nov-
00M
ay-0
1No
v-01
May
-02
Nov-
02M
ay-0
3No
v-03
May
-04
Nov-
04M
ay-0
5No
v-05
May
-06
Nov-
06M
ay-0
7No
v-07
May
-08
Nov-
08M
ay-0
9No
v-09
May
-10
Exhibit 9. Danareksa leading indicators show consistent recoveries
Source: Danareksa Research Institute
The Coincident Index is relatively flat after 3 months ofconsecutive increases. The Leading Economic Index, anindication of economic activity over the next 6 months, showsa pick-up, suggesting growing optimism in the economy.
While it has been relatively flat since the middle of last year,expectations of consumer spending have remained robust, abovethe historical average.
100
102
104
106
108
110
112
114
116
118
Jan
-06
May
-06
Sep
-06
Jan
-07
May
-07
Sep
-07
Jan
-08
May
-08
Sep
-08
Jan
-09
May
-09
Sep
-09
Jan
-10
May
-10
Sep
-10
LEI CEI
Source: CEIC
5060
70
80
90
100
110
120
130
140
150
Ap
r-01
Ap
r-02
Ap
r-03
Ap
r-04
Ap
r-05
Ap
r-06
Ap
r-07
Ap
r-08
Ap
r-09
Ap
r-10
CCI CPI CEI

9
2011 Outlook
Exhibit 10. Risks: higher inflation and fuel prices
Source: BPS
November’s inflation was 0.60%, mainly contributed by higher processedfood prices. It contributed 63% of total inflation, which rose by 0.38%in October. On a YoY basis, inflation is 5.98%. Core inflation is 4.31%YoY or 3.89% YTD.
The restrictions on the use of subsidized fuel, starting next year, areunlikely to have a significant impact on inflation – around 0.3%,according to our estimates. Note that for every 10% increase in fuelprices, the impact on inflation is 0.7%
Exhibit 11. Corporate profitability
Source: Bloomberg and Danareksa Sekuritas
2007 core earnings growth was driven by resources. Since 2008,consumers and banks have taken the lead. The 19.2% YoY coreearnings growth forecast for 2010 bodes well for a good year.Resources and cyclical stocks shall see faster growth than other stocksnext year. We estimate 25.1% YoY earnings growth next year.
The ROE will continue to be robust at 25%, while the capex to salesratio is estimated to reach 12%. The fact that companies areinvesting more suggests corporate optimism toward future growth.Revenues are estimated to pick up next year amidst economicrecovery.
Source: Danareksa Research Institute
100105110115120125130135140145150
Jan
-09
Mar
-09
May
-09
Jul-0
9
Sep
-09
No
v-09
Jan
-10
Mar
-10
May
-10
Jul-1
0
Sep
-10
No
v-10
CPI FoodF&B, Tobacco Housing, Electricity, FuelClothing HealthEducation Transportation
0
50
100
150
200
250
2005 2006 2007 2008 2009 2010F 2011F
0%
1%
1%2%
2%
3%3%
4%4%
5%
5%
Fuel subsidy (LHS) as % of GDP (RHS)Rp trn
-50%
0%
50%
100%
150%
200%
2007 2008 2009 2010F 2011F
0%
10%
20%
30%
40%
50%
60%
70%
Banks Cyclical Consumer
Resources Total
Source: Danareksa Sekuritas
0%
5%
10%
15%
20%
25%
30%
2007 2008 2009 2010F 2011F
ROAE Capex to sales Revenue growth

10
2011 Outlook
Exhibit 12. Trading values
Source: IDX and Danareksa Sekuritas
The JCI has risen by 1,000 points from its low in February 2010.Daily trading remains high, averaging around Rp4.5trn per day,or about US$502mn. Trading activities are dominated by localsrather than foreign players.
Foreign players were net sellers of Rp2.5trn or around US$280mnin November 2010. Yet from Jan-Nov 10, foreign players were netbuyers of around US$2.1bn, with the largest net inflow in September2010.
Exhibit 13. JCI valuation – index target is 4,100
Source: Danareksa Sekuritas and IDX (Closing price as of Dec 16, 2010)
The market PE has re-rated over the past 1 year and is arguablylikely to continue re-rating - albeit more slowly - given greaterearnings visibility and potential upside from earnings revisions.
868.
4 1,98
9.8
(2,6
56.3
)1,
460.
0 3,79
3.6
(444
.6)
(895
.4)
467.
22,
694.
44,
140.
16,
461.
182
4.4
(1,1
60.2
)(5
61.5
)1,
815.
32,
602.
01,
973.
874
6.5
3,08
9.8
1,34
4.7
92
4.9
(3,1
18.1
)1,
793.
9 3,83
9.4
832.
7(2
,007
.9)
4,92
2.0
1,52
4.1
4,81
1.1
2,03
0.3
5,91
6.6
322.
2(2
,514
.9)
4,49
6.6
(1,6
52.0
)
-7,000
-5,000
-3,000
-1,000
1,000
3,000
5,000
7,000
Jan
-08
Ap
r-08
Jul-0
8
Oct
-08
Jan
-09
Ap
r-09
Jul-0
9
Oct
-09
Jan
-10
Ap
r-10
Jul-1
0
Oct
-10
Rp bn
0.02.04.06.08.0
10.012.014.016.0
Jan
-10
Feb
-10
Mar
-10
Ap
r-10
May
-10
Jun
-10
Jul-
10
Au
g-1
0Se
p-1
0O
ct-1
0N
ov-
101
-Dec
-10
2-D
ec-1
03
-Dec
-10
6-D
ec-1
08
-Dec
-10
9-D
ec-1
010
-Dec
-10
13-D
ec-1
014
-Dec
-10
15-D
ec-1
016
-Dec
-10
2,5002,7002,9003,1003,3003,5003,7003,900
Average Daily transaction (LHS) Foreign transaction (LHS)
Domestic Transaction (LHS) JCI Index (RHS)Rp trn
-
5
10
15
20
Jan
-01
Jan
-02
Jan
-03
Jan
-04
Jan
-05
Jan
-06
Jan
-07
Jan
-08
Jan
-09
Jan
-10
P/E Forward +2st.dev +1st.dev
Mean -1st.dev -2st.dev
x
14.9
7.0
18.9
The mining and agriculture sectors have underperformed so far.The banking and consumer sectors outperformed. Our view ofstrong global demand suggests that resources and agriculturestocks will continue to do well over the next 6 months.
Change in %16-Dec-10 1 Week 1 Month 3 Months 1 Year Ytd
Trade 457 (0.3) 9.9 25.1 70.6 65.7Consumer 1,045 (8.3) (9.8) (4.3) 59.6 55.6Finance 464 (7.6) (3.4) 6.7 56.6 54.0Misc. Industry 899 (7.6) (7.8) (6.8) 50.1 49.4JCI Index 3,572 (5.7) (2.9) 5.5 42.3 40.9Basic Industry 385 (4.5) (3.1) (2.3) 43.2 40.5Property 202 (1.8) 0.5 9.8 40.3 37.9Mining 3,005 (4.4) (0.2) 20.4 39.6 36.4Agriculture 2,153 (3.1) (8.2) 15.1 20.6 22.8Infrastructure 796 (4.3) (3.5) (0.8) 6.9 9.3

11
2011 Outlook
Exhibit 14. Stock pick bottom up
TP, Rp Potential Market cap EPS growth, % PER,x EV/EBITDA,x PBV,x Div Yield, %upside, % Rp bn 2010F 2011F 2010F 2011F 2010F 2011F 2010F 2011F 2010F 2011F
ADRO 2,950 15.7 81,564 -45 99 32.7 16.5 10.2 6.6 4.2 3.5 0.6 1.3ASRI 400 31.1 5,448 157 63 22.2 13.6 15.2 8.7 2.5 2.2 0.9 1.5BBRI 14,400 34.0 131,332 21 32 15.9 12.1 7.3 6.4 4.3 3.5 2.2 2.9BWPT 1,350 18.4 4,602 3 67 22.0 13.2 13.8 7.5 4.2 3.3 0.5 0.8GGRM 55,000 33.3 79,369 23 21 19.1 15.8 12.4 10.2 3.8 3.3 0.0 0.0INDF 6,000 29.0 40,829 24 13 15.9 14 8.2 7.5 1.7 1.5 2.0 2.5INTP 19,820 23.8 58,716 17 17 18.5 15.7 11.4 9.5 4.6 3.9 1.9 2.2JSMR 4,300 25.5 23,290 21 31 19.6 15.0 12.9 12.6 2.7 2.3 0.0 0.0LSIP 14,850 23.8 16,375 20 45 19.6 13.5 11.9 8.5 3.8 3.1 1.7 2.0MASA 450 34.3 2,051 2 34 11.4 8.5 7.8 6.7 1.2 1.1 0.3 0.0UNTR 27,250 13.8 79,679 -6 24 22.3 18.0 10.3 7.9 5.0 4.2 1.9 1.9
Source: Bloomberg (closing price as of Dec 15, 2010) and Danareksa Sekuritas
Our top picks, taking into consideration the momentum of higher commodity prices, include ADRO, UNTR, LSIP and BWPT. Meanwhile, we alsolike INDF and GGRM given their exposure to domestic consumption. Other stocks we like are BBRI, INTP, JSMR and ASRI. Among the smaller stocks,we like MASA.

12
2011 Outlook
Sector Outlook(In Alphabetical order)

13
2011 Outlook
Automotive partsRide on growth
BUY MASA and SMSMThe automotive parts sector has good prospects. Currently the sector’s valuation is still attractivewith 11F-12F Core PER of 8.3x-7.3x. Sales growth prospects are bright. Our top picks in the sectorare MASA and SMSM. Our BUY recommendation on MASA is underpinned by its strong revenuesgrowth prospects (37% CAGR over the next 2 years, in our estimate), supported by its rapidexpansion and higher orders. For SMSM, our BUY recommendation is underpinned by ourconfidence in the sustainability of the company’s revenues growth going forward, its attractive09-11F ROE of 25%-30% and its generous dividend payout policy.
Revenues should grow by 17% in 2011We expect the automotive parts sector core profits to grow by 17% in 2011. Domestically, demandgrowth should be driven by the increase in the number of new cars and motorcycles (around 7%p.a. and 14% p.a. respectively in the past two years in our estimate). Whilst in the exports market,Indonesia’s cost efficient manufacturing should allow the Indonesian companies to adoptcompetitive pricing to win more market share. For tire producers specifically, the additional USimport duties on Chinese tires (35%-30%-25% in the first-second-third years from September 2009)should mean that Indonesian tires are more competitive than before.
Capacity will increase to support demand growthTo be able to capture the growing demand, GJTL and MASA are now expanding their radial tiresand motorcycle tires production capacity. In percentage terms, MASA’s expansion is moreaggressive. MASA targets production capacity of radial tires and motorcycle tires to increase to28,500 tires/day and 16,000 tires/day respectively in early 2011 or around 63% and 100% higherthan the capacity in 9M10. GJTL meanwhile targets production capacity to increase to 45,000 radialtires/day and 105,000 motorcycle tires/day in 2012 or around 22% and 52% higher than the capacityin 9M10. As for the filter and radiator manufacturer, SMSM, it still has excess production capacityto accommodate further growth in 2011.
Key risks: rubber price and exchange ratesRubber price fluctuations are a primary risk for the tire producers (MASA and GJTL), as rubber(natural and synthetic) accounts for around 44% of the tires production cost. However, when therubber prices spike, most of the other tire producers also see their gross margins come underpressure, encouraging them to raise selling prices. Hence, a rapid increase in natural rubber pricesshould only result in temporary margins compression. As for the automotive filter and radiatormanufacturer, SMSM, exchange rate fluctuations are the primary risk, as around 75% of its revenuesare in foreign currency, while only 44% of its production costs are in foreign currency.
Indra P. Yudison(62-21) 350 9888 ext. [email protected]
OVERWEIGHT
Rec Price TPRp Rp
MASA BUY 325 450GJTL BUY 2,200 3,125SMSM BUY 1,060 1,500
Price Mkt cap Core PER,x PBV,X Core Profit ROAE,%Rp Rpbn growth, %
11F 12F 11F 12F 11F 12F 11F
MASA 325 1,990 8.1 5.8 1.1 0.9 42.6 39.8 13.6GJTL 2,200 7,667 8.3 7.7 1.8 1.4 15.4 8.0 23.8SMSM 1,060 1,526 9.1 8.0 2.4 2.0 10.6 13.1 29.0
Cut off data December 16,2010

14
2011 Outlook
Exhibit 1. Forward 12 months earnings yield
Source: Companies, Danaraksa estimates and Bloomberg
Exhibit 2. Forward 12 months EV/EBITDA
Source: Companies, Danaraksa estimates and Bloomberg
Exhibit 3. Forward 12 months PBV
Source: Companies, Danaraksa estimates and Bloomberg
Exhibit 4. Core ROAE
Source: Companies, Danareksa estimates
-20%
-10%
0%
10%
20%
30%
40%
50%
60%
70%
6/9/
2005
12/9
/200
5
6/9/
2006
12/9
/200
6
6/9/
2007
12/9
/200
7
6/9/
2008
12/9
/200
8
6/9/
2009
12/9
/200
9
6/9/
2010
12/9
/201
0
Forward 12 Months Earnings Yield Average
-1.02.03.04.05.06.07.08.09.0
10.0
6/9/
2005
12
/9/2
00
5
6/9/
2006
12
/9/2
00
6
6/9/
2007
12
/9/2
00
7
6/9/
2008
12
/9/2
00
8
6/9/
2009
12
/9/2
00
9
6/9/
2010
12
/9/2
01
0
Forward 12 EV/EBITDA Average
-
0.5
1.0
1.5
2.0
2.5
6/9/
2005
12/9
/200
5
6/9/
2006
12/9
/200
6
6/9/
2007
12/9
/200
7
6/9/
2008
12/9
/200
8
6/9/
2009
12/9
/200
9
6/9/
2010
12/9
/201
0
Forward 12 months PBV Average
0%
5%
10%
15%
20%
25%
30%
35%
2008 2009 2010F 2011F 2012F
Total MASA GJTL SMSM
15
2011 Outlook
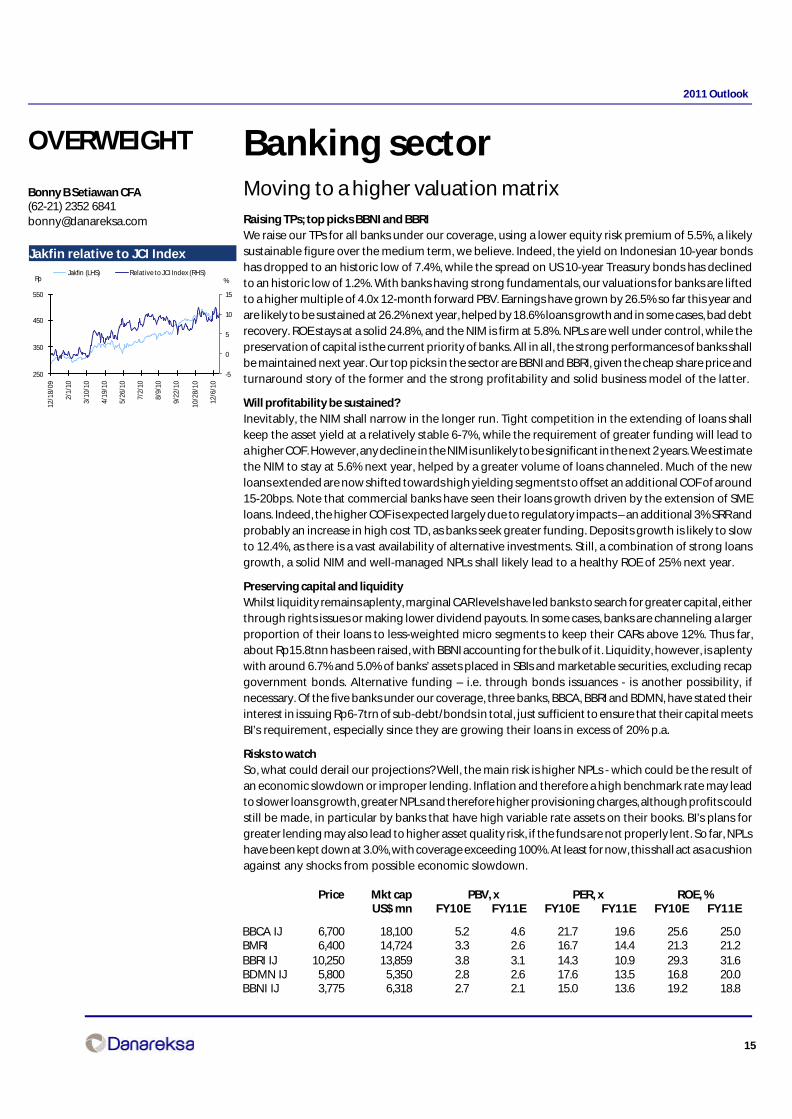
Banking sectorMoving to a higher valuation matrixRaising TPs; top picks BBNI and BBRIWe raise our TPs for all banks under our coverage, using a lower equity risk premium of 5.5%, a likelysustainable figure over the medium term, we believe. Indeed, the yield on Indonesian 10-year bondshas dropped to an historic low of 7.4%, while the spread on US 10-year Treasury bonds has declinedto an historic low of 1.2%. With banks having strong fundamentals, our valuations for banks are liftedto a higher multiple of 4.0x 12-month forward PBV. Earnings have grown by 26.5% so far this year andare likely to be sustained at 26.2% next year, helped by 18.6% loans growth and in some cases, bad debtrecovery. ROE stays at a solid 24.8%, and the NIM is firm at 5.8%. NPLs are well under control, while thepreservation of capital is the current priority of banks. All in all, the strong performances of banks shallbe maintained next year. Our top picks in the sector are BBNI and BBRI, given the cheap share price andturnaround story of the former and the strong profitability and solid business model of the latter.
Will profitability be sustained?Inevitably, the NIM shall narrow in the longer run. Tight competition in the extending of loans shallkeep the asset yield at a relatively stable 6-7%, while the requirement of greater funding will lead toa higher COF. However, any decline in the NIM is unlikely to be significant in the next 2 years. We estimatethe NIM to stay at 5.6% next year, helped by a greater volume of loans channeled. Much of the newloans extended are now shifted towards high yielding segments to offset an additional COF of around15-20bps. Note that commercial banks have seen their loans growth driven by the extension of SMEloans. Indeed, the higher COF is expected largely due to regulatory impacts – an additional 3% SRR andprobably an increase in high cost TD, as banks seek greater funding. Deposits growth is likely to slowto 12.4%, as there is a vast availability of alternative investments. Still, a combination of strong loansgrowth, a solid NIM and well-managed NPLs shall likely lead to a healthy ROE of 25% next year.
Preserving capital and liquidityWhilst liquidity remains aplenty, marginal CAR levels have led banks to search for greater capital, eitherthrough rights issues or making lower dividend payouts. In some cases, banks are channeling a largerproportion of their loans to less-weighted micro segments to keep their CARs above 12%. Thus far,about Rp15.8tnn has been raised, with BBNI accounting for the bulk of it. Liquidity, however, is aplentywith around 6.7% and 5.0% of banks’ assets placed in SBIs and marketable securities, excluding recapgovernment bonds. Alternative funding – i.e. through bonds issuances - is another possibility, ifnecessary. Of the five banks under our coverage, three banks, BBCA, BBRI and BDMN, have stated theirinterest in issuing Rp6-7trn of sub-debt/bonds in total, just sufficient to ensure that their capital meetsBI’s requirement, especially since they are growing their loans in excess of 20% p.a.
Risks to watchSo, what could derail our projections? Well, the main risk is higher NPLs - which could be the result ofan economic slowdown or improper lending. Inflation and therefore a high benchmark rate may leadto slower loans growth, greater NPLs and therefore higher provisioning charges, although profits couldstill be made, in particular by banks that have high variable rate assets on their books. BI’s plans forgreater lending may also lead to higher asset quality risk, if the funds are not properly lent. So far, NPLshave been kept down at 3.0%, with coverage exceeding 100%. At least for now, this shall act as a cushionagainst any shocks from possible economic slowdown.
Price Mkt cap PBV, x PER, x ROE, %US$ mn FY10E FY11E FY10E FY11E FY10E FY11E
BBCA IJ 6,700 18,100 5.2 4.6 21.7 19.6 25.6 25.0BMRI 6,400 14,724 3.3 2.6 16.7 14.4 21.3 21.2BBRI IJ 10,250 13,859 3.8 3.1 14.3 10.9 29.3 31.6BDMN IJ 5,800 5,350 2.8 2.6 17.6 13.5 16.8 20.0BBNI IJ 3,775 6,318 2.7 2.1 15.0 13.6 19.2 18.8
Bonny B Setiawan CFA(62-21) 2352 [email protected]
OVERWEIGHT
Last Recommendation
Jakfin relative to JCI Index
250
350
450
550
12/1
8/09
2/1/
10
3/10
/10
4/19
/10
5/26
/10
7/2/
10
8/9/
10
9/22
/10
10/2
8/10
12/6
/10
-5
0
5
10
15
Jakfin (LHS) Relative to JCI Index (RHS)%Rp

16
2011 Outlook
Exhibit 1. Industry loan growth is robust
Source: BI
Exhibit 2. NPL has been in the declining trend
Source: BI
Exhibit 3. Earnings growth has stayed at 27%
Source: BI
Exhibit 4. Preserving capital is banks’ current priority
Source: BI
Exhibit 5. Lending in SMEs has trended up
Source: BI
Exhibit 6. Commercial banks are focusing towards SME
Source: BI
05
10152025
30354045
Jan
-04
No
v-04
Sep
-05
Jul-
06
May
-07
Mar
-08
Jan
-09
No
v-09
Sep
-10
%
6
7
8
9
10
11
12
13
14%
Loan growth, YoY (LHS) SBI 1-mth (RHS)
%
2.0
3.0
4.0
5.0
6.0
7.0
8.0
9.0
Jan
-03
Aug
-03
Mar
-04
Oct
-04
May
-05
Dec
-05
Jul-
06
Feb
-07
Sep
-07
Ap
r-08
Nov
-08
Jun
-09
Jan
-10
Aug
-10
% NIM NPL
-20%
-10%
0%
10%
20%
30%
40%
50%
60%
Feb
-07
Aug
-07
Feb
-08
Aug
-08
Feb
-09
Aug
-09
Feb
-10
Aug
-10
YoY
10
20
30
40
50
60
70
80
90
Jan
-03
Au
g-0
3
Mar
-04
Oct
-04
May
-05
Dec
-05
Jul-
06
Feb
-07
Sep
-07
Ap
r-08
No
v-08
Jun
-09
Jan
-10
Au
g-1
0
%
101214
1618
20222426
28
%LDR (LHS) CAR (RHS)
0.0%
5.0%
10.0%
15.0%
20.0%
25.0%
30.0%
35.0%
40.0%
Jan
-05
May
-05
Sep
-05
Jan
-06
May
-06
Sep
-06
Jan
-07
May
-07
Sep
-07
Jan
-08
May
-08
Sep
-08
Jan
-09
May
-09
Sep
-09
Jan
-10
May
-10
Sep
-10
-10.0%
0.0%
10.0%
20.0%
30.0%
40.0%
50.0%
Jan
-05
May
-05
Sep
-05
Jan
-06
May
-06
Sep
-06
Jan
-07
May
-07
Sep
-07
Jan
-08
May
-08
Sep
-08
Jan
-09
May
-09
Sep
-09
Jan
-10
May
-10
Sep
-10
SOE Regional development bank Commercial
YoY

17
2011 Outlook
Exhibit 7. Domestic peer comparisons
Bloomberg Price Mcap PBV, x PER, x ROE, % ROA, % Dvd yield, %Code (LC) (USD mn) 2010E 2011E 2010E 2011E 2010E 2011E 2010E 2011E 2010E
BBCA IJ 6,700 18,283 5.2 4.6 21.7 19.6 25.6 25.0 2.5 2.4 2.3BMRI IJ 6,400 14,808 3.3 2.6 16.7 14.4 21.3 21.2 1.9 2.1 2.1BBRI IJ 10,250 13,989 3.8 3.1 14.3 10.9 29.3 31.6 2.6 2.9 3.5BDMN IJ 5,800 5,367 2.8 2.6 17.6 13.5 16.8 20.0 2.6 2.8 2.8BBNI IJ 3,775 6,382 2.7 2.1 15.0 13.6 19.2 18.8 1.6 1.9 3.3BNII IJ 800 4,430 5.4 5.4 57.7 46.0 16.2 15.0 0.9 NA 0.7PNBN IJ 1,090 2,451 2.1 1.8 15.6 12.8 14.0 14.9 1.9 2.3 2.3BNGA IJ 2,150 5,696 3.9 3.3 23.6 20.5 17.9 17.5 1.8 1.8 0.3BTPN IJ 13,700 1,431 4.2 3.2 18.5 13.8 31.2 30.3 3.0 2.9 0.0BBTN IJ 1,620 1,139 2.3 2.1 17.7 12.8 13.8 17.2 1.2 1.5 1.4Weighted average 3.9 3.3 20.4 17.1 22.6 23.1 2.1 2.2 2.3
Source: Bloomberg and Danareksa Sekuritas
Exhibit 8. Regional peer comparisons
Bloomberg Price Mcap PBV, x PER, x ROE, % ROA, % Dvd yield, %Code (LC) (USD mn) 2010E 2011E 2010E 2011E 2010E 2011E 2010E 2011E 2010E
CM CN 77.8 29,655 2.4 2.2 12.5 10.9 20.7 20.6 0.7 0.8 4.43988 HK 0.5 39,686 1.6 1.4 9.5 8.6 17.5 17.5 1.1 1.1 4.4998 HK 0.6 7,878 1.4 1.2 8.5 7.7 17.3 17.2 1.0 1.0 3.0939 HK 0.9 201,371 2.2 1.9 10.7 9.2 22.0 22.0 1.3 1.4 4.0601166 CH 3.6 18,187 1.6 1.3 8.4 7.1 22.5 20.8 1.1 1.1 2.2601398 CH 0.6 158,923 1.8 1.6 9.2 7.8 21.0 21.6 1.3 1.3 4.9600036 CH 2.0 23,732 2.1 1.8 11.0 9.0 21.8 21.2 1.1 1.2 1.9AXSB IN 28.9 10,364 3.3 2.9 20.5 17.0 18.4 18.6 1.5 1.6 0.9BOI IN 9.7 5,076 1.8 1.6 10.0 8.7 16.2 18.5 0.8 1.0 1.6004940 KS 10.1 6,536 0.9 0.8 7.4 6.6 12.5 13.3 1.1 1.1 5.4024110 KS 16.5 8,392 1.1 1.0 8.5 7.4 14.0 14.2 0.9 0.9 2.3005280 KS 12.5 2,341 1.1 1.0 7.3 6.8 16.0 15.1 1.2 1.1 2.6005270 KS 13.1 1,725 1.0 0.9 8.1 6.5 12.7 14.4 0.8 1.0 2.6HLBK MK 3.0 4,736 2.3 1.9 15.5 13.1 15.7 15.8 1.1 1.3 2.2MAY MK 2.7 19,203 2.2 2.0 16.4 14.0 14.2 15.0 1.1 1.2 3.0CIMB MK 2.7 9,708 2.6 2.3 17.2 14.4 16.2 16.9 1.4 1.5 2.0BBL TB 4.9 9,364 1.3 1.2 11.4 10.5 12.0 12.0 1.4 1.4 3.1SCB TB 3.4 8,531 2.2 2.0 14.4 12.5 16.3 16.9 1.8 1.9 2.8KK TB 1.2 650 1.0 1.0 7.1 6.9 15.2 13.7 2.1 2.0 6.6KTB TB 0.6 6,299 1.5 1.4 12.8 10.4 12.8 13.9 0.9 1.1 3.0OCBC SP 7.5 23,482 1.7 1.6 14.1 13.1 12.3 12.4 1.2 1.1 3.3UOB SP 13.7 20,829 1.4 1.4 11.1 10.9 13.2 12.8 1.2 1.2 4.0DBS SP 10.9 24,974 1.3 1.2 17.1 12.0 7.5 10.4 0.8 1.0 3.9Weighted average 1.9 1.7 11.1 9.5 19.1 19.4 1.2 1.3 3.9
Source: Bloomberg and Danareksa Sekuritas
18
2011 Outlook
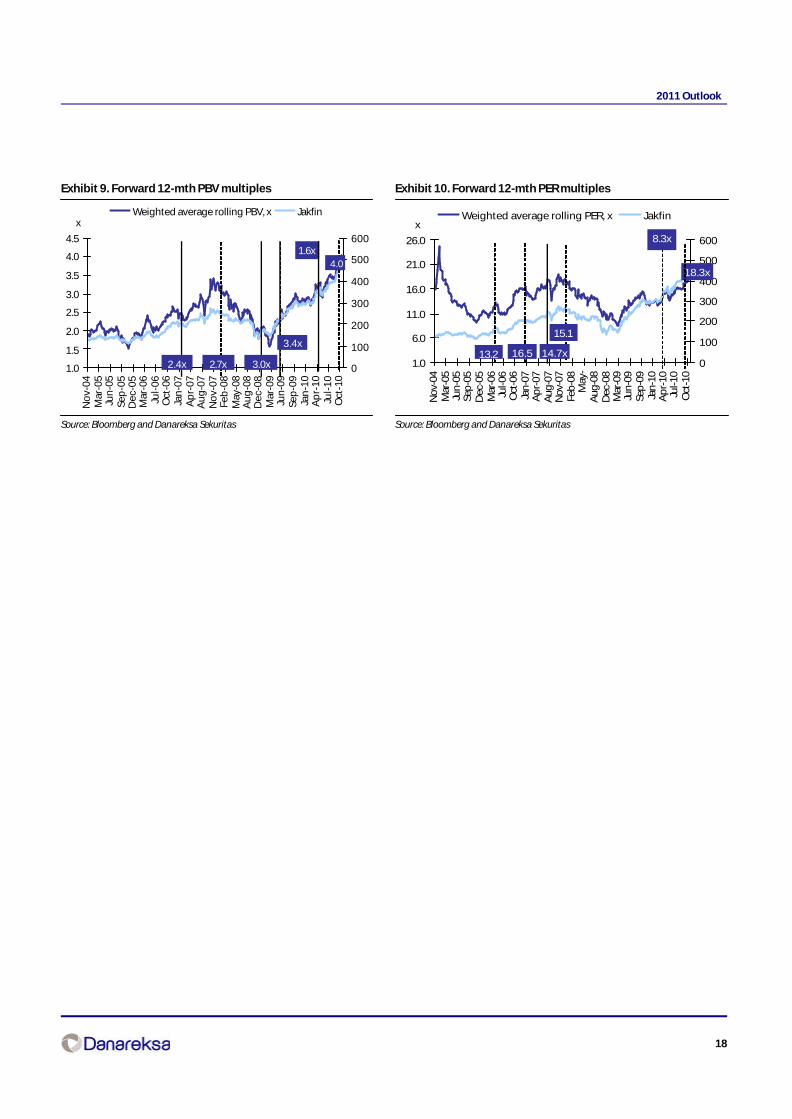
Exhibit 9. Forward 12-mth PBV multiples
Source: Bloomberg and Danareksa Sekuritas
Exhibit 10. Forward 12-mth PER multiples
Source: Bloomberg and Danareksa Sekuritas
1.0
6.0
11.0
16.0
21.0
26.0
No
v-04
Mar
-05
Jun
-05
Sep
-05
Dec
-05
Mar
-06
Jul-0
6O
ct-0
6Ja
n-0
7A
pr-
07A
ug-0
7N
ov-
07Fe
b-0
8M
ay-
Aug
-08
Dec
-08
Mar
-09
Jun
-09
Sep
-09
Jan
-10
Ap
r-10
Jul-1
0O
ct-1
0
0
100
200
300
400
500
600
Weighted average rolling PER, x Jakfinx
13.2 16.5 14.7x
15.1
8.3x
18.3x
1.0
1.5
2.0
2.5
3.0
3.5
4.0
4.5
No
v-04
Mar
-05
Jun
-05
Sep
-05
Dec
-05
Mar
-06
Jul-
06
Oct
-06
Jan
-07
Ap
r-07
Au
g-0
7N
ov-
07Fe
b-0
8M
ay-0
8A
ug
-08
Dec
-08
Mar
-09
Jun
-09
Sep
-09
Jan
-10
Ap
r-10
Jul-
10
Oct
-10
0
100
200
300
400
500
600
Weighted average rolling PBV, x Jakfinx
2.4x 2.7x 3.0x
3.4x
1.6x4.0

19
2011 Outlook
Coal sectorThe black magic is back
Supply shortfall continuesWe have seen coal companies missing their production guidance in 9M10. This means some ofthe coal deliveries that originally have been contracted for this year will not be met, and this short-term supply shortfall will create upward pressures on the coal price. On the demand side, we seehuge demand building up long-term, as India is stepping up to becoming one of the largest coalimporters alongside China in order to fuel their 100GW power projects by 2017. In light of this,we upgrade our coal price forecast to USD110/t for FY11F, USD105/t for FY12F, USD105/t for FY13Fand USD100/t for our long-term coal price. Our top pick in the sector is ADRO. We like the companyfor its low-cost advantage, which we believe will provide strong profitability amidst volatility incoal prices.
The weather is not going to improve anytime soonAnticipating more bad weather, we have lowered our overall coal production target by 5.6-7.6%for this year and next year. The shortfall will result in rising coal prices in the future. Bad weatherin Indonesia, which is attributed to the La Niña weather phenomenon, is expected to persist untilthe first quarter of next year. The World Meteorological Organization in November said in its pressrelease that “La Niña conditions may possibly further strengthen during the next four to sixmonths”. This means that coal supply shortfall can be expected, and we’re about to see morecompanies missing their production targets, as the bad weather will create difficulties in coalextracting, overburden removing, coal hauling and barging through rivers.
Longer-term demand from global power plant projectsWe expect demand for coal to remain strong, with India and China to be the main drivers ofdemand, which is expected to total 76quad btu or equivalent to around 2,850Mt of coal with CVof 6,700 kcal/kg NAR specification by 2015. India, in an effort to overcome its domestic powershortfall, plans to build 9x4000MW coal-fired Ultra Mega Power Projects (“UMPP”), whereby eachUMPP will require 15Mtpa of coal. So far, four of the UMPPs have been tendered and commissioningis expected to start in the next five years. China’s forecast 8.4% growth CAGR over the next 5 yearswill trigger more imports for coal, as the domestic production cost is still higher than the cost ofimports. From the domestic side in Indonesia, PLN, the state-owned electricity company, istargeting coal usage of 58% from the total power generating capacity by 2019. This will translateinto coal demand of 107Mt in 2018 or CAGR growth of 9.4% over the next 8 years. All in all, we expectthe growing demand coupled with the supply constraints to drive the coal price higher in the nearterm.
RisksProlonged rain may provide risks of investing in the coal sector, as this will affect coal miners’production this year, although we believe it will be compensated by higher coal prices should therebe any supply shortfall. Also worth watching is that if prices go up too high, then China may reopenits coal mines since it will be economical for them to use domestic coal. Also any change in India’senvironmental policy (which currently prevents them from mining coal in forest areas) will poserisks to our coal price assumptions.
OVERWEIGHT
Peter P. Sutedja(62-21) 350 9888 ext. [email protected]
Jakmine Relative to JCI Index
Rec Price TPRp Rp
ADRO IJ BUY 2,300 2,950BYAN IJ SELL 12,900 9,700BUMI IJ BUY 2,900 3,600INDY IJ BUY 4,275 4,825ITMG IJ HOLD 51,000 55,300PTBA IJ BUY 20,850 26,650
Rec TP P/E, x EV/EBITDA, x Dividend Yield, %Rp/share FY10F FY11F FY10F FY11F FY10F FY11F
ADRO IJ BUY 2,950 29.5 14.9 9.2 5.9 0.7 1.4BYAN IJ SELL 9,700 59.5 27.5 28.0 13.1 0.0 0.0BUMI IJ BUY 3,600 19.5 14.0 8.8 6.0 0.8 1.3INDY IJ BUY 4,825 21.0 13.3 82.7 38.0 1.6 2.4ITMG IJ HOLD 55,300 23.4 12.2 12.2 7.3 3.8 3.8PTBA IJ BUY 26,650 25.3 15.9 18.5 10.9 2.4 1.8
1,500
2,000
2,500
3,000
3,500
12/1
8/09
2/1/
10
3/10
/10
4/19
/10
5/26
/10
7/2/
10
8/9/
10
9/22
/10
10/2
8/10
12/6
/10
-20
-10
0
10
JAKMINE (LHS) Relative to JCI Index (RHS)%

20
2011 Outlook
Exibit 1. World coal production outlook ...
Source: International Energy Outlook 2010
Exibit 2. ... and China and India still expected to lead the world coal consumption
Source: International Energy Outlook 2010
Exibit 3. Domestic coal demand also sees increase ...
Source: PLN
0
20
40
60
80
100
120
2007 2010F 2015F 2020F 2025F 2030F 2035F
Australia ChinaIndia Other Non-OECD AsiaOECD ex Australia Non-OECD ex Asia
quad btu
0
25
50
75
100
125
2005 2006 2007 2015F 2020F 2025F 2030F 2035F
OECD Non-OECD ex China & India China Indiaquad btu
0
40
80
120
2009 2010 2011 2012 2013 2014 2015 2016 2017 2018
0%
10%
20%
30%
40%
50%
60%
70%
Domestic coal demand (LHS) Growth (RHS)Mt
21
2011 Outlook
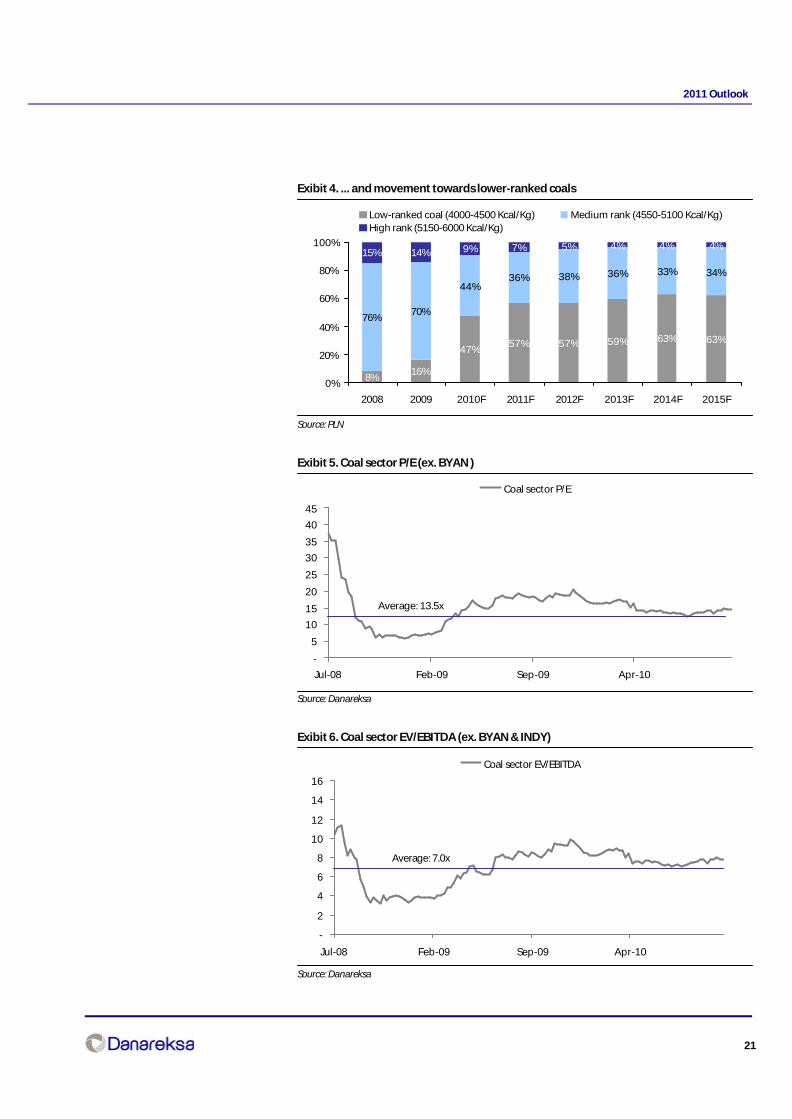
Exibit 4. ... and movement towards lower-ranked coals
Source: PLN
Exibit 5. Coal sector P/E (ex. BYAN )
Source: Danareksa
Exibit 6. Coal sector EV/EBITDA (ex. BYAN & INDY)
Source: Danareksa
8%16%
47%57% 57% 59% 63% 63%
76%70%
44%36% 38% 36% 33% 34%
15% 14% 9% 7% 5% 4% 4% 4%
0%
20%
40%
60%
80%
100%
2008 2009 2010F 2011F 2012F 2013F 2014F 2015F
Low-ranked coal (4000-4500 Kcal/Kg) Medium rank (4550-5100 Kcal/Kg)High rank (5150-6000 Kcal/Kg)
-
5
10
15
20
25
30
35
40
45
Jul-08 Feb-09 Sep-09 Apr-10
Coal sector P/E
Average: 13.5x
-
2
4
6
8
10
12
14
16
Jul-08 Feb-09 Sep-09 Apr-10
Coal sector EV/EBITDA
Average: 7.0x
22
2011 Outlook
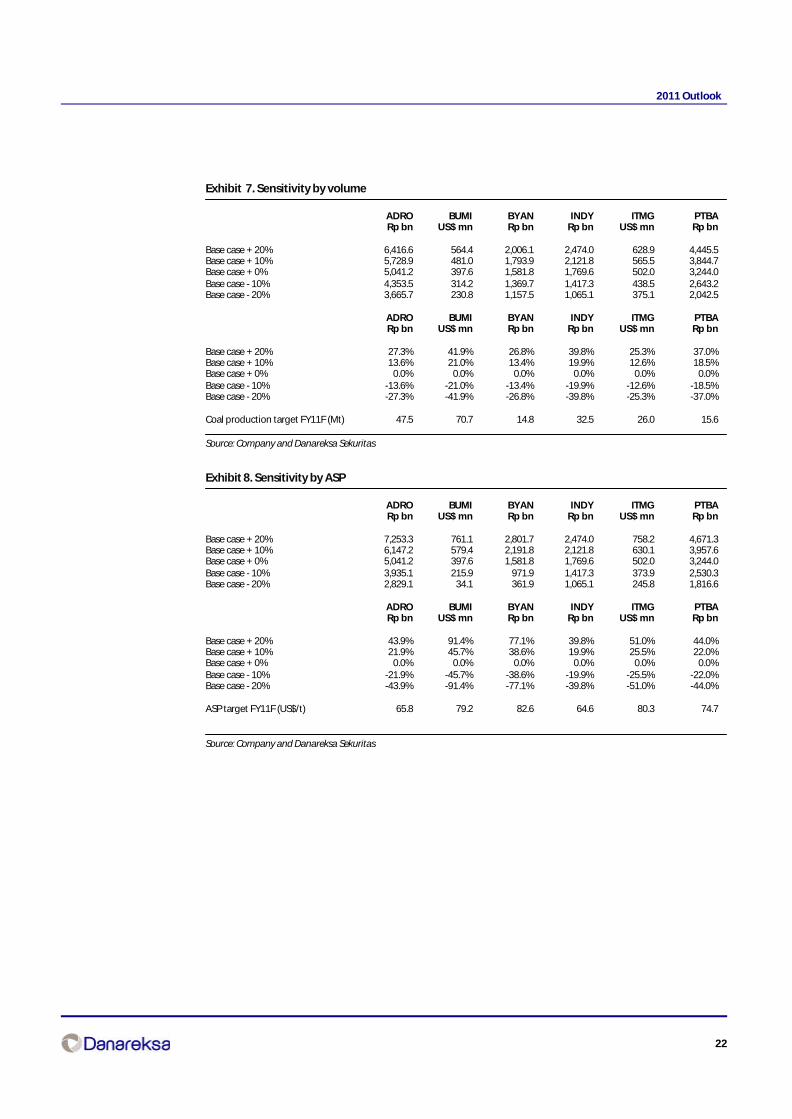
Exhibit 7. Sensitivity by volume
ADRO BUMI BYAN INDY ITMG PTBARp bn US$ mn Rp bn Rp bn US$ mn Rp bn
Base case + 20% 6,416.6 564.4 2,006.1 2,474.0 628.9 4,445.5Base case + 10% 5,728.9 481.0 1,793.9 2,121.8 565.5 3,844.7Base case + 0% 5,041.2 397.6 1,581.8 1,769.6 502.0 3,244.0Base case - 10% 4,353.5 314.2 1,369.7 1,417.3 438.5 2,643.2Base case - 20% 3,665.7 230.8 1,157.5 1,065.1 375.1 2,042.5
ADRO BUMI BYAN INDY ITMG PTBARp bn US$ mn Rp bn Rp bn US$ mn Rp bn
Base case + 20% 27.3% 41.9% 26.8% 39.8% 25.3% 37.0%Base case + 10% 13.6% 21.0% 13.4% 19.9% 12.6% 18.5%Base case + 0% 0.0% 0.0% 0.0% 0.0% 0.0% 0.0%Base case - 10% -13.6% -21.0% -13.4% -19.9% -12.6% -18.5%Base case - 20% -27.3% -41.9% -26.8% -39.8% -25.3% -37.0%
Coal production target FY11F (Mt) 47.5 70.7 14.8 32.5 26.0 15.6
Source: Company and Danareksa Sekuritas
Exhibit 8. Sensitivity by ASP
ADRO BUMI BYAN INDY ITMG PTBARp bn US$ mn Rp bn Rp bn US$ mn Rp bn
Base case + 20% 7,253.3 761.1 2,801.7 2,474.0 758.2 4,671.3Base case + 10% 6,147.2 579.4 2,191.8 2,121.8 630.1 3,957.6Base case + 0% 5,041.2 397.6 1,581.8 1,769.6 502.0 3,244.0Base case - 10% 3,935.1 215.9 971.9 1,417.3 373.9 2,530.3Base case - 20% 2,829.1 34.1 361.9 1,065.1 245.8 1,816.6
ADRO BUMI BYAN INDY ITMG PTBARp bn US$ mn Rp bn Rp bn US$ mn Rp bn
Base case + 20% 43.9% 91.4% 77.1% 39.8% 51.0% 44.0%Base case + 10% 21.9% 45.7% 38.6% 19.9% 25.5% 22.0%Base case + 0% 0.0% 0.0% 0.0% 0.0% 0.0% 0.0%Base case - 10% -21.9% -45.7% -38.6% -19.9% -25.5% -22.0%Base case - 20% -43.9% -91.4% -77.1% -39.8% -51.0% -44.0%
ASP target FY11F (US$/t) 65.8 79.2 82.6 64.6 80.3 74.7
Source: Company and Danareksa Sekuritas
23
2011 Outlook
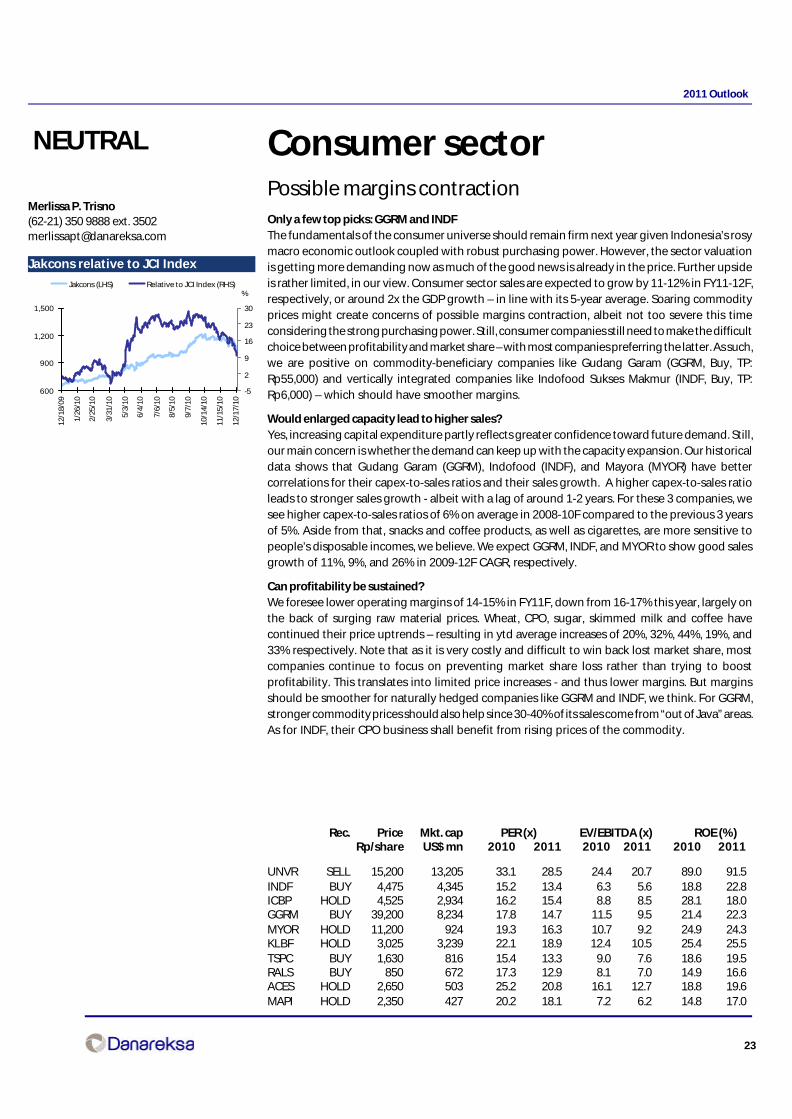
Consumer sectorPossible margins contractionOnly a few top picks: GGRM and INDFThe fundamentals of the consumer universe should remain firm next year given Indonesia’s rosymacro economic outlook coupled with robust purchasing power. However, the sector valuationis getting more demanding now as much of the good news is already in the price. Further upsideis rather limited, in our view. Consumer sector sales are expected to grow by 11-12% in FY11-12F,respectively, or around 2x the GDP growth – in line with its 5-year average. Soaring commodityprices might create concerns of possible margins contraction, albeit not too severe this timeconsidering the strong purchasing power. Still, consumer companies still need to make the difficultchoice between profitability and market share – with most companies preferring the latter. As such,we are positive on commodity-beneficiary companies like Gudang Garam (GGRM, Buy, TP:Rp55,000) and vertically integrated companies like Indofood Sukses Makmur (INDF, Buy, TP:Rp6,000) – which should have smoother margins.
Would enlarged capacity lead to higher sales?Yes, increasing capital expenditure partly reflects greater confidence toward future demand. Still,our main concern is whether the demand can keep up with the capacity expansion. Our historicaldata shows that Gudang Garam (GGRM), Indofood (INDF), and Mayora (MYOR) have bettercorrelations for their capex-to-sales ratios and their sales growth. A higher capex-to-sales ratioleads to stronger sales growth - albeit with a lag of around 1-2 years. For these 3 companies, wesee higher capex-to-sales ratios of 6% on average in 2008-10F compared to the previous 3 yearsof 5%. Aside from that, snacks and coffee products, as well as cigarettes, are more sensitive topeople’s disposable incomes, we believe. We expect GGRM, INDF, and MYOR to show good salesgrowth of 11%, 9%, and 26% in 2009-12F CAGR, respectively.
Can profitability be sustained?We foresee lower operating margins of 14-15% in FY11F, down from 16-17% this year, largely onthe back of surging raw material prices. Wheat, CPO, sugar, skimmed milk and coffee havecontinued their price uptrends – resulting in ytd average increases of 20%, 32%, 44%, 19%, and33% respectively. Note that as it is very costly and difficult to win back lost market share, mostcompanies continue to focus on preventing market share loss rather than trying to boostprofitability. This translates into limited price increases - and thus lower margins. But marginsshould be smoother for naturally hedged companies like GGRM and INDF, we think. For GGRM,stronger commodity prices should also help since 30-40% of its sales come from “out of Java” areas.As for INDF, their CPO business shall benefit from rising prices of the commodity.
Merlissa P. Trisno(62-21) 350 9888 ext. [email protected]
NEUTRAL
Jakcons relative to JCI Index
600
900
1,200
1,500
12/1
8/09
1/26
/10
2/25
/10
3/31
/10
5/3/
10
6/4/
10
7/6/
10
8/5/
10
9/7/
10
10/1
4/10
11/1
5/10
12/1
7/10
-5
2
9
16
23
30
Jakcons (LHS) Relative to JCI Index (RHS)%
Rec. Price Mkt. cap PER (x) EV/EBITDA (x) ROE (%)Rp/share US$ mn 2010 2011 2010 2011 2010 2011
UNVR SELL 15,200 13,205 33.1 28.5 24.4 20.7 89.0 91.5INDF BUY 4,475 4,345 15.2 13.4 6.3 5.6 18.8 22.8ICBP HOLD 4,525 2,934 16.2 15.4 8.8 8.5 28.1 18.0GGRM BUY 39,200 8,234 17.8 14.7 11.5 9.5 21.4 22.3MYOR HOLD 11,200 924 19.3 16.3 10.7 9.2 24.9 24.3KLBF HOLD 3,025 3,239 22.1 18.9 12.4 10.5 25.4 25.5TSPC BUY 1,630 816 15.4 13.3 9.0 7.6 18.6 19.5RALS BUY 850 672 17.3 12.9 8.1 7.0 14.9 16.6ACES HOLD 2,650 503 25.2 20.8 16.1 12.7 18.8 19.6MAPI HOLD 2,350 427 20.2 18.1 7.2 6.2 14.8 17.0

24
2011 Outlook
What could derail our forecast?The key risk is inflation, especially since the government plans to end subsidies on fuel forprivate motorists. Although the details are still sketchy, the plan may be implemented in2Q11. The other risks include rupiah depreciation, stiffer competition, and global economicslowdown.
Exhibit 1. Consumer sales vs GDP growth
Source: CEIC and Danareksa Sekuritas
Exhibit 2. GGRM’s capex-to-sales ratio
Source: Company
Exhibit 3. INDF’s capex to sales ratio
Source: Company
Exhibit 4. Commodity prices index
Source: Bloomberg
0.00.51.01.52.02.53.03.54.04.5
2002 2003 2004 2005 2006 2007 2008 2009 2010F2011F
Consumer sales-to-GDP growth ratio
Consumer sales-to-private cons growth ratio
5-years avg ratio:
2.3x
x
0.01.02.03.04.05.06.07.08.09.0
10.0
2000
2001
2002
2003
2004
2005
2006
2007
2008
2009
0%
5%
10%
15%
20%
25%
Capex/sales ratio (LHS) Revenue growth (RHS)
%
0.0
5.0
10.0
15.0
20.0
25.0
30.0
2000
2001
2002
2003
2004
2005
2006
2007
2008
2009
-10%
0%
10%
20%
30%
40%
50%
Capex/sales ratio (LHS) Revenue growth (RHS)%
0
50
100
150
200
250
300
350
400
1Q98
1Q99
1Q00
1Q01
1Q02
1Q03
1Q04
1Q05
1Q06
1Q07
1Q08
1Q09
1Q10
25
2011 Outlook
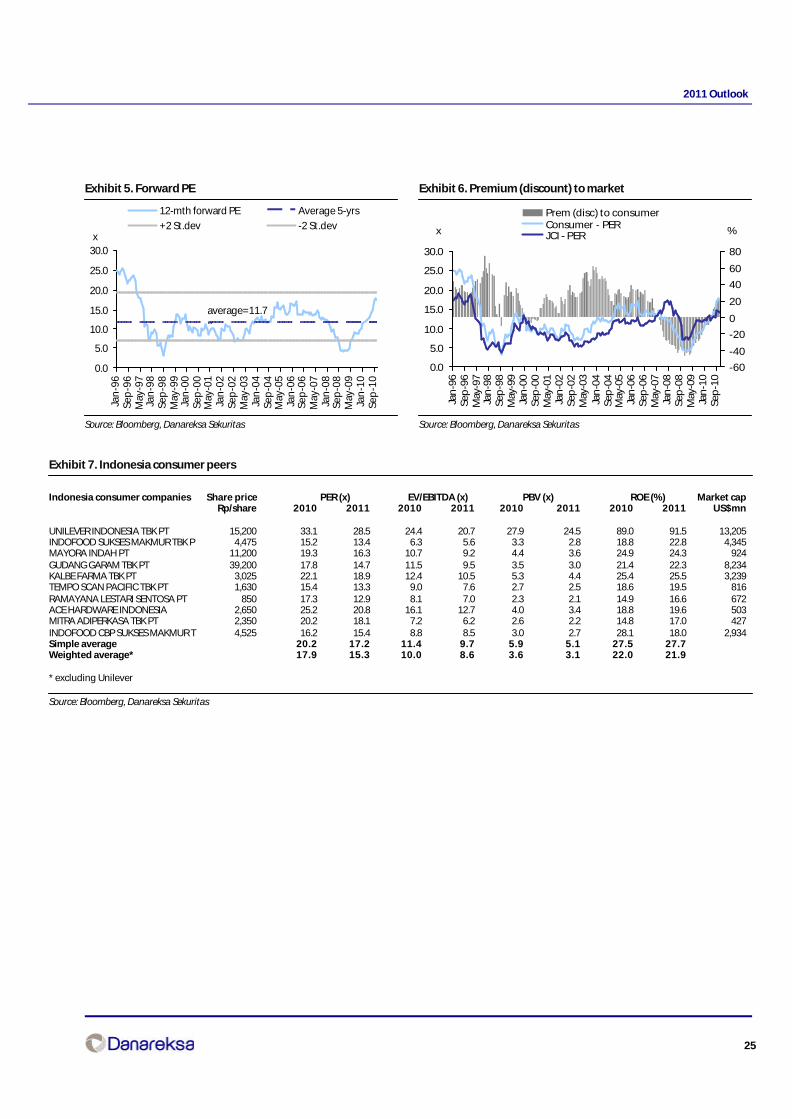
Exhibit 5. Forward PE
Source: Bloomberg, Danareksa Sekuritas
Exhibit 6. Premium (discount) to market
Source: Bloomberg, Danareksa Sekuritas
0.0
5.0
10.0
15.0
20.0
25.0
30.0
Jan
-96
Sep
-96
May
-97
Jan
-98
Sep
-98
May
-99
Jan
-00
Sep
-00
May
-01
Jan
-02
Sep
-02
May
-03
Jan
-04
Sep
-04
May
-05
Jan
-06
Sep
-06
May
-07
Jan
-08
Sep
-08
May
-09
Jan
-10
Sep
-10
12-mth forward PE Average 5-yrs
+2 St.dev -2 St.devx
average=11.7x
0.0
5.0
10.0
15.0
20.0
25.0
30.0
Jan
-96
Sep
-96
May
-97
Jan
-98
Sep
-98
May
-99
Jan
-00
Sep
-00
May
-01
Jan
-02
Sep
-02
May
-03
Jan
-04
Sep
-04
May
-05
Jan
-06
Sep
-06
May
-07
Jan
-08
Sep
-08
May
-09
Jan
-10
Sep
-10
-60
-40
-20
0
20
40
60
80
Prem (disc) to consumerConsumer - PERJCI - PERx %
Exhibit 7. Indonesia consumer peers
Indonesia consumer companies Share price PER (x) EV/EBITDA (x) PBV (x) ROE (%) Market capRp/share 2010 2011 2010 2011 2010 2011 2010 2011 US$mn
UNILEVER INDONESIA TBK PT 15,200 33.1 28.5 24.4 20.7 27.9 24.5 89.0 91.5 13,205INDOFOOD SUKSES MAKMUR TBK P 4,475 15.2 13.4 6.3 5.6 3.3 2.8 18.8 22.8 4,345MAYORA INDAH PT 11,200 19.3 16.3 10.7 9.2 4.4 3.6 24.9 24.3 924GUDANG GARAM TBK PT 39,200 17.8 14.7 11.5 9.5 3.5 3.0 21.4 22.3 8,234KALBE FARMA TBK PT 3,025 22.1 18.9 12.4 10.5 5.3 4.4 25.4 25.5 3,239TEMPO SCAN PACIFIC TBK PT 1,630 15.4 13.3 9.0 7.6 2.7 2.5 18.6 19.5 816RAMAYANA LESTARI SENTOSA PT 850 17.3 12.9 8.1 7.0 2.3 2.1 14.9 16.6 672ACE HARDWARE INDONESIA 2,650 25.2 20.8 16.1 12.7 4.0 3.4 18.8 19.6 503MITRA ADIPERKASA TBK PT 2,350 20.2 18.1 7.2 6.2 2.6 2.2 14.8 17.0 427INDOFOOD CBP SUKSES MAKMUR T 4,525 16.2 15.4 8.8 8.5 3.0 2.7 28.1 18.0 2,934Simple average 20.2 17.2 11.4 9.7 5.9 5.1 27.5 27.7Weighted average* 17.9 15.3 10.0 8.6 3.6 3.1 22.0 21.9
* excluding Unilever
Source: Bloomberg, Danareksa Sekuritas

26
2011 Outlook
Exhibit 8. Regional consumer peers
Consumer regional peers Share price PER (x) EV/EBITDA (x) PBV (x) ROE (%) Market caplocal currency 2010 2011 2010 2011 2010 2011 2010 2011 (US$ mn)
NISSIN FOODS HOLDINGS CO LTD 2,936 14.5 15.2 5.8 6.0 1.2 1.1 8.3 7.9 3,882TINGYI (CAYMAN ISLN) HLDG CO 20 32.4 27.0 15.3 12.7 8.5 7.3 27.8 28.3 14,476UNI-PRESIDENT CHINA HOLDINGS 4 21.4 17.3 9.5 7.5 2.0 1.8 9.2 10.7 1,958UNIVERSAL ROBINA CORP 36 11.1 10.3 6.5 6.2 1.8 1.7 18.5 16.6 1,721NONG SHIM CO LTD 201,500 10.5 9.9 4.9 4.7 0.9 0.9 9.5 9.4 1,010WANT WANT CHINA HOLDINGS LTD 7 29.8 23.4 22.4 17.5 10.4 9.1 36.4 41.2 11,431VITASOY INTL HOLDINGS LTD 6 22.4 19.7 11.7 10.4 4.4 4.1 20.4 21.6 831CHINA FOODS LTD 5 28.6 21.0 14.1 11.2 2.3 2.1 8.4 10.5 1,795NESTLE (MALAYSIA) BERHAD 43 23.2 22.1 16.0 15.0 16.0 14.9 66.4 64.1 3,216PETRA FOODS LTD 2 19.8 17.1 13.8 12.1 2.7 2.4 15.5 15.2 685MORINAGA MILK INDUSTRY CO 346 12.3 9.9 5.2 4.9 0.8 0.8 7.0 7.9 1,038YAKULT HONSHA CO LTD 2,368 28.7 24.6 9.6 8.9 1.7 1.6 6.4 6.9 4,872AUSNUTRIA DAIRY CORP LTD 3 15.1 12.3 8.8 6.2 1.8 1.6 15.5 14.5 363BRIGHT DAIRY & FOOD CO LTD-A 11 56.4 45.4 20.1 15.6 4.6 4.2 7.5 8.0 1,666VIET NAM DAIRY PRODUCTS JSC 86,000 8.4 8.5 7.1 5.7 3.5 2.8 45.7 39.2 1,549GUANGXI ROYAL DAIRY CO LTD-A 51 80.7 55.7 n.a. n.a. 6.9 n.a. n.a. n.a. 205CHINA MENGNIU DAIRY CO 21 23.7 18.6 12.2 9.5 3.3 2.9 15.0 17.5 4,691LG HOUSEHOLD & HEALTH CARE 393,000 29.7 24.4 22.4 19.0 8.7 6.7 31.7 30.4 4,995COLGATE-PALMOLIVE CO 80 16.8 15.9 10.1 9.7 14.8 13.6 82.4 81.3 39,753DABUR INDIA LTD 101 29.3 24.1 22.5 18.6 12.9 10.1 50.4 46.4 3,854HINDUSTAN UNILEVER LTD 295 29.3 25.8 22.4 19.7 21.5 18.6 79.0 76.3 14,160HENGAN INTL GROUP CO LTD 66 31.2 25.0 22.5 17.9 8.0 7.1 27.2 29.6 10,411COLGATE PALMOLIVE (INDIA) 872 26.1 23.8 20.6 17.9 29.6 23.9 119.1 108.7 2,607GODREJ CONSUMER PRODUCTS LTD 363 24.7 19.9 19.9 16.2 6.8 5.8 35.3 32.1 2,462SHANGHAI JAHWA UNITED CO -A 37 52.4 38.0 n.a. 28.3 n.a. n.a. 19.6 22.2 2,360PIGEON CORP 2,814 19.7 16.8 9.5 n.a. 2.1 2.0 11.0 11.9 673KOSE CORP 2,079 20.2 18.4 5.2 4.9 1.2 1.1 6.1 6.5 1,442Simple average 26.6 21.9 13.5 12.3 6.9 5.9 30.0 29.4Weighted average 25.0 21.4 14.9 13.2 11.0 9.7 49.6 49.3
Source: Bloomberg and Danareksa Sekuritas

27
2011 Outlook
Plantation sectorMid-term bullishness
Higher 2011 CPO pricesWe are raising our benchmark CPO price estimate to US$925/ton next year, expecting it to easeto US$870/ton in 2012, buoyed by constrained vegetable oil supply and demand imbalancesamidst a surge in consumption for mandated bio-diesel in Brazil. La Nina still persists in areas ofSouth America, with a plantings slowdown seen in Argentina and Brazil – major producers ofsoybean. Supply constraints are therefore likely to continue, probably until the early part of nextyear, we think. However, the expected subsiding of El Nino, the end of the biological cycle, andthe increase in fertilizer application will likely boost palm oil production, but most likely only inthe second half next year, curbing any further increases in prices. We estimate palm oil productionto increase by 2.7mn tons next year, or higher than this year’s 0.7mn tons increase. Of all plantationstocks under our coverage, our top picks are LSIP and BWPT. Major risks are bad weather and globaleconomic slowdown, led by China and India.
Demand supply imbalancesThe world’s vegetable oil supply is likely to remain constrained, in our view - at least up to the earlypart of next year. Demand shall continue to increase, mainly from higher income and changes indiets in China – despite its intention to curb inflation and India, as well as from mandated bio-diesel in Brazil. We estimate demand for vegetable oil to grow by 4.5% next year, with supply risingonly a mere 3.7%. Much of the supplies are coming from soya oil and palm oil, both growing byaround 8.4% and 6.0% respectively, yet still insufficient to offset the decline in any other vegetableoils. Stock to usage - an indicator of strong demand - will decline in the third consecutive year to11.0%. For now, the risks are in the oilseed production, with the La Nina effect still seen in majorsoybean producers. In effect, such dryness has led to delays in plantings and, in some cases, theyields. As of mid-November, around 7.7mn ha of soybean were planted, down by 9% from a yearago. And in Brazil, only 4.4mn ha was planted, down from 5.1mn ha planted last year. That’s notto mention the potential switch of grain plantings, whose production setback has been severein recent months.
Bio-diesel – small yet great impactWe are not a great fan of bio-diesel, for which consumption of vegetable oils is thought to beimmaterial. However, the rapidly expanding bio-diesel production in Brazil, the 3rd largest worldproducer of soya oil, is likely to reduce the export supply of oils and fats. In fact, it will also increaseimports primarily of palm oil and palm kernel oil to meet demand for food. This year, Brazil’sdomestic consumption of vegetable oil rises by 14.0% YoY, with 28.3% of such demand going intobio-diesel, with the remaining going into food. In any case, exports of soya oil are expected todecline by 15.2% YoY to about 1.2mn tons, creating a decline in the stock to usage of soya oil to10.1% from this year’s 11.6%.
Bonny B. Setiawan, CFA(62-21) 2352 [email protected]
OVERWEIGHT
Jakagri Relative to JCI Index
Rec. TP Mkt. cap PER, x EV/EBITDA, x Current Div yieldRp/share Rp bn 2010E 2011E 2010E 2011E EV/Ha %
US$/ha
AALI HOLD 24,500 36,376 26.1 18.0 15.9 11.1 21,735 2.8LSIP BUY 14,850 15,147 19.4 13.4 11.7 8.4 17,133 2.1SGRO BUY 3,700 5,765 18.8 12.5 10.6 7.7 11,605 2.4BWPT BUY 1,350 4,683 22.3 13.2 13.9 7.6 13,140 0.8
1,000
1,300
1,600
1,900
2,200
2,500
12/1
8/09
2/1
/10
3/10
/10
4/19
/10
5/26
/10
7/2
/10
8/9
/10
9/22
/10
10/2
8/10
12/6
/10
-25
-20
-15
-10
-5
0
5
10
JAKAGRI (LHS) Relative to JCI Index (RHS)%
28
2011 Outlook
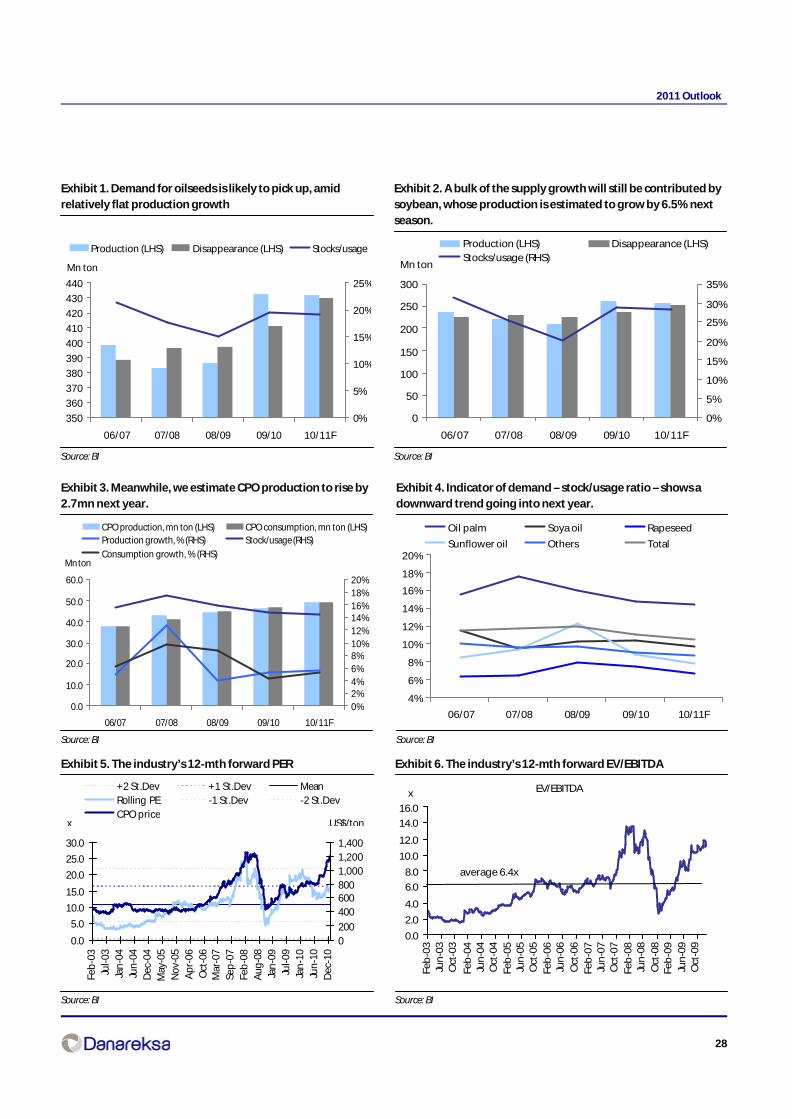
Exhibit 1. Demand for oilseeds is likely to pick up, amidrelatively flat production growth
Source: BI
Exhibit 2. A bulk of the supply growth will still be contributed bysoybean, whose production is estimated to grow by 6.5% nextseason.
Source: BI
350
360
370
380
390
400
410
420
430
440
06/07 07/08 08/09 09/10 10/11F
Mn ton
0%
5%
10%
15%
20%
25%
Production (LHS) Disappearance (LHS) Stocks/usage
0
50
100
150
200
250
300
06/07 07/08 08/09 09/10 10/11F
Mn ton
0%
5%
10%
15%
20%
25%
30%
35%
Production (LHS) Disappearance (LHS)Stocks/usage (RHS)
Exhibit 3. Meanwhile, we estimate CPO production to rise by2.7mn next year.
Source: BI
0.0
10.0
20.0
30.0
40.0
50.0
60.0
06/07 07/08 08/09 09/10 10/11F
Mn ton
0%2%4%6%8%10%12%14%16%18%20%
CPO production, mn ton (LHS) CPO consumption, mn ton (LHS)Production growth, % (RHS) Stock/usage (RHS)
Consumption growth, % (RHS)
Exhibit 4. Indicator of demand – stock/usage ratio – shows adownward trend going into next year.
Source: BI
4%
6%
8%
10%
12%
14%
16%
18%
20%
06/07 07/08 08/09 09/10 10/11F
Oil palm Soya oil Rapeseed
Sunflower oil Others Total
Exhibit 5. The industry’s 12-mth forward PER
Source: BI
Exhibit 6. The industry’s 12-mth forward EV/EBITDA
Source: BI
0.0
5.0
10.0
15.0
20.0
25.0
30.0
Feb
-03
Jul-0
3Ja
n-0
4Ju
n-0
4D
ec-0
4M
ay-0
5N
ov-0
5A
pr-
06O
ct-0
6M
ar-0
7Se
p-0
7Fe
b-0
8A
ug-0
8Ja
n-0
9Ju
l-09
Jan
-10
Jun
-10
Dec
-10
0200
4006008001,0001,2001,400
+2 St.Dev +1 St.Dev MeanRolling PE -1 St.Dev -2 St.DevCPO price
x US$/ton
EV/EBITDA
0.0
2.0
4.0
6.0
8.0
10.0
12.0
14.0
16.0
Feb
-03
Jun
-03
Oct
-03
Feb
-04
Jun
-04
Oct
-04
Feb
-05
Jun
-05
Oct
-05
Feb
-06
Jun
-06
Oct
-06
Feb
-07
Jun
-07
Oct
-07
Feb
-08
Jun
-08
Oct
-08
Feb
-09
Jun
-09
Oct
-09
x
average 6.4x
29
2011 Outlook
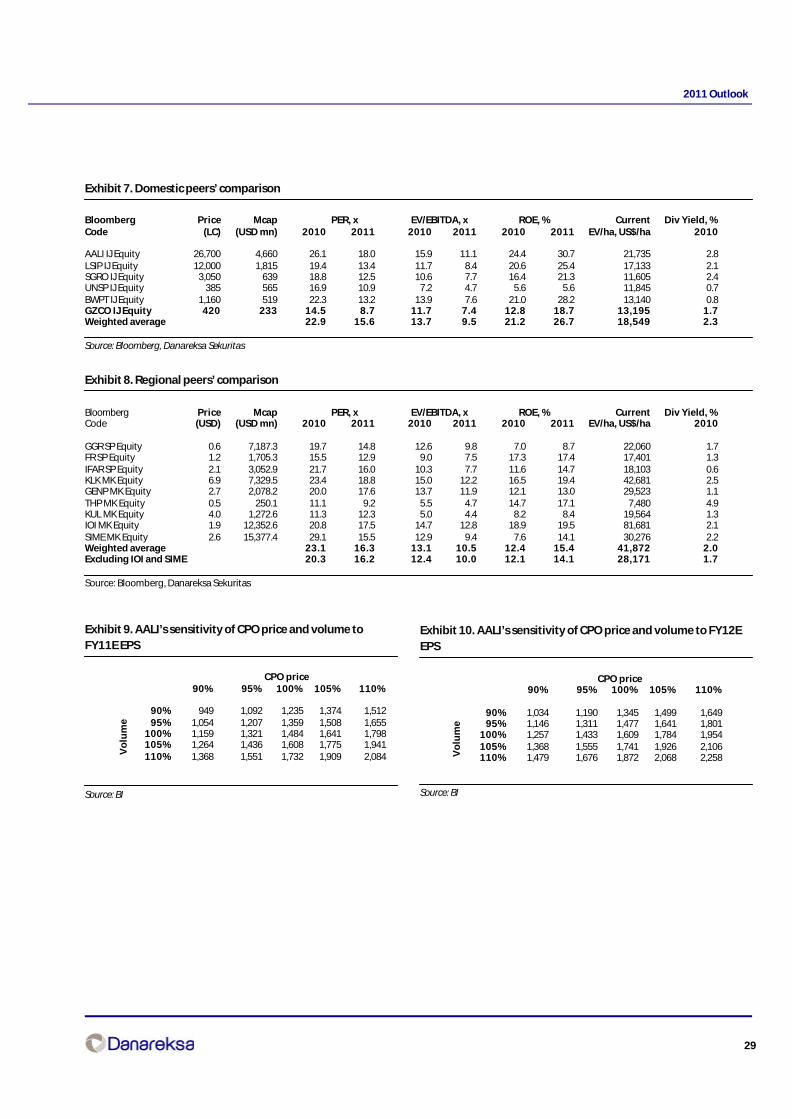
Exhibit 7. Domestic peers’ comparison
Bloomberg Price Mcap PER, x EV/EBITDA, x ROE, % Current Div Yield, %Code (LC) (USD mn) 2010 2011 2010 2011 2010 2011 EV/ha, US$/ha 2010
AALI IJ Equity 26,700 4,660 26.1 18.0 15.9 11.1 24.4 30.7 21,735 2.8LSIP IJ Equity 12,000 1,815 19.4 13.4 11.7 8.4 20.6 25.4 17,133 2.1SGRO IJ Equity 3,050 639 18.8 12.5 10.6 7.7 16.4 21.3 11,605 2.4UNSP IJ Equity 385 565 16.9 10.9 7.2 4.7 5.6 5.6 11,845 0.7BWPT IJ Equity 1,160 519 22.3 13.2 13.9 7.6 21.0 28.2 13,140 0.8GZCO IJ Equity 420 233 14.5 8.7 11.7 7.4 12.8 18.7 13,195 1.7Weighted average 22.9 15.6 13.7 9.5 21.2 26.7 18,549 2.3
Source: Bloomberg, Danareksa Sekuritas
Exhibit 8. Regional peers’ comparison
Bloomberg Price Mcap PER, x EV/EBITDA, x ROE, % Current Div Yield, %Code (USD) (USD mn) 2010 2011 2010 2011 2010 2011 EV/ha, US$/ha 2010
GGR SP Equity 0.6 7,187.3 19.7 14.8 12.6 9.8 7.0 8.7 22,060 1.7FR SP Equity 1.2 1,705.3 15.5 12.9 9.0 7.5 17.3 17.4 17,401 1.3IFAR SP Equity 2.1 3,052.9 21.7 16.0 10.3 7.7 11.6 14.7 18,103 0.6KLK MK Equity 6.9 7,329.5 23.4 18.8 15.0 12.2 16.5 19.4 42,681 2.5GENP MK Equity 2.7 2,078.2 20.0 17.6 13.7 11.9 12.1 13.0 29,523 1.1THP MK Equity 0.5 250.1 11.1 9.2 5.5 4.7 14.7 17.1 7,480 4.9KUL MK Equity 4.0 1,272.6 11.3 12.3 5.0 4.4 8.2 8.4 19,564 1.3IOI MK Equity 1.9 12,352.6 20.8 17.5 14.7 12.8 18.9 19.5 81,681 2.1SIME MK Equity 2.6 15,377.4 29.1 15.5 12.9 9.4 7.6 14.1 30,276 2.2Weighted average 23.1 16.3 13.1 10.5 12.4 15.4 41,872 2.0Excluding IOI and SIME 20.3 16.2 12.4 10.0 12.1 14.1 28,171 1.7
Source: Bloomberg, Danareksa Sekuritas
Exhibit 9. AALI’s sensitivity of CPO price and volume toFY11E EPS
CPO price90% 95% 100% 105% 110%
90% 949 1,092 1,235 1,374 1,51295% 1,054 1,207 1,359 1,508 1,655
100% 1,159 1,321 1,484 1,641 1,798105% 1,264 1,436 1,608 1,775 1,941110% 1,368 1,551 1,732 1,909 2,084
Source: BI
Exhibit 10. AALI’s sensitivity of CPO price and volume to FY12EEPS
CPO price90% 95% 100% 105% 110%
90% 1,034 1,190 1,345 1,499 1,64995% 1,146 1,311 1,477 1,641 1,801
100% 1,257 1,433 1,609 1,784 1,954105% 1,368 1,555 1,741 1,926 2,106110% 1,479 1,676 1,872 2,068 2,258
Source: BI
Vo
lum
e
Vo
lum
e

30
2011 Outlook
Exhibit 11. LSIP’s sensitivity of CPO price and volume toFY11E EPS
CPO price90% 95% 100% 105% 110%
90% 616 680 744 805 86595% 685 754 822 886 950
100% 754 827 899 967 1,034105% 824 900 976 1,048 1,119110% 893 973 1,053 1,129 1,204
Source: BI
Exhibit 12. LSIP’s sensitivity of CPO price and volume to FY12EEPS
CPO price90% 95% 100% 105% 110%
90% 631 700 769 837 90195% 705 778 851 924 992
100% 779 857 934 1,010 1,083105% 853 935 1,016 1,097 1,173110% 927 1,013 1,098 1,183 1,264
Source: BI
Vo
lum
e
Vo
lum
e
Exhibit 13. SGRO’s sensitivity of CPO price and volume toFY11E EPS
CPO price90% 95% 100% 105% 110%
90% 128 149 170 191 21195% 161 184 207 230 252
100% 194 219 244 269 293105% 228 255 282 308 334110% 261 290 319 347 375
Source: BI
Exhibit 14. SGRO’s sensitivity of CPO price and volume to FY12EEPS
CPO price90% 95% 100% 105% 110%
90% 159 184 209 233 25795% 197 224 252 279 305
100% 235 265 294 324 352105% 274 306 337 369 399110% 312 346 380 414 447
Source: BI
Vo
lum
e
Vo
lum
e
Exhibit 15. BWPT’s sensitivity of CPO price and volume toFY11E EPS
CPO price90% 95% 100% 105% 110%
90% 59 66 73 80 8795% 66 73 80 88 95
100% 72 80 88 95 103105% 79 87 95 103 111110% 85 94 102 111 119
Source: BI
Exhibit 16. BWPT’s sensitivity of CPO price and volume to FY12EEPS
CPO price90% 95% 100% 105% 110%
90% 80 89 97 106 11595% 88 97 106 115 124
100% 96 105 115 124 134105% 104 114 124 134 144110% 112 122 132 143 153
Source: BI
Vo
lum
e
Vo
lum
e
31
2011 Outlook
Property sectorMore to come
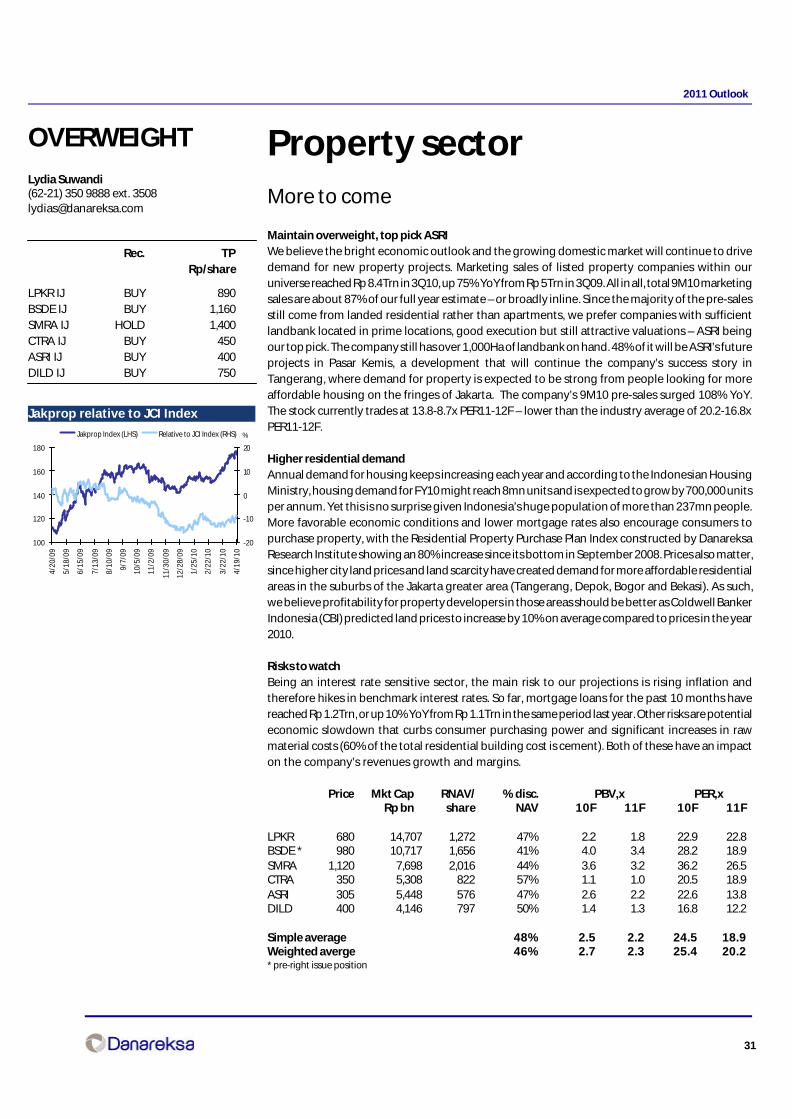
Maintain overweight, top pick ASRIWe believe the bright economic outlook and the growing domestic market will continue to drivedemand for new property projects. Marketing sales of listed property companies within ouruniverse reached Rp 8.4Trn in 3Q10, up 75% YoY from Rp 5Trn in 3Q09. All in all, total 9M10 marketingsales are about 87% of our full year estimate – or broadly inline. Since the majority of the pre-salesstill come from landed residential rather than apartments, we prefer companies with sufficientlandbank located in prime locations, good execution but still attractive valuations – ASRI beingour top pick. The company still has over 1,000Ha of landbank on hand. 48% of it will be ASRI’s futureprojects in Pasar Kemis, a development that will continue the company’s success story inTangerang, where demand for property is expected to be strong from people looking for moreaffordable housing on the fringes of Jakarta. The company’s 9M10 pre-sales surged 108% YoY.The stock currently trades at 13.8-8.7x PER11-12F – lower than the industry average of 20.2-16.8xPER11-12F.
Higher residential demandAnnual demand for housing keeps increasing each year and according to the Indonesian HousingMinistry, housing demand for FY10 might reach 8mn units and is expected to grow by 700,000 unitsper annum. Yet this is no surprise given Indonesia’s huge population of more than 237mn people.More favorable economic conditions and lower mortgage rates also encourage consumers topurchase property, with the Residential Property Purchase Plan Index constructed by DanareksaResearch Institute showing an 80% increase since its bottom in September 2008. Prices also matter,since higher city land prices and land scarcity have created demand for more affordable residentialareas in the suburbs of the Jakarta greater area (Tangerang, Depok, Bogor and Bekasi). As such,we believe profitability for property developers in those areas should be better as Coldwell BankerIndonesia (CBI) predicted land prices to increase by 10% on average compared to prices in the year2010.
Risks to watchBeing an interest rate sensitive sector, the main risk to our projections is rising inflation andtherefore hikes in benchmark interest rates. So far, mortgage loans for the past 10 months havereached Rp 1.2Trn, or up 10% YoY from Rp 1.1Trn in the same period last year. Other risks are potentialeconomic slowdown that curbs consumer purchasing power and significant increases in rawmaterial costs (60% of the total residential building cost is cement). Both of these have an impacton the company’s revenues growth and margins.
Lydia Suwandi(62-21) 350 9888 ext. [email protected]
OVERWEIGHT
Jakprop relative to JCI Index
100
120
140
160
180
4/20
/09
5/18
/09
6/15
/09
7/13
/09
8/10
/09
9/7/
09
10/5
/09
11/2
/09
11/3
0/09
12/2
8/09
1/25
/10
2/22
/10
3/22
/10
4/19
/10
-20
-10
0
10
20
Jakprop Index (LHS) Relative to JCI Index (RHS) %
Price Mkt Cap RNAV/ % disc. PBV,x PER,xRp bn share NAV 10F 11F 10F 11F
LPKR 680 14,707 1,272 47% 2.2 1.8 22.9 22.8BSDE * 980 10,717 1,656 41% 4.0 3.4 28.2 18.9SMRA 1,120 7,698 2,016 44% 3.6 3.2 36.2 26.5CTRA 350 5,308 822 57% 1.1 1.0 20.5 18.9ASRI 305 5,448 576 47% 2.6 2.2 22.6 13.8DILD 400 4,146 797 50% 1.4 1.3 16.8 12.2
Simple average 48% 2.5 2.2 24.5 18.9Weighted averge 46% 2.7 2.3 25.4 20.2* pre-right issue position
Rec. TPRp/share
LPKR IJ BUY 890BSDE IJ BUY 1,160SMRA IJ HOLD 1,400CTRA IJ BUY 450ASRI IJ BUY 400DILD IJ BUY 750

32
2011 Outlook
Exhibit 1. 10-15% land price increase in outskirt Jakarta
2010 2011 Growth, %in RpType 550,000 605,000 10.0Residential 900,000 1,035,000 15.0
Source: Coldwell banker Indonesia, others
Exhibit 2. Listed property companies pre-sales in our universe
Source: Companies, Danareksa Sekuritas
Exhibit 3. Residential purchase plan index
Source: Danareksa Research Institute
Exhibit 4. Negative correlation between Jakprop index andinterest rate
Source: CEIC
Exhibit 5. 12-mth forward PER
Source: Danareksa and Bloomberg
Exhibit 6. 12-mth forward PBV
Source: Danareksa and Bloomberg
3,403
5,9865,077
6,163
8,4309,659
12,304
-
2,000
4,000
6,000
8,000
10,000
12,000
14,000
2007 2008 9M09 2009 9M10 2010F 2011F
Rp bn
11.512.012.513.013.514.014.515.015.5
Dec
-07
May
-08
Oct
-08
Mar
-09
Au
g-0
9
Jan
-10
Jun
-10
0
50
100
150
200
250
300
Lending Rate (LHS),% JakProp Index (RHS)
average 22.6x
-
5.0
10.0
15.0
20.0
25.0
30.0
35.0
40.0
Jan
-06
May
-06
Sep
-06
Jan
-07
May
-07
Sep
-07
Jan
-08
May
-08
Sep
-08
Jan
-09
May
-09
Sep
-09
Jan
-10
May
-10
Sep
-10
x
1.0
1.5
2.0
2.5
3.0
Jan-
06
Aug
-06
Mar
-07
Oct
-07
May
-08
Dec
-08
Jul-0
9
Feb
-10
Sep
-10
x
average 1.9x
0.0
0.5
1.0
1.5
2.0
2.5
3.0
3.5
4.0
Jan
-08
Mar
-08
May
-08
Jul-
08
Sep
-08
No
v-08
Jan
-09
Mar
-09
May
-09
Jul-
09
Sep
-09
No
v-09
Jan
-10
Mar
-10
May
-10
Jul-
10
30
35
40
45
50
55
60
65
70
Housing price Index, % YoY (LHS)
Housing buying plan Index (RHS)

33
2011 Outlook

34
2011 Outlook
Company Outlook(In Alphabetical order)

35
2011 Outlook
ACE Hardware IndonesiaPositives already in the share price
Downgrade to HOLD, TP stays at Rp2,550While we like ACES for its sound business model, savvy management and healthy balance sheet,we believe much of these positives are already in the share price; hence our downgrade to a HOLD.Looking ahead, earnings are likely to be strong – at some 19% 3-yr CAGR, backed by above industryaverage productivity of Rp14mn/sqm. Recent same-store-sales growth of 6.7% suggests that suchearnings momentum shall be maintained through next year. Operating margins shall remainresilient, hitting some 13.7-13.9% in FY11-12F. We maintain our TP of Rp2,550, implying 20x PE11Fand 3.5x PBV 11F, already at the high-end compared to its peers, although justified by its strongprofitability.
Sales buoyed by strong demand and expansionWe estimate sales growth to reach 19-13% in 2011-12E, with SSSG remaining firm at 10%, thanksto growing housing demand of 4% p.a. and the company’s expansion of 15,000sqm p.a. or 3-4stores every year. Such expansion shall cost Rp75bn in annual capex and is likely to generatereturns of Rp14.9mn-15.4mn/sqm in 2011-12E. So far in 2010, 6 stores have been opened, addingapproximately 24,105sqm – some 23% of the existing operating space. Store expansion is still inJava, which so far has yielded a SSSG of 14%. Yet opportunities remain “out of Java”, where marginsand productivity is higher by 3% and 7%, respectively. Still, until such plans materialize, we remainconservative and forecast overall productivity of Rp14mn/sqm.
Expanding marginsACES is benefiting from economies of scale, largely due to its greater bargaining position withsuppliers amidst lower import taxes thanks to AFTA. Besides that, margin expansion is likely tocome from its focus on higher margin products like lifestyle goods and toys. Presently, homeimprovement products account for 65% of its total sales, but going forward this is likely to declineto 50-60% as its sales of high yielding lifestyle products pick up. Note that the margin differentialbetween lifestyle products and home improvement products can reach as high as 5%. Bottom line,we are expecting margins to stay firm, hitting 11-12% in 2011-12E.
Risks to watchMuch of the company’s successful execution risk hinges on: 1) the current economic conditions,as any slowdown could delay expansion plans, 2) the stability of the rupiah, since many productsare imported, and 3) the sustainability of robust housing demand and strong purchasing power.
Lydia Suwandi(62-21) 350 9888 ext. [email protected]
HOLDBloomberg Code ACES IJPrice, Rp 2,650Mkt Cap Rp bn 4,544Target Price, Rp 2,,550
Last Recommendation
Rec. Target Price
22-Dec-10 HOLD Rp 2,55005-Oct-10 BUY Rp 2,550
ACES relative price to JCI Index
Year to Dec 2008 2009 2010F 2011F 2012F
Revenues, Rp bn 1,280 1,398 1,657 1,976 2,234Gross profit, Rp bn 503 552 690 834 948EBITDA, Rp bn 188 211 266 332 384EBIT, Rp bn 164 178 216 271 311Net profit, Rp bn 131 154 173 223 259Core profit, Rp bn 129 149 169 218 255Core EPS, Rp 75 87 98 127 148Core EPS growth, % 104 15 13 29 17EV/EBITDA, x 24 20 16 12 10Dividend Yield, % 0.1 0.3 0.3 0.4 0.5BVPS, Rp 395 506 599 719 858
1,000
1,500
2,000
2,500
3,000
12/1
8/09
1/28
/10
3/12
/10
4/20
/10
6/7/
10
7/14
/10
8/30
/10
10/7
/10
11/8
/10
12/1
0/10
-20
-5
10
25
40
ACES (LHS) Relative to JCI Index (RHS)%
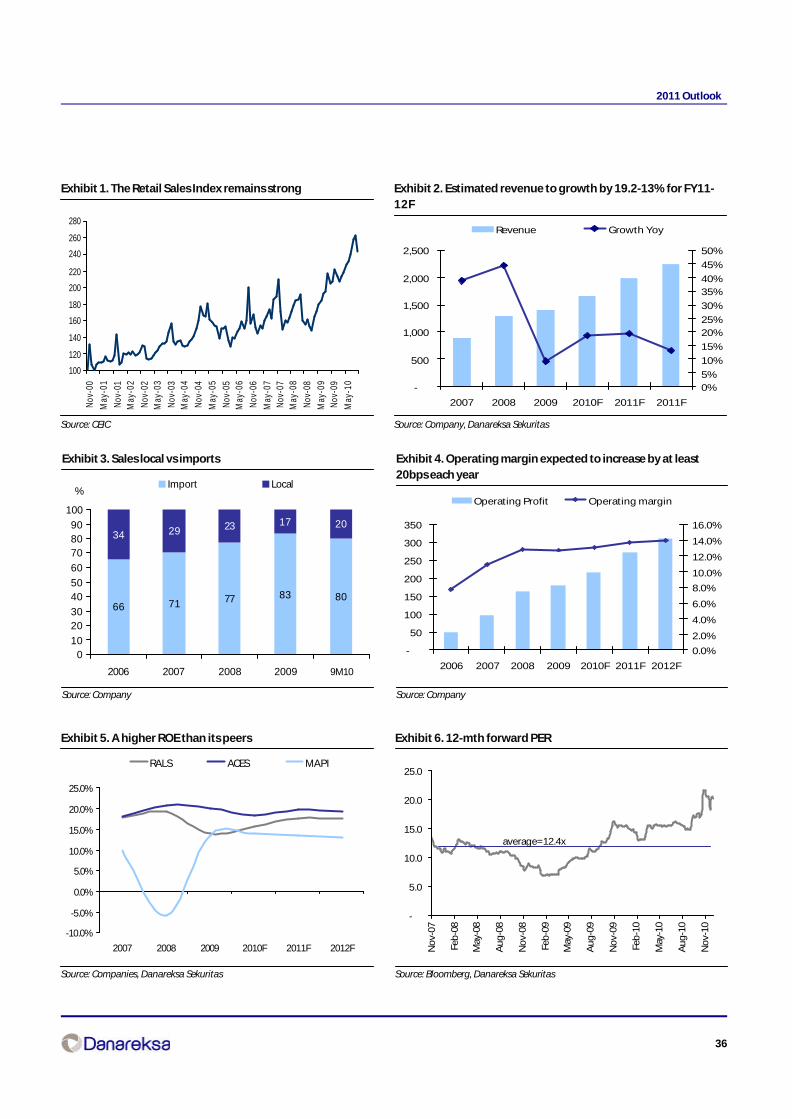
36
2011 Outlook
Exhibit 1. The Retail Sales Index remains strong
Source: CEIC
Exhibit 2. Estimated revenue to growth by 19.2-13% for FY11-12F
Source: Company, Danareksa Sekuritas
Exhibit 3. Sales local vs imports
Source: Company
Exhibit 4. Operating margin expected to increase by at least20bps each year
Source: Company
Exhibit 5. A higher ROE than its peers
Source: Companies, Danareksa Sekuritas
Exhibit 6. 12-mth forward PER
Source: Bloomberg, Danareksa Sekuritas
-
500
1,000
1,500
2,000
2,500
2007 2008 2009 2010F 2011F 2011F
0%
5%
10%
15%
20%
25%
30%
35%
40%
45%
50%
Revenue Growth Yoy
66 71 77 83 80
34 29 23 17 20
010
2030
4050
60
708090
100
2006 2007 2008 2009 1H10
%Import Local
-
50
100
150
200
250
300
350
2006 2007 2008 2009 2010F 2011F 2012F
0.0%
2.0%
4.0%
6.0%
8.0%
10.0%
12.0%
14.0%
16.0%
Operating Profit Operating margin
-10.0%
-5.0%
0.0%
5.0%
10.0%
15.0%
20.0%
25.0%
2007 2008 2009 2010F 2011F 2012F
RALS ACES MAPI
-
5.0
10.0
15.0
20.0
25.0
No
v-07
Feb
-08
May
-08
Au
g-0
8
No
v-08
Feb
-09
May
-09
Au
g-0
9
No
v-09
Feb
-10
May
-10
Au
g-1
0
No
v-10
average=12.4x
100
120
140
160
180
200
220
240
260
280
Nov-
00M
ay-0
1No
v-01
May
-02
Nov-
02M
ay-0
3No
v-03
May
-04
Nov-
04M
ay-0
5No
v-05
May
-06
Nov-
06M
ay-0
7No
v-07
May
-08
Nov-
08M
ay-0
9No
v-09
May
-10
9M10

37
2011 Outlook
Exhibit 7. Profit & loss (Rp bn)
2008 2009 2010F 2011F 2012F
Revenue 1,279.8 1,397.9 1,657.4 1,976.0 2,233.9 YoY growth, % 44 9 19 19 13Cost of good sold 777.1 845.5 967.4 1,141.6 1,285.9 YoY growth, % 39 9 14 18 13% of sales 61 60 58 58 58Gross profit 502.7 552.4 690.0 834.4 948.0 YoY growth, % 54 10 25 21 14% of sales 39 40 42 42 42EBITDA 188.1 211.4 265.7 332.4 383.9 YoY growth, % 78 12 26 25 15% of sales 15 15 16 17 17Depreciation 23.6 33.2 49.7 61.2 72.6Operating profit 164.5 178.2 216.0 271.3 311.3 YoY growth, % 70 8 21 26 15% of sales 13 13 13 14 14Forex 6.5 10.6Interet expenses (0.1) (0.0)Interest income 17.3 20.7 8.9 20.0 28.1Others (4.7) (3.2) 6.2 6.2 6.2Total other income (loss) 19.0 28.1 15.1 26.2 34.3Pretax profit 183.5 206.3 231.1 297.5 345.6Income tax (52.8) (51.9) (57.8) (74.4) (86.4)Net income 130.6 154.4 173.3 223.1 259.2
Source: Company and Danareksa Sekuritas
Exhibit 8. Balance sheet
2008 2009 2010F 2011F 2012FAssetCash and equivalent 98.7 395.8 236.4 335.6 495.9Investment 198.3 73.1 73.1 73.1 73.1Trade receivable 7.7 8.4 10.0 11.9 13.5Other receivable 13.4 5.5 9.1 10.8 12.2Invetory 198.0 95.6 408.7 487.2 550.8Advance 80.0 170.7 115.3 136.4 153.8Prepaid expense and tax 23.1 26.7 27.5 32.5 36.7Due from related parties 38.7 37.4 37.4 37.4 37.4Deferred tax 3.5 6.5 6.5 6.5 6.5Other assets 46.0 45.8 45.8 45.8 45.8Fixed assets 82.8 105.1 176.0 189.8 192.2TOTAL ASSETS 790.3 970.6 1,145.8 1,367.1 1,617.9
LIABILITIESBank loans - - - - -Trade payables 52.1 29.5 39.8 46.9 52.8Tax payables 22.1 20.9 20.1 25.7 30.0Accrued exp 6.8 7.5 12.8 15.2 17.1Sales Advance 3.9 4.2 5.0 6.0 6.8employee benefit 21.0 29.6 29.6 29.6 29.6other liaibilities 6.9 11.0 12.5 14.8 16.7TOTAL LIABILITIES 112.8 102.8 119.8 138.2 153.0
EQUITYCap stock 171.5 171.5 171.5 171.5 171.5Add. Paid in 353.9 368.1 368.1 368.1 368.1Treasury stock (34.1)Retained 186.1 328.1 486.3 689.2 925.2
Appropriated 6.0 19.0 486.3 689.2 925.2Unappropriated 180.1 309.1
TOTAL EQUITY 677.5 867.8 1,025.9 1,228.8 1,464.9
TL & SE 790.3 970.6 1,145.7 1,367.0 1,617.8
Source: Company and Danareksa Sekuritas
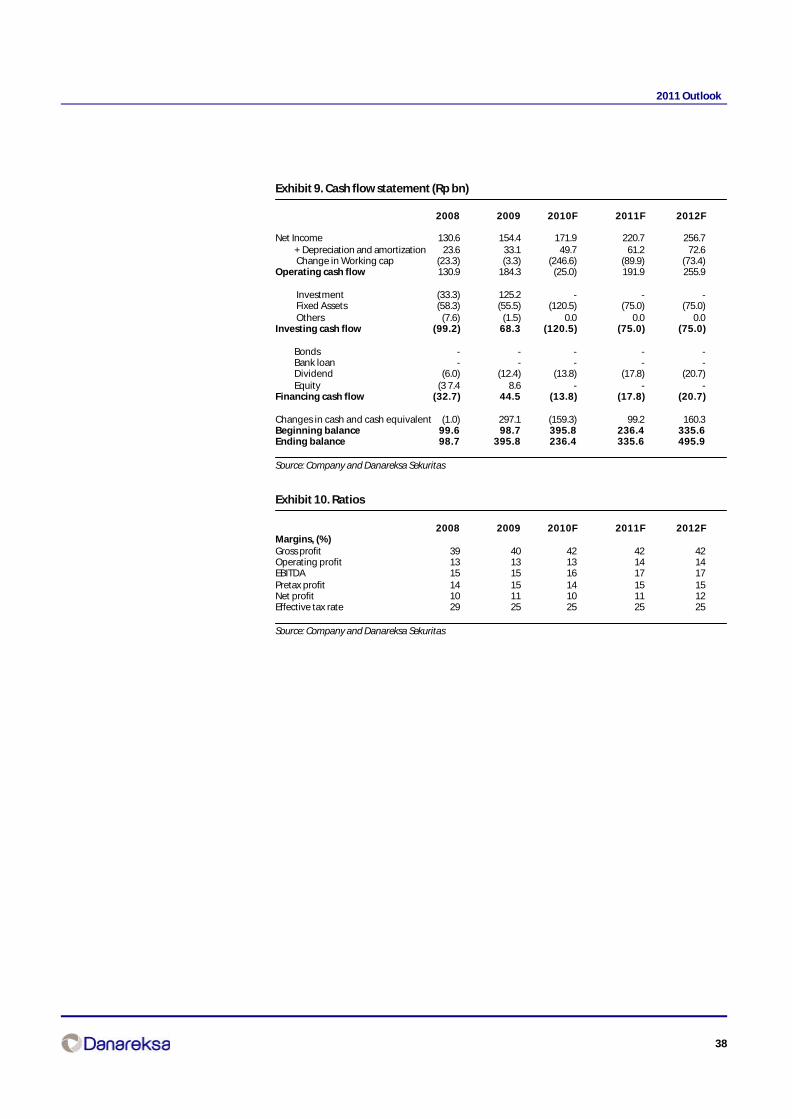
38
2011 Outlook
Exhibit 9. Cash flow statement (Rp bn)
2008 2009 2010F 2011F 2012F
Net Income 130.6 154.4 171.9 220.7 256.7+ Depreciation and amortization 23.6 33.1 49.7 61.2 72.6 Change in Working cap (23.3) (3.3) (246.6) (89.9) (73.4)
Operating cash flow 130.9 184.3 (25.0) 191.9 255.9
Investment (33.3) 125.2 - - - Fixed Assets (58.3) (55.5) (120.5) (75.0) (75.0) Others (7.6) (1.5) 0.0 0.0 0.0
Investing cash flow (99.2) 68.3 (120.5) (75.0) (75.0)
Bonds - - - - -Bank loan - - - - -Dividend (6.0) (12.4) (13.8) (17.8) (20.7)Equity (3 7.4 8.6 - - -
Financing cash flow (32.7) 44.5 (13.8) (17.8) (20.7)
Changes in cash and cash equivalent (1.0) 297.1 (159.3) 99.2 160.3Beginning balance 99.6 98.7 395.8 236.4 335.6Ending balance 98.7 395.8 236.4 335.6 495.9
Source: Company and Danareksa Sekuritas
Exhibit 10. Ratios
2008 2009 2010F 2011F 2012FMargins, (%)Gross profit 39 40 42 42 42Operating profit 13 13 13 14 14EBITDA 15 15 16 17 17Pretax profit 14 15 14 15 15Net profit 10 11 10 11 12Effective tax rate 29 25 25 25 25
Source: Company and Danareksa Sekuritas
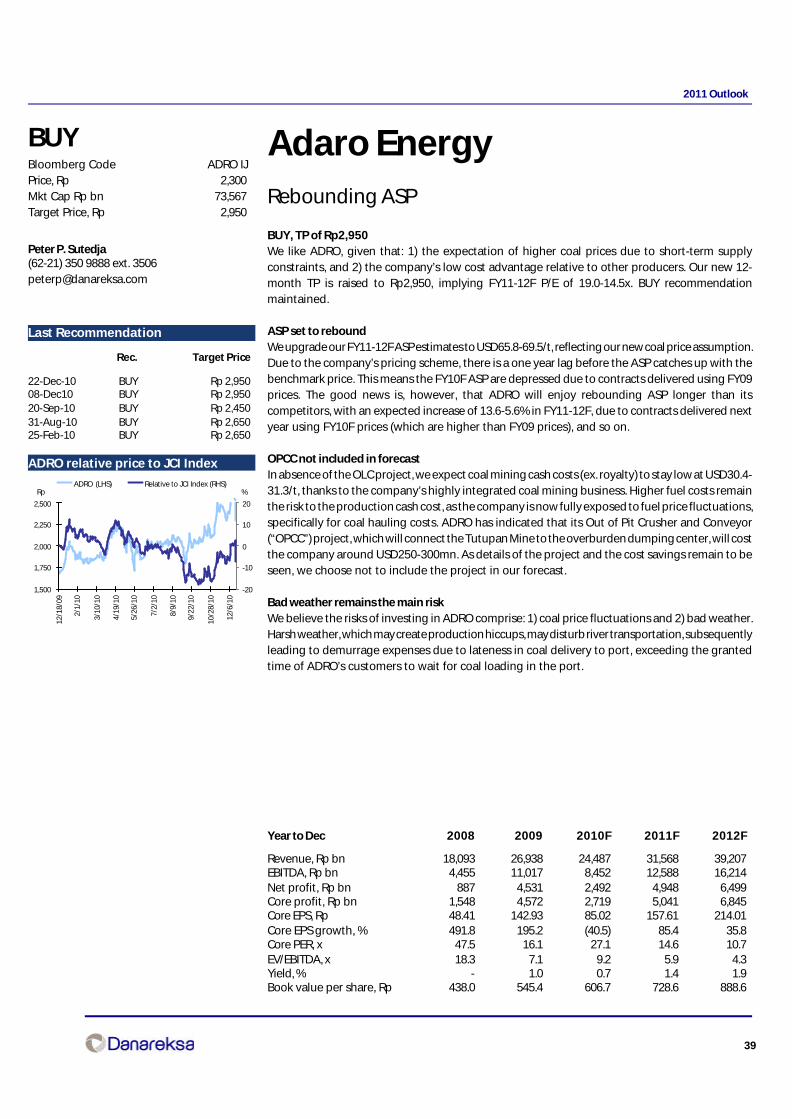
39
2011 Outlook
BUYBloomberg Code ADRO IJPrice, Rp 2,300Mkt Cap Rp bn 73,567Target Price, Rp 2,950
Adaro EnergyRebounding ASP
BUY, TP of Rp2,950We like ADRO, given that: 1) the expectation of higher coal prices due to short-term supplyconstraints, and 2) the company’s low cost advantage relative to other producers. Our new 12-month TP is raised to Rp2,950, implying FY11-12F P/E of 19.0-14.5x. BUY recommendationmaintained.
ASP set to reboundWe upgrade our FY11-12F ASP estimates to USD65.8-69.5/t, reflecting our new coal price assumption.Due to the company’s pricing scheme, there is a one year lag before the ASP catches up with thebenchmark price. This means the FY10F ASP are depressed due to contracts delivered using FY09prices. The good news is, however, that ADRO will enjoy rebounding ASP longer than itscompetitors, with an expected increase of 13.6-5.6% in FY11-12F, due to contracts delivered nextyear using FY10F prices (which are higher than FY09 prices), and so on.
OPCC not included in forecastIn absence of the OLC project, we expect coal mining cash costs (ex. royalty) to stay low at USD30.4-31.3/t, thanks to the company’s highly integrated coal mining business. Higher fuel costs remainthe risk to the production cash cost, as the company is now fully exposed to fuel price fluctuations,specifically for coal hauling costs. ADRO has indicated that its Out of Pit Crusher and Conveyor(“OPCC”) project, which will connect the Tutupan Mine to the overburden dumping center, will costthe company around USD250-300mn. As details of the project and the cost savings remain to beseen, we choose not to include the project in our forecast.
Bad weather remains the main riskWe believe the risks of investing in ADRO comprise: 1) coal price fluctuations and 2) bad weather.Harsh weather, which may create production hiccups, may disturb river transportation, subsequentlyleading to demurrage expenses due to lateness in coal delivery to port, exceeding the grantedtime of ADRO’s customers to wait for coal loading in the port.
Year to Dec 2008 2009 2010F 2011F 2012F
Revenue, Rp bn 18,093 26,938 24,487 31,568 39,207EBITDA, Rp bn 4,455 11,017 8,452 12,588 16,214Net profit, Rp bn 887 4,531 2,492 4,948 6,499Core profit, Rp bn 1,548 4,572 2,719 5,041 6,845Core EPS, Rp 48.41 142.93 85.02 157.61 214.01Core EPS growth, % 491.8 195.2 (40.5) 85.4 35.8Core PER, x 47.5 16.1 27.1 14.6 10.7EV/EBITDA, x 18.3 7.1 9.2 5.9 4.3Yield, % - 1.0 0.7 1.4 1.9Book value per share, Rp 438.0 545.4 606.7 728.6 888.6
Peter P. Sutedja(62-21) 350 9888 ext. [email protected]
Last Recommendation
Rec. Target Price
22-Dec-10 BUY Rp 2,95008-Dec10 BUY Rp 2,95020-Sep-10 BUY Rp 2,45031-Aug-10 BUY Rp 2,65025-Feb-10 BUY Rp 2,650
ADRO relative price to JCI Index
1,500
1,750
2,000
2,250
2,500
12/1
8/09
2/1/
10
3/10
/10
4/19
/10
5/26
/10
7/2/
10
8/9/
10
9/22
/10
10/2
8/10
12/6
/10
-20
-10
0
10
20
ADRO (LHS) Relative to JCI Index (RHS)%Rp
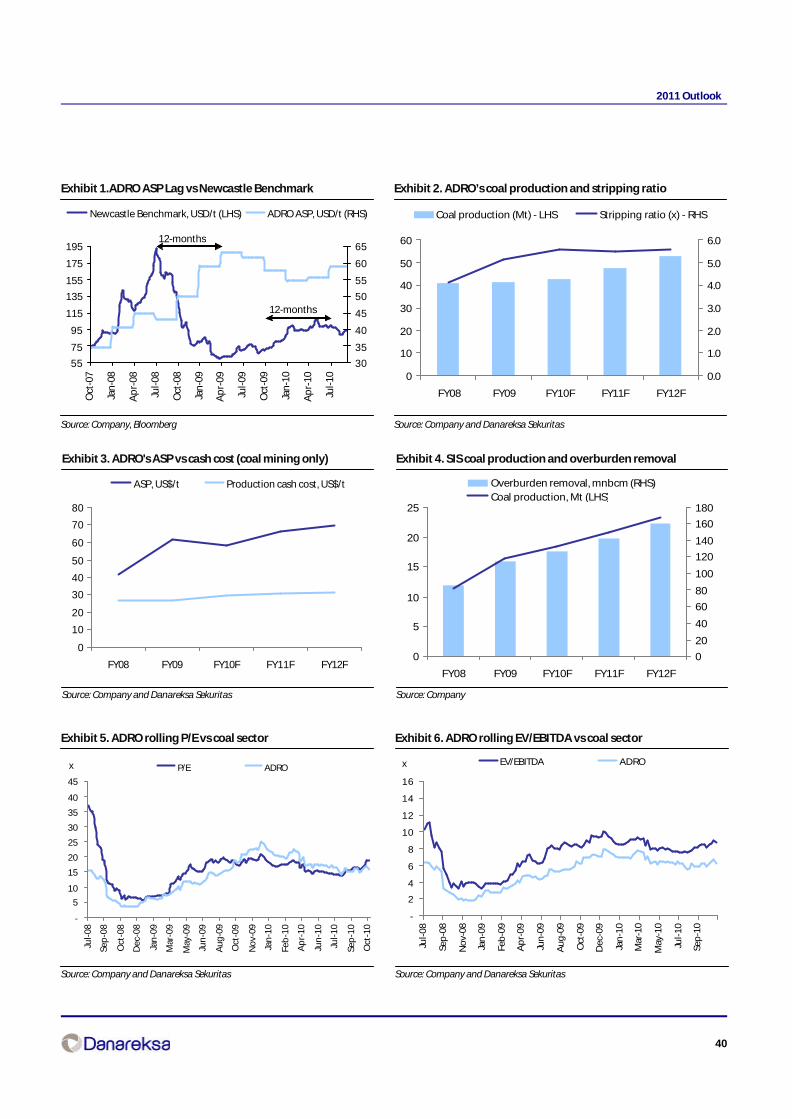
40
2011 Outlook
Exhibit 1.ADRO ASP Lag vs Newcastle Benchmark
Source: Company, Bloomberg
Exhibit 2. ADRO’s coal production and stripping ratio
Source: Company and Danareksa Sekuritas
Exhibit 3. ADRO's ASP vs cash cost (coal mining only)
Source: Company and Danareksa Sekuritas
Exhibit 4. SIS coal production and overburden removal
Source: Company
55
75
95
115
135
155
175
195
Oct
-07
Jan
-08
Ap
r-08
Jul-
08
Oct
-08
Jan
-09
Ap
r-09
Jul-
09
Oct
-09
Jan
-10
Ap
r-10
Jul-
10
30
35
40
45
50
55
60
65
Newcastle Benchmark, USD/t (LHS) ADRO ASP, USD/t (RHS)
12-months
12-months
Exhibit 5. ADRO rolling P/E vs coal sector
Source: Company and Danareksa Sekuritas
Exhibit 6. ADRO rolling EV/EBITDA vs coal sector
Source: Company and Danareksa Sekuritas
-
5
10
15
20
25
30
35
40
45
Jul-
08
Sep
-08
Oct
-08
Dec
-08
Jan
-09
Mar
-09
May
-09
Jun
-09
Au
g-0
9
Oct
-09
No
v-09
Jan
-10
Feb
-10
Ap
r-10
Jun
-10
Jul-
10
Sep
-10
Oct
-10
P/E ADROx
-
2
4
6
8
10
12
14
16
Jul-
08
Sep
-08
No
v-08
Jan
-09
Feb
-09
Ap
r-09
Jun
-09
Au
g-0
9
Oct
-09
Dec
-09
Jan
-10
Mar
-10
May
-10
Jul-
10
Sep
-10
EV/EBITDA ADROx
0
10
20
30
40
50
60
FY08 FY09 FY10F FY11F FY12F
0.0
1.0
2.0
3.0
4.0
5.0
6.0
Coal production (Mt) - LHS Stripping ratio (x) - RHS
0
10
20
30
40
50
60
70
80
FY08 FY09 FY10F FY11F FY12F
ASP, US$/t Production cash cost, US$/t
0
5
10
15
20
25
FY08 FY09 FY10F FY11F FY12F
0
20
40
60
80
100
120
140
160
180
Overburden removal, mnbcm (RHS)Coal production, Mt (LHS)

41
2011 Outlook
Exhibit 6. Profit and Loss (Rp bn)
2008 2009 2010F 2011F 2012F
Sales 18,093 26,938 24,487 31,568 39,207COGS (13,149) (15,900) (16,873) (19,957) (24,126)Gross profit 4,943 11,038 7,615 11,611 15,081Operating expenses (731) (946) (725) (841) (964)Operating profit 4,212 10,092 6,890 10,770 14,117EBITDA 4,455 11,017 8,452 12,588 16,214Other income/expenses (1,287) (1,350) (1,895) (1,434) (1,854)Pre-tax profit 2,925 8,742 4,995 9,336 12,263Taxes (1,602) (4,119) (2,503) (4,388) (5,764)Profit from ordinary activities 1,323 4,623 2,492 4,948 6,499Minority interest & extraordinary items (436) (92) 0 0 0Net profit 887 4,531 2,492 4,948 6,499Core profit 1,548 4,572 2,719 5,041 6,845
Source: Company and Danareksa Sekuritas
Exhibit 7. Balance Sheet (Rp bn)
2008 2009 2010F 2011F 2012F
Cash 2,416 11,275 9,402 10,815 13,766Receivables 2,350 2,882 2,272 2,929 3,638Inventories 305 250 295 348 421Others 2,786 1,429 1,429 1,429 1,429Total current assets 7,857 15,837 13,398 15,522 19,254Property & plant - net 5,924 7,416 8,243 9,647 10,363Other noncurrent assets 19,939 19,213 21,336 20,343 19,351
Account payable 2,641 2,168 2,552 3,018 3,649Short term debt 876 188 187 190 201Others 3,204 5,640 5,451 6,395 4,262Total curr. liabs 6,722 7,996 8,190 9,603 8,112Long term debt 9,010 13,476 11,831 9,056 8,884Other long-term 3,961 3,482 3,482 3,482 3,482
Minority Interest 18 67 67 67 67Share capital 3,199 3,199 3,199 3,199 3,199Excess paid in 10,733 10,733 10,733 10,733 10,733Retained earnings & others 78 3,514 5,476 9,373 14,492Total equity 14,009 17,445 19,407 23,305 28,424
Source: Company and Danareksa Sekuritas
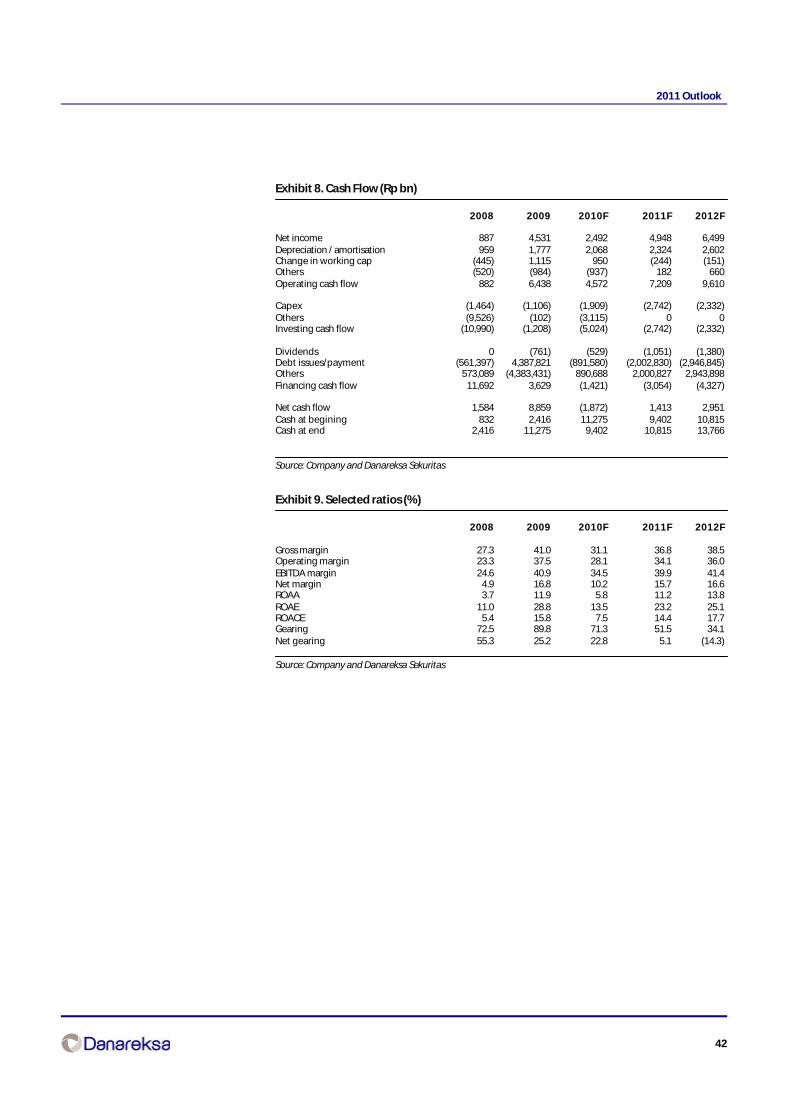
42
2011 Outlook
Exhibit 8. Cash Flow (Rp bn)
2008 2009 2010F 2011F 2012F
Net income 887 4,531 2,492 4,948 6,499Depreciation / amortisation 959 1,777 2,068 2,324 2,602Change in working cap (445) 1,115 950 (244) (151)Others (520) (984) (937) 182 660Operating cash flow 882 6,438 4,572 7,209 9,610
Capex (1,464) (1,106) (1,909) (2,742) (2,332)Others (9,526) (102) (3,115) 0 0Investing cash flow (10,990) (1,208) (5,024) (2,742) (2,332)
Dividends 0 (761) (529) (1,051) (1,380)Debt issues/payment (561,397) 4,387,821 (891,580) (2,002,830) (2,946,845)Others 573,089 (4,383,431) 890,688 2,000,827 2,943,898Financing cash flow 11,692 3,629 (1,421) (3,054) (4,327)
Net cash flow 1,584 8,859 (1,872) 1,413 2,951Cash at begining 832 2,416 11,275 9,402 10,815Cash at end 2,416 11,275 9,402 10,815 13,766
Source: Company and Danareksa Sekuritas
Exhibit 9. Selected ratios (%)
2008 2009 2010F 2011F 2012F
Gross margin 27.3 41.0 31.1 36.8 38.5Operating margin 23.3 37.5 28.1 34.1 36.0EBITDA margin 24.6 40.9 34.5 39.9 41.4Net margin 4.9 16.8 10.2 15.7 16.6ROAA 3.7 11.9 5.8 11.2 13.8ROAE 11.0 28.8 13.5 23.2 25.1ROACE 5.4 15.8 7.5 14.4 17.7Gearing 72.5 89.8 71.3 51.5 34.1Net gearing 55.3 25.2 22.8 5.1 (14.3)
Source: Company and Danareksa Sekuritas

43
2011 Outlook
AKR CorporindoRich valuation
SELL, TP of Rp 1,340We maintain our SELL recommendation on AKRA with a Target Price of Rp 1,340, implying 12.7.x-10.6x 11F-12F PER. We use a lower equity risk premium of 5.5%, a figure likely to be sustainableover the medium term, we believe. Note that the yield on Indonesian 10-year bonds has droppedto an historic low of 7.4% while the spread on US 10-year Treasury bonds has declined to an historiclow of 1.2%. 2010 has been a tough year for the company, as the skyrocketing cassava pricesqueezed the company’s manufacturing business gross margin. However, in 2011, margins shouldrecover and the petroleum sales volume should grow. Nonetheless, the shares look expensive.The stock currently trades at 11F PER of 15.9x, or higher than the market’s 11F PER of 14.3x.
Petroleum sales volume should continue to grow in 2011We forecast the company to sell around 1.69 mn kl of petroleum in 2011, or some 30% higher thanour estimate for the company’s 2010 petroleum sales volume of 1.3 mn kl. From around the 390,000kl YoY increase in the petroleum sales volume in 2011, around 100,000 kl should be of subsidizedfuel oil (in September 2010 the company was reappointed to sell the subsidised fuel oil in 2011).The rest should come largely from its market share increase, primarily in Kalimantan. To serve theabundant fuel oil demand in Kalimantan (a significant part of it coming from the coalminers), thecompany is increasing the Stagen tank terminal’s capacity by 30,000 kl adding to the existingcapacity of 50,000kl. Assuming a 12x turnover rate, the additional capacity should allow anadditional 360,000kl fuel oil sales volume in Kalimantan.
Divestment of Sorini is in the pipelineThe company has entered into an agreement with Cargill to sell its entire stake in Sorini (SOBI),representing 68.82% ownership, at a price of Rp 3,500 per share. The transaction is, however, stillsubject to approval of the shareholders at the shareholders’ general meeting in January 2011. Ifthe transaction is approved, the calculation of our Target Price is subject to the usage of theproceeds from the divestments. However, our scenario analysis shows no significant change toour DCF based TP if we strip out SOBI’s contribution to the Free Cash Flow to the Firm (FCFF)calculation and add the proceeds from the divestment to the ending balance of cash in 2011.
Key risk: fuel and basic chemical price fluctuationsWe expect trading and distribution to contribute around 36% of the gross profits in 2011. Eventhough the alpha margin in fuel distribution is relatively stable and a large part of the basicchemical business is commission based, the fluctuations in the fuel and basic chemical price shouldstill affect the gross profits.
YE Dec (Rp bn) 2008 2009 2010F 2011F 2012F
Sales, Rp bn 9,473 8,960 11,872 15,172 17,434EBITDA, Rp bn 787 637 820 1,061 1,202Net profit, Rp bn 211 275 310 399 479Core profit, Rp bn 305 247 306 399 479Core EPS Growth, % 52.7 (19.1) 24.1 30.1 20.0Core PER, x 30.1 23.1 20.5 15.9 13.2EV/EBITDA, x 10.6 13.7 10.6 7.9 6.8Dividend Yield, % 1.0 1.4 1.4 1.6 2.0BVPS, Rp 516 587 807 921 1,057
Indra P Yudison(62-21) 350 9888 ext. [email protected]
SELLBloomberg Code AKRA IJPrice, Rp 1,670Mkt Cap Rp bn 6,334Target Price, Rp 1,340
Last Recommendation
Rec. Target Price
22-Dec-10 SELL Rp 1,34030-Aug-10 SELL Rp 1,16025-Feb-10 BUY Rp 1,580
AKRA relative price to JCI Index
800
1,100
1,400
1,700
2,000
12/1
8/09
2/1/
10
3/10
/10
4/19
/10
5/26
/10
7/2/
10
8/9/
10
9/22
/10
10/2
8/10
12/6
/10
-40
-30
-20
-10
0
10
AKRA (LHS) Relative to JCI Index (RHS)%Rp
Cut off data December 16,2010

44
2011 Outlook
Exhibit 1. Revenues breakdown based on business segment
Source: Company and Danareksa estimates
Exhibit 2. Gross profit breakdown based on business segment
Source: Company and Danareksa estimates
Exhibit 3. ROAE
Source: Company, Danareksa estimates
Exhibit 4. Forward 12-months EV/EBITDA
Source: Company, Danareksa estimates and Bloomberg
Exhibit 5. 12-mth forward PER
Source: Company, Danareksa estimates and Bloomberg
Exhibit 6. 12-mth forward PBV
Source: Company, Danareksa estimates and Bloomberg
-
5.0
10.0
15.0
20.0
25.0
1/1/
05
8/1/
05
3/1/
06
10/1
/06
5/1/
07
12/1
/07
7/1/
08
2/1/
09
9/1/
09
4/1/
10
11/1
/10
Forward 12 months PER Average
-
0.5
1.0
1.5
2.0
2.5
3.0
3.5
1/1/
05
8/1/
05
3/1/
06
10/1
/06
5/1/
07
12/1
/07
7/1/
08
2/1/
09
9/1/
09
4/1/
10
11/1
/10
Forward 12 months PBV Average
-1.02.03.04.05.06.07.08.09.0
1/1/
05
8/1/
05
3/1/
06
10
/1/0
6
5/1/
07
12
/1/0
7
7/1/
08
2/1/
09
9/1/
09
4/1/
10
11
/1/1
0
Forward 12 months EV/EBITDA Average
-2,000
4,000
6,000
8,000
10,00012,000
14,000
16,000
18,000
20,000
2008 2009 2010F 2011F 2012F
logistic services, Rp bnManufacturing, Rp bnTrading and distribution, Rp bn
-
200
400
600
800
1,000
1,200
1,400
1,600
2008 2009 2010F 2011F 2012F
logistic services, Rp bnManufacturing, Rp bnTrading and distribution, Rp bn
12.0
13.0
14.0
15.0
16.0
17.0
2008 2009 2010F 2011F 2012F
%

45
2011 Outlook
Exhibit 7. Profit & loss (Rp bn)
2008 2009 2010F 2011F 2012F
Sales 9,473 8,960 11,872 15,172 17,434COGS (8,427) (8,006) (10,798) (13,824) (15,918)Gross Profit 1,046 954 1,075 1,348 1,516
Operating Expenses G&A 268 260 306 351 378 Selling expenses 158 153 184 209 227 Total Operating Expenses (426) (414) (490) (560) (605)
Operating Profit 620 540 585 788 912
EBITDA 787 637 820 1,061 1,202
Others Income (Expenses) Interest income 12 10 - - - Interest expenses (104) (120) (111) (130) (114) Forex gain (loss) (149) 50 4 - - Others 13 (12) - - - Total Others Income (Expenses) (229) (72) (107) (130) (114)
Pre-tax Income 392 468 479 658 797Tax Expenses (120) (128) (114) (165) (200)Minority Interest (61) (65) (55) (94) (119)Net Income 211 275 310 399 479Core Profit 305 247 306 399 479
Source: Company and Danareksa Sekuritas
Exhibit 8. Profit & loss (Rp bn)
2008 2009 2010F 2011F 2012F
Cash 286 274 302 438 478Trade receivables 902 1,299 1,352 1,744 2,228Other receivables 22 113 142 180 207Inventories 784 710 963 1,023 1,164Other current assets 192 299 311 314 321Total current assets 2,185 2,694 3,070 3,699 4,398
PPE 2,216 2,859 3,322 3,294 3,248Other non-current assets 474 506 506 506 506Total non-current assets 2,690 3,365 3,828 3,799 3,754
Total Assets 4,875 6,059 6,898 7,498 8,152
Trade payables 508 1,112 1,144 1,483 1,720Other payables 86 166 231 290 335ST bank loan 988 998 1,152 1,152 1,152ST portion of LT bank loan 266 201 255 147 133ST portion of obligation under financial lease 36 58 32 34 25Other current liabilities 308 277 308 365 404Total current liabilities 2,192 2,810 3,121 3,471 3,769
LT Portion of LT bank loan 611 841 561 415 281LT Portion of obligation under financial lease 56 112 85 50 26Post employment benefits 57 62 62 62 62Other non-current liabilities 3 8 8 8 8Total non-current liabilities 726 1,022 715 534 377
Minority interest 348 486 541 635 754
Capital stocks 313 314 379 382 386Additional paid in capital 5 18 510 544 584Share options 3 8 8 8 8Retained earnings 835 1,107 1,329 1,628 1,980Other equity 452 295 295 295 295Total equity 1,608 1,741 2,520 2,857 3,252
Total Liabilities and Equity 4,875 6,059 6,898 7,498 8,152
Source: Company and Danareksa Sekuritas

46
2011 Outlook
Exhibit 9. Cash flow(Rp bn)
2008 2009 2010F 2011F 2012F
CFONet Income 210.6 274.7 309.5 398.8 478.6Depreciation & Ammortization 166.7 97.3 235.3 272.1 290.3Forex gain/loss 149.4 (50.4) (4.0) - -Minority interest 60.9 65.2 55.3 94.2 118.7Working Capital Changes (313.0) 136.5 (219.4) (36.9) (337.3)Others (157.2) 148.0 - - -Net Cash from Operating Activities 117.4 671.2 376.7 728.2 550.3
CFIAcquisitions of PPE (843.4) (843.7) (698.39) (243.34) (244.51)Others (19.8) (192.7) - - -Net Cash Used in Investing Activities (863.2) (1,036.5) (698.39) (243.34) (244.51)
CFFAddition/Repayment to ST bank loans 283.6 59.6 155.36 - -Addition/Repayment to LT bank loans 396.0 263.2 (222.70) (255.04) (146.75)Capital Injection from Exercised option 3.9 11.2 25.67 37.58 43.20Capital Injection from Right Issue II 531.56 - -Payments of cash dividends (20.9) (18.4) (87.79) (98.93) (127.45)Payments of obligations under financial lease (24.9) (46.1) (52.37) (32.29) (34.22)Others 170.0 145.7 - - -Net Cash Provided by Financing Activities 807.7 415.1 349.7 (348.7) (265.2)
Net Increase in Cash and Cash Equivalents 61.8 49.8 28.02 136.15 40.56Effect of forex rate changes 43.5 131.5 - - -
Source: Company and Danareksa Sekuritas
Exhibit 10. Ratios
2008 2009 2010F 2011F 2012F
ProfitabilityGross Margin, % 11.0 10.6 9.1 8.9 8.7Operating Margin, % 6.5 6.0 4.9 5.2 5.2Opex to Sales, % 4.5 4.6 4.1 3.7 3.5Net Maring, % 2.2 3.1 2.6 2.6 2.7ROAE, % 14.6 16.4 14.5 14.8 15.7ROAA, % 5.0 5.0 4.8 5.5 6.1
LeverageDebt to Equity Ratio, % 100.0 99.2 68.1 51.5 40.4Net Gearing, % 103.9 111.1 70.8 47.6 35.0
GrowthSales, % 60.7 (5.4) 32.5 27.8 14.9Gross Profit, % 40.2 (8.8) 12.7 25.4 12.5Operating Profit, % 20.8 (2.8) 18.4 14.3 8.0Net Profit, % 9.9 30.4 12.7 28.8 20.0Core Profit, % 52.7 (19.1) 24.1 30.1 20.0
TurnoverReceivables, days 36 58 46 46 51Inventories, days 34 32 33 27 27Payables, days 26 58 46 47 47
ValuationPER, x 30.1 23.1 20.5 15.9 13.2Core PER, x 20.7 25.6 20.7 15.9 13.2PBV, x 3.2 2.8 2.1 1.8 1.6EV/EBITDA, x 10.6 13.7 10.6 7.9 6.8Dividend yield, % 1.0 1.4 1.4 1.6 2.0
Source: Company and Danareksa Sekuritas
47
2011 Outlook
Lydia Suwandi(62-21) 350 9888 ext. [email protected]
BUYBloomberg Code ASRI IJPrice, Rp 305Mkt Cap Rp bn 5,448Target Price, Rp 400
ASRI relative price to JCI Index
Last Recommendation
Rec. Target Price
22-Dec-10 BUY Rp 40003-Nov-10 BUY Rp 40004-Aug-10 BUY Rp 34008-Jul-10 BUY Rp 27526-May-10 BUY Rp 275
Alam Sutera RealtyThe success story continues
Maintain BUYOur BUY call is based on firm property demand in the Serpong area, leading to strong marketingsales. Indeed, 9M10’s marketing sales reached 87% of our FY10E estimate. Going forward, futureprojects in Pasar Kemis will continue the company’s success story in the Tangerang area, wheredemand is expected to be strong from people looking for more affordable housing on the fringesof Jakarta. We estimate marketing sales of Rp1.8trn next year, 13% higher on a yearly basis. OurTP of Rp400, is based on a 30% discount to the company’s new NAV of Rp 576/share. Our TP implies18x PE11, reasonable we believe, since we expect ASRI to post brisk earnings growth of 88% CAGRfrom 2009-2012F.
Robust margins likely to persistWe estimate FY11-12F gross margins to stay firm at 52%, thanks to partial booking of its commercialprojects (‘Town Center”) which has widened the gross margin to 52.2% (note that gross marginson commercial projects are typically 10% higher than on residential developments). From thesecommercial projects alone, around 75% of the total sales value of Rp250bn will be booked thisyear, with the remaining expected to be fully booked next year. Sustaining gross margins ofbeyond 50% shall likely come from sales of commercial lots, shop-houses and residential lots. Notethat these high yielding properties account for 62% of the company’s current year pre-sales.
Another boost to marketing sales“Pasar Kemis” shall be the next sales driver. It will add around Rp200bn in marketing sales nextyear. Indeed, the company is planning to sell 20Ha each year with the land selling price startingat Rp 1mn/sqm. That yields around a 50% gross margin, given that the current acquisition costwas around Rp 100,000-200,000/sqm. Pre-sales are likely to start in 2H11, but given the current lowmortgage rate amid strong demand from people looking for more affordable housing, sales fromPasar Kemis are likely to remain robust. While we have yet to include revenues from these salesin our forecast, successful execution is expected given the robust demand.
Risks to watchThe risks to our call include 1) rising inflation and therefore an increase in the benchmark rate, 2)economic slowdown and declining purchasing power and 3) a cutback in lending by banks
100
150
200
250
300
350
12/1
8/09
2/1/
10
3/10
/10
4/19
/10
5/26
/10
7/2/
10
8/9/
10
9/22
/10
10/2
8/10
12/6
/10
-10
20
50
80
110
ASRI (LHS) Relative to JCI Index (RHS)%Rp
Year end to Dec, Rp bn 2008 2009 2010F 2011F 2012F
Revenues, Rp bn 435 404 798 1,312 1,827Gross profit, Rp bn 111 162 414 683 952EBITDA, Rp bn 57 112 342 542 831EBIT, Rp bn 55 111 317 495 739Net profit, Rp bn 59 94 242 395 625Core profit, Rp bn 45 89 242 395 626Core EPS, Rp 3 5 14 22 35Core EPS growth, % 130 90 172 63 58EV/EBITDA, x 42 51 15 9 5Dividend Yield, % 0.0 0.0 88.7 144.9 229.4BVPS, Rp 102 108 119 136 164
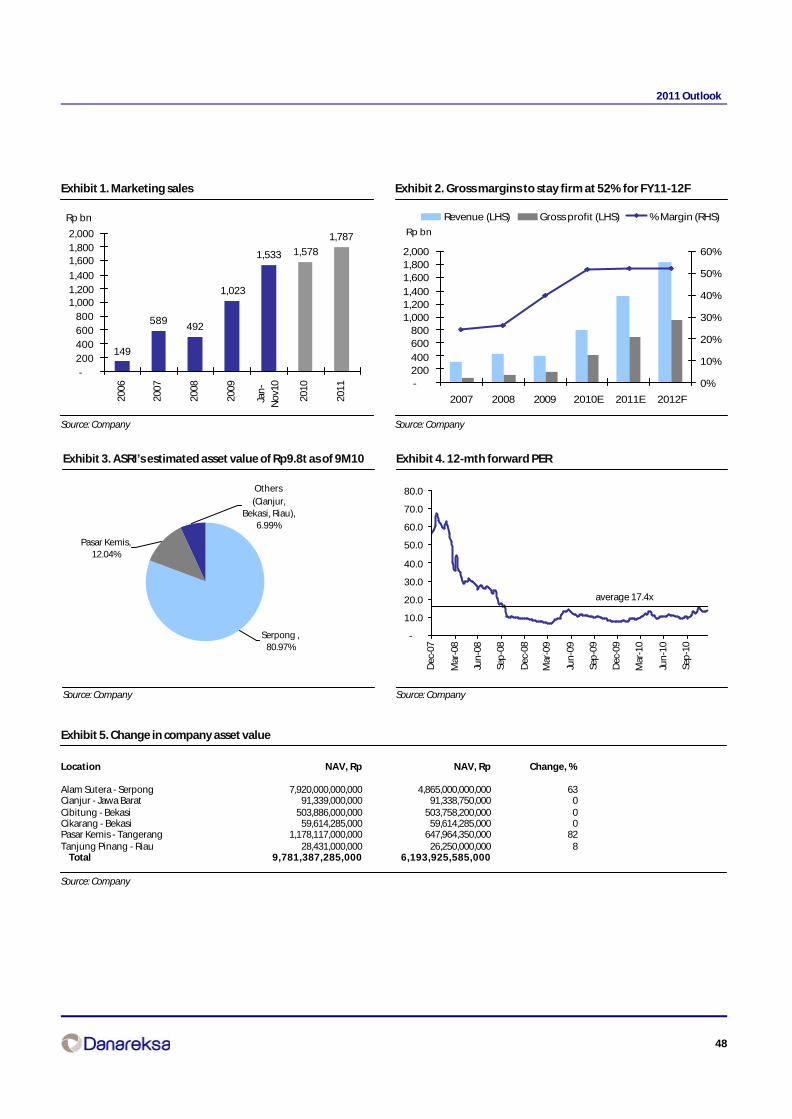
48
2011 Outlook
Exhibit 1. Marketing sales
Source: Company
Exhibit 2. Gross margins to stay firm at 52% for FY11-12F
Source: Company
Exhibit 3. ASRI’s estimated asset value of Rp9.8t as of 9M10
Source: Company
Exhibit 4. 12-mth forward PER
Source: Company
Exhibit 5. Change in company asset value
Location NAV, Rp NAV, Rp Change, %
Alam Sutera - Serpong 7,920,000,000,000 4,865,000,000,000 63Cianjur - Jawa Barat 91,339,000,000 91,338,750,000 0Cibitung - Bekasi 503,886,000,000 503,758,200,000 0Cikarang - Bekasi 59,614,285,000 59,614,285,000 0Pasar Kemis - Tangerang 1,178,117,000,000 647,964,350,000 82Tanjung Pinang - Riau 28,431,000,000 26,250,000,000 8 Total 9,781,387,285,000 6,193,925,585,000
Source: Company
149
589492
1,023
1,533 1,578
1,787
-
200
400
600
800
1,0001,200
1,400
1,6001,800
2,000
2006
2007
2008
2009
Jan
-
Nov
10
2010
2011
Rp bn
-200400
600800
1,0001,2001,400
1,6001,8002,000
2007 2008 2009 2010E 2011E 2012F
0%
10%
20%
30%
40%
50%
60%
Revenue (LHS) Gross profit (LHS) % Margin (RHS)
Rp bn
Serpong , 80.97%
Others
(Cianjur, Bekasi, Riau),
6.99%
Pasar Kemis, 12.04%
-
10.0
20.0
30.0
40.0
50.0
60.0
70.0
80.0
Dec
-07
Mar
-08
Jun
-08
Sep
-08
Dec
-08
Mar
-09
Jun
-09
Sep
-09
Dec
-09
Mar
-10
Jun
-10
Sep
-10
average 17.4x
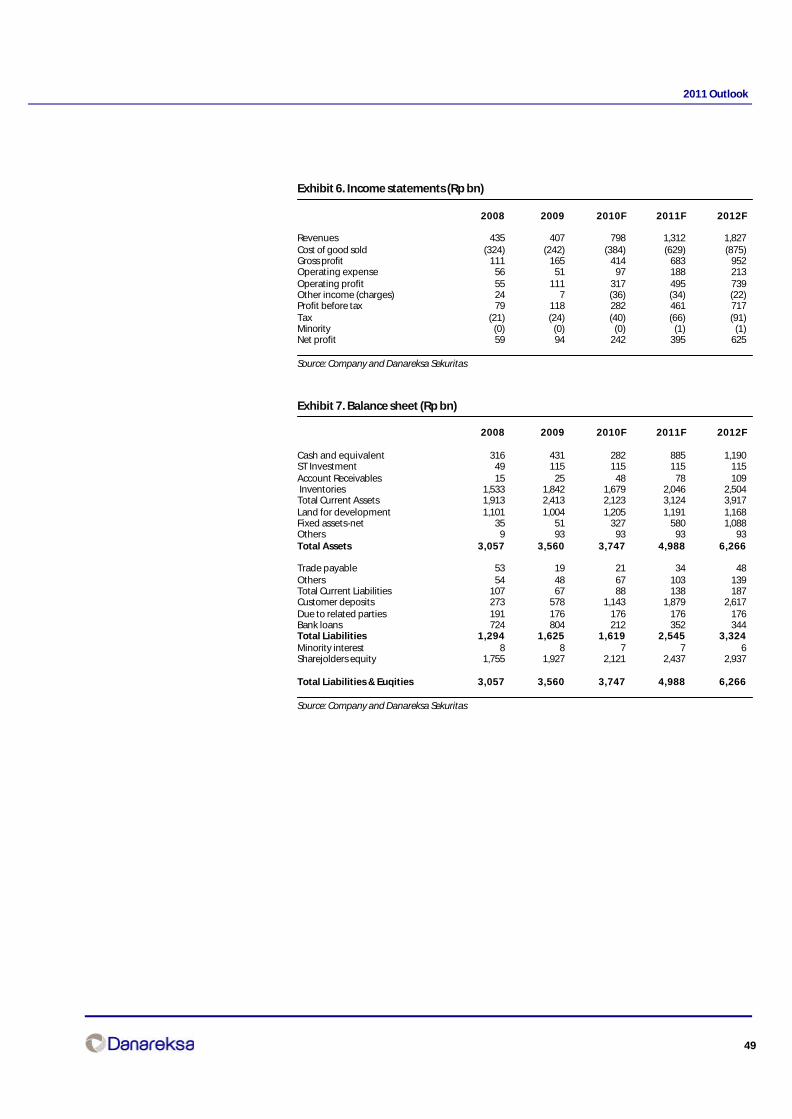
49
2011 Outlook
Exhibit 6. Income statements (Rp bn)
2008 2009 2010F 2011F 2012F
Revenues 435 407 798 1,312 1,827Cost of good sold (324) (242) (384) (629) (875)Gross profit 111 165 414 683 952Operating expense 56 51 97 188 213Operating profit 55 111 317 495 739Other income (charges) 24 7 (36) (34) (22)Profit before tax 79 118 282 461 717Tax (21) (24) (40) (66) (91)Minority (0) (0) (0) (1) (1)Net profit 59 94 242 395 625
Source: Company and Danareksa Sekuritas
Exhibit 7. Balance sheet (Rp bn)
2008 2009 2010F 2011F 2012F
Cash and equivalent 316 431 282 885 1,190ST Investment 49 115 115 115 115Account Receivables 15 25 48 78 109 Inventories 1,533 1,842 1,679 2,046 2,504Total Current Assets 1,913 2,413 2,123 3,124 3,917Land for development 1,101 1,004 1,205 1,191 1,168Fixed assets-net 35 51 327 580 1,088Others 9 93 93 93 93Total Assets 3,057 3,560 3,747 4,988 6,266
Trade payable 53 19 21 34 48Others 54 48 67 103 139Total Current Liabilities 107 67 88 138 187Customer deposits 273 578 1,143 1,879 2,617Due to related parties 191 176 176 176 176Bank loans 724 804 212 352 344Total Liabilities 1,294 1,625 1,619 2,545 3,324Minority interest 8 8 7 7 6Sharejolders equity 1,755 1,927 2,121 2,437 2,937
Total Liabilities & Euqities 3,057 3,560 3,747 4,988 6,266
Source: Company and Danareksa Sekuritas
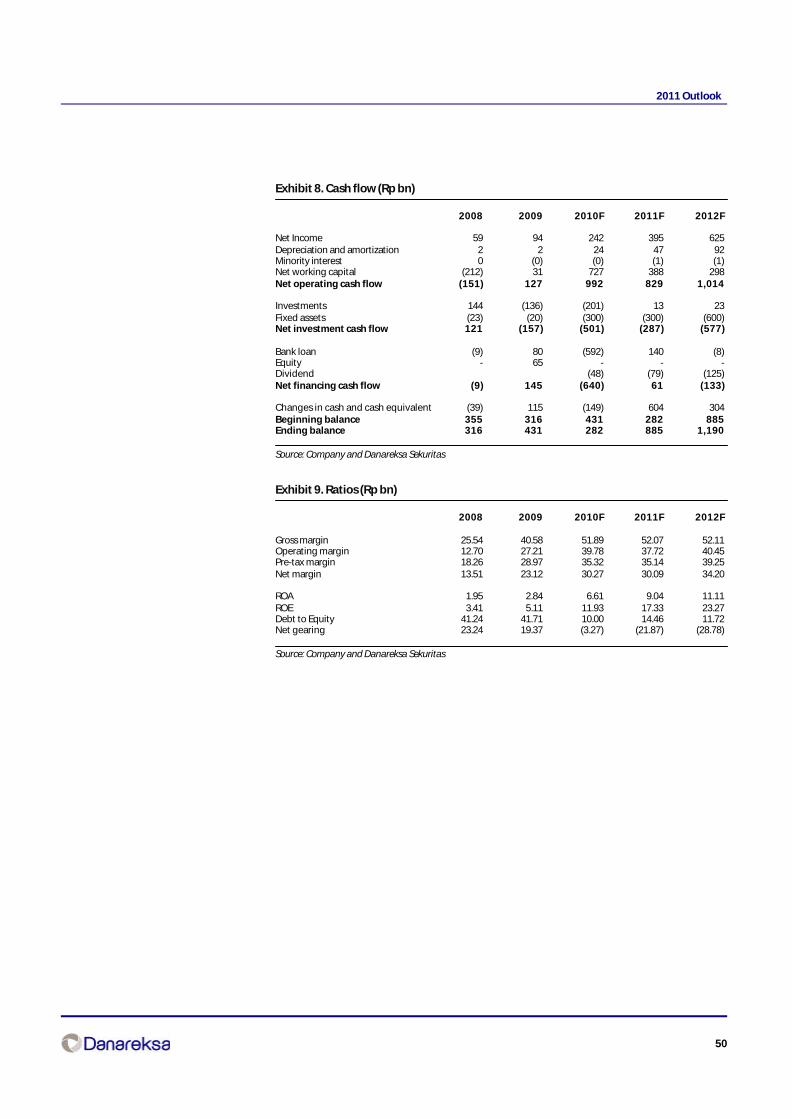
50
2011 Outlook
Exhibit 8. Cash flow (Rp bn)
2008 2009 2010F 2011F 2012F
Net Income 59 94 242 395 625Depreciation and amortization 2 2 24 47 92Minority interest 0 (0) (0) (1) (1)Net working capital (212) 31 727 388 298Net operating cash flow (151) 127 992 829 1,014
Investments 144 (136) (201) 13 23Fixed assets (23) (20) (300) (300) (600)Net investment cash flow 121 (157) (501) (287) (577)
Bank loan (9) 80 (592) 140 (8)Equity - 65 - - -Dividend (48) (79) (125)Net financing cash flow (9) 145 (640) 61 (133)
Changes in cash and cash equivalent (39) 115 (149) 604 304Beginning balance 355 316 431 282 885Ending balance 316 431 282 885 1,190
Source: Company and Danareksa Sekuritas
Exhibit 9. Ratios (Rp bn)
2008 2009 2010F 2011F 2012F
Gross margin 25.54 40.58 51.89 52.07 52.11Operating margin 12.70 27.21 39.78 37.72 40.45Pre-tax margin 18.26 28.97 35.32 35.14 39.25Net margin 13.51 23.12 30.27 30.09 34.20
ROA 1.95 2.84 6.61 9.04 11.11ROE 3.41 5.11 11.93 17.33 23.27Debt to Equity 41.24 41.71 10.00 14.46 11.72Net gearing 23.24 19.37 (3.27) (21.87) (28.78)
Source: Company and Danareksa Sekuritas
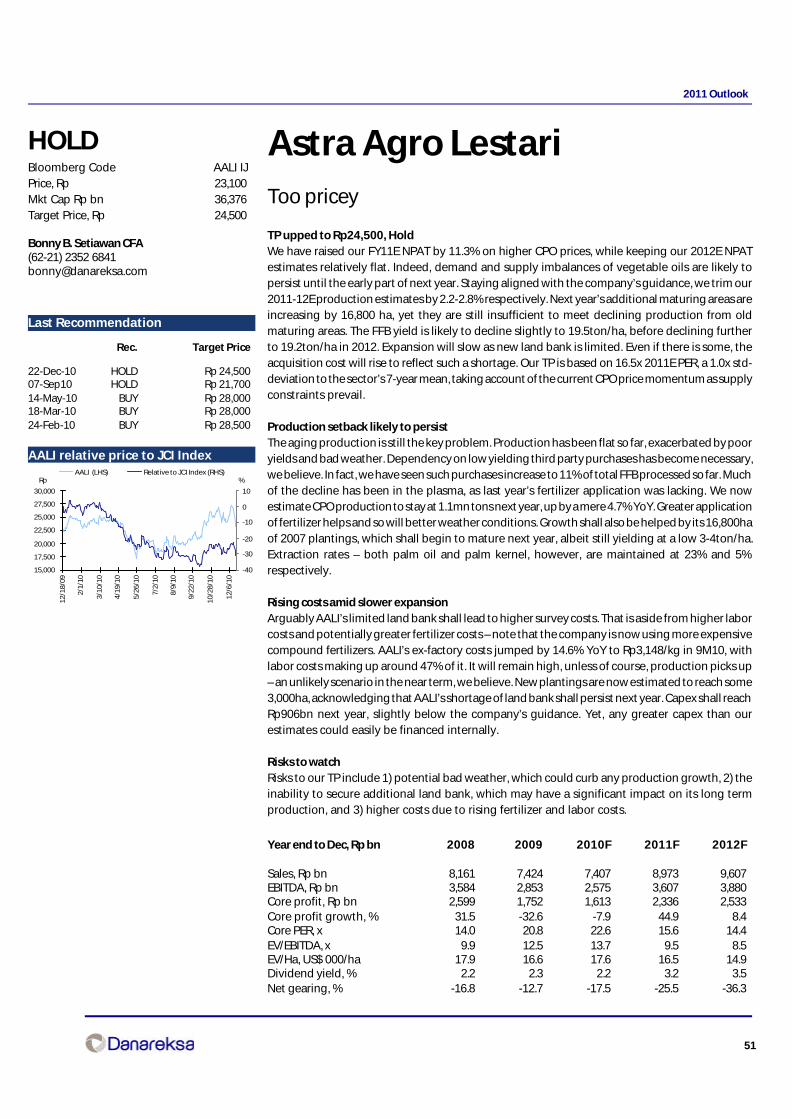
51
2011 Outlook
Astra Agro LestariToo pricey
TP upped to Rp24,500, HoldWe have raised our FY11E NPAT by 11.3% on higher CPO prices, while keeping our 2012E NPATestimates relatively flat. Indeed, demand and supply imbalances of vegetable oils are likely topersist until the early part of next year. Staying aligned with the company’s guidance, we trim our2011-12E production estimates by 2.2-2.8% respectively. Next year’s additional maturing areas areincreasing by 16,800 ha, yet they are still insufficient to meet declining production from oldmaturing areas. The FFB yield is likely to decline slightly to 19.5ton/ha, before declining furtherto 19.2ton/ha in 2012. Expansion will slow as new land bank is limited. Even if there is some, theacquisition cost will rise to reflect such a shortage. Our TP is based on 16.5x 2011E PER, a 1.0x std-deviation to the sector’s 7-year mean, taking account of the current CPO price momentum as supplyconstraints prevail.
Production setback likely to persistThe aging production is still the key problem. Production has been flat so far, exacerbated by pooryields and bad weather. Dependency on low yielding third party purchases has become necessary,we believe. In fact, we have seen such purchases increase to 11% of total FFB processed so far. Muchof the decline has been in the plasma, as last year’s fertilizer application was lacking. We nowestimate CPO production to stay at 1.1mn tons next year, up by a mere 4.7% YoY. Greater applicationof fertilizer helps and so will better weather conditions. Growth shall also be helped by its 16,800haof 2007 plantings, which shall begin to mature next year, albeit still yielding at a low 3-4ton/ha.Extraction rates – both palm oil and palm kernel, however, are maintained at 23% and 5%respectively.
Rising costs amid slower expansionArguably AALI’s limited land bank shall lead to higher survey costs. That is aside from higher laborcosts and potentially greater fertilizer costs – note that the company is now using more expensivecompound fertilizers. AALI’s ex-factory costs jumped by 14.6% YoY to Rp3,148/kg in 9M10, withlabor costs making up around 47% of it. It will remain high, unless of course, production picks up– an unlikely scenario in the near term, we believe. New plantings are now estimated to reach some3,000ha, acknowledging that AALI’s shortage of land bank shall persist next year. Capex shall reachRp906bn next year, slightly below the company’s guidance. Yet, any greater capex than ourestimates could easily be financed internally.
Risks to watchRisks to our TP include 1) potential bad weather, which could curb any production growth, 2) theinability to secure additional land bank, which may have a significant impact on its long termproduction, and 3) higher costs due to rising fertilizer and labor costs.
Year end to Dec, Rp bn 2008 2009 2010F 2011F 2012F
Sales, Rp bn 8,161 7,424 7,407 8,973 9,607EBITDA, Rp bn 3,584 2,853 2,575 3,607 3,880Core profit, Rp bn 2,599 1,752 1,613 2,336 2,533Core profit growth, % 31.5 -32.6 -7.9 44.9 8.4Core PER, x 14.0 20.8 22.6 15.6 14.4EV/EBITDA, x 9.9 12.5 13.7 9.5 8.5EV/Ha, US$ 000/ha 17.9 16.6 17.6 16.5 14.9Dividend yield, % 2.2 2.3 2.2 3.2 3.5Net gearing, % -16.8 -12.7 -17.5 -25.5 -36.3
Bonny B. Setiawan CFA(62-21) 2352 [email protected]
HOLDBloomberg Code AALI IJPrice, Rp 23,100Mkt Cap Rp bn 36,376Target Price, Rp 24,500
AALI relative price to JCI Index
Last Recommendation
Rec. Target Price
22-Dec-10 HOLD Rp 24,50007-Sep10 HOLD Rp 21,70014-May-10 BUY Rp 28,00018-Mar-10 BUY Rp 28,00024-Feb-10 BUY Rp 28,500
15,000
17,500
20,000
22,500
25,000
27,500
30,000
12/1
8/09
2/1/
10
3/10
/10
4/19
/10
5/26
/10
7/2/
10
8/9/
10
9/22
/10
10/2
8/10
12/6
/10
-40
-30
-20
-10
0
10
AALI (LHS) Relative to JCI Index (RHS)%Rp
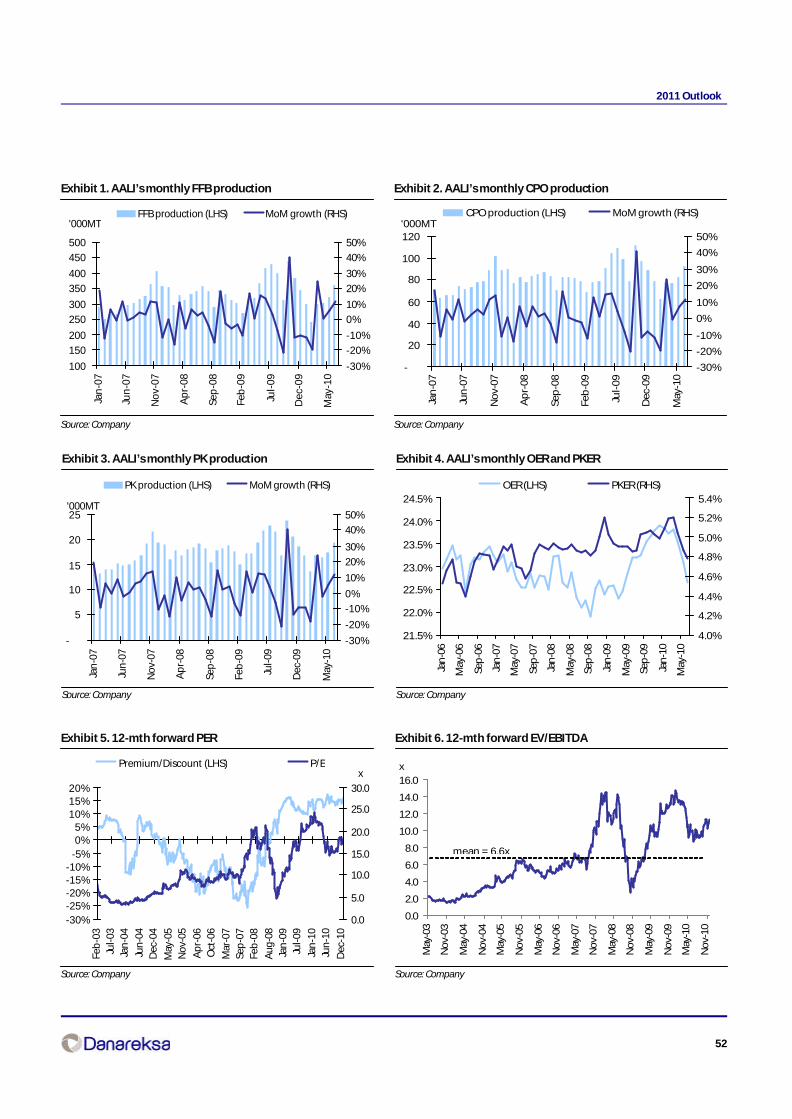
52
2011 Outlook
Exhibit 1. AALI’s monthly FFB production
Source: Company
Exhibit 2. AALI’s monthly CPO production
Source: Company
Exhibit 3. AALI’s monthly PK production
Source: Company
Exhibit 4. AALI’s monthly OER and PKER
Source: Company
Exhibit 5. 12-mth forward PER
Source: Company
Exhibit 6. 12-mth forward EV/EBITDA
Source: Company
100
150
200
250
300
350
400
450
500
Jan
-07
Jun
-07
No
v-07
Ap
r-08
Sep
-08
Feb
-09
Jul-
09
Dec
-09
May
-10
-30%
-20%
-10%
0%
10%
20%
30%
40%
50%
FFB production (LHS) MoM growth (RHS)'000MT
-
20
40
60
80
100
120
Jan
-07
Jun
-07
No
v-07
Ap
r-08
Sep
-08
Feb
-09
Jul-
09
Dec
-09
May
-10
-30%
-20%
-10%
0%
10%
20%
30%
40%
50%
CPO production (LHS) MoM growth (RHS)'000MT
-
5
10
15
20
25
Jan
-07
Jun
-07
Nov
-07
Ap
r-08
Sep
-08
Feb
-09
Jul-0
9
Dec
-09
May
-10
-30%
-20%
-10%
0%
10%
20%
30%
40%
50%
PK production (LHS) MoM growth (RHS)
'000MT
21.5%
22.0%
22.5%
23.0%
23.5%
24.0%
24.5%
Jan
-06
May
-06
Sep
-06
Jan
-07
May
-07
Sep
-07
Jan
-08
May
-08
Sep
-08
Jan
-09
May
-09
Sep
-09
Jan
-10
May
-10
4.0%
4.2%
4.4%
4.6%
4.8%
5.0%
5.2%
5.4%OER (LHS) PKER (RHS)
-30%-25%-20%-15%-10%
-5%0%5%
10%15%20%
Feb
-03
Jul-0
3Ja
n-0
4
Jun
-04
Dec
-04
May
-05
Nov
-05
Ap
r-06
Oct
-06
Mar
-07
Sep
-07
Feb
-08
Aug
-08
Jan
-09
Jul-0
9
Jan
-10
Jun
-10
Dec
-10
0.0
5.0
10.0
15.0
20.0
25.0
30.0
Premium/Discount (LHS) P/Ex
0.0
2.0
4.0
6.0
8.0
10.0
12.0
14.0
16.0
May
-03
No
v-03
May
-04
No
v-04
May
-05
No
v-05
May
-06
No
v-06
May
-07
No
v-07
May
-08
No
v-08
May
-09
No
v-09
May
-10
No
v-10
x
mean = 6.6x
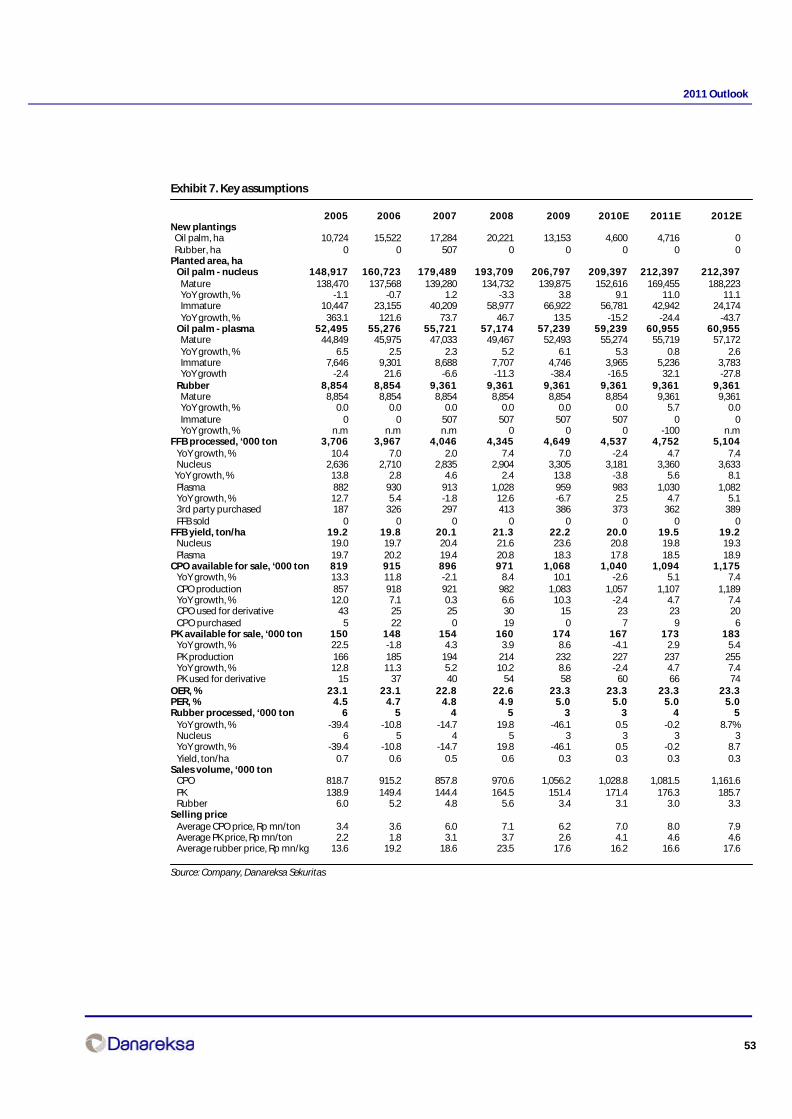
53
2011 Outlook
Exhibit 7. Key assumptions
2005 2006 2007 2008 2009 2010E 2011E 2012ENew plantings Oil palm, ha 10,724 15,522 17,284 20,221 13,153 4,600 4,716 0 Rubber, ha 0 0 507 0 0 0 0 0Planted area, ha Oil palm - nucleus 148,917 160,723 179,489 193,709 206,797 209,397 212,397 212,397 Mature 138,470 137,568 139,280 134,732 139,875 152,616 169,455 188,223 YoY growth, % -1.1 -0.7 1.2 -3.3 3.8 9.1 11.0 11.1 Immature 10,447 23,155 40,209 58,977 66,922 56,781 42,942 24,174 YoY growth, % 363.1 121.6 73.7 46.7 13.5 -15.2 -24.4 -43.7 Oil palm - plasma 52,495 55,276 55,721 57,174 57,239 59,239 60,955 60,955 Mature 44,849 45,975 47,033 49,467 52,493 55,274 55,719 57,172 YoY growth, % 6.5 2.5 2.3 5.2 6.1 5.3 0.8 2.6 Immature 7,646 9,301 8,688 7,707 4,746 3,965 5,236 3,783 YoY growth -2.4 21.6 -6.6 -11.3 -38.4 -16.5 32.1 -27.8 Rubber 8,854 8,854 9,361 9,361 9,361 9,361 9,361 9,361 Mature 8,854 8,854 8,854 8,854 8,854 8,854 9,361 9,361 YoY growth, % 0.0 0.0 0.0 0.0 0.0 0.0 5.7 0.0 Immature 0 0 507 507 507 507 0 0 YoY growth, % n.m n.m n.m 0 0 0 -100 n.mFFB processed, ‘000 ton 3,706 3,967 4,046 4,345 4,649 4,537 4,752 5,104 YoY growth, % 10.4 7.0 2.0 7.4 7.0 -2.4 4.7 7.4 Nucleus 2,636 2,710 2,835 2,904 3,305 3,181 3,360 3,633 YoY growth, % 13.8 2.8 4.6 2.4 13.8 -3.8 5.6 8.1 Plasma 882 930 913 1,028 959 983 1,030 1,082 YoY growth, % 12.7 5.4 -1.8 12.6 -6.7 2.5 4.7 5.1 3rd party purchased 187 326 297 413 386 373 362 389 FFB sold 0 0 0 0 0 0 0 0FFB yield, ton/ha 19.2 19.8 20.1 21.3 22.2 20.0 19.5 19.2 Nucleus 19.0 19.7 20.4 21.6 23.6 20.8 19.8 19.3 Plasma 19.7 20.2 19.4 20.8 18.3 17.8 18.5 18.9CPO available for sale, ‘000 ton 819 915 896 971 1,068 1,040 1,094 1,175 YoY growth, % 13.3 11.8 -2.1 8.4 10.1 -2.6 5.1 7.4 CPO production 857 918 921 982 1,083 1,057 1,107 1,189 YoY growth, % 12.0 7.1 0.3 6.6 10.3 -2.4 4.7 7.4 CPO used for derivative 43 25 25 30 15 23 23 20 CPO purchased 5 22 0 19 0 7 9 6PK available for sale, ‘000 ton 150 148 154 160 174 167 173 183 YoY growth, % 22.5 -1.8 4.3 3.9 8.6 -4.1 2.9 5.4 PK production 166 185 194 214 232 227 237 255 YoY growth, % 12.8 11.3 5.2 10.2 8.6 -2.4 4.7 7.4 PK used for derivative 15 37 40 54 58 60 66 74OER, % 23.1 23.1 22.8 22.6 23.3 23.3 23.3 23.3PER, % 4.5 4.7 4.8 4.9 5.0 5.0 5.0 5.0Rubber processed, ‘000 ton 6 5 4 5 3 3 4 5 YoY growth, % -39.4 -10.8 -14.7 19.8 -46.1 0.5 -0.2 8.7% Nucleus 6 5 4 5 3 3 3 3 YoY growth, % -39.4 -10.8 -14.7 19.8 -46.1 0.5 -0.2 8.7 Yield, ton/ha 0.7 0.6 0.5 0.6 0.3 0.3 0.3 0.3Sales volume, ‘000 ton CPO 818.7 915.2 857.8 970.6 1,056.2 1,028.8 1,081.5 1,161.6 PK 138.9 149.4 144.4 164.5 151.4 171.4 176.3 185.7 Rubber 6.0 5.2 4.8 5.6 3.4 3.1 3.0 3.3Selling price Average CPO price, Rp mn/ton 3.4 3.6 6.0 7.1 6.2 7.0 8.0 7.9 Average PK price, Rp mn/ton 2.2 1.8 3.1 3.7 2.6 4.1 4.6 4.6 Average rubber price, Rp mn/kg 13.6 19.2 18.6 23.5 17.6 16.2 16.6 17.6
Source: Company, Danareksa Sekuritas

54
2011 Outlook
Exhibit 8. Projected profit and loss (Rp bn)
2005 2006 2007 2008 2009 2010E 2011E 2012E
Palm product 3,280 3,655 5,857 8,012 7,353 7,357 8,923 9,549 YoY growth -1.9 11.4 60.2% 36.8% -8.2% 0.1% 21.3% 7.0% Rubber product 90 103 89 132 59 49 51 58 YoY growth, % -24.7 14.3 -13.0 48.1 -55.2 -16.5 2.5 15.1 Others 1 0 15 0 12 0 0 0Net revenues 3,371 3,758 5,961 8,161 7,424 7,407 8,973 9,607YoY growth, % -2.9 11.5 58.6 36.9 -9.0 -0.2 21.2 7.1Cost of good sold 1,908 2,278 2,774 4,358 4,322 4,540 5,012 5,381% of sales 56.6 60.6 46.5 53.4 58.2 61.3 55.9 56.0Gross profit 1,463 1,480 3,187 3,803 3,102 2,867 3,961 4,226YoY growth, % -4.1 1.2 115.3 19.3 -18.4 -7.6 38.2 6.7% of sales 43.4 39.4 53.5 46.6 41.8 38.7 44.1 44.0EBITDA 1,372 1,373 3,100 3,584 2,853 2,575 3,607 3,880YoY growth, % -6.7 0.0 142.5 16.2 -22.7 -12.5 42.7 6.6% of sales 40.7 36.5 52.0 43.9 38.4 34.8 40.2 40.4Depreciation 173 175 194 207 243 290 346 405Operating profit 1,199 1,199 2,906 3,377 2,610 2,285 3,261 3,475YoY growth, % -6.7 0.0 142.5 16.2 -22.7 -12.5 42.7 6.6% of sales 35.6 31.9 48.8 41.4 35.2 30.9 36.3 36.2Forex 3 -9 2 78 -111 0 0 0Interest expenses -32 -25 -7 0 -31 -5 0 0Interest income 26 17 26 129 58 61 104 172Others -46 -27 -12 365 -26 -34 -5 -5Total other income (loss) -49 -44 8 572 -110 22 100 167Pretax profit 1,150 1,154 2,914 3,949 2,500 2,307 3,361 3,642Income tax -333 -340 -874 -1,234 -771 -646 -941 -1,020Net income 790 787 1,973 2,631 1,661 1,592 2,336 2,533YoY growth, % -1.3 -0.4 150.7 33.3 -36.9 -4.1 46.7 8.4% of sales 23.4 21.0 33.1 32.2 22.4 21.5 26.0 26.4Core income 819 804 1,977 2,599 1,752 1,613 2,336 2,533YoY growth, % 4.9 -1.8 145.8 31.5 -32.6 -7.9 44.9 8.4% of sales 24.3 21.4 33.2 31.8 23.6 21.8 26.0 26.4No of shares, mn 1,574 1,575 1,575 1,575 1,575 1,575 1,575 1,575EPS 502 500 1,253 1,671 1,055 1,011 1,484 1,609YoY growth, % -2.3 -0.4 150.7 33.3 -36.9 -4.1 46.7 8.4Core EPS 520 511 1,255 1,650 1,112 1,024 1,484 1,609YoY growth, % 3.8 -1.9 145.8 31.5 -32.6 -7.9 44.9 8.4DPS 325 325 815 505 530 508 745 808Dividend payout 64.8 65.0 65.0 47.6 50.2 50.2 50.2 50.2
Margins (%)Cost of good sold 56.6 60.6 46.5 53.4 58.2 61.3 55.9 56.0Gross profit 43.4 39.4 53.5 46.6 41.8 38.7 44.1 44.0Operating profit 35.6 31.9 48.8 41.4 35.2 30.9 36.3 36.2EBITDA 40.7 36.5 52.0 43.9 38.4 34.8 40.2 40.4Pretax profit 34.1 30.7 48.9 48.4 33.7 31.2 37.5 37.9Net profit 23.4 21.0 33.1 32.2 22.4 21.5 26.0 26.4Effective tax rate 29.0 29.5 30.0 31.2 30.8 28.0 28.0 28.0
Growth rates (YoY)Sales -2.9 11.5 58.6 36.9 -9.0 -0.2 21.2 7.1Gross profit -4.1 1.2 115.3 19.3 -18.4 -7.6 38.2 6.7Operating income -6.7 0.0 142.5 16.2 -22.7 -12.5 42.7 6.6Net income -1.3 -0.4 150.7 33.3 -36.9 -4.1 46.7 8.4EPS -2.3 -0.4 150.7 33.3 -36.9 -4.1 46.7 8.4
Source: Company, Danareksa Sekuritas

55
2011 Outlook
Exhibit 9. Projected balance sheet (Rp bn)
2005 2006 2007 2008 2009 2010E 2011E 2012ECurrent assetsCash and cash equivalent 313 195 1,013 868 789 1,228 2,088 3,432Short term investment 9 0 0 0 0 0 0 0Receivables 100 24 115 25 157 22 28 28Inventories 190 192 414 781 610 641 707 759Prepaid taxes and expenses 24 49 13 37 37 31 45 49Advances 51 33 93 264 122 130 145 156Total Current Assets 687 492 1,648 1,976 1,714 2,052 3,013 4,424Plantation - mature 791 733 675 601 729 1,009 1,578 2,213Plantation - immature 102 295 667 1,337 1,885 2,166 1,882 1,272PPE 1,295 1,545 1,756 2,002 2,445 2,552 2,770 2,773Goodwill - net 49 45 67 74 62 57 52 48Other assets 269 387 540 531 736 566 566 566Total Non Current Assets 2,505 3,005 3,705 4,544 5,857 6,350 6,849 6,872Total Assets 3,192 3,497 5,353 6,520 7,571 8,402 9,862 11,297
Short term loan 5 255 5 0 0 0 0 0Payables 122 106 170 301 249 261 288 308Accrued expenses 36 39 31 98 107 114 127 137Current maturities of LT debt 37 11 0 0 0 0 0 0Others 208 153 821 617 582 533 707 762Total Current Liabilities 408 564 1,028 1,016 939 909 1,123 1,207Long term debts - net of currentmaturities 19 0 0 0 0 0 0 0Others 62 94 123 167 206 206 206 206Total Non Current Liabilities 81 94 123 167 206 206 206 206Minority interest 81 91 142 180 200 269 352 442Capital stock 787 787 787 787 787 787 787 787Additional paid-in capital 83 83 83 83 83 83 83 83Retained earnings 1,752 1,878 3,190 4,285 5,356 6,148 7,310 8,571Total Stockholders’ Equity 2,623 2,749 4,061 5,156 6,226 7,019 8,181 9,442Total Liabilities and Equity 3,192 3,497 5,353 6,520 7,571 8,402 9,862 11,297
Selected ratiosInventory turn 11 12 9 7 6 7 7 7Inventory days 32 30 39 49 58 50 48 49Payable days 10 9 9 9 11 10 9 10Receivable days 8 6 4 3 4 4 1 1Cash cycle 30 27 35 43 51 44 40 40Prepaid expense days 1 2 1 1 1 1 1 1Accrued expense days 8 5 4 5 8 8 8 8Other payable days 1 1 1 1 1 1 1 1Account payable, % of inventory 64% 55% 41% 39% 41% 41% 41% 41%Working capital -2 -1 -388 92 -13 -85 -197 -215Working capital % of sales 0 0 -7 1 0 -1 -2 -2Total debt 61 266 5 0 0 0 0 0Net debt -262 71 -1,008 -868 -789 -1,228 -2,088 -3,432Debt/equity, % 2.3 9.7 0.1 0.0 0.0 0.0 0.0 0.0Net debt/equity, % -10.0 2.6 -24.8 -16.8 -12.7 -17.5 -25.5 -36.3Cash and ST per share 205 124 643 551 501 780 1,326 2,179Book value per share 1,666 1,745 2,579 3,274 3,954 4,457 5,195 5,996
Extended Dupont ROEOperating margin 35.6% 31.9% 48.8% 41.4% 35.2% 30.9% 36.3% 36.2%Interest burden 1.0 1.0 1.0 1.2 1.0 1.0 1.0 1.0Tax burden 0.7 0.7 0.7 0.7 0.7 0.7 0.7 0.7Total asset turnover 1.0 1.1 1.3 1.4 1.1 0.9 1.0 0.9Financial leverage 1.4 1.2 1.3 1.3 1.2 1.2 1.2 1.2ROE, % 33.7 29.3 58.0 57.1 29.2 24.0 30.7 28.7
Source: Company, Danareksa Sekuritas

56
2011 Outlook
Exhibit 10. Projected balance sheet (Rp bn)
2005 2006 2007 2008 2009 2010E 2011E 2012EOperating cash flowCash receipt from sales 3,369 3,771 6,071 8,155 7,412 7,542 8,970 9,606Cash payment to suppliers -2,006 -2,176 -2,842 -4,658 -4,053 -4,643 -5,293 -5,672Interest received 27 17 24 101 48 61 104 172Tax -513 -423 -516 -1,285 -1,035 -688 -841 -993Others -77 -160 -141 -226 -387 -17 0 0Net operating cash flow 800 1,029 2,596 2,087 1,985 2,255 2,940 3,112
Investing cash flowAdditional PPE and planting -569 -643 -796 -1,279 -1,284 -1,011 -906 -496Changes in ST investment -9 9 0 0 0 0 0 0Acquisition of subsidiaries -11 -6 -27 538 -10 0 0 0Others 0 0 0 0 0 0 0 0Net investing cash flow -590 -639 -823 -741 -1,293 -1,011 -906 -496
Financing cash flowChanges in LT debt -563 206 -261 -5 0 0 0 0Interest expenses -58 -23 -10 0 -27 -5 0 0Cash from issuance of shares 3 0 0 0 0 0 0 0Dividend payment -255 -678 -678 -1,581 -640 -800 -1,174 -1,273Others -1 0 -9 10 0 0 0 0Net financing cash flow -875 -495 -958 -1,577 -666 -805 -1,174 -1,273
Changes in cash and cash equivalent -665 -105 815 -231 25 440 860 1,344Effect of forex 8 -12 2 86 -104 0 0 0Cash from acq. Subs. 0 0 0 0 0 0 0 0Beginning balance 970 313 195 1,013 868 789 1,228 2,088Ending balance 313 195 1,013 868 789 1,228 2,088 3,432
Source: Company, Danareksa Sekuritas
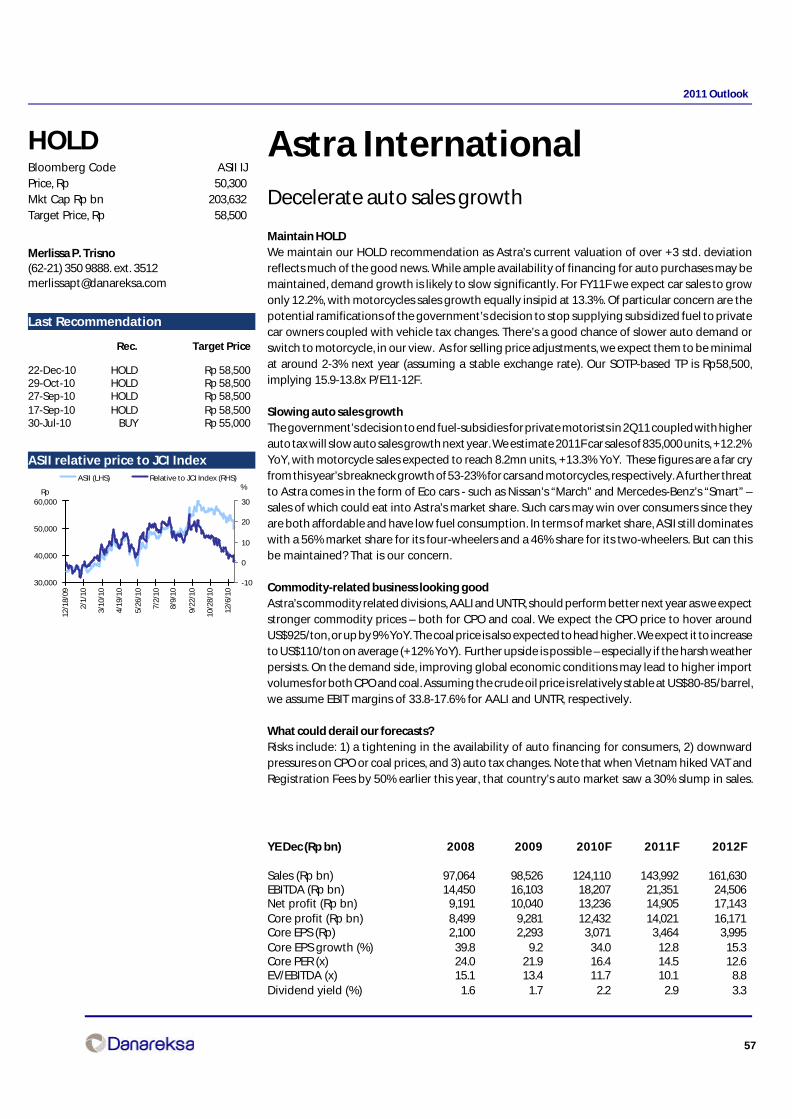
57
2011 Outlook
Astra InternationalDecelerate auto sales growth
Maintain HOLDWe maintain our HOLD recommendation as Astra’s current valuation of over +3 std. deviationreflects much of the good news. While ample availability of financing for auto purchases may bemaintained, demand growth is likely to slow significantly. For FY11F we expect car sales to growonly 12.2%, with motorcycles sales growth equally insipid at 13.3%. Of particular concern are thepotential ramifications of the government’s decision to stop supplying subsidized fuel to privatecar owners coupled with vehicle tax changes. There’s a good chance of slower auto demand orswitch to motorcycle, in our view. As for selling price adjustments, we expect them to be minimalat around 2-3% next year (assuming a stable exchange rate). Our SOTP-based TP is Rp58,500,implying 15.9-13.8x P/E11-12F.
Slowing auto sales growthThe government’s decision to end fuel-subsidies for private motorists in 2Q11 coupled with higherauto tax will slow auto sales growth next year. We estimate 2011F car sales of 835,000 units, +12.2%YoY, with motorcycle sales expected to reach 8.2mn units, +13.3% YoY. These figures are a far cryfrom this year’s breakneck growth of 53-23% for cars and motorcycles, respectively. A further threatto Astra comes in the form of Eco cars - such as Nissan’s “March” and Mercedes-Benz’s “Smart” –sales of which could eat into Astra’s market share. Such cars may win over consumers since theyare both affordable and have low fuel consumption. In terms of market share, ASII still dominateswith a 56% market share for its four-wheelers and a 46% share for its two-wheelers. But can thisbe maintained? That is our concern.
Commodity-related business looking goodAstra’s commodity related divisions, AALI and UNTR, should perform better next year as we expectstronger commodity prices – both for CPO and coal. We expect the CPO price to hover aroundUS$925/ton, or up by 9% YoY. The coal price is also expected to head higher. We expect it to increaseto US$110/ton on average (+12% YoY). Further upside is possible – especially if the harsh weatherpersists. On the demand side, improving global economic conditions may lead to higher importvolumes for both CPO and coal. Assuming the crude oil price is relatively stable at US$80-85/barrel,we assume EBIT margins of 33.8-17.6% for AALI and UNTR, respectively.
What could derail our forecasts?Risks include: 1) a tightening in the availability of auto financing for consumers, 2) downwardpressures on CPO or coal prices, and 3) auto tax changes. Note that when Vietnam hiked VAT andRegistration Fees by 50% earlier this year, that country’s auto market saw a 30% slump in sales.
Merlissa P. Trisno(62-21) 350 9888. ext. [email protected]
HOLDBloomberg Code ASII IJPrice, Rp 50,300Mkt Cap Rp bn 203,632Target Price, Rp 58,500
Last Recommendation
Rec. Target Price
22-Dec-10 HOLD Rp 58,50029-Oct-10 HOLD Rp 58,50027-Sep-10 HOLD Rp 58,50017-Sep-10 HOLD Rp 58,50030-Jul-10 BUY Rp 55,000
ASII relative price to JCI Index
30,000
40,000
50,000
60,000
12/1
8/09
2/1/
10
3/10
/10
4/19
/10
5/26
/10
7/2/
10
8/9/
10
9/22
/10
10/2
8/10
12/6
/10
-10
0
10
20
30
ASII (LHS) Relative to JCI Index (RHS)%
Rp
YE Dec (Rp bn) 2008 2009 2010F 2011F 2012F
Sales (Rp bn) 97,064 98,526 124,110 143,992 161,630EBITDA (Rp bn) 14,450 16,103 18,207 21,351 24,506Net profit (Rp bn) 9,191 10,040 13,236 14,905 17,143Core profit (Rp bn) 8,499 9,281 12,432 14,021 16,171Core EPS (Rp) 2,100 2,293 3,071 3,464 3,995Core EPS growth (%) 39.8 9.2 34.0 12.8 15.3Core PER (x) 24.0 21.9 16.4 14.5 12.6EV/EBITDA (x) 15.1 13.4 11.7 10.1 8.8Dividend yield (%) 1.6 1.7 2.2 2.9 3.3
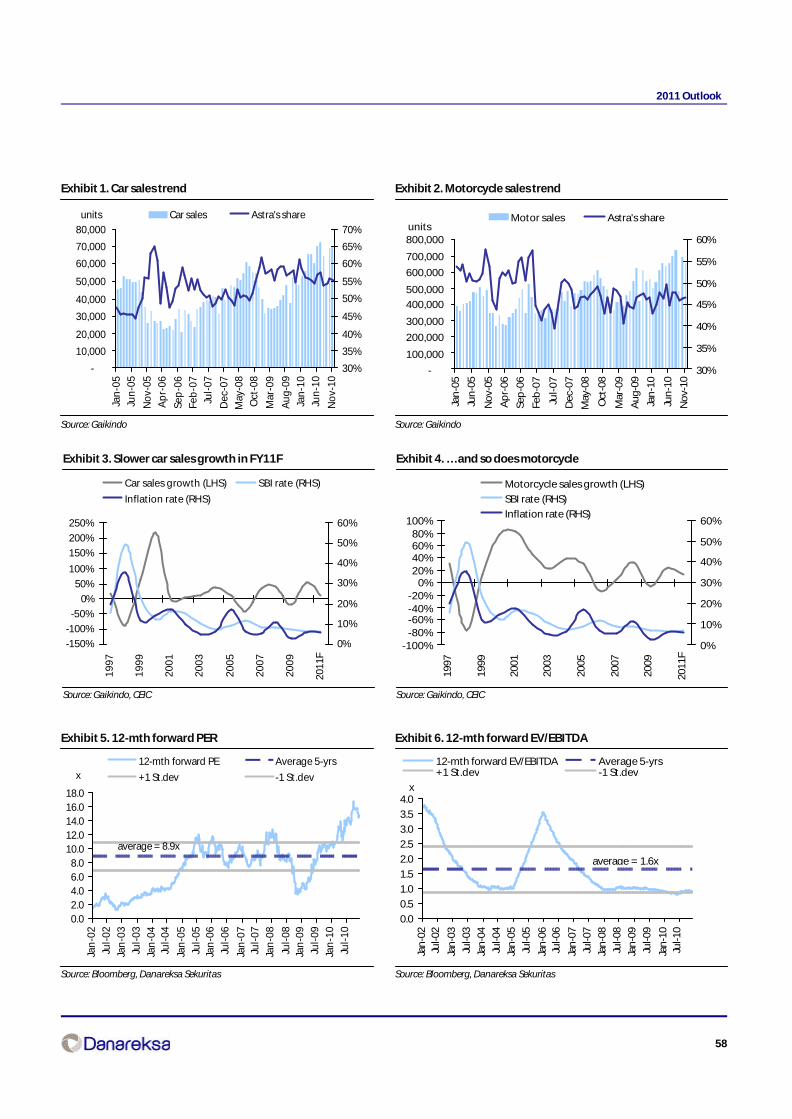
58
2011 Outlook
Exhibit 1. Car sales trend
Source: Gaikindo
Exhibit 2. Motorcycle sales trend
Source: Gaikindo
Exhibit 3. Slower car sales growth in FY11F
Source: Gaikindo, CEIC
Exhibit 4. …and so does motorcycle
Source: Gaikindo, CEIC
Exhibit 5. 12-mth forward PER
Source: Bloomberg, Danareksa Sekuritas
Exhibit 6. 12-mth forward EV/EBITDA
Source: Bloomberg, Danareksa Sekuritas
-150%
-100%
-50%
0%
50%
100%
150%
200%
250%
1997
1999
2001
2003
2005
2007
2009
2011
F
0%
10%
20%
30%
40%
50%
60%
Car sales growth (LHS) SBI rate (RHS)
Inflation rate (RHS)
-100%-80%-60%-40%-20%
0%20%40%60%80%
100%
1997
1999
2001
2003
2005
2007
2009
2011
F
0%
10%
20%
30%
40%
50%
60%
Motorcycle sales growth (LHS)
SBI rate (RHS)
Inflation rate (RHS)
0.02.04.06.08.0
10.012.014.016.018.0
Jan
-02
Jul-
02
Jan
-03
Jul-
03
Jan
-04
Jul-
04
Jan
-05
Jul-
05Ja
n-0
6
Jul-
06
Jan
-07
Jul-
07
Jan
-08
Jul-
08Ja
n-0
9
Jul-
09
Jan
-10
Jul-
10
12-mth forward PE Average 5-yrs
+1 St.dev -1 St.devx
average = 8.9x
0.0
0.5
1.0
1.5
2.0
2.5
3.0
3.5
4.0
Jan
-02
Jul-0
2
Jan
-03
Jul-0
3
Jan
-04
Jul-0
4
Jan
-05
Jul-0
5
Jan
-06
Jul-0
6
Jan
-07
Jul-0
7
Jan
-08
Jul-0
8
Jan
-09
Jul-0
9
Jan
-10
Jul-1
0
12-mth forward EV/EBITDA Average 5-yrs+1 St.dev -1 St.dev
x
average = 1.6x
-
10,000
20,000
30,000
40,000
50,000
60,000
70,000
80,000
Jan
-05
Jun
-05
No
v-05
Ap
r-06
Sep
-06
Feb
-07
Jul-
07
Dec
-07
May
-08
Oct
-08
Mar
-09
Au
g-0
9
Jan
-10
Jun
-10
No
v-10
30%
35%
40%
45%
50%
55%
60%
65%
70%
Car sales Astra's shareunits
-
100,000
200,000
300,000
400,000
500,000
600,000
700,000
800,000
Jan
-05
Jun
-05
No
v-05
Ap
r-06
Sep
-06
Feb
-07
Jul-
07
Dec
-07
May
-08
Oct
-08
Mar
-09
Au
g-0
9
Jan
-10
Jun
-10
No
v-10
30%
35%
40%
45%
50%
55%
60%
Motor sales Astra's shareunits

59
2011 Outlook
Exhibit 7. Projected profit & loss (Rp bn)
2008 2009 2010F 2011F 2012F
Revenues 97,064 98,526 124,110 143,992 161,630Gross profit 21,730 22,771 26,554 30,956 35,192Operating Profit 11,876 12,756 14,031 16,217 18,296EBITDA 14,450 16,103 18,207 21,351 24,506Net interest 142 78 157 166 150Interest income 655 563 620 620 595Interest expense (513) (485) (462) (453) (445)Net other 941 1,001 1,004 1,105 1,215Equity income 2,404 2,567 4,690 5,463 6,617Pretax income 15,363 16,402 19,882 22,951 26,278Income tax (4,065) (3,958) (3,976) (4,590) (5,256)Others - - - - -Minority Interest (2,107) (2,404) (2,670) (3,456) (3,879)Net profit 9,191 10,040 13,236 14,905 17,143
Source: Company and Danareksa Sekuritas
Exhibit 8. Projected balance sheet (Rp bn)
2008 2009 2010F 2011F 2012F
Current assets 35,531 36,595 42,257 45,821 49,836Cash & ST investment 8,852 8,771 10,945 9,402 8,327Account Receivable 6,474 7,874 8,953 10,340 11,570Financing Receivable 9,499 10,630 11,379 13,680 16,310Inventories 8,666 7,282 8,943 10,362 11,590Others 2,040 2,038 2,038 2,038 2,038Financing Receivable 8,601 10,103 10,815 13,002 15,502Investment in Associates 10,636 11,484 13,654 16,504 20,298Fixed Asset - net 20,869 24,555 28,884 33,717 38,568Others 5,103 6,201 6,201 6,201 6,201Total assets 80,740 88,938 101,811 115,246 130,404
Current liabilities 26,883 26,735 27,544 28,884 29,928 Accounts payable 9,645 10,807 12,603 14,043 15,290 ST borrowings 5,185 2,430 1,430 1,430 1,430 Current portion of LT debts 7,794 8,824 8,836 8,737 8,534 Others 4,259 4,674 4,674 4,674 4,674Long-term liabilities 13,280 13,271 13,948 13,637 13,437 Long-term debts 10,554 10,667 11,344 11,033 10,833 Others 2,726 2,604 2,604 2,604 2,604Total liabilities 40,163 40,006 41,492 42,521 43,364
Minority interest 7,497 9,038 11,708 15,164 19,043
Share capital 2,024 2,024 2,024 2,024 2,024Excess paid in 1,106 1,106 1,106 1,106 1,106Retained earnings and others 29,950 36,764 45,482 54,431 64,867Total equity 33,080 39,894 48,612 57,561 67,997Total liabilities and equity 80,740 88,938 101,811 115,246 130,404
Source: Company and Danareksa Sekuritas

60
2011 Outlook
Exhibit 9. Projected cash flow (Rp bn)
2008 2009 2010F 2011F 2012F
Operating cash flow 8,369 11,367 15,007 14,185 17,011 Net Profit 9,191 10,040 13,236 14,905 17,143 Depreciation & amortisation 2,223 2,595 4,176 5,133 6,210 Change in working capital (1,293) 460 (1,692) (3,667) (3,842) Others (1,752) (1,728) (712) (2,187) (2,500)Investment cash flow (10,319) (8,001) (10,675) (12,817) (14,854) Net capex (8,683) (6,281) (8,505) (9,967) (11,061) Change in other assets (1,636) (1,720) (2,170) (2,850) (3,793)Cash flow after invt. (1,951) 3,366 4,332 1,368 2,157Financing cash flow 4,471 (3,419) (2,159) (2,911) (3,232) Change in share capital 1,612 1,796 2,670 3,456 3,879 Net change in debt 3,688 (1,612) (310) (411) (403) Dividend payment (3,174) (3,481) (4,518) (5,956) (6,707) Change in other LT liab. 2,345 (122) - - -Net cash flow 2,520 (53) 2,174 (1,543) (1,074)Beginning balance 6,265 8,785 8,732 10,906 9,363Ending balance 8,785 8,732 10,906 9,363 8,288
Source: Company and Danareksa Sekuritas
Exhibit 10. Selected ratios
2008 2009 2010F 2011F 2012FGrowh (%YoY)Sales 38.3 1.5 26.0 16.0 12.2EBIT 39.7 7.4 10.0 15.6 12.8EBITDA 34.5 11.4 13.1 17.3 14.8Net Profit 41.0 9.2 31.8 12.6 15.0
Profitability (%)Gross margin 22.4 23.1 21.4 21.5 21.8Operating margin 12.2 12.9 11.3 11.3 11.3EBITDA margin 14.9 16.3 14.7 14.8 15.2Net Profit margin 9.5 10.2 10.7 10.4 10.6ROE 27.8 25.2 27.2 25.9 25.2ROA 11.4 11.3 13.0 12.9 13.1
LeverageNet debt/equity (%) 44.6 33.1 22.0 20.6 18.4EBITDA/Gross Interest (X) 35.5 44.0 53.0 53.2 62.9
Per share data (Rp)EPS 2,271 2,480 3,270 3,682 4,235CFPS 2,170 2,157 2,694 2,313 2,048BVPS 8,172 9,855 12,009 14,220 16,798DPS 784 860 1,116 1,471 1,657
Source: Company and Danareksa Sekuritas
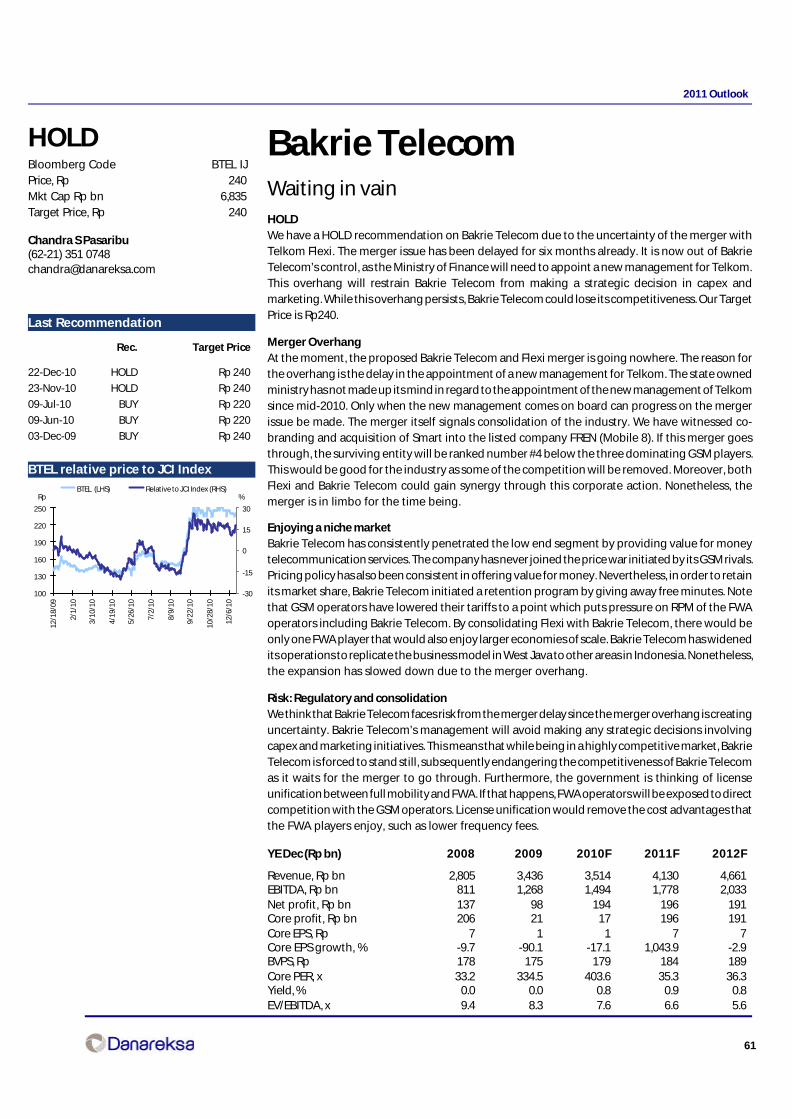
61
2011 Outlook
Bakrie TelecomWaiting in vainHOLDWe have a HOLD recommendation on Bakrie Telecom due to the uncertainty of the merger withTelkom Flexi. The merger issue has been delayed for six months already. It is now out of BakrieTelecom’s control, as the Ministry of Finance will need to appoint a new management for Telkom.This overhang will restrain Bakrie Telecom from making a strategic decision in capex andmarketing. While this overhang persists, Bakrie Telecom could lose its competitiveness. Our TargetPrice is Rp240.
Merger OverhangAt the moment, the proposed Bakrie Telecom and Flexi merger is going nowhere. The reason forthe overhang is the delay in the appointment of a new management for Telkom. The state ownedministry has not made up its mind in regard to the appointment of the new management of Telkomsince mid-2010. Only when the new management comes on board can progress on the mergerissue be made. The merger itself signals consolidation of the industry. We have witnessed co-branding and acquisition of Smart into the listed company FREN (Mobile 8). If this merger goesthrough, the surviving entity will be ranked number #4 below the three dominating GSM players.This would be good for the industry as some of the competition will be removed. Moreover, bothFlexi and Bakrie Telecom could gain synergy through this corporate action. Nonetheless, themerger is in limbo for the time being.
Enjoying a niche marketBakrie Telecom has consistently penetrated the low end segment by providing value for moneytelecommunication services. The company has never joined the price war initiated by its GSM rivals.Pricing policy has also been consistent in offering value for money. Nevertheless, in order to retainits market share, Bakrie Telecom initiated a retention program by giving away free minutes. Notethat GSM operators have lowered their tariffs to a point which puts pressure on RPM of the FWAoperators including Bakrie Telecom. By consolidating Flexi with Bakrie Telecom, there would beonly one FWA player that would also enjoy larger economies of scale. Bakrie Telecom has widenedits operations to replicate the business model in West Java to other areas in Indonesia. Nonetheless,the expansion has slowed down due to the merger overhang.
Risk: Regulatory and consolidationWe think that Bakrie Telecom faces risk from the merger delay since the merger overhang is creatinguncertainty. Bakrie Telecom’s management will avoid making any strategic decisions involvingcapex and marketing initiatives. This means that while being in a highly competitive market, BakrieTelecom is forced to stand still, subsequently endangering the competitiveness of Bakrie Telecomas it waits for the merger to go through. Furthermore, the government is thinking of licenseunification between full mobility and FWA. If that happens, FWA operators will be exposed to directcompetition with the GSM operators. License unification would remove the cost advantages thatthe FWA players enjoy, such as lower frequency fees.
Chandra S Pasaribu(62-21) 351 [email protected]
HOLDBloomberg Code BTEL IJPrice, Rp 240Mkt Cap Rp bn 6,835Target Price, Rp 240
Last Recommendation
Rec. Target Price
22-Dec-10 HOLD Rp 240
23-Nov-10 HOLD Rp 240
09-Jul-10 BUY Rp 220
09-Jun-10 BUY Rp 220
03-Dec-09 BUY Rp 240
BTEL relative price to JCI Index
100
130
160
190
220
250
12/1
8/09
2/1/
10
3/10
/10
4/19
/10
5/26
/10
7/2/
10
8/9/
10
9/22
/10
10/2
8/10
12/6
/10
-30
-15
0
15
30
BTEL (LHS) Relative to JCI Index (RHS)%Rp
YE Dec (Rp bn) 2008 2009 2010F 2011F 2012F
Revenue, Rp bn 2,805 3,436 3,514 4,130 4,661EBITDA, Rp bn 811 1,268 1,494 1,778 2,033Net profit, Rp bn 137 98 194 196 191Core profit, Rp bn 206 21 17 196 191Core EPS, Rp 7 1 1 7 7Core EPS growth, % -9.7 -90.1 -17.1 1,043.9 -2.9BVPS, Rp 178 175 179 184 189Core PER, x 33.2 334.5 403.6 35.3 36.3Yield, % 0.0 0.0 0.8 0.9 0.8EV/EBITDA, x 9.4 8.3 7.6 6.6 5.6
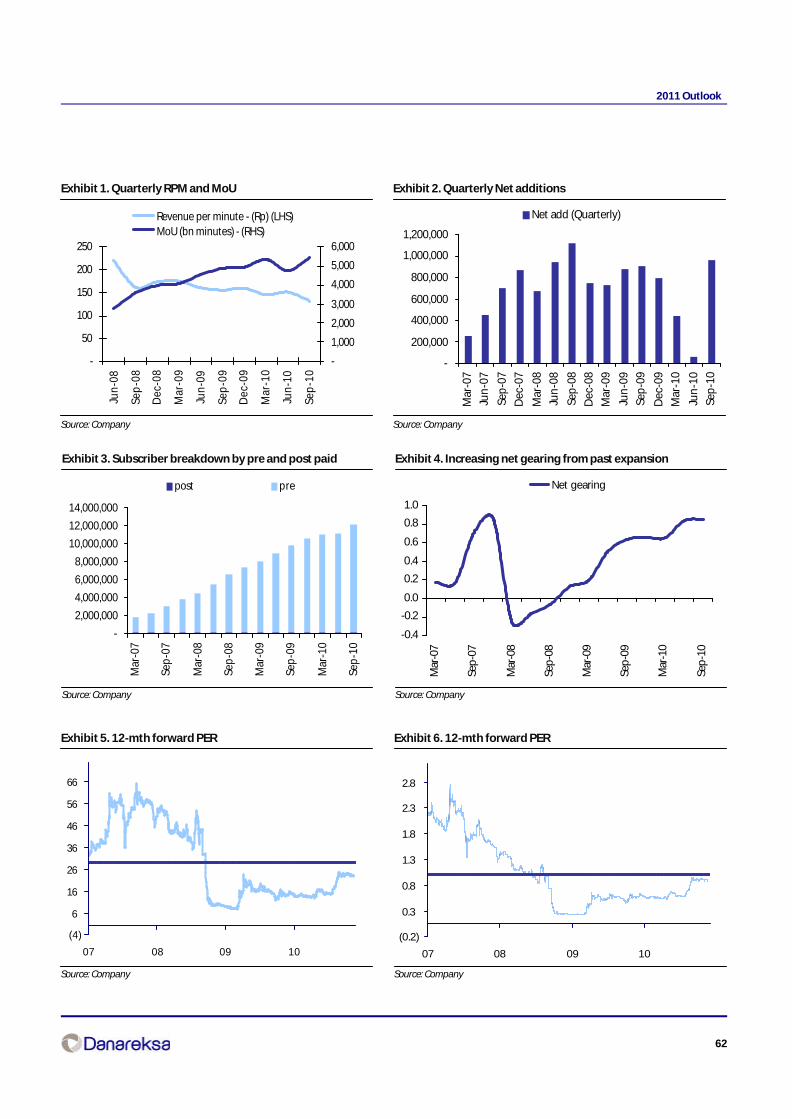
62
2011 Outlook
Exhibit 1. Quarterly RPM and MoU
Source: Company
Exhibit 2. Quarterly Net additions
Source: Company
Exhibit 3. Subscriber breakdown by pre and post paid
Source: Company
Exhibit 4. Increasing net gearing from past expansion
Source: Company
Exhibit 5. 12-mth forward PER
Source: Company
Exhibit 6. 12-mth forward PER
Source: Company
-
50
100
150
200
250
Jun
-08
Sep
-08
Dec
-08
Mar
-09
Jun
-09
Sep
-09
Dec
-09
Mar
-10
Jun
-10
Sep
-10
-
1,000
2,000
3,000
4,000
5,000
6,000
Revenue per minute - (Rp) (LHS)MoU (bn minutes) - (RHS)
-
200,000
400,000
600,000
800,000
1,000,000
1,200,000
Mar
-07
Jun
-07
Sep
-07
Dec
-07
Mar
-08
Jun
-08
Sep
-08
Dec
-08
Mar
-09
Jun
-09
Sep
-09
Dec
-09
Mar
-10
Jun
-10
Sep
-10
Net add (Quarterly)
-
2,000,000
4,000,000
6,000,000
8,000,000
10,000,000
12,000,000
14,000,000
Mar
-07
Sep
-07
Mar
-08
Sep
-08
Mar
-09
Sep
-09
Mar
-10
Sep
-10
post pre
-0.4
-0.2
0.0
0.2
0.4
0.6
0.8
1.0
Mar
-07
Sep
-07
Mar
-08
Sep
-08
Mar
-09
Sep
-09
Mar
-10
Sep
-10
Net gearing
(4)
6
16
26
36
46
56
66
07 08 09 10
(0.2)
0.3
0.8
1.3
1.8
2.3
2.8
07 08 09 10

63
2011 Outlook
Exhibit 4. Profit and loss (Rp bn)
2008 2009 2010F 2011F 2012F
Gross Revenue 2,805 3,436 3,514 4,130 4,661Discount and interconnection (603) (693) (660) (768) (857)Net Revenue 2,202 2,743 2,854 3,362 3,804
Depreciation (432) (979) (1,015) (1,119) (1,235)Selling exp. (424) (451) (387) (454) (513)Salary and wages (241) (291) (316) (372) (419)Overhead (178) (225) (220) (258) (291)Network (537) (506) (436) (498) (546)Others (12) (1) (1) (2) (2) Total Opex (1,824) (2,454) (2,376) (2,703) (3,006)
Operating Income 379 288 479 660 797
Net interest exp/income (132) (220) (378) (379) (543)Forex (44) 98 - - -Others (24) (20) 177 - -Other income/ expense (201) (143) (201) (379) (543)
Pre tax Income 178 146 277 280 254
Income tax (41) (47) (83) (84) (64)Minorities - - - - -Net Income 137 98 194 196 191
Source: Company and Danareksa Sekuritas
Exhibit 5. Balance sheet (Rp bn)
2008 2009 2010F 2011F 2012F
Cash & Equivalent 1,585 1,273 2,322 672 668Receivable 121 94 97 114 128Inventory 36 28 28 33 38Other current assets 567 336 341 381 415 Total Current Asset 2,308 1,732 2,788 1,200 1,248
Fixed assets 6,725 11,656 13,492 15,406 16,571Depreciation (1,421) (2,341) (3,356) (4,475) (5,710)Other LT assets 934 390 390 390 390 Total Non Current Asset 6,238 9,704 10,526 11,320 11,250TOTAL ASSET 8,546 11,436 13,314 12,520 12,499
ST Loans - 235 - - 1,500Payable 532 955 967 1,136 1,282Current portion of LT loans 175 534 - - -Other current liabilities 360 338 282 326 363 Total Current Liab. 1,067 2,062 1,249 1,462 3,145
Long term loans 2,208 4,052 6,607 5,443 3,605Other LT Liab. 188 285 285 305 305 Total Non Current Liab. 2,396 4,337 6,892 5,748 3,910
Equity 5,517 5,604 5,604 5,604 5,604Retained Earnings (710) (612) (476) (338) (205)Others 276 44 44 44 44 Total Equity 5,082 5,037 5,173 5,310 5,444TOTAL LIABILITIES and EQUITY 8,546 11,436 13,314 12,520 12,499
Source: Company and Danareksa Sekuritas
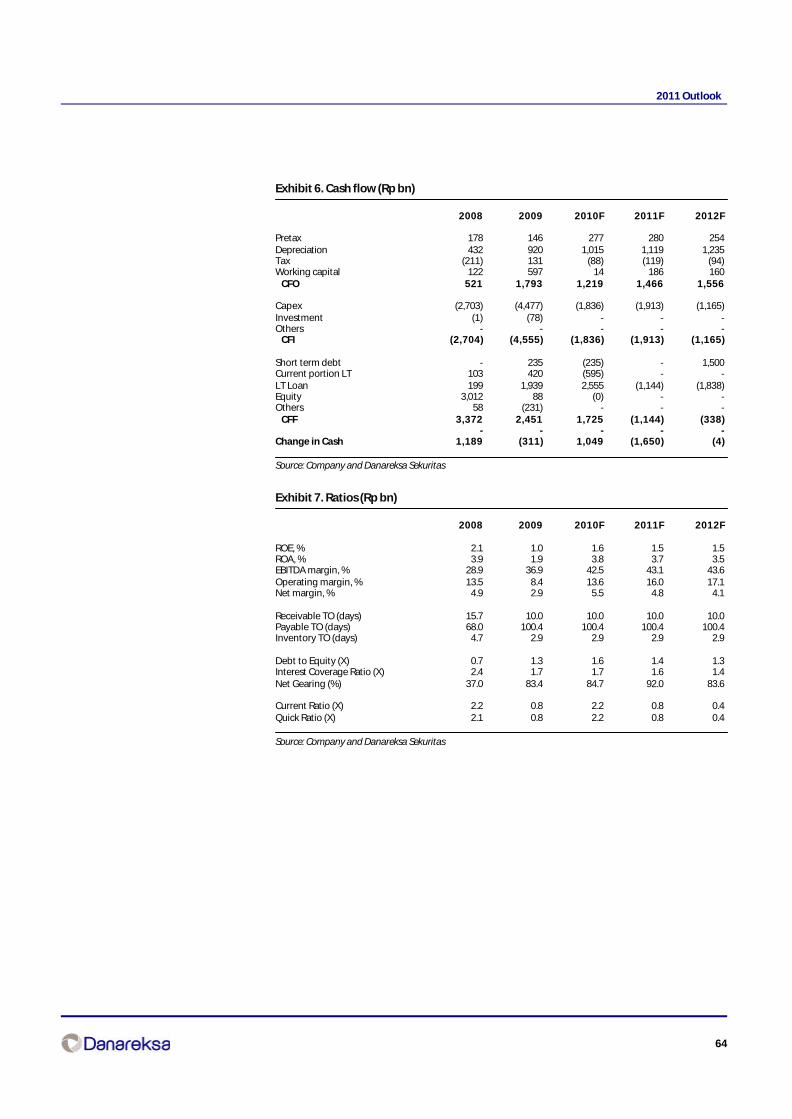
64
2011 Outlook
Exhibit 6. Cash flow (Rp bn)
2008 2009 2010F 2011F 2012F
Pretax 178 146 277 280 254Depreciation 432 920 1,015 1,119 1,235Tax (211) 131 (88) (119) (94)Working capital 122 597 14 186 160 CFO 521 1,793 1,219 1,466 1,556
Capex (2,703) (4,477) (1,836) (1,913) (1,165)Investment (1) (78) - - -Others - - - - - CFI (2,704) (4,555) (1,836) (1,913) (1,165)
Short term debt - 235 (235) - 1,500Current portion LT 103 420 (595) - -LT Loan 199 1,939 2,555 (1,144) (1,838)Equity 3,012 88 (0) - -Others 58 (231) - - - CFF 3,372 2,451 1,725 (1,144) (338)
- - - - -Change in Cash 1,189 (311) 1,049 (1,650) (4)
Source: Company and Danareksa Sekuritas
Exhibit 7. Ratios (Rp bn)
2008 2009 2010F 2011F 2012F
ROE, % 2.1 1.0 1.6 1.5 1.5ROA, % 3.9 1.9 3.8 3.7 3.5EBITDA margin, % 28.9 36.9 42.5 43.1 43.6Operating margin, % 13.5 8.4 13.6 16.0 17.1Net margin, % 4.9 2.9 5.5 4.8 4.1
Receivable TO (days) 15.7 10.0 10.0 10.0 10.0Payable TO (days) 68.0 100.4 100.4 100.4 100.4Inventory TO (days) 4.7 2.9 2.9 2.9 2.9
Debt to Equity (X) 0.7 1.3 1.6 1.4 1.3Interest Coverage Ratio (X) 2.4 1.7 1.7 1.6 1.4Net Gearing (%) 37.0 83.4 84.7 92.0 83.6
Current Ratio (X) 2.2 0.8 2.2 0.8 0.4Quick Ratio (X) 2.1 0.8 2.2 0.8 0.4
Source: Company and Danareksa Sekuritas
65
2011 Outlook
Bank Central AsiaA new multiple zone
TP lifted to Rp7,000Our higher TP reflects a sustainable low risk premium, supported by the company’s strong businessmodel, good management, high profitability and robust asset quality. It implies 4.8x 2011PBV,admittedly at the high end, but given that the stock has been trading at a 26.4% premium to thesector over the past 5 years, we believe that such a high multiple is justified. Profitability remainsintact, mostly helped by solid 25.5% 3-yr CAGR loans growth. While the low yielding corporatesegment accounts for the bulk of its loan portfolio, its efforts in the robust consumer segmentshall keep its asset yield beyond 7.0%, in our estimates. Meanwhile, the imminent penalty imposedon low LDR shall compress the NIM in the next 2 years – by about 16-17bps, yet the bank’s ROEshall remain in excess of 25%, well above the industry average. We now raise our call to HOLD.
Profitability stays firmWe estimate NPAT to grow by a modest 11% next year, thanks to strong loans growth of 29% andgreater fee based income. A low COF remaining at 2.8% also helps keep profitability intact. Ourloans growth estimate far exceeds the company’s guidance of 15-20%, a view supported by thehigh historic growth levels (25.1% CAGR over the past 5 years). The bank’s venture towards multi-finance is also helping, aside from economic expansion, although the full impact shall not be feltfor 2-3 years. The cost to income (CIR) ratio is likely to ease next year to 48.7%, before picking upin 2012, as the bank continues to expand its branches to remain competitive. By next year, around30 branches and 900 ATMs will be opened to ensure that the bank remains as the largesttransactional bank in the country.
Liquidity pushThere is liquidity aplenty and the bank’s problem remains on allocating its excess funds. The LDRis still at 60%, requiring an additional 1.8% to be placed as MRR or some additional 5.3bps COF.However, it has been the bank’s trait to remain conservative, meaning that it will not act hastilyto achieve the minimum LDR of 78% set by BI. Any lending will be done cautiously such that NPLsare maintained at a low 0.8%. What the bank can do is to release some of the expensive TD, whichin a way, could also lead to a lower COF, hence greater NIM. Until that happens, we may see a pick-up in marketable securities, albeit the returns obtained may be low.
Risks to watchRisks to our call are 1) worse than expected provisioning charges, which tend to correlate withhigher loans growth and the economic downcycle, 2) higher CIR with the company attemptingto sustain its competitive advantage, and 3) a higher COF mainly due to the additional MRR as partof the penalty for a lower LDR.
Year end to Dec, Rp bn 2008 2009 2010F 2011F 2012F
Net interest income 12,356 14,900 13,951 15,530 18,135PPOP 9,409 10,777 9,921 11,670 13,150PBT 7,720 8,945 9,888 10,946 12,302Net income 5,776 6,807 7,614 8,429 9,472EPS, Rp 234 276 309 342 384EPS growth, % 28.7 17.9 11.8 10.7 12.4Dividend yield, % 1.5 1.3 2.3 2.6 2.9ROE, % 26.4 26.6 25.6 25.0 24.8PBV, x 7.1 5.9 5.2 4.6 4.1PER, x 28.6 24.3 21.7 19.6 17.4BVPS, Rp 944 1,130 1,284 1,455 1,647
Bonny B. Setiawan CFA(62-21) 2352 [email protected]
HOLDBloomberg Code BBCA IJPrice, Rp 6,700Mkt Cap Rp bn 163,536Target Price, Rp 7,000
BBCA relative price to JCI Index
Last Recommendation
Rec. Target Price
22-Dec-10 HOLD Rp 7,00028-Oct-10 SELL Rp 5,10030-Jul-10 SELL Rp 5,10010-Jun-10 SELL Rp 4,55030-Apr-10 SELL Rp 4,200
4,500
5,500
6,500
7,500
12/1
8/09
2/1/
10
3/10
/10
4/19
/10
5/26
/10
7/2/
10
8/9/
10
9/22
/10
10/2
8/10
12/6
/10
-10
-5
0
5
10
15
BBCA (LHS) Relative to JCI Index (RHS)%Rp
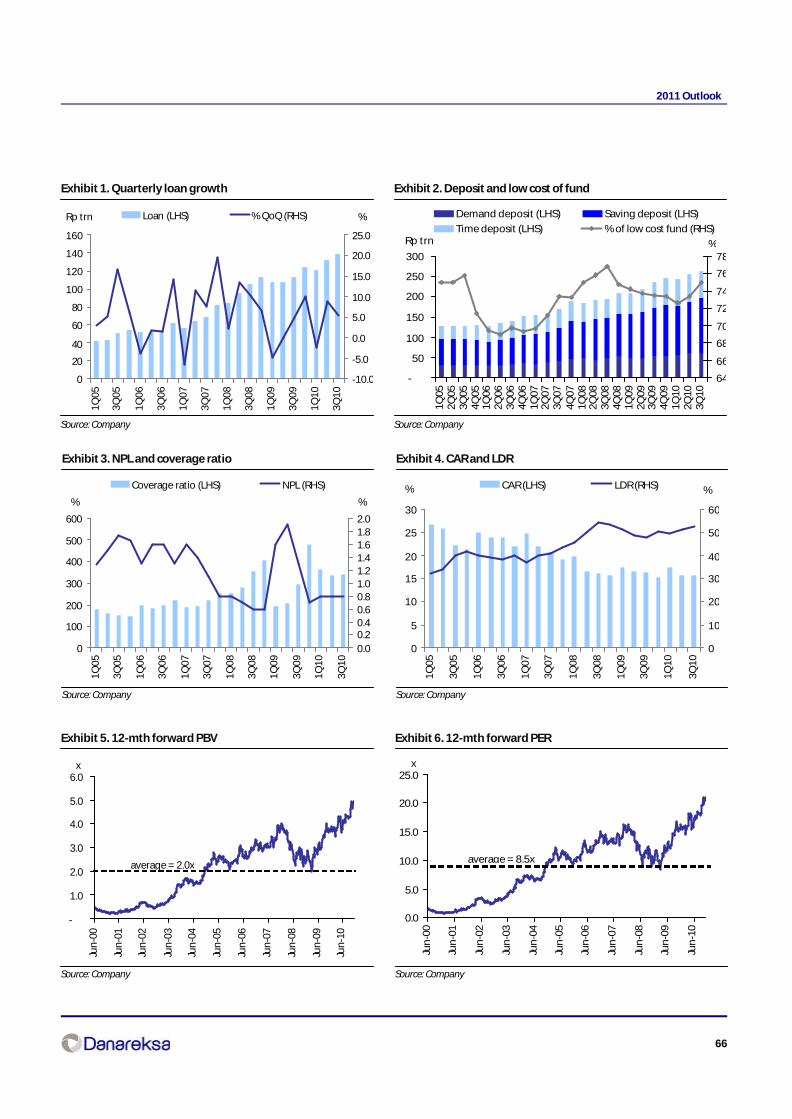
66
2011 Outlook
Exhibit 1. Quarterly loan growth
Source: Company
Exhibit 2. Deposit and low cost of fund
Source: Company
Exhibit 3. NPL and coverage ratio
Source: Company
Exhibit 4. CAR and LDR
Source: Company
Exhibit 5. 12-mth forward PBV
Source: Company
Exhibit 6. 12-mth forward PER
Source: Company
0
20
40
60
80
100
120
140
160
1Q05
3Q05
1Q06
3Q06
1Q07
3Q07
1Q08
3Q08
1Q09
3Q09
1Q10
3Q10
Rp trn
-10.0
-5.0
0.0
5.0
10.0
15.0
20.0
25.0
%Loan (LHS) % QoQ (RHS)
-
50
100
150
200
250
300
1Q05
2Q05
3Q05
4Q05
1Q06
2Q06
3Q06
4Q06
1Q07
2Q07
3Q07
4Q07
1Q08
2Q08
3Q08
4Q08
1Q09
2Q09
3Q09
4Q09
1Q10
2Q10
3Q10
64
66
68
70
72
74
76
78
Demand deposit (LHS) Saving deposit (LHS)
Time deposit (LHS) % of low cost fund (RHS)
%Rp trn
0
100
200
300
400
500
600
1Q05
3Q05
1Q06
3Q06
1Q07
3Q07
1Q08
3Q08
1Q09
3Q09
1Q10
3Q10
%
0.00.20.40.60.81.01.21.41.61.82.0
%
Coverage ratio (LHS) NPL (RHS)
0
5
10
15
20
25
30
1Q05
3Q05
1Q06
3Q06
1Q07
3Q07
1Q08
3Q08
1Q09
3Q09
1Q10
3Q10
%
0
10
20
30
40
50
60
%CAR (LHS) LDR (RHS)
-
1.0
2.0
3.0
4.0
5.0
6.0
Jun
-00
Jun
-01
Jun
-02
Jun
-03
Jun
-04
Jun
-05
Jun
-06
Jun
-07
Jun
-08
Jun
-09
Jun
-10
x
average = 2.0x
0.0
5.0
10.0
15.0
20.0
25.0
Jun
-00
Jun
-01
Jun
-02
Jun
-03
Jun
-04
Jun
-05
Jun
-06
Jun
-07
Jun
-08
Jun
-09
Jun
-10
x
average = 8.5x
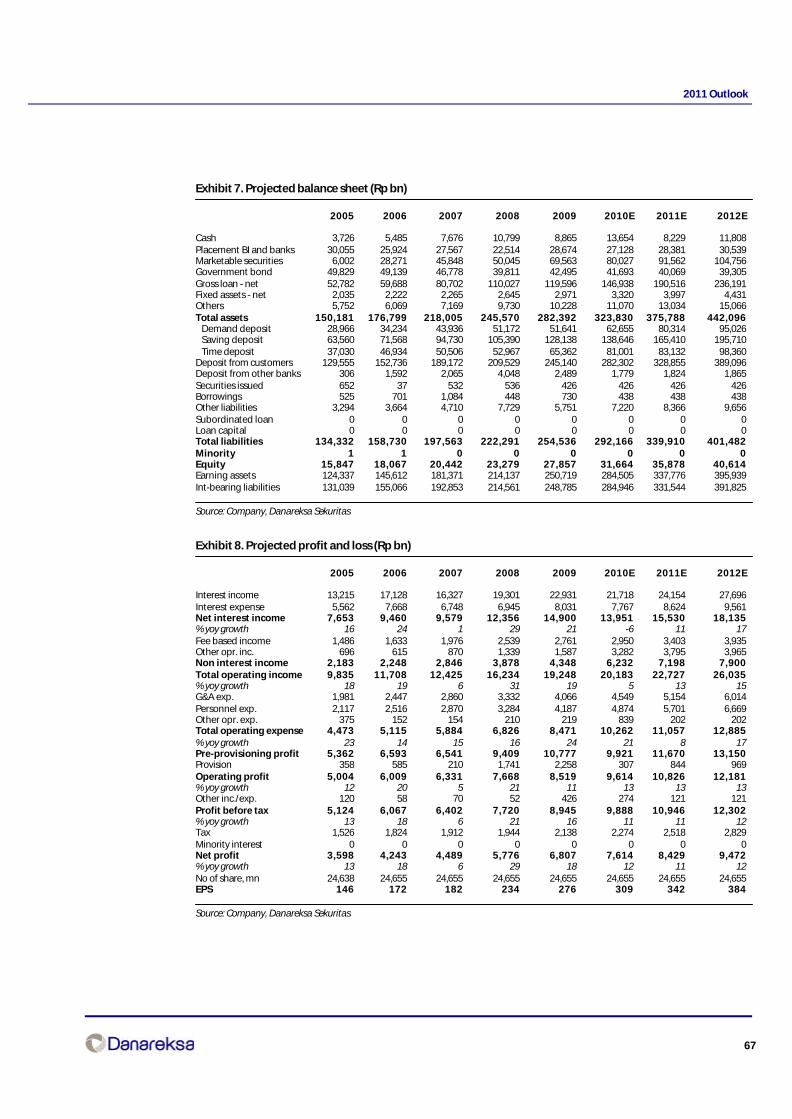
67
2011 Outlook
Exhibit 7. Projected balance sheet (Rp bn)
2005 2006 2007 2008 2009 2010E 2011E 2012E
Cash 3,726 5,485 7,676 10,799 8,865 13,654 8,229 11,808Placement BI and banks 30,055 25,924 27,567 22,514 28,674 27,128 28,381 30,539Marketable securities 6,002 28,271 45,848 50,045 69,563 80,027 91,562 104,756Government bond 49,829 49,139 46,778 39,811 42,495 41,693 40,069 39,305Gross loan - net 52,782 59,688 80,702 110,027 119,596 146,938 190,516 236,191Fixed assets - net 2,035 2,222 2,265 2,645 2,971 3,320 3,997 4,431Others 5,752 6,069 7,169 9,730 10,228 11,070 13,034 15,066Total assets 150,181 176,799 218,005 245,570 282,392 323,830 375,788 442,096 Demand deposit 28,966 34,234 43,936 51,172 51,641 62,655 80,314 95,026 Saving deposit 63,560 71,568 94,730 105,390 128,138 138,646 165,410 195,710 Time deposit 37,030 46,934 50,506 52,967 65,362 81,001 83,132 98,360Deposit from customers 129,555 152,736 189,172 209,529 245,140 282,302 328,855 389,096Deposit from other banks 306 1,592 2,065 4,048 2,489 1,779 1,824 1,865Securities issued 652 37 532 536 426 426 426 426Borrowings 525 701 1,084 448 730 438 438 438Other liabilities 3,294 3,664 4,710 7,729 5,751 7,220 8,366 9,656Subordinated loan 0 0 0 0 0 0 0 0Loan capital 0 0 0 0 0 0 0 0Total liabilities 134,332 158,730 197,563 222,291 254,536 292,166 339,910 401,482Minority 1 1 0 0 0 0 0 0Equity 15,847 18,067 20,442 23,279 27,857 31,664 35,878 40,614Earning assets 124,337 145,612 181,371 214,137 250,719 284,505 337,776 395,939Int-bearing liabilities 131,039 155,066 192,853 214,561 248,785 284,946 331,544 391,825
Source: Company, Danareksa Sekuritas
Exhibit 8. Projected profit and loss (Rp bn)
2005 2006 2007 2008 2009 2010E 2011E 2012E
Interest income 13,215 17,128 16,327 19,301 22,931 21,718 24,154 27,696Interest expense 5,562 7,668 6,748 6,945 8,031 7,767 8,624 9,561Net interest income 7,653 9,460 9,579 12,356 14,900 13,951 15,530 18,135% yoy growth 16 24 1 29 21 -6 11 17Fee based income 1,486 1,633 1,976 2,539 2,761 2,950 3,403 3,935Other opr. inc. 696 615 870 1,339 1,587 3,282 3,795 3,965Non interest income 2,183 2,248 2,846 3,878 4,348 6,232 7,198 7,900Total operating income 9,835 11,708 12,425 16,234 19,248 20,183 22,727 26,035% yoy growth 18 19 6 31 19 5 13 15G&A exp. 1,981 2,447 2,860 3,332 4,066 4,549 5,154 6,014Personnel exp. 2,117 2,516 2,870 3,284 4,187 4,874 5,701 6,669Other opr. exp. 375 152 154 210 219 839 202 202Total operating expense 4,473 5,115 5,884 6,826 8,471 10,262 11,057 12,885% yoy growth 23 14 15 16 24 21 8 17Pre-provisioning profit 5,362 6,593 6,541 9,409 10,777 9,921 11,670 13,150Provision 358 585 210 1,741 2,258 307 844 969Operating profit 5,004 6,009 6,331 7,668 8,519 9,614 10,826 12,181% yoy growth 12 20 5 21 11 13 13 13Other inc./exp. 120 58 70 52 426 274 121 121Profit before tax 5,124 6,067 6,402 7,720 8,945 9,888 10,946 12,302% yoy growth 13 18 6 21 16 11 11 12Tax 1,526 1,824 1,912 1,944 2,138 2,274 2,518 2,829Minority interest 0 0 0 0 0 0 0 0Net profit 3,598 4,243 4,489 5,776 6,807 7,614 8,429 9,472% yoy growth 13 18 6 29 18 12 11 12No of share, mn 24,638 24,655 24,655 24,655 24,655 24,655 24,655 24,655EPS 146 172 182 234 276 309 342 384
Source: Company, Danareksa Sekuritas

68
2011 Outlook
Exhibit 9. Selected ratios
2005 2006 2007 2008 2009 2010E 2011E 2012E
NIM, % 6.0 7.0 5.9 6.2 6.4 5.6 5.7 5.6Fee based/total income, % 18.9 17.8 20.3 19.9 18.8 19.8 20.9 21.6BOPO, % 67.5 69.0 67.0 66.9 68.8 65.6 65.5 65.8Tax rate, % 29.8 30.1 29.9 25.2 23.9 23.0 23.0 23.0ROAE, % 24.2 25.0 23.3 26.4 26.6 25.6 25.0 24.8ROAA, % 2.4 2.6 2.3 2.5 2.6 2.5 2.4 2.3CAR, % 21.5 22.2 19.2 15.8 16.4 15.7 14.1 13.3Tier 1 CAR, % 17.6 18.1 15.4 14.0 15.1 14.4 12.9 12.0
Avg yield on earning assets, % 10.1 12.4 9.6 9.4 9.5 7.7 7.3 7.1Loans/earning assets, % 42.5 41.0 44.5 51.4 47.7 51.6 56.4 59.7Earning assets/total asset, % 82.8 82.4 83.2 87.2 88.8 87.9 89.9 89.6Loan growth, % 33.9 13.4 34.1 36.9 9.9 23.2 29.5 24.0Avg cost of fund, % 4.2 5.4 3.9 3.4 3.5 2.9 2.8 2.6Deposit/int bearing liab., % 98.9 98.5 98.1 97.7 98.5 99.1 99.2 99.3Deposit growth, % -1.6 17.9 23.9 10.8 17.0 15.2 16.5 18.3Int bearing liab./total asset, % 87.3 87.7 88.5 87.4 88.1 88.0 88.2 88.6
NPL - gross, % 1.7 1.3 0.8 0.6 0.7 0.9 0.8 0.7NPL - net, % 0.5 0.3 0.1 0.1 0.1 0.2 0.1 0.1Coverage, % 146.0 217.1 251.8 408.6 476.8 434.8 482.0 491.8LDR, % 41.8 40.2 43.6 53.8 50.5 54.1 60.1 63.0
Source: Company, Danareksa Sekuritas

69
2011 Outlook
Bank DanamonMass market oriented
Upgraded to BUYWe set our TP at Rp8,050, taking account of a sustainable low-risk premium. Our new TP implies3.6x 2011E PBV, justified by the bank’s strong capital base, high NIM and potentially strong loansgrowth. Earnings are likely to grow by 31% next year, helped by strong growth in loans, much ofwhich is channeled to the high yielding mass market. The NIM shall remain at a very high 11.9%,as a consequence. This is despite the expectation of a greater proportion of expensive fundingthat the bank will need in order to sustain such a level of loans growth. Low rates, with thebenchmark rate likely to stay at 6.5%, will also help sustain the bank’s mass-market loans growth.ROE will surge to 20.0%, despite the bank’s high capitalization. For now, we keep our forecast intact.
Self-funded loansFunding remains BDMN’s key issue, in particular since the LDR has reached 104% as of September2010. While the bank could easily source its funding through the issuance of bonds, deposits willcontinue to be the key source of funds for its loans expansion. We estimate deposits to grow by23.3% over the next 3 years driven by the bank’s aggressive branch openings and innovativeproducts. CASA still accounts for around 35% of total deposits, nonetheless. Tapping for greaterfunding could also be sourced through cross selling with the SME segment. However, until sucha strategy pays off, the loans channeled will be skewed largely to the mass market, where the shortduration of 18-months will ensure the sustainability of loans growth through immediatereinvestment.
Staying efficientWe estimate operating costs to increase by 15.1% next year, of which salaries shall take the bulk,aside from greater costs associated with the expansion program. Indeed, the bank’s goal is to open800 branches from currently 500 branches with the ratio of branches to ATMs geared up to 1:4 overthe next 3 years from currently one branch for every 2 ATMs. The cost to income ratio is expectedto stay at 51% next year, slightly above the company’s guidance of below 50%. However, asconservative as it is, next year’s CIR is still lower compared to this year’s, as any additional costswould be compensated by greater income yield.
Risks to watchRisks to our call are 1) the inability to secure greater funding, which may slow its loans expansionand result in a lower NIM, 2) economic slowdown which may affect its profitability and asset qualitygiven that 57% of its loan portfolio is dependent on the mass market and 3) tightening competitionin the micro segment.
Bonny B. Setiawan CFA(62-21) 2352 [email protected]
BUYBloomberg Code BDMN IJPrice, Rp 5,800Mkt Cap Rp bn 48,333Target Price, Rp 8,050
Year end to Dec, Rp bn 2008 2009 2010F 2011F 2012F
Net interest income 9,278 10,197 11,849 13,760 15,050PPOP 4,490 5,677 6,203 7,329 8,012PBT 2,678 2,371 4,129 5,395 5,967Net income 1,530 1,533 2,769 3,617 3,999EPS, Rp 303 183 330 431 476EPS growth, % -27.7 0.2 80.7 30.6 10.6Dividend yield, % 2.6 1.6 2.8 3.7 4.1ROE, % 14.3 11.6 16.8 20.0 20.0PBV, x 2.8 3.1 2.8 2.6 2.3PER, x 19.1 31.8 17.6 13.5 12.2BVPS, Rp 2,096 1,883 2,048 2,263 2,501
BDMN relative price to JCI Index
Last Recommendation
Rec. Target Price
22-Dec-10 BUY Rp 8,05027-Oct-10 HOLD Rp 6,85004-Oct10 BUY Rp 6,85023-Aug-10 BUY Rp 6,85014-Jul-10 BUY Rp 6,850
3,500
4,500
5,500
6,500
7,500
12/1
8/09
2/1/
10
3/10
/10
4/19
/10
5/26
/10
7/2/
10
8/9/
10
9/22
/10
10/2
8/10
12/6
/10
-15
-10
-5
0
5
10
15
BDMN (LHS) Relative to JCI Index (RHS)%Rp

70
2011 Outlook
Exhibit 1. Quarterly loan growth
Source: Company
Exhibit 2. Deposit and low cost of fund
Source: Company
Exhibit 3. NIM and asset yie;d
Source: Company
Exhibit 4. CAR and NPL
Source: Company
Exhibit 5. 12-mth forward PBV
Source: Company
Exhibit 6. 12-mth forward PER
Source: Company
0
10
20
30
40
50
60
70
80
90
3M03
9M03
3M04
9M04
3M05
9M05
3M06
9M06
3M07
9M07
3M08
9M08
3M09
9M09
3M10
9M10
-15%-10%-5%0%5%10%15%20%25%30%35%40%
Loan, Rp trn (LHS) QoQ (RHS)Rp trn
0
10
20
30
40
50
60
70
80
12M
02
6M
03
12M
03
6M
04
12M
04
6M
05
12M
05
6M
06
12M
06
6M
07
12M
07
6M
08
12M
08
6M
09
12M
09
6M
10
0
20
40
60
80
100
120
TD (RHS) CASA (RHS) LDR (LHS)
Rp trn%
0.02.04.06.08.0
10.012.014.016.018.020.0
1Q05
2Q05
3Q05
4Q05
1Q06
2Q06
3Q06
4Q06
1Q07
2Q07
3Q07
4Q07
1Q08
2Q08
3Q08
4Q08
1Q09
2Q09
3Q09
4Q09
1Q10
2Q10
3Q10
Earning asset yield COF NIM%
0.0
5.0
10.0
15.0
20.0
25.0
30.0
12M
043
M0
56
M0
59
M0
512
M05
3M
06
6M
06
9M
06
12M
063
M0
76
M0
79
M0
712
M07
3M
08
6M
08
9M
08
12M
083
M0
96
M0
99
M0
912
M09
3M
10
6M
10
9M
10
0.00.51.01.52.02.53.03.54.04.55.0
CAR (LHS) NPL (RHS)%
-
0.5
1.0
1.5
2.0
2.5
3.0
3.5
May
-03
Nov
-03
May
-04
Nov
-04
May
-05
Nov
-05
May
-06
Nov
-06
May
-07
Nov
-07
May
-08
Nov
-08
May
-09
Nov
-09
May
-10
average = 2.0x
x
0.0
5.0
10.0
15.0
20.0
25.0
Jan
-03
Jan
-04
Jan
-05
Jan
-06
Jan
-07
Jan
-08
Jan
-09
Jan
-10
average = 11.2x
x

71
2011 Outlook
Exhibit 7. Projected balance sheet (Rp bn)
2005 2006 2007 2008 2009 2010E 2011E 2012E
Cash 640 833 1,238 4,162 2,117 2,858 6,384 12,050Placement BI and banks 10,124 9,506 9,533 9,915 9,917 11,227 13,681 14,365Marketable securities 2,476 6,012 4,111 4,137 4,432 5,334 6,231 7,507Government bond 14,102 18,702 15,808 13,083 11,011 11,140 12,525 12,611Gross loan - net 34,974 39,747 49,858 63,410 58,368 71,161 86,911 105,784Fixed assets - net 1,480 1,575 1,539 1,905 1,802 1,774 1,697 1,446Others 4,008 5,699 7,323 10,655 10,951 11,137 13,094 14,279Total assets 67,803 82,073 89,410 107,268 98,598 114,632 140,524 168,042 Demand deposit 4,429 5,208 6,595 6,894 6,858 7,648 13,080 16,215 Saving deposit 8,552 9,712 11,395 12,847 15,364 15,824 21,991 27,262 Time deposit 31,370 39,274 39,814 54,228 44,994 58,586 66,566 82,522Deposit from customers 44,350 54,194 57,804 73,969 67,216 82,058 101,637 125,999Deposit from other banks 3,926 4,769 4,609 1,471 1,438 1,537 437 438Securities issued 495 1,194 2,666 2,234 2,051 1,000 5,750 5,750Borrowings 1,115 1,028 1,510 2,544 2,394 2,394 2,394 2,394Other liabilities 5,373 7,671 8,291 12,172 9,098 9,815 10,614 11,706Subordinated loan 3,628 3,374 3,359 3,770 500 500 500 500Loan capital 155 155 0 0 0 0 0 0Total liabilities 59,043 72,386 78,239 96,159 82,696 97,303 121,332 146,787Minority 171 245 337 530 96 138 194 256Equity 8,589 9,442 10,833 10,579 15,806 17,190 18,999 20,999Earning assets 58,853 71,800 77,283 89,603 82,562 96,400 116,354 136,701Int-bearing liabilities
53,670 64,715 69,949 83,987 73,598 87,488 110,717 135,081
Source: Company, Danareksa Sekuritas
Exhibit 8. Projected profit and loss (Rp bn)
2005 2006 2007 2008 2009 2010E 2011E 2012E
Interest income 8,793 11,684 13,490 16,119 17,666 18,722 22,181 24,803Interest expense 3,882 5,690 5,662 6,841 7,469 6,874 8,421 9,753Net interest income 4,911 5,994 7,828 9,278 10,197 11,849 13,760 15,050% yoy growth 8 22 31 19 10 16 16 9Fee based income 585 797 551 780 602 700 812 888Other opr. inc. 583 453 632 273 595 278 380 603Non interest income 1,168 1,250 1,183 1,052 1,197 977 1,192 1,492Total operating income 6,079 7,243 9,011 10,330 11,394 12,826 14,952 16,542% yoy growth 16 19 24 15 10 13 17 11G&A exp. 1,232 1,468 1,712 2,272 2,463 2,895 3,393 3,746Personnel exp. 1,691 1,888 2,417 3,059 3,003 3,436 3,947 4,534Other opr. exp. 91 312 258 510 251 292 283 249Total operating expense 3,014 3,669 4,387 5,840 5,717 6,623 7,623 8,529% yoy growth 40 22 20 33 -2 16 15 12Pre-provisioning profit 3,064 3,575 4,623 4,490 5,677 6,203 7,329 8,012Provision -210 1,026 1,020 1,819 2,895 1,867 1,726 1,838Operating profit 3,275 2,549 3,604 2,671 2,782 4,337 5,603 6,174% yoy growth -6 -22 41 -26 4 56 29 10Other inc./exp. -276 -446 -290 7 -412 -207 -207 -207Profit before tax 2,998 2,103 3,314 2,678 2,371 4,129 5,395 5,967% yoy growth -111 -30 58 -19 -11 74 31 11Tax 876 652 1,044 876 757 1,318 1,723 1,905Minority interest 119 126 153 272 81 42 55 63Net profit 2,122 1,325 2,117 1,530 1,533 2,769 3,617 3,999% yoy growth -17 -34 60 -28 0 81 31 11No of share, mn 4,921 4,946 5,033 5,046 8,395 8,395 8,395 8,395EPS 407 268 421 303 183 330 431 476
Source: Company, Danareksa Sekuritas
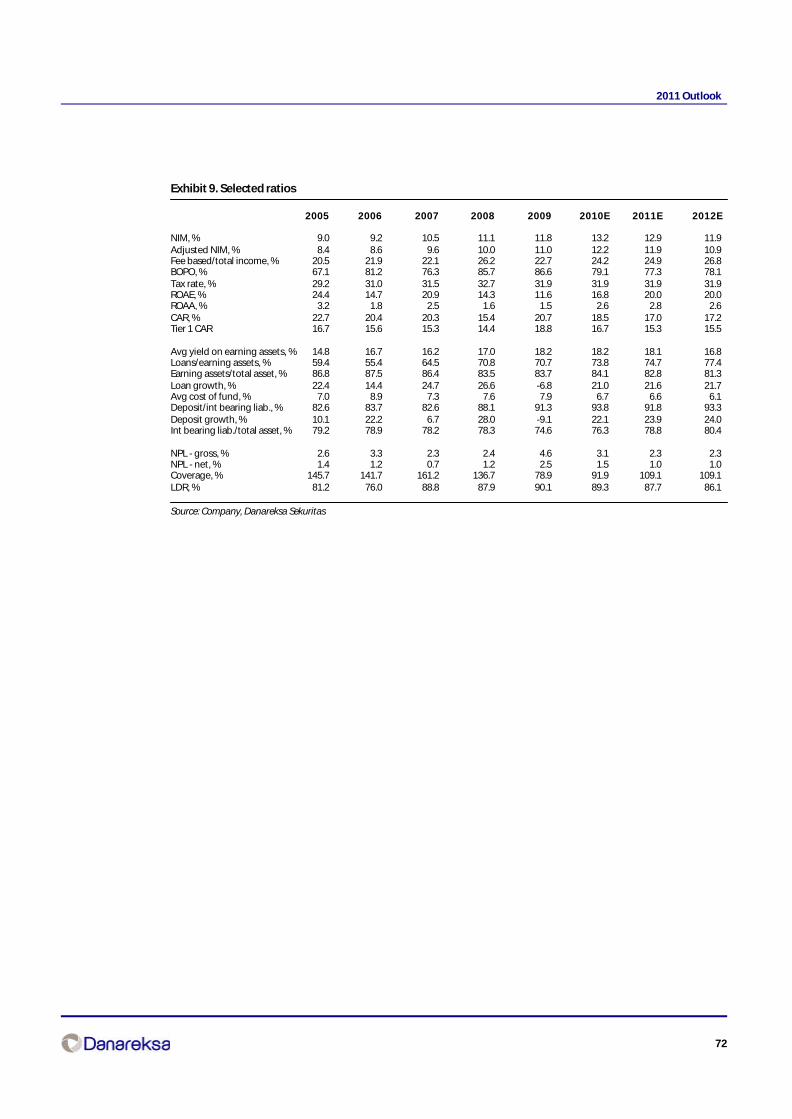
72
2011 Outlook
Exhibit 9. Selected ratios
2005 2006 2007 2008 2009 2010E 2011E 2012E
NIM, % 9.0 9.2 10.5 11.1 11.8 13.2 12.9 11.9Adjusted NIM, % 8.4 8.6 9.6 10.0 11.0 12.2 11.9 10.9Fee based/total income, % 20.5 21.9 22.1 26.2 22.7 24.2 24.9 26.8BOPO, % 67.1 81.2 76.3 85.7 86.6 79.1 77.3 78.1Tax rate, % 29.2 31.0 31.5 32.7 31.9 31.9 31.9 31.9ROAE, % 24.4 14.7 20.9 14.3 11.6 16.8 20.0 20.0ROAA, % 3.2 1.8 2.5 1.6 1.5 2.6 2.8 2.6CAR, % 22.7 20.4 20.3 15.4 20.7 18.5 17.0 17.2Tier 1 CAR 16.7 15.6 15.3 14.4 18.8 16.7 15.3 15.5
Avg yield on earning assets, % 14.8 16.7 16.2 17.0 18.2 18.2 18.1 16.8Loans/earning assets, % 59.4 55.4 64.5 70.8 70.7 73.8 74.7 77.4Earning assets/total asset, % 86.8 87.5 86.4 83.5 83.7 84.1 82.8 81.3Loan growth, % 22.4 14.4 24.7 26.6 -6.8 21.0 21.6 21.7Avg cost of fund, % 7.0 8.9 7.3 7.6 7.9 6.7 6.6 6.1Deposit/int bearing liab., % 82.6 83.7 82.6 88.1 91.3 93.8 91.8 93.3Deposit growth, % 10.1 22.2 6.7 28.0 -9.1 22.1 23.9 24.0Int bearing liab./total asset, % 79.2 78.9 78.2 78.3 74.6 76.3 78.8 80.4
NPL - gross, % 2.6 3.3 2.3 2.4 4.6 3.1 2.3 2.3NPL - net, % 1.4 1.2 0.7 1.2 2.5 1.5 1.0 1.0Coverage, % 145.7 141.7 161.2 136.7 78.9 91.9 109.1 109.1LDR, % 81.2 76.0 88.8 87.9 90.1 89.3 87.7 86.1
Source: Company, Danareksa Sekuritas

73
2011 Outlook
Bank MandiriStrong delivery
Upgrade to BUY, TP of Rp8,300We have raised our FY11-12E NPAT by 9% and 8% respectively, mainly on the additional 5% taxbenefit post rights issue, assuming also that all rights issue proceeds of around Rp12.5trn areplaced in marketable securities. Our TP is lifted as a consequence, which also reflects a sustainablelow risk premium in the medium term, implying some 3.3x 2011F PBV, justified we believe by thebank’s large asset base, potentially strong loans growth post the rights issue and imminent baddebt recovery. Our higher NPAT assumes 17.7% CAGR loans growth over the next 3 years, whichcould still prove to be conservative, especially post rights issue. NIM, however, is unlikely to bea major surprise, with corporates still dominating the loans portfolio. This is aside from the factthat 20.1% of the bank’s assets are still in low yield government bonds. ROE will decline slightlyto 21.2% post rights issue, but this is still at the top end of the range.
Imminent rights issue is an earnings boosterIf the same structure as BBNI’s rights issue is assumed, then the rights issue will probably raisearound Rp12.5trn, in our estimates. There is no earnings dilution. Instead, NPAT could increase onadditional tax benefit. That’s also assuming that all proceeds are placed under marketablesecurities. CAR will increase to 18.4%, with tier 1 capital raised by 3.1%. The LDR is estimated to reach65.9% next year, but it could also be higher; that’s if the company were to use the rights issueproceeds rather than growing its deposits for expansion purposes. We have estimated depositsto grow by 16.1% next year. However, if we were to assume that such deposits growth reaches2.2% next year, much like it has been so far, the LDR may reach 74.5%, or still below the 78% requiredby BI. At next year’s estimated LDR, the bank will see its COF increased by 4.9bps, not much though.NIM is likely to stay at 5.3%, as a result.
Potential write backsAdmittedly, the bank has done well in containing its NPLs, albeit we are still seeing loansdowngraded. So far, written off debts are around Rp32.9trn, which potentially could be reversedin the future. Settlement of Domba Mas’s debt of around Rp1.6trn could be an imminentprovisioning reversal, although it is likely to be amortized over 7 years. The Garuda IPO early nextyear could also be the next immediate earnings driver - a potential write back from the IPO is aroundRp1.3trn. However, until such events materialize, we refrain from incorporating the reversal in ourforecast. In any case, NPLs are likely to stay low next year at around 3.5%.
Risks to our callThere are some risks to consider, including 1) inferior NIM, which could be the result of stiffcompetition, 2) lower than expected loans growth as a result of slower economic growth and 3)higher NPLs due to poor lending policies.
Year end to Dec, Rp bn 2008 2009 2010F 2011F 2012F
Net interest income 15,285 16,777 19,164 21,537 23,573PPOP 10,505 12,430 13,795 16,108 17,905PBT 8,069 10,824 11,722 13,586 15,366Net income 5,313 7,155 8,039 10,406 11,772EPS, Rp 254 341 383 446 505Dividend yield, % 1.4 1.9 2.1 3.5 3.9ROE, % 17.8 21.8 21.3 21.2 19.4PBV, x 4.4 3.8 3.3 2.6 2.3PER, x 25.2 18.8 16.7 14.4 12.7BVPS, Rp 1,460 1,674 1,923 2,478 2,730
Bonny B. Setiawan CFA(62-21) 2352 [email protected]
BUYBloomberg Code BMRI IJPrice, Rp 6,400Mkt Cap Rp bn 133,033Target Price, Rp 8,300
BMRI relative price to JCI Index
Last Recommendation
Rec. Target Price
22-Dec-10 BUY Rp 8,30029-Oct-10 HOLD Rp 6,00026-Jul-10 HOLD Rp 6,00026-Apr-10 HOLD Rp 5,25015-Apr-10 HOLD Rp 5,250
3,500
4,500
5,500
6,500
7,500
12/1
8/09
2/1/
10
3/10
/10
4/19
/10
5/26
/10
7/2/
10
8/9/
10
9/22
/10
10/2
8/10
12/6
/10
-10
0
10
20
BMRI (LHS) Relative to JCI Index (RHS)%Rp
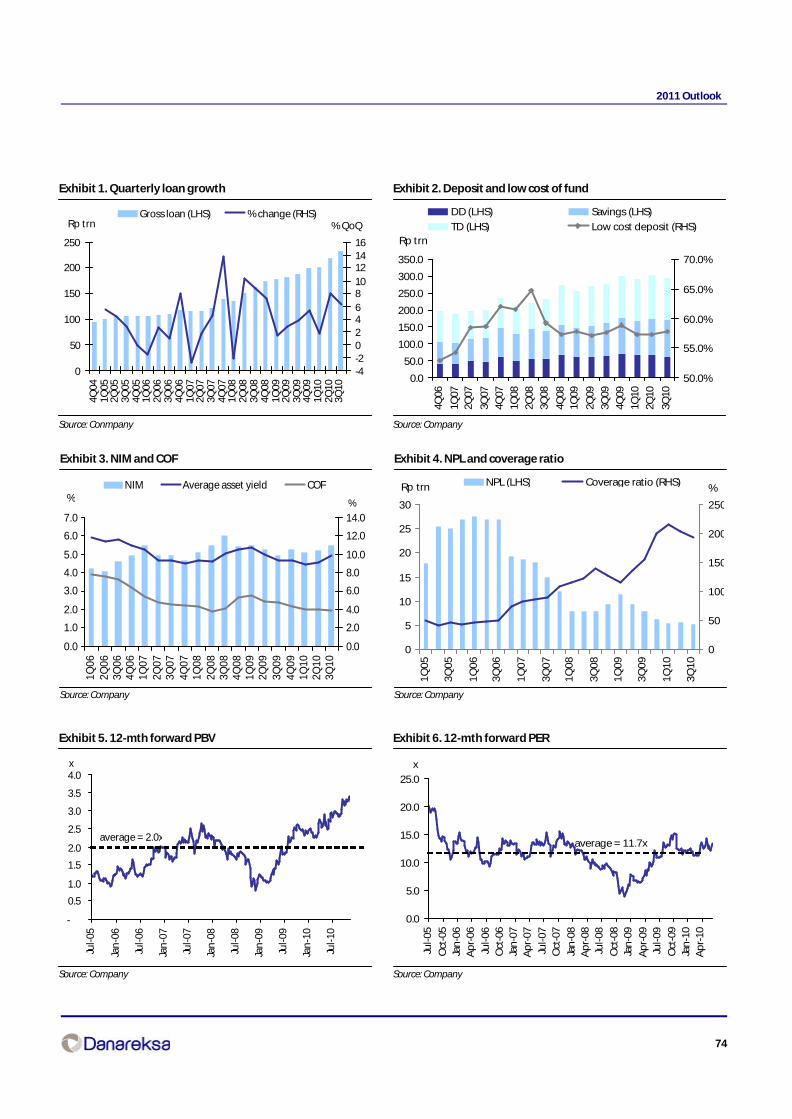
74
2011 Outlook
Exhibit 1. Quarterly loan growth
Source: Conmpany
Exhibit 2. Deposit and low cost of fund
Source: Company
Exhibit 3. NIM and COF
Source: Company
Exhibit 4. NPL and coverage ratio
Source: Company
Exhibit 5. 12-mth forward PBV
Source: Company
Exhibit 6. 12-mth forward PER
Source: Company
0.0
50.0
100.0
150.0
200.0
250.0
300.0
350.0
4Q06
1Q07
2Q07
3Q07
4Q07
1Q08
2Q08
3Q08
4Q08
1Q09
2Q09
3Q09
4Q09
1Q10
2Q10
3Q10
50.0%
55.0%
60.0%
65.0%
70.0%
DD (LHS) Savings (LHS)
TD (LHS) Low cost deposit (RHS)Rp trn
0
50
100
150
200
250
4Q04
1Q05
2Q05
3Q05
4Q05
1Q06
2Q06
3Q06
4Q06
1Q07
2Q07
3Q07
4Q07
1Q08
2Q08
3Q08
4Q08
1Q09
2Q09
3Q09
4Q09
1Q10
2Q10
3Q10
-4-20246810121416
Gross loan (LHS) % change (RHS)Rp trn % QoQ
0.0
1.0
2.0
3.0
4.0
5.0
6.0
7.0
1Q06
2Q06
3Q06
4Q06
1Q07
2Q07
3Q07
4Q07
1Q08
2Q08
3Q08
4Q08
1Q09
2Q09
3Q09
4Q09
1Q10
2Q10
3Q10
0.0
2.0
4.0
6.0
8.0
10.0
12.0
14.0
NIM Average asset yield COF% %
0
5
10
15
20
25
30
1Q
05
3Q
05
1Q
06
3Q
06
1Q
07
3Q
07
1Q
08
3Q
08
1Q
09
3Q
09
1Q
10
3Q
10
Rp trn
0
50
100
150
200
250
%NPL (LHS) Coverage ratio (RHS)
-
0.5
1.0
1.5
2.0
2.5
3.0
3.5
4.0
Jul-0
5
Jan
-06
Jul-0
6
Jan
-07
Jul-0
7
Jan
-08
Jul-0
8
Jan
-09
Jul-0
9
Jan
-10
Jul-1
0
x
average = 2.0x
0.0
5.0
10.0
15.0
20.0
25.0
Jul-
05
Oct
-05
Jan
-06
Ap
r-06
Jul-
06O
ct-0
6Ja
n-0
7A
pr-
07
Jul-
07O
ct-0
7
Jan
-08
Ap
r-08
Jul-
08
Oct
-08
Jan
-09
Ap
r-09
Jul-
09
Oct
-09
Jan
-10
Ap
r-10
x
average = 11.7x
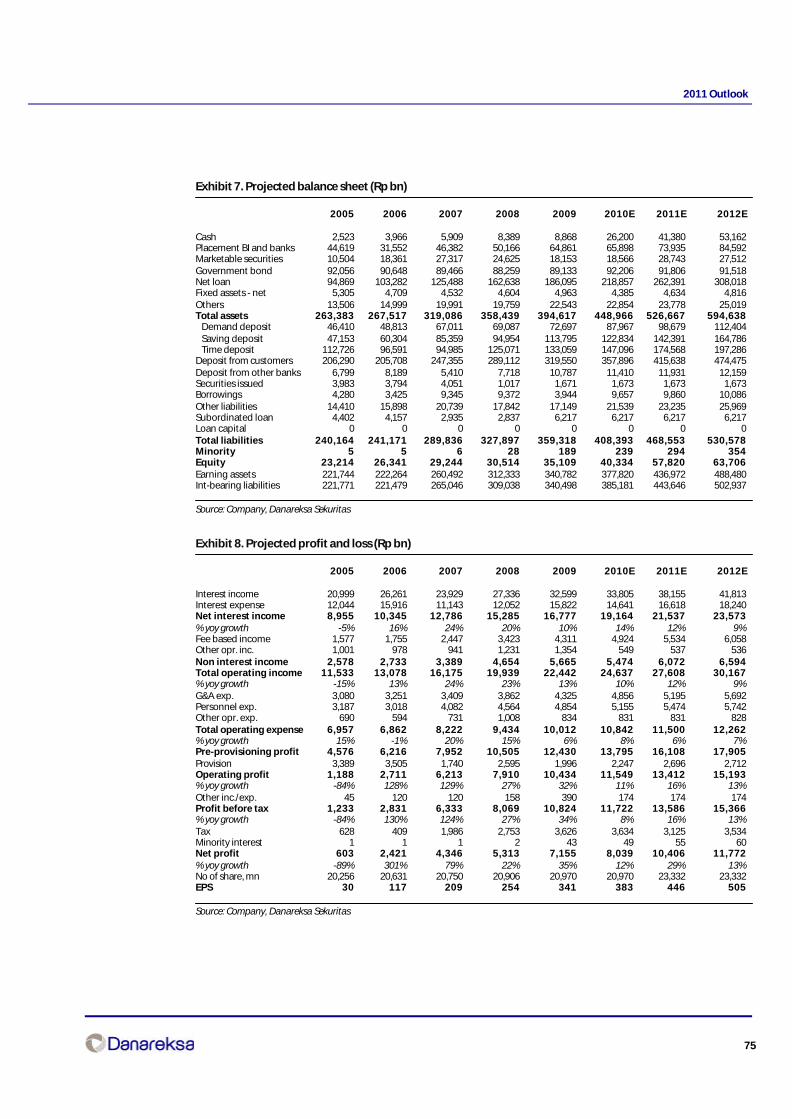
75
2011 Outlook
Exhibit 7. Projected balance sheet (Rp bn)
2005 2006 2007 2008 2009 2010E 2011E 2012E
Cash 2,523 3,966 5,909 8,389 8,868 26,200 41,380 53,162Placement BI and banks 44,619 31,552 46,382 50,166 64,861 65,898 73,935 84,592Marketable securities 10,504 18,361 27,317 24,625 18,153 18,566 28,743 27,512Government bond 92,056 90,648 89,466 88,259 89,133 92,206 91,806 91,518Net loan 94,869 103,282 125,488 162,638 186,095 218,857 262,391 308,018Fixed assets - net 5,305 4,709 4,532 4,604 4,963 4,385 4,634 4,816Others 13,506 14,999 19,991 19,759 22,543 22,854 23,778 25,019Total assets 263,383 267,517 319,086 358,439 394,617 448,966 526,667 594,638 Demand deposit 46,410 48,813 67,011 69,087 72,697 87,967 98,679 112,404 Saving deposit 47,153 60,304 85,359 94,954 113,795 122,834 142,391 164,786 Time deposit 112,726 96,591 94,985 125,071 133,059 147,096 174,568 197,286Deposit from customers 206,290 205,708 247,355 289,112 319,550 357,896 415,638 474,475Deposit from other banks 6,799 8,189 5,410 7,718 10,787 11,410 11,931 12,159Securities issued 3,983 3,794 4,051 1,017 1,671 1,673 1,673 1,673Borrowings 4,280 3,425 9,345 9,372 3,944 9,657 9,860 10,086Other liabilities 14,410 15,898 20,739 17,842 17,149 21,539 23,235 25,969Subordinated loan 4,402 4,157 2,935 2,837 6,217 6,217 6,217 6,217Loan capital 0 0 0 0 0 0 0 0Total liabilities 240,164 241,171 289,836 327,897 359,318 408,393 468,553 530,578Minority 5 5 6 28 189 239 294 354Equity 23,214 26,341 29,244 30,514 35,109 40,334 57,820 63,706Earning assets 221,744 222,264 260,492 312,333 340,782 377,820 436,972 488,480Int-bearing liabilities 221,771 221,479 265,046 309,038 340,498 385,181 443,646 502,937
Source: Company, Danareksa Sekuritas
Exhibit 8. Projected profit and loss (Rp bn)
2005 2006 2007 2008 2009 2010E 2011E 2012E
Interest income 20,999 26,261 23,929 27,336 32,599 33,805 38,155 41,813Interest expense 12,044 15,916 11,143 12,052 15,822 14,641 16,618 18,240Net interest income 8,955 10,345 12,786 15,285 16,777 19,164 21,537 23,573% yoy growth -5% 16% 24% 20% 10% 14% 12% 9%Fee based income 1,577 1,755 2,447 3,423 4,311 4,924 5,534 6,058Other opr. inc. 1,001 978 941 1,231 1,354 549 537 536Non interest income 2,578 2,733 3,389 4,654 5,665 5,474 6,072 6,594Total operating income 11,533 13,078 16,175 19,939 22,442 24,637 27,608 30,167% yoy growth -15% 13% 24% 23% 13% 10% 12% 9%G&A exp. 3,080 3,251 3,409 3,862 4,325 4,856 5,195 5,692Personnel exp. 3,187 3,018 4,082 4,564 4,854 5,155 5,474 5,742Other opr. exp. 690 594 731 1,008 834 831 831 828Total operating expense 6,957 6,862 8,222 9,434 10,012 10,842 11,500 12,262% yoy growth 15% -1% 20% 15% 6% 8% 6% 7%Pre-provisioning profit 4,576 6,216 7,952 10,505 12,430 13,795 16,108 17,905Provision 3,389 3,505 1,740 2,595 1,996 2,247 2,696 2,712Operating profit 1,188 2,711 6,213 7,910 10,434 11,549 13,412 15,193% yoy growth -84% 128% 129% 27% 32% 11% 16% 13%Other inc./exp. 45 120 120 158 390 174 174 174Profit before tax 1,233 2,831 6,333 8,069 10,824 11,722 13,586 15,366% yoy growth -84% 130% 124% 27% 34% 8% 16% 13%Tax 628 409 1,986 2,753 3,626 3,634 3,125 3,534Minority interest 1 1 1 2 43 49 55 60Net profit 603 2,421 4,346 5,313 7,155 8,039 10,406 11,772% yoy growth -89% 301% 79% 22% 35% 12% 29% 13%No of share, mn 20,256 20,631 20,750 20,906 20,970 20,970 23,332 23,332EPS 30 117 209 254 341 383 446 505
Source: Company, Danareksa Sekuritas
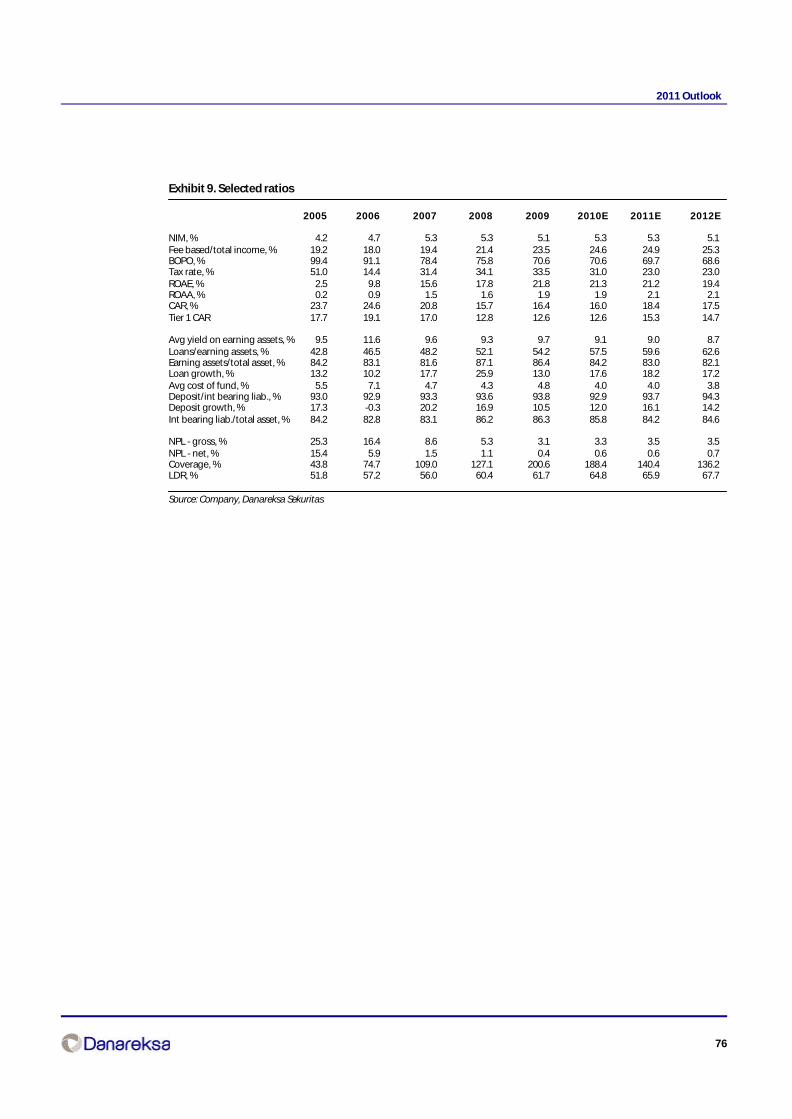
76
2011 Outlook
Exhibit 9. Selected ratios
2005 2006 2007 2008 2009 2010E 2011E 2012E
NIM, % 4.2 4.7 5.3 5.3 5.1 5.3 5.3 5.1Fee based/total income, % 19.2 18.0 19.4 21.4 23.5 24.6 24.9 25.3BOPO, % 99.4 91.1 78.4 75.8 70.6 70.6 69.7 68.6Tax rate, % 51.0 14.4 31.4 34.1 33.5 31.0 23.0 23.0ROAE, % 2.5 9.8 15.6 17.8 21.8 21.3 21.2 19.4ROAA, % 0.2 0.9 1.5 1.6 1.9 1.9 2.1 2.1CAR, % 23.7 24.6 20.8 15.7 16.4 16.0 18.4 17.5Tier 1 CAR 17.7 19.1 17.0 12.8 12.6 12.6 15.3 14.7
Avg yield on earning assets, % 9.5 11.6 9.6 9.3 9.7 9.1 9.0 8.7Loans/earning assets, % 42.8 46.5 48.2 52.1 54.2 57.5 59.6 62.6Earning assets/total asset, % 84.2 83.1 81.6 87.1 86.4 84.2 83.0 82.1Loan growth, % 13.2 10.2 17.7 25.9 13.0 17.6 18.2 17.2Avg cost of fund, % 5.5 7.1 4.7 4.3 4.8 4.0 4.0 3.8Deposit/int bearing liab., % 93.0 92.9 93.3 93.6 93.8 92.9 93.7 94.3Deposit growth, % 17.3 -0.3 20.2 16.9 10.5 12.0 16.1 14.2Int bearing liab./total asset, % 84.2 82.8 83.1 86.2 86.3 85.8 84.2 84.6
NPL - gross, % 25.3 16.4 8.6 5.3 3.1 3.3 3.5 3.5NPL - net, % 15.4 5.9 1.5 1.1 0.4 0.6 0.6 0.7Coverage, % 43.8 74.7 109.0 127.1 200.6 188.4 140.4 136.2LDR, % 51.8 57.2 56.0 60.4 61.7 64.8 65.9 67.7
Source: Company, Danareksa Sekuritas

77
2011 Outlook
Bank Negara IndonesiaTurnaround continues
Ready for growth, BUYWe continue to like the company for its cheap valuation and turnaround story. Post completionof the rights issue, tier 1 CAR is estimated to reach 16.6%, with loans potentially growing in excessof 19.1% p.a. over the next 3 years. Our FY11-12E NPAT estimates are raised by 19-29%, on additional5% tax benefits post-completion of the rights issue, assuming also that all the rights issue proceedsare placed under marketable securities. While we estimate next year’s earnings to grow by 34.3%,the bank’s focus on higher assets quality, meaning therefore lower provisioning charges, mayprove our estimates conservative. Additionally, the company’s aggressive “consumer-centric”transformation will ensure that NPLs are maintained at 4.9% and NIM is sustained at 5.7%. Our TPis therefore raised to Rp5,700, implying 3.1x 2011 PBV, at the high end but justified by the bank’spotential strong loans growth post rights issue. The ROE may also stay at 18.8% in 2011, despitethe high capitalization.
It is all about capital strengtheningCompletion of the rights issue will strengthen CAR by 5.1%, in our estimate, with some Rp10.4trnlikely to be raised. The government’s stake will be diluted to 60%, as a consequence. The lack ofcapital has been a problem for the bank, capping its true potential growth, despite an LDR of amere 67.5% next year. EPS dilution, however, is minimized post rights issue, with the bank eligiblefor an additional 5% tax benefit. In fact, the rights issue gives the bank flexibility in terms of funding.Loans are likely to grow above 18.2% next year, or slightly below the company’s potential 20%.Our conservative estimate takes into account the potential delay in channeling its loans, as thebank’s focus is still on completion of its transformation process.
Asset quality in focusWe have seen the bank cleaning up its bad debt over the past 2 years. Total debts written off havereached Rp22trn, yet recovery has picked up as well. The end goal is to have a 20% recovery rateevery year. NPLs have been well managed, nonetheless, suppressed below 5% despite the modestloans growth this year. With the exception of the middle segment, all other segments have seena decline in NPLs so far. Building up provisioning coverage beyond 100% is also seen as part ofits conservative strategy. Bottom line, we are likely to see the provisioning charges normalize nextyear at around 1.6% of total loans, much less than in the previous two years.
Risks to watchRisks to our call are 1) slower than expected completion of its transformation process and stiffcompetition, which could lead to lower loans growth, 2) greater NPLs as the clean-up processcontinues, in particular in the medium segment and 3) a higher COF on additional MRR as a resultof a lower LDR.
Bonny B. Setiawan CFA(62-21) 2352 [email protected]
BUYBloomberg Code BBNI IJPrice, Rp 3,775Mkt Cap Rp bn 57,083Target Price, Rp 5,700
Year end to Dec, Rp bn 2008 2009 2010F 2011F 2012F
Net interest income 9,912 11,133 12,241 14,145 16,073PPOP 6,233 7,437 7,725 9,048 10,267PBT 1,932 3,444 5,146 6,479 7,619Net income 1,222 2,484 3,857 5,180 6,091EPS, Rp 80 163 252 278 327EPS growth, % 36 103 55 34 18Dividend yield, % 0.2 1.5 3.3 3.7 4.3ROE, % 7.5 14.4 19.2 18.8 17.1PBV, x 3.7 3.0 2.7 2.1 1.9PER, x 47.2 23.2 15.0 13.6 11.5BVPS, Rp 1,010 1,253 1,380 1,828 1,992
BBNI relative price to JCI Index
Last Recommendation
Rec. Target Price
22-Dec-10 BUY Rp 5,70028-Jul-10 BUY Rp 3,65023-Apr-10 BUY Rp 2,80005-Apr10 BUY Rp 2,80017-Feb-10 BUY Rp 2,525
1,500
2,500
3,500
4,500
5,500
12/1
8/09
2/1/
10
3/10
/10
4/19
/10
5/26
/10
7/2/
10
8/9/
10
9/22
/10
10/2
8/10
12/6
/10
-10
10
30
50
70
BBNI (LHS) Relative to JCI Index (RHS)%Rp

78
2011 Outlook
Exhibit 1. Quarterly loan growth
Source: Company
Exhibit 2. Deposit and low cost of fund
Source: Company
Exhibit 3. NIM asset yield
Source: Company
Exhibit 4. NPL coverage ratio
Source: Company
Exhibit 5. 12-mth forward PBV
Source: Company
Exhibit 6. 12-mth forward PER
Source: Company
0
20
40
60
80
100
120
140
4Q04
1Q05
2Q05
3Q05
4Q05
1Q06
2Q06
3Q06
4Q06
1Q07
2Q07
3Q07
4Q07
1Q08
2Q08
3Q08
4Q08
1Q09
2Q09
3Q09
4Q09
1Q10
2Q10
3Q10
Rp trn
-6-4-20246810121416
Gross loan (LHS) change (RHS)%
0
50
100
150
200
1Q05
2Q05
3Q05
4Q05
1Q06
2Q06
3Q06
4Q06
1Q07
2Q07
3Q07
4Q07
1Q08
2Q08
3Q08
4Q08
1Q09
2Q09
3Q09
4Q09
1Q10
2Q10
3Q10
0%
10%
20%
30%
40%
50%
60%
70%
Demand deposit (LHS) Saving (LHS)
Time deposit (LHS) % of low cost fund (RHS)Rp trn
2.0
4.0
6.0
8.0
10.0
12.0
14.0
1Q05
2Q05
3Q05
4Q05
1Q06
2Q06
3Q06
4Q06
1Q07
2Q07
3Q07
4Q07
1Q08
2Q08
3Q08
4Q08
1Q09
2Q09
3Q09
4Q09
1Q10
2Q10
3Q10
% NIM COF Earning asset yield
0
2
4
6
8
10
12
1Q05
3Q05
1Q06
3Q06
1Q07
3Q07
1Q08
3Q08
1Q09
3Q09
1Q10
3Q10
Rp trn
0
20
40
60
80
100
120
140
%NPL (LHS) Coverage ratio (RHS)
-
0.5
1.0
1.5
2.0
2.5
3.0
3.5
4.0
Jan
-03
Jan
-04
Jan
-05
Jan
-06
Jan
-07
Jan
-08
Jan
-09
Jan
-10
x
average = 1.5x
0.0
5.0
10.0
15.0
20.0
25.0
30.0
35.0
40.0
Jan
-03
Jan
-04
Jan
-05
Jan
-06
Jan
-07
Jan
-08
Jan
-09
Jan
-10
x
average = 13.8x
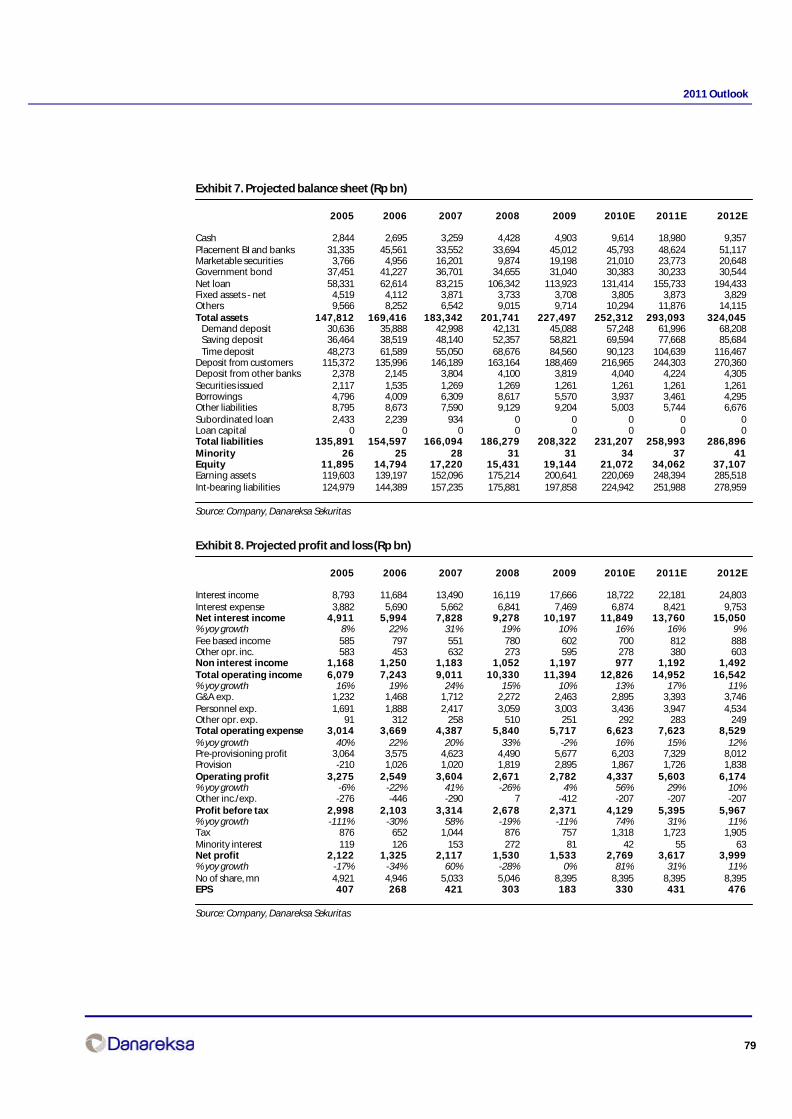
79
2011 Outlook
Exhibit 7. Projected balance sheet (Rp bn)
2005 2006 2007 2008 2009 2010E 2011E 2012E
Cash 2,844 2,695 3,259 4,428 4,903 9,614 18,980 9,357Placement BI and banks 31,335 45,561 33,552 33,694 45,012 45,793 48,624 51,117Marketable securities 3,766 4,956 16,201 9,874 19,198 21,010 23,773 20,648Government bond 37,451 41,227 36,701 34,655 31,040 30,383 30,233 30,544Net loan 58,331 62,614 83,215 106,342 113,923 131,414 155,733 194,433Fixed assets - net 4,519 4,112 3,871 3,733 3,708 3,805 3,873 3,829Others 9,566 8,252 6,542 9,015 9,714 10,294 11,876 14,115Total assets 147,812 169,416 183,342 201,741 227,497 252,312 293,093 324,045 Demand deposit 30,636 35,888 42,998 42,131 45,088 57,248 61,996 68,208 Saving deposit 36,464 38,519 48,140 52,357 58,821 69,594 77,668 85,684 Time deposit 48,273 61,589 55,050 68,676 84,560 90,123 104,639 116,467Deposit from customers 115,372 135,996 146,189 163,164 188,469 216,965 244,303 270,360Deposit from other banks 2,378 2,145 3,804 4,100 3,819 4,040 4,224 4,305Securities issued 2,117 1,535 1,269 1,269 1,261 1,261 1,261 1,261Borrowings 4,796 4,009 6,309 8,617 5,570 3,937 3,461 4,295Other liabilities 8,795 8,673 7,590 9,129 9,204 5,003 5,744 6,676Subordinated loan 2,433 2,239 934 0 0 0 0 0Loan capital 0 0 0 0 0 0 0 0Total liabilities 135,891 154,597 166,094 186,279 208,322 231,207 258,993 286,896Minority 26 25 28 31 31 34 37 41Equity 11,895 14,794 17,220 15,431 19,144 21,072 34,062 37,107Earning assets 119,603 139,197 152,096 175,214 200,641 220,069 248,394 285,518Int-bearing liabilities 124,979 144,389 157,235 175,881 197,858 224,942 251,988 278,959
Source: Company, Danareksa Sekuritas
Exhibit 8. Projected profit and loss (Rp bn)
2005 2006 2007 2008 2009 2010E 2011E 2012E
Interest income 8,793 11,684 13,490 16,119 17,666 18,722 22,181 24,803Interest expense 3,882 5,690 5,662 6,841 7,469 6,874 8,421 9,753Net interest income 4,911 5,994 7,828 9,278 10,197 11,849 13,760 15,050% yoy growth 8% 22% 31% 19% 10% 16% 16% 9%Fee based income 585 797 551 780 602 700 812 888Other opr. inc. 583 453 632 273 595 278 380 603Non interest income 1,168 1,250 1,183 1,052 1,197 977 1,192 1,492Total operating income 6,079 7,243 9,011 10,330 11,394 12,826 14,952 16,542% yoy growth 16% 19% 24% 15% 10% 13% 17% 11%G&A exp. 1,232 1,468 1,712 2,272 2,463 2,895 3,393 3,746Personnel exp. 1,691 1,888 2,417 3,059 3,003 3,436 3,947 4,534Other opr. exp. 91 312 258 510 251 292 283 249Total operating expense 3,014 3,669 4,387 5,840 5,717 6,623 7,623 8,529% yoy growth 40% 22% 20% 33% -2% 16% 15% 12%Pre-provisioning profit 3,064 3,575 4,623 4,490 5,677 6,203 7,329 8,012Provision -210 1,026 1,020 1,819 2,895 1,867 1,726 1,838Operating profit 3,275 2,549 3,604 2,671 2,782 4,337 5,603 6,174% yoy growth -6% -22% 41% -26% 4% 56% 29% 10%Other inc./exp. -276 -446 -290 7 -412 -207 -207 -207Profit before tax 2,998 2,103 3,314 2,678 2,371 4,129 5,395 5,967% yoy growth -111% -30% 58% -19% -11% 74% 31% 11%Tax 876 652 1,044 876 757 1,318 1,723 1,905Minority interest 119 126 153 272 81 42 55 63Net profit 2,122 1,325 2,117 1,530 1,533 2,769 3,617 3,999% yoy growth -17% -34% 60% -28% 0% 81% 31% 11%No of share, mn 4,921 4,946 5,033 5,046 8,395 8,395 8,395 8,395EPS 407 268 421 303 183 330 431 476
Source: Company, Danareksa Sekuritas

80
2011 Outlook
Exhibit 9. Selected ratios
2005 2006 2007 2008 2009 2010E 2011E 2012E
NIM, % 5.9 5.7 5.1 6.1 5.9 5.8 6.0 6.0Fee based/total income, % 16.6 16.7 17.4 18.4 18.1 19.1 19.2 19.6BOPO, % 85.5 85.1 93.3 90.8 85.7 78.9 77.3 75.9Tax rate, % 37.2 32.1 39.1 36.6 27.8 25.0 20.0 20.0ROAE, % 11.4 14.4 5.6 7.5 14.4 19.2 18.8 17.1ROAA, % 1.0 1.2 0.5 0.6 1.2 1.6 1.9 2.0CAR, % 16.0 15.3 15.7 13.5 14.0 13.4 17.8 16.0Tier 1 CAR 8.5 10.0 11.7 9.8 12.8 12.1 16.6 14.8
Avg yield on earning assets, % 10.6 11.3 9.9 9.8 10.0 9.2 9.7 9.4Loans/earning assets, % 48.8 45.0 54.7 60.7 56.8 59.7 62.7 68.1Earning assets/total asset, % 80.9 82.2 83.0 86.9 88.2 87.2 84.7 88.1Loan growth, % 8.3 6.1 33.4 26.3 7.9 15.4 18.2 24.0Avg cost of fund, % 4.5 5.6 4.9 4.0 4.4 3.7 3.9 3.8Deposit/int bearing liab., % 92.3 94.2 93.0 92.8 95.3 96.5 96.9 96.9Deposit growth, % 9.9 17.9 7.5 11.6 15.5 15.1 12.6 10.7Int bearing liab./total asset, % 84.6 85.2 85.8 87.2 87.0 89.2 86.0 86.1
NPL - gross, % 13.7 10.5 8.5 5.0 4.8 4.9 4.9 4.9NPL - net, % 8.4 6.6 4.0 1.7 0.9 1.0 1.0 1.5Coverage, % 50.4 55.1 71.9 101.0 120.1 117.4 112.9 99.2LDR, % 54.3 48.9 60.6 68.6 64.1 64.3 67.5 75.6
Source: Company, Danareksa Sekuritas

81
2011 Outlook
Bank Rakyat IndonesiaSolid business model
Top pick; Buy with a higher TPWe continue to like the bank for its unique business model, specifically in the area of micro lending,high profitability and above average loans growth. ROE has been robust and so has its NIM. Loansgrowth has helped, but also important is the high proportion of its earnings assets. We estimateNPAT to grow strongly by 31.8% next year, mainly due to normalized provisioning charges. Indeed,NPLs have been a major concern this year – specifically in the medium segment, but the bank’sconcerted efforts to clean up its book this year may in fact lead to better asset quality and probablyrecovery. We have raised our DDM derived TP slightly to Rp14,400, mainly on a lower COE, implying4.4x 2011E PBV, which we believe is justified given the bank’s strong ROE of 31.6% and aboveaverage NIM of 8.1%.
High yielding bankWe estimate ROE to be sustained beyond 30% over the next 3 years, buoyed by 22.8% 3-yr CAGRloan growth, which may prove to be conservative. Indeed, the bank has been able to grow its loansby 27.1% over the past 5-years, and may have exceeded this level if the bank had not beenconstrained by funding. The LDR has reached 89.0% as of September 2010, with deposits growinga mediocre 4.0% over the past 10 quarters. Yet, as argued, liquidity is still plenty. The bank hasaround Rp55trn of funds placed in short term liquid assets. This is aside from the potential Rp2-3trn issuance of sub-debt next year. If need be, the bank can actually raise TD as costs have declinedsignificantly. Even then, what the bank could in fact do is to shift its loans towards short durationmicro lending, much like BDMN has done. This would allow the bank to have immediatereinvestment from loan repayment, with greater yields, of course.
Taking a conservative stanceWe estimate NPLs to stay at 3.1% next year, in our view. Our estimate takes into account the recentefforts the bank has taken to curb its high NPLs, including restructuring, as well as stringent loansapproval and monitoring. The highest NPLs have still been booked by the medium segment, butthey seemingly declined in 3Q10. Reflecting the bank’s conservative stance, it has downgradedhalf of its loan portfolio under doubtful categories into loss categories, which could in fact leadus to believe that such significant downgrades are unlikely to happen again next year. Thecoverage ratio is estimated to reach 162.4%, still conservative, we believe. We estimate provisioningcharges to normalize to 2% of its loans next year.
Risks to watchRisks to our call include 1) a higher COF which could be the result of higher funding costs, 2) higherthan expected NPLs which could be due to slow restructuring and hence greater provisioningcharges, 3) declining NIM as competition intensifies and 4) a lack of capital which may preventaggressive expansion.
Year end to Dec, Rp bn 2008 2009 2010F 2011F 2012F
Net interest income 19,651 23,049 28,240 31,634 35,393PPOP 11,190 14,360 17,541 20,019 22,530PBT 8,822 9,891 11,469 15,517 17,973Net income 5,958 7,308 8,831 11,638 13,480EPS, Rp 483 593 717 944 1,094EPS growth, % 23.2 22.7 20.8 31.8 15.8Dividend yield, % 1.2 2.9 2.4 3.2 3.7ROE, % 28.5 29.5 29.3 31.6 30.0PBV, x 5.7 4.6 3.8 3.1 2.6PER, x 21.2 17.3 14.3 10.9 9.4BVPS, Rp 1,814 2,211 2,677 3,291 4,002
Bonny B. Setiawan CFA(62-21) 2352 [email protected]
BUYBloomberg Code BBRI IJPrice, Rp 10,250Mkt Cap Rp bn 125,223Target Price, Rp 14,400
BBRI relative price to JCI Index
Last Recommendation
Rec. Target Price
22-Dec-10 BUY Rp 14,40001-Nov-10 BUY Rp 13,00002-Aug-10 BUY Rp 12,20003-May-10 BUY Rp 9,90022-Apr-10 BUY Rp 9,900
7,000
8,000
9,000
10,000
11,000
12,000
13,000
12/1
8/09
2/1
/10
3/1
0/1
0
4/1
9/1
0
5/2
6/1
0
7/2
/10
8/9
/10
9/2
2/1
0
10/2
8/10
12
/6/1
0
-15
-5
5
15
BBRI (LHS) Relative to JCI Index (RHS)%Rp

82
2011 Outlook
Exhibit 1. Quarterly loan growth
Source: Company
Exhibit 2. Deposit and low cost of fund
Source: Company
Exhibit 3. NIM and COF
Source: Company
Exhibit 4. CAR and LDR
Source: Company
Exhibit 5. 12-mth forward PBV
Source: Company
Exhibit 6. 12-mth forward PER
Source: Company
-0.51.01.52.02.53.03.54.04.55.0
Jan
-04
Jul-
04
Jan
-05
Jul-
05
Jan
-06
Jul-
06
Jan
-07
Jul-
07
Jan
-08
Jul-
08
Jan
-09
Jul-
09
Jan
-10
Jul-
10
x
average = 2.7x
0.02.04.06.08.0
10.012.014.016.018.020.0
Jan
-04
Jul-
04
Jan
-05
Jul-
05
Jan
-06
Jul-
06
Jan
-07
Jul-
07
Jan
-08
Jul-
08
Jan
-09
Jul-
09
Jan
-10
Jul-
10
x
average = 10.2x
0
50
100
150
200
250
1Q05
2Q05
3Q05
4Q05
1Q06
2Q06
3Q06
4Q06
1Q07
2Q07
3Q07
4Q07
1Q08
2Q08
3Q08
4Q08
1Q09
2Q09
3Q09
4Q09
1Q10
2Q10
3Q10
Rp trn
0.0
2.0
4.0
6.0
8.0
10.0
12.0
14.0
16.0
%Loan (LHS) QoQ (RHS)
0
50
100
150
200
250
300
1Q05
2Q05
3Q05
4Q05
1Q06
2Q06
3Q06
4Q06
1Q07
2Q07
3Q07
4Q07
1Q08
2Q08
3Q08
4Q08
1Q09
2Q09
3Q09
4Q09
1Q10
2Q10
3Q10
Rp trn
01020304050607080
%
Demand deposit (LHS) Saving (LHS)Time deposit (LHS) % of low cost of fund (RHS)
0.0
2.0
4.0
6.0
8.0
10.0
12.0
14.0
1Q
04
3Q
04
1Q
05
3Q
05
1Q
06
3Q
06
1Q
07
3Q
07
1Q
08
3Q
08
1Q
09
3Q
09
1Q
10
3Q
10
% NIM COF
0
5
10
15
20
25
1Q04
3Q04
1Q05
3Q05
1Q06
3Q06
1Q07
3Q07
1Q08
3Q08
1Q09
3Q09
1Q10
3Q10
%
0102030405060708090100
%CAR (LHS) LDR (RHS)
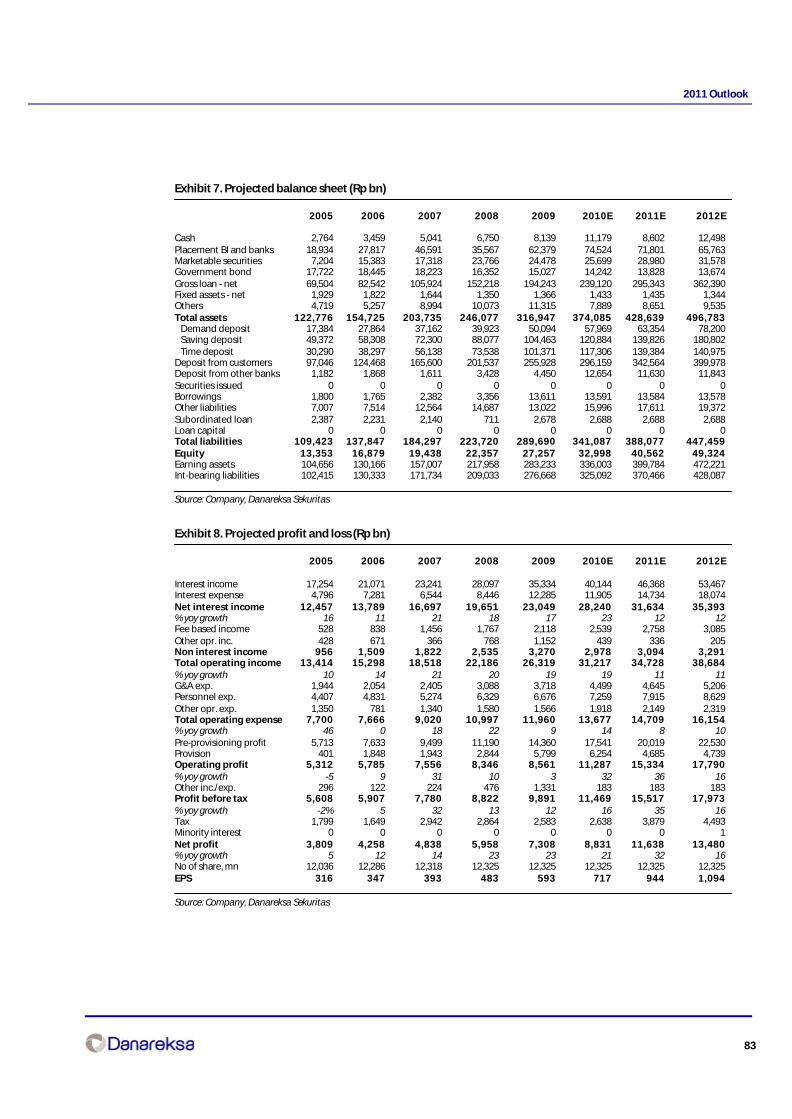
83
2011 Outlook
Exhibit 7. Projected balance sheet (Rp bn)
2005 2006 2007 2008 2009 2010E 2011E 2012E
Cash 2,764 3,459 5,041 6,750 8,139 11,179 8,602 12,498Placement BI and banks 18,934 27,817 46,591 35,567 62,379 74,524 71,801 65,763Marketable securities 7,204 15,383 17,318 23,766 24,478 25,699 28,980 31,578Government bond 17,722 18,445 18,223 16,352 15,027 14,242 13,828 13,674Gross loan - net 69,504 82,542 105,924 152,218 194,243 239,120 295,343 362,390Fixed assets - net 1,929 1,822 1,644 1,350 1,366 1,433 1,435 1,344Others 4,719 5,257 8,994 10,073 11,315 7,889 8,651 9,535Total assets 122,776 154,725 203,735 246,077 316,947 374,085 428,639 496,783 Demand deposit 17,384 27,864 37,162 39,923 50,094 57,969 63,354 78,200 Saving deposit 49,372 58,308 72,300 88,077 104,463 120,884 139,826 180,802 Time deposit 30,290 38,297 56,138 73,538 101,371 117,306 139,384 140,975Deposit from customers 97,046 124,468 165,600 201,537 255,928 296,159 342,564 399,978Deposit from other banks 1,182 1,868 1,611 3,428 4,450 12,654 11,630 11,843Securities issued 0 0 0 0 0 0 0 0Borrowings 1,800 1,765 2,382 3,356 13,611 13,591 13,584 13,578Other liabilities 7,007 7,514 12,564 14,687 13,022 15,996 17,611 19,372Subordinated loan 2,387 2,231 2,140 711 2,678 2,688 2,688 2,688Loan capital 0 0 0 0 0 0 0 0Total liabilities 109,423 137,847 184,297 223,720 289,690 341,087 388,077 447,459Equity 13,353 16,879 19,438 22,357 27,257 32,998 40,562 49,324Earning assets 104,656 130,166 157,007 217,958 283,233 336,003 399,784 472,221Int-bearing liabilities 102,415 130,333 171,734 209,033 276,668 325,092 370,466 428,087
Source: Company, Danareksa Sekuritas
Exhibit 8. Projected profit and loss (Rp bn)
2005 2006 2007 2008 2009 2010E 2011E 2012E
Interest income 17,254 21,071 23,241 28,097 35,334 40,144 46,368 53,467Interest expense 4,796 7,281 6,544 8,446 12,285 11,905 14,734 18,074Net interest income 12,457 13,789 16,697 19,651 23,049 28,240 31,634 35,393% yoy growth 16 11 21 18 17 23 12 12Fee based income 528 838 1,456 1,767 2,118 2,539 2,758 3,085Other opr. inc. 428 671 366 768 1,152 439 336 205Non interest income 956 1,509 1,822 2,535 3,270 2,978 3,094 3,291Total operating income 13,414 15,298 18,518 22,186 26,319 31,217 34,728 38,684% yoy growth 10 14 21 20 19 19 11 11G&A exp. 1,944 2,054 2,405 3,088 3,718 4,499 4,645 5,206Personnel exp. 4,407 4,831 5,274 6,329 6,676 7,259 7,915 8,629Other opr. exp. 1,350 781 1,340 1,580 1,566 1,918 2,149 2,319Total operating expense 7,700 7,666 9,020 10,997 11,960 13,677 14,709 16,154% yoy growth 46 0 18 22 9 14 8 10Pre-provisioning profit 5,713 7,633 9,499 11,190 14,360 17,541 20,019 22,530Provision 401 1,848 1,943 2,844 5,799 6,254 4,685 4,739Operating profit 5,312 5,785 7,556 8,346 8,561 11,287 15,334 17,790% yoy growth -5 9 31 10 3 32 36 16Other inc./exp. 296 122 224 476 1,331 183 183 183Profit before tax 5,608 5,907 7,780 8,822 9,891 11,469 15,517 17,973% yoy growth -2% 5 32 13 12 16 35 16Tax 1,799 1,649 2,942 2,864 2,583 2,638 3,879 4,493Minority interest 0 0 0 0 0 0 0 1Net profit 3,809 4,258 4,838 5,958 7,308 8,831 11,638 13,480% yoy growth 5 12 14 23 23 21 32 16No of share, mn 12,036 12,286 12,318 12,325 12,325 12,325 12,325 12,325EPS 316 347 393 483 593 717 944 1,094
Source: Company, Danareksa Sekuritas

84
2011 Outlook
Exhibit 9. Selected ratios
2005 2006 2007 2008 2009 2010E 2011E 2012E
NIM, % 12.7 11.7 11.6 10.5 9.2 9.1 8.6 8.1Fee based/total income, % 7.2 9.0 11.4 12.0 12.3 12.6 12.8 13.4BOPO, % 70.8 74.4 69.9 72.8 77.8 73.8 69.0 68.7Tax rate, % 32.1 27.9 37.8 32.5 26.1 23.0 25.0 25.0ROAE, % 29.5 28.2 26.6 28.5 29.5 29.3 31.6 30.0ROAA, % 3.3 3.1 2.7 2.6 2.6 2.6 2.9 2.9CAR, % 15.3 18.8 15.8 13.2 13.2 12.8 12.7 12.7Tier 1 CAR 12.8 13.4 12.0 11.1 10.2 10.5 10.6 10.8
Avg yield on earning assets, % 17.0 17.4 15.6 14.4 13.5 12.4 12.1 11.7Loans/earning assets, % 66.4 63.4 67.5 69.8 68.6 71.2 73.9 76.7Earning assets/total asset, % 85.2 84.1 77.1 88.6 89.4 89.8 93.3 95.1Loan growth, % 20.7 19.1 26.5 41.9 28.4 23.6 22.4 22.3Avg cost of fund, % 5.0 6.2 4.3 4.4 5.0 3.9 4.2 4.5Deposit/int bearing liab., % 94.8 95.5 96.4 96.4 92.5 91.1 92.5 93.4Deposit growth, % 17.8 28.3 33.0 21.7 27.0 15.7 15.7 16.8Int bearing liab./total asset, % 83.4 84.2 84.3 84.9 87.3 86.9 86.4 86.2
NPL - gross, % 4.7 4.8 3.4 2.8 3.5 3.5 3.1 3.1NPL - net, % 1.9 1.3 0.9 0.9 1.1 0.9 1.0 1.0Coverage, % 153.4 155.2 177.7 177.6 156.0 170.1 162.4 153.1LDR, % 77.2 71.7 68.1 79.4 80.3 85.8 90.8 95.1
Source: Company, Danareksa Sekuritas
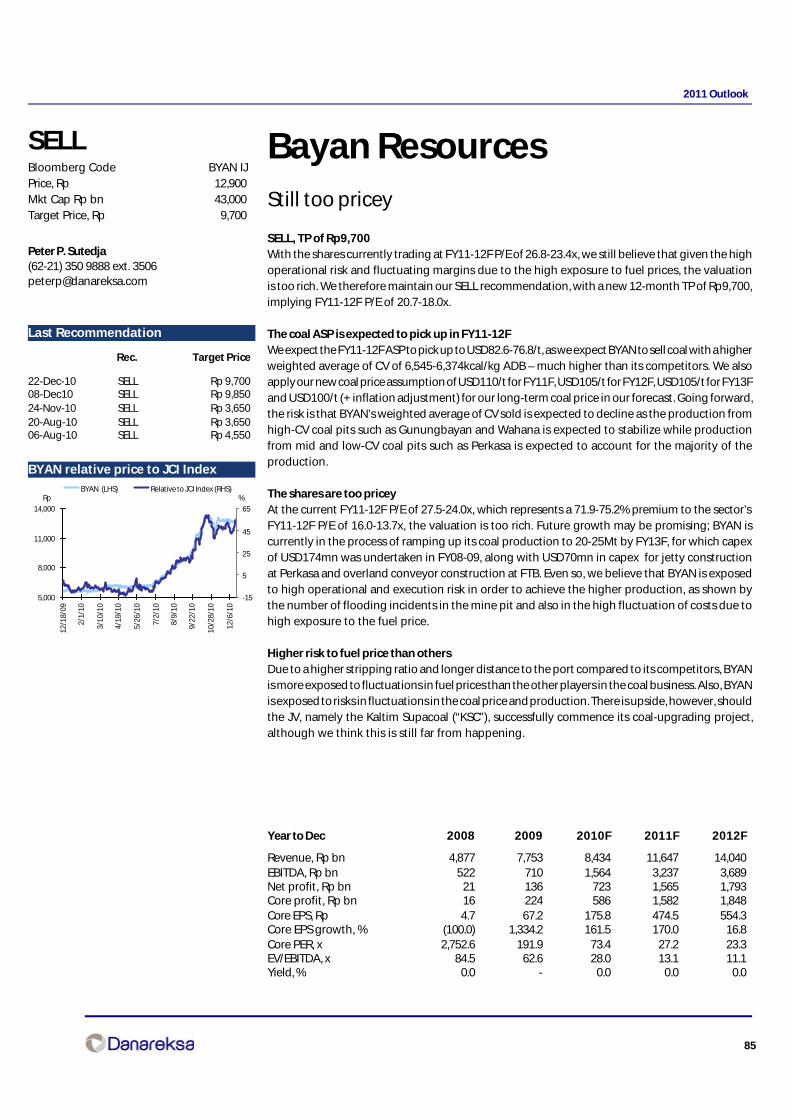
85
2011 Outlook
Bayan ResourcesStill too pricey
SELL, TP of Rp9,700With the shares currently trading at FY11-12F P/E of 26.8-23.4x, we still believe that given the highoperational risk and fluctuating margins due to the high exposure to fuel prices, the valuationis too rich. We therefore maintain our SELL recommendation, with a new 12-month TP of Rp9,700,implying FY11-12F P/E of 20.7-18.0x.
The coal ASP is expected to pick up in FY11-12FWe expect the FY11-12F ASP to pick up to USD82.6-76.8/t, as we expect BYAN to sell coal with a higherweighted average of CV of 6,545-6,374kcal/kg ADB – much higher than its competitors. We alsoapply our new coal price assumption of USD110/t for FY11F, USD105/t for FY12F, USD105/t for FY13Fand USD100/t (+ inflation adjustment) for our long-term coal price in our forecast. Going forward,the risk is that BYAN’s weighted average of CV sold is expected to decline as the production fromhigh-CV coal pits such as Gunungbayan and Wahana is expected to stabilize while productionfrom mid and low-CV coal pits such as Perkasa is expected to account for the majority of theproduction.
The shares are too priceyAt the current FY11-12F P/E of 27.5-24.0x, which represents a 71.9-75.2% premium to the sector’sFY11-12F P/E of 16.0-13.7x, the valuation is too rich. Future growth may be promising; BYAN iscurrently in the process of ramping up its coal production to 20-25Mt by FY13F, for which capexof USD174mn was undertaken in FY08-09, along with USD70mn in capex for jetty constructionat Perkasa and overland conveyor construction at FTB. Even so, we believe that BYAN is exposedto high operational and execution risk in order to achieve the higher production, as shown bythe number of flooding incidents in the mine pit and also in the high fluctuation of costs due tohigh exposure to the fuel price.
Higher risk to fuel price than othersDue to a higher stripping ratio and longer distance to the port compared to its competitors, BYANis more exposed to fluctuations in fuel prices than the other players in the coal business. Also, BYANis exposed to risks in fluctuations in the coal price and production. There is upside, however, shouldthe JV, namely the Kaltim Supacoal (“KSC”), successfully commence its coal-upgrading project,although we think this is still far from happening.
Year to Dec 2008 2009 2010F 2011F 2012F
Revenue, Rp bn 4,877 7,753 8,434 11,647 14,040EBITDA, Rp bn 522 710 1,564 3,237 3,689Net profit, Rp bn 21 136 723 1,565 1,793Core profit, Rp bn 16 224 586 1,582 1,848Core EPS, Rp 4.7 67.2 175.8 474.5 554.3Core EPS growth, % (100.0) 1,334.2 161.5 170.0 16.8Core PER, x 2,752.6 191.9 73.4 27.2 23.3EV/EBITDA, x 84.5 62.6 28.0 13.1 11.1Yield, % 0.0 - 0.0 0.0 0.0
Peter P. Sutedja(62-21) 350 9888 ext. [email protected]
SELLBloomberg Code BYAN IJPrice, Rp 12,900Mkt Cap Rp bn 43,000Target Price, Rp 9,700
Last Recommendation
Rec. Target Price
22-Dec-10 SELL Rp 9,70008-Dec10 SELL Rp 9,85024-Nov-10 SELL Rp 3,65020-Aug-10 SELL Rp 3,65006-Aug-10 SELL Rp 4,550
BYAN relative price to JCI Index
5,000
8,000
11,000
14,000
12/1
8/09
2/1/
10
3/10
/10
4/19
/10
5/26
/10
7/2/
10
8/9/
10
9/22
/10
10/2
8/10
12/6
/10
-15
5
25
45
65
BYAN (LHS) Relative to JCI Index (RHS)%Rp
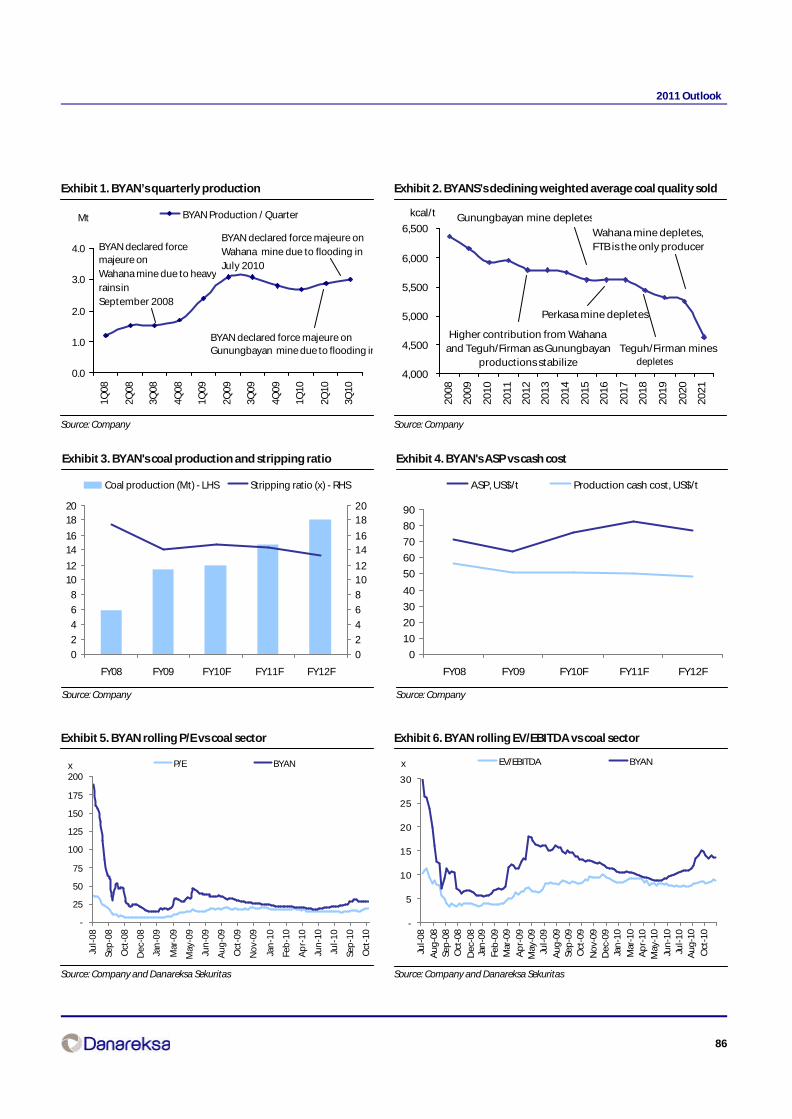
86
2011 Outlook
Exhibit 1. BYAN’s quarterly production
Source: Company
Exhibit 2. BYANS’s declining weighted average coal quality sold
Source: Company
Exhibit 3. BYAN's coal production and stripping ratio
Source: Company
Exhibit 4. BYAN's ASP vs cash cost
Source: Company
Exhibit 5. BYAN rolling P/E vs coal sector
Source: Company and Danareksa Sekuritas
Exhibit 6. BYAN rolling EV/EBITDA vs coal sector
Source: Company and Danareksa Sekuritas
x x
-
25
50
75
100
125
150
175
200
Jul-
08
Sep
-08
Oct
-08
Dec
-08
Jan
-09
Mar
-09
May
-09
Jun
-09
Au
g-0
9
Oct
-09
No
v-09
Jan
-10
Feb
-10
Ap
r-10
Jun
-10
Jul-
10
Sep
-10
Oct
-10
P/E BYAN
-
5
10
15
20
25
30
Jul-
08
Au
g-0
8Se
p-0
8O
ct-0
8
Dec
-08
Jan
-09
Feb
-09
Mar
-09
Ap
r-0
9M
ay-0
9Ju
l-0
9
Au
g-0
9Se
p-0
9O
ct-0
9
No
v-09
Dec
-09
Jan
-10
Mar
-10
Ap
r-1
0M
ay-1
0
Jun
-10
Jul-
10
Au
g-1
0
Oct
-10
EV/EBITDA BYAN
0.0
1.0
2.0
3.0
4.0
1Q08
2Q08
3Q08
4Q08
1Q09
2Q09
3Q09
4Q09
1Q10
2Q10
3Q10
BYAN Production / QuarterMt
BYAN declared force majeure on
Wahana mine due to heavy
rains in
September 2008
BYAN declared force majeure onGunungbayan mine due to flooding in
BYAN declared force majeure on
Wahana mine due to flooding in
July 2010
0
2
4
6
8
1012
1416
1820
FY08 FY09 FY10F FY11F FY12F
0
2
4
6
8
1012
1416
1820
Coal production (Mt) - LHS Stripping ratio (x) - RHS
0
10
20
30
40
50
60
70
80
90
FY08 FY09 FY10F FY11F FY12F
ASP, US$/t Production cash cost, US$/t
4,000
4,500
5,000
5,500
6,000
6,500
20
08
20
09
20
10
20
11
20
12
20
13
20
14
20
15
20
16
20
17
20
18
20
19
20
20
20
21
kcal/t
Higher contribution from Wahana and Teguh/Firman as Gunungbayan
productions stabilize
Gunungbayan mine depletes
Teguh/Firman mines sd
Wahana mine depletes, FTB is the only producer
Perkasa mine depletes
depletes

87
2011 Outlook
Exhibit 7. Profit and Loss (Rp bn)
2008 2009 2010F 2011F 2012F
Sales 4,877 7,753 8,434 11,647 14,040COGS (3,937) (6,614) (6,490) (7,888) (9,635)Gross profit 939 1,139 1,945 3,759 4,404Operating expenses (738) (774) (744) (931) (1,178)Operating profit 201 365 1,200 2,828 3,226EBITDA 522 710 1,564 3,237 3,689Other income/expenses (102) (174) 68 (133) (133)Pre-tax profit 99 191 1,268 2,696 3,094Taxes (60) (35) (507) (1,078) (1,237)Net income before min. interest 38 156 761 1,617 1,856Minority interest (18) (20) (38) (52) (63)Net profit 21 136 723 1,565 1,793Core profit 16 224 586 1,582 1,848
Source: Company and Danareksa Sekuritas
Exhibit 8. Balance Sheet (Rp bn)
2008 2009 2010F 2011F 2012F
Cash 1,532 900 2,053 2,271 3,274Receivables 275 561 455 628 757Inventories 597 724 648 788 962Others 336 130 130 130 130Total current assets 2,739 2,315 3,286 3,817 5,123Property & plant - net 1,923 1,962 2,096 2,415 2,620Other noncurrent assets 2,085 2,903 2,862 2,821 2,782
Account payable 1,104 1,356 1,207 1,467 1,792Short term debt 0 0 0 0 0Others 3,593 1,331 2,020 1,710 1,226Total curr. liabs 4,697 2,688 3,227 3,177 3,019Long term debt 6 1,943 1,703 960 764Other long-term 31 76 82 77 75
Minority Interest 20 59 97 149 212Share capital 333 333 333 333 333Excess paid in 1,763 1,763 1,763 1,763 1,763Retained earnings & others (104) 319 1,039 2,592 4,359Total equity 1,992 2,415 3,136 4,689 6,456
Source: Company and Danareksa Sekuritas

88
2011 Outlook
Exhibit 9. Cash Flow (Rp bn)
2008 2009 2010F 2011F 2012F
Net income 21 136 723 1,565 1,793Depreciation / amortisation 321 345 364 409 463Change in working cap 610 (20) 33 (53) 21Others (1,161) (809) (324) 33 96Operating cash flow (209) (348) 796 1,954 2,373
Capex (1,116) (352) (457) (686) (627)Others (278) (16) 6 (5) (5)Investing cash flow (1,394) (368) (451) (691) (631)
Dividends (120) 0 (2) (12) (26)Debt issues/payment 1,185 99 773 (1,086) (776)Others 1,779 (15) 38 52 63Financing cash flow 2,843 84 809 (1,045) (739)
Net cash flow 1,240 (632) 1,153 218 1,003Cash at begining 291 1,532 900 2,053 2,271Cash at end 1,532 900 2,053 2,271 3,274
Source: Company and Danareksa Sekuritas
Exhibit 10. Selected ratios (%)
2008 2009 2010F 2011F 2012F
Gross margin 19.3 14.7 23.1 32.3 31.4Operating margin 4.1 4.7 14.2 24.3 23.0EBITDA margin 10.7 9.2 18.5 27.8 26.3Net margin 0.4 1.8 8.6 13.4 12.8ROAA 0.4 2.0 9.4 18.1 18.3ROAE 1.9 6.2 26.0 40.0 32.2ROACE 0.7 2.9 13.5 25.3 25.7Gearing 130.4 97.1 89.1 37.1 16.4Net gearing 53.5 59.8 23.6 (11.3) (34.3)
Source: Company and Danareksa Sekuritas
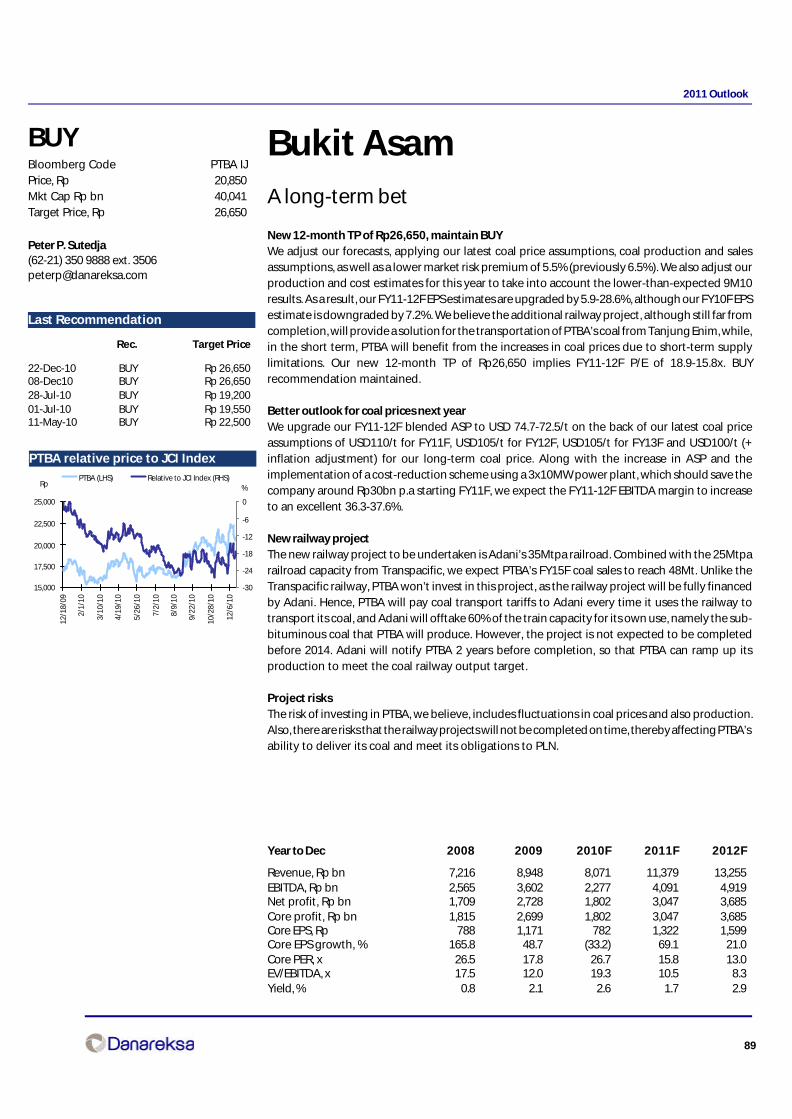
89
2011 Outlook
Bukit AsamA long-term bet
New 12-month TP of Rp26,650, maintain BUYWe adjust our forecasts, applying our latest coal price assumptions, coal production and salesassumptions, as well as a lower market risk premium of 5.5% (previously 6.5%). We also adjust ourproduction and cost estimates for this year to take into account the lower-than-expected 9M10results. As a result, our FY11-12F EPS estimates are upgraded by 5.9-28.6%, although our FY10F EPSestimate is downgraded by 7.2%. We believe the additional railway project, although still far fromcompletion, will provide a solution for the transportation of PTBA’s coal from Tanjung Enim, while,in the short term, PTBA will benefit from the increases in coal prices due to short-term supplylimitations. Our new 12-month TP of Rp26,650 implies FY11-12F P/E of 18.9-15.8x. BUYrecommendation maintained.
Better outlook for coal prices next yearWe upgrade our FY11-12F blended ASP to USD 74.7-72.5/t on the back of our latest coal priceassumptions of USD110/t for FY11F, USD105/t for FY12F, USD105/t for FY13F and USD100/t (+inflation adjustment) for our long-term coal price. Along with the increase in ASP and theimplementation of a cost-reduction scheme using a 3x10MW power plant, which should save thecompany around Rp30bn p.a starting FY11F, we expect the FY11-12F EBITDA margin to increaseto an excellent 36.3-37.6%.
New railway projectThe new railway project to be undertaken is Adani’s 35Mtpa railroad. Combined with the 25Mtparailroad capacity from Transpacific, we expect PTBA’s FY15F coal sales to reach 48Mt. Unlike theTranspacific railway, PTBA won’t invest in this project, as the railway project will be fully financedby Adani. Hence, PTBA will pay coal transport tariffs to Adani every time it uses the railway totransport its coal, and Adani will offtake 60% of the train capacity for its own use, namely the sub-bituminous coal that PTBA will produce. However, the project is not expected to be completedbefore 2014. Adani will notify PTBA 2 years before completion, so that PTBA can ramp up itsproduction to meet the coal railway output target.
Project risksThe risk of investing in PTBA, we believe, includes fluctuations in coal prices and also production.Also, there are risks that the railway projects will not be completed on time, thereby affecting PTBA’sability to deliver its coal and meet its obligations to PLN.
Peter P. Sutedja(62-21) 350 9888 ext. [email protected]
BUYBloomberg Code PTBA IJPrice, Rp 20,850Mkt Cap Rp bn 40,041Target Price, Rp 26,650
Last Recommendation
Rec. Target Price
22-Dec-10 BUY Rp 26,65008-Dec10 BUY Rp 26,65028-Jul-10 BUY Rp 19,20001-Jul-10 BUY Rp 19,55011-May-10 BUY Rp 22,500
PTBA relative price to JCI Index
Year to Dec 2008 2009 2010F 2011F 2012F
Revenue, Rp bn 7,216 8,948 8,071 11,379 13,255EBITDA, Rp bn 2,565 3,602 2,277 4,091 4,919Net profit, Rp bn 1,709 2,728 1,802 3,047 3,685Core profit, Rp bn 1,815 2,699 1,802 3,047 3,685Core EPS, Rp 788 1,171 782 1,322 1,599Core EPS growth, % 165.8 48.7 (33.2) 69.1 21.0Core PER, x 26.5 17.8 26.7 15.8 13.0EV/EBITDA, x 17.5 12.0 19.3 10.5 8.3Yield, % 0.8 2.1 2.6 1.7 2.9
15,000
17,500
20,000
22,500
25,000
12/1
8/09
2/1/
10
3/10
/10
4/19
/10
5/26
/10
7/2/
10
8/9/
10
9/22
/10
10/2
8/10
12/6
/10
-30
-24
-18
-12
-6
0
PTBA (LHS) Relative to JCI Index (RHS)%Rp
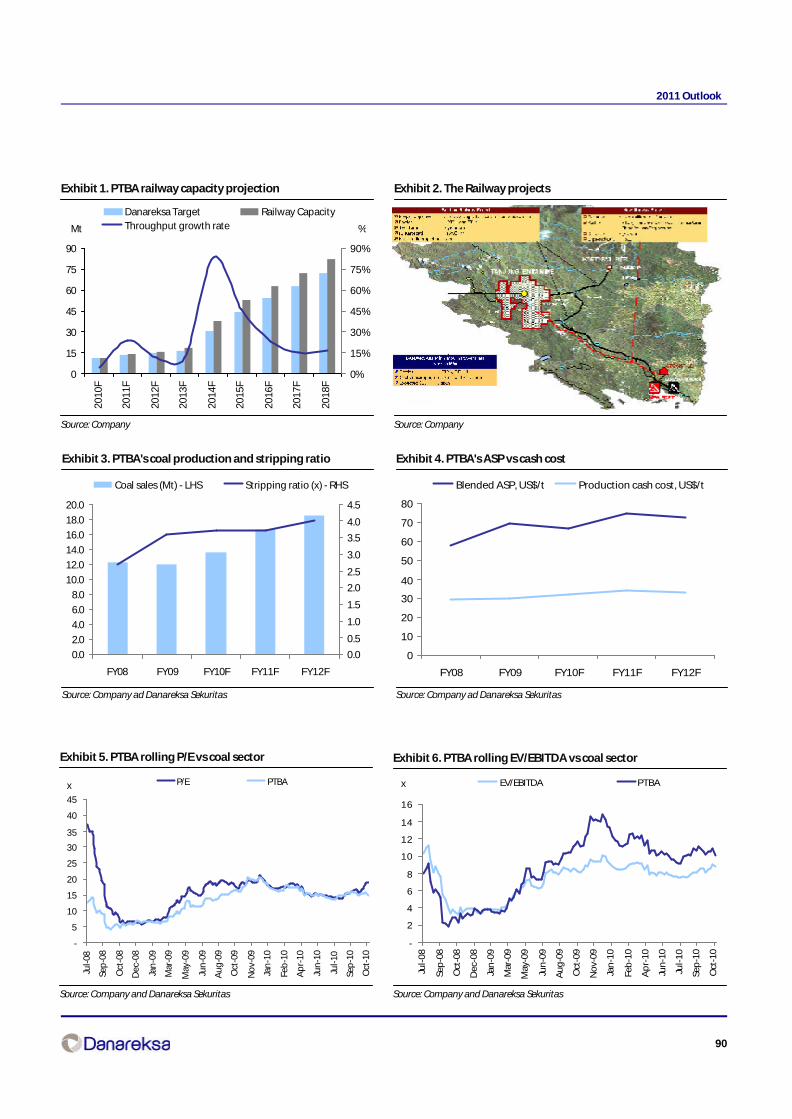
90
2011 Outlook
Exhibit 1. PTBA railway capacity projection
Source: Company
Exhibit 2. The Railway projects
Source: Company
Exhibit 3. PTBA's coal production and stripping ratio
Source: Company ad Danareksa Sekuritas
Exhibit 4. PTBA's ASP vs cash cost
Source: Company ad Danareksa Sekuritas
Exhibit 5. PTBA rolling P/E vs coal sector
Source: Company and Danareksa Sekuritas
Exhibit 6. PTBA rolling EV/EBITDA vs coal sector
Source: Company and Danareksa Sekuritas
x x
-
5
10
15
20
25
30
35
40
45
Jul-0
8
Sep
-08
Oct
-08
Dec
-08
Jan
-09
Mar
-09
May
-09
Jun
-09
Au
g-0
9
Oct
-09
No
v-09
Jan
-10
Feb
-10
Ap
r-10
Jun
-10
Jul-1
0
Sep
-10
Oct
-10
P/E PTBA
-
2
4
6
8
10
12
14
16
Jul-
08
Sep
-08
Oct
-08
Dec
-08
Jan
-09
Mar
-09
May
-09
Jun
-09
Au
g-0
9
Oct
-09
No
v-09
Jan
-10
Feb
-10
Ap
r-1
0
Jun
-10
Jul-
10
Sep
-10
Oct
-10
EV/EBITDA PTBA
0
15
30
45
60
75
90
2010
F
2011
F
2012
F
2013
F
2014
F
2015
F
2016
F
2017
F
2018
F
0%
15%
30%
45%
60%
75%
90%
Danareksa Target Railway CapacityThroughput growth rateMt %
0.0
2.0
4.0
6.0
8.0
10.0
12.0
14.0
16.0
18.0
20.0
FY08 FY09 FY10F FY11F FY12F
0.0
0.5
1.0
1.5
2.0
2.5
3.0
3.5
4.0
4.5
Coal sales (Mt) - LHS Stripping ratio (x) - RHS
0
10
20
30
40
50
60
70
80
FY08 FY09 FY10F FY11F FY12F
Blended ASP, US$/t Production cash cost, US$/t
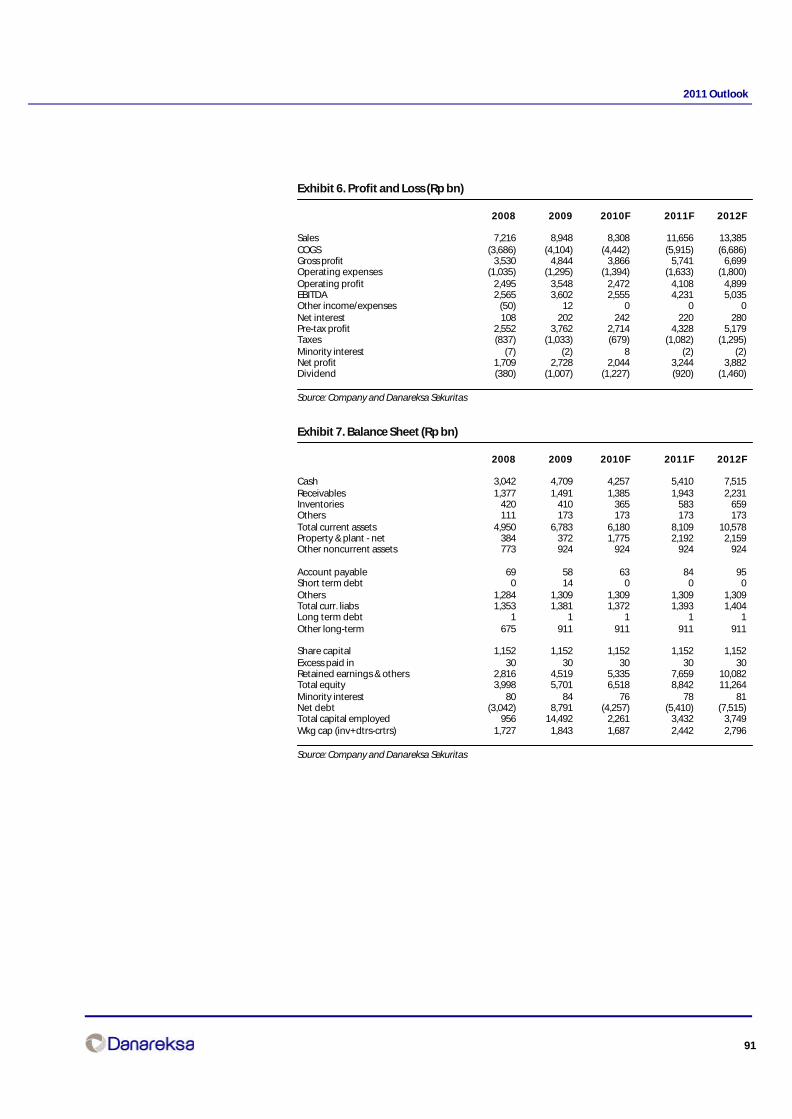
91
2011 Outlook
Exhibit 6. Profit and Loss (Rp bn)
2008 2009 2010F 2011F 2012F
Sales 7,216 8,948 8,308 11,656 13,385COGS (3,686) (4,104) (4,442) (5,915) (6,686)Gross profit 3,530 4,844 3,866 5,741 6,699Operating expenses (1,035) (1,295) (1,394) (1,633) (1,800)Operating profit 2,495 3,548 2,472 4,108 4,899EBITDA 2,565 3,602 2,555 4,231 5,035Other income/expenses (50) 12 0 0 0Net interest 108 202 242 220 280Pre-tax profit 2,552 3,762 2,714 4,328 5,179Taxes (837) (1,033) (679) (1,082) (1,295)Minority interest (7) (2) 8 (2) (2)Net profit 1,709 2,728 2,044 3,244 3,882Dividend (380) (1,007) (1,227) (920) (1,460)
Source: Company and Danareksa Sekuritas
Exhibit 7. Balance Sheet (Rp bn)
2008 2009 2010F 2011F 2012F
Cash 3,042 4,709 4,257 5,410 7,515Receivables 1,377 1,491 1,385 1,943 2,231Inventories 420 410 365 583 659Others 111 173 173 173 173Total current assets 4,950 6,783 6,180 8,109 10,578Property & plant - net 384 372 1,775 2,192 2,159Other noncurrent assets 773 924 924 924 924
Account payable 69 58 63 84 95Short term debt 0 14 0 0 0Others 1,284 1,309 1,309 1,309 1,309Total curr. liabs 1,353 1,381 1,372 1,393 1,404Long term debt 1 1 1 1 1Other long-term 675 911 911 911 911
Share capital 1,152 1,152 1,152 1,152 1,152Excess paid in 30 30 30 30 30Retained earnings & others 2,816 4,519 5,335 7,659 10,082Total equity 3,998 5,701 6,518 8,842 11,264Minority interest 80 84 76 78 81Net debt (3,042) 8,791 (4,257) (5,410) (7,515)Total capital employed 956 14,492 2,261 3,432 3,749Wkg cap (inv+dtrs-crtrs) 1,727 1,843 1,687 2,442 2,796
Source: Company and Danareksa Sekuritas

92
2011 Outlook
Exhibit 8. Cash Flow (Rp bn)
2008 2009 2010F 2011F 2012F
Net income 1,709 2,728 2,044 3,244 3,882Depreciation / amortisation 70 54 83 123 136Change in working cap (358) (139) 143 (755) (353)Others 189 93 0 0 0Operating cash flow 1,610 2,736 2,270 2,612 3,664
Capex (86) (58) (1,487) (540) (102)Net acquisitions (343) (10) 0 0 0Others 0 0 0 0 0Investing cash flow (429) (67) (1,487) (540) (102)
Dividends (380) (1,007) (1,227) (920) (1,460)Debt issues/payment 0 0 0 0 0Others 0 0 (8) 2 2Financing cash flow (380) (1,007) (1,236) (918) (1,457)
Net cash flow 800 1,661 (452) 1,154 2,104Cash at begining 2,223 3,042 4,709 4,257 5,410Adjustments 19 6 0 0 0Cash at end 3,042 4,709 4,257 5,410 7,515
Source: Company and Danareksa Sekuritas
Exhibit 9. Selected ratios (%)
2008 2009 2010F 2011F 2012F
Gross margin 48.9 54.1 46.5 49.3 50.0Operating margin 34.6 39.7 29.8 35.2 36.6EBITDA margin 35.5 40.3 30.8 36.3 37.6Net margin 23.7 30.5 24.6 27.8 29.0ROAA 33.9 38.5 24.1 32.3 31.2ROAE 51.2 56.2 33.5 42.2 38.6Current ratio 3.7 4.9 4.5 5.8 7.5Net gearing -76.1 -82.4 -65.3 -61.2 -66.7
Source: Company and Danareksa Sekuritas
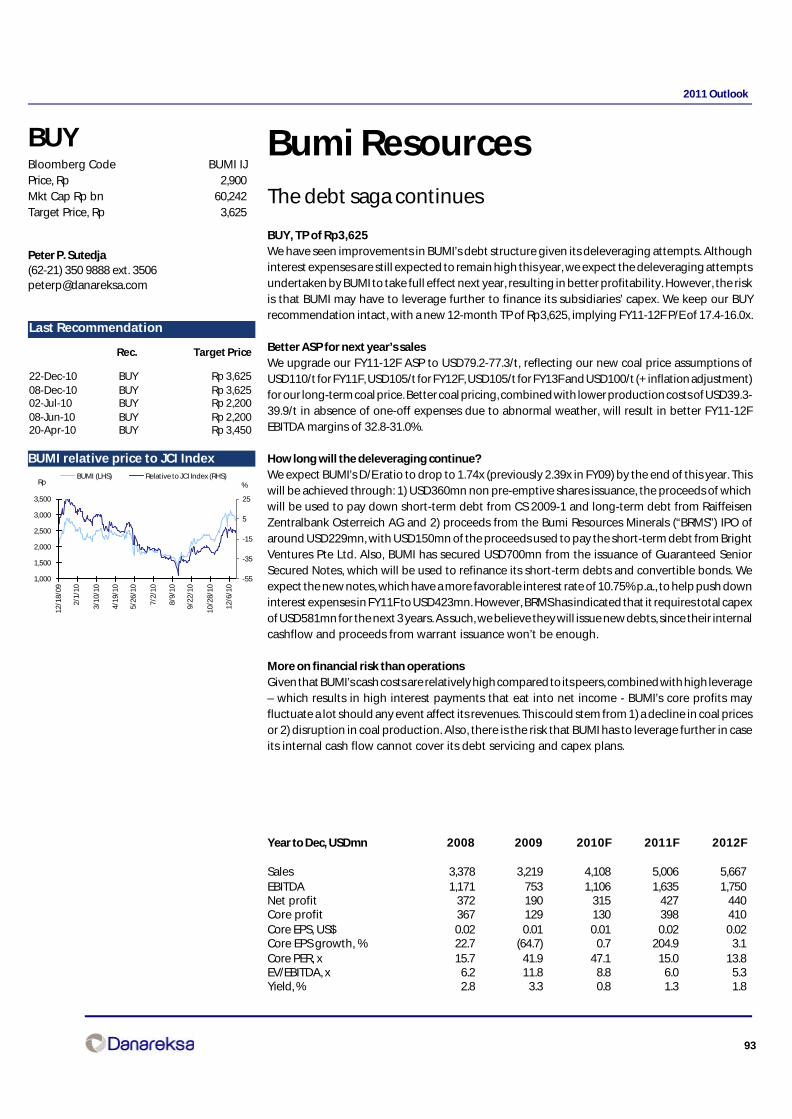
93
2011 Outlook
Bumi ResourcesThe debt saga continues
BUY, TP of Rp3,625We have seen improvements in BUMI’s debt structure given its deleveraging attempts. Althoughinterest expenses are still expected to remain high this year, we expect the deleveraging attemptsundertaken by BUMI to take full effect next year, resulting in better profitability. However, the riskis that BUMI may have to leverage further to finance its subsidiaries’ capex. We keep our BUYrecommendation intact, with a new 12-month TP of Rp3,625, implying FY11-12F P/E of 17.4-16.0x.
Better ASP for next year’s salesWe upgrade our FY11-12F ASP to USD79.2-77.3/t, reflecting our new coal price assumptions ofUSD110/t for FY11F, USD105/t for FY12F, USD105/t for FY13F and USD100/t (+ inflation adjustment)for our long-term coal price. Better coal pricing, combined with lower production costs of USD39.3-39.9/t in absence of one-off expenses due to abnormal weather, will result in better FY11-12FEBITDA margins of 32.8-31.0%.
How long will the deleveraging continue?We expect BUMI’s D/E ratio to drop to 1.74x (previously 2.39x in FY09) by the end of this year. Thiswill be achieved through: 1) USD360mn non pre-emptive shares issuance, the proceeds of whichwill be used to pay down short-term debt from CS 2009-1 and long-term debt from RaiffeisenZentralbank Osterreich AG and 2) proceeds from the Bumi Resources Minerals (“BRMS”) IPO ofaround USD229mn, with USD150mn of the proceeds used to pay the short-term debt from BrightVentures Pte Ltd. Also, BUMI has secured USD700mn from the issuance of Guaranteed SeniorSecured Notes, which will be used to refinance its short-term debts and convertible bonds. Weexpect the new notes, which have a more favorable interest rate of 10.75% p.a., to help push downinterest expenses in FY11F to USD423mn. However, BRMS has indicated that it requires total capexof USD581mn for the next 3 years. As such, we believe they will issue new debts, since their internalcashflow and proceeds from warrant issuance won’t be enough.
More on financial risk than operationsGiven that BUMI’s cash costs are relatively high compared to its peers, combined with high leverage– which results in high interest payments that eat into net income - BUMI’s core profits mayfluctuate a lot should any event affect its revenues. This could stem from 1) a decline in coal pricesor 2) disruption in coal production. Also, there is the risk that BUMI has to leverage further in caseits internal cash flow cannot cover its debt servicing and capex plans.
Year to Dec, USDmn 2008 2009 2010F 2011F 2012F
Sales 3,378 3,219 4,108 5,006 5,667EBITDA 1,171 753 1,106 1,635 1,750Net profit 372 190 315 427 440Core profit 367 129 130 398 410Core EPS, US$ 0.02 0.01 0.01 0.02 0.02Core EPS growth, % 22.7 (64.7) 0.7 204.9 3.1Core PER, x 15.7 41.9 47.1 15.0 13.8EV/EBITDA, x 6.2 11.8 8.8 6.0 5.3Yield, % 2.8 3.3 0.8 1.3 1.8
BUYBloomberg Code BUMI IJPrice, Rp 2,900Mkt Cap Rp bn 60,242Target Price, Rp 3,625
Peter P. Sutedja(62-21) 350 9888 ext. [email protected]
Last Recommendation
Rec. Target Price
22-Dec-10 BUY Rp 3,62508-Dec-10 BUY Rp 3,62502-Jul-10 BUY Rp 2,20008-Jun-10 BUY Rp 2,20020-Apr-10 BUY Rp 3,450
BUMI relative price to JCI Index
1,000
1,500
2,000
2,500
3,000
3,500
12/1
8/09
2/1/
10
3/10
/10
4/19
/10
5/26
/10
7/2/
10
8/9/
10
9/22
/10
10/2
8/10
12/6
/10
-55
-35
-15
5
25
BUMI (LHS) Relative to JCI Index (RHS)%Rp
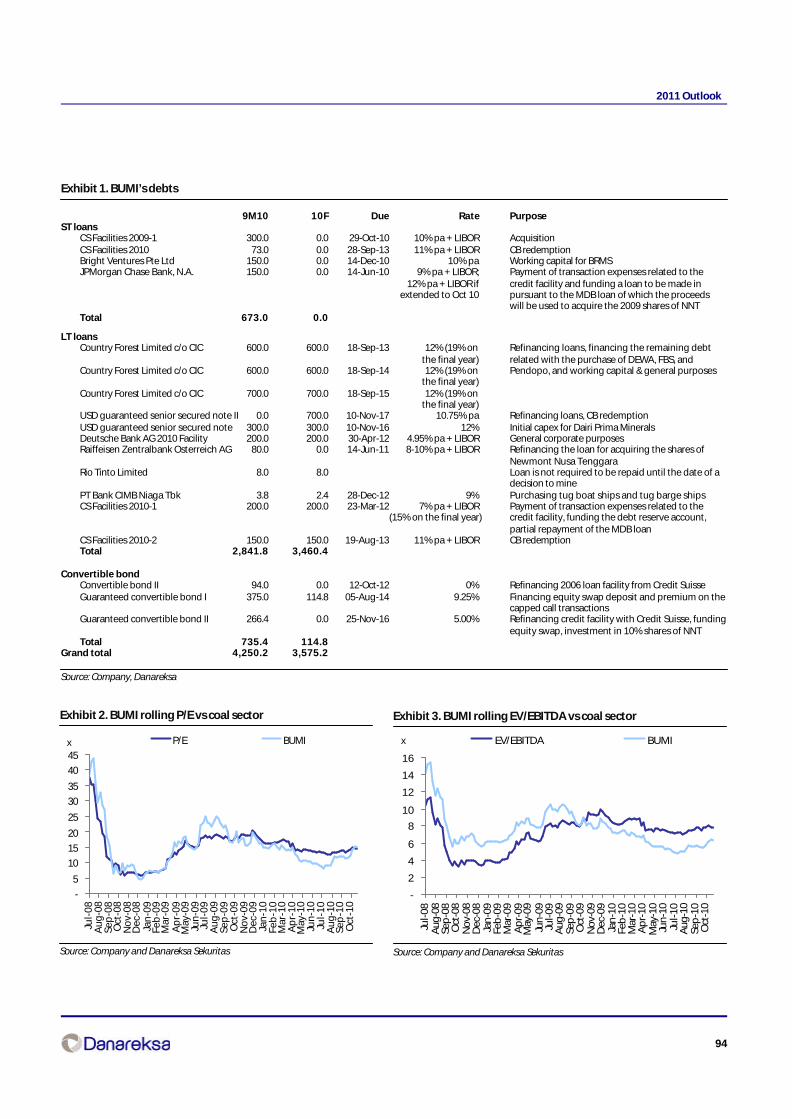
94
2011 Outlook
Exhibit 1. BUMI’s debts
9M10 10F Due Rate PurposeST loans
CS Facilities 2009-1 300.0 0.0 29-Oct-10 10% pa + LIBOR AcquisitionCS Facilities 2010 73.0 0.0 28-Sep-13 11% pa + LIBOR CB redemptionBright Ventures Pte Ltd 150.0 0.0 14-Dec-10 10% pa Working capital for BRMSJPMorgan Chase Bank, N.A. 150.0 0.0 14-Jun-10 9% pa + LIBOR; Payment of transaction expenses related to the
12% pa + LIBOR if credit facility and funding a loan to be made inextended to Oct 10 pursuant to the MDB loan of which the proceeds
will be used to acquire the 2009 shares of NNTTotal 673.0 0.0
LT loansCountry Forest Limited c/o CIC 600.0 600.0 18-Sep-13 12% (19% on Refinancing loans, financing the remaining debt
the final year) related with the purchase of DEWA, FBS, andCountry Forest Limited c/o CIC 600.0 600.0 18-Sep-14 12% (19% on Pendopo, and working capital & general purposes
the final year)Country Forest Limited c/o CIC 700.0 700.0 18-Sep-15 12% (19% on
the final year)USD guaranteed senior secured note II 0.0 700.0 10-Nov-17 10.75% pa Refinancing loans, CB redemptionUSD guaranteed senior secured note 300.0 300.0 10-Nov-16 12% Initial capex for Dairi Prima MineralsDeutsche Bank AG 2010 Facility 200.0 200.0 30-Apr-12 4.95% pa + LIBOR General corporate purposesRaiffeisen Zentralbank Osterreich AG 80.0 0.0 14-Jun-11 8-10% pa + LIBOR Refinancing the loan for acquiring the shares of
Newmont Nusa TenggaraRio Tinto Limited 8.0 8.0 Loan is not required to be repaid until the date of a
decision to minePT Bank CIMB Niaga Tbk 3.8 2.4 28-Dec-12 9% Purchasing tug boat ships and tug barge shipsCS Facilities 2010-1 200.0 200.0 23-Mar-12 7% pa + LIBOR Payment of transaction expenses related to the
(15% on the final year) credit facility, funding the debt reserve account,partial repayment of the MDB loan
CS Facilities 2010-2 150.0 150.0 19-Aug-13 11% pa + LIBOR CB redemptionTotal 2,841.8 3,460.4
Convertible bondConvertible bond II 94.0 0.0 12-Oct-12 0% Refinancing 2006 loan facility from Credit SuisseGuaranteed convertible bond I 375.0 114.8 05-Aug-14 9.25% Financing equity swap deposit and premium on the
capped call transactionsGuaranteed convertible bond II 266.4 0.0 25-Nov-16 5.00% Refinancing credit facility with Credit Suisse, funding
equity swap, investment in 10% shares of NNTTotal 735.4 114.8
Grand total 4,250.2 3,575.2
Source: Company, Danareksa
Exhibit 2. BUMI rolling P/E vs coal sector
Source: Company and Danareksa Sekuritas
Exhibit 3. BUMI rolling EV/EBITDA vs coal sector
Source: Company and Danareksa Sekuritas
x x
-
5
10
15
20
25
30
35
40
45
Jul-
08
Au
g-0
8Se
p-0
8O
ct-0
8N
ov-
08D
ec-0
8Ja
n-0
9Fe
b-0
9M
ar-0
9A
pr-
09M
ay-0
9Ju
n-0
9Ju
l-0
9A
ug
-09
Sep
-09
Oct
-09
No
v-09
Dec
-09
Jan
-10
Feb
-10
Mar
-10
Ap
r-10
May
-10
Jun
-10
Jul-
10
Au
g-1
0Se
p-1
0O
ct-1
0
P/E BUMI
-
2
4
6
8
10
12
14
16
Jul-
08A
ug-0
8Se
p-0
8O
ct-0
8N
ov-
08D
ec-0
8Ja
n-0
9Fe
b-0
9M
ar-0
9A
pr-
09M
ay-0
9Ju
n-0
9Ju
l-09
Aug
-09
Sep
-09
Oct
-09
No
v-09
Dec
-09
Jan
-10
Feb
-10
Mar
-10
Ap
r-10
May
-10
Jun
-10
Jul-
10A
ug-1
0Se
p-1
0O
ct-1
0
EV/EBITDA BUMI

95
2011 Outlook
Exhibit 4. Profit & loss (USS mn)
2008 2009 2010F 2011F 2012F
Sales 3,378 3,219 4,108 5,006 5,667COGS (1,766) (2,116) (2,601) (2,933) (3,450)Gross profit 1,613 1,104 1,507 2,073 2,217
Operating expenses (511) (465) (515) (588) (648)Operating profit 1,102 638 992 1,485 1,569EBITDA 1,171 753 1,106 1,635 1,750Other income/expenses (69) (121) (273) (389) (441)Pre-tax profit 1,033 518 719 1,096 1,128Taxes (489) (234) (324) (493) (508)Minority interest (172) (93) (81) (175) (181)Net profit 372 190 315 427 440Core profit 367 129 130 398 410
Source: Company and Danareksa Sekuritas
Exhibit 5. Balance sheet (USS mn)
2008 2009 2010F 2011F 2012F
Cash 172 60 47 164 116Receivables 272 754 581 731 827Inventories 153 199 182 218 256Others 1,036 1,038 1,153 1,153 1,153Total current assets 1,633 2,052 1,963 2,265 2,353Property & plant - net 1,164 1,473 1,858 2,448 2,791Other noncurrent assets 2,438 3,887 3,965 4,024 4,093
Account payable 865 1,084 221 249 293Short term debt 80 400 0 115 125Others 1,158 632 611 1,132 1,360Total curr. liabs 2,103 2,115 832 1,496 1,778Long term debt 1,233 3,258 3,875 3,595 3,086Other long-term 381 441 527 530 532
Minority Interest 353 126 436 83 419Share capital 1,401 1,401 1,500 1,500 1,500Excess paid in 123 71 326 326 326Retained earnings & others (711) (126) (145) 1,125 1,178Total equity 1,165 1,471 2,117 3,034 3,423
Source: Company and Danareksa Sekuritas
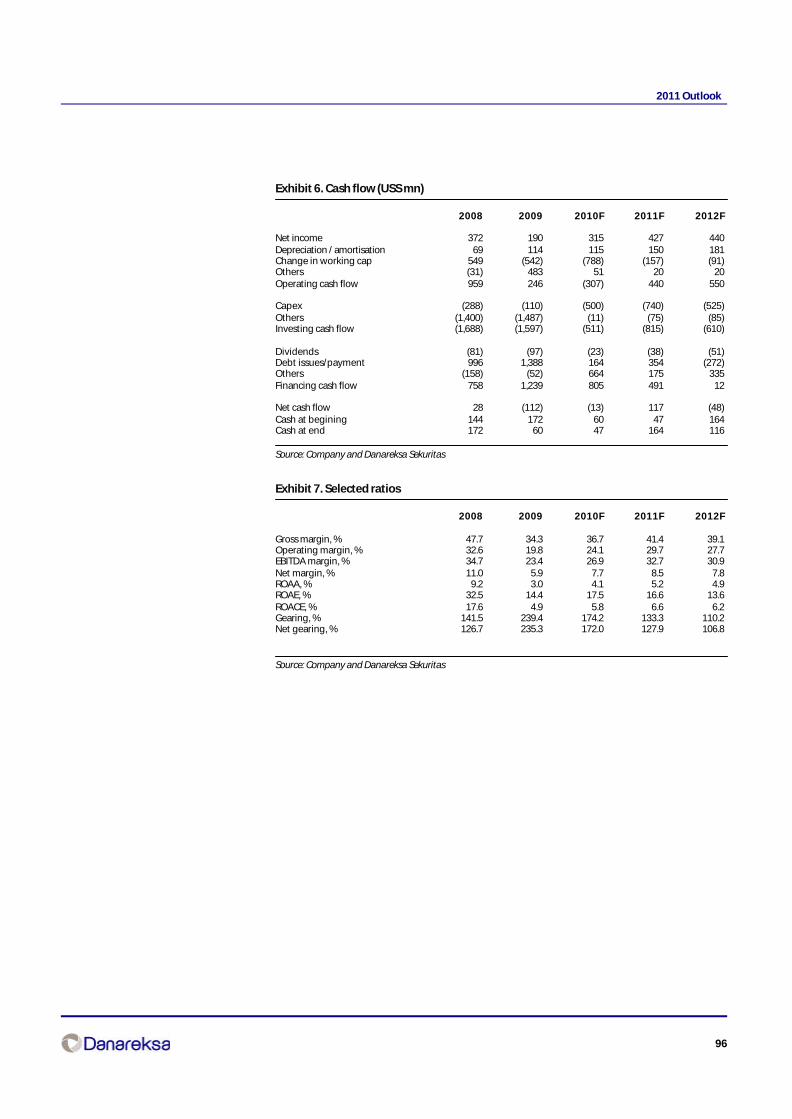
96
2011 Outlook
Exhibit 6. Cash flow (USS mn)
2008 2009 2010F 2011F 2012F
Net income 372 190 315 427 440Depreciation / amortisation 69 114 115 150 181Change in working cap 549 (542) (788) (157) (91)Others (31) 483 51 20 20Operating cash flow 959 246 (307) 440 550
Capex (288) (110) (500) (740) (525)Others (1,400) (1,487) (11) (75) (85)Investing cash flow (1,688) (1,597) (511) (815) (610)
Dividends (81) (97) (23) (38) (51)Debt issues/payment 996 1,388 164 354 (272)Others (158) (52) 664 175 335Financing cash flow 758 1,239 805 491 12
Net cash flow 28 (112) (13) 117 (48)Cash at begining 144 172 60 47 164Cash at end 172 60 47 164 116
Source: Company and Danareksa Sekuritas
Exhibit 7. Selected ratios
2008 2009 2010F 2011F 2012F
Gross margin, % 47.7 34.3 36.7 41.4 39.1Operating margin, % 32.6 19.8 24.1 29.7 27.7EBITDA margin, % 34.7 23.4 26.9 32.7 30.9Net margin, % 11.0 5.9 7.7 8.5 7.8ROAA, % 9.2 3.0 4.1 5.2 4.9ROAE, % 32.5 14.4 17.5 16.6 13.6ROACE, % 17.6 4.9 5.8 6.6 6.2Gearing, % 141.5 239.4 174.2 133.3 110.2Net gearing, % 126.7 235.3 172.0 127.9 106.8
Source: Company and Danareksa Sekuritas

97
2011 Outlook
Lydia Suwandi(62-21) 350 9888 ext. [email protected]
BUYBloomberg Code BSDE IJPrice, Rp 980Mkt Cap Rp bn 10,716Target Price, Rp 1,160
Last Recommendation
Rec. Target Price
22-Dec-10 BUY Rp 1,16028-Sep-10 BUY Rp 1,160
Bumi Serpong DamaiMaking acquisitions
Maintain BUY, TP of Rp1,160Post rights issue, BSDE’s market cap will hit Rp 15.9Trn, the highest among its peers. Nonetheless,the company has not finalized the shareholders’ structure post rights yet. We keep our forecastintact and SOTP derived TP of Rp 1,160/share, implying potential upside of 18% from the currentshare price with PE11F of 23.7x, PBV11F of 4.1x and a 30% discount to NAV.
Rp 4.99Trn rights issueThe company’s rights issue was finalized at Rp760/share involving the issuance of 6,561mn newshares (10 old: 6 new) – some 37.5% dilution. The proceeds will be used for: 1) acquiring a 85.3%stake in DUTI - 3.47Trn, 2) acquiring a 55% stake in Sinar Mas Wisesa – Rp 387bn, 3) acquiring a 60%stake in Sinar Mas Teladan - Rp 501bn and 4) for working capital – Rp 640bn. The Sinarmas groupwill exercise its entire allotment. Hence, its ownership of 53.4% in BSDE will not change.
Dilutive or not?Our preliminary view is that the acquisition is not really dilutive. This is considering that theacquisition cost of DUTI is slightly above its equity of Rp2.7trn, based on annualized numbers. Itis at 1.3x PBV10F or slightly below the 1.4x PBV10F implied by the current market price. Meanwhile,BSDE is currently trading at a far higher multiple of 4.0x PBV10F. The trading PER multiple is alsonot dilutive, since BSDE trades at 28.2x and DUTI is at somewhere around 15.5x. Post acquisition,BSDE will have recurring based income that we believe is going to stabilize the company’s earningsduring any possible turmoil of the property cycle. Management in house revenues for FY11F areestimated to reach 2.7Trn with 24-25% of the total contributed by recurring based businesses.
Marketing sales exceed the targetBSDE’s pre-sales in Nov’10 have hit Rp 2.25Trn, 12.5% higher than the company’s previous targetof Rp 2Trn. This includes 3Ha of land sold to Unilever, a well known multinational companyproducing consumer goods. They will build their headquarters office inside BSDE’s office park(25Ha in size). The acquisition was done at a price of Rp 2.5mn/sqm, at a discount to the currentland selling price of over Rp 3mn/sqm. We believe the deal will bring further benefits to thecompany, in terms of creating more interest in the township as well as unlocking the value of thecompany’s planned green office park.
Risks to our callRisks to our call are: 1) slow bureaucratic decision making due to consolidation at the managementlevel, 2) higher inflation and therefore an increase in the benchmark rate, 3) possible economicslowdown that would curb consumer purchasing power
Year to Dec 2008 2009 2010F 2011F 2012F
Revenues, Rp bn 1,386 1,271 1,471 1,690 1,977Gross profit, Rp bn 642 633 817 1,012 1,281EBITDA, Rp bn 429 475 571 724 924EBIT, Rp bn 412 456 549 699 896Net profit, Rp bn 223 309 380 568 838Core profit, Rp bn 218 332 382 569 846Core EPS, Rp 20 30 35 52 77Core EPS growth, % (64) 52 15 49 49EV/EBITDA, x 25 23 20 16 13Dividend Yield, % 0.0 0.4 0.6 0.7 1.0BVPS, Rp 190 214 243 288 355
BSDE relative price to JCI Index
500
600
700
800
900
1,000
1,100
1,200
12
/18
/09
2/1
/10
3/1
0/1
0
4/1
9/1
0
5/2
6/1
0
7/2
/10
8/9
/10
9/2
2/1
0
10
/28
/10
12
/6/1
0
-40
-30
-20
-10
0
BSDE (LHS) Relative to JCI Index (RHS)%Rp
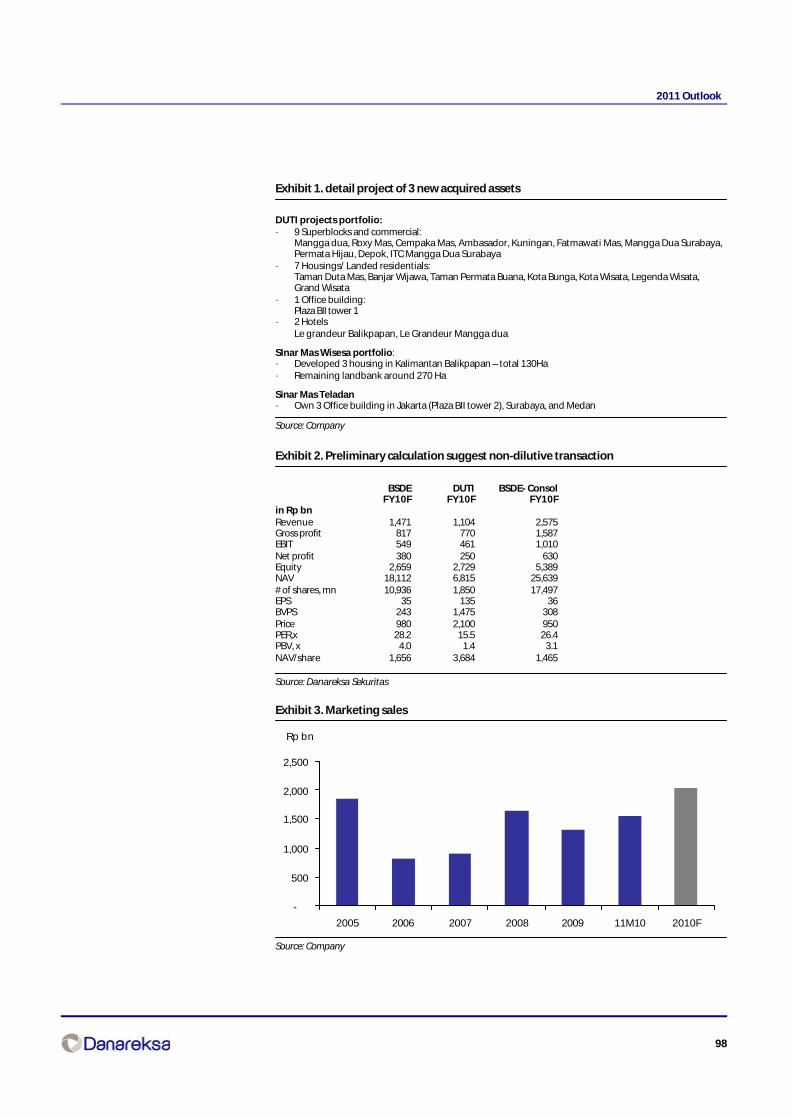
98
2011 Outlook
Exhibit 1. detail project of 3 new acquired assets
DUTI projects portfolio:· 9 Superblocks and commercial:
Mangga dua, Roxy Mas, Cempaka Mas, Ambasador, Kuningan, Fatmawati Mas, Mangga Dua Surabaya,Permata Hijau, Depok, ITC Mangga Dua Surabaya
· 7 Housings/ Landed residentials:Taman Duta Mas, Banjar Wijawa, Taman Permata Buana, Kota Bunga, Kota Wisata, Legenda Wisata,Grand Wisata
· 1 Office building:Plaza BII tower 1
· 2 HotelsLe grandeur Balikpapan, Le Grandeur Mangga dua
SInar Mas Wisesa portfolio:· Developed 3 housing in Kalimantan Balikpapan – total 130Ha· Remaining landbank around 270 Ha
Sinar Mas Teladan· Own 3 Office building in Jakarta (Plaza BII tower 2), Surabaya, and Medan
Source: Company
Exhibit 2. Preliminary calculation suggest non-dilutive transaction
BSDE DUTI BSDE- ConsolFY10F FY10F FY10F
in Rp bnRevenue 1,471 1,104 2,575Gross profit 817 770 1,587EBIT 549 461 1,010Net profit 380 250 630Equity 2,659 2,729 5,389NAV 18,112 6,815 25,639# of shares, mn 10,936 1,850 17,497EPS 35 135 36BVPS 243 1,475 308Price 980 2,100 950PER,x 28.2 15.5 26.4PBV, x 4.0 1.4 3.1NAV/share 1,656 3,684 1,465
Source: Danareksa Sekuritas
Exhibit 3. Marketing sales
Source: Company
Rp bn
-
500
1,000
1,500
2,000
2,500
2005 2006 2007 2008 2009 11M10 2010F

99
2011 Outlook
Exhibit 4. Key assumptions and profit & loss (Rp bn)
2008 2009 2010F 2011F 2012FAssumptionLandbank, Ha 2,525 2,064 2,111 2,055 2,000Selling price, Rp mn/sqm
Residential 1.8 2.2 2.5 2.8 3.0 Commercial 3.0 3.2 3.5 3.9 4.2
Forex, Rp /USDAverage 9,753 10,356 9,149 9,399 9,947Year end 10,950 9,400 9,356 9,489 10,053
BI rate, %Average 8.60 8.67 7.13 6.50 6.63Year end 8.00 9.25 6.50 6.50 6.50
Net revenue 1,386 1,271 1,471 1,690 1,977YoY growth, % -4 -8 16 15 17Cost of good sold 744 638 655 678 696YoY growth, % -25 -14 3 4 3% of sales 54 50 44 40 35Gross profit 642 633 817 1,012 1,281YoY growth, % 43 -1 29 24 27% of sales 46 50 56 60 65EBITDA 429 475 571 724 924YoY growth, % 51 11 20 27 28% of sales 31 37 39 43 47Depreciation 17 19 22 25 29Operating profit 412 456 549 699 896YoY growth, % 30 11 20 27 28% of sales 30 36 37 41 45Forex (8) (18) (0) (1) (9)Interet expenses (176) (123) (123) (71) -Interest income 61 72 37 31 53Others 15 (11) (3) 1 4Total other income (loss) (108) (80) (90) (40) 49Pretax profit 304 376 459 659 944Income tax 81 67 79 91 107Net income 223 309 380 568 838YoY growth, % 110 38 23 50 48% of sales 16 24 26 34 42Core Income 218 332 382 569 846YoY growth, % 101 52 15 49 49% of sales 16 26 26 34 43No of shares, mn 10,936 10,936 10,936 10,936 10,936EPS 20.4 28.2 34.7 51.9 76.6YoY growth, % 110 38 23 50 48Core EPS 20.0 30.4 35.0 52.0 77.4YoY growth, % 101 52 15 49 49DPS - 4.0 5.5 6.8 10.2Dividend payout, % 20 20 20 20
Margins, (%)Gross profit 46.3 49.8 55.5 59.9 64.8Operating profit 29.7 35.9 37.3 41.4 45.3EBITDA 31.0 37.4 38.8 42.9 46.8Pretax profit 21.9 29.6 31.2 39.0 47.8Net profit 16.1 24.3 25.8 33.6 42.4Effective tax rate 26.5 17.9 17.3 13.8 11.3
Source: Company and Danareksa Sekuritas
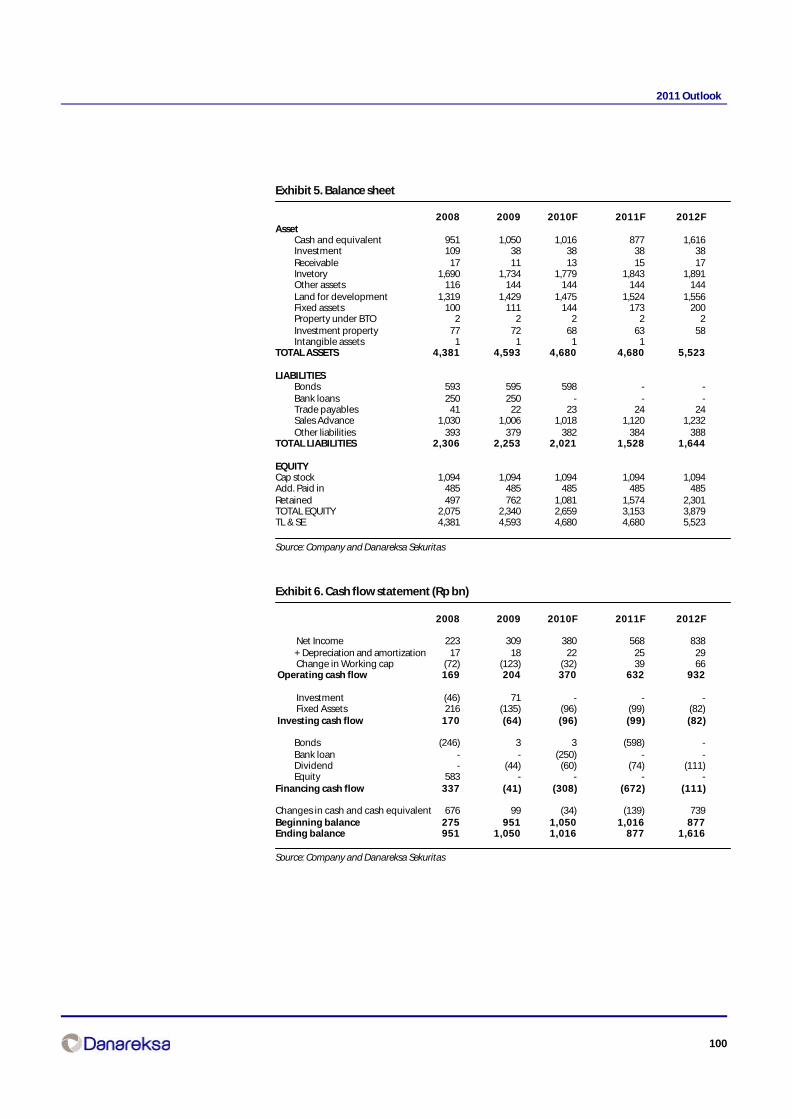
100
2011 Outlook
Exhibit 5. Balance sheet
2008 2009 2010F 2011F 2012FAsset
Cash and equivalent 951 1,050 1,016 877 1,616Investment 109 38 38 38 38Receivable 17 11 13 15 17Invetory 1,690 1,734 1,779 1,843 1,891Other assets 116 144 144 144 144Land for development 1,319 1,429 1,475 1,524 1,556Fixed assets 100 111 144 173 200Property under BTO 2 2 2 2 2Investment property 77 72 68 63 58Intangible assets 1 1 1 1
TOTAL ASSETS 4,381 4,593 4,680 4,680 5,523
LIABILITIESBonds 593 595 598 - -Bank loans 250 250 - - -Trade payables 41 22 23 24 24Sales Advance 1,030 1,006 1,018 1,120 1,232Other liabilities 393 379 382 384 388
TOTAL LIABILITIES 2,306 2,253 2,021 1,528 1,644
EQUITYCap stock 1,094 1,094 1,094 1,094 1,094Add. Paid in 485 485 485 485 485Retained 497 762 1,081 1,574 2,301TOTAL EQUITY 2,075 2,340 2,659 3,153 3,879TL & SE 4,381 4,593 4,680 4,680 5,523
Source: Company and Danareksa Sekuritas
Exhibit 6. Cash flow statement (Rp bn)
2008 2009 2010F 2011F 2012F
Net Income 223 309 380 568 838+ Depreciation and amortization 17 18 22 25 29 Change in Working cap (72) (123) (32) 39 66
Operating cash flow 169 204 370 632 932
Investment (46) 71 - - - Fixed Assets 216 (135) (96) (99) (82)
Investing cash flow 170 (64) (96) (99) (82)
Bonds (246) 3 3 (598) -Bank loan - - (250) - -Dividend - (44) (60) (74) (111)Equity 583 - - - -
Financing cash flow 337 (41) (308) (672) (111)
Changes in cash and cash equivalent 676 99 (34) (139) 739Beginning balance 275 951 1,050 1,016 877Ending balance 951 1,050 1,016 877 1,616
Source: Company and Danareksa Sekuritas

101
2011 Outlook
BW PlantationKeeping robust production growth
Raising EPS, Buy maintainedWe lifted FY11-12E EPS by 14.2% and 8.3% respectively, buoyed by strong CPO price amid greaterproduction growth. While this year’s CPO production is likely to grow at a modest 4.1%, itsaggressive expansion over the past 3 years shall ensure that long-term production growth issustained. FFB yield may decline to 25ton/ha this year, as a result of bad weather, yet such a yieldstill remains one of the highest in the industry. For now, we maintain our FFB production of 388,000tons this year, before jumping to 488,300ton next year. November’s production has reached 91%of our FY10 forecast. Our TP is now set at Rp1,350, based on a 12-mth 15x target multiple, whichwe believe is justified by the company’s savvy management, robust EPS growth and strong 18.2%3-yr CAGR production growth.
Margins expansion staysWe now estimate gross margin to hit 68.8% next year, helped by strong production growth asidefrom higher CPO price. BWPT’s ability to suppress its production cost on a per ton basis is alsohelping. While we estimate processing cost to increase by 10% next year, much of the increase isoffset by lower harvesting costs. On a per ton basis, we estimate total production cost, includingplantation cost, is around Rp2,540/kg, relatively flat on a yearly basis. Indeed, BWPT is expandingits mechanization from currently 7,200ha to about 8,500ha by YE10, and to about 11,000ha by nextyear. In effect, mechanization shall save harvesting costs by as much as US$30-35/mt as comparedto doing the work manually.
Strong expansion continuesAs of Oct, new plantings have reached 8,000ha. This year’s new plantings guidance still stands at10,450ha by YE10. Most of the plantings are in the East Kalimantan, requiring around US$43mnof capex. Expansion will be about the same for next year, aggressive, yet achievable, we believe,in particular when it has financing already at hand. Impacts, however, will not yield until 3-4 yearslater. Mid term production growth is likely to come from 2006-2009’s plantings, of which around4,100ha is likely to mature next year. That’s an additional of 41,000 tons of FFB production nextyear. This is aside from 447,300 tons of FFB coming from the existing 19,663ha of mature area nextyear.
Risksto watchKey risks include 1) poor weather that may impact long term production growth and expansion,2) higher fertilizer costs as it is aggressively expanding its plantation and 3) slower than expectedexpansion.
Year to Dec 2008 2009 2010F 2011F 2012F
Sales, Rp bn 514 584 672 966 1,174EBITDA, Rp bn 268 289 364 587 729Core profit, Rp bn 150 148 210 354 464Core EPS growth, % 68 -5 16 69 31Core PER, x 24.4 25.8 22.3 13.2 10.1EV/EBITDA, x 15.4 16.9 13.9 7.6 6.1EV/Ha, US$ 000/ha 15.9 12.0 11.3 8.2 7.1Dividend yield, % 0.0 0.4 0.5 0.8 1.0Net gearing, % 173.9 23.5 33.9 -16.5 -13.6
Bonny B. Setiawan CFA(62-21) 2352 [email protected]
BUYBloomberg Code BWPT IJPrice, Rp 1,160Mkt Cap Rp bn 4,683Target Price, Rp 1,350
BWPT relative price to JCI Index
Last Recommendation
Rec. Target Price
22-Dec-10 BUY Rp 1,35007-Sep10 BUY Rp 1,05002-Jul-10 BUY Rp 81003-Mar-10 BUY Rp 85013-Jan-10 BUY Rp 850
500
750
1,000
1,250
1,500
12/1
8/09
2/1/
10
3/10
/10
4/19
/10
5/26
/10
7/2/
10
8/9/
10
9/22
/10
10/2
8/10
12/6
/10
-10
0
10
20
30
40
50
60
BWPT (LHS) Relative to JCI Index (RHS)%Rp
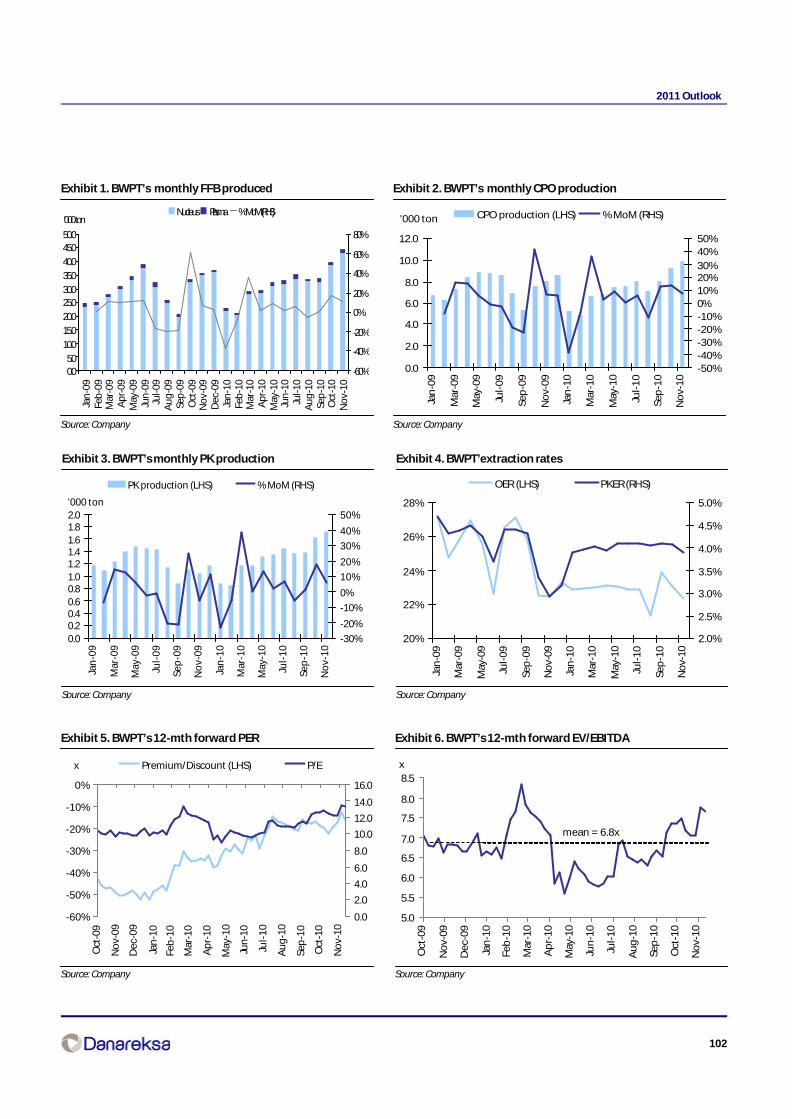
102
2011 Outlook
Exhibit 1. BWPT’s monthly FFB produced
Source: Company
Exhibit 2. BWPT’s monthly CPO production
Source: Company
0.05.0
10.0
15.0
20.0
25.030.0
35.0
40.0
45.050.0
Jan
-09
Feb
-09
Mar
-09
Ap
r-09
May
-09
Jun
-09
Jul-0
9A
ug
-09
Sep
-09
Oct
-09
No
v-09
Dec
-09
Jan
-10
Feb
-10
Mar
-10
Ap
r-10
May
-10
Jun
-10
Jul-1
0A
ug
-10
Sep
-10
Oct
-10
No
v-10
-60%
-40%
-20%
0%
20%
40%
60%
80%
Nucleus Plasma % MoM (RHS)'000 ton
0.0
2.0
4.0
6.0
8.0
10.0
12.0
Jan
-09
Mar
-09
May
-09
Jul-
09
Sep
-09
No
v-0
9
Jan
-10
Mar
-10
May
-10
Jul-
10
Sep
-10
No
v-1
0
-50%-40%-30%-20%-10%0%10%20%30%
40%50%
CPO production (LHS) % MoM (RHS)'000 ton
Exhibit 3. BWPT’s monthly PK production
Source: Company
Exhibit 4. BWPT’extraction rates
Source: Company
0.00.20.40.60.81.01.21.41.61.82.0
Jan
-09
Mar
-09
May
-09
Jul-
09
Sep
-09
No
v-0
9
Jan
-10
Mar
-10
May
-10
Jul-
10
Sep
-10
No
v-1
0
-30%
-20%
-10%
0%
10%
20%
30%
40%
50%
PK production (LHS) % MoM (RHS)
'000 ton
20%
22%
24%
26%
28%
Jan
-09
Mar
-09
May
-09
Jul-
09
Sep
-09
No
v-09
Jan
-10
Mar
-10
May
-10
Jul-
10
Sep
-10
No
v-10
2.0%
2.5%
3.0%
3.5%
4.0%
4.5%
5.0%
OER (LHS) PKER (RHS)
Exhibit 5. BWPT’s 12-mth forward PER
Source: Company
Exhibit 6. BWPT’s 12-mth forward EV/EBITDA
Source: Company
-60%
-50%
-40%
-30%
-20%
-10%
0%
Oct
-09
No
v-09
Dec
-09
Jan
-10
Feb
-10
Mar
-10
Ap
r-10
May
-10
Jun
-10
Jul-
10
Au
g-1
0
Sep
-10
Oct
-10
No
v-10
0.0
2.0
4.0
6.0
8.0
10.0
12.0
14.0
16.0
x Premium/Discount (LHS) P/E
5.0
5.5
6.0
6.5
7.0
7.5
8.0
8.5
Oct
-09
No
v-09
Dec
-09
Jan
-10
Feb
-10
Mar
-10
Ap
r-10
May
-10
Jun
-10
Jul-
10
Au
g-1
0
Sep
-10
Oct
-10
No
v-10
x
mean = 6.8x
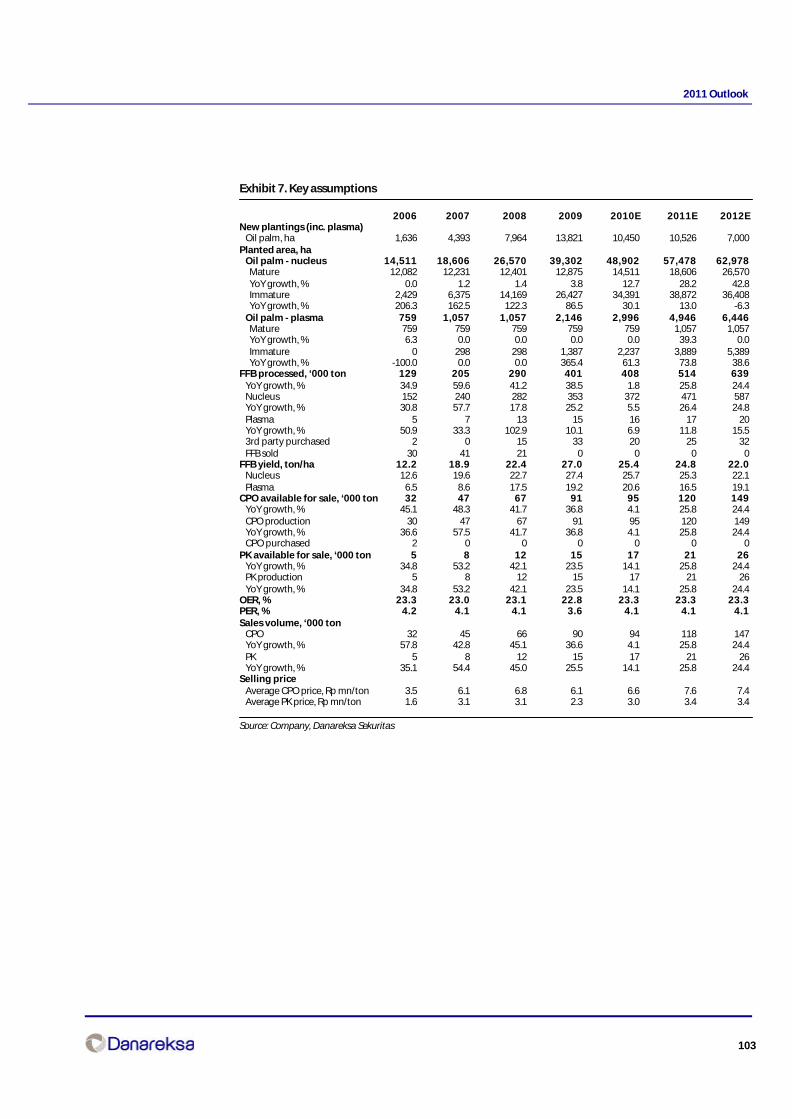
103
2011 Outlook
Exhibit 7. Key assumptions
2006 2007 2008 2009 2010E 2011E 2012ENew plantings (inc. plasma) Oil palm, ha 1,636 4,393 7,964 13,821 10,450 10,526 7,000Planted area, ha Oil palm - nucleus 14,511 18,606 26,570 39,302 48,902 57,478 62,978 Mature 12,082 12,231 12,401 12,875 14,511 18,606 26,570 YoY growth, % 0.0 1.2 1.4 3.8 12.7 28.2 42.8 Immature 2,429 6,375 14,169 26,427 34,391 38,872 36,408 YoY growth, % 206.3 162.5 122.3 86.5 30.1 13.0 -6.3 Oil palm - plasma 759 1,057 1,057 2,146 2,996 4,946 6,446 Mature 759 759 759 759 759 1,057 1,057 YoY growth, % 6.3 0.0 0.0 0.0 0.0 39.3 0.0 Immature 0 298 298 1,387 2,237 3,889 5,389 YoY growth, % -100.0 0.0 0.0 365.4 61.3 73.8 38.6FFB processed, ‘000 ton 129 205 290 401 408 514 639 YoY growth, % 34.9 59.6 41.2 38.5 1.8 25.8 24.4 Nucleus 152 240 282 353 372 471 587 YoY growth, % 30.8 57.7 17.8 25.2 5.5 26.4 24.8 Plasma 5 7 13 15 16 17 20 YoY growth, % 50.9 33.3 102.9 10.1 6.9 11.8 15.5 3rd party purchased 2 0 15 33 20 25 32 FFB sold 30 41 21 0 0 0 0FFB yield, ton/ha 12.2 18.9 22.4 27.0 25.4 24.8 22.0 Nucleus 12.6 19.6 22.7 27.4 25.7 25.3 22.1 Plasma 6.5 8.6 17.5 19.2 20.6 16.5 19.1CPO available for sale, ‘000 ton 32 47 67 91 95 120 149 YoY growth, % 45.1 48.3 41.7 36.8 4.1 25.8 24.4 CPO production 30 47 67 91 95 120 149 YoY growth, % 36.6 57.5 41.7 36.8 4.1 25.8 24.4 CPO purchased 2 0 0 0 0 0 0PK available for sale, ‘000 ton 5 8 12 15 17 21 26 YoY growth, % 34.8 53.2 42.1 23.5 14.1 25.8 24.4 PK production 5 8 12 15 17 21 26 YoY growth, % 34.8 53.2 42.1 23.5 14.1 25.8 24.4OER, % 23.3 23.0 23.1 22.8 23.3 23.3 23.3PER, % 4.2 4.1 4.1 3.6 4.1 4.1 4.1Sales volume, ‘000 ton CPO 32 45 66 90 94 118 147 YoY growth, % 57.8 42.8 45.1 36.6 4.1 25.8 24.4 PK 5 8 12 15 17 21 26 YoY growth, % 35.1 54.4 45.0 25.5 14.1 25.8 24.4Selling price Average CPO price, Rp mn/ton 3.5 6.1 6.8 6.1 6.6 7.6 7.4 Average PK price, Rp mn/ton 1.6 3.1 3.1 2.3 3.0 3.4 3.4
Source: Company, Danareksa Sekuritas

104
2011 Outlook
Exhibit 8. Projected profit and loss (Rp bn)
2006 2007 2008 2009 2010E 2011E 2012E
Palm oil 113 278 451 550 622 894 1,086 YoY growth, % 68.0 146.4 62.3 22.0 13.0 43.7 21.5 Palm kernel 8 25 36 34 50 72 88 YoY growth, % 11.6 190.2 47.5 -6.8 49.0 43.7 21.5 FFB 18 38 26 0 0 0 0Net revenues 139 341 514 584 672 966 1,174YoY growth, % 47.1 144.6 50.8 13.7 15.1 43.7 21.5Cost of good sold 97 134 208 219 239 301 357% of sales 69.3 39.3 40.4 37.5 35.5 31.2 30.4Gross profit 43 207 306 365 433 665 817YoY growth, % 58.1 383.7 48.1 19.3 18.8 53.5 22.8% of sales 30.7 60.7 59.6 62.5 64.5 68.8 69.6EBITDA 43 187 268 289 364 587 729YoY growth, % 50.2 511.8 42.3 5.7 28.1 61.7 22.9% of sales 30.7 55.0 52.1 49.4 54.2 60.7 62.1Depreciation 15 15 23 30 33 50 70Operating profit 28 172 245 259 332 536 659YoY growth, % 50.2 511.8 42.3 5.7 28.1 61.7 22.9% of sales 20.2 50.6 47.7 44.3 49.3 55.5 56.1Forex 8 -4 -41 40 3 -2 -7Interest expenses -11 -16 -23 -42 -49 -68 -43Interest income 0 1 1 4 1 8 7Others 1 0 -2 -13 -5 -4 -4Total other income (loss) -1 -19 -65 -11 -50 -67 -47Pretax profit 27 153 180 248 281 469 611Income tax -9 -50 -60 -80 -70 -117 -153Net income 11 87 120 167 211 352 459YoY growth, % 1083.8 693.0 38.4 39.8 26.0 66.8 30.3% of sales 7.8 25.4 23.3 28.7 31.4 36.4 39.1Core income 4 89 150 148 210 354 464YoY growth, % -16.7 2059.8 67.7 -1.0 41.8 68.5 31.2% of sales 3.0 26.2 29.1 25.3 31.2 36.6 39.5DPS 0 0 0 5 5 9 11Dividend payout 0.0 0.0 0.0 10.0 10.0 10.0 10.0
Margins (%)Cost of good sold 69.3 39.3 40.4 37.5 35.5 31.2 30.4Gross profit 30.7 60.7 59.6 62.5 64.5 68.8 69.6Operating profit 20.2 50.6 47.7 44.3 49.3 55.5 56.1EBITDA 30.7 55.0 52.1 49.4 54.2 60.7 62.1Pretax profit 19.7 45.0 35.1 42.4 41.8 48.5 52.1Net profit 7.8 25.4 23.3 28.7 31.4 36.4 39.1Effective tax rate 33.5 32.4 33.5 32.4 25.0 25.0 25.0
Growth rates (%,YoY)Sales 47.1 144.6 50.8 13.7 15.1 43.7 21.5Gross profit 58.1 383.7 48.1 19.3 18.8 53.5 22.8Operating income 50.2 511.8 42.3 5.7 28.1 61.7 22.9Net income 1083.8 693.0 38.4 39.8 26.0 66.8 30.3
Source: Company, Danareksa Sekuritas

105
2011 Outlook
Exhibit 9. Projected balance sheet (Rp bn)
2006 2007 2008 2009 2010E 2011E 2012ECurrent assetsCash and cash equivalent 13 32 18 318 59 467 424Short term investment 0 0 0 0 0 0 0Receivables 73 52 39 44 51 73 89Inventories 28 29 45 32 35 44 52Prepaid taxes and expenses 2 1 19 8 2 3 3Advances 0 0 0 0 0 0 0Total Current Assets 116 114 122 403 147 587 568Plantation - mature 110 105 116 128 185 415 600Plantation - immature 69 135 372 571 899 1,082 1,243PPE 97 181 260 301 339 377 462Goodwill - net 0 0 75 60 56 52 49Other assets 66 42 72 159 93 96 98Total Non Current Assets 342 464 894 1,220 1,572 2,023 2,451Total Assets 457 578 1,016 1,623 1,719 2,610 3,020
Short term loan 30 66 101 93 93 0 0Payables 27 44 122 82 89 112 133Accrued expenses 2 3 5 8 8 10 12Current maturities of LT debt 49 49 52 76 106 66 65Others 16 105 102 81 80 125 158Total Current Liabilities 124 267 382 340 376 313 369Long term debts - net of current maturities122 209 340 362 232 168 110Long term bond 0 0 0 0 0 700 700Others 5 7 21 16 16 16 16Total Non Current Liabilities 127 216 361 378 248 884 826Minority interest 0 0 0 0 0 0 0Capital stock 33 41 314 404 404 404 404Additional paid-in capital 7 135 0 375 375 375 375Others 157 -175 -175 -175 -175 -175 -175Retained earnings 8 94 134 302 492 808 1,221Total Stockholders’ Equity 206 95 273 905 1,095 1,412 1,825Total Liabilities and Equity 457 578 1,016 1,623 1,719 2,610 3,020
Selected ratiosInventory turn 4 5 6 6 7 8 7Inventory days 87 76 64 63 51 47 49Payable days 103 96 144 167 129 120 124Receivable days 12 23 20 16 20 18 19Cash cycle -4 3 -60 -88 -58 -55 -56Prepaid expense days 3 1 1 1 1 0 0Accrued expense days 5 5 6 7 8 8 8Account payable, % of inventory 98 155 270 254 254 254 254Interest coverage 4.0 11.8 11.6 6.9 7.4 8.6 16.8Working capital 58 -70 -125 -86 -89 -127 -159Working capital % of sales, % 41 -21 -24 -15 -13 -13 -14%Total debt 201 323 493 531 431 234 176Net debt 188 291 475 212 371 -232 -248Debt/equity, % 97.5 338.4 180.6 58.6 39.3 16.6 9.6Net debt/equity, % 91.3 305.0 173.9 23.5 33.9 -16.5 -13.6
Extended Dupont ROEOperating margin, % 20.2 50.6 47.7 44.3 49.3 55.5 56.1Interest burden 1.0 0.9 0.7 1.0 0.8 0.9 0.9Tax burden 0.4 0.6 0.7 0.7 0.8 0.8 0.8Total asset turnover 0.4 0.7 0.6 0.4 0.4 0.4 0.4Financial leverage 2.1 3.4 4.3 2.2 1.7 1.7 1.7ROE, % 5.9 57.4 65.0 28.4 21.1 28.1 28.3
Source: Company, Danareksa Sekuritas

106
2011 Outlook
Exhibit 10.Cash flow (Rp bn)
2006 2007 2008 2009 2010E 2011E 2012EOperating cash flowCash receipt from sales 152 352 542 579 667 949 1,162Cash payment to suppliers -111 -164 -244 -282 -251 -345 -416Payment of tax 0 -3 -62 -99 -76 -89 -131Interest paid -17 -21 -53 -46 -49 -68 -43Net operating cash flow 24 163 182 153 291 447 571
Investing cash flowAdditional PPE and planting -47 -157 -311 -277 -455 -502 -500Changes in ST investment 0 0 0 -10 0 0 0Acquisition of subsidiaries 0 -342 -67 -6 0 0 0Others -59 100 -28 -42 23 -3 -2Net investing cash flow -106 -399 -406 -334 -432 -505 -502
Financing cash flowChanges in debt 90 121 159 36 -83 -199 -66Cash from issuance of shares 0 135 58 452 0 0 0Bond issuance 0 0 0 0 0 700 0Capital lease -2 -2 -8 -6 -15 0 0IPO and additional capital 0 0 0 0Dividend 0 0 0 0 -21 -35 -46Net financing cash flow 88 254 209 482 -118 466 -112
Changes in cash and cash equivalent 6 18 -14 300 -259 407 -43Effect of forex 0 1 1 0 0 0 0Beginning balance 7 13 32 18 318 59 467Ending balance 13 32 18 318 59 467 424
Source: Company, Danareksa Sekuritas
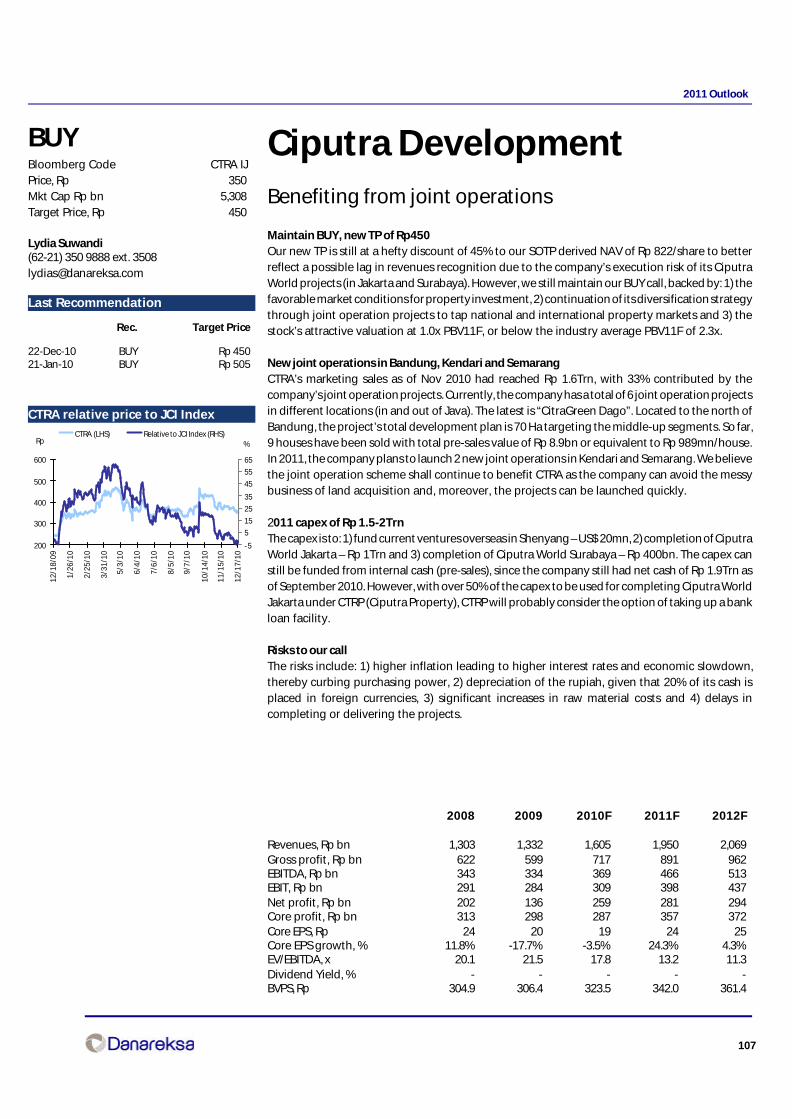
107
2011 Outlook
Ciputra DevelopmentBenefiting from joint operations
Maintain BUY, new TP of Rp450Our new TP is still at a hefty discount of 45% to our SOTP derived NAV of Rp 822/share to betterreflect a possible lag in revenues recognition due to the company’s execution risk of its CiputraWorld projects (in Jakarta and Surabaya). However, we still maintain our BUY call, backed by: 1) thefavorable market conditions for property investment, 2) continuation of its diversification strategythrough joint operation projects to tap national and international property markets and 3) thestock’s attractive valuation at 1.0x PBV11F, or below the industry average PBV11F of 2.3x.
New joint operations in Bandung, Kendari and SemarangCTRA’s marketing sales as of Nov 2010 had reached Rp 1.6Trn, with 33% contributed by thecompany’s joint operation projects. Currently, the company has a total of 6 joint operation projectsin different locations (in and out of Java). The latest is “CitraGreen Dago”. Located to the north ofBandung, the project’s total development plan is 70 Ha targeting the middle-up segments. So far,9 houses have been sold with total pre-sales value of Rp 8.9bn or equivalent to Rp 989mn/house.In 2011, the company plans to launch 2 new joint operations in Kendari and Semarang. We believethe joint operation scheme shall continue to benefit CTRA as the company can avoid the messybusiness of land acquisition and, moreover, the projects can be launched quickly.
2011 capex of Rp 1.5-2TrnThe capex is to: 1) fund current ventures overseas in Shenyang – US$ 20mn, 2) completion of CiputraWorld Jakarta – Rp 1Trn and 3) completion of Ciputra World Surabaya – Rp 400bn. The capex canstill be funded from internal cash (pre-sales), since the company still had net cash of Rp 1.9Trn asof September 2010. However, with over 50% of the capex to be used for completing Ciputra WorldJakarta under CTRP (Ciputra Property), CTRP will probably consider the option of taking up a bankloan facility.
Risks to our callThe risks include: 1) higher inflation leading to higher interest rates and economic slowdown,thereby curbing purchasing power, 2) depreciation of the rupiah, given that 20% of its cash isplaced in foreign currencies, 3) significant increases in raw material costs and 4) delays incompleting or delivering the projects.
Lydia Suwandi(62-21) 350 9888 ext. [email protected]
BUYBloomberg Code CTRA IJPrice, Rp 350Mkt Cap Rp bn 5,308Target Price, Rp 450
Last Recommendation
Rec. Target Price
22-Dec-10 BUY Rp 45021-Jan-10 BUY Rp 505
2008 2009 2010F 2011F 2012F
Revenues, Rp bn 1,303 1,332 1,605 1,950 2,069Gross profit, Rp bn 622 599 717 891 962EBITDA, Rp bn 343 334 369 466 513EBIT, Rp bn 291 284 309 398 437Net profit, Rp bn 202 136 259 281 294Core profit, Rp bn 313 298 287 357 372Core EPS, Rp 24 20 19 24 25Core EPS growth, % 11.8% -17.7% -3.5% 24.3% 4.3%EV/EBITDA, x 20.1 21.5 17.8 13.2 11.3Dividend Yield, % - - - - -BVPS, Rp 304.9 306.4 323.5 342.0 361.4
CTRA relative price to JCI Index
200
300
400
500
600
12/1
8/09
1/26
/10
2/25
/10
3/31
/10
5/3
/10
6/4
/10
7/6
/10
8/5
/10
9/7
/10
10/1
4/10
11/1
5/10
12/1
7/10
- 5
5
15
25
35
45
55
65
CTRA (LHS) Relative to JCI Index (RHS)%Rp
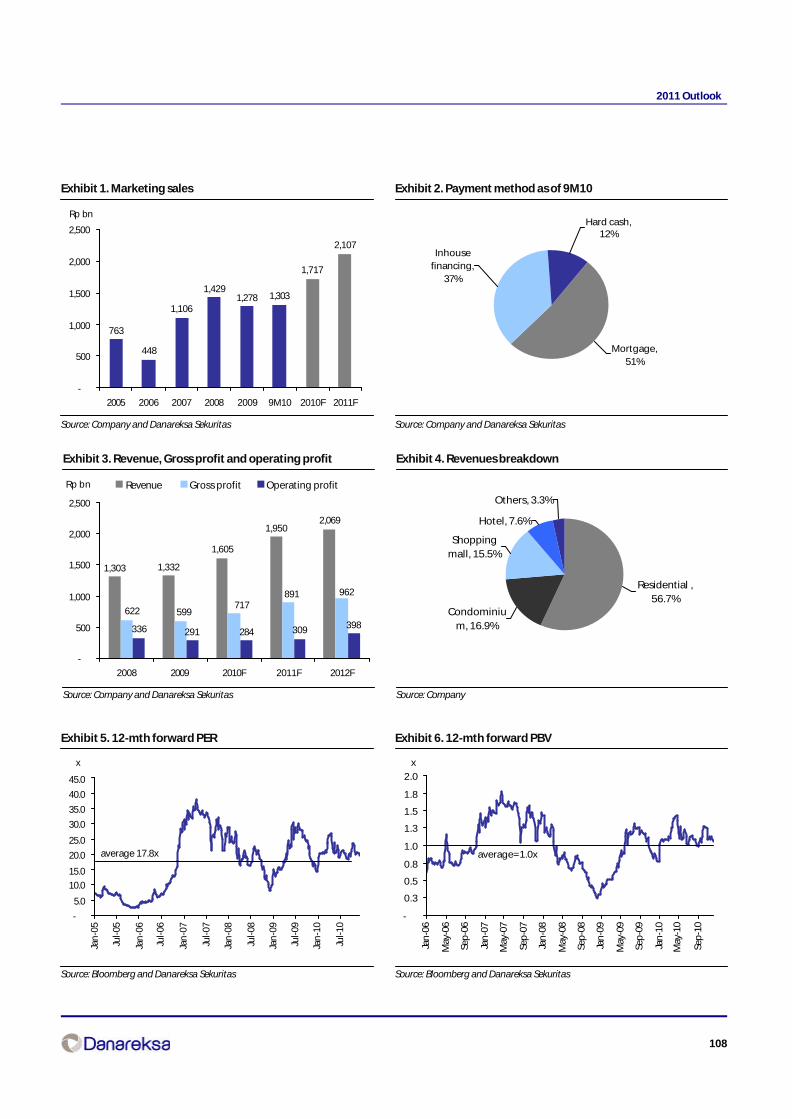
108
2011 Outlook
Exhibit 1. Marketing sales
Source: Company and Danareksa Sekuritas
Exhibit 2. Payment method as of 9M10
Source: Company and Danareksa Sekuritas
Exhibit 3. Revenue, Gross profit and operating profit
Source: Company and Danareksa Sekuritas
Exhibit 4. Revenues breakdown
Source: Company
Exhibit 5. 12-mth forward PER
Source: Bloomberg and Danareksa Sekuritas
Exhibit 6. 12-mth forward PBV
Source: Bloomberg and Danareksa Sekuritas
Rp bn
763
448
1,106
1,4291,278 1,303
1,717
2,107
-
500
1,000
1,500
2,000
2,500
2005 2006 2007 2008 2009 9M10 2010F 2011F
Inhouse financing,
37%
Mortgage, 51%
Hard cash, 12%
1,303 1,332
1,605
1,9502,069
336 291 284 309 398
962891717
599622
-
500
1,000
1,500
2,000
2,500
2008 2009 2010F 2011F 2012F
Rp bn Revenue Gross profit Operating profit
Hotel, 7.6%
Others, 3.3%
Residential , 56.7%
Condominium, 16.9%
Shopping mall, 15.5%
-
5.0
10.0
15.0
20.0
25.0
30.0
35.0
40.0
45.0
Jan
-05
Jul-0
5
Jan
-06
Jul-0
6
Jan
-07
Jul-0
7
Jan
-08
Jul-0
8
Jan
-09
Jul-0
9
Jan
-10
Jul-1
0
x
average 17.8x
-
0.3
0.5
0.8
1.0
1.3
1.5
1.8
2.0
Jan
-06
May
-06
Sep
-06
Jan
-07
May
-07
Sep
-07
Jan
-08
May
-08
Sep
-08
Jan
-09
May
-09
Sep
-09
Jan
-10
May
-10
Sep
-10
x
average=1.0x
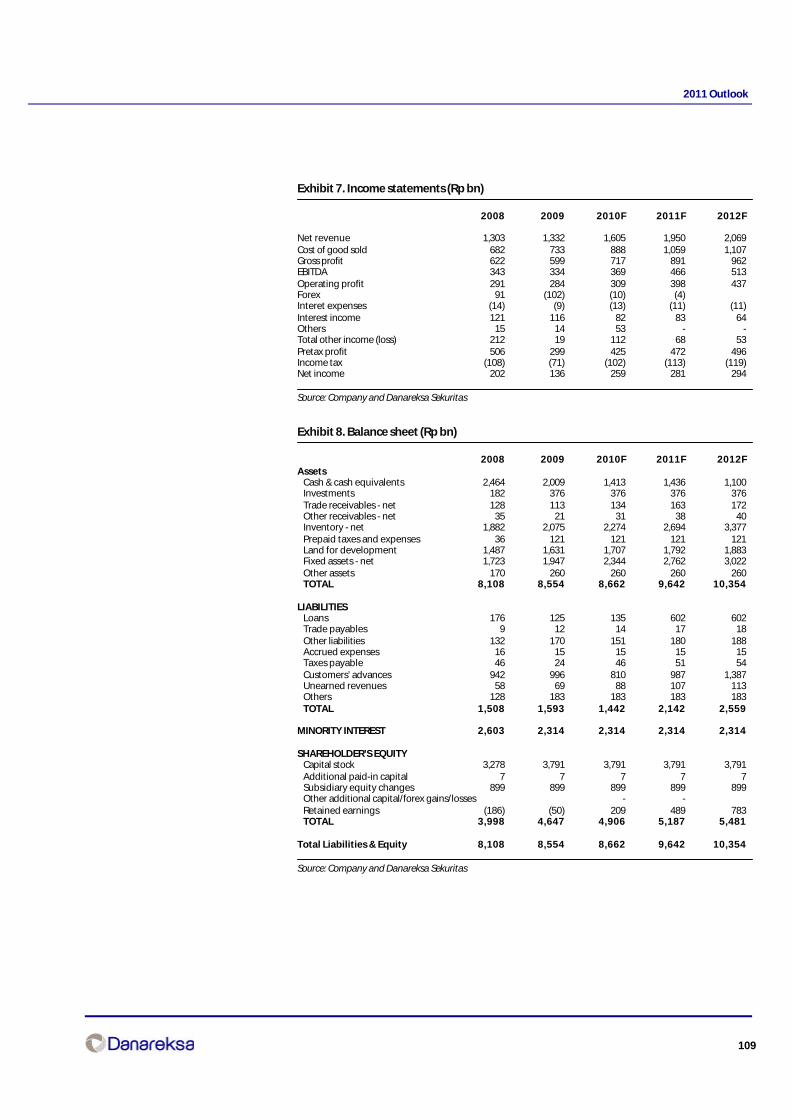
109
2011 Outlook
Exhibit 7. Income statements (Rp bn)
2008 2009 2010F 2011F 2012F
Net revenue 1,303 1,332 1,605 1,950 2,069Cost of good sold 682 733 888 1,059 1,107Gross profit 622 599 717 891 962EBITDA 343 334 369 466 513Operating profit 291 284 309 398 437Forex 91 (102) (10) (4)Interet expenses (14) (9) (13) (11) (11)Interest income 121 116 82 83 64Others 15 14 53 - -Total other income (loss) 212 19 112 68 53Pretax profit 506 299 425 472 496Income tax (108) (71) (102) (113) (119)Net income 202 136 259 281 294
Source: Company and Danareksa Sekuritas
Exhibit 8. Balance sheet (Rp bn)
2008 2009 2010F 2011F 2012FAssets Cash & cash equivalents 2,464 2,009 1,413 1,436 1,100 Investments 182 376 376 376 376 Trade receivables - net 128 113 134 163 172 Other receivables - net 35 21 31 38 40 Inventory - net 1,882 2,075 2,274 2,694 3,377 Prepaid taxes and expenses 36 121 121 121 121 Land for development 1,487 1,631 1,707 1,792 1,883 Fixed assets - net 1,723 1,947 2,344 2,762 3,022 Other assets 170 260 260 260 260 TOTAL 8,108 8,554 8,662 9,642 10,354
LIABILITIES Loans 176 125 135 602 602 Trade payables 9 12 14 17 18 Other liabilities 132 170 151 180 188 Accrued expenses 16 15 15 15 15 Taxes payable 46 24 46 51 54 Customers’ advances 942 996 810 987 1,387 Unearned revenues 58 69 88 107 113 Others 128 183 183 183 183 TOTAL 1,508 1,593 1,442 2,142 2,559
MINORITY INTEREST 2,603 2,314 2,314 2,314 2,314
SHAREHOLDER’S EQUITY Capital stock 3,278 3,791 3,791 3,791 3,791 Additional paid-in capital 7 7 7 7 7 Subsidiary equity changes 899 899 899 899 899 Other additional capital/forex gains/losses - - Retained earnings (186) (50) 209 489 783 TOTAL 3,998 4,647 4,906 5,187 5,481
Total Liabilities & Equity 8,108 8,554 8,662 9,642 10,354
Source: Company and Danareksa Sekuritas

110
2011 Outlook
Exhibit 9. Cash flow (Rp bn)
2008 2009 2010F 2011F 2012F
Operating cash flow Net Income 202 136 259 281 294 + Depreciation and amortization 52 50 61 68 76 + Minority interest 183 (289) - - - Operating cash flow 437 (103) 320 349 370 Adjustment to working capital A/R (52) 15 (21) (29) (10) Other receivable (9) 14 (10) (7) (2) Inventory 9 (193) (199) (420) (683) Prepaid & taxes expenses (21) (85) - - - Advances for purchases of land & others 41 - - - - Deferred tax 2 (0) - - - Other non current asset (128) (90) - - - Trade payables 0 3 3 3 1 Other payables (12) 38 (19) 29 8 Taxes payable 5 (22) 22 5 3 Accrued expenses (0) (1) - - - Advances from customer 279 54 (186) 177 400 Unearned revenues 16 10 19 19 6 Construction cost payable 23 51 - - - Deferred tax liabilities (88) (2) - - - Employee benefit liabilities 4 6 - - -
Net operating cash flow 507 (306) (72) 127 92Investing cash flow
Investment 34 (194) - - - Land for development 211 (144) (76) (85) (92) Fixed assets - net (589) (274) (458) (486) (336) Property investation
Net investing cash flow (344) (611) (534) (571) (428)Financing cash flow
Bank loan 4 (51) 10 467 - Equity 8 513 - - -
Net financing cash flow 12 462 10 467 -Changes in cash and cash equivalent 175 (455) (596) 22 (335)B eginning balance 2,289 2,464 2,009 1,413 1,436E nding balance 2,464 2,009 1,413 1,436 1,100
Source: Company and Danareksa Sekuritas
Exhibit 10. Ratios
2008 2009 2010F 2011F 2012F
Gross profit 48 45 45 46 46Operating profit 22 21 19 20 21EBITDA 26 25 23 24 25Pretax profit 39 22 26 24 24Net profit 16 10 16 14 14Effective tax rate 21 24 24 24 24
Source: Danareksa Sekuritas
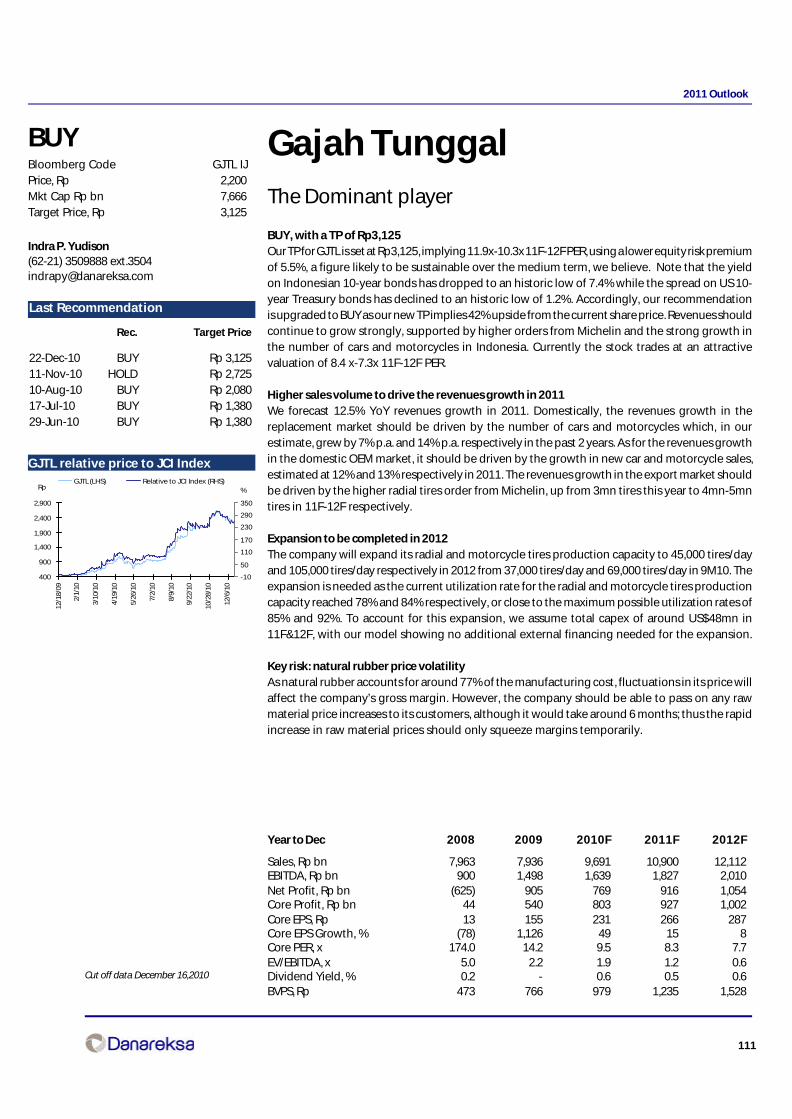
111
2011 Outlook
Indra P. Yudison(62-21) 3509888 [email protected]
BUYBloomberg Code GJTL IJPrice, Rp 2,200Mkt Cap Rp bn 7,666Target Price, Rp 3,125
Gajah TunggalThe Dominant player
BUY, with a TP of Rp3,125Our TP for GJTL is set at Rp3,125, implying 11.9x-10.3x 11F-12F PER, using a lower equity risk premiumof 5.5%, a figure likely to be sustainable over the medium term, we believe. Note that the yieldon Indonesian 10-year bonds has dropped to an historic low of 7.4% while the spread on US 10-year Treasury bonds has declined to an historic low of 1.2%. Accordingly, our recommendationis upgraded to BUY as our new TP implies 42% upside from the current share price. Revenues shouldcontinue to grow strongly, supported by higher orders from Michelin and the strong growth inthe number of cars and motorcycles in Indonesia. Currently the stock trades at an attractivevaluation of 8.4 x-7.3x 11F-12F PER.
Higher sales volume to drive the revenues growth in 2011We forecast 12.5% YoY revenues growth in 2011. Domestically, the revenues growth in thereplacement market should be driven by the number of cars and motorcycles which, in ourestimate, grew by 7% p.a. and 14% p.a. respectively in the past 2 years. As for the revenues growthin the domestic OEM market, it should be driven by the growth in new car and motorcycle sales,estimated at 12% and 13% respectively in 2011. The revenues growth in the export market shouldbe driven by the higher radial tires order from Michelin, up from 3mn tires this year to 4mn-5mntires in 11F-12F respectively.
Expansion to be completed in 2012The company will expand its radial and motorcycle tires production capacity to 45,000 tires/dayand 105,000 tires/day respectively in 2012 from 37,000 tires/day and 69,000 tires/day in 9M10. Theexpansion is needed as the current utilization rate for the radial and motorcycle tires productioncapacity reached 78% and 84% respectively, or close to the maximum possible utilization rates of85% and 92%. To account for this expansion, we assume total capex of around US$48mn in11F&12F, with our model showing no additional external financing needed for the expansion.
Key risk: natural rubber price volatilityAs natural rubber accounts for around 77% of the manufacturing cost, fluctuations in its price willaffect the company’s gross margin. However, the company should be able to pass on any rawmaterial price increases to its customers, although it would take around 6 months; thus the rapidincrease in raw material prices should only squeeze margins temporarily.
Last Recommendation
Rec. Target Price
22-Dec-10 BUY Rp 3,12511-Nov-10 HOLD Rp 2,72510-Aug-10 BUY Rp 2,08017-Jul-10 BUY Rp 1,38029-Jun-10 BUY Rp 1,380
GJTL relative price to JCI Index
Year to Dec 2008 2009 2010F 2011F 2012F
Sales, Rp bn 7,963 7,936 9,691 10,900 12,112EBITDA, Rp bn 900 1,498 1,639 1,827 2,010Net Profit, Rp bn (625) 905 769 916 1,054Core Profit, Rp bn 44 540 803 927 1,002Core EPS, Rp 13 155 231 266 287Core EPS Growth, % (78) 1,126 49 15 8Core PER, x 174.0 14.2 9.5 8.3 7.7EV/EBITDA, x 5.0 2.2 1.9 1.2 0.6Dividend Yield, % 0.2 - 0.6 0.5 0.6BVPS, Rp 473 766 979 1,235 1,528
400
900
1,400
1,900
2,400
2,900
12/1
8/09
2/1/
10
3/10
/10
4/19
/10
5/26
/10
7/2/
10
8/9/
10
9/22
/10
10/2
8/10
12/6
/10
-10
50
110
170
230
290
350
GJTL (LHS) Relative to JCI Index (RHS)%Rp
Cut off data December 16,2010

112
2011 Outlook
Exhibit 1. Forward 12 months earnings yield
Source: Company, Bloomberg and Danareksa estimates
Exhibit 2. Forward 12 months EV/EBITDA
Source: Company, Bloomberg and Danareksa estimates
Exhibit 3. Forward 12 months PBV
Source: Company, Bloomberg and Danareksa estimates
Exhibit 4. Net gearing
Source: Company, Danareksa estimates
Exhibit 5. Revenues breakdown based on product, Rp bn
Source: Company, Danareksa estimates
Exhibit 6. 9M10 production cost breakdown
Source: Company
-80%
-40%
0%
40%
80%
120%
160%
1/1/
05
8/1/
05
3/1/
06
10/1
/06
5/1/
07
12/1
/07
7/1/
08
2/1/
09
9/1/
09
4/1/
10
11/1
/10
Forward 12 months earnings yieldAverage
-
2.0
4.0
6.0
8.0
10.0
12.0
1/1/
05
8/1/
05
3/1/
06
10/1
/06
5/1/
07
12/1
/07
7/1/
08
2/1/
09
9/1/
09
4/1/
10
11/1
/10
Forward 12 months EV/EBITDA Average
-
0.5
1.0
1.5
2.0
2.5
1/1/
05
8/1/
05
3/1/
06
10/1
/06
5/1/
07
12/1
/07
7/1/
08
2/1/
09
9/1/
09
4/1/
10
11/1
/10
Forward 12 months PBV Average
-
50
100
150
200
250
300
2008 2009 2010F 2011F 2012F
%
-
2,000
4,000
6,000
8,000
10,000
12,000
14,000
2008 2009 2010F 2011F 2012F
Radial Tires Bias Tires Motorcycle Tires SBR+TC
Raw Material77%
Indirect Labor3%
Direct Labor4%
Other Overhead
5%
Depreciation4%
Energy7%

113
2011 Outlook
Exhibit 8. Profit and loss (Rp bn)
2008 2009 2010F 2011F 2012F
Sales 7,963 7,936 9,691 10,900 12,112COGS (6,828) (6,115) (7,801) (8,763) (9,728)Gross Profit 1,135 1,822 1,890 2,137 2,385 Gross Margin, % 14.3 23.0 19.5 19.6 19.7EBITDA 900 1,498 1,639 1,827 2,010 EBITDA Margin, % 11.3 18.9 16.9 16.8 16.6Opex (554) (677) (630) (709) (787) Opex to Sales, % (7.0) (8.5) (6.5) (6.5) (6.5)Operating Profit 581 1,145 1,260 1,429 1,597 Operating Margin, % 7.3 14.4 13.0 13.1 13.2Other Income (Expenses) (1,279) 113 (300) (291) (303)Equity Income (76) 16 16 17 18Pre-tax Profit (774) 1,274 977 1,155 1,312Net Profit (625) 905 769 916 1,054 Net Margin, % (7.8) 11.4 7.9 8.4 8.7Core Profit, Rp bn 44 540 803 927 1,002 Core Margin, % 0.6 6.8 8.3 8.5 8.3
Source: Company and Danareksa Sekuritas
Exhibit 9. Balance sheet (Rp bn)
2008 2009 2010F 2011F 2012F
ASSETSCash 170 815 859 1,709 2,679Receivables 657 731 1,025 1,153 1,281Inventories 1,399 862 1,444 1,622 1,800Others 818 967 1,080 1,158 1,236Total Current Assets 3,045 3,375 4,408 5,642 6,997
PPE 3,619 3,609 3,633 3,479 3,274Other assets 2,050 1,893 1,909 1,926 1,943Total Non Current Assets 5,669 5,502 5,542 5,405 5,217
TOTAL ASSETS 8,714 8,877 9,950 11,046 12,214
LIABILITIES & EQUITYAccount payable 1,345 809 1,009 1,133 1,258Short term debt 12 - - - -Others 714 524 542 643 683Total Current Liabilities 2,071 1,333 1,551 1,776 1,941
Long term debt 4,581 4,044 4,053 3,960 3,867Other long-term 412 829 934 1,008 1,081Total Non Current Liabilities 4,993 4,873 4,987 4,968 4,949
Share capital 1,742 1,742 1,742 1,742 1,742Excess paid in 52 52 52 52 52Retained earnings & others 12 917 1,642 2,516 3,520Total Equity 1,649 2,671 3,411 4,302 5,324
TOTAL LIABILITIES AND EQUITY 8,714 8,877 9,950 11,046 12,214
Source: Company and Danareksa Sekuritas

114
2011 Outlook
Exhibit 9. Cash flow (Rp bn)
2008 2009 2010F 2011F 2012F
CFONet Income (625) 905 769 916 1,054Depreciation 320 353 379 398 412Forex gain/loss 786 (487) 0 (0) (0)WC Changes 605 (296) (772) (159) (219)Other assets/liabilities changes (516) 663 105 74 74Net cash from operating activities 571 1,137 482 1,229 1,321
CFIInterest received, Investment withdrawal 12 339 - - -Proceeds from sale of PPE 1 1 - - -Placements of investments (1) (126) - - -Acquisition of property, plan & equipment (507) (336) (403) (244) (207)Net Cash Used in Investing Activities (494) (394) (403) (244) (207)
CFFProceeds from bank loan 38 - - - -bank loans repayment (37) - - -Payment of cash dividend (17) - (45) (41) (50)Payment of long-term notes payable (535) (13) - - -Bonds principal addition - - - -Bonds principal repayment - - (102) (102)Net cash provided by financing activities (513) (50) (45) (144) (152)
Net increase (decrease) in cash (437) 693 34 841 962
Source: Company and Danareksa Sekuritas
Exhibit 10. Ratios
2008 2009 2010F 2011F 2012F
ProfitabilityGross Margin, % 14.3 23.0 19.5 19.6 19.7Operating Margin, % 7.3 14.4 13.0 13.1 13.2EBITDA Margin, % 11.3 18.9 16.9 16.8 16.6Net Margin, % (7.8) 11.4 7.9 8.4 8.7ROAE, % (31.0) 41.9 25.3 23.8 21.9ROAA, % (7.3) 10.3 8.2 8.7 9.1
LeverageDebt to Equity, % 280 151 119 92 73Net Gearing, % 270 121 94 52 22
ValuationPER, x (12.3) 8.5 10.0 8.4 7.3PBV, x 4.6 2.9 2.2 1.8 1.4EV/EBITDA, x 5.0 2.2 1.9 1.2 0.6Dividend Yield, % 0.2 - 0.6 0.5 0.6
GrowthSales Growth, % 19.6 (0.3) 22.1 12.5 11.1Gross Profit Growth, % (3.4) 60.5 3.8 13.1 11.6Operating Profit Growth, % (12.5) 97.0 10.1 13.4 11.8EBITDA Growth, % (6.5) 66.4 9.5 11.5 10.0Net Profit Growth, % (787.8) (244.9) (15.0) 19.0 15.0
Days TurnoverInventory 74 51 67 67 67Trade receivables 24 29 33 33 33Trade payables 67 42 42 42 42Other receivables 5 4 5 5 5Other payables 3 5 4 4 4
Source: Company and Danareksa Sekuritas
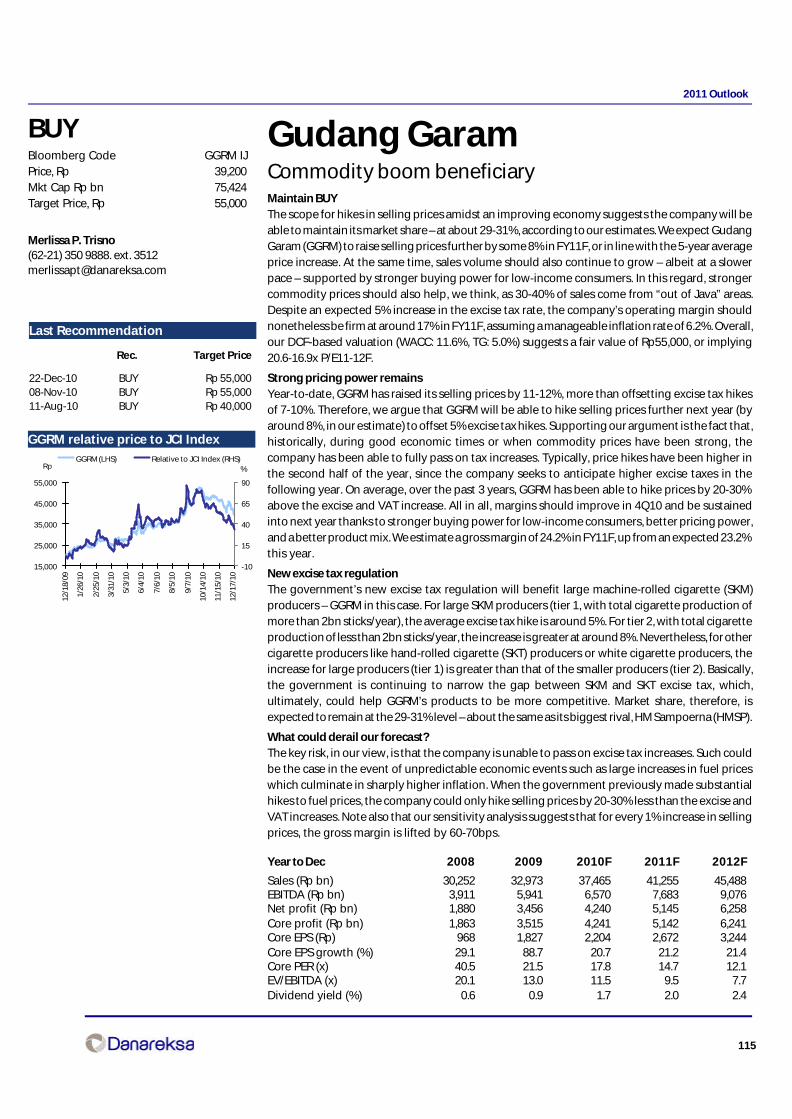
115
2011 Outlook
Gudang GaramCommodity boom beneficiaryMaintain BUYThe scope for hikes in selling prices amidst an improving economy suggests the company will beable to maintain its market share – at about 29-31%, according to our estimates. We expect GudangGaram (GGRM) to raise selling prices further by some 8% in FY11F, or in line with the 5-year averageprice increase. At the same time, sales volume should also continue to grow – albeit at a slowerpace – supported by stronger buying power for low-income consumers. In this regard, strongercommodity prices should also help, we think, as 30-40% of sales come from “out of Java” areas.Despite an expected 5% increase in the excise tax rate, the company’s operating margin shouldnonetheless be firm at around 17% in FY11F, assuming a manageable inflation rate of 6.2%. Overall,our DCF-based valuation (WACC: 11.6%, TG: 5.0%) suggests a fair value of Rp55,000, or implying20.6-16.9x P/E11-12F.
Strong pricing power remainsYear-to-date, GGRM has raised its selling prices by 11-12%, more than offsetting excise tax hikesof 7-10%. Therefore, we argue that GGRM will be able to hike selling prices further next year (byaround 8%, in our estimate) to offset 5% excise tax hikes. Supporting our argument is the fact that,historically, during good economic times or when commodity prices have been strong, thecompany has been able to fully pass on tax increases. Typically, price hikes have been higher inthe second half of the year, since the company seeks to anticipate higher excise taxes in thefollowing year. On average, over the past 3 years, GGRM has been able to hike prices by 20-30%above the excise and VAT increase. All in all, margins should improve in 4Q10 and be sustainedinto next year thanks to stronger buying power for low-income consumers, better pricing power,and a better product mix. We estimate a gross margin of 24.2% in FY11F, up from an expected 23.2%this year.
New excise tax regulationThe government’s new excise tax regulation will benefit large machine-rolled cigarette (SKM)producers – GGRM in this case. For large SKM producers (tier 1, with total cigarette production ofmore than 2bn sticks/year), the average excise tax hike is around 5%. For tier 2, with total cigaretteproduction of less than 2bn sticks/year, the increase is greater at around 8%. Nevertheless, for othercigarette producers like hand-rolled cigarette (SKT) producers or white cigarette producers, theincrease for large producers (tier 1) is greater than that of the smaller producers (tier 2). Basically,the government is continuing to narrow the gap between SKM and SKT excise tax, which,ultimately, could help GGRM’s products to be more competitive. Market share, therefore, isexpected to remain at the 29-31% level – about the same as its biggest rival, HM Sampoerna (HMSP).
What could derail our forecast?The key risk, in our view, is that the company is unable to pass on excise tax increases. Such couldbe the case in the event of unpredictable economic events such as large increases in fuel priceswhich culminate in sharply higher inflation. When the government previously made substantialhikes to fuel prices, the company could only hike selling prices by 20-30% less than the excise andVAT increases. Note also that our sensitivity analysis suggests that for every 1% increase in sellingprices, the gross margin is lifted by 60-70bps.
BUYBloomberg Code GGRM IJPrice, Rp 39,200Mkt Cap Rp bn 75,424Target Price, Rp 55,000
Merlissa P. Trisno(62-21) 350 9888. ext. [email protected]
Last Recommendation
Rec. Target Price
22-Dec-10 BUY Rp 55,00008-Nov-10 BUY Rp 55,00011-Aug-10 BUY Rp 40,000
GGRM relative price to JCI Index
15,000
25,000
35,000
45,000
55,000
12/1
8/09
1/26
/10
2/25
/10
3/31
/10
5/3/
10
6/4/
10
7/6/
10
8/5/
10
9/7/
10
10/1
4/10
11/1
5/10
12/1
7/10
-10
15
40
65
90
GGRM (LHS) Relative to JCI Index (RHS)%Rp
Year to Dec 2008 2009 2010F 2011F 2012F
Sales (Rp bn) 30,252 32,973 37,465 41,255 45,488EBITDA (Rp bn) 3,911 5,941 6,570 7,683 9,076Net profit (Rp bn) 1,880 3,456 4,240 5,145 6,258Core profit (Rp bn) 1,863 3,515 4,241 5,142 6,241Core EPS (Rp) 968 1,827 2,204 2,672 3,244Core EPS growth (%) 29.1 88.7 20.7 21.2 21.4Core PER (x) 40.5 21.5 17.8 14.7 12.1EV/EBITDA (x) 20.1 13.0 11.5 9.5 7.7Dividend yield (%) 0.6 0.9 1.7 2.0 2.4
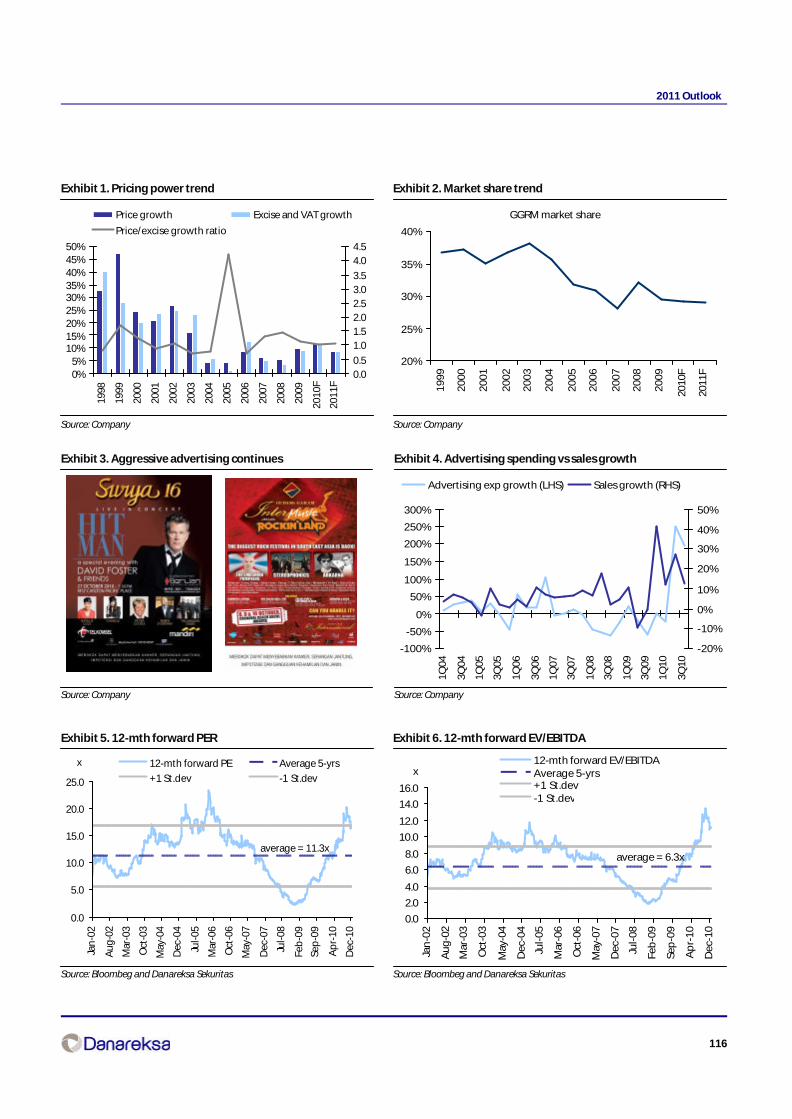
116
2011 Outlook
Exhibit 1. Pricing power trend
Source: Company
Exhibit 2. Market share trend
Source: Company
Exhibit 3. Aggressive advertising continues
Source: Company
Exhibit 4. Advertising spending vs sales growth
Source: Company
Exhibit 5. 12-mth forward PER
Source: Bloombeg and Danareksa Sekuritas
Exhibit 6. 12-mth forward EV/EBITDA
Source: Bloombeg and Danareksa Sekuritas
0%5%
10%15%20%25%30%35%40%45%50%
1998
1999
2000
2001
2002
2003
2004
2005
2006
2007
2008
2009
2010
F
2011
F
0.00.5
1.01.52.02.53.03.5
4.04.5
Price growth Excise and VAT growth
Price/excise growth ratio
GGRM market share
20%
25%
30%
35%
40%
19
99
20
00
20
01
20
02
20
03
20
04
20
05
20
06
20
07
20
08
20
09
2010
F
2011
F
-100%
-50%
0%
50%
100%
150%
200%
250%
300%
1Q04
3Q04
1Q05
3Q05
1Q06
3Q06
1Q07
3Q07
1Q08
3Q08
1Q09
3Q09
1Q10
3Q10
-20%
-10%
0%
10%
20%
30%
40%
50%
Advertising exp growth (LHS) Sales growth (RHS)
0.0
5.0
10.0
15.0
20.0
25.0
Jan
-02
Aug
-02
Mar
-03
Oct
-03
May
-04
Dec
-04
Jul-0
5
Mar
-06
Oct
-06
May
-07
Dec
-07
Jul-0
8
Feb
-09
Sep
-09
Ap
r-10
Dec
-10
12-mth forward PE Average 5-yrs
+1 St.dev -1 St.dev
x
average = 11.3x
0.0
2.0
4.0
6.0
8.0
10.0
12.0
14.0
16.0
Jan
-02
Au
g-0
2
Mar
-03
Oct
-03
May
-04
Dec
-04
Jul-
05
Mar
-06
Oct
-06
May
-07
Dec
-07
Jul-
08
Feb
-09
Sep
-09
Ap
r-1
0
Dec
-10
12-mth forward EV/EBITDAAverage 5-yrs+1 St.dev-1 St.dev
x
average = 6.3x

117
2011 Outlook
Exhibit 7. Projected profit and loss (Rp bn)
2008 2009 2010F 2011F 2012F
Revenues 30,252 32,973 37,465 41,255 45,488Gross profit 5,156 7,165 8,686 9,975 11,565Operating Profit 3,166 5,207 5,917 7,002 8,371EBITDA 3,911 5,941 6,570 7,683 9,076Net interest -539 -349 -273 -157 -60Interest income 14 96 52 70 99Interest expense -553 -445 -325 -227 -159Forex gain (loss) 25 -41 -1 5 22Net other 5 11 11 11 11Pretax income 2,656 4,828 5,654 6,861 8,344Income tax -776 -1,342 -1,413 -1,715 -2,086Others 2 3 4 5 6Minority Interest 0 -30 0 0 0Net profit 1,880 3,456 4,240 5,145 6,258Core profit 1,863 3,515 4,241 5,142 6,241
Source: Company and Danareksa Sekuritas
Exhibit 8. Projected balance sheet (Rp bn)
2008 2009 2010F 2011F 2012F
Total assets 24,073 27,231 29,606 33,038 37,590Current assets 17,009 19,585 21,867 25,454 30,296Cash & ST investment 1,135 1,223 2,207 4,178 7,075Account Receivable 2,099 1,039 1,070 1,179 1,300Inventories 13,529 16,853 17,987 19,551 21,202Others 246 469 602 547 720LT Investment 10 9 9 9 9Fixed Asset 6,608 7,019 7,105 6,962 6,696Others 446 618 625 613 589Total liabilities 8,554 8,848 8,234 8,060 8,182Current liabilities 7,671 7,961 7,347 7,173 7,294 Accounts payable 175 323 300 326 353 ST borrowings 4,332 3,183 2,228 1,560 1,092 Others 3,163 4,456 4,819 5,287 5,849Long-term liabilities 883 887 887 887 887 Long-term debts 0 0 0 0 0 Others 883 887 887 887 887Minority interest 0 81 81 81 81Shareholder’s equity 15,519 18,302 21,291 24,897 29,328
Source: Company and Danareksa Sekuritas
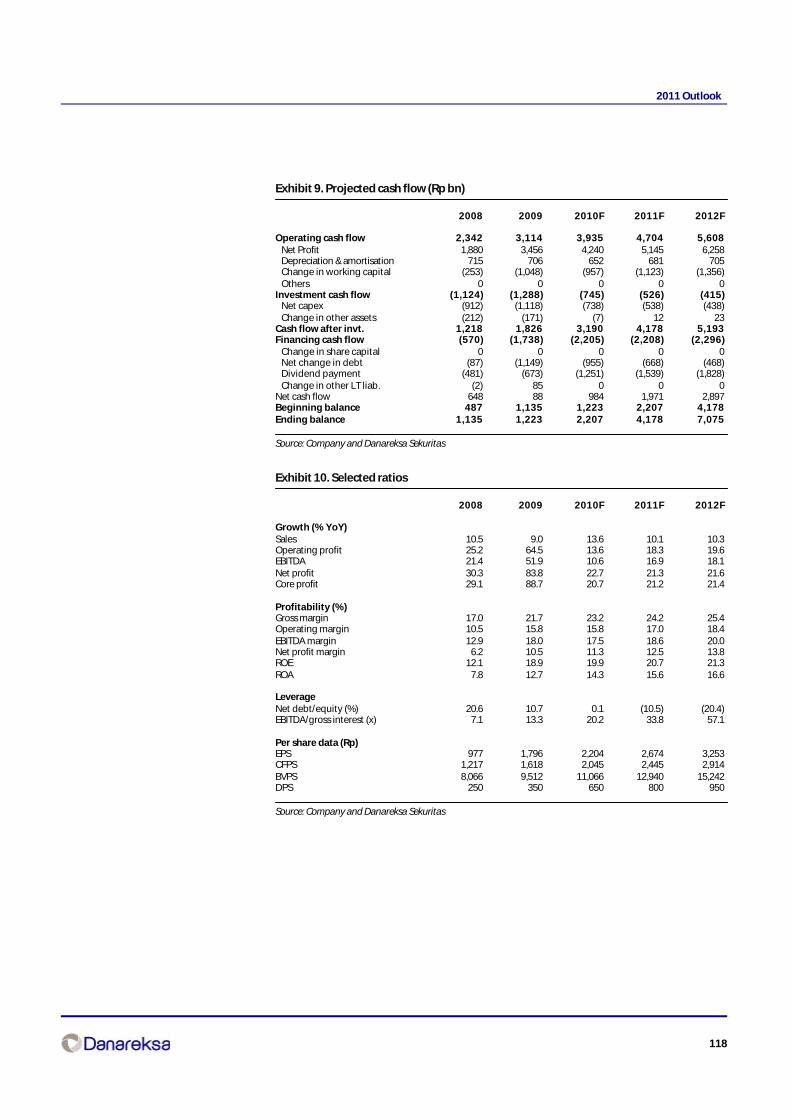
118
2011 Outlook
Exhibit 9. Projected cash flow (Rp bn)
2008 2009 2010F 2011F 2012F
Operating cash flow 2,342 3,114 3,935 4,704 5,608 Net Profit 1,880 3,456 4,240 5,145 6,258 Depreciation & amortisation 715 706 652 681 705 Change in working capital (253) (1,048) (957) (1,123) (1,356) Others 0 0 0 0 0Investment cash flow (1,124) (1,288) (745) (526) (415) Net capex (912) (1,118) (738) (538) (438) Change in other assets (212) (171) (7) 12 23Cash flow after invt. 1,218 1,826 3,190 4,178 5,193Financing cash flow (570) (1,738) (2,205) (2,208) (2,296) Change in share capital 0 0 0 0 0 Net change in debt (87) (1,149) (955) (668) (468) Dividend payment (481) (673) (1,251) (1,539) (1,828) Change in other LT liab. (2) 85 0 0 0Net cash flow 648 88 984 1,971 2,897Beginning balance 487 1,135 1,223 2,207 4,178Ending balance 1,135 1,223 2,207 4,178 7,075
Source: Company and Danareksa Sekuritas
Exhibit 10. Selected ratios
2008 2009 2010F 2011F 2012F
Growth (% YoY)Sales 10.5 9.0 13.6 10.1 10.3Operating profit 25.2 64.5 13.6 18.3 19.6EBITDA 21.4 51.9 10.6 16.9 18.1Net profit 30.3 83.8 22.7 21.3 21.6Core profit 29.1 88.7 20.7 21.2 21.4
Profitability (%)Gross margin 17.0 21.7 23.2 24.2 25.4Operating margin 10.5 15.8 15.8 17.0 18.4EBITDA margin 12.9 18.0 17.5 18.6 20.0Net profit margin 6.2 10.5 11.3 12.5 13.8ROE 12.1 18.9 19.9 20.7 21.3ROA 7.8 12.7 14.3 15.6 16.6
LeverageNet debt/equity (%) 20.6 10.7 0.1 (10.5) (20.4)EBITDA/gross interest (x) 7.1 13.3 20.2 33.8 57.1
Per share data (Rp)EPS 977 1,796 2,204 2,674 3,253CFPS 1,217 1,618 2,045 2,445 2,914BVPS 8,066 9,512 11,066 12,940 15,242DPS 250 350 650 800 950
Source: Company and Danareksa Sekuritas
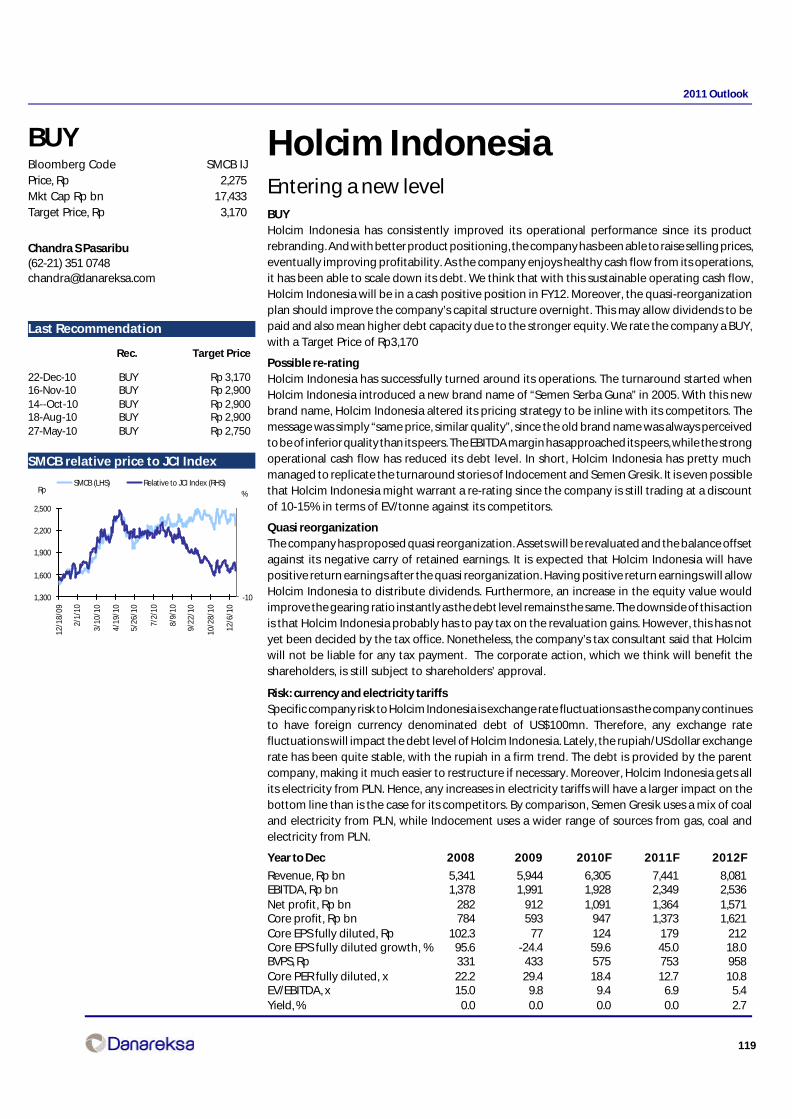
119
2011 Outlook
Holcim IndonesiaEntering a new levelBUYHolcim Indonesia has consistently improved its operational performance since its productrebranding. And with better product positioning, the company has been able to raise selling prices,eventually improving profitability. As the company enjoys healthy cash flow from its operations,it has been able to scale down its debt. We think that with this sustainable operating cash flow,Holcim Indonesia will be in a cash positive position in FY12. Moreover, the quasi-reorganizationplan should improve the company’s capital structure overnight. This may allow dividends to bepaid and also mean higher debt capacity due to the stronger equity. We rate the company a BUY,with a Target Price of Rp3,170
Possible re-ratingHolcim Indonesia has successfully turned around its operations. The turnaround started whenHolcim Indonesia introduced a new brand name of “Semen Serba Guna” in 2005. With this newbrand name, Holcim Indonesia altered its pricing strategy to be inline with its competitors. Themessage was simply “same price, similar quality”, since the old brand name was always perceivedto be of inferior quality than its peers. The EBITDA margin has approached its peers, while the strongoperational cash flow has reduced its debt level. In short, Holcim Indonesia has pretty muchmanaged to replicate the turnaround stories of Indocement and Semen Gresik. It is even possiblethat Holcim Indonesia might warrant a re-rating since the company is still trading at a discountof 10-15% in terms of EV/tonne against its competitors.
Quasi reorganizationThe company has proposed quasi reorganization. Assets will be revaluated and the balance offsetagainst its negative carry of retained earnings. It is expected that Holcim Indonesia will havepositive return earnings after the quasi reorganization. Having positive return earnings will allowHolcim Indonesia to distribute dividends. Furthermore, an increase in the equity value wouldimprove the gearing ratio instantly as the debt level remains the same. The downside of this actionis that Holcim Indonesia probably has to pay tax on the revaluation gains. However, this has notyet been decided by the tax office. Nonetheless, the company’s tax consultant said that Holcimwill not be liable for any tax payment. The corporate action, which we think will benefit theshareholders, is still subject to shareholders’ approval.
Risk: currency and electricity tariffsSpecific company risk to Holcim Indonesia is exchange rate fluctuations as the company continuesto have foreign currency denominated debt of US$100mn. Therefore, any exchange ratefluctuations will impact the debt level of Holcim Indonesia. Lately, the rupiah/US dollar exchangerate has been quite stable, with the rupiah in a firm trend. The debt is provided by the parentcompany, making it much easier to restructure if necessary. Moreover, Holcim Indonesia gets allits electricity from PLN. Hence, any increases in electricity tariffs will have a larger impact on thebottom line than is the case for its competitors. By comparison, Semen Gresik uses a mix of coaland electricity from PLN, while Indocement uses a wider range of sources from gas, coal andelectricity from PLN.
Chandra S Pasaribu(62-21) 351 [email protected]
BUYBloomberg Code SMCB IJPrice, Rp 2,275Mkt Cap Rp bn 17,433Target Price, Rp 3,170
SMCB relative price to JCI Index
Last Recommendation
Rec. Target Price
22-Dec-10 BUY Rp 3,17016-Nov-10 BUY Rp 2,90014--Oct-10 BUY Rp 2,90018-Aug-10 BUY Rp 2,90027-May-10 BUY Rp 2,750
Year to Dec 2008 2009 2010F 2011F 2012F
Revenue, Rp bn 5,341 5,944 6,305 7,441 8,081EBITDA, Rp bn 1,378 1,991 1,928 2,349 2,536Net profit, Rp bn 282 912 1,091 1,364 1,571Core profit, Rp bn 784 593 947 1,373 1,621Core EPS fully diluted, Rp 102.3 77 124 179 212Core EPS fully diluted growth, % 95.6 -24.4 59.6 45.0 18.0BVPS, Rp 331 433 575 753 958Core PER fully diluted, x 22.2 29.4 18.4 12.7 10.8EV/EBITDA, x 15.0 9.8 9.4 6.9 5.4Yield, % 0.0 0.0 0.0 0.0 2.7
1,300
1,600
1,900
2,200
2,500
12/1
8/09
2/1/
10
3/10
/10
4/19
/10
5/26
/10
7/2/
10
8/9/
10
9/22
/10
10/2
8/10
12/6
/10
-10
SMCB (LHS) Relative to JCI Index (RHS)%Rp

120
2011 Outlook
Exhibit 1. Quarterly EBITDA margin
Source: Conmpany
Exhibit 2. Production capacity and utilization rate
Source: Company
Exhibit 3. Net gearing and net debt position
Source: Company
Exhibit 4. COGS breakdown
Source: Company
Exhibit 5. 12-mth forward PBV
Source: Company
Exhibit 6. 12-mth forward EV/EBITDA
Source: Company
0%
10%
20%
30%
40%
Sep
-06
Mar
-07
Sep
-07
Mar
-08
Sep
-08
Mar
-09
Sep
-09
Mar
-10
Sep
-10
-
1,000
2,000
3,000
4,000
5,000
6,000
7,000
8,000
9,000
2005 2006 2007 2008 2009 2010 2011 2012
0%
20%
40%
60%
80%
100%
120%
Production ('000 tonne) Utilization rate (%)
0%
50%
100%
150%
200%
250%
Mar
-06
Jun
-06
Sep
-06
Dec
-06
Mar
-07
Jun
-07
Sep
-07
Dec
-07
Mar
-08
Jun
-08
Sep
-08
Dec
-08
Mar
-09
Jun
-09
Sep
-09
Dec
-09
Mar
-10
-
1,000
2,000
3,000
4,000
Net Gearing - LHS Net debt - RHS (Rp bn)
Salary and wages
7%
Depreciation11%
Raw materials
82%
0.5
1.5
2.5
3.5
4.5
5.5
6.5
04 05 06 07 08 09 10 11
(3)
2
7
12
17
22
27
32
37
42
04 05 06 07 08 09 10 11
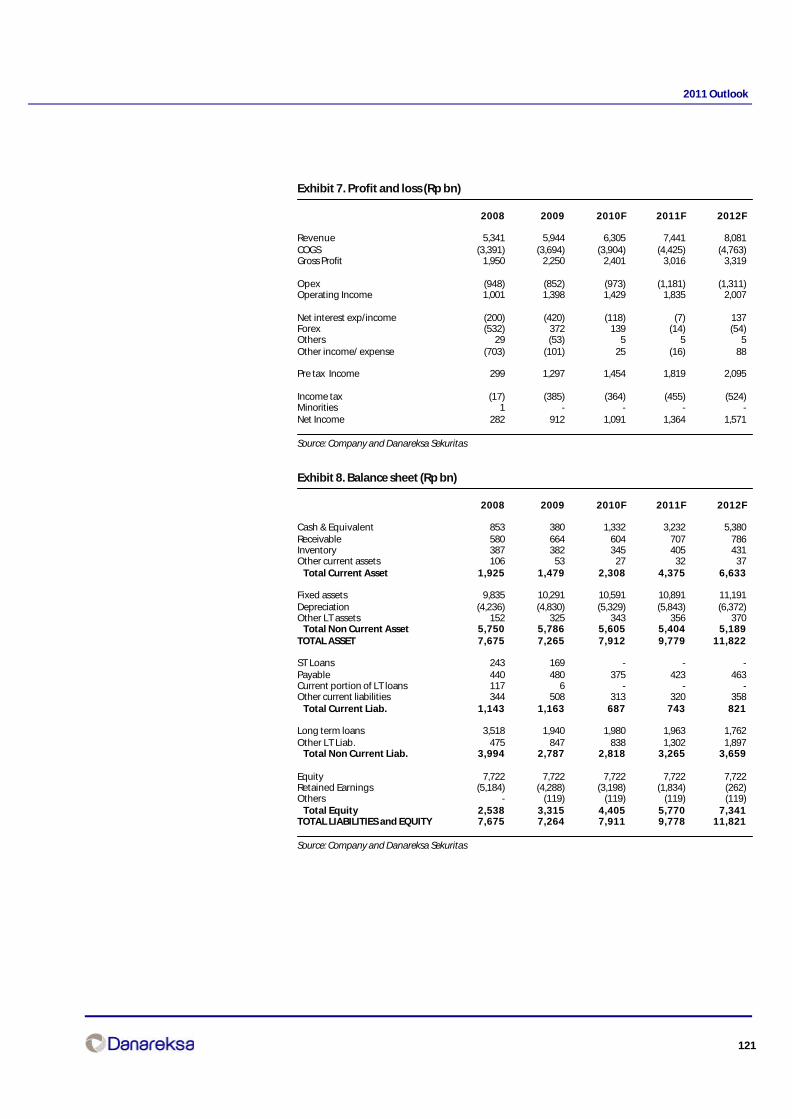
121
2011 Outlook
Exhibit 7. Profit and loss (Rp bn)
2008 2009 2010F 2011F 2012F
Revenue 5,341 5,944 6,305 7,441 8,081COGS (3,391) (3,694) (3,904) (4,425) (4,763)Gross Profit 1,950 2,250 2,401 3,016 3,319
Opex (948) (852) (973) (1,181) (1,311)Operating Income 1,001 1,398 1,429 1,835 2,007
Net interest exp/income (200) (420) (118) (7) 137Forex (532) 372 139 (14) (54)Others 29 (53) 5 5 5Other income/ expense (703) (101) 25 (16) 88
Pre tax Income 299 1,297 1,454 1,819 2,095
Income tax (17) (385) (364) (455) (524)Minorities 1 - - - -Net Income 282 912 1,091 1,364 1,571
Source: Company and Danareksa Sekuritas
Exhibit 8. Balance sheet (Rp bn)
2008 2009 2010F 2011F 2012F
Cash & Equivalent 853 380 1,332 3,232 5,380Receivable 580 664 604 707 786Inventory 387 382 345 405 431Other current assets 106 53 27 32 37 Total Current Asset 1,925 1,479 2,308 4,375 6,633
Fixed assets 9,835 10,291 10,591 10,891 11,191Depreciation (4,236) (4,830) (5,329) (5,843) (6,372)Other LT assets 152 325 343 356 370 Total Non Current Asset 5,750 5,786 5,605 5,404 5,189TOTAL ASSET 7,675 7,265 7,912 9,779 11,822
ST Loans 243 169 - - -Payable 440 480 375 423 463Current portion of LT loans 117 6 - - -Other current liabilities 344 508 313 320 358 Total Current Liab. 1,143 1,163 687 743 821
Long term loans 3,518 1,940 1,980 1,963 1,762Other LT Liab. 475 847 838 1,302 1,897 Total Non Current Liab. 3,994 2,787 2,818 3,265 3,659
Equity 7,722 7,722 7,722 7,722 7,722Retained Earnings (5,184) (4,288) (3,198) (1,834) (262)Others - (119) (119) (119) (119) Total Equity 2,538 3,315 4,405 5,770 7,341TOTAL LIABILITIES and EQUITY 7,675 7,264 7,911 9,778 11,821
Source: Company and Danareksa Sekuritas

122
2011 Outlook
Exhibit 9. Cash flow (Rp bn)
2008 2009 2010F 2011F 2012F
Pretax Profit 299 1,297 1,454 1,819 2,095Taxation 14 (2) (124) 5 76Depreciation 377 593 499 514 529Working capital (180) 70 (60) (110) (38)Others 1 (15) 0 0 0 Cash flow from Operation 511 1,944 1,769 2,229 2,662
Fixed assets (303) (456) (300) (300) (300)Investment - - - - -Others (71) (184) (16) (12) (13) Cash Flow from Investment (375) (640) (316) (312) (313)
ST Loans 243 (74) (169) - -LT Loans (1,877) (12) 1,610 (17) (201)Subordinated loan 1,671 (1,572) (1,942) - -Share issue - - - - -Dividends - - - - -Others (1.7) (119) - - - Cash Flow from Financing 35 (1,777) (501) (17) (201)
Change in cash 171 (473) 952 1,899 2,148
Source: Company and Danareksa Sekuritas
Exhibit 10. Ratios
2008 2009 2010F 2011F 2012F
ROE , % 3.8 12.0 14.4 15.4 14.5ROA, % 11.8 30.6 28.3 26.8 24.0EBITDA margin, % 25.8 33.5 30.6 31.6 31.4Operating margin, % 18.7 23.5 22.7 24.7 24.8Net margin, % 5.3 15.1 17.3 18.3 19.4
Receivable TO (days) 32.1 36.9 34.9 34.7 35.5Payable TO (days) 1.4 1.8 1.6 1.6 1.7Inventory TO (days) 34.7 33.3 32.2 33.4 33.0
Debt to Equity (X) 1.6 0.7 0.4 0.3 0.2Interest Coverage Ratio (X) 2.4 3.9 10.4 14.6 21.5Net Gearing (%) 141.3 88.2 40.3 5.7 net cash
Current Ratio (X) 1.68 1.27 3.36 5.89 8.08Quick Ratio (X) 1.35 0.94 2.86 5.34 7.56
Source: Company and Danareksa Sekuritas
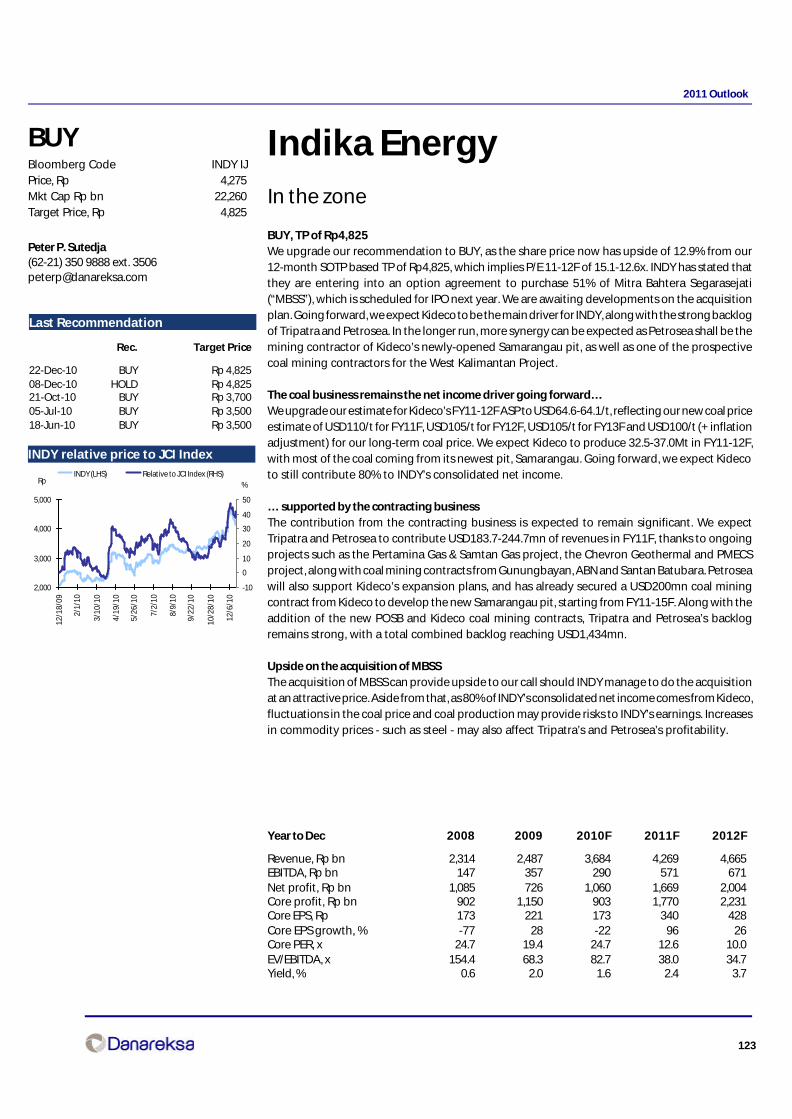
123
2011 Outlook
Indika EnergyIn the zone
BUY, TP of Rp4,825We upgrade our recommendation to BUY, as the share price now has upside of 12.9% from our12-month SOTP based TP of Rp4,825, which implies P/E 11-12F of 15.1-12.6x. INDY has stated thatthey are entering into an option agreement to purchase 51% of Mitra Bahtera Segarasejati(“MBSS”), which is scheduled for IPO next year. We are awaiting developments on the acquisitionplan. Going forward, we expect Kideco to be the main driver for INDY, along with the strong backlogof Tripatra and Petrosea. In the longer run, more synergy can be expected as Petrosea shall be themining contractor of Kideco’s newly-opened Samarangau pit, as well as one of the prospectivecoal mining contractors for the West Kalimantan Project.
The coal business remains the net income driver going forward…We upgrade our estimate for Kideco’s FY11-12F ASP to USD64.6-64.1/t, reflecting our new coal priceestimate of USD110/t for FY11F, USD105/t for FY12F, USD105/t for FY13F and USD100/t (+ inflationadjustment) for our long-term coal price. We expect Kideco to produce 32.5-37.0Mt in FY11-12F,with most of the coal coming from its newest pit, Samarangau. Going forward, we expect Kidecoto still contribute 80% to INDY’s consolidated net income.
… supported by the contracting businessThe contribution from the contracting business is expected to remain significant. We expectTripatra and Petrosea to contribute USD183.7-244.7mn of revenues in FY11F, thanks to ongoingprojects such as the Pertamina Gas & Samtan Gas project, the Chevron Geothermal and PMECSproject, along with coal mining contracts from Gunungbayan, ABN and Santan Batubara. Petroseawill also support Kideco’s expansion plans, and has already secured a USD200mn coal miningcontract from Kideco to develop the new Samarangau pit, starting from FY11-15F. Along with theaddition of the new POSB and Kideco coal mining contracts, Tripatra and Petrosea’s backlogremains strong, with a total combined backlog reaching USD1,434mn.
Upside on the acquisition of MBSSThe acquisition of MBSS can provide upside to our call should INDY manage to do the acquisitionat an attractive price. Aside from that, as 80% of INDY’s consolidated net income comes from Kideco,fluctuations in the coal price and coal production may provide risks to INDY’s earnings. Increasesin commodity prices - such as steel - may also affect Tripatra’s and Petrosea’s profitability.
Peter P. Sutedja(62-21) 350 9888 ext. [email protected]
BUYBloomberg Code INDY IJPrice, Rp 4,275Mkt Cap Rp bn 22,260Target Price, Rp 4,825
Last Recommendation
Rec. Target Price
22-Dec-10 BUY Rp 4,82508-Dec-10 HOLD Rp 4,82521-Oct-10 BUY Rp 3,70005-Jul-10 BUY Rp 3,50018-Jun-10 BUY Rp 3,500
INDY relative price to JCI Index
Year to Dec 2008 2009 2010F 2011F 2012F
Revenue, Rp bn 2,314 2,487 3,684 4,269 4,665EBITDA, Rp bn 147 357 290 571 671Net profit, Rp bn 1,085 726 1,060 1,669 2,004Core profit, Rp bn 902 1,150 903 1,770 2,231Core EPS, Rp 173 221 173 340 428Core EPS growth, % -77 28 -22 96 26Core PER, x 24.7 19.4 24.7 12.6 10.0EV/EBITDA, x 154.4 68.3 82.7 38.0 34.7Yield, % 0.6 2.0 1.6 2.4 3.7
2,000
3,000
4,000
5,000
12/1
8/09
2/1/
10
3/10
/10
4/19
/10
5/26
/10
7/2/
10
8/9/
10
9/22
/10
10/2
8/10
12/6
/10
-10
0
10
20
30
40
50
INDY (LHS) Relative to JCI Index (RHS)%Rp
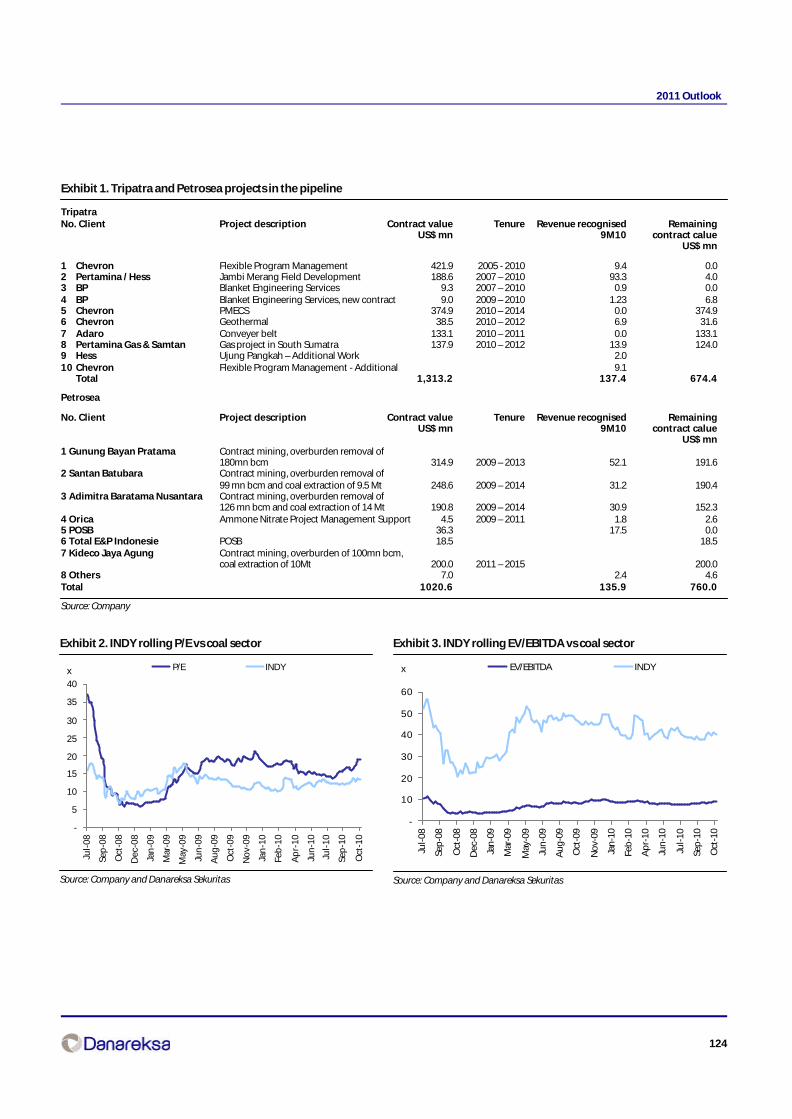
124
2011 Outlook
Exhibit 1. Tripatra and Petrosea projects in the pipeline
TripatraNo. Client Project description Contract value Tenure Revenue recognised Remaining
US$ mn 9M10 contract calueUS$ mn
1 Chevron Flexible Program Management 421.9 2005 - 2010 9.4 0.02 Pertamina / Hess Jambi Merang Field Development 188.6 2007 – 2010 93.3 4.03 BP Blanket Engineering Services 9.3 2007 – 2010 0.9 0.04 BP Blanket Engineering Services, new contract 9.0 2009 – 2010 1.23 6.85 Chevron PMECS 374.9 2010 – 2014 0.0 374.96 Chevron Geothermal 38.5 2010 – 2012 6.9 31.67 Adaro Conveyer belt 133.1 2010 – 2011 0.0 133.18 Pertamina Gas & Samtan Gas project in South Sumatra 137.9 2010 – 2012 13.9 124.09 Hess Ujung Pangkah – Additional Work 2.010 Chevron Flexible Program Management - Additional 9.1
Total 1,313.2 137.4 674.4
Petrosea
No. Client Project description Contract value Tenure Revenue recognised RemainingUS$ mn 9M10 contract calue
US$ mn1 Gunung Bayan Pratama Contract mining, overburden removal of
180mn bcm 314.9 2009 – 2013 52.1 191.62 Santan Batubara Contract mining, overburden removal of
99 mn bcm and coal extraction of 9.5 Mt 248.6 2009 – 2014 31.2 190.43 Adimitra Baratama Nusantara Contract mining, overburden removal of
126 mn bcm and coal extraction of 14 Mt 190.8 2009 – 2014 30.9 152.34 Orica Ammone Nitrate Project Management Support 4.5 2009 – 2011 1.8 2.65 POSB 36.3 17.5 0.06 Total E&P Indonesie POSB 18.5 18.57 Kideco Jaya Agung Contract mining, overburden of 100mn bcm,
coal extraction of 10Mt 200.0 2011 – 2015 200.08 Others 7.0 2.4 4.6Total 1020.6 135.9 760.0
Source: Company
Exhibit 2. INDY rolling P/E vs coal sector
Source: Company and Danareksa Sekuritas
Exhibit 3. INDY rolling EV/EBITDA vs coal sector
Source: Company and Danareksa Sekuritas
x x
-
5
10
15
20
25
30
35
40
Jul-
08
Sep
-08
Oct
-08
Dec
-08
Jan
-09
Mar
-09
May
-09
Jun
-09
Au
g-0
9
Oct
-09
No
v-09
Jan
-10
Feb
-10
Ap
r-10
Jun
-10
Jul-
10
Sep
-10
Oct
-10
P/E INDY
-
10
20
30
40
50
60
Jul-
08
Sep
-08
Oct
-08
Dec
-08
Jan
-09
Mar
-09
May
-09
Jun
-09
Au
g-0
9
Oct
-09
No
v-09
Jan
-10
Feb
-10
Ap
r-10
Jun
-10
Jul-
10
Sep
-10
Oct
-10
EV/EBITDA INDY

125
2011 Outlook
Exhibit 4. Profit and Loss (Rp bn)
2008 2009 2010F 2011F 2012F
Sales 2,314 2,487 3,684 4,269 4,665COGS 2,028 1,867 2,947 3,331 3,635Gross profit 287 620 737 938 1,030Operating expenses 164 428 675 645 681Operating profit 123 191 61 293 349EBITDA 147 357 290 571 671Other income/expenses 1,064 705 1,277 1,815 2,180Pre-tax profit 1,188 897 1,338 2,108 2,529Taxes (103) (158) (268) (422) (506)Net income before min. interest 1,085 739 1,071 1,687 2,023Minority interest (0) (13) (11) (18) (20)Net profit 1,085 726 1,060 1,669 2,004Core profit 902 1,150 903 1,770 2,231
Source: Company and Danareksa Sekuritas
Exhibit 5. Balance Sheet (Rp bn)
2008 2009 2010F 2011F 2012F
Cash 2,332 2,945 3,074 2,977 1,399Receivables 406 773 874 1,012 1,106Inventories 0 38 30 34 37Others 1,184 1,120 978 978 978Total current assets 3,922 4,876 4,955 5,001 3,520Property & plant - net 97 1,189 1,490 1,771 1,709Other noncurrent assets 4,691 5,618 5,869 6,804 7,275
Account payable 415 708 888 1,000 1,089Short term debt 0 52 51 52 55Others 365 623 588 2,959 596Total curr. liabs 781 1,382 1,527 4,011 1,740Long term debt 2,699 4,800 4,578 2,199 2,209Other long-term 17 157 157 157 157
Minority Interest 0 13 24 41 61Share capital 521 521 521 521 521Excess paid in 2,233 2,233 2,233 2,233 2,233Retained earnings & others 2,460 2,578 3,275 4,414 5,584Total equity 5,214 5,332 6,029 7,168 8,337
Source: Company and Danareksa Sekuritas
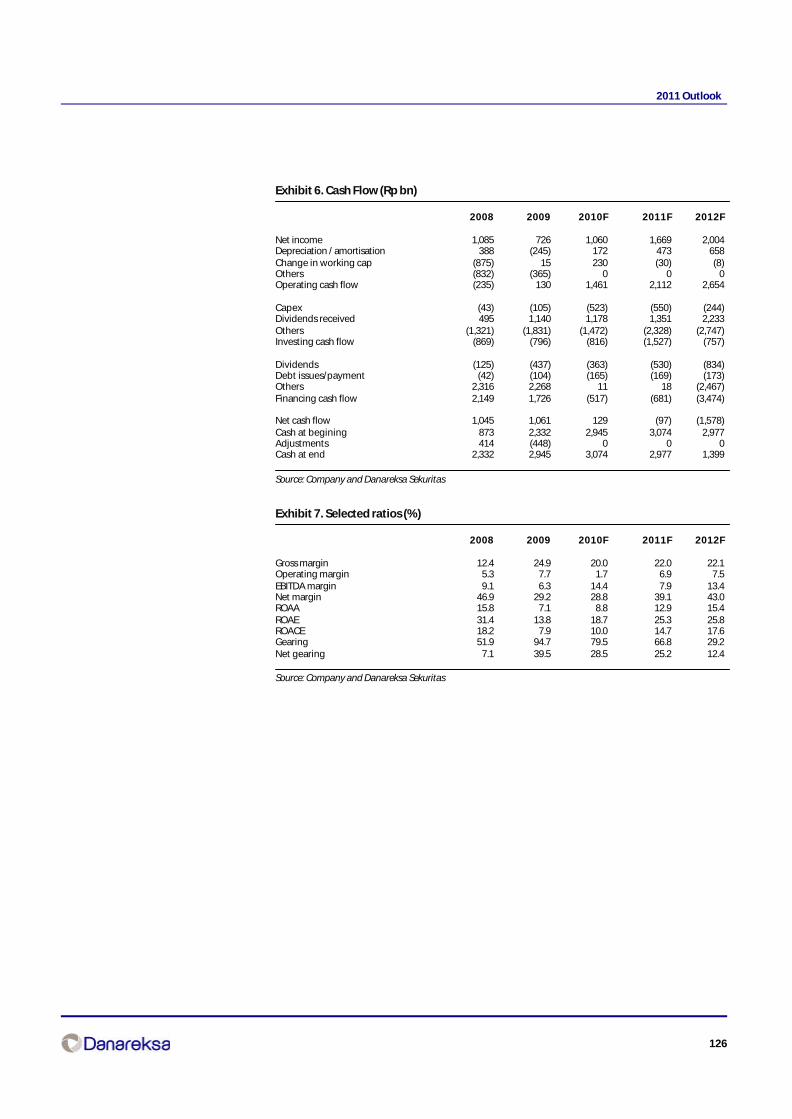
126
2011 Outlook
Exhibit 6. Cash Flow (Rp bn)
2008 2009 2010F 2011F 2012F
Net income 1,085 726 1,060 1,669 2,004Depreciation / amortisation 388 (245) 172 473 658Change in working cap (875) 15 230 (30) (8)Others (832) (365) 0 0 0Operating cash flow (235) 130 1,461 2,112 2,654
Capex (43) (105) (523) (550) (244)Dividends received 495 1,140 1,178 1,351 2,233Others (1,321) (1,831) (1,472) (2,328) (2,747)Investing cash flow (869) (796) (816) (1,527) (757)
Dividends (125) (437) (363) (530) (834)Debt issues/payment (42) (104) (165) (169) (173)Others 2,316 2,268 11 18 (2,467)Financing cash flow 2,149 1,726 (517) (681) (3,474)
Net cash flow 1,045 1,061 129 (97) (1,578)Cash at begining 873 2,332 2,945 3,074 2,977Adjustments 414 (448) 0 0 0Cash at end 2,332 2,945 3,074 2,977 1,399
Source: Company and Danareksa Sekuritas
Exhibit 7. Selected ratios (%)
2008 2009 2010F 2011F 2012F
Gross margin 12.4 24.9 20.0 22.0 22.1Operating margin 5.3 7.7 1.7 6.9 7.5EBITDA margin 9.1 6.3 14.4 7.9 13.4Net margin 46.9 29.2 28.8 39.1 43.0ROAA 15.8 7.1 8.8 12.9 15.4ROAE 31.4 13.8 18.7 25.3 25.8ROACE 18.2 7.9 10.0 14.7 17.6Gearing 51.9 94.7 79.5 66.8 29.2Net gearing 7.1 39.5 28.5 25.2 12.4
Source: Company and Danareksa Sekuritas
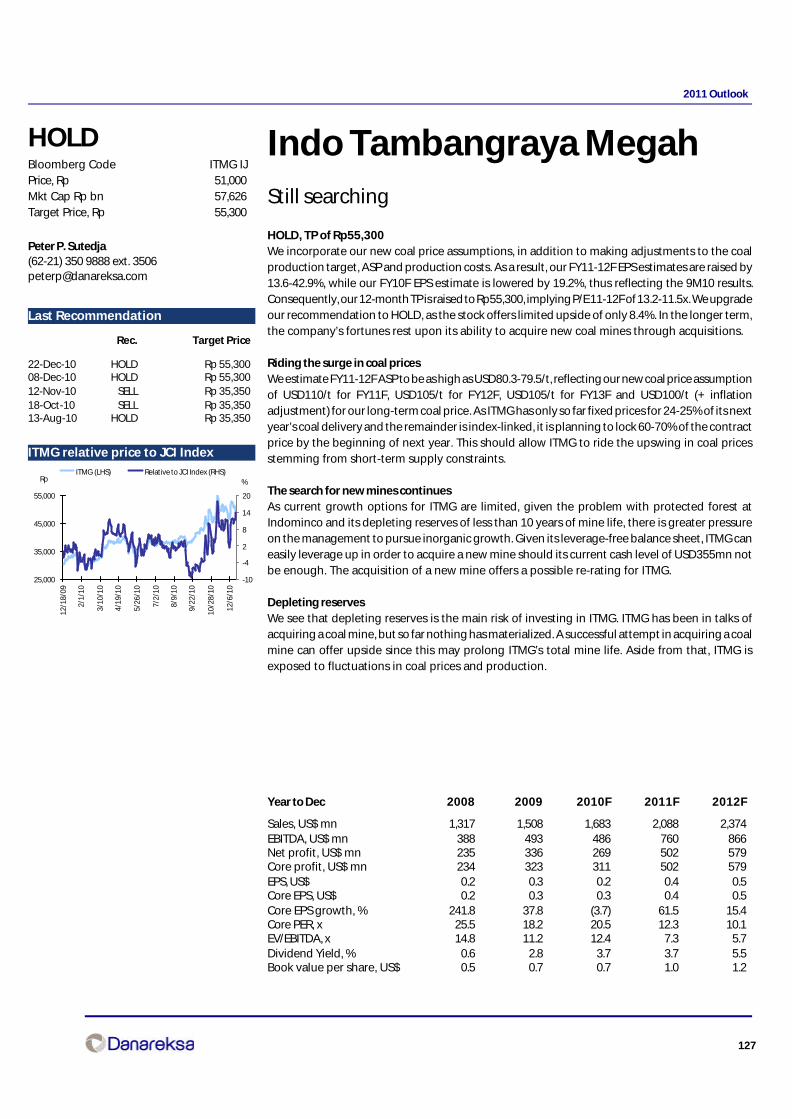
127
2011 Outlook
Indo Tambangraya MegahStill searching
HOLD, TP of Rp55,300We incorporate our new coal price assumptions, in addition to making adjustments to the coalproduction target, ASP and production costs. As a result, our FY11-12F EPS estimates are raised by13.6-42.9%, while our FY10F EPS estimate is lowered by 19.2%, thus reflecting the 9M10 results.Consequently, our 12-month TP is raised to Rp55,300, implying P/E 11-12F of 13.2-11.5x. We upgradeour recommendation to HOLD, as the stock offers limited upside of only 8.4%. In the longer term,the company’s fortunes rest upon its ability to acquire new coal mines through acquisitions.
Riding the surge in coal pricesWe estimate FY11-12F ASP to be as high as USD80.3-79.5/t, reflecting our new coal price assumptionof USD110/t for FY11F, USD105/t for FY12F, USD105/t for FY13F and USD100/t (+ inflationadjustment) for our long-term coal price. As ITMG has only so far fixed prices for 24-25% of its nextyear’s coal delivery and the remainder is index-linked, it is planning to lock 60-70% of the contractprice by the beginning of next year. This should allow ITMG to ride the upswing in coal pricesstemming from short-term supply constraints.
The search for new mines continuesAs current growth options for ITMG are limited, given the problem with protected forest atIndominco and its depleting reserves of less than 10 years of mine life, there is greater pressureon the management to pursue inorganic growth. Given its leverage-free balance sheet, ITMG caneasily leverage up in order to acquire a new mine should its current cash level of USD355mn notbe enough. The acquisition of a new mine offers a possible re-rating for ITMG.
Depleting reservesWe see that depleting reserves is the main risk of investing in ITMG. ITMG has been in talks ofacquiring a coal mine, but so far nothing has materialized. A successful attempt in acquiring a coalmine can offer upside since this may prolong ITMG’s total mine life. Aside from that, ITMG isexposed to fluctuations in coal prices and production.
Peter P. Sutedja(62-21) 350 9888 ext. [email protected]
HOLDBloomberg Code ITMG IJPrice, Rp 51,000Mkt Cap Rp bn 57,626Target Price, Rp 55,300
Last Recommendation
Rec. Target Price
22-Dec-10 HOLD Rp 55,30008-Dec-10 HOLD Rp 55,30012-Nov-10 SELL Rp 35,35018-Oct-10 SELL Rp 35,35013-Aug-10 HOLD Rp 35,350
ITMG relative price to JCI Index
Year to Dec 2008 2009 2010F 2011F 2012F
Sales, US$ mn 1,317 1,508 1,683 2,088 2,374EBITDA, US$ mn 388 493 486 760 866Net profit, US$ mn 235 336 269 502 579Core profit, US$ mn 234 323 311 502 579EPS, US$ 0.2 0.3 0.2 0.4 0.5Core EPS, US$ 0.2 0.3 0.3 0.4 0.5Core EPS growth, % 241.8 37.8 (3.7) 61.5 15.4Core PER, x 25.5 18.2 20.5 12.3 10.1EV/EBITDA, x 14.8 11.2 12.4 7.3 5.7Dividend Yield, % 0.6 2.8 3.7 3.7 5.5Book value per share, US$ 0.5 0.7 0.7 1.0 1.2
25,000
35,000
45,000
55,000
12/1
8/09
2/1/
10
3/10
/10
4/19
/10
5/26
/10
7/2/
10
8/9/
10
9/22
/10
10/2
8/10
12/6
/10
-10
-4
2
8
14
20
ITMG (LHS) Relative to JCI Index (RHS)%Rp
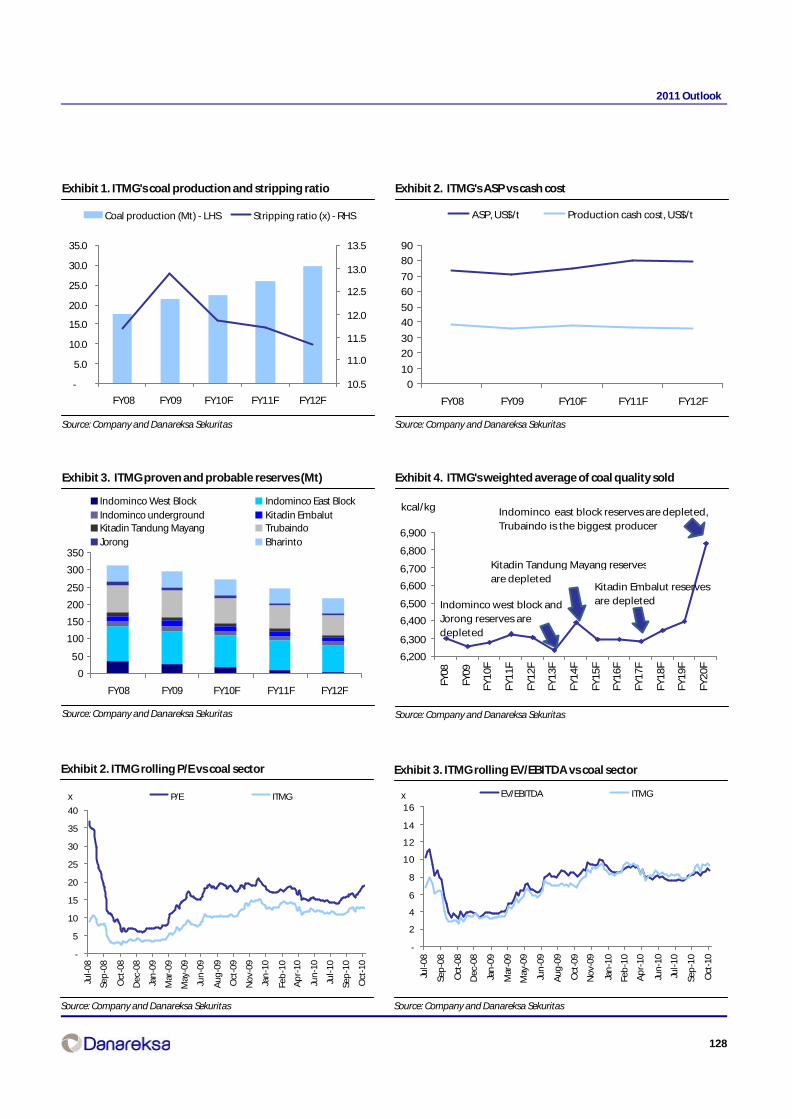
128
2011 Outlook
Exhibit 2. ITMG rolling P/E vs coal sector
Source: Company and Danareksa Sekuritas
Exhibit 3. ITMG rolling EV/EBITDA vs coal sector
Source: Company and Danareksa Sekuritas
x x
-
5
10
15
20
25
30
35
40
Jul-
08
Sep
-08
Oct
-08
Dec
-08
Jan
-09
Mar
-09
May
-09
Jun
-09
Au
g-0
9
Oct
-09
No
v-09
Jan
-10
Feb
-10
Ap
r-10
Jun
-10
Jul-
10
Sep
-10
Oct
-10
P/E ITMG
-
2
4
6
8
10
12
14
16
Jul-
08
Sep
-08
Oct
-08
Dec
-08
Jan
-09
Mar
-09
May
-09
Jun
-09
Au
g-0
9
Oct
-09
No
v-09
Jan
-10
Feb
-10
Ap
r-10
Jun
-10
Jul-
10
Sep
-10
Oct
-10
EV/EBITDA ITMG
Exhibit 1. ITMG's coal production and stripping ratio
Source: Company and Danareksa Sekuritas
Exhibit 2. ITMG's ASP vs cash cost
Source: Company and Danareksa Sekuritas
Exhibit 3. ITMG proven and probable reserves (Mt)
Source: Company and Danareksa Sekuritas
Exhibit 4. ITMG's weighted average of coal quality sold
Source: Company and Danareksa Sekuritas
-
5.0
10.0
15.0
20.0
25.0
30.0
35.0
FY08 FY09 FY10F FY11F FY12F
10.5
11.0
11.5
12.0
12.5
13.0
13.5
Coal production (Mt) - LHS Stripping ratio (x) - RHS
0
10
20
30
40
50
60
70
80
90
FY08 FY09 FY10F FY11F FY12F
ASP, US$/t Production cash cost, US$/t
0
50
100
150
200
250
300
350
FY08 FY09 FY10F FY11F FY12F
Indominco West Block Indominco East BlockIndominco underground Kitadin EmbalutKitadin Tandung Mayang TrubaindoJorong Bharinto
6,200
6,300
6,400
6,500
6,600
6,700
6,800
6,900
FY08
FY09
FY1
0F
FY1
1F
FY1
2F
FY1
3F
FY1
4F
FY1
5F
FY1
6F
FY1
7F
FY1
8F
FY1
9F
FY2
0F
kcal/kg
Indominco west block and Jorong reserves are depleted
Kitadin Tandung Mayang reserves are depleted
Kitadin Embalut reserves are depleted
Indominco east block reserves are depleted,Trubaindo is the biggest producer
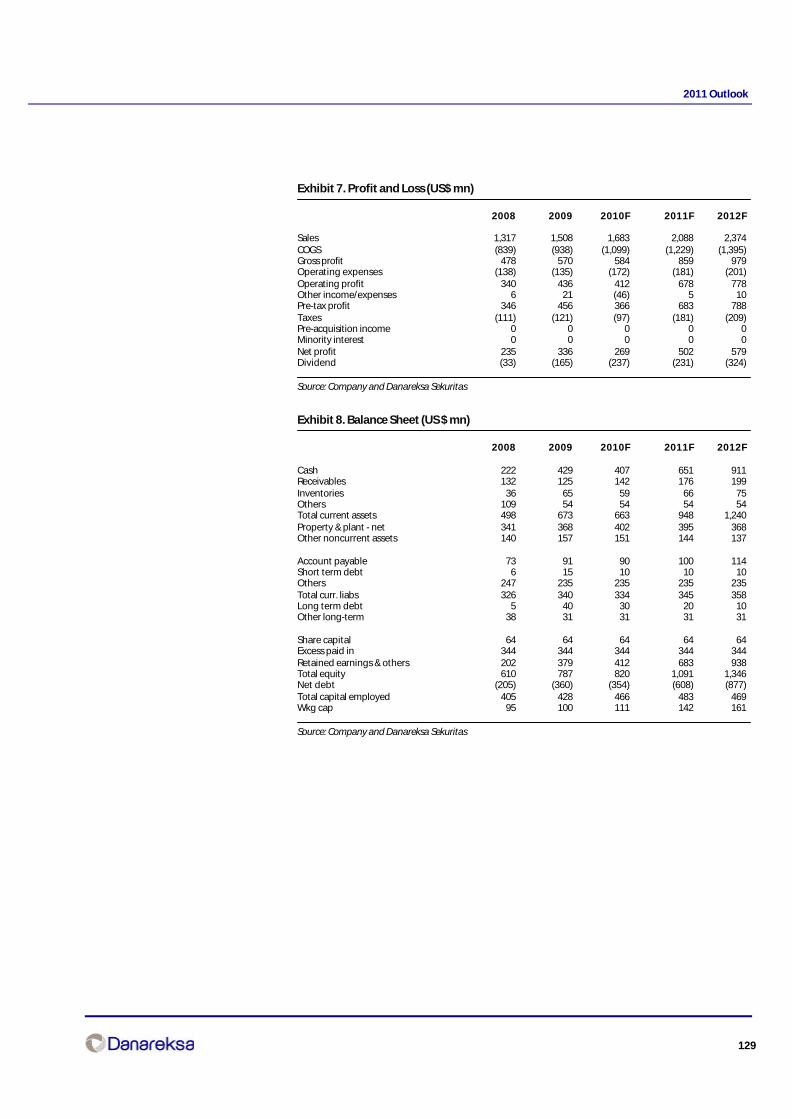
129
2011 Outlook
Exhibit 7. Profit and Loss (US$ mn)
2008 2009 2010F 2011F 2012F
Sales 1,317 1,508 1,683 2,088 2,374COGS (839) (938) (1,099) (1,229) (1,395)Gross profit 478 570 584 859 979Operating expenses (138) (135) (172) (181) (201)Operating profit 340 436 412 678 778Other income/expenses 6 21 (46) 5 10Pre-tax profit 346 456 366 683 788Taxes (111) (121) (97) (181) (209)Pre-acquisition income 0 0 0 0 0Minority interest 0 0 0 0 0Net profit 235 336 269 502 579Dividend (33) (165) (237) (231) (324)
Source: Company and Danareksa Sekuritas
Exhibit 8. Balance Sheet (US $ mn)
2008 2009 2010F 2011F 2012F
Cash 222 429 407 651 911Receivables 132 125 142 176 199Inventories 36 65 59 66 75Others 109 54 54 54 54Total current assets 498 673 663 948 1,240Property & plant - net 341 368 402 395 368Other noncurrent assets 140 157 151 144 137
Account payable 73 91 90 100 114Short term debt 6 15 10 10 10Others 247 235 235 235 235Total curr. liabs 326 340 334 345 358Long term debt 5 40 30 20 10Other long-term 38 31 31 31 31
Share capital 64 64 64 64 64Excess paid in 344 344 344 344 344Retained earnings & others 202 379 412 683 938Total equity 610 787 820 1,091 1,346Net debt (205) (360) (354) (608) (877)Total capital employed 405 428 466 483 469Wkg cap 95 100 111 142 161
Source: Company and Danareksa Sekuritas

130
2011 Outlook
Exhibit 9. Cash Flow (US$ mn)
2008 2009 2010F 2011F 2012F
Net income 235 336 269 502 579Depreciation / amortisation 48 57 74 82 88Gross cash flow 283 393 343 584 667
Capex (95) (74) (101) (69) (54)Change in working cap 57 (37) (12) (30) (19)Free cash flow 245 282 231 485 594
Dividends (88) (151) (237) (231) (324)Investment 0 (0) 0 0 0Debt issues/payment (81) 44 (15) (10) (10)Others (112) 33 (0) 0 0Net cash flow (36) 207 (21) 244 260
Cash at begining 258 222 429 407 651Cash at end 222 429 407 651 911
Source: Company and Danareksa Sekuritas
Exhibit 10. Selected ratios (%)
2008 2009 2010F 2011F 2012F
Gross margin 36.3 37.8 34.7 41.1 41.2Operating margin 25.8 28.9 24.5 32.5 32.8EBITDA margin 29.5 32.7 28.9 36.4 36.5Net margin 17.8 22.2 16.0 24.0 24.4ROAA 26.8 30.8 22.3 37.2 35.9ROAE 44.0 48.0 33.5 52.5 47.6ROACE 39.4 45.2 31.1 50.0 46.1Gearing 2.7 8.7 6.6 4.0 2.5Net gearing (33.6) (45.7) (43.1) (55.7) (65.2)
Source: Company and Danareksa Sekuritas

131
2011 Outlook
Indocement Tunggal PrakarsaLargest spare capacityBUYIndocement is well positioned to enjoy market growth with its idle capacity, while its competitorsare running close to full utilization. Moreover, Indocement has the highest EBITDA margincompared to its competitors due to its strategic locations in Java and Kalimantan. Indocement hasmaximized the production technology from its parent Heidelberger. By doing so, Indocementshould be able to achieve better production efficiency within world class standards. Indocementalso produces Portland Composite Cement with a lower clinker content from its parent company.We like the company for these reasons and recommend a BUY on the counter. Our Target Priceis Rp19,820.
Largest idle capacityIndocement has production capacity of approximately 19.0mn tonnes. The utilization rate willprobably only reach 71% in FY10. This leaves plenty of room for further growth. Meanwhile itscompetitors are already running at nearly full capacity, making it difficult for them to captureadditional volume in a growing market. The company has the lowest clinker content in the marketof 81% and is aiming to reduce this further to 76% in FY12. For this reason, Indocement has investedin additional cement mills to push up production capacity. According to the company, theproduction capacity can be pushed up further to nearly 20.0mn tonnes. If the market grows by8% p.a, Indocement will not need to invest in new capacity over the next five years. But rememberthat a green filed project will need 3 years to complete. Hence, we should see Indocement starta new plant two years down the road.
The highest marginsIndocement had the highest EBITDA margin of nearly 40% in 9M10. Indocement has about 85%of its capacity located in Java, where it sells 50% of its cement. Transportation costs in Java arerelatively low since the island is already well developed. This coupled with the fact that demandis strong in Java means that the market in Java is very lucrative. As a result, Indocement enjoys verygood margins. We think that the cement industry’s margin is already at a peak. Going forward,margins sustainability will largely depend on how strong demand is. This is because any costincreases can only be passed onto the customers if demand is firm. For instance, cement producersdid not increase their selling prices when electricity rates were hiked in 2010. Fortunately for cementproducers, however, other costs declined due to the stronger rupiah.
Risk: higher fuel costsIndocement’s power generation comes from four sources: the PLN state-owned electricitycompany (24%), diesel fuel based (38%), coal (14%) and gas (24%). Therefore, Indocement is moresensitive to diesel oil price increases than PLN tariff increases. Any jump in fuel costs by 10% willreduce net profits by 1%. Indocement is exposed to higher fuel risk than its competitors. In contrast,Semen Gresik and Holcim Indonesia are more dependent on PLN electricity. Hence, if fuel pricesincrease, they still enjoy the fixed tariffs of PLN, while Indocement will have to endure higherproduction costs.
Chandra S Pasaribu(62-21) 351 [email protected]
BUYBloomberg Code INTP IJPrice, Rp 16,000Mkt Cap Rp bn 58,899Target Price, Rp 19,820
Last Recommendation
Rec. Target Price
22-Dec-10 BUY Rp 19,82016-Nov-10 BUY Rp 20,80014-Oct-10 BUY Rp 20,80018-Aug-10 BUY Rp 20,80004-May-10 BUY Rp 17,300
INTP relative price to JCI Index
2008 2009 2010F 2011F 2012F
Revenue, Rp bn 9,780 10,576 10,941 13,703 15,933EBITDA, Rp bn 3,073 4,241 4,827 5,509 6,347Net profit, Rp bn 1,746 2,747 3,221 3,779 4,470Core profit, Rp bn 1,782 2,684 3,213 3,781 4,471Core EPS fully diluted, Rp 484 729 873 1,027 1,214Core EPS fully diluted growth, % 83.9 50.6 19.7 17.7 18.3BVPS, Rp 2,309 2,901 3,470 4,138 4,745Core PER fully diluted, x 33.1 21.9 18.3 15.6 13.2EV/EBITDA, x 19.2 13.3 11.3 9.4 7.8Yield, % 0.7 1.6 1.9 2.2 3.8
12,000
14,000
16,000
18,000
20,000
12/1
8/09
2/1/
10
3/10
/10
4/19
/10
5/26
/10
7/2/
10
8/9/
10
9/22
/10
10/2
8/10
12/6
/10
-15
-5
5
15
25
INTP (LHS) Relative to JCI Index (RHS)%Rp
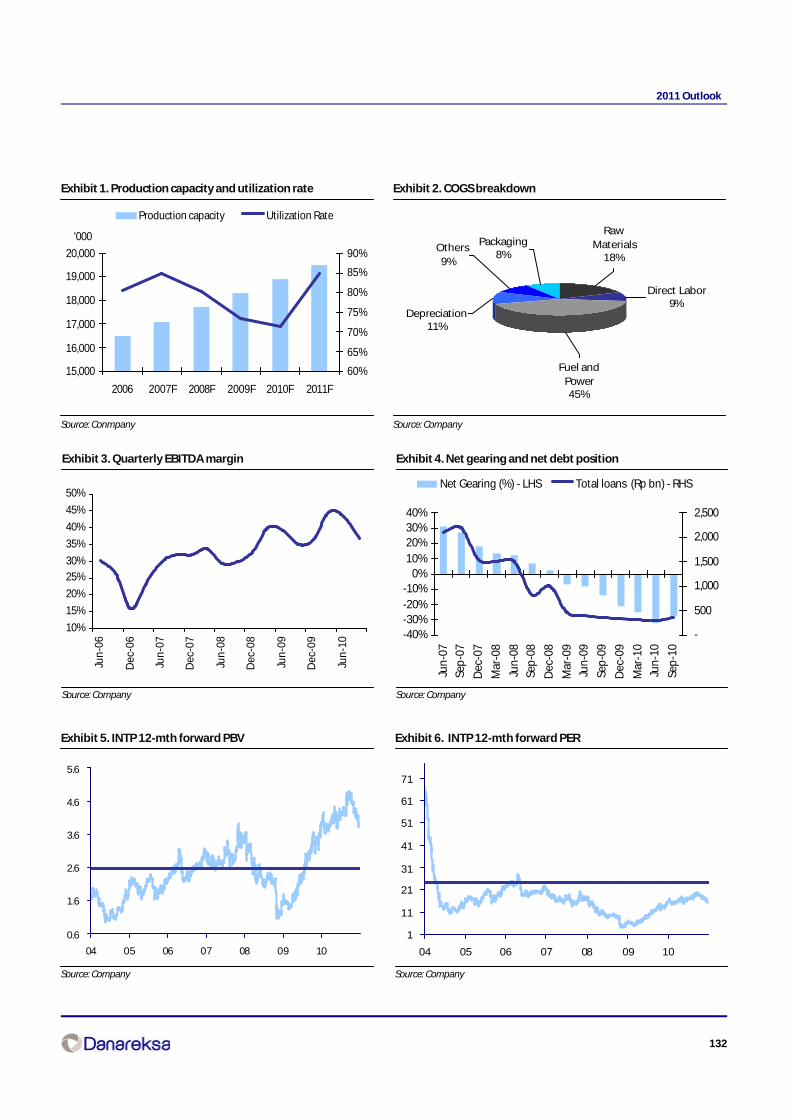
132
2011 Outlook
Exhibit 1. Production capacity and utilization rate
Source: Conmpany
Exhibit 2. COGS breakdown
Source: Company
Exhibit 3. Quarterly EBITDA margin
Source: Company
Exhibit 4. Net gearing and net debt position
Source: Company
Exhibit 5. INTP 12-mth forward PBV
Source: Company
Exhibit 6. INTP 12-mth forward PER
Source: Company
15,000
16,000
17,000
18,000
19,000
20,000
2006 2007F 2008F 2009F 2010F 2011F
60%
65%
70%
75%
80%
85%
90%
Production capacity Utilization Rate
'000 Raw Materials
18%
Direct Labor9%
Depreciation11%
Others9%
Packaging8%
Fuel and Power45%
10%
15%
20%
25%
30%
35%
40%
45%
50%
Jun
-06
Dec
-06
Jun
-07
Dec
-07
Jun
-08
Dec
-08
Jun
-09
Dec
-09
Jun
-10 -40%
-30%-20%-10%
0%10%20%30%40%
Jun-
07
Sep
-07
Dec
-07
Mar
-08
Jun-
08
Sep
-08
Dec
-08
Mar
-09
Jun-
09
Sep
-09
Dec
-09
Mar
-10
Jun-
10
Sep
-10
-
500
1,000
1,500
2,000
2,500
Net Gearing (%) - LHS Total loans (Rp bn) - RHS
1
11
21
31
41
51
61
71
04 05 06 07 08 09 10
0.6
1.6
2.6
3.6
4.6
5.6
04 05 06 07 08 09 10
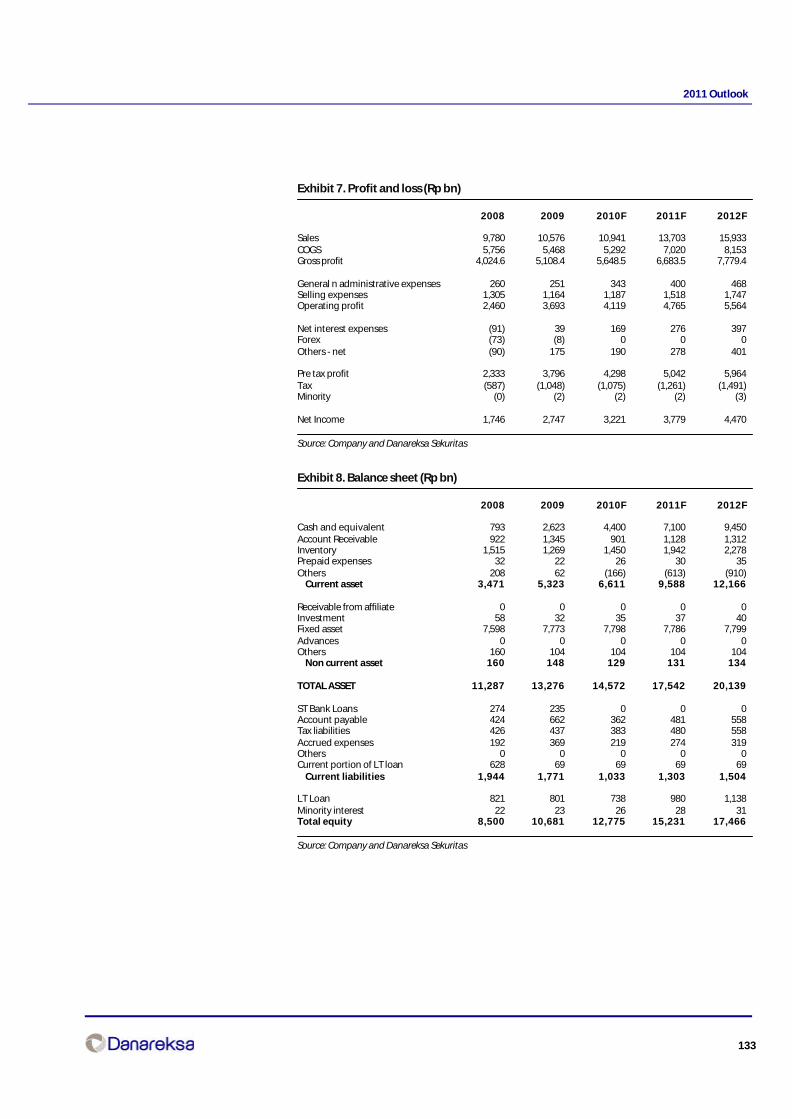
133
2011 Outlook
Exhibit 7. Profit and loss (Rp bn)
2008 2009 2010F 2011F 2012F
Sales 9,780 10,576 10,941 13,703 15,933COGS 5,756 5,468 5,292 7,020 8,153Gross profit 4,024.6 5,108.4 5,648.5 6,683.5 7,779.4
General n administrative expenses 260 251 343 400 468Selling expenses 1,305 1,164 1,187 1,518 1,747Operating profit 2,460 3,693 4,119 4,765 5,564
Net interest expenses (91) 39 169 276 397Forex (73) (8) 0 0 0Others - net (90) 175 190 278 401
Pre tax profit 2,333 3,796 4,298 5,042 5,964Tax (587) (1,048) (1,075) (1,261) (1,491)Minority (0) (2) (2) (2) (3)
Net Income 1,746 2,747 3,221 3,779 4,470
Source: Company and Danareksa Sekuritas
Exhibit 8. Balance sheet (Rp bn)
2008 2009 2010F 2011F 2012F
Cash and equivalent 793 2,623 4,400 7,100 9,450Account Receivable 922 1,345 901 1,128 1,312Inventory 1,515 1,269 1,450 1,942 2,278Prepaid expenses 32 22 26 30 35Others 208 62 (166) (613) (910) Current asset 3,471 5,323 6,611 9,588 12,166
Receivable from affiliate 0 0 0 0 0Investment 58 32 35 37 40Fixed asset 7,598 7,773 7,798 7,786 7,799Advances 0 0 0 0 0Others 160 104 104 104 104 Non current asset 160 148 129 131 134
TOTAL ASSET 11,287 13,276 14,572 17,542 20,139
ST Bank Loans 274 235 0 0 0Account payable 424 662 362 481 558Tax liabilities 426 437 383 480 558Accrued expenses 192 369 219 274 319Others 0 0 0 0 0Current portion of LT loan 628 69 69 69 69 Current liabilities 1,944 1,771 1,033 1,303 1,504
LT Loan 821 801 738 980 1,138Minority interest 22 23 26 28 31Total equity 8,500 10,681 12,775 15,231 17,466
Source: Company and Danareksa Sekuritas
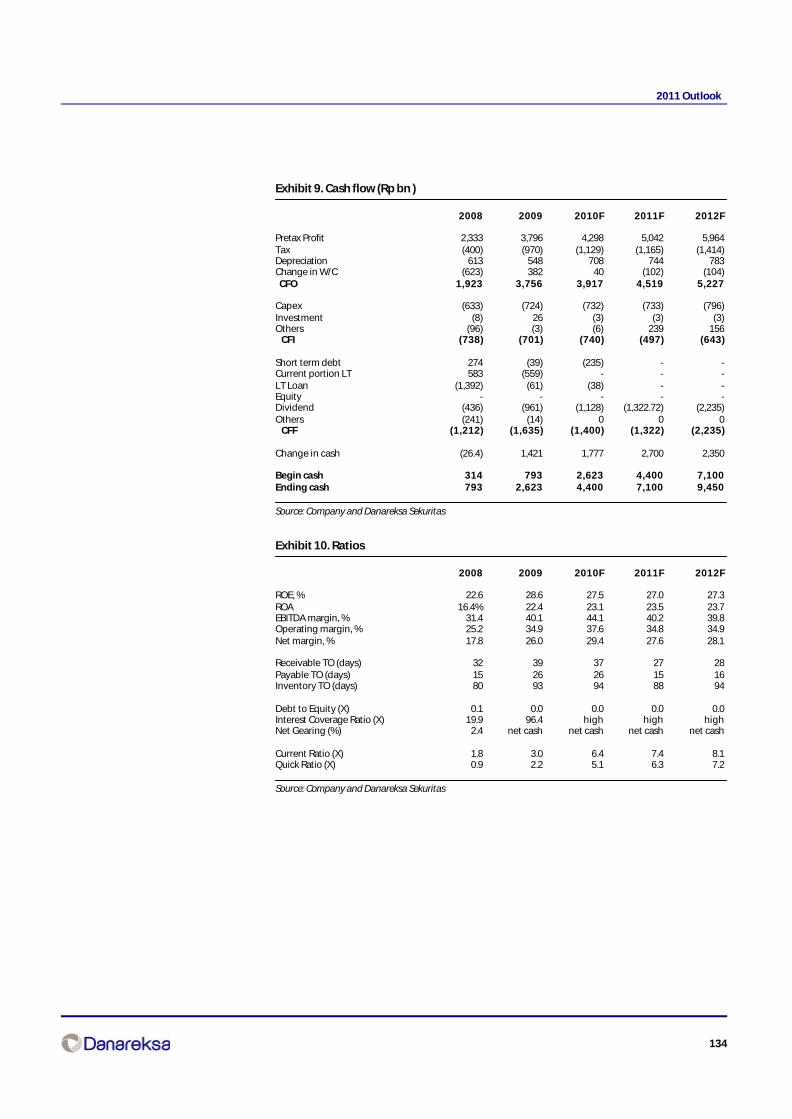
134
2011 Outlook
Exhibit 9. Cash flow (Rp bn )
2008 2009 2010F 2011F 2012F
Pretax Profit 2,333 3,796 4,298 5,042 5,964Tax (400) (970) (1,129) (1,165) (1,414)Depreciation 613 548 708 744 783Change in W/C (623) 382 40 (102) (104) CFO 1,923 3,756 3,917 4,519 5,227
Capex (633) (724) (732) (733) (796)Investment (8) 26 (3) (3) (3)Others (96) (3) (6) 239 156 CFI (738) (701) (740) (497) (643)
Short term debt 274 (39) (235) - -Current portion LT 583 (559) - - -LT Loan (1,392) (61) (38) - -Equity - - - - -Dividend (436) (961) (1,128) (1,322.72) (2,235)Others (241) (14) 0 0 0 CFF (1,212) (1,635) (1,400) (1,322) (2,235)
Change in cash (26.4) 1,421 1,777 2,700 2,350
Begin cash 314 793 2,623 4,400 7,100Ending cash 793 2,623 4,400 7,100 9,450
Source: Company and Danareksa Sekuritas
Exhibit 10. Ratios
2008 2009 2010F 2011F 2012F
ROE, % 22.6 28.6 27.5 27.0 27.3ROA 16.4% 22.4 23.1 23.5 23.7EBITDA margin, % 31.4 40.1 44.1 40.2 39.8Operating margin, % 25.2 34.9 37.6 34.8 34.9Net margin, % 17.8 26.0 29.4 27.6 28.1
Receivable TO (days) 32 39 37 27 28Payable TO (days) 15 26 26 15 16Inventory TO (days) 80 93 94 88 94
Debt to Equity (X) 0.1 0.0 0.0 0.0 0.0Interest Coverage Ratio (X) 19.9 96.4 high high highNet Gearing (%) 2.4 net cash net cash net cash net cash
Current Ratio (X) 1.8 3.0 6.4 7.4 8.1Quick Ratio (X) 0.9 2.2 5.1 6.3 7.2
Source: Company and Danareksa Sekuritas

135
2011 Outlook
Indofood CBPLimited room for margins upside
Maintain HOLDRising commodity prices, chiefly wheat and CPO, may put the share price under pressure. This isthe main reason for our Hold recommendation. Further flour price increases are likely, in our view,following continued rising wheat prices which already hit US$7.2/bushel (+20% higher than itsytd average). The CPO price is also expected to be in a bullish trend up to 1H11 – we expect it toreach US$925/ton next year. Despite reasonable pricing power in noodles, price adjustments arelikely to lag the recent sharp spikes in input costs. This is because the company aims to balanceprofitability, growth, and market share – thus limiting room for margins upside, in our view. Weestimate noodles and dairy operating margins of 15.0-12.9% next year. The stock is now tradingat 15.6x P/E11F which we think is fair given mediocre earnings growth of 10-12% for FY11-12F. Weset our TP at Rp5,500, implying 20.2-18.0x P/E11F.
Where is the noodle margin headed?Modest price increases amidst soaring commodity prices mean that noodle operating marginswill be pushed lower – to around 15.0% in FY11F from 15.9% this year. Price increases are stillplausible, we think, given greater purchasing power. However, quarterly margins might be volatileas the price adjustments are likely to lag the sharp spikes in input costs. It may be tough for thecompany to wholly offset the price increases of the raw materials flour and cooking oil, which makeup some 50% of the total costs. Our sensitivity analysis suggests that for every 1% increase in theflour price, ICBP’s earnings would drop by 1.5%. As for a 1% increase in the price of cooking oil,it would reduce the company’s earnings by 0.6%. Furthermore, learning from its experiences in2004, they are not likely to hike selling prices more than the inflation rate – on fears they couldnot win back lost market share. It’s also the case that the average noodle price increase is in linewith the average inflation rate on a 15 years historical basis.
The pricing gap with rice is narrowingYes, rice prices are on the rise (up 18% ytd average), although they could normalize next year as1) the harvesting season begins in Feb 2010, and 2) the government could undertake marketoperations or price controls to curb inflation. We thus expect noodle volume to grow by a modest4% amidst expected 5% price increases. This is because noodles continue to be the cheapest mealoption on a per serving basis and noodle volume tends to increase when the pricing gap withrice narrows. For example, when the noodle premium over rice on a per kg basis started to declinefrom 89% in Sep 09 to 52% in Sep 10, noodle volume growth rose to 4% from 1% previously. Thus,as we expect the pricing premium to hover around 50-60% going forward, 4% volume growth isattainable, we believe.
Merlissa P. Trisno(62-21) 350 9888. ext. [email protected]
HOLDBloomberg Code ICBP IJPrice, Rp 4,525Mkt Cap Rp bn 26,385Target Price, Rp 5,500
ICBP relative price to JCI Index
Last Recommendation
Rec. Target Price
22-Dec-10 HOLD Rp 5,50025-Nov-10 HOLD Rp 5,500
4,000
4,500
5,000
5,500
6,000
10/6
/10
10/1
5/10
10/2
6/10
11/4
/10
11/1
5/10
11/2
5/10
12/6
/10
12/1
6/10
-20
-10
0
10
20
ICBP (LHS) Relative to JCI Index (RHS)%Rp
2008 2009 2010F 2011F 2012F
Sales (Rp bn) 12,043 16,333 17,829 19,463 21,219EBITDA (Rp bn) 671 2,071 2,889 3,076 3,506Net profit (Rp bn) 339 1,078 1,583 1,733 1,940Core profit (Rp bn) 335 1,051 1,583 1,733 1,940Core EPS (Rp) 57 180 272 297 333Core EPS growth (%) 546.2 213.6 50.6 9.4 12.0Core PER (x) 78.7 25.1 16.7 15.2 13.6EV/EBITDA (X) 39.3 12.7 9.1 8.6 7.5Dividend Yield (%) - - - 2.4 2.6
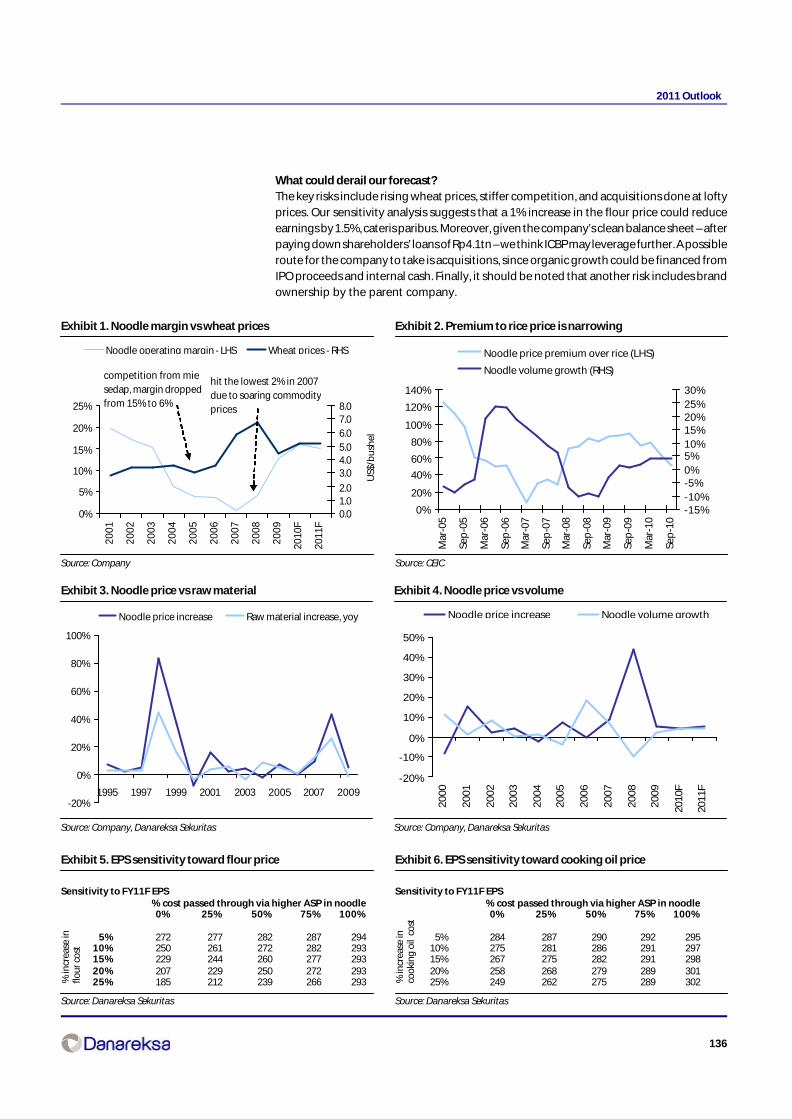
136
2011 Outlook
What could derail our forecast?The key risks include rising wheat prices, stiffer competition, and acquisitions done at loftyprices. Our sensitivity analysis suggests that a 1% increase in the flour price could reduceearnings by 1.5%, cateris paribus. Moreover, given the company’s clean balance sheet – afterpaying down shareholders’ loans of Rp4.1tn – we think ICBP may leverage further. A possibleroute for the company to take is acquisitions, since organic growth could be financed fromIPO proceeds and internal cash. Finally, it should be noted that another risk includes brandownership by the parent company.
Exhibit 1. Noodle margin vs wheat prices
Source: Company
Exhibit 2. Premium to rice price is narrowing
Source: CEIC
0%
5%
10%
15%
20%
25%
20
01
20
02
20
03
20
04
20
05
20
06
20
07
20
08
20
09
2010
F
2011
F
0.01.02.0
3.04.05.06.07.08.0
Noodle operating margin - LHS Wheat prices - RHS
competition from mie sedap, margin dropped from 15% to 6%
hit the lowest 2% in 2007due to soaring commodity prices
US$
/bu
shel
0%
20%
40%
60%
80%
100%
120%
140%
Mar
-05
Sep
-05
Mar
-06
Sep
-06
Mar
-07
Sep
-07
Mar
-08
Sep
-08
Mar
-09
Sep
-09
Mar
-10
Sep
-10
-15%-10%-5%0%5%10%15%20%25%30%
Noodle price premium over rice (LHS)
Noodle volume growth (RHS)
Exhibit 3. Noodle price vs raw material
Source: Company, Danareksa Sekuritas
Exhibit 4. Noodle price vs volume
Source: Company, Danareksa Sekuritas
-20%
0%
20%
40%
60%
80%
100%
1995 1997 1999 2001 2003 2005 2007 2009
Noodle price increase Raw material increase, yoy
-20%
-10%
0%
10%
20%
30%
40%
50%
20
00
20
01
20
02
20
03
20
04
20
05
20
06
20
07
20
08
20
09
2010
F
2011
F
Noodle price increase Noodle volume growth
Exhibit 5. EPS sensitivity toward flour price
Sensitivity to FY11F EPS % cost passed through via higher ASP in noodle
0% 25% 50% 75% 100%
5% 272 277 282 287 29410% 250 261 272 282 29315% 229 244 260 277 29320% 207 229 250 272 29325% 185 212 239 266 293
Source: Danareksa Sekuritas
% in
crea
se in
flour
cos
t
Exhibit 6. EPS sensitivity toward cooking oil price
Sensitivity to FY11F EPS % cost passed through via higher ASP in noodle
0% 25% 50% 75% 100%
5% 284 287 290 292 29510% 275 281 286 291 29715% 267 275 282 291 29820% 258 268 279 289 30125% 249 262 275 289 302
Source: Danareksa Sekuritas
% in
crea
se in
cook
ing
oil
cost
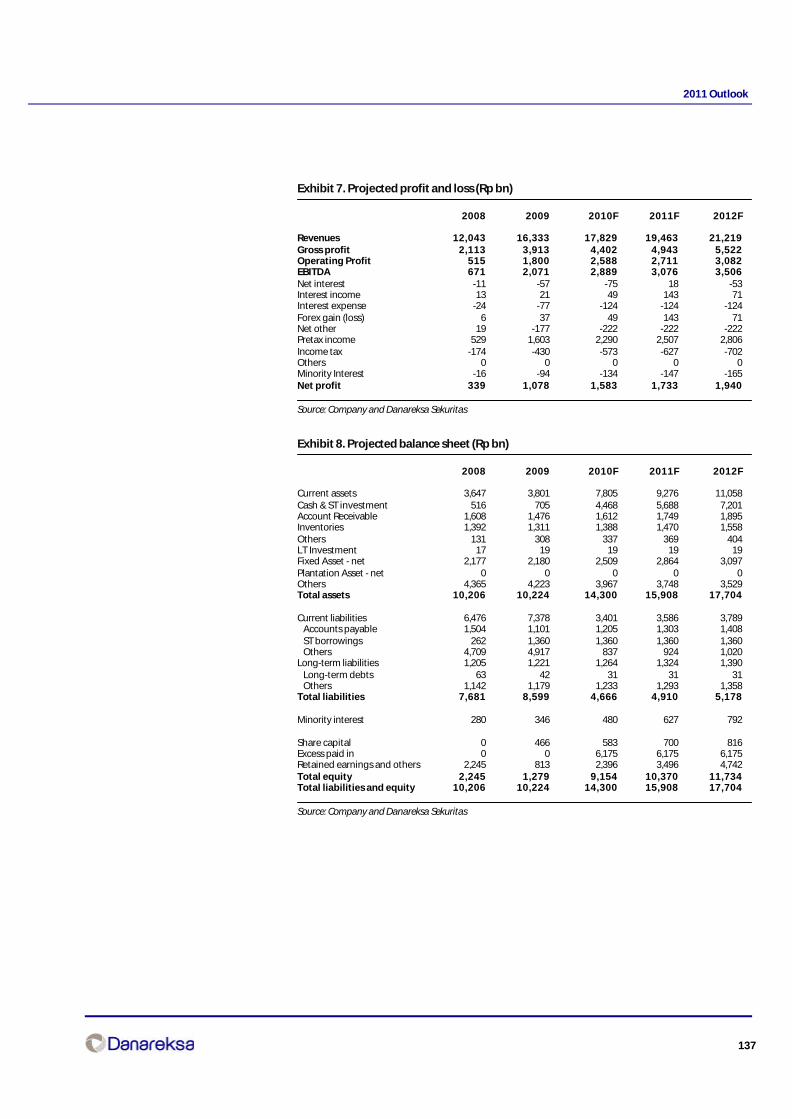
137
2011 Outlook
Exhibit 7. Projected profit and loss (Rp bn)
2008 2009 2010F 2011F 2012F
Revenues 12,043 16,333 17,829 19,463 21,219Gross profit 2,113 3,913 4,402 4,943 5,522Operating Profit 515 1,800 2,588 2,711 3,082EBITDA 671 2,071 2,889 3,076 3,506Net interest -11 -57 -75 18 -53Interest income 13 21 49 143 71Interest expense -24 -77 -124 -124 -124Forex gain (loss) 6 37 49 143 71Net other 19 -177 -222 -222 -222Pretax income 529 1,603 2,290 2,507 2,806Income tax -174 -430 -573 -627 -702Others 0 0 0 0 0Minority Interest -16 -94 -134 -147 -165Net profit 339 1,078 1,583 1,733 1,940
Source: Company and Danareksa Sekuritas
Exhibit 8. Projected balance sheet (Rp bn)
2008 2009 2010F 2011F 2012F
Current assets 3,647 3,801 7,805 9,276 11,058Cash & ST investment 516 705 4,468 5,688 7,201Account Receivable 1,608 1,476 1,612 1,749 1,895Inventories 1,392 1,311 1,388 1,470 1,558Others 131 308 337 369 404LT Investment 17 19 19 19 19Fixed Asset - net 2,177 2,180 2,509 2,864 3,097Plantation Asset - net 0 0 0 0 0Others 4,365 4,223 3,967 3,748 3,529Total assets 10,206 10,224 14,300 15,908 17,704
Current liabilities 6,476 7,378 3,401 3,586 3,789 Accounts payable 1,504 1,101 1,205 1,303 1,408 ST borrowings 262 1,360 1,360 1,360 1,360 Others 4,709 4,917 837 924 1,020Long-term liabilities 1,205 1,221 1,264 1,324 1,390 Long-term debts 63 42 31 31 31 Others 1,142 1,179 1,233 1,293 1,358Total liabilities 7,681 8,599 4,666 4,910 5,178
Minority interest 280 346 480 627 792
Share capital 0 466 583 700 816Excess paid in 0 0 6,175 6,175 6,175Retained earnings and others 2,245 813 2,396 3,496 4,742Total equity 2,245 1,279 9,154 10,370 11,734Total liabilities and equity 10,206 10,224 14,300 15,908 17,704
Source: Company and Danareksa Sekuritas
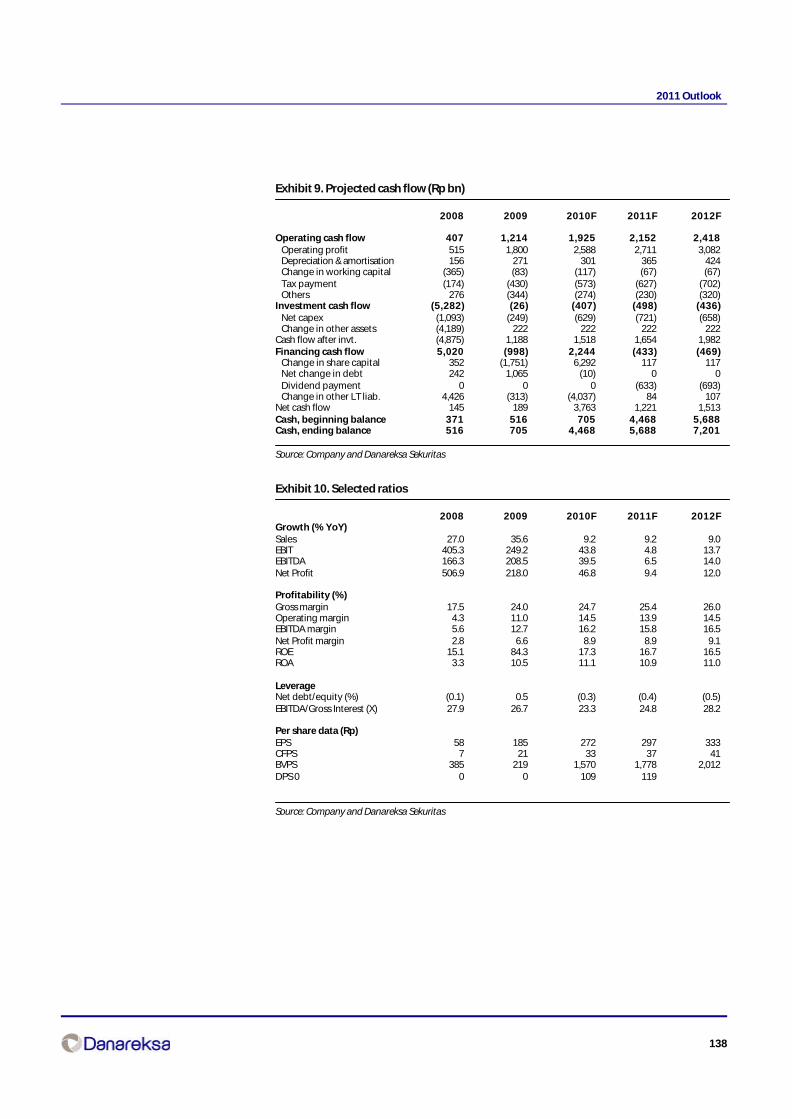
138
2011 Outlook
Exhibit 9. Projected cash flow (Rp bn)
2008 2009 2010F 2011F 2012F
Operating cash flow 407 1,214 1,925 2,152 2,418 Operating profit 515 1,800 2,588 2,711 3,082 Depreciation & amortisation 156 271 301 365 424 Change in working capital (365) (83) (117) (67) (67) Tax payment (174) (430) (573) (627) (702) Others 276 (344) (274) (230) (320)Investment cash flow (5,282) (26) (407) (498) (436) Net capex (1,093) (249) (629) (721) (658) Change in other assets (4,189) 222 222 222 222Cash flow after invt. (4,875) 1,188 1,518 1,654 1,982Financing cash flow 5,020 (998) 2,244 (433) (469) Change in share capital 352 (1,751) 6,292 117 117 Net change in debt 242 1,065 (10) 0 0 Dividend payment 0 0 0 (633) (693) Change in other LT liab. 4,426 (313) (4,037) 84 107Net cash flow 145 189 3,763 1,221 1,513Cash, beginning balance 371 516 705 4,468 5,688Cash, ending balance 516 705 4,468 5,688 7,201
Source: Company and Danareksa Sekuritas
Exhibit 10. Selected ratios
2008 2009 2010F 2011F 2012FGrowth (% YoY)Sales 27.0 35.6 9.2 9.2 9.0EBIT 405.3 249.2 43.8 4.8 13.7EBITDA 166.3 208.5 39.5 6.5 14.0Net Profit 506.9 218.0 46.8 9.4 12.0
Profitability (%)Gross margin 17.5 24.0 24.7 25.4 26.0Operating margin 4.3 11.0 14.5 13.9 14.5EBITDA margin 5.6 12.7 16.2 15.8 16.5Net Profit margin 2.8 6.6 8.9 8.9 9.1ROE 15.1 84.3 17.3 16.7 16.5ROA 3.3 10.5 11.1 10.9 11.0
LeverageNet debt/equity (%) (0.1) 0.5 (0.3) (0.4) (0.5)EBITDA/Gross Interest (X) 27.9 26.7 23.3 24.8 28.2
Per share data (Rp)EPS 58 185 272 297 333CFPS 7 21 33 37 41BVPS 385 219 1,570 1,778 2,012DPS 0 0 0 109 119
Source: Company and Danareksa Sekuritas
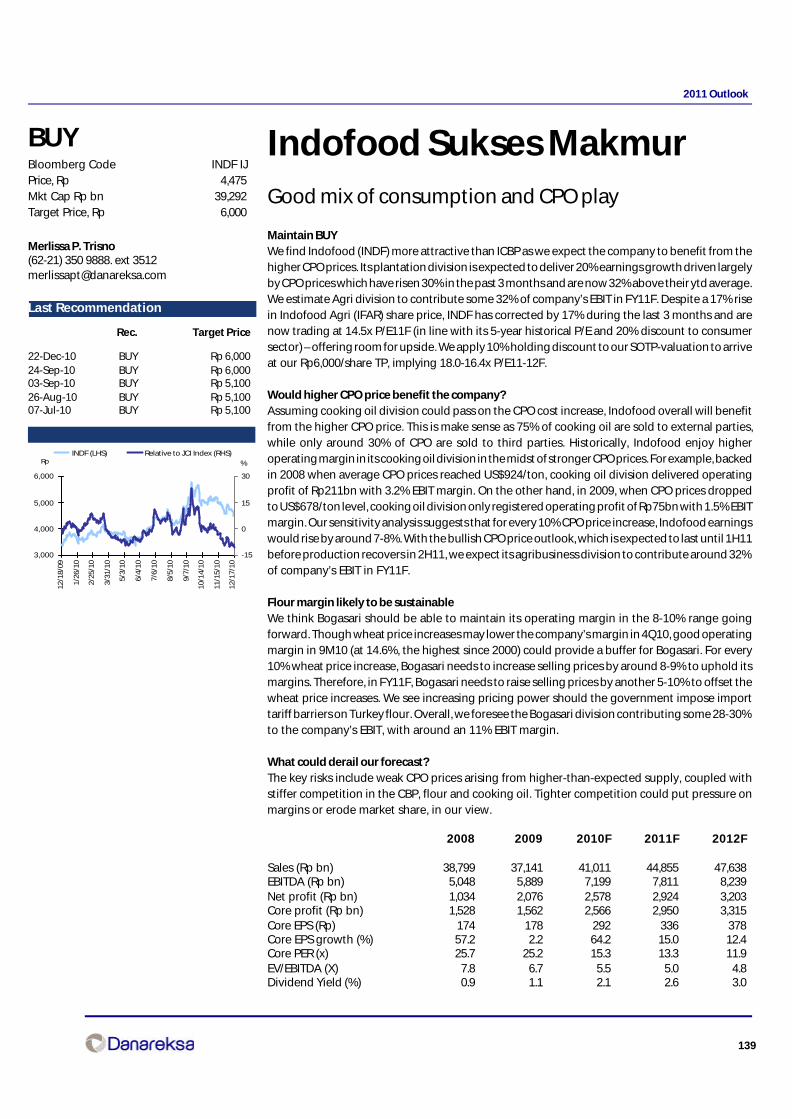
139
2011 Outlook
Indofood Sukses MakmurGood mix of consumption and CPO play
Maintain BUYWe find Indofood (INDF) more attractive than ICBP as we expect the company to benefit from thehigher CPO prices. Its plantation division is expected to deliver 20% earnings growth driven largelyby CPO prices which have risen 30% in the past 3 months and are now 32% above their ytd average.We estimate Agri division to contribute some 32% of company’s EBIT in FY11F. Despite a 17% risein Indofood Agri (IFAR) share price, INDF has corrected by 17% during the last 3 months and arenow trading at 14.5x P/E11F (in line with its 5-year historical P/E and 20% discount to consumersector) – offering room for upside. We apply 10% holding discount to our SOTP-valuation to arriveat our Rp6,000/share TP, implying 18.0-16.4x P/E11-12F.
Would higher CPO price benefit the company?Assuming cooking oil division could pass on the CPO cost increase, Indofood overall will benefitfrom the higher CPO price. This is make sense as 75% of cooking oil are sold to external parties,while only around 30% of CPO are sold to third parties. Historically, Indofood enjoy higheroperating margin in its cooking oil division in the midst of stronger CPO prices. For example, backedin 2008 when average CPO prices reached US$924/ton, cooking oil division delivered operatingprofit of Rp211bn with 3.2% EBIT margin. On the other hand, in 2009, when CPO prices droppedto US$678/ton level, cooking oil division only registered operating profit of Rp75bn with 1.5% EBITmargin. Our sensitivity analysis suggests that for every 10% CPO price increase, Indofood earningswould rise by around 7-8%. With the bullish CPO price outlook, which is expected to last until 1H11before production recovers in 2H11, we expect its agribusiness division to contribute around 32%of company’s EBIT in FY11F.
Flour margin likely to be sustainableWe think Bogasari should be able to maintain its operating margin in the 8-10% range goingforward. Though wheat price increases may lower the company’s margin in 4Q10, good operatingmargin in 9M10 (at 14.6%, the highest since 2000) could provide a buffer for Bogasari. For every10% wheat price increase, Bogasari needs to increase selling prices by around 8-9% to uphold itsmargins. Therefore, in FY11F, Bogasari needs to raise selling prices by another 5-10% to offset thewheat price increases. We see increasing pricing power should the government impose importtariff barriers on Turkey flour. Overall, we foresee the Bogasari division contributing some 28-30%to the company’s EBIT, with around an 11% EBIT margin.
What could derail our forecast?The key risks include weak CPO prices arising from higher-than-expected supply, coupled withstiffer competition in the CBP, flour and cooking oil. Tighter competition could put pressure onmargins or erode market share, in our view.
Merlissa P. Trisno(62-21) 350 9888. ext [email protected]
BUYBloomberg Code INDF IJPrice, Rp 4,475Mkt Cap Rp bn 39,292Target Price, Rp 6,000
Last Recommendation
Major shareholders (%)
INDF relative price to JCI Index
2008 2009 2010F 2011F 2012F
Sales (Rp bn) 38,799 37,141 41,011 44,855 47,638EBITDA (Rp bn) 5,048 5,889 7,199 7,811 8,239Net profit (Rp bn) 1,034 2,076 2,578 2,924 3,203Core profit (Rp bn) 1,528 1,562 2,566 2,950 3,315Core EPS (Rp) 174 178 292 336 378Core EPS growth (%) 57.2 2.2 64.2 15.0 12.4Core PER (x) 25.7 25.2 15.3 13.3 11.9EV/EBITDA (X) 7.8 6.7 5.5 5.0 4.8Dividend Yield (%) 0.9 1.1 2.1 2.6 3.0
3,000
4,000
5,000
6,000
12
/18
/09
1/2
6/1
0
2/2
5/1
0
3/3
1/1
0
5/3
/10
6/4
/10
7/6
/10
8/5
/10
9/7
/10
10
/14
/10
11
/15
/10
12
/17
/10
-15
0
15
30
INDF (LHS) Relative to JCI Index (RHS)
%Rp
Last Recommendation
Rec. Target Price
22-Dec-10 BUY Rp 6,00024-Sep-10 BUY Rp 6,00003-Sep-10 BUY Rp 5,10026-Aug-10 BUY Rp 5,10007-Jul-10 BUY Rp 5,100
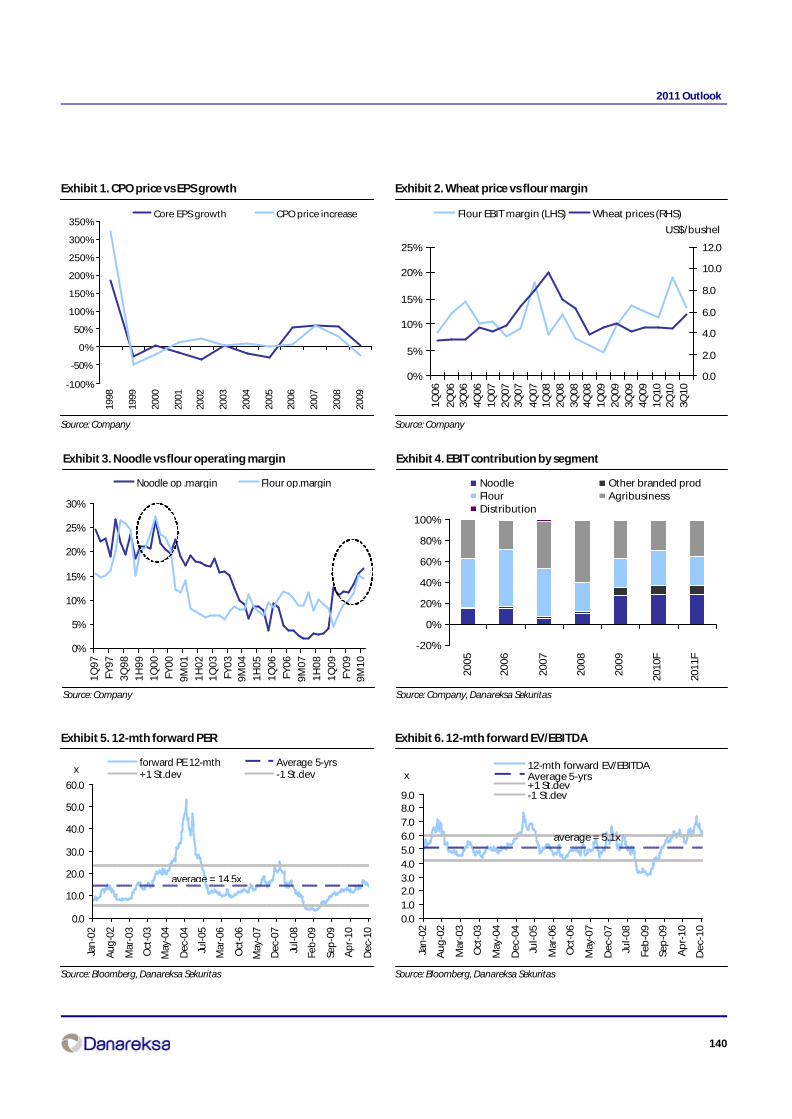
140
2011 Outlook
Exhibit 1. CPO price vs EPS growth
Source: Company
Exhibit 2. Wheat price vs flour margin
Source: Company
Exhibit 3. Noodle vs flour operating margin
Source: Company
Exhibit 4. EBIT contribution by segment
Source: Company, Danareksa Sekuritas
Exhibit 5. 12-mth forward PER
Source: Bloomberg, Danareksa Sekuritas
Exhibit 6. 12-mth forward EV/EBITDA
Source: Bloomberg, Danareksa Sekuritas
-100%
-50%
0%
50%
100%
150%
200%
250%
300%
350%
1998
1999
2000
2001
2002
2003
2004
2005
2006
2007
2008
2009
Core EPS growth CPO price increase
0%
5%
10%
15%
20%
25%
1Q06
2Q06
3Q06
4Q06
1Q07
2Q07
3Q07
4Q07
1Q08
2Q08
3Q08
4Q08
1Q09
2Q09
3Q09
4Q09
1Q10
2Q10
3Q10
0.0
2.0
4.0
6.0
8.0
10.0
12.0
Flour EBIT margin (LHS) Wheat prices (RHS)
US$/bushel
0%
5%
10%
15%
20%
25%
30%
1Q
97
FY9
7
3Q
98
1H
99
1Q
00
FY0
0
9M01
1H
02
1Q
03
FY0
39M
04
1H
05
1Q
06
FY0
6
9M07
1H
08
1Q
09
FY0
99M
10
Noodle op .margin Flour op.margin
-20%
0%
20%
40%
60%
80%
100%
20
05
20
06
20
07
20
08
20
09
2010
F
2011
F
Noodle Other branded prodFlour AgribusinessDistribution
0.0
10.0
20.0
30.0
40.0
50.0
60.0
Jan
-02
Aug
-02
Mar
-03
Oct
-03
May
-04
Dec
-04
Jul-0
5
Mar
-06
Oct
-06
May
-07
Dec
-07
Jul-0
8
Feb
-09
Sep
-09
Ap
r-10
Dec
-10
forward PE 12-mth Average 5-yrs+1 St.dev -1 St.devx
average = 14.5x
0.0
1.0
2.03.0
4.0
5.0
6.0
7.0
8.09.0
Jan
-02
Au
g-0
2
Mar
-03
Oct
-03
May
-04
De
c-0
4
Jul-
05
Mar
-06
Oct
-06
May
-07
De
c-0
7
Jul-
08
Feb
-09
Sep
-09
Ap
r-1
0
De
c-1
0
12-mth forward EV/EBITDAAverage 5-yrs+1 St.dev-1 St.dev
x
average = 5.1x

141
2011 Outlook
Exhibit 7. Projected profit and loss (Rp bn)
2008 2009 2010F 2011F 2012F
Revenues 38,799 37,141 41,011 44,855 47,638Gross profit 8,977 10,122 11,430 12,406 13,144Operating Profit 4,341 5,004 6,042 6,595 6,964EBITDA 5,048 5,889 7,199 7,811 8,239Net interest -989 -1,379 -1,226 -845 -640Interest income 169 162 219 284 287Interest expense -1,158 -1,541 -1,446 -1,130 -927Forex gain (loss) -713 731 17 -37 -157Net other -39 -292 0 0 0Pretax income 2,600 4,064 4,833 5,713 6,168Income tax -802 -1,207 -1,353 -1,600 -1,727Others 19 0 0 0 0Minority Interest -783 -781 -902 -1,190 -1,238Net profit 1,034 2,076 2,578 2,924 3,203
Source: Company and Danareksa Sekuritas
Exhibit 8. Projected balance sheet (Rp bn)
2008 2009 2010F 2011F 2012F
Current assets 14,598 12,842 22,550 20,661 20,997Cash & ST investment 4,894 4,806 12,285 9,774 9,776Account Receivable 2,761 2,296 3,076 3,279 3,398Inventories 6,061 5,117 6,294 6,622 6,764Others 882 622 895 986 1,060LT Investment 165 32 32 32 32Fixed Asset - net 9,587 10,808 12,385 13,402 14,469Plantation Asset - net 5,212 5,719 5,868 6,070 6,360Others 10,032 10,869 10,343 10,585 10,760Total assets 39,594 40,270 51,178 50,749 52,618
Current liabilities 16,262 11,159 12,494 13,444 11,881 Accounts payable 3,182 2,485 3,698 3,902 3,998 ST borrowings 11,379 6,718 6,889 7,412 5,545 Others 1,701 1,956 1,907 2,131 2,337Long-term liabilities 10,173 13,728 14,350 10,007 10,322 Long-term debts 7,201 10,558 11,200 6,718 6,880 Others 2,973 3,170 3,150 3,289 3,441Total liabilities 26,435 24,887 26,844 23,451 22,203
Minority interest 4,660 5,341 12,434 13,508 14,594
Share capital 878 878 878 878 878Excess paid in 1,498 1,498 1,498 1,498 1,498Retained earnings and others 6,123 7,780 9,524 11,414 13,446Total equity 8,499 10,155 11,900 13,790 15,821Total liabilities and equity 39,594 40,383 51,178 50,749 52,618
Source: Company and Danareksa Sekuritas
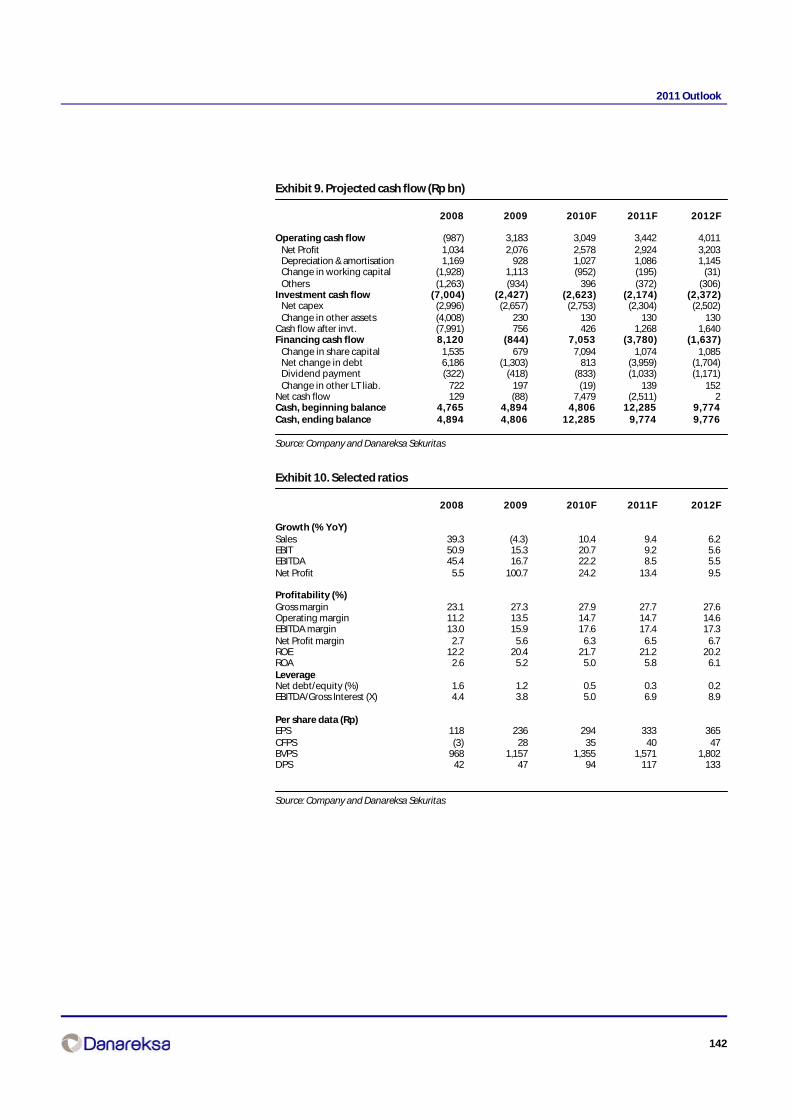
142
2011 Outlook
Exhibit 9. Projected cash flow (Rp bn)
2008 2009 2010F 2011F 2012F
Operating cash flow (987) 3,183 3,049 3,442 4,011 Net Profit 1,034 2,076 2,578 2,924 3,203 Depreciation & amortisation 1,169 928 1,027 1,086 1,145 Change in working capital (1,928) 1,113 (952) (195) (31) Others (1,263) (934) 396 (372) (306)Investment cash flow (7,004) (2,427) (2,623) (2,174) (2,372) Net capex (2,996) (2,657) (2,753) (2,304) (2,502) Change in other assets (4,008) 230 130 130 130Cash flow after invt. (7,991) 756 426 1,268 1,640Financing cash flow 8,120 (844) 7,053 (3,780) (1,637) Change in share capital 1,535 679 7,094 1,074 1,085 Net change in debt 6,186 (1,303) 813 (3,959) (1,704) Dividend payment (322) (418) (833) (1,033) (1,171) Change in other LT liab. 722 197 (19) 139 152Net cash flow 129 (88) 7,479 (2,511) 2Cash, beginning balance 4,765 4,894 4,806 12,285 9,774Cash, ending balance 4,894 4,806 12,285 9,774 9,776
Source: Company and Danareksa Sekuritas
Exhibit 10. Selected ratios
2008 2009 2010F 2011F 2012F
Growth (% YoY)Sales 39.3 (4.3) 10.4 9.4 6.2EBIT 50.9 15.3 20.7 9.2 5.6EBITDA 45.4 16.7 22.2 8.5 5.5Net Profit 5.5 100.7 24.2 13.4 9.5
Profitability (%)Gross margin 23.1 27.3 27.9 27.7 27.6Operating margin 11.2 13.5 14.7 14.7 14.6EBITDA margin 13.0 15.9 17.6 17.4 17.3Net Profit margin 2.7 5.6 6.3 6.5 6.7ROE 12.2 20.4 21.7 21.2 20.2ROA 2.6 5.2 5.0 5.8 6.1LeverageNet debt/equity (%) 1.6 1.2 0.5 0.3 0.2EBITDA/Gross Interest (X) 4.4 3.8 5.0 6.9 8.9
Per share data (Rp)EPS 118 236 294 333 365CFPS (3) 28 35 40 47BVPS 968 1,157 1,355 1,571 1,802DPS 42 47 94 117 133
Source: Company and Danareksa Sekuritas
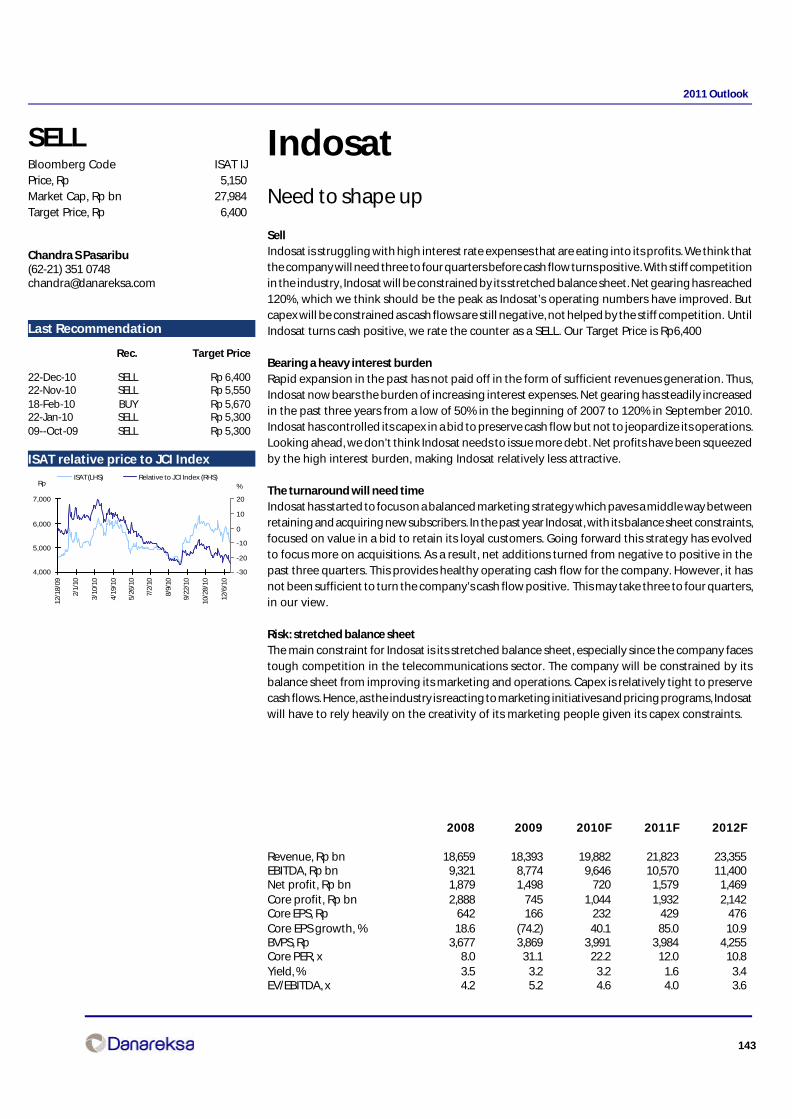
143
2011 Outlook
IndosatNeed to shape up
SellIndosat is struggling with high interest rate expenses that are eating into its profits. We think thatthe company will need three to four quarters before cash flow turns positive. With stiff competitionin the industry, Indosat will be constrained by its stretched balance sheet. Net gearing has reached120%, which we think should be the peak as Indosat’s operating numbers have improved. Butcapex will be constrained as cash flows are still negative, not helped by the stiff competition. UntilIndosat turns cash positive, we rate the counter as a SELL. Our Target Price is Rp6,400
Bearing a heavy interest burdenRapid expansion in the past has not paid off in the form of sufficient revenues generation. Thus,Indosat now bears the burden of increasing interest expenses. Net gearing has steadily increasedin the past three years from a low of 50% in the beginning of 2007 to 120% in September 2010.Indosat has controlled its capex in a bid to preserve cash flow but not to jeopardize its operations.Looking ahead, we don’t think Indosat needs to issue more debt. Net profits have been squeezedby the high interest burden, making Indosat relatively less attractive.
The turnaround will need timeIndosat has started to focus on a balanced marketing strategy which paves a middle way betweenretaining and acquiring new subscribers. In the past year Indosat, with its balance sheet constraints,focused on value in a bid to retain its loyal customers. Going forward this strategy has evolvedto focus more on acquisitions. As a result, net additions turned from negative to positive in thepast three quarters. This provides healthy operating cash flow for the company. However, it hasnot been sufficient to turn the company’s cash flow positive. This may take three to four quarters,in our view.
Risk: stretched balance sheetThe main constraint for Indosat is its stretched balance sheet, especially since the company facestough competition in the telecommunications sector. The company will be constrained by itsbalance sheet from improving its marketing and operations. Capex is relatively tight to preservecash flows. Hence, as the industry is reacting to marketing initiatives and pricing programs, Indosatwill have to rely heavily on the creativity of its marketing people given its capex constraints.
Chandra S Pasaribu(62-21) 351 [email protected]
SELLBloomberg Code ISAT IJPrice, Rp 5,150Market Cap, Rp bn 27,984Target Price, Rp 6,400
Last Recommendation
Rec. Target Price
22-Dec-10 SELL Rp 6,40022-Nov-10 SELL Rp 5,55018-Feb-10 BUY Rp 5,67022-Jan-10 SELL Rp 5,30009--Oct-09 SELL Rp 5,300
ISAT relative price to JCI Index relative price to JCI Index
2008 2009 2010F 2011F 2012F
Revenue, Rp bn 18,659 18,393 19,882 21,823 23,355EBITDA, Rp bn 9,321 8,774 9,646 10,570 11,400Net profit, Rp bn 1,879 1,498 720 1,579 1,469Core profit, Rp bn 2,888 745 1,044 1,932 2,142Core EPS, Rp 642 166 232 429 476Core EPS growth, % 18.6 (74.2) 40.1 85.0 10.9BVPS, Rp 3,677 3,869 3,991 3,984 4,255Core PER, x 8.0 31.1 22.2 12.0 10.8Yield, % 3.5 3.2 3.2 1.6 3.4EV/EBITDA, x 4.2 5.2 4.6 4.0 3.6
4,000
5,000
6,000
7,000
12/1
8/09
2/1/
10
3/10
/10
4/19
/10
5/26
/10
7/2/
10
8/9/
10
9/22
/10
10/2
8/10
12/6
/10
-30
-20
-10
0
10
20
ISAT (LHS) Relative to JCI Index (RHS)%Rp
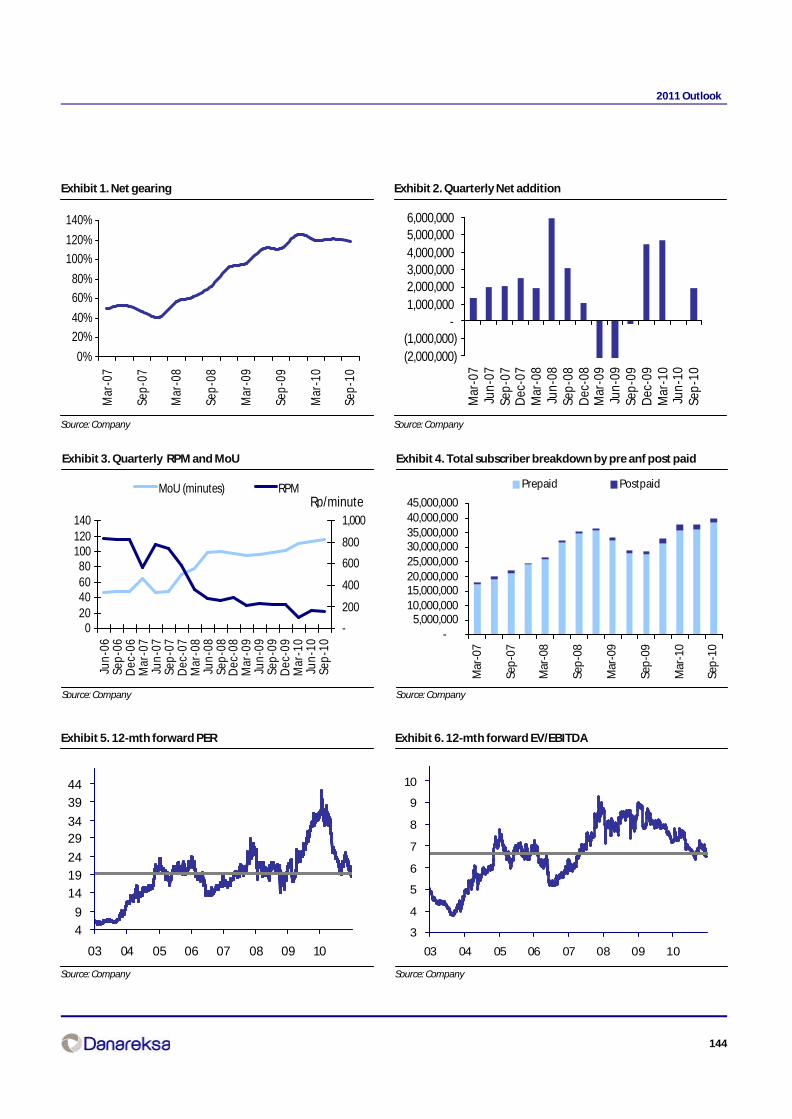
144
2011 Outlook
Exhibit 1. Net gearing
Source: Company
Exhibit 2. Quarterly Net addition
Source: Company
Exhibit 3. Quarterly RPM and MoU
Source: Company
Exhibit 4. Total subscriber breakdown by pre anf post paid
Source: Company
Exhibit 5. 12-mth forward PER
Source: Company
Exhibit 6. 12-mth forward EV/EBITDA
Source: Company
0%
20%
40%
60%
80%
100%
120%
140%
Mar
-07
Sep-
07
Mar
-08
Sep-
08
Mar
-09
Sep-
09
Mar
-10
Sep-
10(2,000,000)(1,000,000)
-1,000,0002,000,0003,000,0004,000,0005,000,0006,000,000
Mar
-07
Jun-
07Se
p-0
7D
ec-0
7M
ar-0
8Ju
n-08
Sep
-08
Dec
-08
Mar
-09
Jun-
09Se
p-0
9D
ec-0
9M
ar-1
0Ju
n-10
Sep
-10
020406080
100120140
Jun-
06Se
p-0
6D
ec-0
6M
ar-0
7Ju
n-07
Sep
-07
Dec
-07
Mar
-08
Jun-
08Se
p-0
8D
ec-0
8M
ar-0
9Ju
n-09
Sep
-09
Dec
-09
Mar
-10
Jun-
10Se
p-1
0
-
200
400
600
800
1,000
MoU (minutes) RPMRp/minute
-5,000,000
10,000,00015,000,00020,000,00025,000,00030,000,00035,000,00040,000,00045,000,000
Mar
-07
Sep
-07
Mar
-08
Sep
-08
Mar
-09
Sep
-09
Mar
-10
Sep
-10
Prepaid Postpaid
4
9
14
19
24
2934
39
44
03 04 05 06 07 08 09 10
3
4
5
6
7
8
9
10
03 04 05 06 07 08 09 10

145
2011 Outlook
Exhibit 7. Profit and Loss (Rp bn)
2008 2009 2010F 2011F 2012F
Gross Revenue 18,659 18,393 19,882 21,823 23,355Discount
Net Revenue 18,659 18,393 19,882 21,823 23,355
Depreciation (4,588) (5,561) (6,014) (6,570) (7,270)Selling exp. (918) (817) (895) (982) (1,051)Salary and wages (1,639) (1,452) (1,569) (1,722) (1,843)Overhead (737) (693) (712) (761) (808)Network (6,043) (6,657) (7,060) (7,787) (8,252)Others Total Opex (13,926) (15,180) (16,250) (17,822) (19,225)
Operating Income 4,733 3,213 3,633 4,000 4,130
Net interest exp/income (1,398) (1,734) (2,192) (1,453) (1,402)Forex (886) 1,656 589 (169) (626)Others (124) (903) (913) (185) (48)Other income/ expense (2,408) (981) (2,517) (1,806) (2,076)
Pre tax Income 2,325 2,232 1,116 2,194 2,054
Income tax (420) (677) (335) (549) (513)Minorities (27) (56) (61) (67) (72)Net Income 1,879 1,498 720 1,579 1,469
Source: Company and Danareksa Sekuritas
Exhibit 8. Balance sheet (Rp bn)
2008 2009 2010F 2011F 2012F
Cash & Equivalent 5,738 2,836 6,662 2,545 180Receivable 1,341 1,357 729 800 856Inventory 242 112 112 112 112Other current assets 2,322 2,241 2,241 2,241 2,241 Total Current Asset 9,643 6,546 9,744 5,699 3,390
Fixed assets - net 38,394 44,429 44,082 44,059 43,795Other LT assets 3,639 3,473 2,756 2,503 2,250 Total Non Current Asset 42,034 47,902 46,838 46,562 46,044TOTAL ASSET 51,676 54,448 56,582 52,261 49,434
ST Loans 0 0 0 0 0Payable 609 537 304 335 355Current portion of LT loans 668 4,331 5,616 4,745 4,790Other current liabilities 9,399 8,199 8,308 8,568 8,772 Total Current Liab. 10,675 13,068 14,228 13,648 13,917
Long term loans 21,128 21,193 22,085 17,058 13,212Other LT Liab. 2,192 2,492 2,492 2,492 2,492 Total Non Current Liab. 23,320 23,685 24,577 19,550 15,703
Equity 2,090 2,090 2,090 2,090 2,090Retained Earnings 14,902 15,461 15,432 16,651 17,330Others 417 406 406 406 406 Total Equity 17,410 17,958 17,929 19,147 19,827TOTAL LIABILITIES and EQUITY 51,404 54,711 56,734 52,345 49,447
Source: Conmpany and Danareksa Sekuritas

146
2011 Outlook
Exhibit 9. Cash flow (Rp bn)
2008 2009 2010F 2011F 2012F
Pretax profit 2,325 2,232 1,116 2,194 2,054Depreciation 4,492 5,305 6,014 6,570 7,270Tax (746) (572) (335) (549) (513)Working Capital 205 (1,628) 503 219 169Others (270) (277) (339) 429 (55)CFO 6,006 5,061 6,959 8,864 8,924
Fixed asset (12,314) (11,340) (5,666) (6,547) (7,006)Other Investment (0) 0 0 0 0Other asset (243) 453 717 253 253CFI (12,557) (10,887) (4,950) (6,293) (6,753)
Loans 6,641 2,777 426 (4,308) (3,504)Bonds (1,577) 941 1,750 (1,589) (298)Equity 7 (11) 0 0 0Dividend (1,021) (749) (360) (789) (734)Others 184 (33) 0 0 0
Change in cash (2,316.5) (2,901.9) 3,825.8 (4,116.5) (2,365.3)
Beginning balance 8,054 5,738 2,836 6,662 2,545Ending balance 5,738 2,836 6,662 2,545 180
Source: Company and Danareksa Sekuritas
Exhibit 10. Ratios
2008 2009 2010F 2011F 2012FProfitability ratios, %
Operating margin 25.4 17.5 18.3 18.3 17.7EBITDA margin 50.0 47.7 48.5 48.4 48.8Net margin 10.1 8.1 3.6 7.2 6.3ROAA 3.9 2.8 1.3 2.9 2.9ROAE 11.1 8.5 4.0 8.5 7.5ROACE 5.2 3.6 1.6 3.6 3.7
Liquidity ratios, xCurrent ratio 0.9 0.5 0.7 0.5 0.3Quick ratio 0.7 0.4 0.6 0.3 0.1
Activity ratios, daysAccounts receivable turnover 12 13 13 13 13Accounts payable turnover 32 16 16 16 16Working capital cycle (20) (2) (2) (2) (2)
Leverage ratiosGearing, % 101.3 126.8 143.0 155.3 114.7Net gearing, % 93.8 127.2 118.2 101.4 90.6Debt/capital, % 50.3 55.9 58.8 60.8 53.4Net debt/EBITDA, x 1.8 2.6 2.2 1.8 1.6
Source: Company and Danareksa Sekuritas
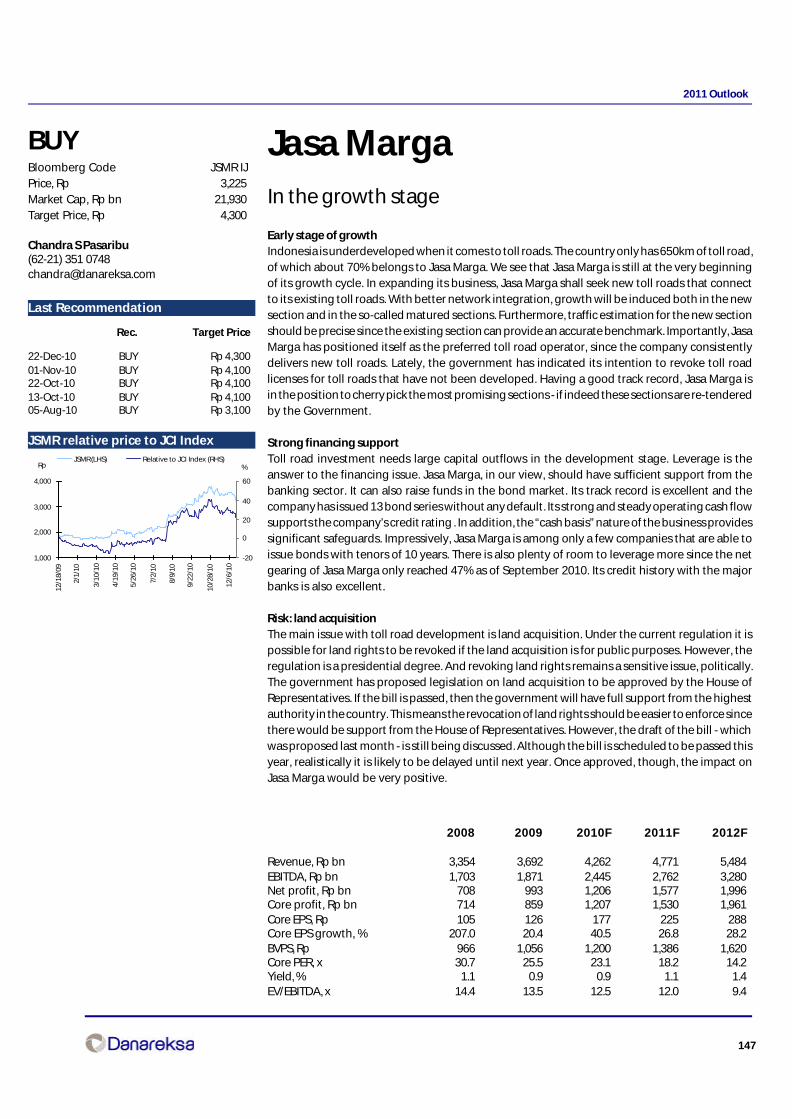
147
2011 Outlook
Jasa MargaIn the growth stage
Early stage of growthIndonesia is underdeveloped when it comes to toll roads. The country only has 650km of toll road,of which about 70% belongs to Jasa Marga. We see that Jasa Marga is still at the very beginningof its growth cycle. In expanding its business, Jasa Marga shall seek new toll roads that connectto its existing toll roads. With better network integration, growth will be induced both in the newsection and in the so-called matured sections. Furthermore, traffic estimation for the new sectionshould be precise since the existing section can provide an accurate benchmark. Importantly, JasaMarga has positioned itself as the preferred toll road operator, since the company consistentlydelivers new toll roads. Lately, the government has indicated its intention to revoke toll roadlicenses for toll roads that have not been developed. Having a good track record, Jasa Marga isin the position to cherry pick the most promising sections - if indeed these sections are re-tenderedby the Government.
Strong financing supportToll road investment needs large capital outflows in the development stage. Leverage is theanswer to the financing issue. Jasa Marga, in our view, should have sufficient support from thebanking sector. It can also raise funds in the bond market. Its track record is excellent and thecompany has issued 13 bond series without any default. Its strong and steady operating cash flowsupports the company’s credit rating . In addition, the “cash basis” nature of the business providessignificant safeguards. Impressively, Jasa Marga is among only a few companies that are able toissue bonds with tenors of 10 years. There is also plenty of room to leverage more since the netgearing of Jasa Marga only reached 47% as of September 2010. Its credit history with the majorbanks is also excellent.
Risk: land acquisitionThe main issue with toll road development is land acquisition. Under the current regulation it ispossible for land rights to be revoked if the land acquisition is for public purposes. However, theregulation is a presidential degree. And revoking land rights remains a sensitive issue, politically.The government has proposed legislation on land acquisition to be approved by the House ofRepresentatives. If the bill is passed, then the government will have full support from the highestauthority in the country. This means the revocation of land rights should be easier to enforce sincethere would be support from the House of Representatives. However, the draft of the bill - whichwas proposed last month - is still being discussed. Although the bill is scheduled to be passed thisyear, realistically it is likely to be delayed until next year. Once approved, though, the impact onJasa Marga would be very positive.
Chandra S Pasaribu(62-21) 351 [email protected]
BUYBloomberg Code JSMR IJPrice, Rp 3,225Market Cap, Rp bn 21,930Target Price, Rp 4,300
JSMR relative price to JCI Index relative price to JCI Index
Last Recommendation
Rec. Target Price
22-Dec-10 BUY Rp 4,30001-Nov-10 BUY Rp 4,10022-Oct-10 BUY Rp 4,10013-Oct-10 BUY Rp 4,10005-Aug-10 BUY Rp 3,100
2008 2009 2010F 2011F 2012F
Revenue, Rp bn 3,354 3,692 4,262 4,771 5,484EBITDA, Rp bn 1,703 1,871 2,445 2,762 3,280Net profit, Rp bn 708 993 1,206 1,577 1,996Core profit, Rp bn 714 859 1,207 1,530 1,961Core EPS, Rp 105 126 177 225 288Core EPS growth, % 207.0 20.4 40.5 26.8 28.2BVPS, Rp 966 1,056 1,200 1,386 1,620Core PER, x 30.7 25.5 23.1 18.2 14.2Yield, % 1.1 0.9 0.9 1.1 1.4EV/EBITDA, x 14.4 13.5 12.5 12.0 9.4
1,000
2,000
3,000
4,000
12/1
8/09
2/1/
10
3/10
/10
4/19
/10
5/26
/10
7/2/
10
8/9/
10
9/22
/10
10/2
8/10
12/6
/10
-20
0
20
40
60
JSMR (LHS) Relative to JCI Index (RHS)%Rp

148
2011 Outlook
Exhibit 1. Revenue contribution breakdown by section
Source: Company
Exhibit 2. Monthly traffic volume in the past three years
Source: Company
Exhibit 3. Opex to sales ratio declined with growing toll roadportfolio
Source: Company
Exhibit 4. Net gearing declined steeply after IPO
Source: Company
Exhibit 5. 12-mth forward PER
Source: Company
Exhibit 6. 12-mth forward PBV
Source: Company
Jakarta Cikampek
14%
Jakarta Tangerang
13%Inner City
26%
Purbaleunyi7%
Surabaya Gempol
7%
Belmera2%
Semarang3%
Palikanci2% JORR
12%BORR
1%Jagorawi
13%
50,000,000
55,000,000
60,000,000
65,000,000
70,000,000
75,000,000
80,000,000
85,000,000
90,000,000
Jan Mar May Jul Sep Nov
2008 2009 2010
55.8%
58.9%
51.1%54.7%
56.0%
58.3%
49.5%
47.9%
59.5%
56.2%
59.1%
45%
50%
55%
60%
65%
Mar
-08
Jun
-08
Sep
-08
Dec
-08
Mar
-09
Jun
-09
Sep
-09
Dec
-09
Mar
-10
Jun
-10
Sep
-10 0%
50%
100%
150%
200%
250%
300%
350%
Mar
-05
Sep
-05
Mar
-06
Sep
-06
Mar
-07
Sep
-07
Mar
-08
Sep
-08
Mar
-09
Sep
-09
Mar
-10
Sep
-10
4
6
8
10
12
14
16
18
20
08 09 10
0.4
0.9
1.4
1.9
2.4
2.9
0 8 09 10

149
2011 Outlook
Exhibit 7. Profit and Loss (Rp bn)
2008 2009 2010F 2011F 2012F
Toll road Revenue 3,319 3,631 4,171 4,671 5,375Others 34 61 91 100 110Total Revenue 3,354 3,692 4,262 4,771 5,484
Toll collection (517) (545) (550) (606) (658)Service (190) (214) (211) (234) (253)Maintenance (436) (507) (474) (536) (586)KSO (258) (262) (288) (317) (349)General n administrative expenses (581) (648) (638) (697) (746) Opex (1,982) (2,176) (2,161) (2,389) (2,592)Operating profit 1,372 1,516 2,101 2,382 2,892
Net Interest exp (434) (445) (593) (469) (441)Forex - - - - -Other 8 23 - - -Other income/ expense (426) (422) (593) (469) (441)
Pre tax Income 946 1,094 1,508 1,913 2,451
Income tax (224) (212) (302) (383) (490)Minorities (14) (15) (1) 46 35Net Income 708 868 1,206 1,577 1,996
Source: Company and Danareksa Sekuritas
Exhibit 8. Balance sheet (Rp bn)
2008 2009 2010F 2011F 2012F
Cash & Equivalent 3,866 3,355 3,620 1,103 2,330Receivable 32 65 46 51 59Inventory - - - - -Other current assets 9 10 91 102 118 Total Current Asset 3,907 3,430 3,757 1,257 2,507
Fixed assets 10,596 12,400 12,718 14,080 14,251Depreciation (1,748) (2,341) (2,714) (3,095) (3,482)Other LT assets 1,887 2,684 3,127 6,915 6,905 Total Non Current Asset 10,736 12,744 13,131 17,900 17,674TOTAL ASSET 14,643 16,174 16,888 19,157 20,180
ST Loans - - - - -Payable 95 157 121 136 156Current portion of LT loans 573 1,808 - - -Other current liabilities 569 1,001 800 1,429 1,511 Total Current Liab. 1,237 2,966 922 1,564 1,667
Long term loans 5,624 4,817 6,424 6,438 5,436Other LT Liab. 1,210 1,207 1,382 1,733 2,060 Total Non Current Liab. 6,833 6,025 7,806 8,171 7,495
Equity 5,739 5,723 5,736 5,736 5,736Retained Earnings 833 1,460 2,425 3,686 5,282Others - - - - - Total Equity 6,572 7,183 8,160 9,421 11,018TOTAL LIABILITIES and EQUITY 14,643 16,174 16,888 19,157 20,180
Source: Conmpany and Danareksa Sekuritas
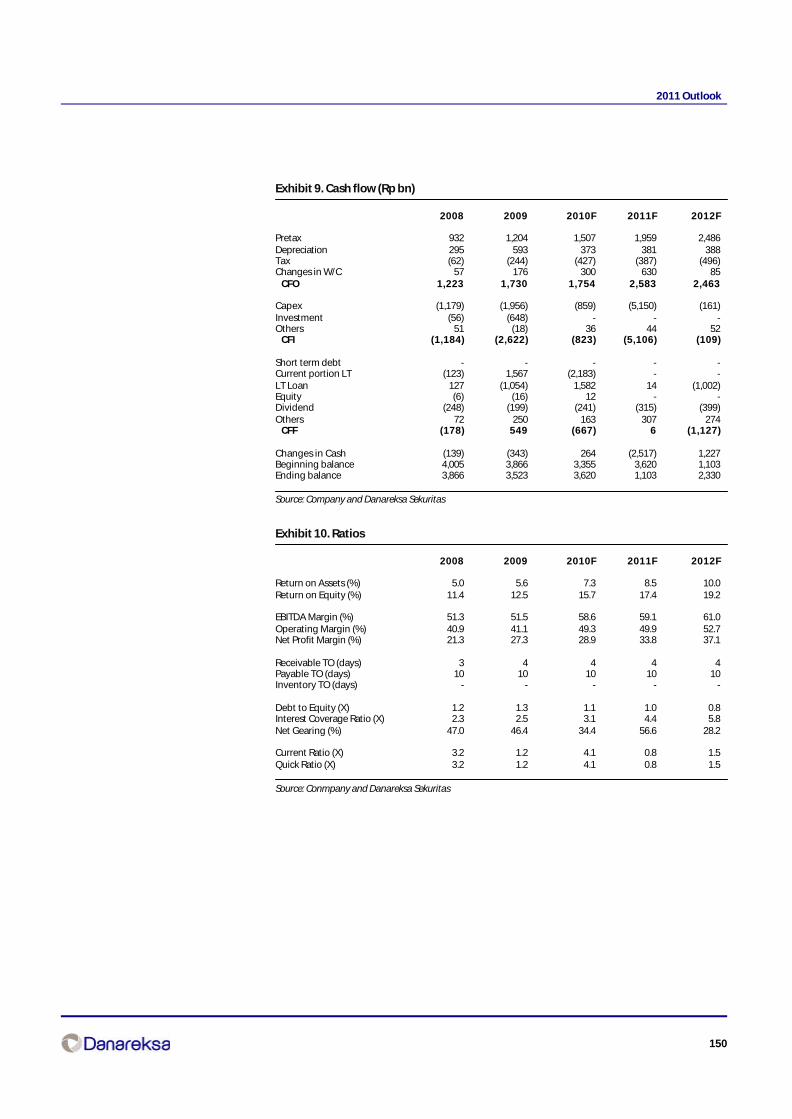
150
2011 Outlook
Exhibit 9. Cash flow (Rp bn)
2008 2009 2010F 2011F 2012F
Pretax 932 1,204 1,507 1,959 2,486Depreciation 295 593 373 381 388Tax (62) (244) (427) (387) (496)Changes in W/C 57 176 300 630 85 CFO 1,223 1,730 1,754 2,583 2,463
Capex (1,179) (1,956) (859) (5,150) (161)Investment (56) (648) - - -Others 51 (18) 36 44 52 CFI (1,184) (2,622) (823) (5,106) (109)
Short term debt - - - - -Current portion LT (123) 1,567 (2,183) - -LT Loan 127 (1,054) 1,582 14 (1,002)Equity (6) (16) 12 - -Dividend (248) (199) (241) (315) (399)Others 72 250 163 307 274 CFF (178) 549 (667) 6 (1,127)
Changes in Cash (139) (343) 264 (2,517) 1,227Beginning balance 4,005 3,866 3,355 3,620 1,103Ending balance 3,866 3,523 3,620 1,103 2,330
Source: Company and Danareksa Sekuritas
Exhibit 10. Ratios
2008 2009 2010F 2011F 2012F
Return on Assets (%) 5.0 5.6 7.3 8.5 10.0Return on Equity (%) 11.4 12.5 15.7 17.4 19.2
EBITDA Margin (%) 51.3 51.5 58.6 59.1 61.0Operating Margin (%) 40.9 41.1 49.3 49.9 52.7Net Profit Margin (%) 21.3 27.3 28.9 33.8 37.1
Receivable TO (days) 3 4 4 4 4Payable TO (days) 10 10 10 10 10Inventory TO (days) - - - - -
Debt to Equity (X) 1.2 1.3 1.1 1.0 0.8Interest Coverage Ratio (X) 2.3 2.5 3.1 4.4 5.8Net Gearing (%) 47.0 46.4 34.4 56.6 28.2
Current Ratio (X) 3.2 1.2 4.1 0.8 1.5Quick Ratio (X) 3.2 1.2 4.1 0.8 1.5
Source: Conmpany and Danareksa Sekuritas
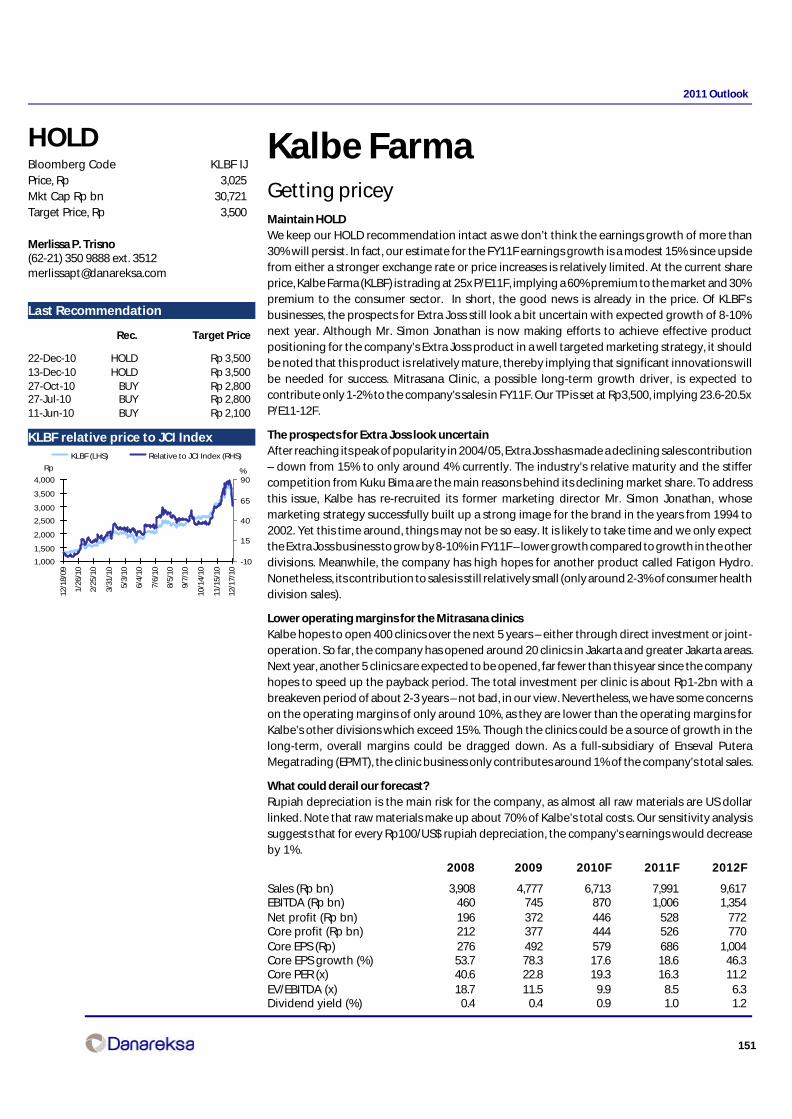
151
2011 Outlook
Kalbe FarmaGetting priceyMaintain HOLDWe keep our HOLD recommendation intact as we don’t think the earnings growth of more than30% will persist. In fact, our estimate for the FY11F earnings growth is a modest 15% since upsidefrom either a stronger exchange rate or price increases is relatively limited. At the current shareprice, Kalbe Farma (KLBF) is trading at 25x P/E11F, implying a 60% premium to the market and 30%premium to the consumer sector. In short, the good news is already in the price. Of KLBF’sbusinesses, the prospects for Extra Joss still look a bit uncertain with expected growth of 8-10%next year. Although Mr. Simon Jonathan is now making efforts to achieve effective productpositioning for the company’s Extra Joss product in a well targeted marketing strategy, it shouldbe noted that this product is relatively mature, thereby implying that significant innovations willbe needed for success. Mitrasana Clinic, a possible long-term growth driver, is expected tocontribute only 1-2% to the company’s sales in FY11F. Our TP is set at Rp3,500, implying 23.6-20.5xP/E11-12F.
The prospects for Extra Joss look uncertainAfter reaching its peak of popularity in 2004/05, Extra Joss has made a declining sales contribution– down from 15% to only around 4% currently. The industry’s relative maturity and the stiffercompetition from Kuku Bima are the main reasons behind its declining market share. To addressthis issue, Kalbe has re-recruited its former marketing director Mr. Simon Jonathan, whosemarketing strategy successfully built up a strong image for the brand in the years from 1994 to2002. Yet this time around, things may not be so easy. It is likely to take time and we only expectthe Extra Joss business to grow by 8-10% in FY11F – lower growth compared to growth in the otherdivisions. Meanwhile, the company has high hopes for another product called Fatigon Hydro.Nonetheless, its contribution to sales is still relatively small (only around 2-3% of consumer healthdivision sales).
Lower operating margins for the Mitrasana clinicsKalbe hopes to open 400 clinics over the next 5 years – either through direct investment or joint-operation. So far, the company has opened around 20 clinics in Jakarta and greater Jakarta areas.Next year, another 5 clinics are expected to be opened, far fewer than this year since the companyhopes to speed up the payback period. The total investment per clinic is about Rp1-2bn with abreakeven period of about 2-3 years – not bad, in our view. Nevertheless, we have some concernson the operating margins of only around 10%, as they are lower than the operating margins forKalbe’s other divisions which exceed 15%. Though the clinics could be a source of growth in thelong-term, overall margins could be dragged down. As a full-subsidiary of Enseval PuteraMegatrading (EPMT), the clinic business only contributes around 1% of the company’s total sales.
What could derail our forecast?Rupiah depreciation is the main risk for the company, as almost all raw materials are US dollarlinked. Note that raw materials make up about 70% of Kalbe’s total costs. Our sensitivity analysissuggests that for every Rp100/US$ rupiah depreciation, the company’s earnings would decreaseby 1%.
Merlissa P. Trisno(62-21) 350 9888 ext. [email protected]
HOLDBloomberg Code KLBF IJPrice, Rp 3,025Mkt Cap Rp bn 30,721Target Price, Rp 3,500
Last Recommendation
Rec. Target Price
22-Dec-10 HOLD Rp 3,50013-Dec-10 HOLD Rp 3,50027-Oct-10 BUY Rp 2,80027-Jul-10 BUY Rp 2,80011-Jun-10 BUY Rp 2,100
Last Recommendation
KLBF relative price to JCI Index
1,000
1,500
2,000
2,500
3,000
3,500
4,000
12/1
8/09
1/26
/10
2/25
/10
3/31
/10
5/3/
10
6/4/
10
7/6/
10
8/5/
10
9/7/
10
10/1
4/10
11/1
5/10
12/1
7/10
-10
15
40
65
90
KLBF (LHS) Relative to JCI Index (RHS)
%Rp
2008 2009 2010F 2011F 2012F
Sales (Rp bn) 3,908 4,777 6,713 7,991 9,617EBITDA (Rp bn) 460 745 870 1,006 1,354Net profit (Rp bn) 196 372 446 528 772Core profit (Rp bn) 212 377 444 526 770Core EPS (Rp) 276 492 579 686 1,004Core EPS growth (%) 53.7 78.3 17.6 18.6 46.3Core PER (x) 40.6 22.8 19.3 16.3 11.2EV/EBITDA (x) 18.7 11.5 9.9 8.5 6.3Dividend yield (%) 0.4 0.4 0.9 1.0 1.2
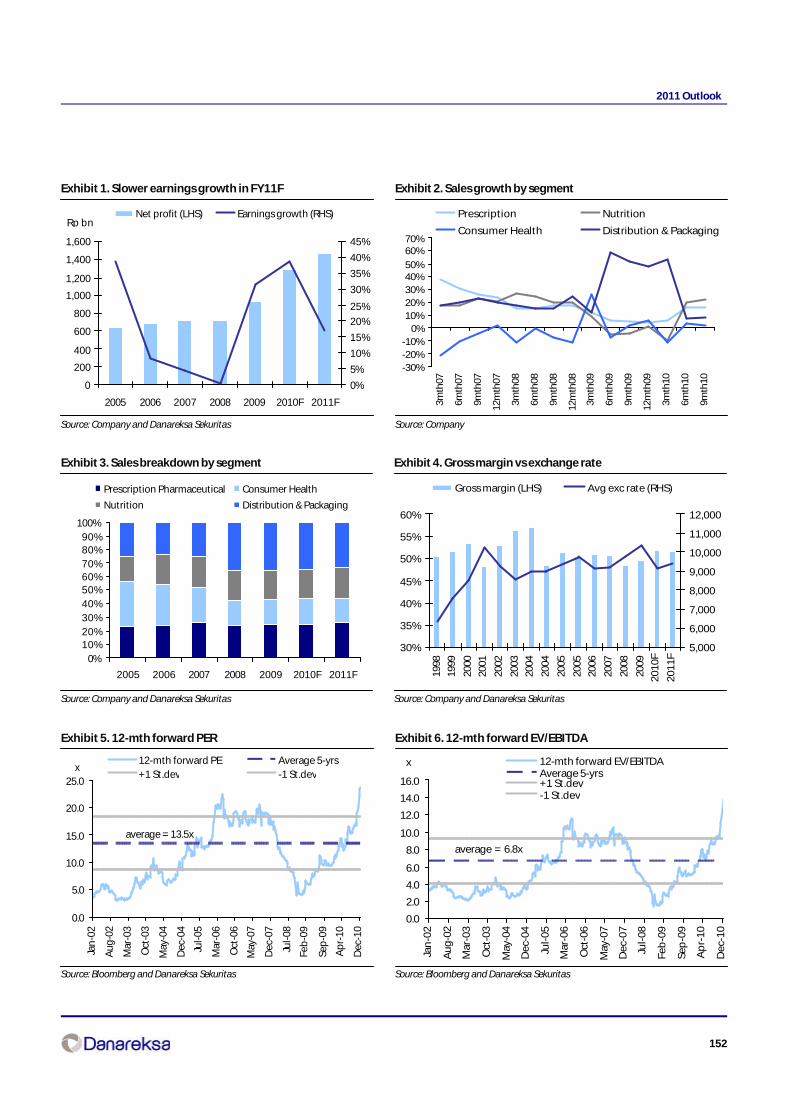
152
2011 Outlook
Exhibit 1. Slower earnings growth in FY11F
Source: Company and Danareksa Sekuritas
Exhibit 2. Sales growth by segment
Source: Company
Exhibit 5. 12-mth forward PER
Source: Bloomberg and Danareksa Sekuritas
Exhibit 6. 12-mth forward EV/EBITDA
Source: Bloomberg and Danareksa Sekuritas
Exhibit 3. Sales breakdown by segment
Source: Company and Danareksa Sekuritas
Exhibit 4. Gross margin vs exchange rate
Source: Company and Danareksa Sekuritas
0
200
400
600
800
1,000
1,200
1,400
1,600
2005 2006 2007 2008 2009 2010F 2011F
0%
5%
10%
15%
20%
25%
30%
35%
40%
45%
Net profit (LHS) Earnings growth (RHS)Rp bn
-30%-20%-10%
0%10%20%30%40%50%
60%70%
3mth
07
6mth
07
9mth
07
12m
th07
3mth
08
6mth
08
9mth
08
12m
th08
3mth
09
6mth
09
9mth
09
12m
th09
3mth
10
6mth
10
9mth
10
Prescription Nutrition
Consumer Health Distribution & Packaging
0%
10%20%
30%
40%
50%60%70%
80%90%
100%
2005 2006 2007 2008 2009 2010F 2011F
Prescription Pharmaceutical Consumer Health
Nutrition Distribution & Packaging
30%
35%
40%
45%
50%
55%
60%
1998
1999
2000
2001
2002
2003
2004
2004
2005
2005
2006
2007
2008
2009
20
10
F
20
11
F
5,000
6,000
7,000
8,000
9,000
10,000
11,000
12,000
Gross margin (LHS) Avg exc rate (RHS)
0.0
5.0
10.0
15.0
20.0
25.0
Jan
-02
Aug
-02
Mar
-03
Oct
-03
May
-04
Dec
-04
Jul-0
5
Mar
-06
Oct
-06
May
-07
Dec
-07
Jul-0
8
Feb
-09
Sep
-09
Ap
r-10
Dec
-10
12-mth forward PE Average 5-yrs+1 St.dev -1 St.dev
x
average = 13.5x
0.0
2.0
4.0
6.0
8.0
10.0
12.0
14.0
16.0
Jan
-02
Au
g-0
2
Mar
-03
Oct
-03
May
-04
Dec
-04
Jul-
05
Mar
-06
Oct
-06
May
-07
Dec
-07
Jul-
08
Feb
-09
Sep
-09
Ap
r-1
0
Dec
-10
12-mth forward EV/EBITDAAverage 5-yrs+1 St.dev-1 St.dev
x
average = 6.8x
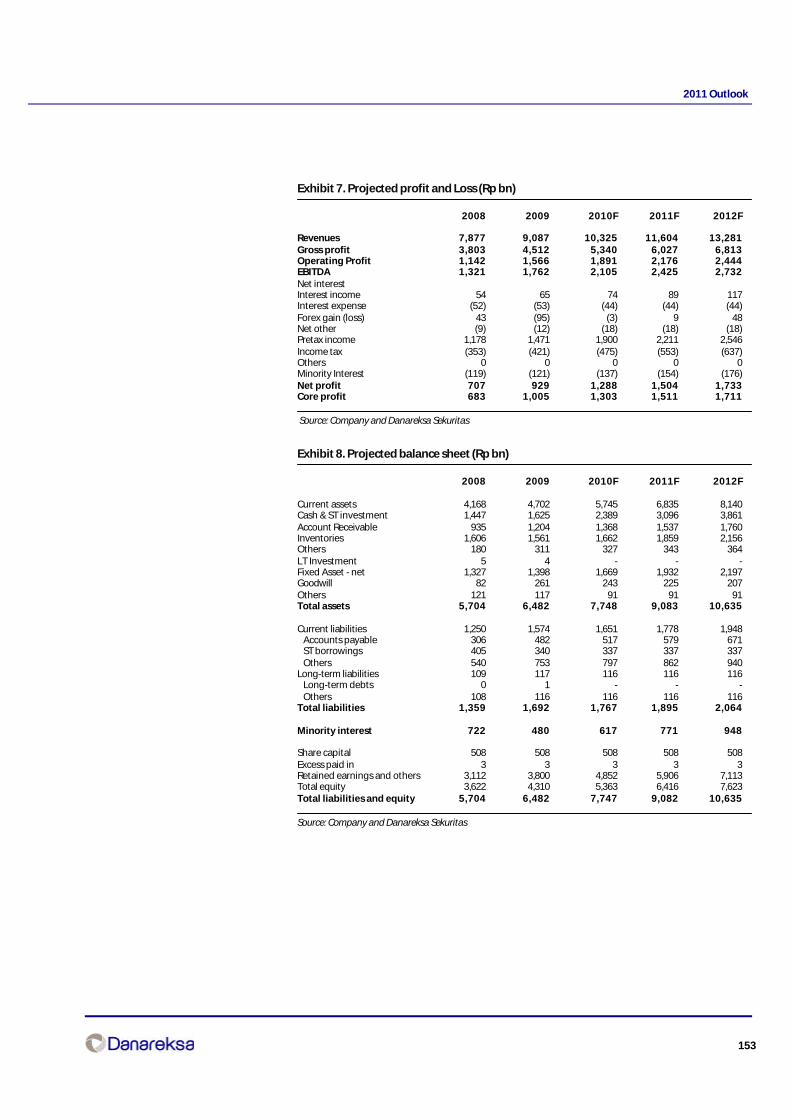
153
2011 Outlook
Exhibit 7. Projected profit and Loss (Rp bn)
2008 2009 2010F 2011F 2012F
Revenues 7,877 9,087 10,325 11,604 13,281Gross profit 3,803 4,512 5,340 6,027 6,813Operating Profit 1,142 1,566 1,891 2,176 2,444EBITDA 1,321 1,762 2,105 2,425 2,732Net interestInterest income 54 65 74 89 117Interest expense (52) (53) (44) (44) (44)Forex gain (loss) 43 (95) (3) 9 48Net other (9) (12) (18) (18) (18)Pretax income 1,178 1,471 1,900 2,211 2,546Income tax (353) (421) (475) (553) (637)Others 0 0 0 0 0Minority Interest (119) (121) (137) (154) (176)Net profit 707 929 1,288 1,504 1,733Core profit 683 1,005 1,303 1,511 1,711
Source: Company and Danareksa Sekuritas
Exhibit 8. Projected balance sheet (Rp bn)
2008 2009 2010F 2011F 2012F
Current assets 4,168 4,702 5,745 6,835 8,140Cash & ST investment 1,447 1,625 2,389 3,096 3,861Account Receivable 935 1,204 1,368 1,537 1,760Inventories 1,606 1,561 1,662 1,859 2,156Others 180 311 327 343 364LT Investment 5 4 - - -Fixed Asset - net 1,327 1,398 1,669 1,932 2,197Goodwill 82 261 243 225 207Others 121 117 91 91 91Total assets 5,704 6,482 7,748 9,083 10,635
Current liabilities 1,250 1,574 1,651 1,778 1,948 Accounts payable 306 482 517 579 671 ST borrowings 405 340 337 337 337 Others 540 753 797 862 940Long-term liabilities 109 117 116 116 116 Long-term debts 0 1 - - - Others 108 116 116 116 116Total liabilities 1,359 1,692 1,767 1,895 2,064
Minority interest 722 480 617 771 948
Share capital 508 508 508 508 508Excess paid in 3 3 3 3 3Retained earnings and others 3,112 3,800 4,852 5,906 7,113Total equity 3,622 4,310 5,363 6,416 7,623Total liabilities and equity 5,704 6,482 7,747 9,082 10,635
Source: Company and Danareksa Sekuritas

154
2011 Outlook
Exhibit 9. Projected profit and Loss (Rp bn)
2008 2009 2010F 2011F 2012F
Operating cash flow 772 1,018 1,369 1,537 1,695 Net Profit 707 929 1,288 1,504 1,733 Depreciation & amortisation 156 159 233 271 314 Change in working capital (66) 96 (200) (256) (370) Others (25) (166) 49 18 18Investment cash flow Net capex (279) (230) (504) (534) (580) Change in other assetsCash flow after invt. 493 789 866 1,004 1,115Financing cash flow (287) (548) (102) (297) (350) Change in share capital (380) (124) (3) - - Net change in debt 91 (65) (4) - - Dividend payment (91) (117) (232) (451) (527) Change in other LT liab. 92 (242) 137 154 176Net cash flow 205 241 764 707 765Beginning balance 1,116 1,322 1,563 2,326 3,033Ending balance 1,322 1,563 2,326 3,033 3,798
Source: Company and Danareksa Sekuritas
Exhibit 10. Selected ratios
2008 2009 2010F 2011F 2012F
Growth (% YoY)Sales 12.5 15.4 13.6 12.4 14.4Operating profit 1.2 37.1 20.8 15.1 12.3EBITDA 2.0 33.4 19.5 15.2 12.7Net profit 0.1 31.5 38.6 16.8 15.2Core profit (1.3) 47.1 29.6 15.9 13.2
Profitability (%)Gross margin 48.3 49.7 51.7 51.9 51.3Operating margin 14.5 17.2 18.3 18.8 18.4EBITDA margin 16.8 19.4 20.4 20.9 20.6Net profit margin 9.0 10.2 12.5 13.0 13.1ROE 19.5 21.6 24.0 23.4 22.7ROA 12.4 14.3 16.6 16.6 16.3
LeverageNet debt/equity (%) Net cash Net cash Net cash Net cash Net cashEBITDA/gross interest (x) 25.4 33.0 47.4 54.7 61.6
Per share data (Rp)EPS 70 91 127 148 171CFPS 76 100 135 151 167BVPS 357 424 528 632 751DPS 9 12 23 44 52
Source: Company and Danareksa Sekuritas
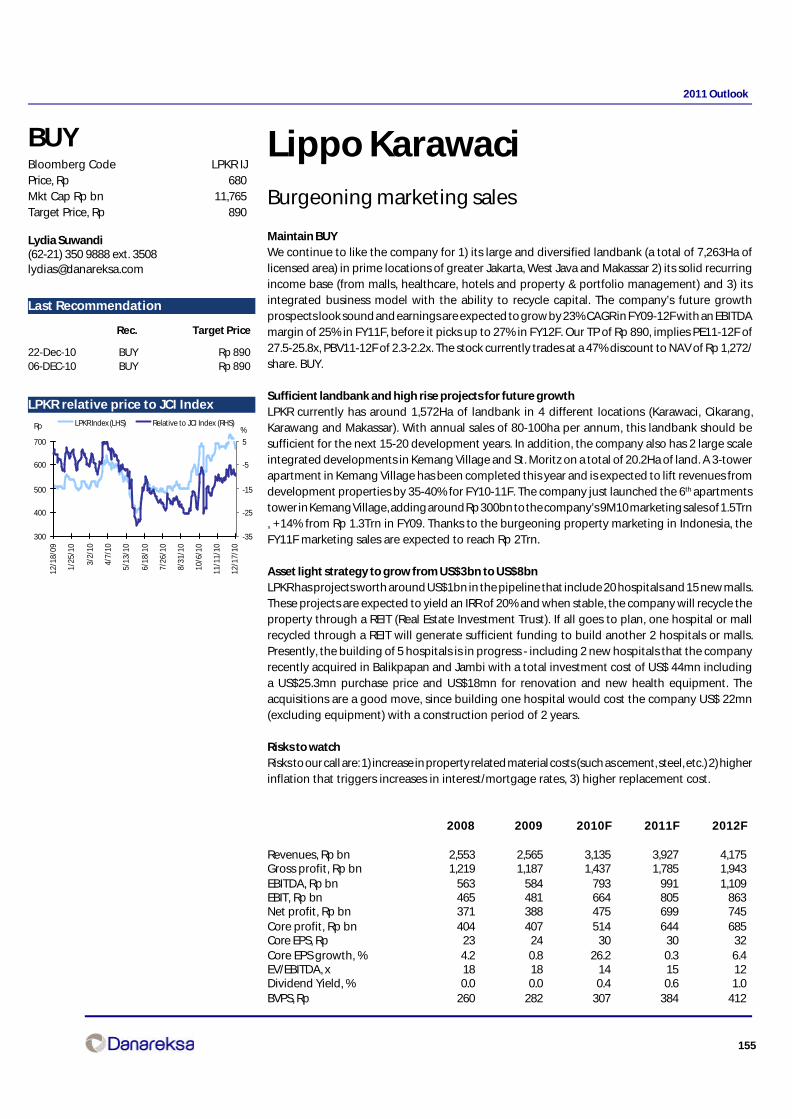
155
2011 Outlook
Lippo KarawaciBurgeoning marketing sales
Maintain BUYWe continue to like the company for 1) its large and diversified landbank (a total of 7,263Ha oflicensed area) in prime locations of greater Jakarta, West Java and Makassar 2) its solid recurringincome base (from malls, healthcare, hotels and property & portfolio management) and 3) itsintegrated business model with the ability to recycle capital. The company’s future growthprospects look sound and earnings are expected to grow by 23% CAGR in FY09-12F with an EBITDAmargin of 25% in FY11F, before it picks up to 27% in FY12F. Our TP of Rp 890, implies PE11-12F of27.5-25.8x, PBV11-12F of 2.3-2.2x. The stock currently trades at a 47% discount to NAV of Rp 1,272/share. BUY.
Sufficient landbank and high rise projects for future growthLPKR currently has around 1,572Ha of landbank in 4 different locations (Karawaci, Cikarang,Karawang and Makassar). With annual sales of 80-100ha per annum, this landbank should besufficient for the next 15-20 development years. In addition, the company also has 2 large scaleintegrated developments in Kemang Village and St. Moritz on a total of 20.2Ha of land. A 3-towerapartment in Kemang Village has been completed this year and is expected to lift revenues fromdevelopment properties by 35-40% for FY10-11F. The company just launched the 6th apartmentstower in Kemang Village, adding around Rp 300bn to the company’s 9M10 marketing sales of 1.5Trn, +14% from Rp 1.3Trn in FY09. Thanks to the burgeoning property marketing in Indonesia, theFY11F marketing sales are expected to reach Rp 2Trn.
Asset light strategy to grow from US$3bn to US$8bnLPKR has projects worth around US$1bn in the pipeline that include 20 hospitals and 15 new malls.These projects are expected to yield an IRR of 20% and when stable, the company will recycle theproperty through a REIT (Real Estate Investment Trust). If all goes to plan, one hospital or mallrecycled through a REIT will generate sufficient funding to build another 2 hospitals or malls.Presently, the building of 5 hospitals is in progress - including 2 new hospitals that the companyrecently acquired in Balikpapan and Jambi with a total investment cost of US$ 44mn includinga US$25.3mn purchase price and US$18mn for renovation and new health equipment. Theacquisitions are a good move, since building one hospital would cost the company US$ 22mn(excluding equipment) with a construction period of 2 years.
Risks to watchRisks to our call are: 1) increase in property related material costs (such as cement, steel, etc.) 2) higherinflation that triggers increases in interest/mortgage rates, 3) higher replacement cost.
2008 2009 2010F 2011F 2012F
Revenues, Rp bn 2,553 2,565 3,135 3,927 4,175Gross profit, Rp bn 1,219 1,187 1,437 1,785 1,943EBITDA, Rp bn 563 584 793 991 1,109EBIT, Rp bn 465 481 664 805 863Net profit, Rp bn 371 388 475 699 745Core profit, Rp bn 404 407 514 644 685Core EPS, Rp 23 24 30 30 32Core EPS growth, % 4.2 0.8 26.2 0.3 6.4EV/EBITDA, x 18 18 14 15 12Dividend Yield, % 0.0 0.0 0.4 0.6 1.0BVPS, Rp 260 282 307 384 412
Lydia Suwandi(62-21) 350 9888 ext. [email protected]
BUYBloomberg Code LPKR IJPrice, Rp 680Mkt Cap Rp bn 11,765Target Price, Rp 890
Last Recommendation
Last Recommendation
Rec. Target Price
22-Dec-10 BUY Rp 89006-DEC-10 BUY Rp 890
LPKR relative price to JCI Index
300
400
500
600
700
12/1
8/09
1/25
/10
3/2/
10
4/7/
10
5/13
/10
6/18
/10
7/26
/10
8/31
/10
10/6
/10
11/1
1/10
12/1
7/10
-35
-25
-15
-5
5
LPKR Index (LHS) Relative to JCI Index (RHS)%Rp

156
2011 Outlook
Exhibit 1. LPLR’s marketing sales
Source: Company
Exhibit 2. 9M10 revenue structure
Source: Company
Exhibit 3. LPKR’s healthacare revenue from 2007 to 9M10
Source: Company
Exhibit 4. LPKR’s historical asset value
Source: Company
Exhibit 5. 12-mth forward PER
Source: Bloomberg, Danareksa Sekuritas
Exhibit 6. 12-mth forward PBV
Source: Bloomberg, Danareksa Sekuritas
599 680921 879
795817 401
628
-
200
400
600
800
1,000
1,200
1,400
1,600
2007 2008 2009 9M10
Rp bnUrban development Large scale dev.
Residential & township
45%
Healthcare34%
Property & portfolio mgt.
9%
Commercial 12%
10,475
14,166
18,59220,625
28,115
-
5,000
10,000
15,000
20,000
25,000
30,000
2005 2006 2007 2008 2009
Rp bn
362 395 452 391526 447
212233
291274
370
313
-
100
200300
400
500
600
700
800
900
1,000
2006 2007 2008 9M09 2009 9M10
Rp bnIPD OPD
0.5
1.0
1.5
2.0
2.5
3.0
3.5
Jan
-06
May
-06
Sep
-06
Jan
-07
May
-07
Sep
-07
Jan
-08
May
-08
Sep
-08
Jan
-09
May
-09
Sep
-09
Jan
-10
May
-10
Sep
-10
average=2.1x
-
5.0
10.0
15.0
20.0
25.0
30.0
35.0
40.0
45.0
Jan
-06
May
-06
Sep
-06
Jan
-07
May
-07
Sep
-07
Jan
-08
May
-08
Sep
-08
Jan
-09
May
-09
Sep
-09
Jan
-10
May
-10
Sep
-10
average=24.4x
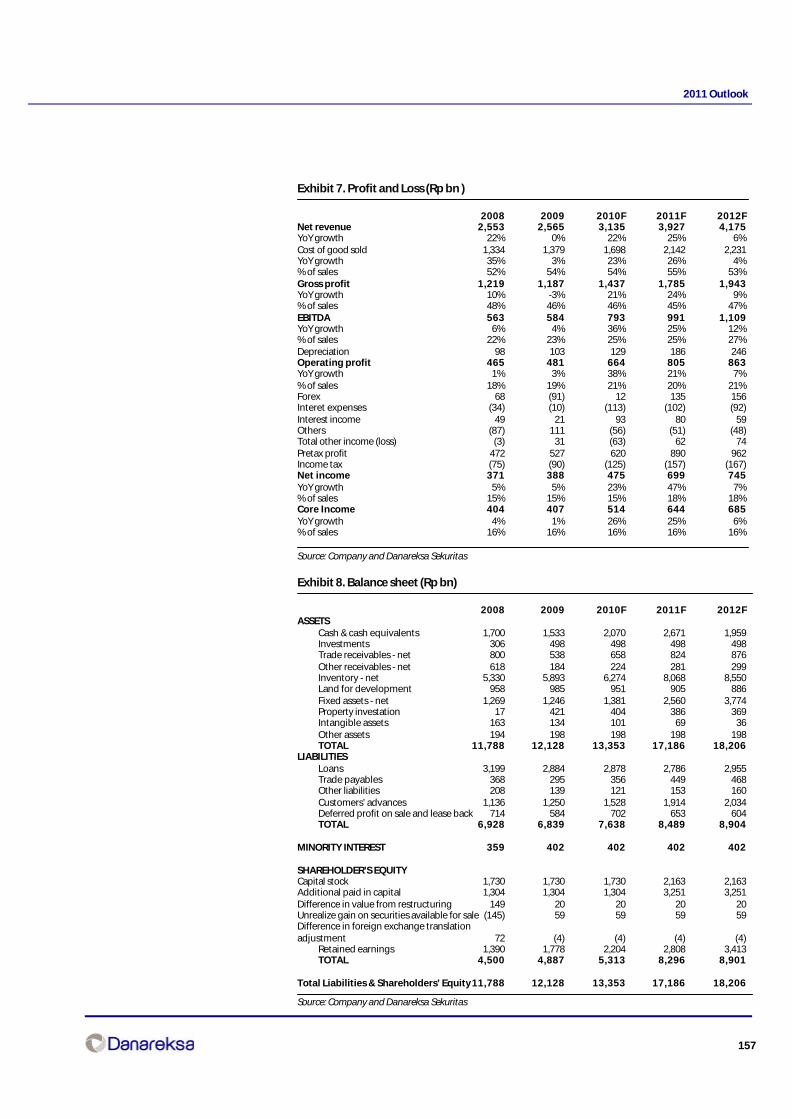
157
2011 Outlook
Exhibit 7. Profit and Loss (Rp bn )
2008 2009 2010F 2011F 2012FNet revenue 2,553 2,565 3,135 3,927 4,175YoY growth 22% 0% 22% 25% 6%Cost of good sold 1,334 1,379 1,698 2,142 2,231YoY growth 35% 3% 23% 26% 4%% of sales 52% 54% 54% 55% 53%Gross profit 1,219 1,187 1,437 1,785 1,943YoY growth 10% -3% 21% 24% 9%% of sales 48% 46% 46% 45% 47%EBITDA 563 584 793 991 1,109YoY growth 6% 4% 36% 25% 12%% of sales 22% 23% 25% 25% 27%Depreciation 98 103 129 186 246Operating profit 465 481 664 805 863YoY growth 1% 3% 38% 21% 7%% of sales 18% 19% 21% 20% 21%Forex 68 (91) 12 135 156Interet expenses (34) (10) (113) (102) (92)Interest income 49 21 93 80 59Others (87) 111 (56) (51) (48)Total other income (loss) (3) 31 (63) 62 74Pretax profit 472 527 620 890 962Income tax (75) (90) (125) (157) (167)Net income 371 388 475 699 745YoY growth 5% 5% 23% 47% 7%% of sales 15% 15% 15% 18% 18%Core Income 404 407 514 644 685YoY growth 4% 1% 26% 25% 6%% of sales 16% 16% 16% 16% 16%
Source: Company and Danareksa Sekuritas
Exhibit 8. Balance sheet (Rp bn)
2008 2009 2010F 2011F 2012FASSETS
Cash & cash equivalents 1,700 1,533 2,070 2,671 1,959 Investments 306 498 498 498 498 Trade receivables - net 800 538 658 824 876 Other receivables - net 618 184 224 281 299 Inventory - net 5,330 5,893 6,274 8,068 8,550 Land for development 958 985 951 905 886 Fixed assets - net 1,269 1,246 1,381 2,560 3,774 Property investation 17 421 404 386 369 Intangible assets 163 134 101 69 36 Other assets 194 198 198 198 198 TOTAL 11,788 12,128 13,353 17,186 18,206
LIABILITIES Loans 3,199 2,884 2,878 2,786 2,955 Trade payables 368 295 356 449 468 Other liabilities 208 139 121 153 160 Customers’ advances 1,136 1,250 1,528 1,914 2,034 Deferred profit on sale and lease back 714 584 702 653 604 TOTAL 6,928 6,839 7,638 8,489 8,904
MINORITY INTEREST 359 402 402 402 402
SHAREHOLDER’S EQUITYCapital stock 1,730 1,730 1,730 2,163 2,163Additional paid in capital 1,304 1,304 1,304 3,251 3,251Difference in value from restructuring 149 20 20 20 20Unrealize gain on securities available for sale (145) 59 59 59 59Difference in foreign exchange translationadjustment 72 (4) (4) (4) (4)
Retained earnings 1,390 1,778 2,204 2,808 3,413 TOTAL 4,500 4,887 5,313 8,296 8,901
Total Liabilities & Shareholders’ Equity 11,788 12,128 13,353 17,186 18,206
Source: Company and Danareksa Sekuritas
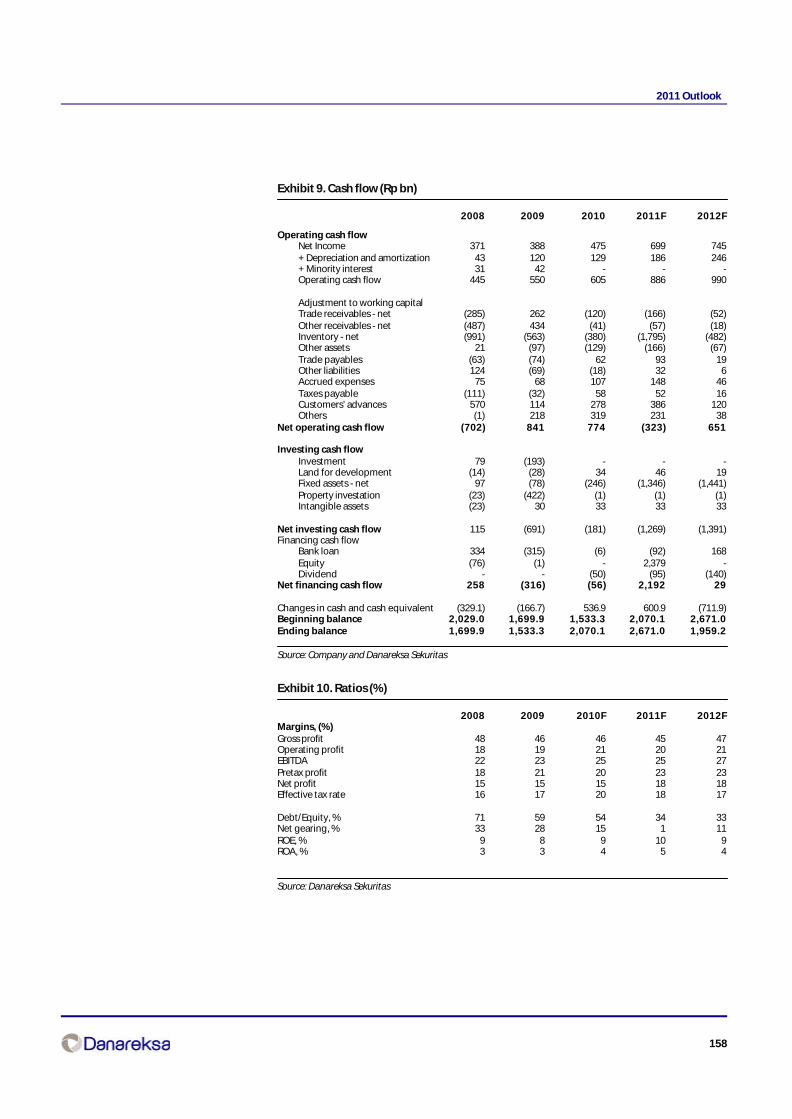
158
2011 Outlook
Exhibit 9. Cash flow (Rp bn)
2008 2009 2010 2011F 2012F
Operating cash flow Net Income 371 388 475 699 745 + Depreciation and amortization 43 120 129 186 246 + Minority interest 31 42 - - - Operating cash flow 445 550 605 886 990
Adjustment to working capital Trade receivables - net (285) 262 (120) (166) (52) Other receivables - net (487) 434 (41) (57) (18) Inventory - net (991) (563) (380) (1,795) (482) Other assets 21 (97) (129) (166) (67) Trade payables (63) (74) 62 93 19 Other liabilities 124 (69) (18) 32 6 Accrued expenses 75 68 107 148 46 Taxes payable (111) (32) 58 52 16 Customers’ advances 570 114 278 386 120 Others (1) 218 319 231 38
Net operating cash flow (702) 841 774 (323) 651
Investing cash flow Investment 79 (193) - - - Land for development (14) (28) 34 46 19 Fixed assets - net 97 (78) (246) (1,346) (1,441) Property investation (23) (422) (1) (1) (1) Intangible assets (23) 30 33 33 33
Net investing cash flow 115 (691) (181) (1,269) (1,391)Financing cash flow
Bank loan 334 (315) (6) (92) 168 Equity (76) (1) - 2,379 - Dividend - - (50) (95) (140)
Net financing cash flow 258 (316) (56) 2,192 29
Changes in cash and cash equivalent (329.1) (166.7) 536.9 600.9 (711.9)Beginning balance 2,029.0 1,699.9 1,533.3 2,070.1 2,671.0Ending balance 1,699.9 1,533.3 2,070.1 2,671.0 1,959.2
Source: Company and Danareksa Sekuritas
Exhibit 10. Ratios (%)
2008 2009 2010F 2011F 2012FMargins, (%)Gross profit 48 46 46 45 47Operating profit 18 19 21 20 21EBITDA 22 23 25 25 27Pretax profit 18 21 20 23 23Net profit 15 15 15 18 18Effective tax rate 16 17 20 18 17
Debt/Equity, % 71 59 54 34 33Net gearing, % 33 28 15 1 11ROE, % 9 8 9 10 9ROA, % 3 3 4 5 4
Source: Danareksa Sekuritas

159
2011 Outlook
London SumateraProduction upturn
Raising TP to Rp14,850, BUYWe are raising our FY11-12E NPAT estimates by 19.8% and 24.5% respectively on the robust CPOprice amidst the company’s efforts to suppress production costs. Since IFAR placed 8% of its stakein LSIP, this will also lead to an additional 5% tax benefit thanks to a higher free float. Our TP isbased on 1.5x std. deviation to its 5-year average multiple of 16.5x 2011E P/E, taking account ofhigher CPO price momentum but is also justified by its large plantations size, hence economiesof scale, and continued production turnaround. Indeed, the FFB yield is likely to improve, albeitslowly. Much of the growth shall come from its South Sumatra and Kalimantan estates whereplantations are still young. Its efforts to cut production costs through rebuilding infrastructureshall also ensure that higher margins are sustained in the longer run. At least for now, we estimategross margins to reach 48.9-48.2% for 2011-12E – assuming the current CPO price.
The turnaround continuesAn imminent production turnaround is more likely to happen in its South Sumatra estate, whereproblems still lie in the estates’ lack of infrastructure amidst scattered locations. Production losseshave been inevitable, explaining its poor yield – at about 12-14ton/ha currently. Yet efforts havebeen made to minimize such losses, albeit the impact is unlikely to be felt in the near term. Priorityis set towards developing an internal transportation system, which will allow fallen fruits to beminimized and more fruits to be collected. That alone will increase the yield from the South Sumatraestates to 16tons/ha by 2012. Bottom line, we expect rehabilitation to boost overall FFB productionby 8.2% over the next 4 years and CPO production by 7.8% over the same period.
Structural shift lifts productionYield turnaround aside, production growth shall come from a structural shift of the company’syoung plantation profile in South Sumatra. About 26% of the total planted area is still immatureand of a total area planted, 7,200 ha shall come into maturity next year, yielding around 5-6tons/ha. The company’s land bank is still aplenty, with 50,000ha left unplanted. Meanwhile, its aggressiveplanting of around 18,300ha over the past 3 years will ensure that our mid-term production growthtarget will be met. As for its North Sumatra estate, production is likely to be stable at 22-23ton/ha as much of its land bank has been exhausted.
Risks to watchKey risks include 1) slower than expected rehabilitation process, which could lead to cost overrunsand lower than expected production, 2) bad weather that may curb any increase in productionand hinder the successful execution of the rehabilitation process and 3) higher costs resulting froman upsurge in labor and fertilizer costs.
Year end to Dec, Rp bn 2008 2009 2010F 2011F 2012F
Sales, Rp bn 3,846 3,200 3,364 4,086 4,306EBITDA, Rp bn 1,445 1,177 1,314 1,723 1,787Core profit, Rp bn 903 691 845 1,226 1,274Core profit growth, % 43.5 -23.5 22.4 45.1 3.9Core PER, x 16.8 21.9 17.9 12.3 11.9EV/EBITDA, x 10.4 12.5 10.8 7.7 7.1EV/Ha, US$ 000/ha 17.8 16.7 15.4 13.6 12.2Dividend yield, % 1.9 1.9 1.9 2.2 3.2Net gearing, % -3.0 -11.7 -22.5 -35.3 -40.4
Bonny B. Setiawan CFA(62-21) 2352 [email protected]
BUYBloomberg Code LSIP IJPrice, Rp 11,100Mkt Cap Rp bn 15,147Target Price, Rp 14,850
Last Recommendation
Rec. Target Price
22-Dec-10 BUY Rp 14,85007-Sep10 BUY Rp 11,250
LSIP relative price to JCI Index
7,000
8,000
9,000
10,000
11,000
12,000
13,000
12/1
8/09
2/1/
10
3/10
/10
4/19
/10
5/26
/10
7/2/
10
8/9/
10
9/22
/10
10/2
8/10
12/6
/10
-25
-18
-11
-4
3
10
LSIP (LHS) Relative to JCI Index (RHS)%Rp
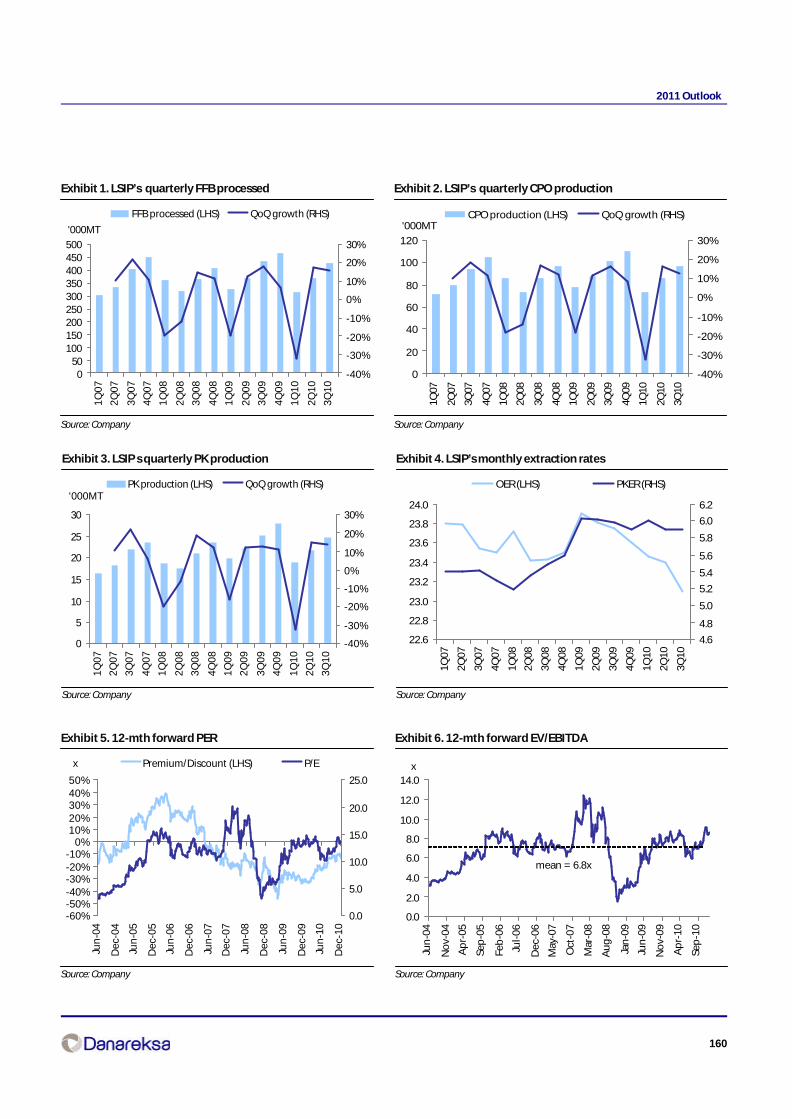
160
2011 Outlook
Exhibit 1. LSIP’s quarterly FFB processed
Source: Company
Exhibit 2. LSIP’s quarterly CPO production
Source: Company
Exhibit 3. LSIP s quarterly PK production
Source: Company
Exhibit 4. LSIP’s monthly extraction rates
Source: Company
Exhibit 5. 12-mth forward PER
Source: Company
Exhibit 6. 12-mth forward EV/EBITDA
Source: Company
050
100150200250300350400450500
1Q
07
2Q
07
3Q
07
4Q
07
1Q
08
2Q
08
3Q
08
4Q
08
1Q
09
2Q
09
3Q
09
4Q
09
1Q
10
2Q
10
3Q
10
'000MT
-40%
-30%
-20%
-10%
0%
10%
20%
30%
FFB processed (LHS) QoQ growth (RHS)
0
20
40
60
80
100
120
1Q07
2Q07
3Q07
4Q07
1Q08
2Q08
3Q08
4Q08
1Q09
2Q09
3Q09
4Q09
1Q10
2Q10
3Q10
'000MT
-40%
-30%
-20%
-10%
0%
10%
20%
30%
CPO production (LHS) QoQ growth (RHS)
0
5
10
15
20
25
30
1Q
07
2Q
07
3Q
07
4Q
07
1Q
08
2Q
08
3Q
08
4Q
08
1Q
09
2Q
09
3Q
09
4Q
09
1Q
10
2Q
10
3Q
10
'000MT
-40%
-30%
-20%
-10%
0%
10%
20%
30%
PK production (LHS) QoQ growth (RHS)
22.6
22.8
23.0
23.2
23.4
23.6
23.8
24.0
1Q07
2Q07
3Q07
4Q07
1Q08
2Q08
3Q08
4Q08
1Q09
2Q09
3Q09
4Q09
1Q10
2Q10
3Q10
4.6
4.8
5.0
5.2
5.4
5.6
5.8
6.0
6.2
OER (LHS) PKER (RHS)
-60%-50%-40%-30%-20%-10%
0%10%20%30%40%50%
Jun
-04
Dec
-04
Jun
-05
Dec
-05
Jun
-06
Dec
-06
Jun
-07
Dec
-07
Jun
-08
Dec
-08
Jun
-09
Dec
-09
Jun
-10
Dec
-10
0.0
5.0
10.0
15.0
20.0
25.0
x Premium/Discount (LHS) P/E
0.0
2.0
4.0
6.0
8.0
10.0
12.0
14.0
Jun
-04
No
v-04
Ap
r-05
Sep
-05
Feb
-06
Jul-
06
Dec
-06
May
-07
Oct
-07
Mar
-08
Au
g-0
8
Jan
-09
Jun
-09
No
v-09
Ap
r-10
Sep
-10
x
mean = 6.8x
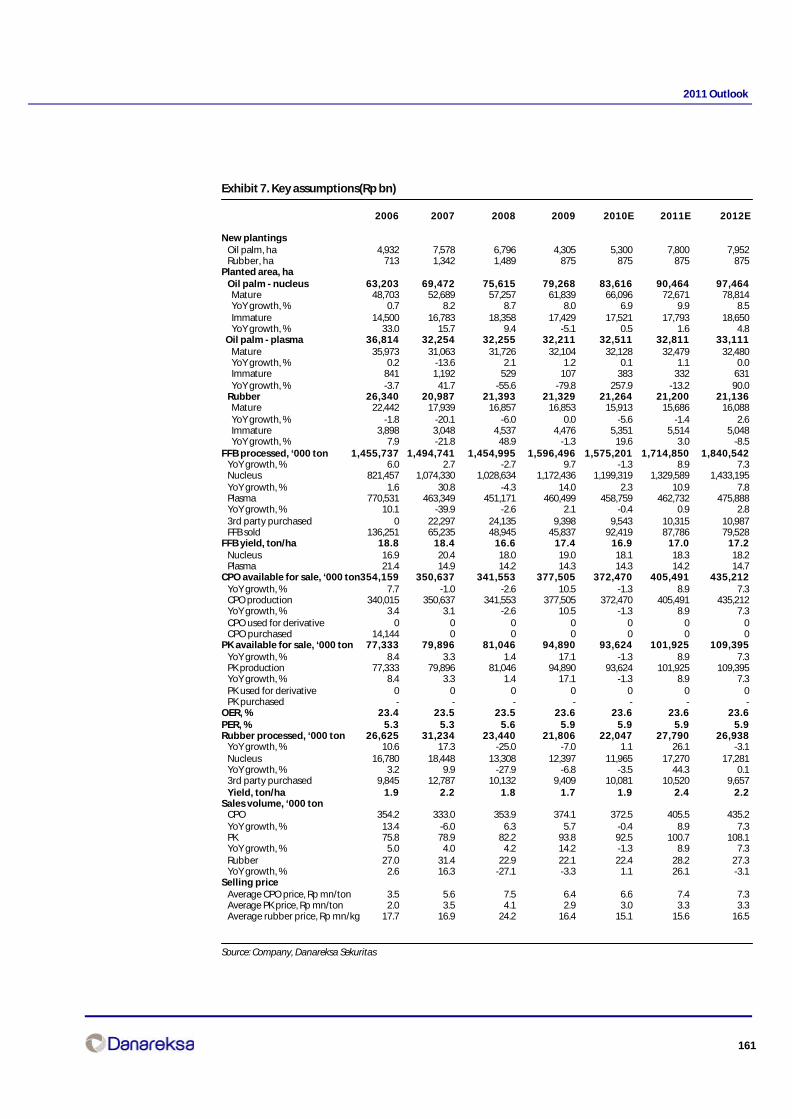
161
2011 Outlook
Exhibit 7. Key assumptions(Rp bn)
2006 2007 2008 2009 2010E 2011E 2012E
New plantings Oil palm, ha 4,932 7,578 6,796 4,305 5,300 7,800 7,952 Rubber, ha 713 1,342 1,489 875 875 875 875Planted area, ha Oil palm - nucleus 63,203 69,472 75,615 79,268 83,616 90,464 97,464 Mature 48,703 52,689 57,257 61,839 66,096 72,671 78,814 YoY growth, % 0.7 8.2 8.7 8.0 6.9 9.9 8.5 Immature 14,500 16,783 18,358 17,429 17,521 17,793 18,650 YoY growth, % 33.0 15.7 9.4 -5.1 0.5 1.6 4.8 Oil palm - plasma 36,814 32,254 32,255 32,211 32,511 32,811 33,111 Mature 35,973 31,063 31,726 32,104 32,128 32,479 32,480 YoY growth, % 0.2 -13.6 2.1 1.2 0.1 1.1 0.0 Immature 841 1,192 529 107 383 332 631 YoY growth, % -3.7 41.7 -55.6 -79.8 257.9 -13.2 90.0 Rubber 26,340 20,987 21,393 21,329 21,264 21,200 21,136 Mature 22,442 17,939 16,857 16,853 15,913 15,686 16,088 YoY growth, % -1.8 -20.1 -6.0 0.0 -5.6 -1.4 2.6 Immature 3,898 3,048 4,537 4,476 5,351 5,514 5,048 YoY growth, % 7.9 -21.8 48.9 -1.3 19.6 3.0 -8.5FFB processed, ‘000 ton 1,455,737 1,494,741 1,454,995 1,596,496 1,575,201 1,714,850 1,840,542 YoY growth, % 6.0 2.7 -2.7 9.7 -1.3 8.9 7.3 Nucleus 821,457 1,074,330 1,028,634 1,172,436 1,199,319 1,329,589 1,433,195 YoY growth, % 1.6 30.8 -4.3 14.0 2.3 10.9 7.8 Plasma 770,531 463,349 451,171 460,499 458,759 462,732 475,888 YoY growth, % 10.1 -39.9 -2.6 2.1 -0.4 0.9 2.8 3rd party purchased 0 22,297 24,135 9,398 9,543 10,315 10,987 FFB sold 136,251 65,235 48,945 45,837 92,419 87,786 79,528FFB yield, ton/ha 18.8 18.4 16.6 17.4 16.9 17.0 17.2 Nucleus 16.9 20.4 18.0 19.0 18.1 18.3 18.2 Plasma 21.4 14.9 14.2 14.3 14.3 14.2 14.7CPO available for sale, ‘000 ton354,159 350,637 341,553 377,505 372,470 405,491 435,212 YoY growth, % 7.7 -1.0 -2.6 10.5 -1.3 8.9 7.3 CPO production 340,015 350,637 341,553 377,505 372,470 405,491 435,212 YoY growth, % 3.4 3.1 -2.6 10.5 -1.3 8.9 7.3 CPO used for derivative 0 0 0 0 0 0 0 CPO purchased 14,144 0 0 0 0 0 0PK available for sale, ‘000 ton 77,333 79,896 81,046 94,890 93,624 101,925 109,395 YoY growth, % 8.4 3.3 1.4 17.1 -1.3 8.9 7.3 PK production 77,333 79,896 81,046 94,890 93,624 101,925 109,395 YoY growth, % 8.4 3.3 1.4 17.1 -1.3 8.9 7.3 PK used for derivative 0 0 0 0 0 0 0 PK purchased - - - - - - -OER, % 23.4 23.5 23.5 23.6 23.6 23.6 23.6PER, % 5.3 5.3 5.6 5.9 5.9 5.9 5.9Rubber processed, ‘000 ton 26,625 31,234 23,440 21,806 22,047 27,790 26,938 YoY growth, % 10.6 17.3 -25.0 -7.0 1.1 26.1 -3.1 Nucleus 16,780 18,448 13,308 12,397 11,965 17,270 17,281 YoY growth, % 3.2 9.9 -27.9 -6.8 -3.5 44.3 0.1 3rd party purchased 9,845 12,787 10,132 9,409 10,081 10,520 9,657 Yield, ton/ha 1.9 2.2 1.8 1.7 1.9 2.4 2.2Sales volume, ‘000 ton CPO 354.2 333.0 353.9 374.1 372.5 405.5 435.2 YoY growth, % 13.4 -6.0 6.3 5.7 -0.4 8.9 7.3 PK 75.8 78.9 82.2 93.8 92.5 100.7 108.1 YoY growth, % 5.0 4.0 4.2 14.2 -1.3 8.9 7.3 Rubber 27.0 31.4 22.9 22.1 22.4 28.2 27.3 YoY growth, % 2.6 16.3 -27.1 -3.3 1.1 26.1 -3.1Selling price Average CPO price, Rp mn/ton 3.5 5.6 7.5 6.4 6.6 7.4 7.3 Average PK price, Rp mn/ton 2.0 3.5 4.1 2.9 3.0 3.3 3.3 Average rubber price, Rp mn/kg 17.7 16.9 24.2 16.4 15.1 15.6 16.5
Source: Company, Danareksa Sekuritas
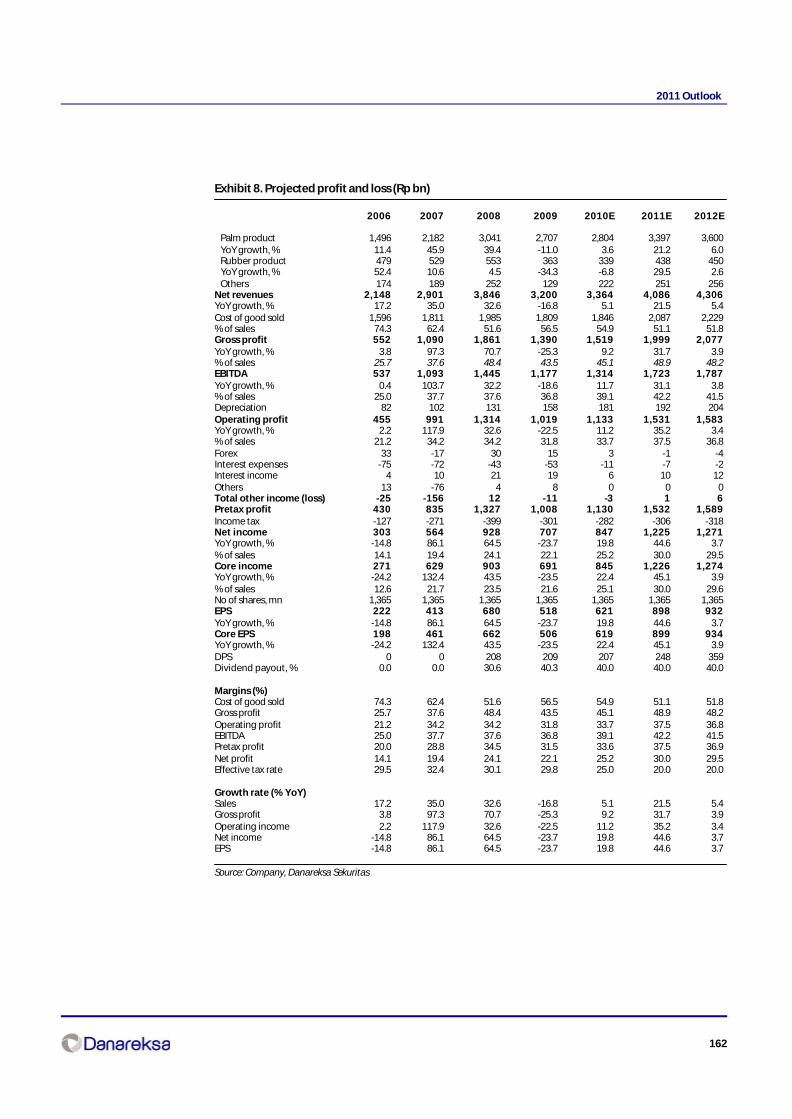
162
2011 Outlook
Exhibit 8. Projected profit and loss (Rp bn)
2006 2007 2008 2009 2010E 2011E 2012E
Palm product 1,496 2,182 3,041 2,707 2,804 3,397 3,600 YoY growth, % 11.4 45.9 39.4 -11.0 3.6 21.2 6.0 Rubber product 479 529 553 363 339 438 450 YoY growth, % 52.4 10.6 4.5 -34.3 -6.8 29.5 2.6 Others 174 189 252 129 222 251 256Net revenues 2,148 2,901 3,846 3,200 3,364 4,086 4,306YoY growth, % 17.2 35.0 32.6 -16.8 5.1 21.5 5.4Cost of good sold 1,596 1,811 1,985 1,809 1,846 2,087 2,229% of sales 74.3 62.4 51.6 56.5 54.9 51.1 51.8Gross profit 552 1,090 1,861 1,390 1,519 1,999 2,077YoY growth, % 3.8 97.3 70.7 -25.3 9.2 31.7 3.9% of sales 25.7 37.6 48.4 43.5 45.1 48.9 48.2EBITDA 537 1,093 1,445 1,177 1,314 1,723 1,787YoY growth, % 0.4 103.7 32.2 -18.6 11.7 31.1 3.8% of sales 25.0 37.7 37.6 36.8 39.1 42.2 41.5Depreciation 82 102 131 158 181 192 204Operating profit 455 991 1,314 1,019 1,133 1,531 1,583YoY growth, % 2.2 117.9 32.6 -22.5 11.2 35.2 3.4% of sales 21.2 34.2 34.2 31.8 33.7 37.5 36.8Forex 33 -17 30 15 3 -1 -4Interest expenses -75 -72 -43 -53 -11 -7 -2Interest income 4 10 21 19 6 10 12Others 13 -76 4 8 0 0 0Total other income (loss) -25 -156 12 -11 -3 1 6Pretax profit 430 835 1,327 1,008 1,130 1,532 1,589Income tax -127 -271 -399 -301 -282 -306 -318Net income 303 564 928 707 847 1,225 1,271YoY growth, % -14.8 86.1 64.5 -23.7 19.8 44.6 3.7% of sales 14.1 19.4 24.1 22.1 25.2 30.0 29.5Core income 271 629 903 691 845 1,226 1,274YoY growth, % -24.2 132.4 43.5 -23.5 22.4 45.1 3.9% of sales 12.6 21.7 23.5 21.6 25.1 30.0 29.6No of shares, mn 1,365 1,365 1,365 1,365 1,365 1,365 1,365EPS 222 413 680 518 621 898 932YoY growth, % -14.8 86.1 64.5 -23.7 19.8 44.6 3.7Core EPS 198 461 662 506 619 899 934YoY growth, % -24.2 132.4 43.5 -23.5 22.4 45.1 3.9DPS 0 0 208 209 207 248 359Dividend payout, % 0.0 0.0 30.6 40.3 40.0 40.0 40.0
Margins (%)Cost of good sold 74.3 62.4 51.6 56.5 54.9 51.1 51.8Gross profit 25.7 37.6 48.4 43.5 45.1 48.9 48.2Operating profit 21.2 34.2 34.2 31.8 33.7 37.5 36.8EBITDA 25.0 37.7 37.6 36.8 39.1 42.2 41.5Pretax profit 20.0 28.8 34.5 31.5 33.6 37.5 36.9Net profit 14.1 19.4 24.1 22.1 25.2 30.0 29.5Effective tax rate 29.5 32.4 30.1 29.8 25.0 20.0 20.0
Growth rate (% YoY)Sales 17.2 35.0 32.6 -16.8 5.1 21.5 5.4Gross profit 3.8 97.3 70.7 -25.3 9.2 31.7 3.9Operating income 2.2 117.9 32.6 -22.5 11.2 35.2 3.4Net income -14.8 86.1 64.5 -23.7 19.8 44.6 3.7EPS -14.8 86.1 64.5 -23.7 19.8 44.6 3.7
Source: Company, Danareksa Sekuritas

163
2011 Outlook
Exhibit 9. Projected balance sheet (Rp bn)
2006 2007 2008 2009 2010E 2011E 2012ECurrent assetsCash and cash equivalent 257 558 1,034 682 1,142 1,938 2,440Short term investment 0 0 0 0 0 0 0Receivables 60 83 158 77 79 96 101Inventories 131 226 214 192 196 222 237Prepaid taxes and expenses 15 14 18 2 2 2 2Advances 77 125 22 11 11 13 14Total Current Assets 540 1,006 1,446 964 1,430 2,271 2,794Plantation - mature 672 787 970 1,126 1,260 1,352 1,464Plantation - immature 693 875 826 829 819 866 925PPE 883 1,108 1,378 1,603 1,522 1,440 1,479Goodwill - net 0 0 0 0 0 0 0Other assets 198 162 302 329 315 315 315Total Non Current Assets 2,445 2,932 3,476 3,888 3,916 3,972 4,183Total Assets 2,985 3,938 4,921 4,852 5,346 6,243 6,977
Short term loan 405 0 0 0 0 0 0Payables 57 84 133 93 94 106 113Accrued expenses 153 233 222 243 252 307 323Current maturities of LT debt 174 260 284 204 78 79 0Others 161 257 167 146 144 165 173Total Current Liabilities 950 833 806 686 569 657 609Lt. debts - net of current maturities 467 539 610 31 78 0 0Others 222 251 265 322 322 322 322Total Non Current Liabilities 689 790 874 353 400 322 322Minority interest 0 0 0 0 0 0 0Capital stock 548 682 682 682 682 682 682Additional paid-in capital 618 888 888 1,030 1,030 1,030 1,030Others 0 0 -46 0 0 0 0Retained earnings 181 745 1,672 2,101 2,665 3,552 4,333Total Stockholders’ Equity 1,346 2,315 3,197 3,813 4,378 5,264 6,045Total Liabilities and Equity 2,985 3,938 4,877 4,852 5,346 6,243 6,977
Selected ratiosInventory turn 12 10 9 9 10 10 10Inventory days 31 35 40 40 38 36 37Payable days 10 11 15 16 12 11 11Receivable days 8 7 8 9 7 7 7Cash cycle 29 31 32 33 33 32 33Prepaid expense days 1 1 1 1 0 0 0Accrued expense days 34 36 32 38 40 39 42Other payable days 4 3 4 6 6 6 6Account payable, % of inventory 44 37 62 48 48 48 48Interest coverage 7 15 33 22 115 245 722Working capital -89 -126 -111 -200 -202 -245 -255Working capital % of sales -4 -4 -3 -6 -6 -6 -6Total debt 1,046 799 893 235 156 79 0Net debt 789 241 -141 -447 -986 -1,859 -2,440Debt/equity, % 77.7 34.5 27.9 6.2 3.6 1.5 0.0Net debt/equity, % 58.6 10.4 -4.4 -11.7 -22.5 -35.3 -40.4Cash and ST per share 188 409 758 500 837 1,420 1,788Book value per share 986 1,697 2,343 2,795 3,208 3,858 4,430
Extended Dupont ROEOperating margin 21.2% 34.2% 34.2% 31.8% 33.7% 37.5% 36.8%Interest burden 0.9 0.8 1.0 1.0 1.0 1.0 1.0Tax burden 0.7 0.7 0.7 0.7 0.8 0.8 0.8Total asset turnover 0.8 0.8 0.9 0.7 0.7 0.7 0.7Financial leverage 2.3 1.9 1.6 1.4 1.2 1.2 1.2ROE, % 24.5 30.8 33.7 20.2 20.7 25.4 22.5
Source: Company, Danareksa Sekuritas
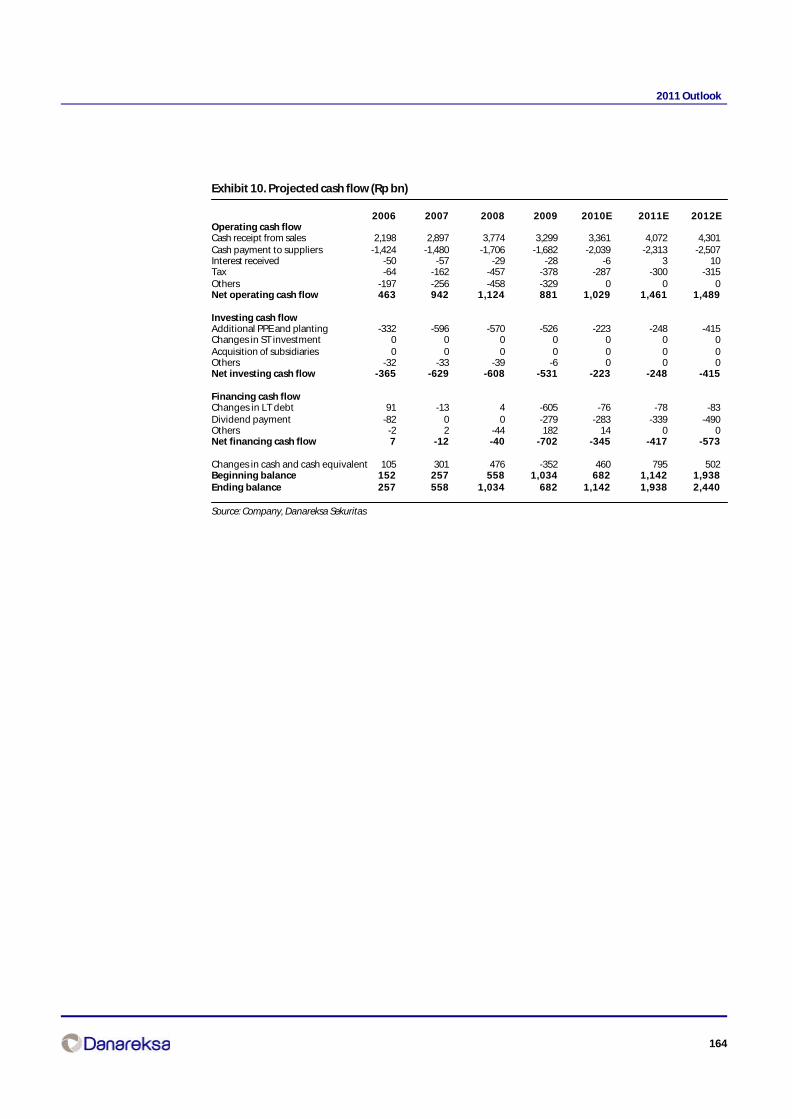
164
2011 Outlook
Exhibit 10. Projected cash flow (Rp bn)
2006 2007 2008 2009 2010E 2011E 2012EOperating cash flowCash receipt from sales 2,198 2,897 3,774 3,299 3,361 4,072 4,301Cash payment to suppliers -1,424 -1,480 -1,706 -1,682 -2,039 -2,313 -2,507Interest received -50 -57 -29 -28 -6 3 10Tax -64 -162 -457 -378 -287 -300 -315Others -197 -256 -458 -329 0 0 0Net operating cash flow 463 942 1,124 881 1,029 1,461 1,489
Investing cash flowAdditional PPE and planting -332 -596 -570 -526 -223 -248 -415Changes in ST investment 0 0 0 0 0 0 0Acquisition of subsidiaries 0 0 0 0 0 0 0Others -32 -33 -39 -6 0 0 0Net investing cash flow -365 -629 -608 -531 -223 -248 -415
Financing cash flowChanges in LT debt 91 -13 4 -605 -76 -78 -83Dividend payment -82 0 0 -279 -283 -339 -490Others -2 2 -44 182 14 0 0Net financing cash flow 7 -12 -40 -702 -345 -417 -573
Changes in cash and cash equivalent 105 301 476 -352 460 795 502Beginning balance 152 257 558 1,034 682 1,142 1,938Ending balance 257 558 1,034 682 1,142 1,938 2,440
Source: Company, Danareksa Sekuritas
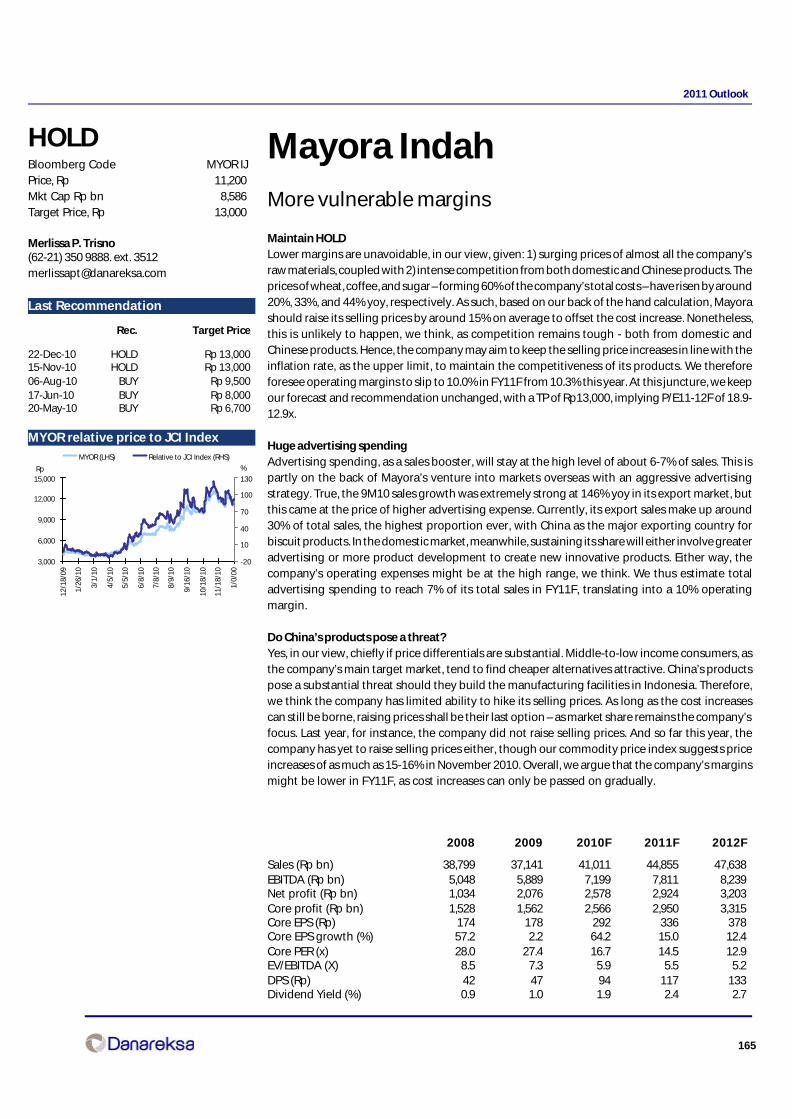
165
2011 Outlook
Mayora IndahMore vulnerable margins
Maintain HOLDLower margins are unavoidable, in our view, given: 1) surging prices of almost all the company’sraw materials, coupled with 2) intense competition from both domestic and Chinese products. Theprices of wheat, coffee, and sugar – forming 60% of the company’s total costs – have risen by around20%, 33%, and 44% yoy, respectively. As such, based on our back of the hand calculation, Mayorashould raise its selling prices by around 15% on average to offset the cost increase. Nonetheless,this is unlikely to happen, we think, as competition remains tough - both from domestic andChinese products. Hence, the company may aim to keep the selling price increases in line with theinflation rate, as the upper limit, to maintain the competitiveness of its products. We thereforeforesee operating margins to slip to 10.0% in FY11F from 10.3% this year. At this juncture, we keepour forecast and recommendation unchanged, with a TP of Rp13,000, implying P/E11-12F of 18.9-12.9x.
Huge advertising spendingAdvertising spending, as a sales booster, will stay at the high level of about 6-7% of sales. This ispartly on the back of Mayora’s venture into markets overseas with an aggressive advertisingstrategy. True, the 9M10 sales growth was extremely strong at 146% yoy in its export market, butthis came at the price of higher advertising expense. Currently, its export sales make up around30% of total sales, the highest proportion ever, with China as the major exporting country forbiscuit products. In the domestic market, meanwhile, sustaining its share will either involve greateradvertising or more product development to create new innovative products. Either way, thecompany’s operating expenses might be at the high range, we think. We thus estimate totaladvertising spending to reach 7% of its total sales in FY11F, translating into a 10% operatingmargin.
Do China’s products pose a threat?Yes, in our view, chiefly if price differentials are substantial. Middle-to-low income consumers, asthe company’s main target market, tend to find cheaper alternatives attractive. China’s productspose a substantial threat should they build the manufacturing facilities in Indonesia. Therefore,we think the company has limited ability to hike its selling prices. As long as the cost increasescan still be borne, raising prices shall be their last option – as market share remains the company’sfocus. Last year, for instance, the company did not raise selling prices. And so far this year, thecompany has yet to raise selling prices either, though our commodity price index suggests priceincreases of as much as 15-16% in November 2010. Overall, we argue that the company’s marginsmight be lower in FY11F, as cost increases can only be passed on gradually.
2008 2009 2010F 2011F 2012F
Sales (Rp bn) 38,799 37,141 41,011 44,855 47,638EBITDA (Rp bn) 5,048 5,889 7,199 7,811 8,239Net profit (Rp bn) 1,034 2,076 2,578 2,924 3,203Core profit (Rp bn) 1,528 1,562 2,566 2,950 3,315Core EPS (Rp) 174 178 292 336 378Core EPS growth (%) 57.2 2.2 64.2 15.0 12.4Core PER (x) 28.0 27.4 16.7 14.5 12.9EV/EBITDA (X) 8.5 7.3 5.9 5.5 5.2DPS (Rp) 42 47 94 117 133Dividend Yield (%) 0.9 1.0 1.9 2.4 2.7
Merlissa P. Trisno(62-21) 350 9888. ext. [email protected]
HOLDBloomberg Code MYOR IJPrice, Rp 11,200Mkt Cap Rp bn 8,586Target Price, Rp 13,000
Last Recommendation
Rec. Target Price
22-Dec-10 HOLD Rp 13,00015-Nov-10 HOLD Rp 13,00006-Aug-10 BUY Rp 9,50017-Jun-10 BUY Rp 8,00020-May-10 BUY Rp 6,700
MYOR relative price to JCI Index
3,000
6,000
9,000
12,000
15,000
12/1
8/09
1/26
/10
3/1/
10
4/5/
10
5/5/
10
6/8/
10
7/8/
10
8/9/
10
9/16
/10
10/1
8/10
11/1
8/10
1/0/
00
-20
10
40
70
100
130
MYOR (LHS) Relative to JCI Index (RHS)
%Rp

166
2011 Outlook
Exhibit 1. Sugar prices
Source: Company
Exhibit 2. Wheat prices
Source: Company
Exhibit 3. Margin trend
Source: Company
Exhibit 4. Huge advertising spending
Source: Company
Sugar price
0.0
0.2
0.4
0.6
0.8
1.0
1.2
Jan
-02
Au
g-0
2
Ap
r-03
De
c-0
3
Au
g-0
4
Ap
r-05
No
v-0
5
Jul-
06
Mar
-07
No
v-0
7
Jul-
08
Mar
-09
Oct
-09
Jun
-10
US$/kg Wheat price
0.0
2.0
4.0
6.0
8.0
10.0
12.0
14.0
Jan
-02
Sep
-02
May
-03
Jan
-04
Sep
-04
Jun
-05
Feb
-06
Oct
-06
Jun
-07
Mar
-08
No
v-0
8
Jul-
09
Mar
-10
De
c-1
0
US$/bushe
0%
5%
10%
15%
20%
25%
30%
35%
1Q00
1Q01
1Q02
1Q03
1Q04
1Q05
1Q06
1Q07
1Q08
1Q09
1Q10
-15%
-10%
-5%
0%
5%
10%
15%
20%
Gross margin (LHS) Operating margin (LHS)
Net margin (RHS)
fuel price incr. 126%
0
50
100
150
200
250
300350
400450
1Q07
1H07
9M07
FY07
1Q08
1H08
9M08
FY08
1Q09
1H09
9M09
FY09
1Q10
1H10
9M10
0%
2%
4%
6%
8%
10%
A&P expense (LHS) A&P-to-sales ratio (RHS)Rp bn
What could derail our forecast?The significant risk is the weakening of purchasing power if the government decides to raisethe fuel price. When fuel prices were hiked 126% back in 2005, the company’s operating profitdropped by 28% and the operating margin shrank to 5.5% from 9.5% previously. Other risksinclude stronger-than-expected prices of commodities – mainly wheat, coffee, and sugar– and rupiah depreciation. Higher prices of other commodities such as skimmed milk, cocoa,and CPO also pose a risk – albeit not as much as the former.

167
2011 Outlook
Exhibit 7. Projected profit and loss (Rp bn)
2008 2009 2010F 2011F 2012F
Revenues 3,908 4,777 6,713 7,991 9,617Gross profit 754 1,134 1,526 1,753 2,170Operating Profit 345 613 694 803 1,114EBITDA 460 745 870 1,006 1,354Net interest -71 -105 -86 -83 -67Interest income 4 20 15 12 12Interest expense -75 -126 -101 -95 -79Forex gain (loss) -16 -7 0 0 0Net other 16 3 2 2 2Pretax income 274 504 610 722 1,049Income tax -72 -121 -153 -180 -262Minority Interest -5 -10 -12 -13 -15Net profit 196 372 446 528 772
Source: Company and Danareksa Sekuritas
Exhibit 8. Projected balance sheet (Rp bn)
2008 2009 2010F 2011F 2012F
Total assets 2,923 3,246 3,884 4,365 5,110Current assets 1,685 1,750 2,176 2,444 2,959Cash & ST investment 344 334 258 152 209Account Receivable 752 881 1,119 1,332 1,603Inventories 534 459 692 832 993Others 55 77 108 128 154LT Investment 0 0 0 0 0Fixed Asset 1,031 1,283 1,473 1,663 1,867Others 207 213 235 258 284Total liabilities 1,678 1,665 1,929 1,971 2,049Current liabilities 770 764 1,080 1,225 1,247 Accounts payable 454 373 531 639 763 ST borrowings 240 250 350 350 200 Others 76 141 198 236 284Long-term liabilities 908 901 849 746 803 Long-term debts 747 698 600 450 450 Others 161 202 249 296 353Shareholder’s equity 1,245 1,582 1,955 2,394 3,060
Source: Company and Danareksa Sekuritas
Exhibit 5. 12-mth forward PER
Source: Bloomberg and Danareksa Sekuritas
Exhibit 6. 12-mth forward EV/EBITDA
Source: Bloomberg and Danareksa Sekuritas
0.0
5.0
10.0
15.0
20.0
25.0
Jan
-02
Au
g-0
2
Mar
-03
Oct
-03
May
-04
Dec
-04
Jul-
05
Mar
-06
Oct
-06
May
-07
Dec
-07
Jul-
08
Feb
-09
Sep
-09
Ap
r-1
0
Dec
-10
forward PE 12-mth Average 5-yrs+1 St.dev -1 St.devx
average = 6.7x
0.0
1.0
2.0
3.0
4.0
5.0
6.0
7.0
Jan
-02
Aug
-02
Mar
-03
Oct
-03
May
-04
Dec
-04
Jul-0
5
Mar
-06
Oct
-06
May
-07
Dec
-07
Jul-0
8
Feb
-09
Sep
-09
Ap
r-10
12-mth forward EV/EBITDAAverage 5-yrs+1 St.dev-1 St.dev
x
average = 3.4x
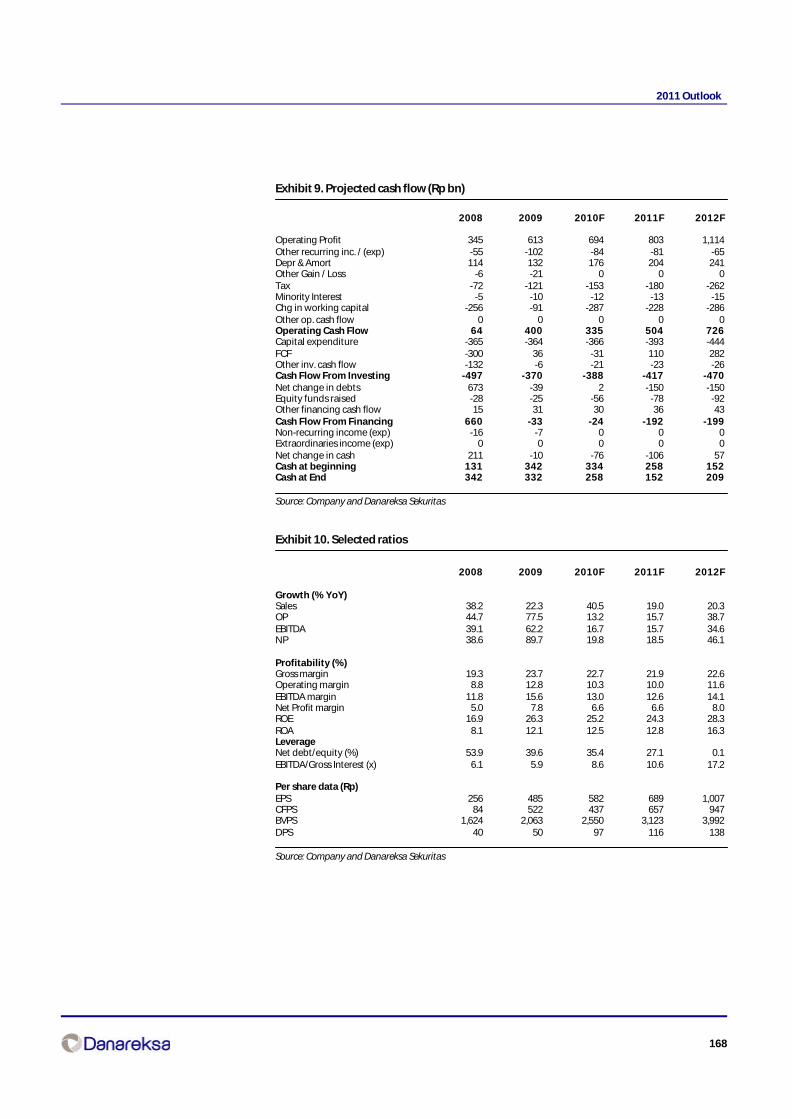
168
2011 Outlook
Exhibit 9. Projected cash flow (Rp bn)
2008 2009 2010F 2011F 2012F
Operating Profit 345 613 694 803 1,114Other recurring inc. / (exp) -55 -102 -84 -81 -65Depr & Amort 114 132 176 204 241Other Gain / Loss -6 -21 0 0 0Tax -72 -121 -153 -180 -262Minority Interest -5 -10 -12 -13 -15Chg in working capital -256 -91 -287 -228 -286Other op. cash flow 0 0 0 0 0Operating Cash Flow 64 400 335 504 726Capital expenditure -365 -364 -366 -393 -444FCF -300 36 -31 110 282Other inv. cash flow -132 -6 -21 -23 -26Cash Flow From Investing -497 -370 -388 -417 -470Net change in debts 673 -39 2 -150 -150Equity funds raised -28 -25 -56 -78 -92Other financing cash flow 15 31 30 36 43Cash Flow From Financing 660 -33 -24 -192 -199Non-recurring income (exp) -16 -7 0 0 0Extraordinaries income (exp) 0 0 0 0 0Net change in cash 211 -10 -76 -106 57Cash at beginning 131 342 334 258 152Cash at End 342 332 258 152 209
Source: Company and Danareksa Sekuritas
Exhibit 10. Selected ratios
2008 2009 2010F 2011F 2012F
Growth (% YoY)Sales 38.2 22.3 40.5 19.0 20.3OP 44.7 77.5 13.2 15.7 38.7EBITDA 39.1 62.2 16.7 15.7 34.6NP 38.6 89.7 19.8 18.5 46.1
Profitability (%)Gross margin 19.3 23.7 22.7 21.9 22.6Operating margin 8.8 12.8 10.3 10.0 11.6EBITDA margin 11.8 15.6 13.0 12.6 14.1Net Profit margin 5.0 7.8 6.6 6.6 8.0ROE 16.9 26.3 25.2 24.3 28.3ROA 8.1 12.1 12.5 12.8 16.3LeverageNet debt/equity (%) 53.9 39.6 35.4 27.1 0.1EBITDA/Gross Interest (x) 6.1 5.9 8.6 10.6 17.2
Per share data (Rp)EPS 256 485 582 689 1,007CFPS 84 522 437 657 947BVPS 1,624 2,063 2,550 3,123 3,992DPS 40 50 97 116 138
Source: Company and Danareksa Sekuritas

169
2011 Outlook
Mitra AdiperkasaPriced in
Maintain HOLD; TP set at Rp2,600While we like the company for its turnaround and cost efficiency story, earnings growth is unlikelyto be exciting – some 24% 3-yr CAGR. The stock has performed well thus far, yet from hereon, limitedupside is foreseen. We believe much of the company’s strategies including limiting new brandacquisitions and instead focusing more on maximizing the growth potential of its existing brands,coupled with the collaborative marketing with local banks, are pretty much already in the shareprice. Our TP of Rp2,600 implies a valuation of 17.5x PE11F and 2.5x PBV 11F. HOLD.
2011F previewWe expect the FY11F revenues to grow by 17% YoY to Rp 5.6Trn with the same-store-sales growthreaching 13% as more stores open this year, resulting in an additional 49,000sqm of space. Thiswill start to yield higher margins. Capex will be maintained at Rp300bn with an additional Rp 100bnfor working capital. Of the 40,000 sqm of new space added this year, 50% will be for departmentstores, 25% for specialty stores and the remainder for F&B. The company’s ability to source locallywill keep the gross margin at around 50% and the EBITDA margin at 11% for FY11F. Financingof the expansion shall come internally, although, if it wanted to, the company could raise moreloans considering FY11F’s net gearing of 58%.
New brand “Payless” – only a small contributionAcquisition of a new brand called “Payless Shoesource” is unlikely to contribute much to MAPI’srevenues in the near term. Tapping a middle segment with a relatively affordable price startingat US$25/pair, the company is planning to open 10-15 stores, with around 250-300sqm of floorspace, annually. Capex is around Rp2-3mn/sqm, excluding working capital needs. Yet as small asthe capex is, it will probably take around 1-2 years before the brand becomes well known and yieldsbetter margins. In fact, marketing expenses shall likely pick up, before greater margins aredelivered. While we believe the acquisition of Payless offers more scope for expansion – i.e. theexpansion is not limited only to Indonesia, its competitiveness remains to be seen.
Risks to our callKey risks to our call include: 1) higher inflation leading to higher interest rates and economicslowdown, thereby curbing purchasing power, 2) depreciation of the rupiah – note that 30% ofthe company’s debt is foreign currency denominated and 3) slower-than-expected store expansionthat may limit revenues growth.
Lydia Suwandi(62-21) 350 9888 ext. [email protected]
HOLDBloomberg Code MAPI IJPrice, Rp 2,350Mkt Cap Rp bn 3,901Target Price, Rp 2,600
MAPI relative price to JCI Index
Last Recommendation
Rec. Target Price
22-Dec-10 HOLD Rp 2,60005 Nov-10 HOLD Rp 2,60009-Aug-10 BUY Rp 1,12005-May-10 BUY Rp 97012-Apr-09 BUY Rp 970
MAPI relative to JCI Index
2008 2009 2010F 2011F 2012F
Revenues, Rp bn 4,854 5,521 6,394 7,452 8,463Gross profit, Rp bn 1,841 2,058 2,394 2,798 3,182EBITDA, Rp bn 515 554 698 802 899EBIT, Rp bn 303 308 422 500 571Net profit, Rp bn (70) 164 207 246 310Core profit, Rp bn 191 116 205 249 310Core EPS, Rp 115 70 123 150 187Core EPS growth, % 26 (40) 77 22 24EV/EBITDA, x 10 9 7 6 5Dividend Yield, % 49 0 0 0 0BVPS, Rp 679 776 901 1,049 1,236
500
1,000
1,500
2,000
2,500
3,000
12
/18
/09
2/1
/10
3/1
0/1
0
4/1
9/1
0
5/2
6/1
0
7/2
/10
8/9
/10
9/2
2/1
0
10
/28
/10
12
/6/1
0
-25
25
75
125
175
225
MAPI (LHS) Relative to JCI Index (RHS)%
Rp

170
2011 Outlook
Exhibit 1. 9M10 ‘s SSSG reach 10% YTD
Source: Company
Exhibit 2. Revenue breakdown
Source: Company
Exhibit 3. Net operating cash flow saw an improvement
Source: Company
Exhibit 4. collaborative marketing with local banks eased downadvertising expense
Source: Company
Exhibit 5. 12-mth forward PER
Source: Company
Exhibit 6. 12-mth forward PBV
Source: Company
0.0
3.0
6.0
9.0
12.0
15.0
18.0
21.0
Nov
-04
Jun
-05
Dec
-05
Jul-0
6
Feb
-07
Aug
-07
Mar
-08
Oct
-08
Ap
r-09
Nov
-09
Jun
-10
Retail, 59%
Others, 4%F&B, 11%
Dept Store, 27%
average 9.2x
-15%
-10%
-5%
0%
5%
10%
15%
20%
25%
Jan
-07
Mar
-07
May
-07
Jul-
07Se
p-0
7N
ov-
07Ja
n-0
8M
ar-0
8M
ay-0
8Ju
l-08
Sep
-08
No
v-08
Jan
-09
Mar
-09
May
-09
Jul-
09Se
p-0
9N
ov-
09Ja
n-1
0M
ar-1
0M
ay-1
0Ju
l-10
Sep
-10
-
100
200
300
400
500
600
700
Rp bnMonthly sales (RHS) YTD SSG (LHS)
(300)
(200)
(100)
0
100
200
300
400
3M05
9M05
3M06
9M06
3M07
9M07
3M08
9M08
3M09
9M09
3M10
9M10
-20.0%
-15.0%
-10.0%
-5.0%
0.0%
5.0%
10.0%
15.0%
CFO CFO/Gross SalesRp bn
0.0%0.2%
0.4%
0.6%0.8%
1.0%
1.2%
1.4%1.6%
1.8%
2.0%
1Q08
2Q08
3Q08
4Q08
1Q09
2Q09
3Q09
4Q09
1Q10
3Q10
-3
5
810
13
15
1820
23
25
Rp bnA&P (RHS) A&P/Sales (LHS)
0.0
0.2
0.4
0.6
0.8
1.0
1.2
1.4
1.6
1.8
2.0
Jan
-05
Ap
r-0
5
Au
g-0
5
De
c-0
5
Mar
-06
Jul-
06
No
v-0
6
Mar
-07
Jun
-07
Oct
-07
Feb
-08
May
-08
Sep
-08
Jan
-09
Ap
r-0
9
Au
g-0
9
De
c-0
9
Mar
-10
Jul-
10
No
v-1
0
average 1.1x
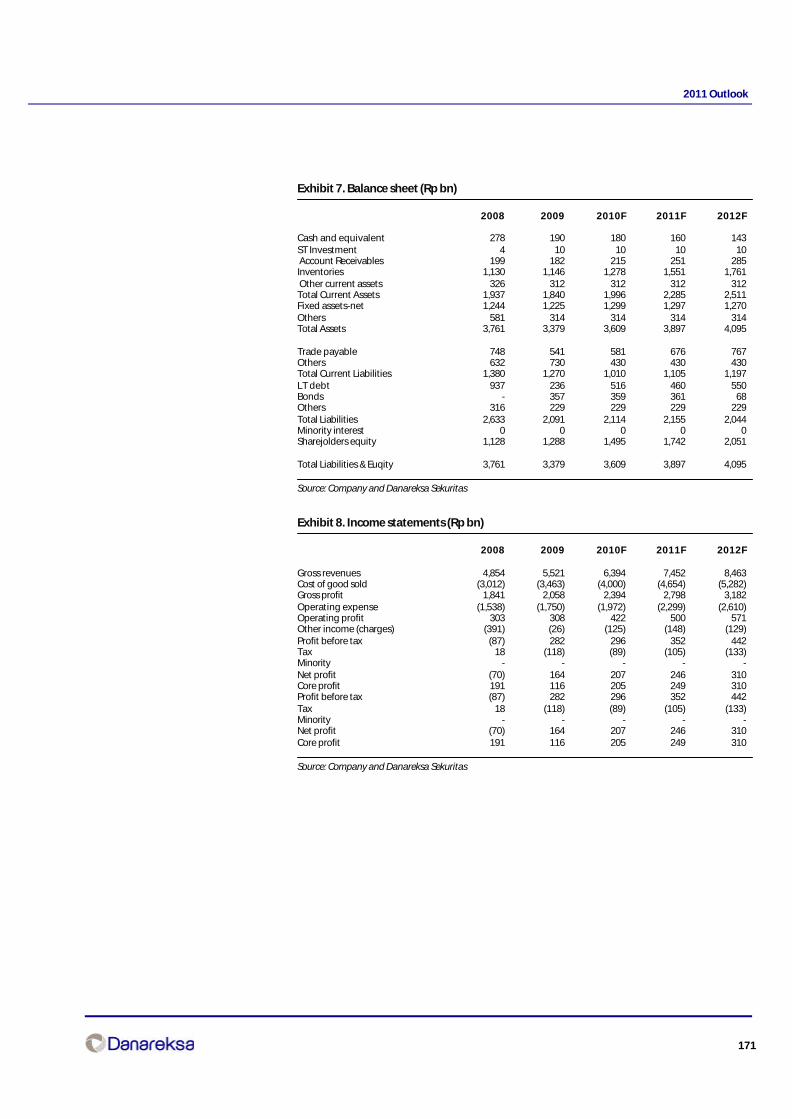
171
2011 Outlook
Exhibit 7. Balance sheet (Rp bn)
2008 2009 2010F 2011F 2012F
Cash and equivalent 278 190 180 160 143ST Investment 4 10 10 10 10 Account Receivables 199 182 215 251 285Inventories 1,130 1,146 1,278 1,551 1,761 Other current assets 326 312 312 312 312Total Current Assets 1,937 1,840 1,996 2,285 2,511Fixed assets-net 1,244 1,225 1,299 1,297 1,270Others 581 314 314 314 314Total Assets 3,761 3,379 3,609 3,897 4,095
Trade payable 748 541 581 676 767Others 632 730 430 430 430Total Current Liabilities 1,380 1,270 1,010 1,105 1,197LT debt 937 236 516 460 550Bonds - 357 359 361 68Others 316 229 229 229 229Total Liabilities 2,633 2,091 2,114 2,155 2,044Minority interest 0 0 0 0 0Sharejolders equity 1,128 1,288 1,495 1,742 2,051
Total Liabilities & Euqity 3,761 3,379 3,609 3,897 4,095
Source: Company and Danareksa Sekuritas
Exhibit 8. Income statements (Rp bn)
2008 2009 2010F 2011F 2012F
Gross revenues 4,854 5,521 6,394 7,452 8,463Cost of good sold (3,012) (3,463) (4,000) (4,654) (5,282)Gross profit 1,841 2,058 2,394 2,798 3,182Operating expense (1,538) (1,750) (1,972) (2,299) (2,610)Operating profit 303 308 422 500 571Other income (charges) (391) (26) (125) (148) (129)Profit before tax (87) 282 296 352 442Tax 18 (118) (89) (105) (133)Minority - - - - -Net profit (70) 164 207 246 310Core profit 191 116 205 249 310Profit before tax (87) 282 296 352 442Tax 18 (118) (89) (105) (133)Minority - - - - -Net profit (70) 164 207 246 310Core profit 191 116 205 249 310
Source: Company and Danareksa Sekuritas

172
2011 Outlook
Exhibit 9. Cash flow (Rp bn)
2008 2009 2010F 2011F 2012FCash Flow From Operating ActivitiesCash Received From Customers 3,437 4,093 6,360 7,417 8,429Cash payment to suppliers & employees (3,213) (3,671) (5,916) (6,829) (7,682)Cash provided by operations 223 422 444 587 747Interest expense (59) (110) (135) (149) (133)Tax payment (4) (42) (89) (105) (133)Net Cash Provided by Operating Activities 160 270 221 333 481Cash Flow From Investing Activities - - - - -PPE (314) (237) (350) (300) (300)Investment (72) (4) - - - Interest income 9 5 6 5 5Others (23) (12) - - -Net Cash Provided by Investing Activities (400) (247) (344) (295) (295)
- - - - -Cash Flow From Financing Activities - - - - -Loan 208 (138) 110 (54) (203)Dividend paid (19) - - - -Others (6) 26 - - -Net Cash Provided by Financing Activities 183 (111) 110 (54) (203)
- - - - -Net Effect of Changes in Foreign Exchange (5) 0 4 (5) -
- - - - -Net Changes (60) (88) (9) (20) (17)Beginning Balance 339 278 190 180 160Ending Balance 278 190 180 160 143
Source: Company and Danareksa Sekuritas
Exhibit 10. Ratios, %
2008 2009 2010 2011 2012
Gross margin 37.94 37.27 37.44 37.55 37.59Operating margin 6.25 5.57 6.60 6.71 6.75Pre-tax margin (1.80) 5.10 4.63 4.72 5.23Net margin (1.44) 2.97 3.24 3.30 3.66Core net margin 3.94 2.10 3.20 3.35 3.66ROA (2.08) 4.59 5.94 6.56 7.75ROE (5.93) 13.58 14.90 15.21 16.33Debt to Equity 122.28 86.34 81.75 67.11 47.10Net gearing 97.61 71.61 69.69 57.91 40.14
Source: Danareksa Sekuritas

173
2011 Outlook
Multistrada Arah SaranaStrong growth player
Reiterate BUY, TP of Rp530We reiterate our BUY recommendation on the stock with a Target Price of Rp530 implying 13.6x-9.4x 11F-12F PER. We use a lower equity risk premium of 5.5%, a figure likely to be sustainable overthe medium term, we believe. Note that the yield on Indonesian 10-year bonds has dropped toan historic low of 7.4% while the spread on US 10-year Treasury bonds has declined to an historiclow of 1.2%. The company’s growth prospects are bright (the revenues should grow by around37% CAGR in the next 2 years), supported by rapid expansion and strong demand for its products.Currently the stock is trading at an attractive valuation of 8.4x-5.8x 11F-12F PER.
Strong demand shall drive net profits growthWe expect the core profits to grow 42.6% in 2011. In October, orders for the company’s passengercar radial tires reached 1.6x of its capacity, while orders for the company’s motorcycle tires exceeded2x its capacity. The orders have surpassed production capacity since 2006 and going forward thedemand for the company’s tires should remain strong as there are additional orders of 1.2 mn tiresfor the US market in 2011. In addition, the company also has plans to penetrate the tire marketsin China, Brazil, and Russia. Margins wise, the operating margin should expand slightly to 13.4%in 2011F from 12.9% in 2010F as we expect the company to pass the raw material price increasesonto the customers as well as increase the sales portion of higher margin ultra high performancetires.
Expansion is underwayThe company is expanding its Passenger Car Radial (PCR) and motorcycle tires production capacityto 28,500 tires/day and 16,000 tires/day respectively in early 2011 from 17,500 tires/day and 8,000tires/day initially. As part of the expansion program, the company has trained and increased theworkforce from 1,800 to around 2,500 employees in May of this year. Consequently, the productionrate should increase gradually to 19,000 PCR tires/day and 12,000 motorcycle tires per day inDecember from around 16,800 PCR/day and 7,990 motorcycle tires/day previously.
Key risks: raw materials price volatility, timeliness of the expansionAs the raw materials account for 67% of MASA’s 9M10 manufacturing costs, fluctuations in rawmaterial prices can potentially impact the gross margin. However, the company should be ableto pass any raw material price increases onto the customer in 1 month; hence, rapid increases inraw materials prices should only squeeze the gross margin temporarily. The timeliness of theexpansion is another key risk to our forecast as the production plant is currently running at themaximum utilization rate.
Indra P Yudison(62-21) 350 9888 ext. [email protected]
BUYBloomberg Code MASA IJPrice, Rp 325Market Cap, Rp bn 1,989Target Price, Rp 530
MASA relative price to JCI Index relative price to JCI Index
Last Recommendation
Rec. Target Price
22-Dec-10 BUY Rp 53019-Nov-10 BUY Rp 45030-Sep-10 BUY Rp 45028-Jul-10 BUY Rp 40014-Jun-10 BUY Rp 400
100
150
200
250
300
350
400
12
/18
/09
1/2
6/1
0
2/2
5/1
0
3/3
1/1
0
5/3
/10
6/4
/10
7/6
/10
8/5
/10
9/7
/10
10
/14
/10
11
/15
/10
12
/17
/10
-15
-5
5
15
25
35
45
55
MASA (LHS) Relative to JCI Index (RHS)
%Rp
2008 2009 2010F 2011F 2012F
Sales, Rp bn 1,334 1,691 2,165 3,033 4,071EBITDA, Rp bn 265 310 395 572 768Net Profit, Rp bn 3 175 178 238 344Core Profit, Rp bn 91 132 172 246 343Core EPS, Rp 14.9 21.6 28.1 40.1 56.1Core EPS Growth, % 147.0 45.1 30.4 42.6 39.8Core PER, x 21.9 15.1 11.6 8.1 5.8EV/EBITDA 10.3 8.5 7.8 6.7 4.7Dividend Yield, % 0.3 - 0.3 - 2.4BVPS, Rp 209.9 238.4 266.6 305.4 353.8
Cut off data December 16,2010
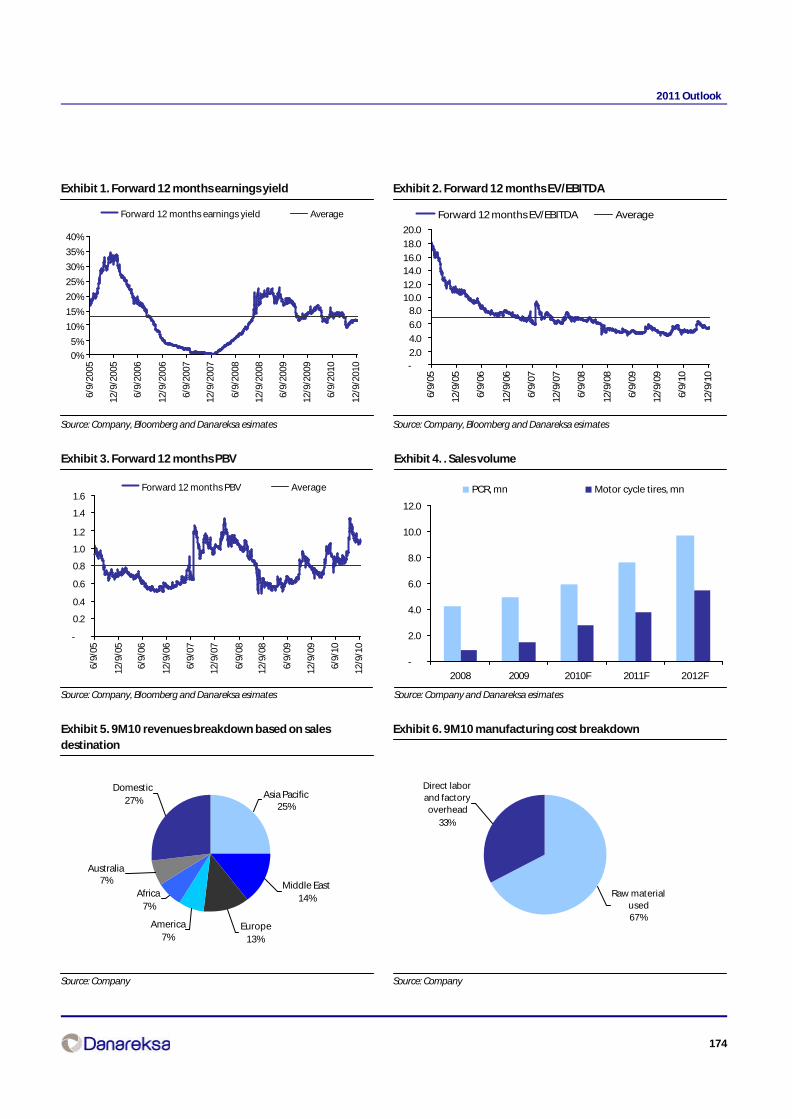
174
2011 Outlook
Exhibit 1. Forward 12 months earnings yield
Source: Company, Bloomberg and Danareksa esimates
Exhibit 2. Forward 12 months EV/EBITDA
Source: Company, Bloomberg and Danareksa esimates
Exhibit 3. Forward 12 months PBV
Source: Company, Bloomberg and Danareksa esimates
Exhibit 4. . Sales volume
Source: Company and Danareksa esimates
Exhibit 5. 9M10 revenues breakdown based on salesdestination
Source: Company
Exhibit 6. 9M10 manufacturing cost breakdown
Source: Company
0%
5%
10%
15%
20%
25%
30%
35%
40%
6/9/
2005
12/9
/200
5
6/9/
2006
12/9
/200
6
6/9/
2007
12/9
/200
7
6/9/
2008
12/9
/200
8
6/9/
2009
12/9
/200
9
6/9/
2010
12/9
/201
0
Forward 12 months earnings yield Average
-2.0
4.0
6.0
8.010.012.0
14.016.0
18.0
20.0
6/9/
05
12/9
/05
6/9/
06
12/9
/06
6/9/
07
12/9
/07
6/9/
08
12/9
/08
6/9/
09
12/9
/09
6/9/
10
12/9
/10
Forward 12 months EV/EBITDA Average
-
0.2
0.4
0.6
0.8
1.0
1.2
1.4
1.6
6/9/
05
12/9
/05
6/9/
06
12/9
/06
6/9/
07
12/9
/07
6/9/
08
12/9
/08
6/9/
09
12/9
/09
6/9/
10
12/9
/10
Forward 12 months PBV Average
-
2.0
4.0
6.0
8.0
10.0
12.0
2008 2009 2010F 2011F 2012F
PCR, mn Motor cycle tires, mn
America7%
Africa7%
Domestic27%
Australia7%
Europe13%
Middle East14%
Asia Pacific25%
Raw material used67%
Direct labor and factory overhead
33%
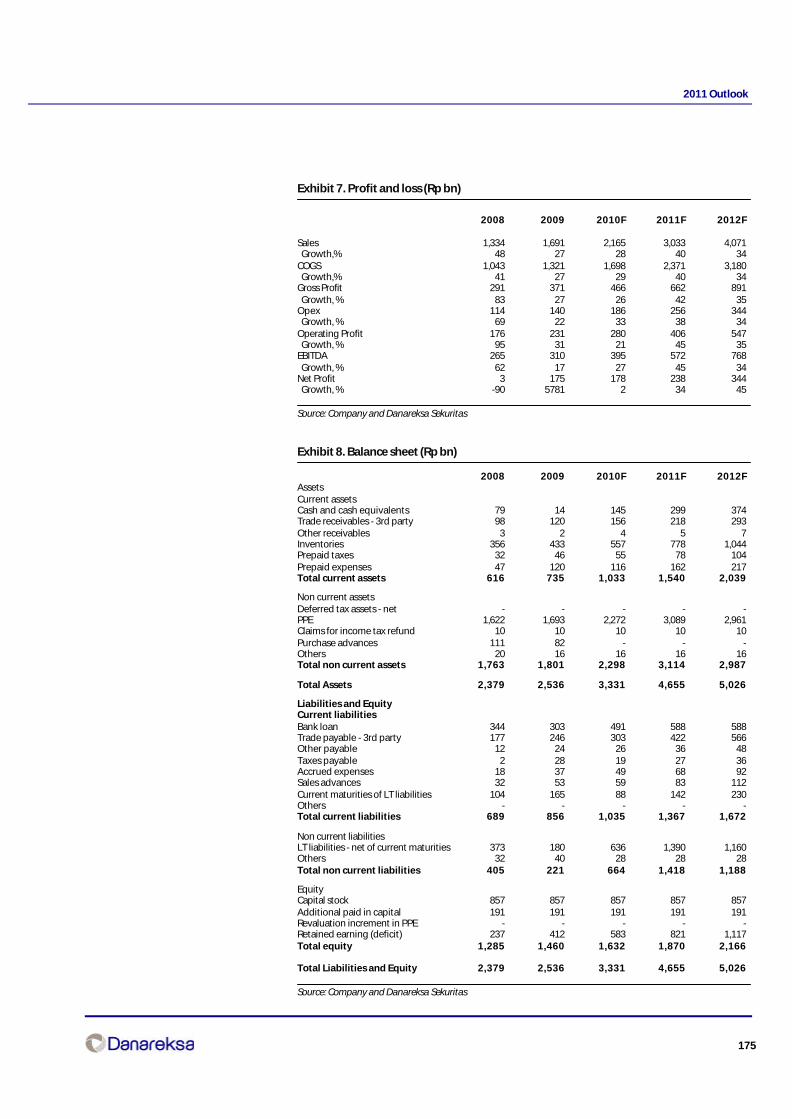
175
2011 Outlook
Exhibit 7. Profit and loss (Rp bn)
2008 2009 2010F 2011F 2012F
Sales 1,334 1,691 2,165 3,033 4,071 Growth,% 48 27 28 40 34COGS 1,043 1,321 1,698 2,371 3,180 Growth,% 41 27 29 40 34Gross Profit 291 371 466 662 891 Growth, % 83 27 26 42 35Opex 114 140 186 256 344 Growth, % 69 22 33 38 34Operating Profit 176 231 280 406 547 Growth, % 95 31 21 45 35EBITDA 265 310 395 572 768 Growth, % 62 17 27 45 34Net Profit 3 175 178 238 344 Growth, % -90 5781 2 34 45
Source: Company and Danareksa Sekuritas
Exhibit 8. Balance sheet (Rp bn)
2008 2009 2010F 2011F 2012FAssetsCurrent assetsCash and cash equivalents 79 14 145 299 374Trade receivables - 3rd party 98 120 156 218 293Other receivables 3 2 4 5 7Inventories 356 433 557 778 1,044Prepaid taxes 32 46 55 78 104Prepaid expenses 47 120 116 162 217Total current assets 616 735 1,033 1,540 2,039
Non current assetsDeferred tax assets - net - - - - -PPE 1,622 1,693 2,272 3,089 2,961Claims for income tax refund 10 10 10 10 10Purchase advances 111 82 - - -Others 20 16 16 16 16Total non current assets 1,763 1,801 2,298 3,114 2,987
Total Assets 2,379 2,536 3,331 4,655 5,026
Liabilities and EquityCurrent liabilitiesBank loan 344 303 491 588 588Trade payable - 3rd party 177 246 303 422 566Other payable 12 24 26 36 48Taxes payable 2 28 19 27 36Accrued expenses 18 37 49 68 92Sales advances 32 53 59 83 112Current maturities of LT liabilities 104 165 88 142 230Others - - - - -Total current liabilities 689 856 1,035 1,367 1,672
Non current liabilitiesLT liabilities - net of current maturities 373 180 636 1,390 1,160Others 32 40 28 28 28Total non current liabilities 405 221 664 1,418 1,188
EquityCapital stock 857 857 857 857 857Additional paid in capital 191 191 191 191 191Revaluation increment in PPE - - - - -Retained earning (deficit) 237 412 583 821 1,117Total equity 1,285 1,460 1,632 1,870 2,166
Total Liabilities and Equity 2,379 2,536 3,331 4,655 5,026
Source: Company and Danareksa Sekuritas
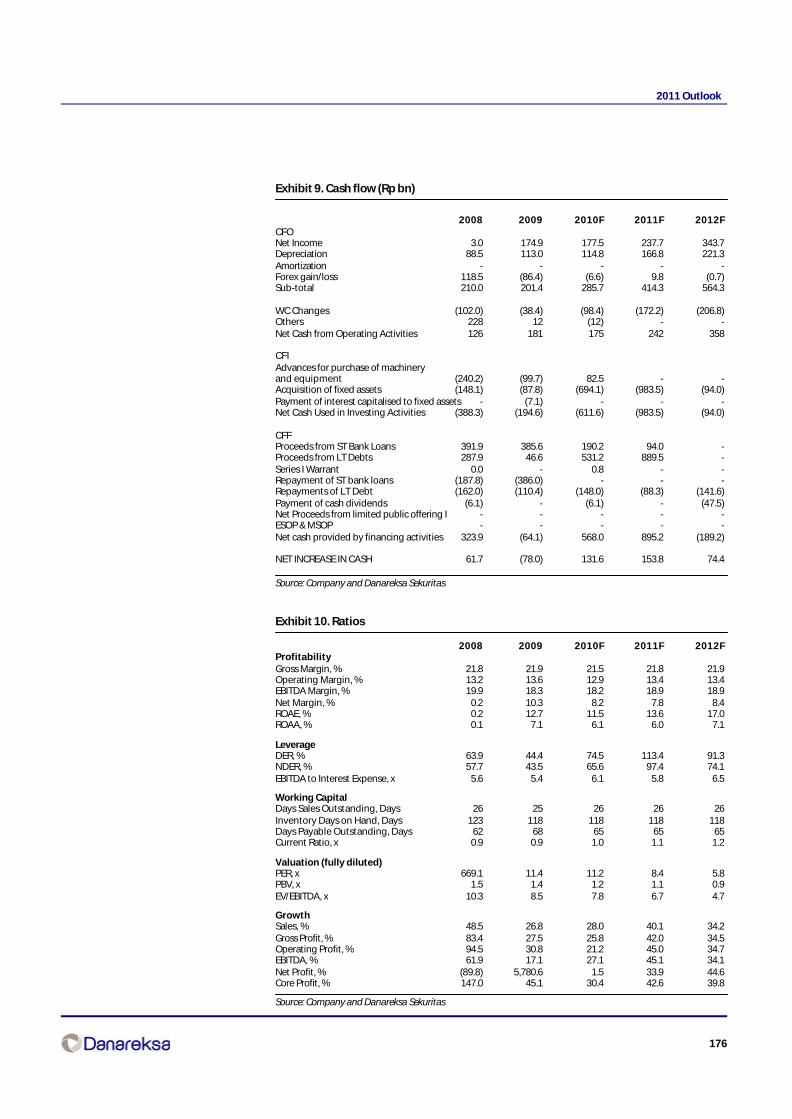
176
2011 Outlook
Exhibit 9. Cash flow (Rp bn)
2008 2009 2010F 2011F 2012FCFONet Income 3.0 174.9 177.5 237.7 343.7Depreciation 88.5 113.0 114.8 166.8 221.3Amortization - - - - -Forex gain/loss 118.5 (86.4) (6.6) 9.8 (0.7)Sub-total 210.0 201.4 285.7 414.3 564.3
WC Changes (102.0) (38.4) (98.4) (172.2) (206.8)Others 228 12 (12) - -Net Cash from Operating Activities 126 181 175 242 358
CFIAdvances for purchase of machineryand equipment (240.2) (99.7) 82.5 - -Acquisition of fixed assets (148.1) (87.8) (694.1) (983.5) (94.0)Payment of interest capitalised to fixed assets - (7.1) - - -Net Cash Used in Investing Activities (388.3) (194.6) (611.6) (983.5) (94.0)
CFFProceeds from ST Bank Loans 391.9 385.6 190.2 94.0 -Proceeds from LT Debts 287.9 46.6 531.2 889.5 -Series I Warrant 0.0 - 0.8 - -Repayment of ST bank loans (187.8) (386.0) - - -Repayments of LT Debt (162.0) (110.4) (148.0) (88.3) (141.6)Payment of cash dividends (6.1) - (6.1) - (47.5)Net Proceeds from limited public offering I - - - - -ESOP & MSOP - - - - -Net cash provided by financing activities 323.9 (64.1) 568.0 895.2 (189.2)
NET INCREASE IN CASH 61.7 (78.0) 131.6 153.8 74.4
Source: Company and Danareksa Sekuritas
Exhibit 10. Ratios
2008 2009 2010F 2011F 2012FProfitabilityGross Margin, % 21.8 21.9 21.5 21.8 21.9Operating Margin, % 13.2 13.6 12.9 13.4 13.4EBITDA Margin, % 19.9 18.3 18.2 18.9 18.9Net Margin, % 0.2 10.3 8.2 7.8 8.4ROAE, % 0.2 12.7 11.5 13.6 17.0ROAA, % 0.1 7.1 6.1 6.0 7.1
LeverageDER, % 63.9 44.4 74.5 113.4 91.3NDER, % 57.7 43.5 65.6 97.4 74.1EBITDA to Interest Expense, x 5.6 5.4 6.1 5.8 6.5
Working CapitalDays Sales Outstanding, Days 26 25 26 26 26Inventory Days on Hand, Days 123 118 118 118 118Days Payable Outstanding, Days 62 68 65 65 65Current Ratio, x 0.9 0.9 1.0 1.1 1.2
Valuation (fully diluted)PER, x 669.1 11.4 11.2 8.4 5.8PBV, x 1.5 1.4 1.2 1.1 0.9EV/EBITDA, x 10.3 8.5 7.8 6.7 4.7
GrowthSales, % 48.5 26.8 28.0 40.1 34.2Gross Profit, % 83.4 27.5 25.8 42.0 34.5Operating Profit, % 94.5 30.8 21.2 45.0 34.7EBITDA, % 61.9 17.1 27.1 45.1 34.1Net Profit, % (89.8) 5,780.6 1.5 33.9 44.6Core Profit, % 147.0 45.1 30.4 42.6 39.8
Source: Company and Danareksa Sekuritas
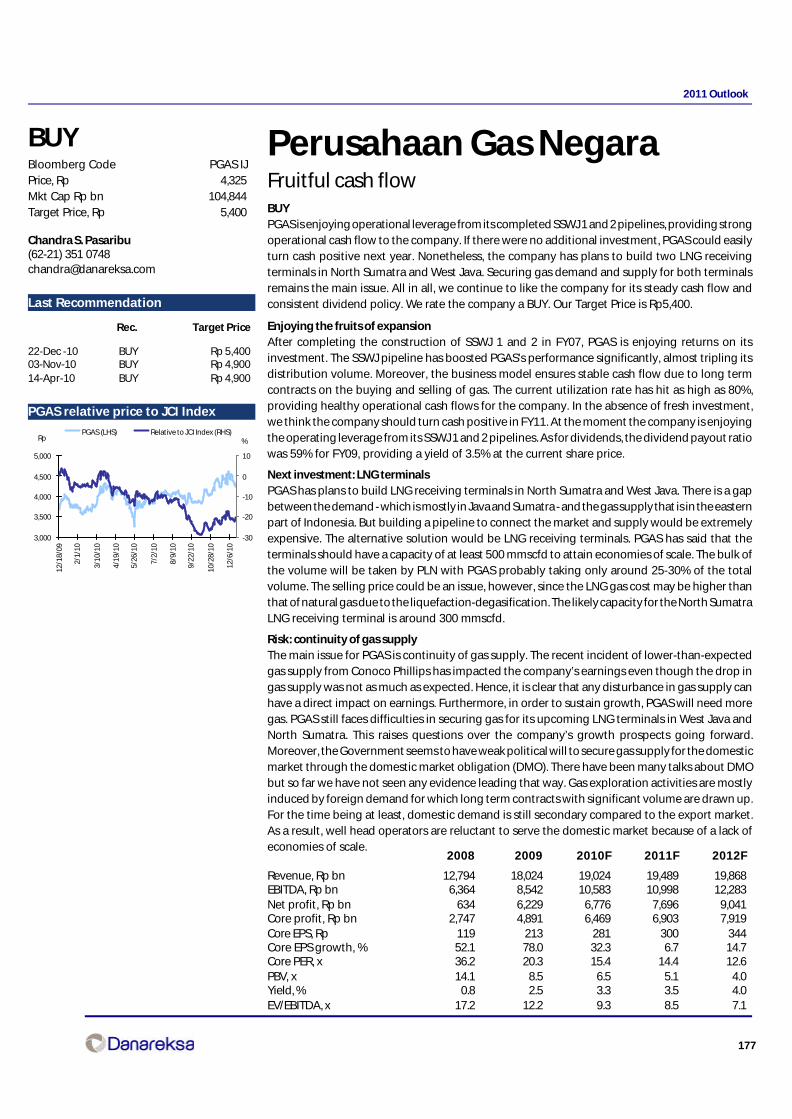
177
2011 Outlook
Perusahaan Gas NegaraFruitful cash flowBUYPGAS is enjoying operational leverage from its completed SSWJ 1 and 2 pipelines, providing strongoperational cash flow to the company. If there were no additional investment, PGAS could easilyturn cash positive next year. Nonetheless, the company has plans to build two LNG receivingterminals in North Sumatra and West Java. Securing gas demand and supply for both terminalsremains the main issue. All in all, we continue to like the company for its steady cash flow andconsistent dividend policy. We rate the company a BUY. Our Target Price is Rp5,400.
Enjoying the fruits of expansionAfter completing the construction of SSWJ 1 and 2 in FY07, PGAS is enjoying returns on itsinvestment. The SSWJ pipeline has boosted PGAS’s performance significantly, almost tripling itsdistribution volume. Moreover, the business model ensures stable cash flow due to long termcontracts on the buying and selling of gas. The current utilization rate has hit as high as 80%,providing healthy operational cash flows for the company. In the absence of fresh investment,we think the company should turn cash positive in FY11. At the moment the company is enjoyingthe operating leverage from its SSWJ 1 and 2 pipelines. As for dividends, the dividend payout ratiowas 59% for FY09, providing a yield of 3.5% at the current share price.
Next investment: LNG terminalsPGAS has plans to build LNG receiving terminals in North Sumatra and West Java. There is a gapbetween the demand - which is mostly in Java and Sumatra - and the gas supply that is in the easternpart of Indonesia. But building a pipeline to connect the market and supply would be extremelyexpensive. The alternative solution would be LNG receiving terminals. PGAS has said that theterminals should have a capacity of at least 500 mmscfd to attain economies of scale. The bulk ofthe volume will be taken by PLN with PGAS probably taking only around 25-30% of the totalvolume. The selling price could be an issue, however, since the LNG gas cost may be higher thanthat of natural gas due to the liquefaction-degasification. The likely capacity for the North SumatraLNG receiving terminal is around 300 mmscfd.
Risk: continuity of gas supplyThe main issue for PGAS is continuity of gas supply. The recent incident of lower-than-expectedgas supply from Conoco Phillips has impacted the company’s earnings even though the drop ingas supply was not as much as expected. Hence, it is clear that any disturbance in gas supply canhave a direct impact on earnings. Furthermore, in order to sustain growth, PGAS will need moregas. PGAS still faces difficulties in securing gas for its upcoming LNG terminals in West Java andNorth Sumatra. This raises questions over the company’s growth prospects going forward.Moreover, the Government seems to have weak political will to secure gas supply for the domesticmarket through the domestic market obligation (DMO). There have been many talks about DMObut so far we have not seen any evidence leading that way. Gas exploration activities are mostlyinduced by foreign demand for which long term contracts with significant volume are drawn up.For the time being at least, domestic demand is still secondary compared to the export market.As a result, well head operators are reluctant to serve the domestic market because of a lack ofeconomies of scale.
Last Recommendation
Chandra S. Pasaribu(62-21) 351 [email protected]
BUYBloomberg Code PGAS IJPrice, Rp 4,325Mkt Cap Rp bn 104,844Target Price, Rp 5,400
Last Recommendation
Rec. Target Price
22-Dec -10 BUY Rp 5,40003-Nov-10 BUY Rp 4,90014-Apr-10 BUY Rp 4,900Key Indicator 09F/10F
Major shareholders (%)
PGAS relative price to JCI Index
3,000
3,500
4,000
4,500
5,000
12/1
8/09
2/1/
10
3/10
/10
4/19
/10
5/26
/10
7/2/
10
8/9/
10
9/22
/10
10/2
8/10
12/6
/10
-30
-20
-10
0
10
PGAS (LHS) Relative to JCI Index (RHS)%Rp
2008 2009 2010F 2011F 2012F
Revenue, Rp bn 12,794 18,024 19,024 19,489 19,868EBITDA, Rp bn 6,364 8,542 10,583 10,998 12,283Net profit, Rp bn 634 6,229 6,776 7,696 9,041Core profit, Rp bn 2,747 4,891 6,469 6,903 7,919Core EPS, Rp 119 213 281 300 344Core EPS growth, % 52.1 78.0 32.3 6.7 14.7Core PER, x 36.2 20.3 15.4 14.4 12.6PBV, x 14.1 8.5 6.5 5.1 4.0Yield, % 0.8 2.5 3.3 3.5 4.0EV/EBITDA, x 17.2 12.2 9.3 8.5 7.1
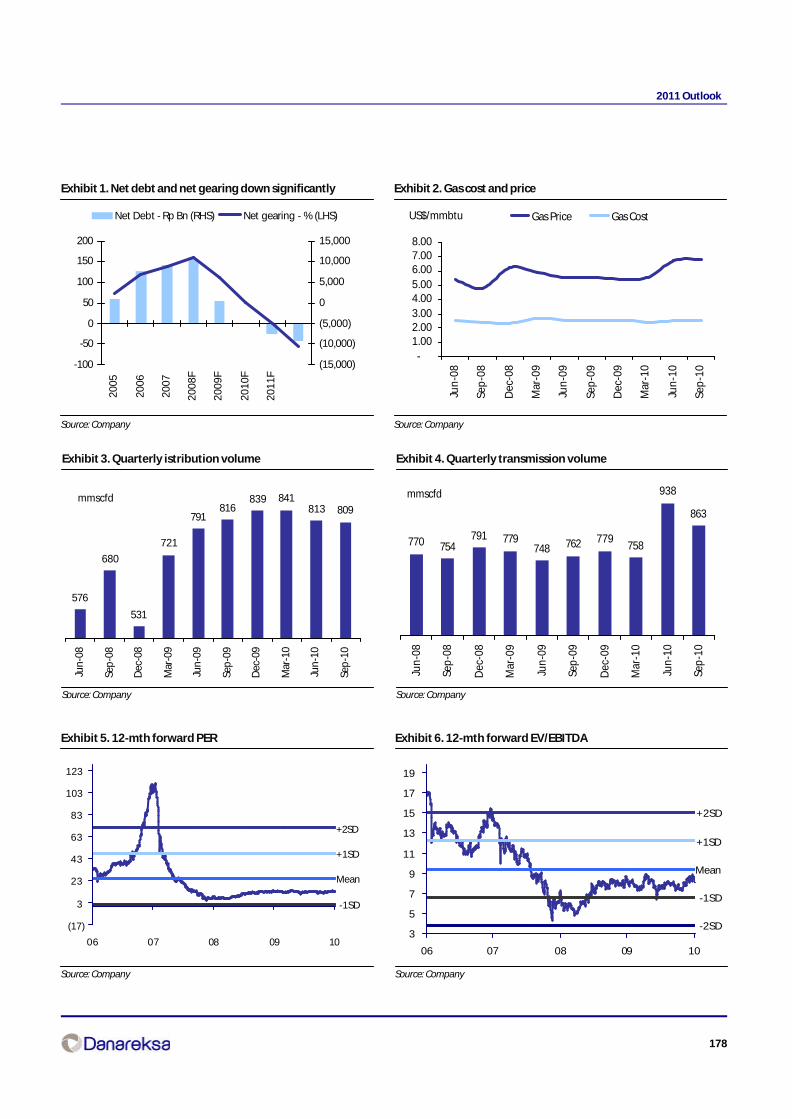
178
2011 Outlook
Exhibit 1. Net debt and net gearing down significantly
Source: Company
Exhibit 2. Gas cost and price
Source: Company
Exhibit 3. Quarterly istribution volume
Source: Company
Exhibit 4. Quarterly transmission volume
Source: Company
Exhibit 5. 12-mth forward PER
Source: Company
Exhibit 6. 12-mth forward EV/EBITDA
Source: Company
576
680
531
721
791816
839 841813 809
Jun
-08
Sep
-08
Dec
-08
Mar
-09
Jun
-09
Sep
-09
Dec
-09
Mar
-10
Jun
-10
Sep
-10
mmscfd
-100
-50
0
50
100
150
200
2005
2006
2007
2008
F
2009
F
2010
F
2011
F
(15,000)
(10,000)
(5,000)
0
5,000
10,000
15,000
Net Debt - Rp Bn (RHS) Net gearing - % (LHS)
-1.002.003.004.005.006.007.008.00
Jun
-08
Sep
-08
Dec
-08
Mar
-09
Jun
-09
Sep
-09
Dec
-09
Mar
-10
Jun
-10
Sep
-10
Gas Price Gas CostUS$/mmbtu
770 754791 779
748 762 779758
938
863
Jun-
08
Sep
-08
Dec
-08
Mar
-09
Jun-
09
Sep
-09
Dec
-09
Mar
-10
Jun-
10
Sep
-10
mmscfd
Mean
+1SD
-1SD
+2SD
(17)
3
23
43
63
83
103
123
06 07 08 09 10
Mean
+1SD
-1SD
+2SD
-2SD3
5
7
9
11
13
15
17
19
06 07 08 09 10

179
2011 Outlook
Exhibit 7. Balance sheet (Rp bn)
2008 2009 2010F 2011F 2012F
Cash & Equivalent 3,514 6,630 11,267 15,119 19,008Receivable 1,610 1,711 1,042 1,068 1,089Inventory 15 14 13 13 12Other current assets 2,040 908 357 189 327Total Current Asset 7,178 9,263 12,680 16,389 20,436
Fixed assets 17,613 17,329 16,628 16,054 15,590Other LT assets 759 2,078 1,841 1,772 1,566Total Non Current Asset 18,373 19,407 18,469 17,827 17,156TOTAL ASSET 25,551 28,670 31,148 34,216 37,592
ST LoansPayable 1,288 1,088 1,122 1,122 959Current portion of LT loans 512 995 1,307 1,384 462Other current liabilities 1,498 1,646 1,646 1,646 1,646Total Current Liab. 3,298 3,730 4,076 4,152 3,068
Long term loans 12,872 10,605 8,908 7,421 6,562Other LT Liab. 2,305 2,604 2,890 3,124 3,362Total Non Current Liab. 15,177 13,209 11,798 10,545 9,925
Equity 4,103 4,134 4,134 4,134 4,134Retained Earnings 2,797 8,023 11,565 15,809 20,890Others 175 (425) (425) (425) (425)Total Equity 7,075 11,732 15,274 19,518 24,599TOTAL LIABILITIES and EQUITY 25,551 28,670 31,148 34,216 37,592
Source: Company and Danareksa Sekuritas
Exhibit 8. Profit and loss (Rp bn)
2008 2009 2010F 2011F 2012F
Revenue 12,794 18,024 19,024 19,489 19,868COGS (5,227) (7,220) (6,827) (6,826) (5,835)Gross Profit 7,566 10,804 12,197 12,664 14,033
Selling exp. (2,097) (2,111) (1,436) (1,321) (1,256)G&A (812) (1,017) (1,057) (1,106) (1,159)Total Opex (2,909) (3,128) (2,492) (2,427) (2,415)
Operating Income 4,657 7,676 9,705 10,237 11,618
Net interest exp/income (488) (398) (138) (42) 35Forex (2,508) 1,245 (470) 103 397Others (379) (275) 0 0 0Other income/ expense (3,376) 571 (608) 61 432
Pre tax Income 1,281 8,247 9,097 10,298 12,051
Income tax (476) (1,814) (2,092) (2,369) (2,772)Minorities (171) (204) (228) (234) (238)Net Income 634 6,229 6,776 7,696 9,041
Source: Company and Danareksa Sekuritas

180
2011 Outlook
Exhibit 9. Cash flow (Rp bn)
2008 2009 2010F 2011F 2012F
Operating cash flowNet income 634 6,229 6,776 7,696 9,041Non-cash adjustments 2,449 1,710 851 734 638WC changes (1,294) 1,463 1,567 219 (1,243)Other assets/liabilities changes 558 (1,071) 237 69 207Sub-total 2,347 8,331 9,431 8,718 8,643
Investing cash flowAdditions of fixed assets (3,355) (581) (150) (160) (174)Disposals of fixed assets 0 0 0 0 0Additions of investments 0 0 0 0 0Liquidations of investments 0 0 0 0 0Sub-total (3,355) (581) (150) (160) (174)
Financing cash flowLoan principal 2,938 (2,295) (1,697) (1,487) (859)Capital injection - rights issue 0 0 0 0 0Capital injection - MSOP 658 28 0 0 0Dividend (786) (2,445) (3,234) (3,451) (3,960)Minority interest 238 79 287 234 238Sub-total 3,048 (4,633) (4,644) (4,704) (4,580)
Total cash flow movement 2,040 3,116 4,637 3,853 3,888
Source: Company and Danareksa Sekuritas
Exhibit 10. Ratios
2008 2009 2010F 2011F 2012F
ROE, % 9.5 66.2 50.2 44.2 41.0ROA , % 2.8 23.0 22.7 23.5 25.2EBITDA margin, % 49.7 47.4 55.6 56.4 61.8Operating margin, % 36.4 42.6 51.0 52.5 58.5Net margin, % 5.0 34.6 35.6 39.5 45.5
Receivable TO (days) 19.7 16.8 20.0 20.0 20.0Payable TO (days) 62.8 30.0 60.0 60.0 60.0Inventory TO (days) 1.0 0.7 0.7 0.7 0.8
Debt to Equity (X) 0.7 0.5 0.4 0.3 0.3Interest Coverage Ratio (X) 3.3 15.8 34.7 39.6 46.3Net Gearing (%) 154.6 53.7 1.8 net cash net cash
Current Ratio (X) 2.2 2.5 3.1 3.9 6.7Quick Ratio (X) 1.6 2.2 3.0 3.9 6.6
Source: Company and Danareksa Sekuritas
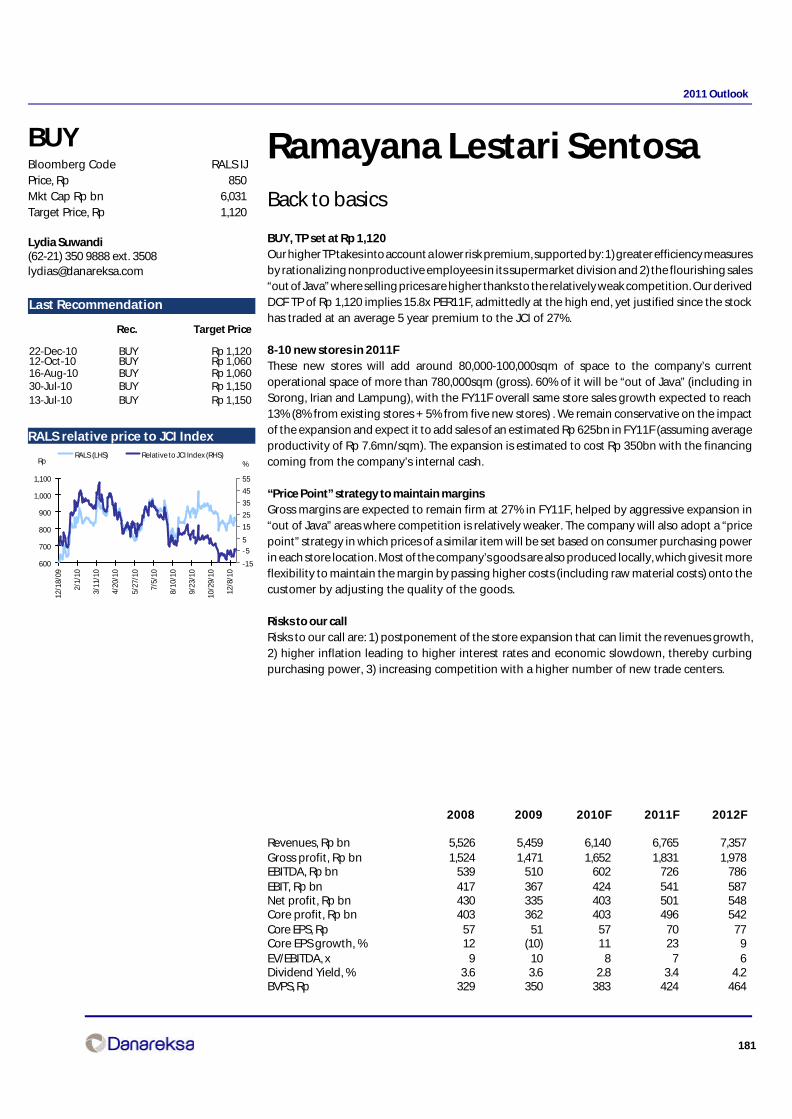
181
2011 Outlook
Ramayana Lestari SentosaBack to basics
BUY, TP set at Rp 1,120Our higher TP takes into account a lower risk premium, supported by: 1) greater efficiency measuresby rationalizing nonproductive employees in its supermarket division and 2) the flourishing sales“out of Java” where selling prices are higher thanks to the relatively weak competition. Our derivedDCF TP of Rp 1,120 implies 15.8x PER11F, admittedly at the high end, yet justified since the stockhas traded at an average 5 year premium to the JCI of 27%.
8-10 new stores in 2011FThese new stores will add around 80,000-100,000sqm of space to the company’s currentoperational space of more than 780,000sqm (gross). 60% of it will be “out of Java” (including inSorong, Irian and Lampung), with the FY11F overall same store sales growth expected to reach13% (8% from existing stores + 5% from five new stores) . We remain conservative on the impactof the expansion and expect it to add sales of an estimated Rp 625bn in FY11F (assuming averageproductivity of Rp 7.6mn/sqm). The expansion is estimated to cost Rp 350bn with the financingcoming from the company’s internal cash.
“Price Point” strategy to maintain marginsGross margins are expected to remain firm at 27% in FY11F, helped by aggressive expansion in“out of Java” areas where competition is relatively weaker. The company will also adopt a “pricepoint” strategy in which prices of a similar item will be set based on consumer purchasing powerin each store location. Most of the company’s goods are also produced locally, which gives it moreflexibility to maintain the margin by passing higher costs (including raw material costs) onto thecustomer by adjusting the quality of the goods.
Risks to our callRisks to our call are: 1) postponement of the store expansion that can limit the revenues growth,2) higher inflation leading to higher interest rates and economic slowdown, thereby curbingpurchasing power, 3) increasing competition with a higher number of new trade centers.
2008 2009 2010F 2011F 2012F
Revenues, Rp bn 5,526 5,459 6,140 6,765 7,357Gross profit, Rp bn 1,524 1,471 1,652 1,831 1,978EBITDA, Rp bn 539 510 602 726 786EBIT, Rp bn 417 367 424 541 587Net profit, Rp bn 430 335 403 501 548Core profit, Rp bn 403 362 403 496 542Core EPS, Rp 57 51 57 70 77Core EPS growth, % 12 (10) 11 23 9EV/EBITDA, x 9 10 8 7 6Dividend Yield, % 3.6 3.6 2.8 3.4 4.2BVPS, Rp 329 350 383 424 464
Lydia Suwandi(62-21) 350 9888 ext. [email protected]
BUYBloomberg Code RALS IJPrice, Rp 850Mkt Cap Rp bn 6,031Target Price, Rp 1,120
Last Recommendation
Rec. Target Price
22-Dec-10 BUY Rp 1,12012-Oct-10 BUY Rp 1,06016-Aug-10 BUY Rp 1,06030-Jul-10 BUY Rp 1,15013-Jul-10 BUY Rp 1,150
Last Recommendation
RALS relative price to JCI Index
600
700
800
900
1,000
1,100
12/1
8/09
2/1/
10
3/11
/10
4/20
/10
5/27
/10
7/5/
10
8/10
/10
9/23
/10
10/2
9/10
12/8
/10
-15
- 5
5
15
25
35
45
55
RALS (LHS) Relative to JCI Index (RHS)%Rp
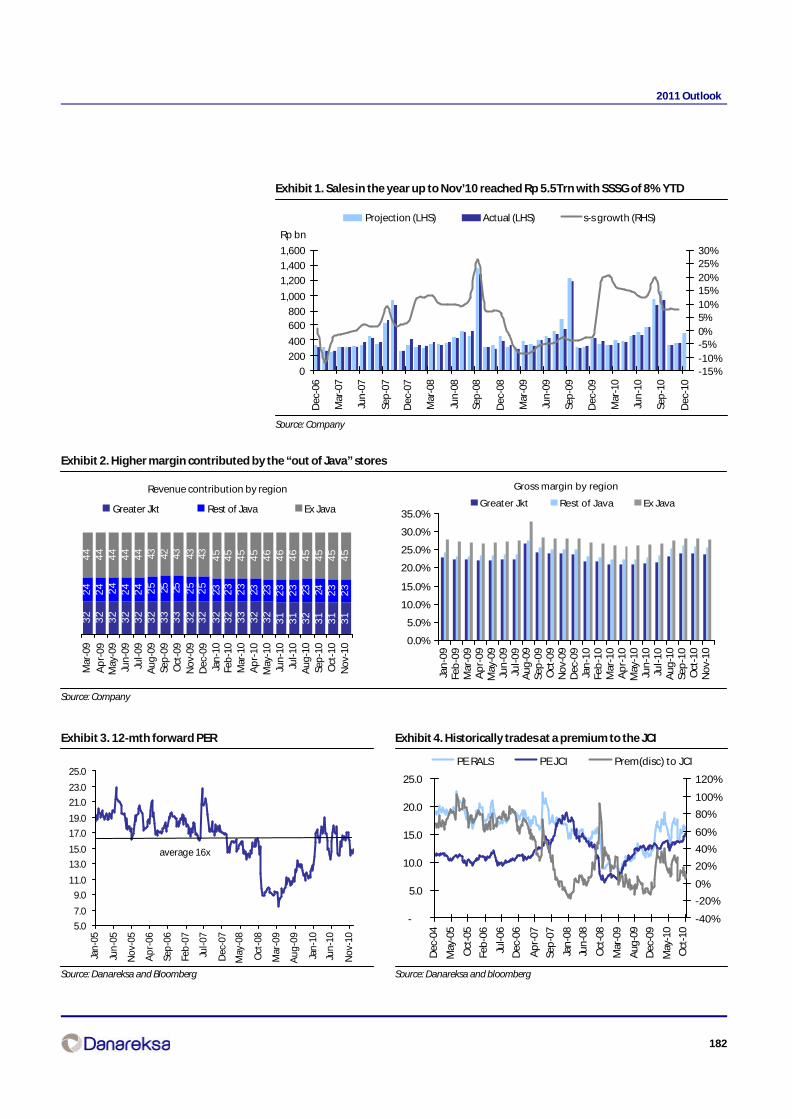
182
2011 Outlook
Exhibit 1. Sales in the year up to Nov’10 reached Rp 5.5Trn with SSSG of 8% YTD
Source: Company
Exhibit 2. Higher margin contributed by the “out of Java” stores
Source: Company
0
200
400
600800
1,000
1,200
1,400
1,600
Dec
-06
Mar
-07
Jun
-07
Sep
-07
Dec
-07
Mar
-08
Jun
-08
Sep
-08
Dec
-08
Mar
-09
Jun
-09
Sep
-09
Dec
-09
Mar
-10
Jun
-10
Sep
-10
Dec
-10
Rp bn
-15%-10%-5%0%5%10%15%20%25%30%
Projection (LHS) Actual (LHS) s-s growth (RHS)
Revenue contribution by region
32
32
32
32
32
32
33
33
32
32
32
32
33
32
32
31
31
32
31
31
31
24
24 24
24
24 25 25 25 25
25
23 23
23
23 23 23
23 23 24 23
23
44
44
44
44
44 43 42 43 43 43 45
45
45
45
46
46
46
45
45
45
45
Mar
-09
Ap
r-09
May
-09
Jun
-09
Jul-
09A
ug
-09
Sep
-09
Oct
-09
No
v-09
Dec
-09
Jan
-10
Feb
-10
Mar
-10
Ap
r-10
May
-10
Jun
-10
Jul-
10A
ug
-10
Sep
-10
Oct
-10
No
v-10
Greater Jkt Rest of Java Ex Java
Gross margin by region
0.0%
5.0%
10.0%
15.0%
20.0%
25.0%
30.0%
35.0%
Jan
-09
Feb
-09
Mar
-09
Ap
r-09
May
-09
Jun
-09
Jul-
09
Au
g-0
9Se
p-0
9O
ct-0
9N
ov-
09D
ec-0
9Ja
n-1
0Fe
b-1
0M
ar-1
0A
pr-
10M
ay-1
0Ju
n-1
0Ju
l-1
0A
ug
-10
Sep
-10
Oct
-10
No
v-10
Greater Jkt Rest of Java Ex Java
Exhibit 3. 12-mth forward PER
Source: Danareksa and Bloomberg
Exhibit 4. Historically trades at a premium to the JCI
Source: Danareksa and bloomberg
5.0
7.0
9.0
11.0
13.0
15.0
17.0
19.0
21.0
23.0
25.0
Jan
-05
Jun
-05
No
v-05
Ap
r-06
Sep
-06
Feb
-07
Jul-
07
Dec
-07
May
-08
Oct
-08
Mar
-09
Au
g-0
9
Jan
-10
Jun
-10
No
v-10
average 16x
-
5.0
10.0
15.0
20.0
25.0
Dec
-04
May
-05
Oct
-05
Feb
-06
Jul-0
6
Dec
-06
Ap
r-07
Sep
-07
Jan
-08
Jun
-08
Oct
-08
Mar
-09
Aug
-09
Dec
-09
May
-10
Oct
-10
-40%
-20%
0%
20%
40%
60%
80%
100%
120%
PE RALS PE JCI Prem(disc) to JCI
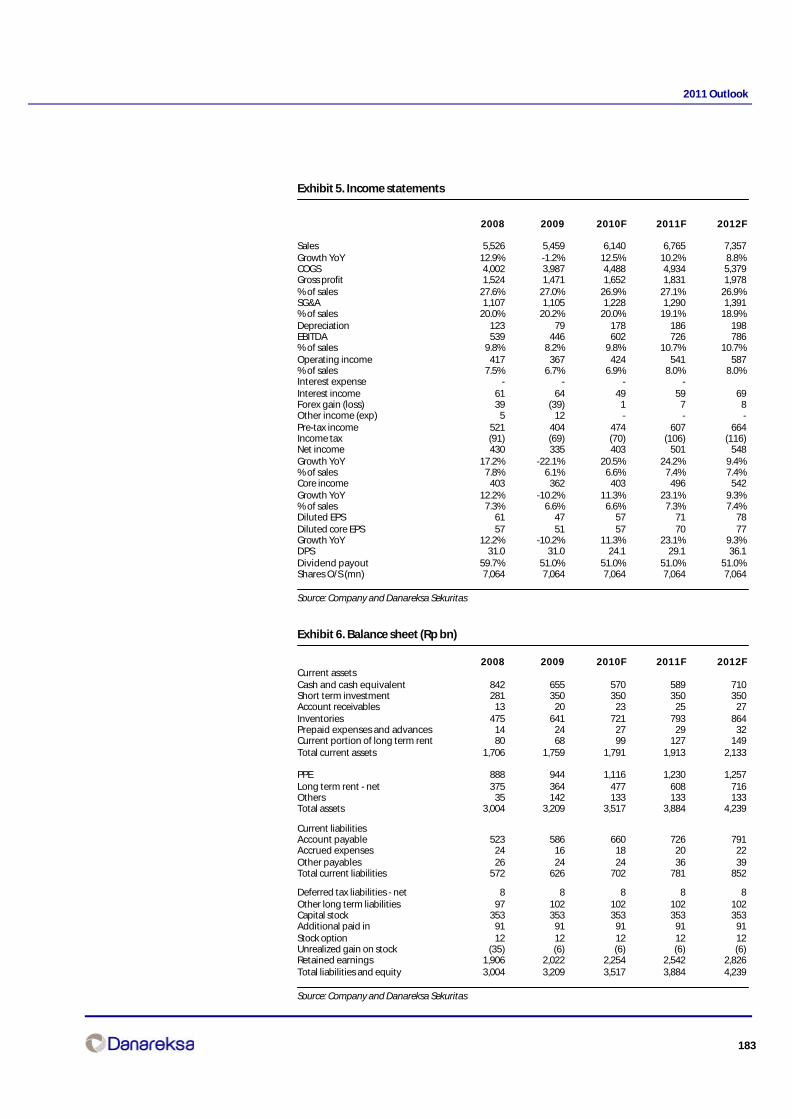
183
2011 Outlook
Exhibit 5. Income statements
2008 2009 2010F 2011F 2012F
Sales 5,526 5,459 6,140 6,765 7,357Growth YoY 12.9% -1.2% 12.5% 10.2% 8.8%COGS 4,002 3,987 4,488 4,934 5,379Gross profit 1,524 1,471 1,652 1,831 1,978% of sales 27.6% 27.0% 26.9% 27.1% 26.9%SG&A 1,107 1,105 1,228 1,290 1,391% of sales 20.0% 20.2% 20.0% 19.1% 18.9%Depreciation 123 79 178 186 198EBITDA 539 446 602 726 786% of sales 9.8% 8.2% 9.8% 10.7% 10.7%Operating income 417 367 424 541 587% of sales 7.5% 6.7% 6.9% 8.0% 8.0%Interest expense - - - -Interest income 61 64 49 59 69Forex gain (loss) 39 (39) 1 7 8Other income (exp) 5 12 - - -Pre-tax income 521 404 474 607 664Income tax (91) (69) (70) (106) (116)Net income 430 335 403 501 548Growth YoY 17.2% -22.1% 20.5% 24.2% 9.4%% of sales 7.8% 6.1% 6.6% 7.4% 7.4%Core income 403 362 403 496 542Growth YoY 12.2% -10.2% 11.3% 23.1% 9.3%% of sales 7.3% 6.6% 6.6% 7.3% 7.4%Diluted EPS 61 47 57 71 78Diluted core EPS 57 51 57 70 77Growth YoY 12.2% -10.2% 11.3% 23.1% 9.3%DPS 31.0 31.0 24.1 29.1 36.1Dividend payout 59.7% 51.0% 51.0% 51.0% 51.0%Shares O/S (mn) 7,064 7,064 7,064 7,064 7,064
Source: Company and Danareksa Sekuritas
Exhibit 6. Balance sheet (Rp bn)
2008 2009 2010F 2011F 2012FCurrent assetsCash and cash equivalent 842 655 570 589 710Short term investment 281 350 350 350 350Account receivables 13 20 23 25 27Inventories 475 641 721 793 864Prepaid expenses and advances 14 24 27 29 32Current portion of long term rent 80 68 99 127 149Total current assets 1,706 1,759 1,791 1,913 2,133
PPE 888 944 1,116 1,230 1,257Long term rent - net 375 364 477 608 716Others 35 142 133 133 133Total assets 3,004 3,209 3,517 3,884 4,239
Current liabilitiesAccount payable 523 586 660 726 791Accrued expenses 24 16 18 20 22Other payables 26 24 24 36 39Total current liabilities 572 626 702 781 852
Deferred tax liabilities - net 8 8 8 8 8Other long term liabilities 97 102 102 102 102Capital stock 353 353 353 353 353Additional paid in 91 91 91 91 91Stock option 12 12 12 12 12Unrealized gain on stock (35) (6) (6) (6) (6)Retained earnings 1,906 2,022 2,254 2,542 2,826Total liabilities and equity 3,004 3,209 3,517 3,884 4,239
Source: Company and Danareksa Sekuritas
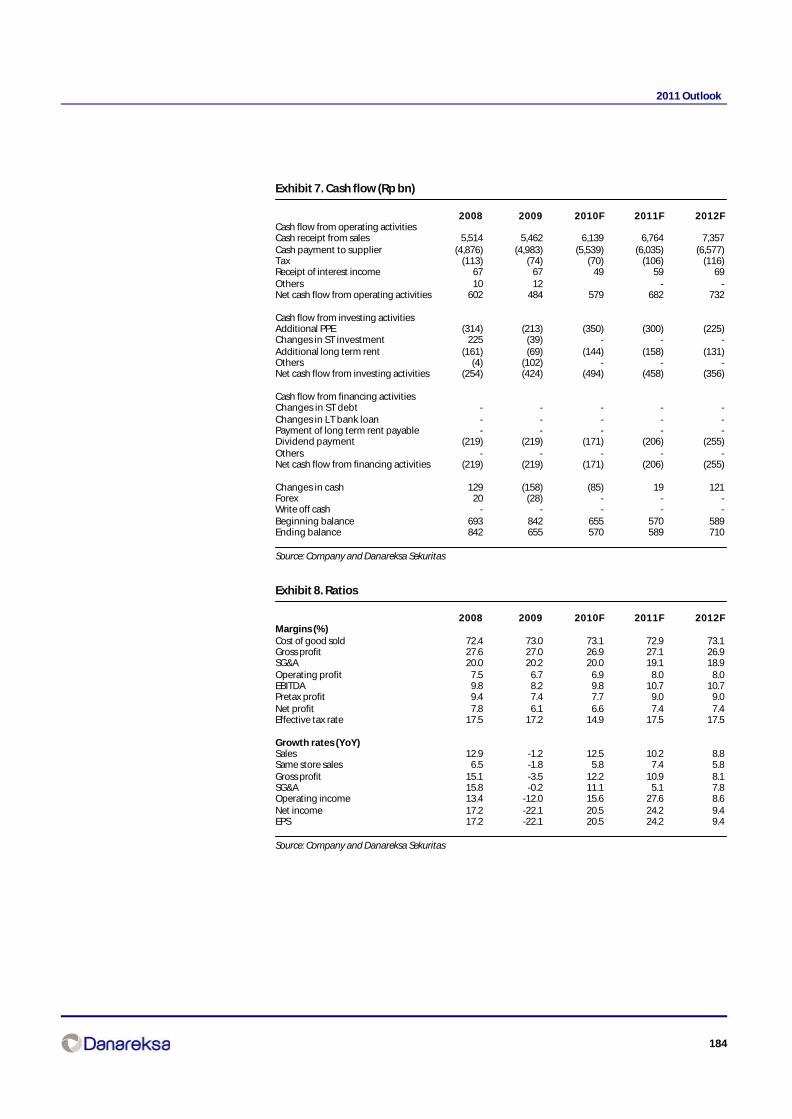
184
2011 Outlook
Exhibit 7. Cash flow (Rp bn)
2008 2009 2010F 2011F 2012FCash flow from operating activitiesCash receipt from sales 5,514 5,462 6,139 6,764 7,357Cash payment to supplier (4,876) (4,983) (5,539) (6,035) (6,577)Tax (113) (74) (70) (106) (116)Receipt of interest income 67 67 49 59 69Others 10 12 - -Net cash flow from operating activities 602 484 579 682 732
Cash flow from investing activitiesAdditional PPE (314) (213) (350) (300) (225)Changes in ST investment 225 (39) - - -Additional long term rent (161) (69) (144) (158) (131)Others (4) (102) - - -Net cash flow from investing activities (254) (424) (494) (458) (356)
Cash flow from financing activitiesChanges in ST debt - - - - -Changes in LT bank loan - - - - -Payment of long term rent payable - - - - -Dividend payment (219) (219) (171) (206) (255)Others - - - - -Net cash flow from financing activities (219) (219) (171) (206) (255)
Changes in cash 129 (158) (85) 19 121Forex 20 (28) - - -Write off cash - - - - -Beginning balance 693 842 655 570 589Ending balance 842 655 570 589 710
Source: Company and Danareksa Sekuritas
Exhibit 8. Ratios
2008 2009 2010F 2011F 2012FMargins (%)Cost of good sold 72.4 73.0 73.1 72.9 73.1Gross profit 27.6 27.0 26.9 27.1 26.9SG&A 20.0 20.2 20.0 19.1 18.9Operating profit 7.5 6.7 6.9 8.0 8.0EBITDA 9.8 8.2 9.8 10.7 10.7Pretax profit 9.4 7.4 7.7 9.0 9.0Net profit 7.8 6.1 6.6 7.4 7.4Effective tax rate 17.5 17.2 14.9 17.5 17.5
Growth rates (YoY)Sales 12.9 -1.2 12.5 10.2 8.8Same store sales 6.5 -1.8 5.8 7.4 5.8Gross profit 15.1 -3.5 12.2 10.9 8.1SG&A 15.8 -0.2 11.1 5.1 7.8Operating income 13.4 -12.0 15.6 27.6 8.6Net income 17.2 -22.1 20.5 24.2 9.4EPS 17.2 -22.1 20.5 24.2 9.4
Source: Company and Danareksa Sekuritas

185
2011 Outlook
Sampoerna AgroImminent production upswing
TP set at Rp3,700; BUYWe raise our FY11-12E NPAT estimates by 17% and 10% respectively, buoyed by the higher CPOprice and potential production upturn. Indeed, production has been sluggish this year as badweather prevailed. The yield has been poor and so has the OER. We are still keeping this year’s FFBproduction estimate of 1.1mn tons, before rising to 1.2mn tons in 2011. Much of next year’sproduction growth shall likely come in 2H, as the impact from El Nino subsides and the effect fromgreater fertilizer application is felt. That assumes rainfall normalizes. Our TP is based on a targetmultiple of 15x, slightly above its historical 3-year average, to take account of the upward CPO pricemomentum. Our BUY call is based on the potential production growth in the mid-term amidstgreater unplanted land bank and potential margin expansion as the company grows itsproportion of nucleus plantations.
Production upswingWe are keeping our yield estimate of 13.8ton/ha this year, despite improvement in production inrecent months. Indeed, our estimates may prove to be conservative as fertilizer application hasnormalized in 2H10. In fact, we have seen FFB production increase in 3Q10, by as much as 37.2%on a quarterly basis. The yield is likely to improve next year to about 14.0ton/ha, but only in 2H11.We estimate production to recover as early as next year, albeit slowly – with 14% YoY FFBproduction growth. Around 6,000ha is expected to come into maturity next year, at a yield of lessthan 5ton/ha. Much of the production will come from its Kalimantan estates, we believe, wherethe plantations are still young.
Costs to increase but unlikely to be significantHigher fertilizer costs will be the drag on margins in the near term, we believe, albeit insignificant.Indeed, fertilizer application has been lacking in 1H10 as rainfall intensified. It has normalized sincethen. We now estimate production costs to increase by 10% to Rp5,100/kg this year, before risingfurther to Rp5,400/kg next year as greater fertilizer application is needed to keep productiongrowth intact. Still, despite the higher production costs, gross margins are likely to stay at 34%this year, before expanding to 37% on our optimism of higher CPO prices next year. As for the EBITmargins, they will ease to 24% before recovering to 28% next year.
Risks to watchRisks to our call include 1) bad weather that will curb production and prevent expansion, 2) aboveexpected production costs, mainly from higher fertilizer application and 3) slower nucleusexpansion, which will impact SGRO’s long-term production growth and margins.
Year to Dec 2008 2009 2010F 2011F 2012F
Sales, Rp bn 2,288 1,816 1,745 2,294 2,620EBITDA, Rp bn 697 553 540 755 897Core profit, Rp bn 438 314 307 462 557Core profit growth, % 83 -28 -2 51 20Core PER, x 13.1 20.5 18.9 12.5 10.4EV/EBITDA, x 7.7 10.2 10.6 7.7 6.4EV/Ha, US$ 000/ha 10.1 10.4 10.9 9.9 8.6Dividend yield, % 0.0 1.5 1.6 2.4 2.9Net gearing, % -27.4 -8.1 -3.3 1.4 0.0
Bonny B. Setiawan CFA(62-21) 2352 [email protected]
BUYBloomberg Code SGRO IJPrice, Rp 3,050Mkt Cap Rp bn 5,765Target Price, Rp 3,700
SGRO relative price to JCI Index
1,500
2,000
2,500
3,000
3,500
12/1
8/09
2/1/
10
3/10
/10
4/19
/10
5/26
/10
7/2/
10
8/9/
10
9/22
/10
10/2
8/10
12/6
/10
-30
-20
-10
0
10
SGRO (LHS) Relative to JCI Index (RHS)%Rp
Last Recommendation
Rec. Target Price
22-Dec-10 BUY Rp 3,70007-Sep10 BUY Rp 3,50023-Jun-10 BUY Rp 3,25013-Jan-10 BUY Rp 3,500
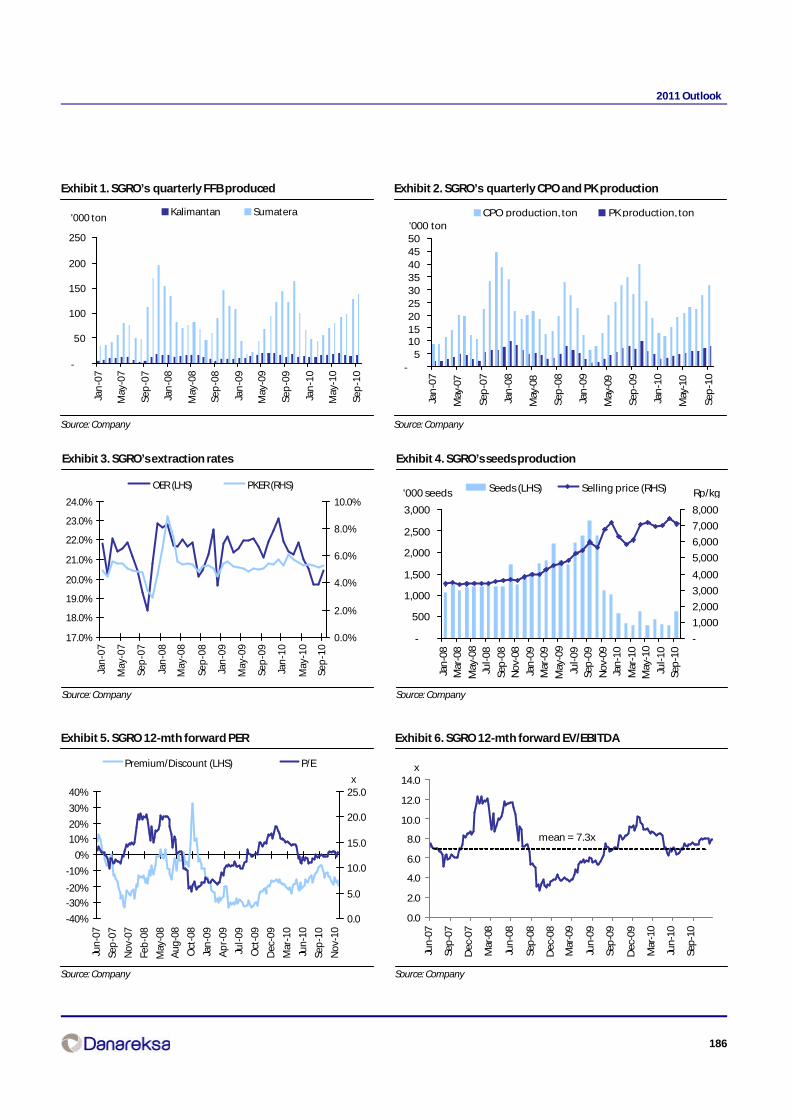
186
2011 Outlook
Exhibit 1. SGRO’s quarterly FFB produced
Source: Company
Exhibit 2. SGRO’s quarterly CPO and PK production
Source: Company
Exhibit 3. SGRO’s extraction rates
Source: Company
Exhibit 4. SGRO’s seeds production
Source: Company
Exhibit 5. SGRO 12-mth forward PER
Source: Company
Exhibit 6. SGRO 12-mth forward EV/EBITDA
Source: Company
-
50
100
150
200
250
Jan
-07
May
-07
Sep
-07
Jan
-08
May
-08
Sep
-08
Jan
-09
May
-09
Sep
-09
Jan
-10
May
-10
Sep
-10
Kalimantan Sumatera'000 ton
-5
101520253035404550
Jan
-07
May
-07
Sep
-07
Jan
-08
May
-08
Sep
-08
Jan
-09
May
-09
Sep
-09
Jan
-10
May
-10
Sep
-10
CPO production, ton PK production, ton'000 ton
17.0%
18.0%
19.0%
20.0%
21.0%
22.0%
23.0%
24.0%
Jan
-07
May
-07
Sep
-07
Jan
-08
May
-08
Sep
-08
Jan
-09
May
-09
Sep
-09
Jan
-10
May
-10
Sep
-10
0.0%
2.0%
4.0%
6.0%
8.0%
10.0%
OER (LHS) PKER (RHS)
-
500
1,000
1,500
2,000
2,500
3,000
Jan
-08
Mar
-08
May
-08
Jul-
08
Sep
-08
No
v-08
Jan
-09
Mar
-09
May
-09
Jul-
09Se
p-0
9
No
v-09
Jan
-10
Mar
-10
May
-10
Jul-
10Se
p-1
0
-
1,000
2,000
3,000
4,000
5,000
6,000
7,000
8,000
Seeds (LHS) Selling price (RHS)'000 seeds Rp/kg
-40%
-30%
-20%
-10%
0%
10%
20%
30%
40%
Jun
-07
Sep
-07
Nov
-07
Feb
-08
May
-08
Aug
-08
Oct
-08
Jan
-09
Ap
r-09
Jul-
09
Oct
-09
Dec
-09
Mar
-10
Jun
-10
Sep
-10
Nov
-10
0.0
5.0
10.0
15.0
20.0
25.0
Premium/Discount (LHS) P/E
x
0.0
2.0
4.0
6.0
8.0
10.0
12.0
14.0
Jun
-07
Sep
-07
Dec
-07
Mar
-08
Jun
-08
Sep
-08
Dec
-08
Mar
-09
Jun
-09
Sep
-09
Dec
-09
Mar
-10
Jun
-10
Sep
-10
x
mean = 7.3x

187
2011 Outlook
Exhibit 7. Key assumptions
2005 2006 2007 2008 2009 2010E 2011E 2012ENew plantings Sumatera 2,414 2,745 2,721 6,228 4,130 3,500 5,500 5,500 Kalimantan 338 446 2,214 4,163 483 2,000 1,000 0Planted area, ha Oil palm - nucleus 30,879 33,494 38,426 48,222 50,769 55,769 61,769 66,769 Sumatera 20,600 22,239 24,957 30,590 32,654 35,654 40,654 45,654 Mature 15,511 16,840 17,377 17,377 18,633 21,351 26,984 29,048 YoY growth, % 0.0 8.6 3.2 0.0 7.2 14.6 26.4 7.6 Immature 5,089 5,399 7,580 13,213 14,021 14,303 13,670 16,606 YoY growth, % 27.4 6.1 40.4 74.3 6.1 2.0 -4.4 21.5 Kalimantan 10,279 11,255 13,469 17,632 18,115 20,115 21,115 21,115 Mature 9,828 10,470 10,470 10,470 10,795 13,009 17,172 17,655 YoY growth, % 11.4 6.5 0.0 0.0 3.1 20.5 32.0 2.8 Immature 451 785 2,999 7,162 7,320 7,106 3,943 3,460 YoY growth, % -55.7 74.0 281.9 138.8 2.2 -2.9 -44.5 -12.2 Oil palm - plasma 37,379 39,425 39,428 40,023 42,089 42,589 43,089 43,589 Sumatera 37,379 39,425 39,428 40,023 42,089 42,589 43,089 43,589 Mature 35,719 36,981 37,515 37,599 38,915 40,020 40,024 40,619 YoY growth, % 0. 3.5 1.4 0.2 3.5 2.8 0.0 1.5 Immature 1,660 2,444 1,913 2,424 3,174 2,568 3,065 2,970 YoY growth, % -12.4 47.2 -21.7 26.7 30.9 -19.1 19.3 -3.1 Kalimantan 1,809 1,809 1,809 1,809 1,809 1,809 1,809 1,809 Mature 1,809 1,809 1,809 1,809 1,809 1,809 1,809 1,809 YoY growth, % 13.7 0.0 0.0 0.0 0.0 0.0 0.0 0.0 Immature 0 0 0 0 0 0 0 0 YoY growth, % -100.0 0.0 0.0 0.0 0.0 0.0 0.0 0.0FFB processed, ‘000 ton 862 595 1,181 1,231 1,204 1,054 1,202 1,398 YoY growth, % -10.8 -30.9 98.4 4.2 -2.2 -12.4 14.1 16.3 Nucleus 327 430 426 469 486 473 583 737 YoY growth, % -14.9 31.6 -1.1 10.2 3.6 -2.5 23.3 26.3 Plasma 535 716 755 762 718 581 619 661 YoY growth, % -8.1 33.8 5.5 0.8 -5.7 -19.1 6.6 6.8 3rd party purchased 0 0 0 0 0 0 0 0 FFB sold 0 551 0 0 0 0 0 0FFB yield, ton/ha 13.7 17.3 17.6 18.3 17.2 13.8 14.0 15.7 Nucleus 12.9 15.8 15.3 16.8 16.5 13.8 13.2 15.8 Plasma 14.3 18.5 19.2 19.3 17.6 13.9 14.8 15.6CPO available for sale, ‘000 ton 189 242 246 265 264 224 265 308 YoY growth, % -10.4 27.7 1.7 8.0 -0.5 -15.0 17.9 16.3 CPO production 189 242 246 265 264 224 265 308 YoY growth, % -10.4 27.7 1.7 8.0 -0.5 -15.0 17.9 16.3PK available for sale, ‘000 ton 40 59 52 71 62 53 62 71 YoY growth, % -13.3 46.4 -12.7 37.1 -11.7 -14.3 15.5 15.8 PK production 40 59 52 71 62 53 62 71 YoY growth, % -13.3 46.4 -12.7 37.1 -11.7 -14.3 15.5 15.8OER, % 22.0 21.1 20.8 21.6 21.9 21.3 22.0 22.0PER, % 4.7 5.1 4.4 5.7 5.2 5.1 5.1 5.1Germinated seeds, ‘000 seeds 9,678 15,156 22,735 5,894 11,655 12,856 11,847 17,172 YoY growth, % 0.0 56.6 50.0 -74.1 97.7 10.3 -7.8 45.0Sales volume, ‘000 ton CPO 172 259 220 287 263 224 265 308 YoY growth, % -23.7 50.7 -15.1 30.6 -8.3 -14.8 17.9 16.3 PK 37 64 50 71 58 53 62 71 YoY growth, % -19.9 70.9 -21.9 42.8 -18.6 -7.8 15.5 15.8 Rubber 0 0 1 0 0 0 0 0 YoY growth, % 13.7 34.3 32.1 -3.8 -15.5 0.0 0.0 0.0Germinated seeds, ‘000 seeds 9 9 14 18 6 11 12 11 YoY growth, % 636.9 -7.1 58.2 34.7 -68.0 78.9 10.4 -4.6Selling price Average CPO price, Rp mn/ton 3.1 3.2 6.3 6.7 6.1 6.7 7.5 7.4 Average PK price, Rp mn/ton 1.9 1.7 3.2 3.6 2.8 3.3 3.7 3.6 Average rubber price, Rp mn/kg 6.5 8.8 9.8 12.9 8.3 7.7 7.9 8.3 Average seed price, Rp ‘000/seed 3.0 3.3 3.5 5.2 6.7 7.3 8.2 8.1
Source: Company, Danareksa Sekuritas

188
2011 Outlook
Exhibit 8. Projected profit and loss (Rp bn)
2005 2006 2007 2008 2009 2010E 2011E 2012E
Palm product 596 945 1,546 2,186 1,773 1,665 2,196 2,526 YoY growth, % -30.9 58.6 63.6 41.4 -18.9 -6.1 31.9 15.1 Rubber product 2 3 5 6 3 3 3 3 YoY growth, % 49.6 81.4 48.4 26.3 -45.7 -7.8 2.7 5.8 Germinated seeds 28 29 48 96 40 77 96 90 YoY growth, % 893.6% 2.9% 66.1% 98.8% -58.6% 94.7% 24.1% -5.5% Others 0 0 0 0 0 0 0 1Net revenues 626 977 1,599 2,288 1,816 1,745 2,294 2,621YoY growth, % -27.7 56.2 63.6 43.1 -20.7 -3.9 31.5 14.2Cost of good sold 458 729 1,104 1,514 1,216 1,161 1,447 1,620% of sales 73.2 74.5 69.1 66.2 67.0 66.5 63.1 61.8Gross profit 168 249 494 774 599 584 847 1,001YoY growth, % -28.2 48.5 98.8 56.5 -22.5 -2.6 45.1 18.1% of sales 26.8 25.5 30.9 33.8 33.0 33.5 36.9 38.2EBITDA 162 235 483 697 553 540 755 897YoY growth, % -35.1 45.4 105.3 44.2 -20.6 -2.3 39.8 18.8% of sales 25.9 24.1 30.2 30.4 30.5 31.0 32.9 34.2Depreciation 41 43 79 85 93 118 120 139Operating profit 121 192 404 611 460 422 636 758YoY growth, % -40.6 59.1 110.5 51.2 -24.8 -8.3 50.6 19.3% of sales 19.3 19.7 25.3 26.7 25.3 24.2 27.7 28.9Forex -1 0 16 -8 -20 0 0 0Interest expenses -41 -32 -83 -24 -28 -24 -20 -14Interest income 3 4 25 42 23 17 8 7Others 0 -3 -51 10 -26 -2 0 0Total other income (loss) -39 -30 -93 20 -51 -10 -12 -7Pretax profit 82 162 312 632 409 413 624 751Income tax -24 -49 -92 -186 -123 -103 -156 -188Extraordinary item 4 0 0 0 0 0 0 0Minority interest -1 -1 -5 -6 -4 -4 -6 -6Net income 61 113 215 440 282 305 462 557YoY growth, % -42.0 83.8 90.9 104.3 -35.9 8.3 51.5 20.4% of sales 9.8 11.5 13.5 19.2 15.5 17.5 20.1 21.2Core income 58 114 239 438 314 307 462 557YoY growth, % -48.8 96.9 109.1 82.9 -28.2 -2.3 50.6 20.4% of sales 9.3 11.7 15.0 19.1 17.3 17.6 20.1 21.2No of shares, mn 518 518 1,890 1,890 1,890 1,890 1,890 1,890EPS 118 218 114 233 149 161 244 294YYoY growth, % -42.0 83.8 -47.7 104.3 -35.9 8.3 51.5 20.4Core EPS 112 221 127 232 166 162 244 294YoY growth, % -48.8 96.9 -42.7 82.9 -28.2 -2.3 50.6 20.4DPS - 126.0 147.0 - 44.7 48.4 73.3 88.3Dividend payout 0.0 211.4 129.2 0.0 30.0 30.0 30.0 30.0
Margins (%)Cost of good sold 73.2 74.5 69.1 66.2 67.0 66.5 63.1 61.8Gross profit 26.8 25.5 30.9 33.8 33.0 33.5 36.9 38.2Operating profit 19.3 19.7 25.3 26.7 25.3 24.2 27.7 28.9EBITDA 25.9 24.1 30.2 30.4 30.5 31.0 32.9 34.2Pretax profit 13.1 16.6 19.5 27.6 22.5 23.6 27.2 28.6Net profit 9.8 11.5 13.5 19.2 15.5 17.5 20.1 21.2Effective tax rate 29.1 29.9 29.6 29.4 30.1 25.0 25.0 25.0
Growth rates (%YoY)Sales -27.7 56.2 63.6 43.1 -20.7 -3.9 31.5 14.2Gross profit -28.2 48.5 98.8 56.5 -22.5 -2.6 45.1 18.1Operating income -40.6 59.1 110.5 51.2 -24.8 -8.3 50.6 19.3Net income -42.0 83.8 90.9 104.3 -35.9 8.3 51.5 20.4EPS -42.0 83.8 -47.7 104.3 -35.9 8.3 51.5 20.4
Source: Company, Danareksa Sekuritas

189
2011 Outlook
Exhibit 9. Projected balance sheet (Rp bn)
2005 2006 2007 2008 2009 2010E 2011E 2012ECurrent assetsCash and cash equivalent 23 64 459 643 387 277 126 109Short term investment 0 0 0 0 0 0 0 0Receivables 2 2 264 31 84 29 38 50Inventories 102 37 215 120 136 130 162 181Prepaid taxes and expenses 0 0 2 4 4 3 5 6Advances 0 0 2 6 4 4 5 6Total Current Assets 128 103 942 804 616 443 336 351Plantation - mature 131 128 462 478 451 529 649 700Plantation - immature 11 15 142 257 356 686 1,021 1,347PPE 323 303 419 486 591 615 648 664Goodwill - net 0 0 7 6 4 4 4 4Other assets 62 67 116 127 245 153 153 153Total Non Current Assets 527 512 1,146 1,353 1,646 1,986 2,475 2,868Total Assets 655 615 2,088 2,156 2,262 2,430 2,811 3,219
Liabilities and EquityCurrent LiabilitiesShort term loan 0 0 0 0 0 0 0 0Payables 51 36 200 202 110 105 131 146Accrued expenses 5 7 17 17 18 18 23 25Current maturities of LT debt 60 32 0 2 25 52 52 52Others 27 37 157 133 82 68 95 113Total Current Liabilities 143 112 374 354 236 243 301 337LT debts - net of current maturities 199 81 217 215 219 160 108 56Others 14 10 4 9 20 14 14 14Total Non Current Liabilities 213 91 221 224 239 175 122 70Minority interest 3 4 22 25 21 26 31 38Capital stock 259 286 378 378 378 378 378 378Additional paid-in capital 0 0 932 853 953 953 953 953Others -100 -127 -275 -272 -272 -272 -272 -272Retained earnings 137 249 437 594 706 927 1,297 1,715Total Stockholders’ Equity 296 408 1,471 1,553 1,765 1,986 2,356 2,774Total Liabilities and Equity 655 615 2,088 2,156 2,261 2,429 2,811 3,219
Selected ratiosInventory turn 7 10 9 9 9 9 10 9Inventory days 50 34 41 40 38 41 36 38Payable days 27 22 39 48 46 33 29 31Receivable days 0 0 8 6 2 3 3 3Cash cycle 23 13 11 -2 -6 11 10 11Prepaid expense days 1 0 0 1 1 1 1 1Accrued expense days 5 3 4 4 5 5 4 5Account payable, % of inventory 50 98 93 168 81 81 81 81Interest coverage 4 7 6 28 20 23 39 64Working capital 21 -41 109 -191 18 -25 -39 -42Working capital % of sales 3 -4 7 -8 1 -1 -2 -2Total debt 259 113 217 217 244 213 160 108Net debt 235 49 -242 -426 -143 -65 34 -1Debt/equity, % 87.3 27.8 14.7 14.0 13.8 10.7 6.8 3.9Net debt/equity, % 79.5 12.1 -16.4 -27.4 -8.1 -3.3 1.4 0.0Cash and ST per share 45 124 243 340 205 147 67 58Book value per share 572 789 778 822 934 1,051 1,247 1,468
Extended Dupont ROEOperating margin, % 19.3 19.7 25.3 26.7 25.3 24.2 27.7 28.9Interest burden 0.7 0.8 0.8 1.0 0.9 1.0 1.0 1.0Tax burden 0.7 0.7 0.7 0.7 0.7 0.7 0.7 0.7Total asset turnover 1.0 1.5 1.2 1.1 0.8 0.7 0.9 0.9Financial leverage 2.4 1.8 1.4 1.4 1.3 1.3 1.2 1.2ROE, % 23.1 32.0 22.9 29.1 17.0 16.3 21.3 21.7
Source: Company, Danareksa Sekuritas

190
2011 Outlook
Exhibit 10. Cash flow (Rp bn)
2005 2006 2007 2008 2009 2010E 2011E 2012EOperating cash flowCash receipt from sales 638 985 1,526 2,301 2,288 1,744 2,289 2,613Cash payment to suppliers -483 -645 -813 -1,503 -1,872 -1,157 -1,535 -1,722Interest received 3 4 19 41 25 17 8 7Tax -62 -83 -134 -159 -232 -109 -141 -179Others 0 0 -48 -4 0 0 0 0Net operating cash flow 96 262 550 676 209 496 621 720
Investing cash flowAdditional PPE and planting -27 -27 -141 -304 -262 -551 -609 -532Changes in ST investment 0 0 0 0 0 0 0 0Acquisition of subsidiaries 0 0 -3 0 0 0 0 0Others -14 -13 -1 22 -32 86 0 0Net investing cash flow -42 -40 -146 -282 -294 -465 -609 -532
Financing cash flowChanges in LT debt -71 -145 -928 0 27 -31 -52 -52Interest expenses -41 -32 -83 -24 -29 -24 -20 -14Cash from issuance of shares 0 0 1,024 0 0 0 0 0Dividend payment 0 0 0 0 -174 -85 -92 -139Others -1 -3 -23 -186 116 -1 0 0Net financing cash flow -113 -181 -10 -210 -60 -141 -163 -205
Changes in cash and cash equivalent -58 41 394 184 -145 -110 -151 -17Effect of forex 0 0 0 0 0 0 0 0Cash from acq. Subs. 0 0 0 0 0 0 0 0Beginning balance 82 23 64 459 643 387 277 126Ending balance 23 64 459 643 498 277 126 109
Source: Company, Danareksa Sekuritas
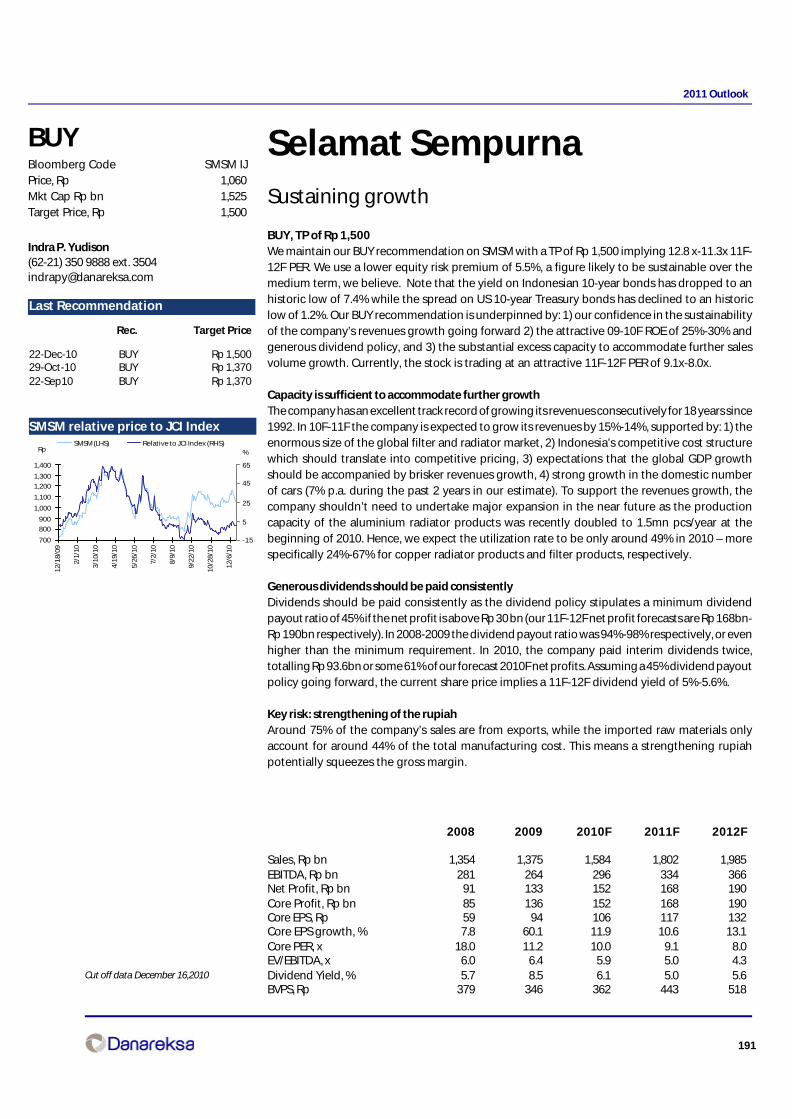
191
2011 Outlook
Selamat SempurnaSustaining growth
BUY, TP of Rp 1,500We maintain our BUY recommendation on SMSM with a TP of Rp 1,500 implying 12.8 x-11.3x 11F-12F PER. We use a lower equity risk premium of 5.5%, a figure likely to be sustainable over themedium term, we believe. Note that the yield on Indonesian 10-year bonds has dropped to anhistoric low of 7.4% while the spread on US 10-year Treasury bonds has declined to an historiclow of 1.2%. Our BUY recommendation is underpinned by: 1) our confidence in the sustainabilityof the company’s revenues growth going forward 2) the attractive 09-10F ROE of 25%-30% andgenerous dividend policy, and 3) the substantial excess capacity to accommodate further salesvolume growth. Currently, the stock is trading at an attractive 11F-12F PER of 9.1x-8.0x.
Capacity is sufficient to accommodate further growthThe company has an excellent track record of growing its revenues consecutively for 18 years since1992. In 10F-11F the company is expected to grow its revenues by 15%-14%, supported by: 1) theenormous size of the global filter and radiator market, 2) Indonesia’s competitive cost structurewhich should translate into competitive pricing, 3) expectations that the global GDP growthshould be accompanied by brisker revenues growth, 4) strong growth in the domestic numberof cars (7% p.a. during the past 2 years in our estimate). To support the revenues growth, thecompany shouldn’t need to undertake major expansion in the near future as the productioncapacity of the aluminium radiator products was recently doubled to 1.5mn pcs/year at thebeginning of 2010. Hence, we expect the utilization rate to be only around 49% in 2010 – morespecifically 24%-67% for copper radiator products and filter products, respectively.
Generous dividends should be paid consistentlyDividends should be paid consistently as the dividend policy stipulates a minimum dividendpayout ratio of 45% if the net profit is above Rp 30 bn (our 11F-12F net profit forecasts are Rp 168bn-Rp 190bn respectively). In 2008-2009 the dividend payout ratio was 94%-98% respectively, or evenhigher than the minimum requirement. In 2010, the company paid interim dividends twice,totalling Rp 93.6bn or some 61% of our forecast 2010F net profits. Assuming a 45% dividend payoutpolicy going forward, the current share price implies a 11F-12F dividend yield of 5%-5.6%.
Key risk: strengthening of the rupiahAround 75% of the company’s sales are from exports, while the imported raw materials onlyaccount for around 44% of the total manufacturing cost. This means a strengthening rupiahpotentially squeezes the gross margin.
Indra P. Yudison(62-21) 350 9888 ext. [email protected]
BUYBloomberg Code SMSM IJPrice, Rp 1,060Mkt Cap Rp bn 1,525Target Price, Rp 1,500
2008 2009 2010F 2011F 2012F
Sales, Rp bn 1,354 1,375 1,584 1,802 1,985EBITDA, Rp bn 281 264 296 334 366Net Profit, Rp bn 91 133 152 168 190Core Profit, Rp bn 85 136 152 168 190Core EPS, Rp 59 94 106 117 132Core EPS growth, % 7.8 60.1 11.9 10.6 13.1Core PER, x 18.0 11.2 10.0 9.1 8.0EV/EBITDA, x 6.0 6.4 5.9 5.0 4.3Dividend Yield, % 5.7 8.5 6.1 5.0 5.6BVPS, Rp 379 346 362 443 518
Last Recommendation
Rec. Target Price
22-Dec-10 BUY Rp 1,50029-Oct-10 BUY Rp 1,37022-Sep10 BUY Rp 1,370
SMSM relative price to JCI Index
700
800
900
1,000
1,100
1,200
1,300
1,400
12/1
8/09
2/1/
10
3/10
/10
4/19
/10
5/26
/10
7/2/
10
8/9/
10
9/22
/10
10/2
8/10
12/6
/10
-15
5
25
45
65
SMSM (LHS) Relative to JCI Index (RHS)%Rp
Cut off data December 16,2010
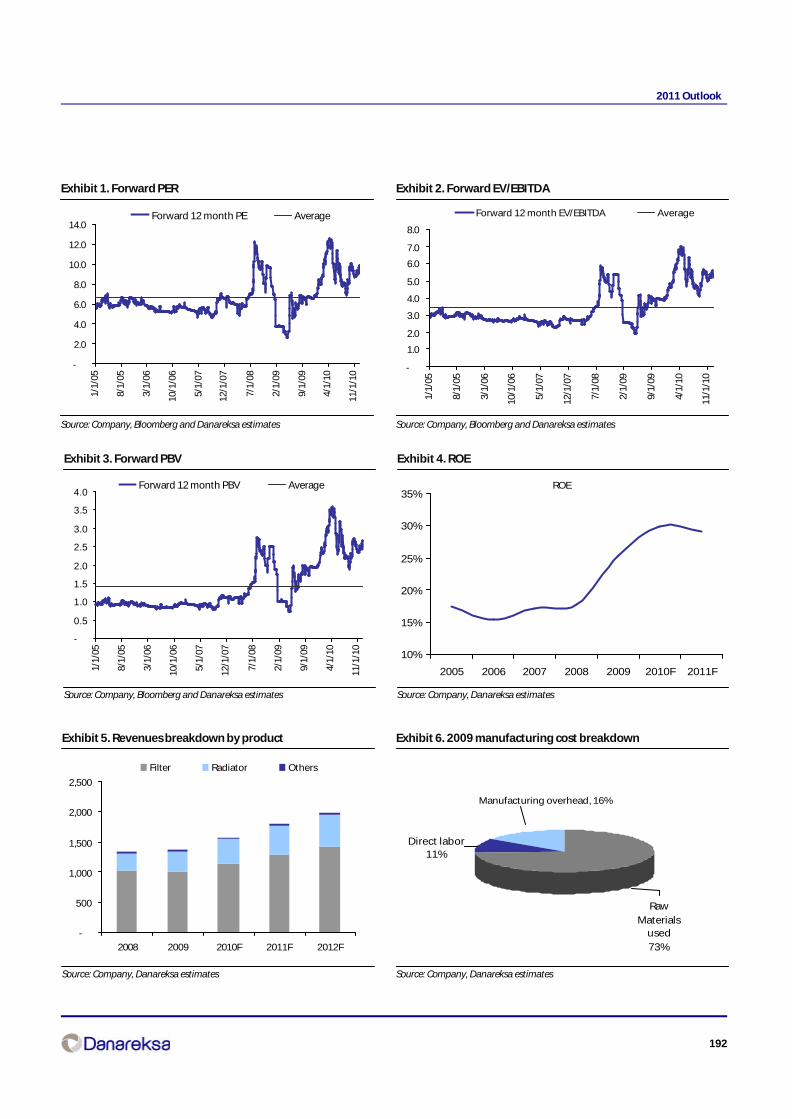
192
2011 Outlook
Exhibit 1. Forward PER
Source: Company, Bloomberg and Danareksa estimates
Exhibit 2. Forward EV/EBITDA
Source: Company, Bloomberg and Danareksa estimates
Exhibit 3. Forward PBV
Source: Company, Bloomberg and Danareksa estimates
Exhibit 4. ROE
Source: Company, Danareksa estimates
Exhibit 5. Revenues breakdown by product
Source: Company, Danareksa estimates
Exhibit 6. 2009 manufacturing cost breakdown
Source: Company, Danareksa estimates
ROE
10%
15%
20%
25%
30%
35%
2005 2006 2007 2008 2009 2010F 2011F
-
500
1,000
1,500
2,000
2,500
2008 2009 2010F 2011F 2012F
Filter Radiator Others
Raw
Materials used
73%
Direct labor11%
Manufacturing overhead, 16%
-
2.0
4.0
6.0
8.0
10.0
12.0
14.0
1/1/
05
8/1/
05
3/1/
06
10/1
/06
5/1/
07
12/1
/07
7/1/
08
2/1/
09
9/1/
09
4/1/
10
11/1
/10
Forward 12 month PE Average
-
0.5
1.0
1.5
2.0
2.5
3.0
3.5
4.0
1/1/
05
8/1/
05
3/1/
06
10/1
/06
5/1/
07
12/1
/07
7/1/
08
2/1/
09
9/1/
09
4/1/
10
11/1
/10
Forward 12 month PBV Average
-
1.0
2.0
3.0
4.0
5.0
6.0
7.0
8.0
1/1/
05
8/1/
05
3/1/
06
10/1
/06
5/1/
07
12/1
/07
7/1/
08
2/1/
09
9/1/
09
4/1/
10
11/1
/10
Forward 12 month EV/EBITDA Average
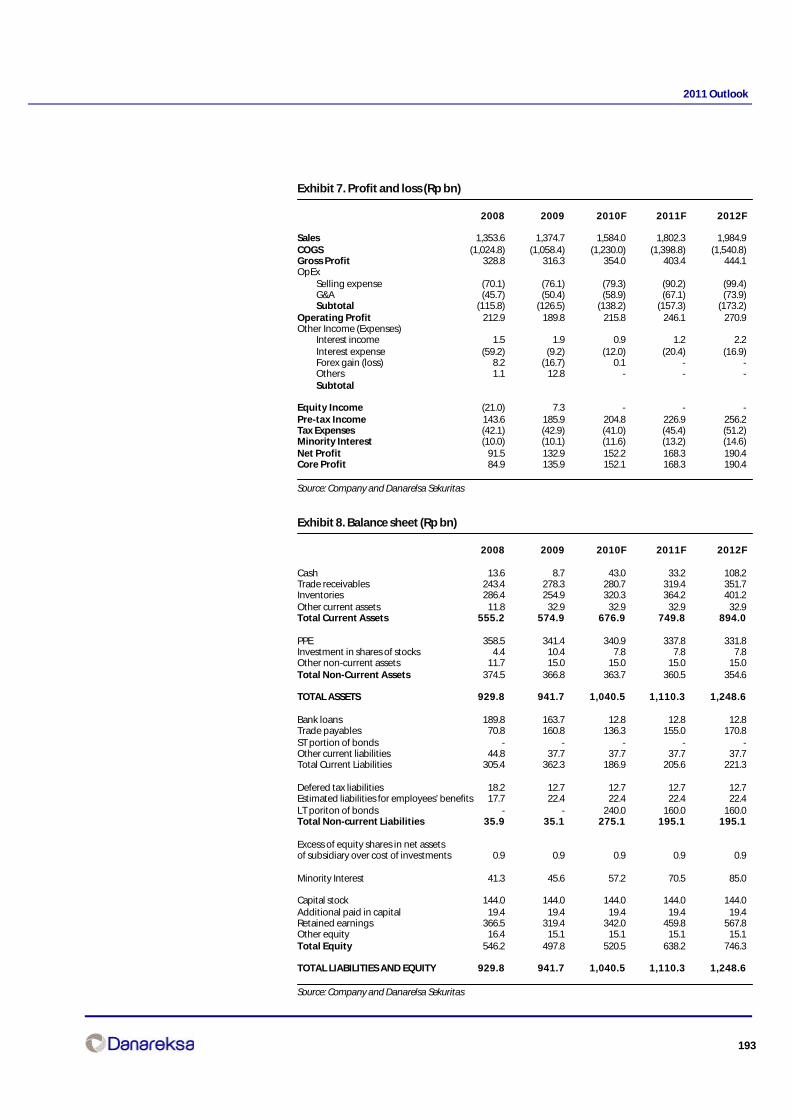
193
2011 Outlook
Exhibit 7. Profit and loss (Rp bn)
2008 2009 2010F 2011F 2012F
Sales 1,353.6 1,374.7 1,584.0 1,802.3 1,984.9COGS (1,024.8) (1,058.4) (1,230.0) (1,398.8) (1,540.8)Gross Profit 328.8 316.3 354.0 403.4 444.1OpEx
Selling expense (70.1) (76.1) (79.3) (90.2) (99.4)G&A (45.7) (50.4) (58.9) (67.1) (73.9)Subtotal (115.8) (126.5) (138.2) (157.3) (173.2)
Operating Profit 212.9 189.8 215.8 246.1 270.9Other Income (Expenses)
Interest income 1.5 1.9 0.9 1.2 2.2Interest expense (59.2) (9.2) (12.0) (20.4) (16.9)Forex gain (loss) 8.2 (16.7) 0.1 - -Others 1.1 12.8 - - -Subtotal
Equity Income (21.0) 7.3 - - -Pre-tax Income 143.6 185.9 204.8 226.9 256.2Tax Expenses (42.1) (42.9) (41.0) (45.4) (51.2)Minority Interest (10.0) (10.1) (11.6) (13.2) (14.6)Net Profit 91.5 132.9 152.2 168.3 190.4Core Profit 84.9 135.9 152.1 168.3 190.4
Source: Company and Danarelsa Sekuritas
Exhibit 8. Balance sheet (Rp bn)
2008 2009 2010F 2011F 2012F
Cash 13.6 8.7 43.0 33.2 108.2Trade receivables 243.4 278.3 280.7 319.4 351.7Inventories 286.4 254.9 320.3 364.2 401.2Other current assets 11.8 32.9 32.9 32.9 32.9Total Current Assets 555.2 574.9 676.9 749.8 894.0
PPE 358.5 341.4 340.9 337.8 331.8Investment in shares of stocks 4.4 10.4 7.8 7.8 7.8Other non-current assets 11.7 15.0 15.0 15.0 15.0Total Non-Current Assets 374.5 366.8 363.7 360.5 354.6
TOTAL ASSETS 929.8 941.7 1,040.5 1,110.3 1,248.6
Bank loans 189.8 163.7 12.8 12.8 12.8Trade payables 70.8 160.8 136.3 155.0 170.8ST portion of bonds - - - - -Other current liabilities 44.8 37.7 37.7 37.7 37.7Total Current Liabilities 305.4 362.3 186.9 205.6 221.3
Defered tax liabilities 18.2 12.7 12.7 12.7 12.7Estimated liabilities for employees’ benefits 17.7 22.4 22.4 22.4 22.4LT poriton of bonds - - 240.0 160.0 160.0Total Non-current Liabilities 35.9 35.1 275.1 195.1 195.1
Excess of equity shares in net assetsof subsidiary over cost of investments 0.9 0.9 0.9 0.9 0.9
Minority Interest 41.3 45.6 57.2 70.5 85.0
Capital stock 144.0 144.0 144.0 144.0 144.0Additional paid in capital 19.4 19.4 19.4 19.4 19.4Retained earnings 366.5 319.4 342.0 459.8 567.8Other equity 16.4 15.1 15.1 15.1 15.1Total Equity 546.2 497.8 520.5 638.2 746.3
TOTAL LIABILITIES AND EQUITY 929.8 941.7 1,040.5 1,110.3 1,248.6
Source: Company and Danarelsa Sekuritas
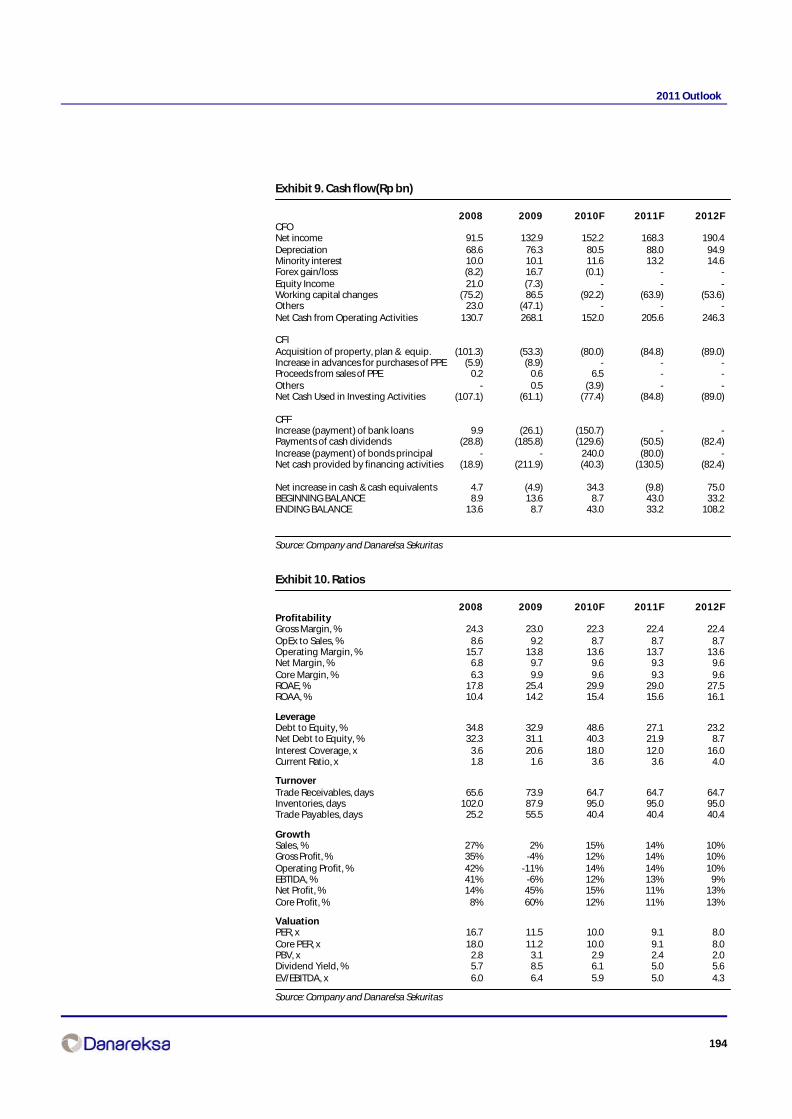
194
2011 Outlook
Exhibit 9. Cash flow(Rp bn)
2008 2009 2010F 2011F 2012FCFONet income 91.5 132.9 152.2 168.3 190.4Depreciation 68.6 76.3 80.5 88.0 94.9Minority interest 10.0 10.1 11.6 13.2 14.6Forex gain/loss (8.2) 16.7 (0.1) - -Equity Income 21.0 (7.3) - - -Working capital changes (75.2) 86.5 (92.2) (63.9) (53.6)Others 23.0 (47.1) - - -Net Cash from Operating Activities 130.7 268.1 152.0 205.6 246.3
CFIAcquisition of property, plan & equip. (101.3) (53.3) (80.0) (84.8) (89.0)Increase in advances for purchases of PPE (5.9) (8.9) - - -Proceeds from sales of PPE 0.2 0.6 6.5 - -Others - 0.5 (3.9) - -Net Cash Used in Investing Activities (107.1) (61.1) (77.4) (84.8) (89.0)
CFFIncrease (payment) of bank loans 9.9 (26.1) (150.7) - -Payments of cash dividends (28.8) (185.8) (129.6) (50.5) (82.4)Increase (payment) of bonds principal - - 240.0 (80.0) -Net cash provided by financing activities (18.9) (211.9) (40.3) (130.5) (82.4)
Net increase in cash & cash equivalents 4.7 (4.9) 34.3 (9.8) 75.0BEGINNING BALANCE 8.9 13.6 8.7 43.0 33.2ENDING BALANCE 13.6 8.7 43.0 33.2 108.2
Source: Company and Danarelsa Sekuritas
Exhibit 10. Ratios
2008 2009 2010F 2011F 2012FProfitabilityGross Margin, % 24.3 23.0 22.3 22.4 22.4OpEx to Sales, % 8.6 9.2 8.7 8.7 8.7Operating Margin, % 15.7 13.8 13.6 13.7 13.6Net Margin, % 6.8 9.7 9.6 9.3 9.6Core Margin, % 6.3 9.9 9.6 9.3 9.6ROAE, % 17.8 25.4 29.9 29.0 27.5ROAA, % 10.4 14.2 15.4 15.6 16.1
LeverageDebt to Equity, % 34.8 32.9 48.6 27.1 23.2Net Debt to Equity, % 32.3 31.1 40.3 21.9 8.7Interest Coverage, x 3.6 20.6 18.0 12.0 16.0Current Ratio, x 1.8 1.6 3.6 3.6 4.0
TurnoverTrade Receivables, days 65.6 73.9 64.7 64.7 64.7Inventories, days 102.0 87.9 95.0 95.0 95.0Trade Payables, days 25.2 55.5 40.4 40.4 40.4
GrowthSales, % 27% 2% 15% 14% 10%Gross Profit, % 35% -4% 12% 14% 10%Operating Profit, % 42% -11% 14% 14% 10%EBTIDA, % 41% -6% 12% 13% 9%Net Profit, % 14% 45% 15% 11% 13%Core Profit, % 8% 60% 12% 11% 13%
ValuationPER, x 16.7 11.5 10.0 9.1 8.0Core PER, x 18.0 11.2 10.0 9.1 8.0PBV, x 2.8 3.1 2.9 2.4 2.0Dividend Yield, % 5.7 8.5 6.1 5.0 5.6EV/EBITDA, x 6.0 6.4 5.9 5.0 4.3
Source: Company and Danarelsa Sekuritas
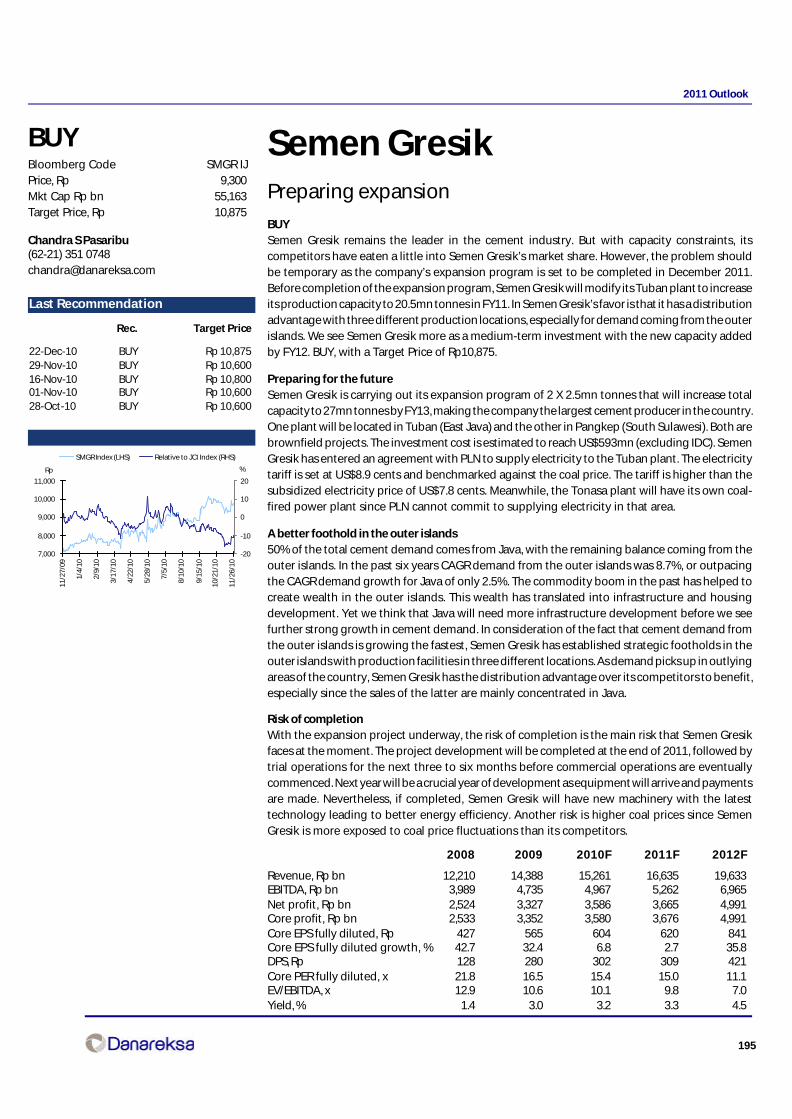
195
2011 Outlook
Semen GresikPreparing expansion
BUYSemen Gresik remains the leader in the cement industry. But with capacity constraints, itscompetitors have eaten a little into Semen Gresik’s market share. However, the problem shouldbe temporary as the company’s expansion program is set to be completed in December 2011.Before completion of the expansion program, Semen Gresik will modify its Tuban plant to increaseits production capacity to 20.5mn tonnes in FY11. In Semen Gresik’s favor is that it has a distributionadvantage with three different production locations, especially for demand coming from the outerislands. We see Semen Gresik more as a medium-term investment with the new capacity addedby FY12. BUY, with a Target Price of Rp10,875.
Preparing for the futureSemen Gresik is carrying out its expansion program of 2 X 2.5mn tonnes that will increase totalcapacity to 27mn tonnes by FY13, making the company the largest cement producer in the country.One plant will be located in Tuban (East Java) and the other in Pangkep (South Sulawesi). Both arebrownfield projects. The investment cost is estimated to reach US$593mn (excluding IDC). SemenGresik has entered an agreement with PLN to supply electricity to the Tuban plant. The electricitytariff is set at US$8.9 cents and benchmarked against the coal price. The tariff is higher than thesubsidized electricity price of US$7.8 cents. Meanwhile, the Tonasa plant will have its own coal-fired power plant since PLN cannot commit to supplying electricity in that area.
A better foothold in the outer islands50% of the total cement demand comes from Java, with the remaining balance coming from theouter islands. In the past six years CAGR demand from the outer islands was 8.7%, or outpacingthe CAGR demand growth for Java of only 2.5%. The commodity boom in the past has helped tocreate wealth in the outer islands. This wealth has translated into infrastructure and housingdevelopment. Yet we think that Java will need more infrastructure development before we seefurther strong growth in cement demand. In consideration of the fact that cement demand fromthe outer islands is growing the fastest, Semen Gresik has established strategic footholds in theouter islands with production facilities in three different locations. As demand picks up in outlyingareas of the country, Semen Gresik has the distribution advantage over its competitors to benefit,especially since the sales of the latter are mainly concentrated in Java.
Risk of completionWith the expansion project underway, the risk of completion is the main risk that Semen Gresikfaces at the moment. The project development will be completed at the end of 2011, followed bytrial operations for the next three to six months before commercial operations are eventuallycommenced. Next year will be a crucial year of development as equipment will arrive and paymentsare made. Nevertheless, if completed, Semen Gresik will have new machinery with the latesttechnology leading to better energy efficiency. Another risk is higher coal prices since SemenGresik is more exposed to coal price fluctuations than its competitors.
Chandra S Pasaribu(62-21) 351 [email protected]
BUYBloomberg Code SMGR IJPrice, Rp 9,300Mkt Cap Rp bn 55,163Target Price, Rp 10,875
SMGR relative price to JCI Index
7,000
8,000
9,000
10,000
11,000
11/2
7/09
1/4/
10
2/9/
10
3/17
/10
4/22
/10
5/28
/10
7/5/
10
8/10
/10
9/15
/10
10/2
1/10
11/2
6/10
-20
-10
0
10
20
SMGR Index (LHS) Relative to JCI Index (RHS)
%Rp
Last Recommendation
Rec. Target Price
22-Dec-10 BUY Rp 10,87529-Nov-10 BUY Rp 10,60016-Nov-10 BUY Rp 10,80001-Nov-10 BUY Rp 10,60028-Oct-10 BUY Rp 10,600
2008 2009 2010F 2011F 2012F
Revenue, Rp bn 12,210 14,388 15,261 16,635 19,633EBITDA, Rp bn 3,989 4,735 4,967 5,262 6,965Net profit, Rp bn 2,524 3,327 3,586 3,665 4,991Core profit, Rp bn 2,533 3,352 3,580 3,676 4,991Core EPS fully diluted, Rp 427 565 604 620 841Core EPS fully diluted growth, % 42.7 32.4 6.8 2.7 35.8DPS, Rp 128 280 302 309 421Core PER fully diluted, x 21.8 16.5 15.4 15.0 11.1EV/EBITDA, x 12.9 10.6 10.1 9.8 7.0Yield, % 1.4 3.0 3.2 3.3 4.5

196
2011 Outlook
Exhibit 1. Production capacity and utilization rate
Source: Company
Exhibit 2. COGS breakdown
Source: Company
Exhibit 3. Quarterly EBITDA margin
Source: Company
Exhibit 4. Net debt position
Source: Company
Exhibit 5. 12-mth forward PER
Source: Company
Exhibit 6. 12-mth forward EV/EBITDA
Source: Company
0
5
10
15
20
25
2005 2006 2007F 2008F 2009F 2010F 2011F
88%90%92%94%96%98%100%102%
104%
Production capacity (mn tonne) Utilization rate (%)
Others7%
Packaging9%
Electricitty11%
Wages11%
Maintenance13%
Transportation
15%
Raw Material8%
Coal26%
10%
15%
20%
25%
30%
35%
40%
Mar
-07
Jul-
07
Nov
-07
Mar
-08
Jul-
08
Nov
-08
Mar
-09
Jul-
09
Nov
-09
Mar
-10
Jul-
10
(6,000)
(5,000)
(4,000)
(3,000)
(2,000)
(1,000)
-
Jun
-07
Sep
-07
Dec
-07
Mar
-08
Jun
-08
Sep
-08
Dec
-08
Mar
-09
Jun
-09
Sep
-09
Dec
-09
Mar
-10
Jun
-10
Sep
-10
Net debts (Rpbn)
Mean
+1SD
-1SD
+2SD
-2SD
3
5
7
9
11
13
15
17
19
05 06 07 08 09 10
Mean
+1SD
-1SD
+2SD
-2SD
1
3
5
7
9
11
05 06 07 08 09 10
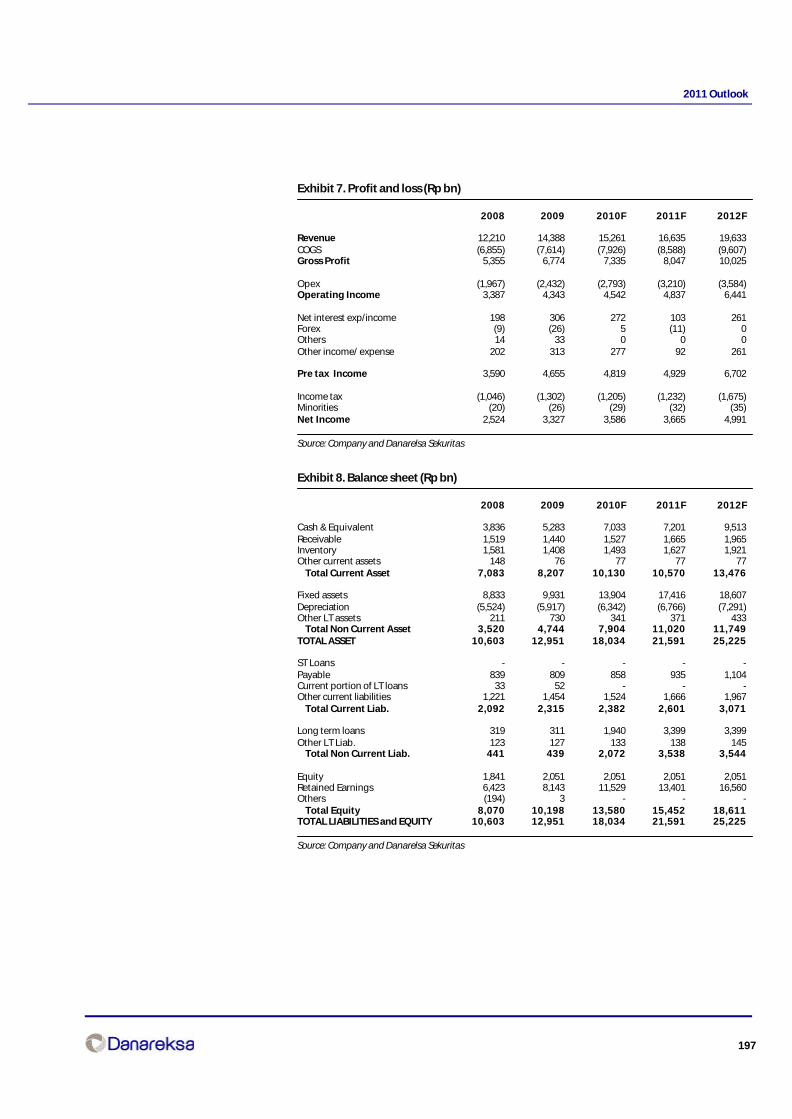
197
2011 Outlook
Exhibit 7. Profit and loss (Rp bn)
2008 2009 2010F 2011F 2012F
Revenue 12,210 14,388 15,261 16,635 19,633COGS (6,855) (7,614) (7,926) (8,588) (9,607)Gross Profit 5,355 6,774 7,335 8,047 10,025
Opex (1,967) (2,432) (2,793) (3,210) (3,584)Operating Income 3,387 4,343 4,542 4,837 6,441
Net interest exp/income 198 306 272 103 261Forex (9) (26) 5 (11) 0Others 14 33 0 0 0Other income/ expense 202 313 277 92 261
Pre tax Income 3,590 4,655 4,819 4,929 6,702
Income tax (1,046) (1,302) (1,205) (1,232) (1,675)Minorities (20) (26) (29) (32) (35)Net Income 2,524 3,327 3,586 3,665 4,991
Source: Company and Danarelsa Sekuritas
Exhibit 8. Balance sheet (Rp bn)
2008 2009 2010F 2011F 2012F
Cash & Equivalent 3,836 5,283 7,033 7,201 9,513Receivable 1,519 1,440 1,527 1,665 1,965Inventory 1,581 1,408 1,493 1,627 1,921Other current assets 148 76 77 77 77 Total Current Asset 7,083 8,207 10,130 10,570 13,476
Fixed assets 8,833 9,931 13,904 17,416 18,607Depreciation (5,524) (5,917) (6,342) (6,766) (7,291)Other LT assets 211 730 341 371 433 Total Non Current Asset 3,520 4,744 7,904 11,020 11,749TOTAL ASSET 10,603 12,951 18,034 21,591 25,225
ST Loans - - - - -Payable 839 809 858 935 1,104Current portion of LT loans 33 52 - - -Other current liabilities 1,221 1,454 1,524 1,666 1,967 Total Current Liab. 2,092 2,315 2,382 2,601 3,071
Long term loans 319 311 1,940 3,399 3,399Other LT Liab. 123 127 133 138 145 Total Non Current Liab. 441 439 2,072 3,538 3,544
Equity 1,841 2,051 2,051 2,051 2,051Retained Earnings 6,423 8,143 11,529 13,401 16,560Others (194) 3 - - - Total Equity 8,070 10,198 13,580 15,452 18,611TOTAL LIABILITIES and EQUITY 10,603 12,951 18,034 21,591 25,225
Source: Company and Danarelsa Sekuritas
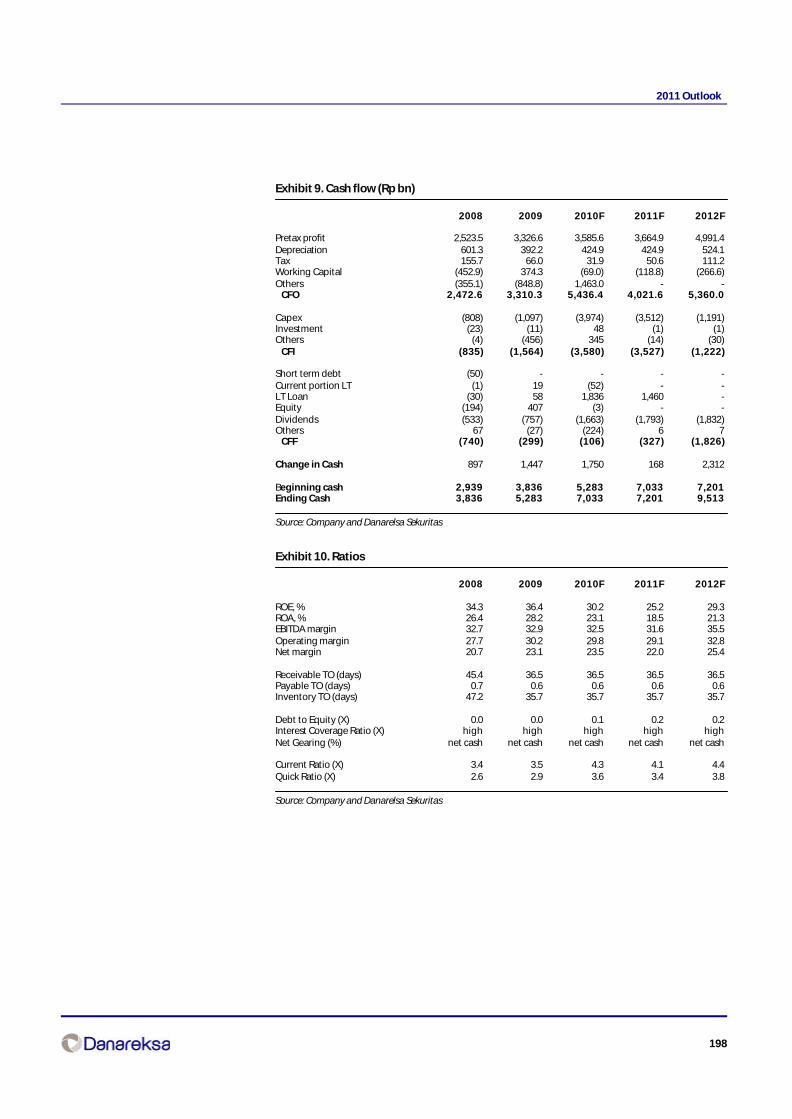
198
2011 Outlook
Exhibit 9. Cash flow (Rp bn)
2008 2009 2010F 2011F 2012F
Pretax profit 2,523.5 3,326.6 3,585.6 3,664.9 4,991.4Depreciation 601.3 392.2 424.9 424.9 524.1Tax 155.7 66.0 31.9 50.6 111.2Working Capital (452.9) 374.3 (69.0) (118.8) (266.6)Others (355.1) (848.8) 1,463.0 - - CFO 2,472.6 3,310.3 5,436.4 4,021.6 5,360.0
Capex (808) (1,097) (3,974) (3,512) (1,191)Investment (23) (11) 48 (1) (1)Others (4) (456) 345 (14) (30) CFI (835) (1,564) (3,580) (3,527) (1,222)
Short term debt (50) - - - -Current portion LT (1) 19 (52) - -LT Loan (30) 58 1,836 1,460 -Equity (194) 407 (3) - -Dividends (533) (757) (1,663) (1,793) (1,832)Others 67 (27) (224) 6 7 CFF (740) (299) (106) (327) (1,826)
Change in Cash 897 1,447 1,750 168 2,312
Beginning cash 2,939 3,836 5,283 7,033 7,201Ending Cash 3,836 5,283 7,033 7,201 9,513
Source: Company and Danarelsa Sekuritas
Exhibit 10. Ratios
2008 2009 2010F 2011F 2012F
ROE, % 34.3 36.4 30.2 25.2 29.3ROA, % 26.4 28.2 23.1 18.5 21.3EBITDA margin 32.7 32.9 32.5 31.6 35.5Operating margin 27.7 30.2 29.8 29.1 32.8Net margin 20.7 23.1 23.5 22.0 25.4
Receivable TO (days) 45.4 36.5 36.5 36.5 36.5Payable TO (days) 0.7 0.6 0.6 0.6 0.6Inventory TO (days) 47.2 35.7 35.7 35.7 35.7
Debt to Equity (X) 0.0 0.0 0.1 0.2 0.2Interest Coverage Ratio (X) high high high high highNet Gearing (%) net cash net cash net cash net cash net cash
Current Ratio (X) 3.4 3.5 4.3 4.1 4.4Quick Ratio (X) 2.6 2.9 3.6 3.4 3.8
Source: Company and Danarelsa Sekuritas

199
2011 Outlook
Sorini Agro Asia CorporindoRich valuation
SELL, TP of Rp 2,350We maintain our SELL recommendation on SOBI with a TP of Rp 2,350, implying 13.2x-10.9x 11F-12F PER. We use a lower equity risk premium of 5.5%, a figure likely to be sustainable over themedium term, we believe. Note that the yield on Indonesian 10-year bonds has dropped to anhistoric low of 7.4% while the spread on US 10-year Treasury bonds has declined to an historiclow of 1.2%. The company’s gross margin should recover, but the stock still trades at a very highvaluation. Currently the stock trades at 18.8x 11F PE or much higher than our estimate for the marketof 11F PE 14.3x.
EBITDA to grow 36% in 2011We expect 36% YoY EBITDA growth in 2011. The revenues should increase by 11% mainly supportedby new orders for maltose and maltodextrine products whose production began in July 2010 inthe new production plant with capacity of 42,000 MT/year. EBITDA growth will be supported bythe gross margin which we forecast to rebound to 26% in 2011 thanks to higher ASP and thecompany’s improved ability to choose cheaper raw materials between cassava starch and cornstarch for the starch sweetener products.
Raw materials diversification to support the gross marginAs the cassava starch price has risen significantly this year (the Thailand cassava starch priceincreased by 47% YTD), the company has developed more flexibility in its usage of raw materialsfor the starch sweeteners by starting to also use corn starch in 3Q10 besides the cassava starchit used previously. This should improve the ability of the company to match movements of its unitcosts and the ASP, as the starch sweeteners pricing should also be related to corn starch since othermajor starch sweetener producers also use corn as their raw material.
Cargill will be the new majority shareholderAKR Corporindo (SOBI’s current majority shareholder) has entered into an agreement with Cargillto sell all of its shares (representing about 69% ownership in SOBI) at a price of Rp 3,500 for eachshare. The transaction should obligate Cargill to undertake a tender offer. However, the deal isstill subject to approval from AKR Corporindo’s shareholders at the shareholders’ general meetingwhich will be held in January 2011.
2008 2009 2010F 2011F 2012F
Sales, Rp bn 1,493 1,471 1,976 2,185 2,277EBITDA, Rp bn 304 337 301 410 461Net Profit, Rp bn 142 158 115 169 205Core Profit, Rp bn 154 168 114 169 205Core EPS (fully dilluted), Rp 162 177 120 178 216Core EPS growth, % 66 9 (32) 48 21Core PER (fully dilluted), x 20.7 19.0 27.8 18.8 15.5EV/EBITDA (fully dilluted), x 11.5 10.1 11.9 7.9 6.5Dividend Yield, % 1.7 1.4 1.6 1.4 2.1BVPS (fully dilluted), Rp 572 708 778 911 1,058
Indra P. Yudison(62-21) 350 9888 ext. [email protected]
SELLBloomberg Code SOBI IJPrice, Rp 3,350Mkt Cap Rp bn 3,063Target Price, Rp 2,350
Last Recommendation
Rec. Target Price
22-Dec-10 SELL Rp 2,35019-Aug-10 SELL Rp 2,15029-Jul-10 BUY Rp 2,02510-May-10 BUY Rp 2,02528-Apr-10 BUY Rp 2,400
SOBI relative price to JCI Index
1,000
1,500
2,000
2,500
3,000
3,500
4,000
12/1
8/09
1/26
/10
2/25
/10
3/31
/10
5/3/
10
6/4/
10
7/6/
10
8/5/
10
9/7/
10
10/1
4/10
11/1
5/10
12/1
7/10
-30
-10
10
30
50
SOBI(LHS) Relative to JCI Index (RHS)
%Rp
Cut off data December 16,2010

200
2011 Outlook
Exhibit 1. Forward 12 months PER
Source: Company, Bloomberg and Danareksa estimates
Exhibit 2. Forward 12 months PBV
Source: Company, Bloomberg and Danareksa estimates
Exhibit 5. Net gearing
Source: Company and Danareksa estimates
Exhibit 6. Revenues breakdown based on product
Source: Company and Danareksa estimates
Exhibit 3. Forward 12 months EV/EBITDA
Source: Company, Bloomberg and Danareksa estimates
Exhibit 4. ROAE
Source: Company and Danareksa estimates
-
2.0
4.0
6.0
8.010.0
12.0
14.0
16.0
18.0
20.0
1/1/
05
8/1/
05
3/1/
06
10/1
/06
5/1/
07
12/1
/07
7/1/
08
2/1/
09
9/1/
09
4/1/
10
11/1
/10
Forward 12 months PER Average
-
0.5
1.0
1.5
2.0
2.5
3.0
3.5
4.0
1/1/
05
8/1/
05
3/1/
06
10/1
/06
5/1/
07
12/1
/07
7/1/
08
2/1/
09
9/1/
09
4/1/
10
11/1
/10
Forward 12 months PBV Average
-
1.0
2.0
3.0
4.0
5.0
6.0
7.0
8.0
9.0
1/1/
05
8/1/
05
3/1/
06
10/1
/06
5/1/
07
12/1
/07
7/1/
08
2/1/
09
9/1/
09
4/1/
10
11/1
/10
Forward 12 months EV/EBITDA Average
15%
17%
19%
21%
23%
25%
27%
29%
31%
33%
2008 2009 2010F 2011F 2012F
10%
12%
14%
16%
18%
20%
22%
24%
26%
28%
30%
2008 2009 2010F 2011F 2012F
-
500
1,000
1,500
2,000
2,500
2008 2009 2010F 2011F 2012F
Starch Sweeteners, Rp bn Starch, Rp bn

201
2011 Outlook
Exhibit 7. Profit and loss (Rp bn)
2008 2009 2010F 2011F 2012F
Sales 1,493 1,471 1,976 2,185 2,277COGS (1,031) (1,005) (1,532) (1,625) (1,658)Gross Profit 462 466 444 561 619
Operating ExpensesSelling Expenses (105) (105) (123) (130) (134)G&A Expenses (68) (75) (98) (108) (113)Total OpEx (173) (180) (221) (238) (247)
EBIT 289 286 223 322 372EBITDA 304 337 301 410 461
Other Income (Expenses)Interest Income 4 3 5 10 16Interest Expense (32) (21) (46) (61) (60)Forex Gain (loss) (23) (22) 0 - -Others 7 9 - - -Total Other Income (Expenses) (45) (32) (40) (52) (44)
Pre-tax Profit 244 254 183 271 328Tax Expenses (81) (65) (46) (68) (82)Earnings Before Minority Interest 163 188 137 203 246Minority Interest (21) (31) (23) (34) (41)Net Profit 142 158 115 169 205Core Profit 154 168 114 169 205
Source: Company and Danareksa Sekuritas
Exhibit 8. Balance sheet (Rp bn)
2008 2009 2010F 2011F 2012F
Cash 52 115 195 485 668Trade Receivables 175 148 201 223 232Other Receivables 7 5 7 8 8Inventories 477 246 349 216 220Others 25 47 75 80 82Total Current Assets 735 561 827 1,011 1,210
PPE 350 648 761 716 669Other non-current assets 25 53 44 32 32Total Non-Current Assets 376 701 804 748 701TOTAL ASSETS 1,111 1,263 1,631 1,759 1,912
LIABILITIES & EQUITIESTrade Payables 33 63 98 104 106Other Payables 48 23 19 24 27Accrued Expenses 38 46 70 75 76ST Bank Loan 291 184 449 449 449ST Portion of LT Bank Loan 18 10 15 - -ST Portion of Capital Lease Obligation 11 36 32 34 25Others 1 3 3 3 3Total Current Liabilities 440 365 687 689 685
LT Portion of LT Bank Loan 25 15 - - -LT Portion of Capital Lease Obligation 30 112 85 50 26Post Employment Benefit Obligation 21 28 28 28 28Others 1 2 2 2 2Total Non-Current Liabilities 77 157 115 81 56
Minority Interests 51 68 90 124 165
Share Capital 90 91 92 92 93Additional Paid in Capital 1 3 3 4 4Share Options 1 2 3 3 3Retained Earnings 451 577 641 766 905Total Equity 544 673 739 865 1,005
TOTAL LIABILITIES & EQUITIES 1,111 1,263 1,631 1,759 1,912
Source: Company and Danareksa Sekuritas

202
2011 Outlook
Exhibit 9. Cash flow (Rp bn)
2008 2009 2010F 2011F 2012F
CFONet Income 142 158 115 169 205Depreciation 14 52 78 87 90Forex gain/loss 23 22 (0) - -Minority interest 21 31 23 34 41WC changes (205) 253 (131) 120 (10)Other assets/liabilities changes 14 (20) 9 11 (0)Others 34 (103)Net cash provided by operating activities 43 392 93 422 326
CFIProceeds from sale of PPE 3 2 - - -Acquisition and Advance payment for PPE (134) (280) (190) (42) (43)Interest received 1 3Received from the subsidiary - (37)Net cash used in investing activities (130) (311) (190) (42) (43)
CFFCash dividends paid (51) (43) (50) (45) (66)Proceeds from ST Bank Loans 1,009 473 266 - -Payment of ST Bank Loans (898) (533) - - -Proceeds from LT Bank Loans - - - - -Payment of LT bank loans (19) (13) (10) (15) -Capital Lease Principal(Repayment) (3) (21) (30) (32) (34)Increase/Decrease in Equity - 2 1 1Placement of restricted funds - - - - -Proceeds from sale & leaseback fin. of PPE 42 132 - - -Withdrawak of restricted funds 0 - - - -Share issuance 5 2 - - -Net cash provided by financing activities 87 (4) 177 (90) (99)
Source: Company and Danareksa Sekuritas
Exhibit 10. Ratios
2008 2009 2010F 2011F 2012FProfitability, %
Gross Profit Margin 30.9 31.7 22.5 25.6 27.2Operating Profit Margin 19.4 19.4 11.3 14.8 16.3Net Profit Margin 9.5 10.7 5.8 7.8 9.0EBITDA Margin 20.3 22.9 15.2 18.7 20.3Core Profit Margin 10.3 11.4 5.8 7.8 9.0ROAE 28.9 25.9 16.2 21.1 21.9
Liquidity, %Current Ratio 167.2 153.5 120.4 146.8 176.5Quick Ratio 53.0 73.3 58.7 103.8 132.4Cash Ratio 11.8 31.5 28.4 70.4 97.4
Leverage, %Net Gearing 59.3 35.8 52.2 5.7 (16.7)Gearing 63.0 48.1 70.0 54.0 42.7
Turnover, DaysReceivable 43 37 37 37 37Inventory 166 82 82 48 48Payable 12 23 23 23 23
ValuationsP/E, x 22.3 20.2 27.8 18.8 15.5P/BV, x 5.9 4.7 4.3 3.7 3.2Dividend Yield, % 1.7 1.4 1.6 1.4 2.1
Growth, %Sales 43.2 (1.5) 34.4 10.6 4.2Gross Profit 53.0 0.9 (4.6) 26.1 10.4Operating Profit 79.8 (1.2) (21.9) 44.5 15.2EBITDA 73.3 11.2 (10.8) 36.1 12.6Net Profit 51.3 10.6 (27.3) 47.9 21.0
Source: Company and Danareksa Sekuritas
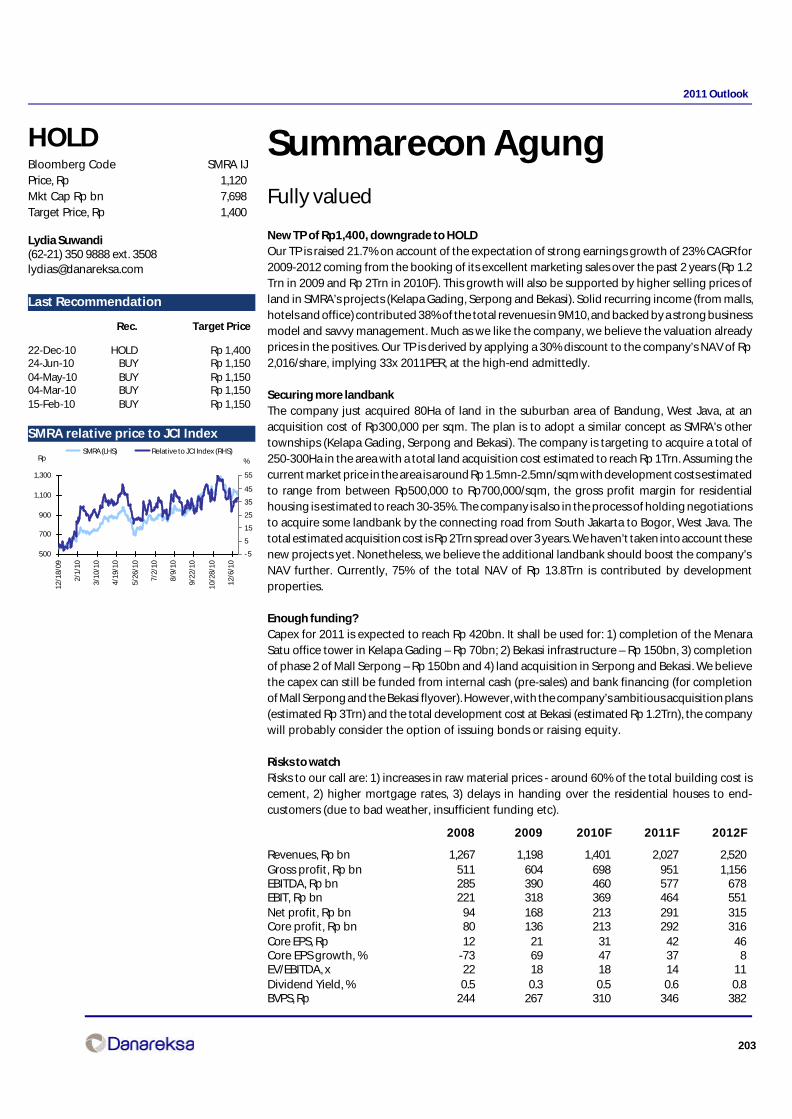
203
2011 Outlook
Summarecon AgungFully valued
New TP of Rp1,400, downgrade to HOLDOur TP is raised 21.7% on account of the expectation of strong earnings growth of 23% CAGR for2009-2012 coming from the booking of its excellent marketing sales over the past 2 years (Rp 1.2Trn in 2009 and Rp 2Trn in 2010F). This growth will also be supported by higher selling prices ofland in SMRA’s projects (Kelapa Gading, Serpong and Bekasi). Solid recurring income (from malls,hotels and office) contributed 38% of the total revenues in 9M10, and backed by a strong businessmodel and savvy management. Much as we like the company, we believe the valuation alreadyprices in the positives. Our TP is derived by applying a 30% discount to the company’s NAV of Rp2,016/share, implying 33x 2011PER, at the high-end admittedly.
Securing more landbankThe company just acquired 80Ha of land in the suburban area of Bandung, West Java, at anacquisition cost of Rp300,000 per sqm. The plan is to adopt a similar concept as SMRA’s othertownships (Kelapa Gading, Serpong and Bekasi). The company is targeting to acquire a total of250-300Ha in the area with a total land acquisition cost estimated to reach Rp 1Trn. Assuming thecurrent market price in the area is around Rp 1.5mn-2.5mn/sqm with development costs estimatedto range from between Rp500,000 to Rp700,000/sqm, the gross profit margin for residentialhousing is estimated to reach 30-35%. The company is also in the process of holding negotiationsto acquire some landbank by the connecting road from South Jakarta to Bogor, West Java. Thetotal estimated acquisition cost is Rp 2Trn spread over 3 years. We haven’t taken into account thesenew projects yet. Nonetheless, we believe the additional landbank should boost the company’sNAV further. Currently, 75% of the total NAV of Rp 13.8Trn is contributed by developmentproperties.
Enough funding?Capex for 2011 is expected to reach Rp 420bn. It shall be used for: 1) completion of the MenaraSatu office tower in Kelapa Gading – Rp 70bn; 2) Bekasi infrastructure – Rp 150bn, 3) completionof phase 2 of Mall Serpong – Rp 150bn and 4) land acquisition in Serpong and Bekasi. We believethe capex can still be funded from internal cash (pre-sales) and bank financing (for completionof Mall Serpong and the Bekasi flyover). However, with the company’s ambitious acquisition plans(estimated Rp 3Trn) and the total development cost at Bekasi (estimated Rp 1.2Trn), the companywill probably consider the option of issuing bonds or raising equity.
Risks to watchRisks to our call are: 1) increases in raw material prices - around 60% of the total building cost iscement, 2) higher mortgage rates, 3) delays in handing over the residential houses to end-customers (due to bad weather, insufficient funding etc).
Lydia Suwandi(62-21) 350 9888 ext. [email protected]
HOLDBloomberg Code SMRA IJPrice, Rp 1,120Mkt Cap Rp bn 7,698Target Price, Rp 1,400
Last Recommendation
Rec. Target Price
22-Dec-10 HOLD Rp 1,40024-Jun-10 BUY Rp 1,15004-May-10 BUY Rp 1,15004-Mar-10 BUY Rp 1,15015-Feb-10 BUY Rp 1,150
Last Recommendation
SMRA relative price to JCI Index
2008 2009 2010F 2011F 2012F
Revenues, Rp bn 1,267 1,198 1,401 2,027 2,520Gross profit, Rp bn 511 604 698 951 1,156EBITDA, Rp bn 285 390 460 577 678EBIT, Rp bn 221 318 369 464 551Net profit, Rp bn 94 168 213 291 315Core profit, Rp bn 80 136 213 292 316Core EPS, Rp 12 21 31 42 46Core EPS growth, % -73 69 47 37 8EV/EBITDA, x 22 18 18 14 11Dividend Yield, % 0.5 0.3 0.5 0.6 0.8BVPS, Rp 244 267 310 346 382
500
700
900
1,100
1,300
12/1
8/09
2/1/
10
3/10
/10
4/19
/10
5/26
/10
7/2/
10
8/9/
10
9/22
/10
10/2
8/10
12/6
/10
- 5
5
15
25
35
45
55
SMRA (LHS) Relative to JCI Index (RHS)%Rp
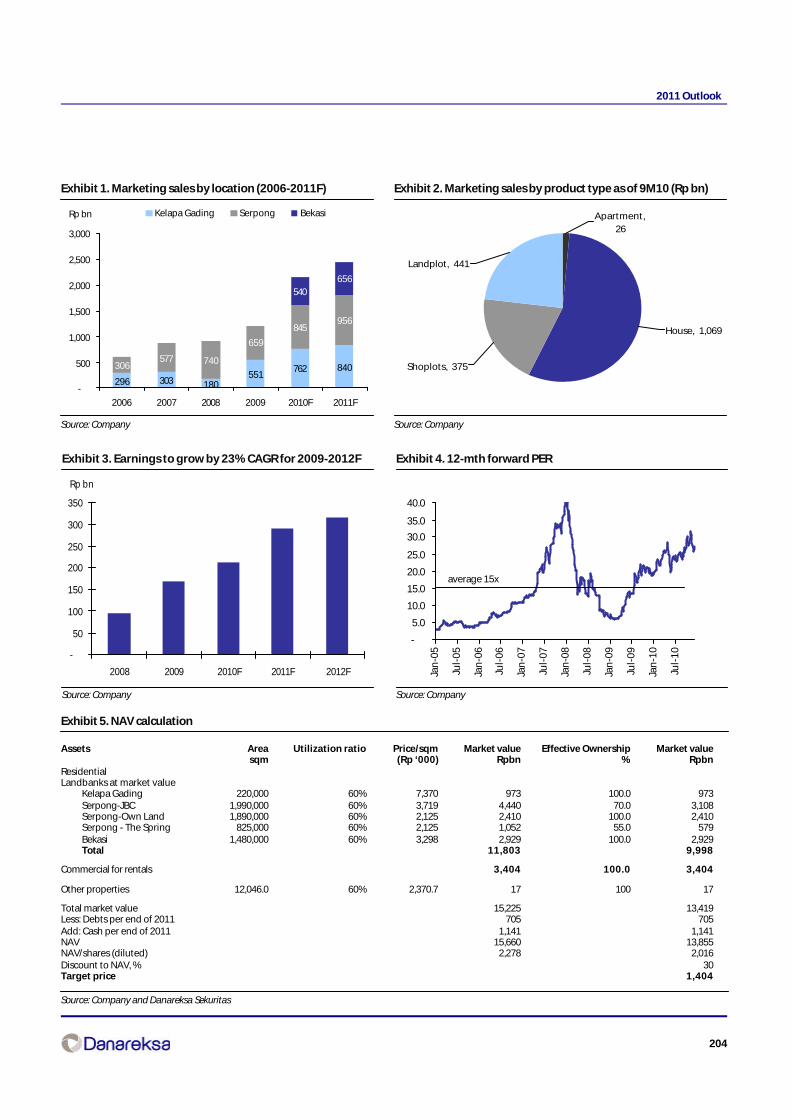
204
2011 Outlook
Exhibit 1. Marketing sales by location (2006-2011F)
Source: Company
Exhibit 2. Marketing sales by product type as of 9M10 (Rp bn)
Source: Company
Exhibit 3. Earnings to grow by 23% CAGR for 2009-2012F
Source: Company
Exhibit 4. 12-mth forward PER
Source: Company
296 303 180551
762 840306577 740
659
845956
540656
-
500
1,000
1,500
2,000
2,500
3,000
2006 2007 2008 2009 2010F 2011F
Rp bn Kelapa Gading Serpong Bekasi
Landplot, 441
Shoplots, 375
House, 1,069
Apartment, 26
Rp bn
-
50
100
150
200
250
300
350
2008 2009 2010F 2011F 2012F
Exhibit 5. NAV calculation
Assets Area Utilization ratio Price/sqm Market value Effective Ownership Market value sqm (Rp ‘000) Rpbn % Rpbn
ResidentialLandbanks at market value
Kelapa Gading 220,000 60% 7,370 973 100.0 973 Serpong-JBC 1,990,000 60% 3,719 4,440 70.0 3,108 Serpong-Own Land 1,890,000 60% 2,125 2,410 100.0 2,410 Serpong - The Spring 825,000 60% 2,125 1,052 55.0 579 Bekasi 1,480,000 60% 3,298 2,929 100.0 2,929 Total 11,803 9,998
Commercial for rentals 3,404 100.0 3,404
Other properties 12,046.0 60% 2,370.7 17 100 17
Total market value 15,225 13,419Less: Debts per end of 2011 705 705Add: Cash per end of 2011 1,141 1,141NAV 15,660 13,855NAV/shares (diluted) 2,278 2,016Discount to NAV, % 30Target price 1,404
Source: Company and Danareksa Sekuritas
-
5.0
10.0
15.0
20.0
25.0
30.0
35.0
40.0
Jan
-05
Jul-
05
Jan
-06
Jul-
06
Jan
-07
Jul-
07
Jan
-08
Jul-
08
Jan
-09
Jul-
09
Jan
-10
Jul-
10
average 15x

205
2011 Outlook
Exhibit 6. Projected profit and loss (Rp bn)
2008 2009 2010F 2011F 2012F
Cash 260.8 633.2 1,140.7 874.7 769.6Short term investment 31.9 10.9 10.9 10.9 10.9Receivables 160.1 133.6 173.8 251.4 312.5Inventories 653.8 712.9 742.0 737.3 822.3Others 157.6 223.8 223.8 223.8 223.8Total current assets 1,264.1 1,714.3 2,291.2 2,098.1 2,139.1Property & plant - net 1,560.8 1,542.7 1,861.6 2,228.5 2,411.5Other assets 805.1 1,203.3 872.3 964.0 1,061.0
Account payable 60.2 62.8 74.4 113.9 144.4Other payable 15.2 16.3 14.0 18.1 21.3Others 818.1 1,659.8 2,091.2 2,234.6 1,887.5Total curr. liabs 893.5 1,738.9 2,179.6 2,366.6 2,053.2Bank Loan 864.6 699.7 407.5 241.5 624.7Bonds 296.3 296.9 297.8 298.7 299.6
Share capital 643.6 643.7 687.3 687.3 687.3Excess paid in 48.6 49.1 245.4 245.4 245.4Retained earnings & others 877.0 1,025.0 1,200.5 1,444.0 1,694.4Total equity 1,569.2 1,717.8 2,133.1 2,376.7 2,627.0
Source: Company and Danareksa Sekuritas
Exhibit 7. Projected balance sheet (Rp bn)
2008 2009 2010F 2011F 2012F
Sales 1,267.1 1,197.7 1,401.5 2,027.1 2,519.9COGS (756.3) (593.3) (703.5) (1,076.5) (1,364.3)Gross profit 510.8 604.4 698.0 950.5 1,155.7Operating expenses (289.9) (286.1) (329.3) (486.5) (604.8)Operating profit 220.9 318.4 368.6 464.0 550.9Other income/expenses 24.4 20.8 0.3 0.0 0.0Net interest (71.6) (50.8) (83.7) (50.8) (38.0)Pre-tax profit 173.7 288.4 285.2 413.3 512.9Taxes (76.0) (74.8) (84.1) (121.6) (151.2)Net profit 94.1 167.6 212.5 290.6 314.7Core profit 80.4 135.5 213.0 291.6 316.0
Source: Company and Danareksa Sekuritas
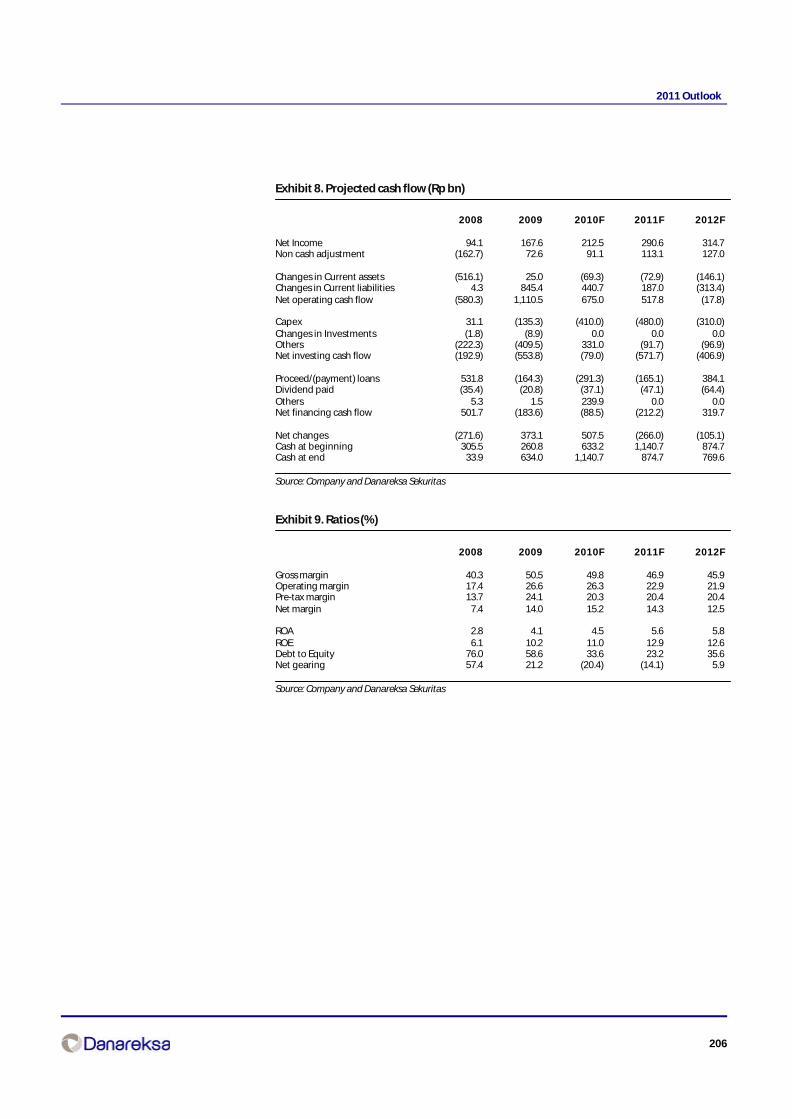
206
2011 Outlook
Exhibit 8. Projected cash flow (Rp bn)
2008 2009 2010F 2011F 2012F
Net Income 94.1 167.6 212.5 290.6 314.7Non cash adjustment (162.7) 72.6 91.1 113.1 127.0
Changes in Current assets (516.1) 25.0 (69.3) (72.9) (146.1)Changes in Current liabilities 4.3 845.4 440.7 187.0 (313.4)Net operating cash flow (580.3) 1,110.5 675.0 517.8 (17.8)
Capex 31.1 (135.3) (410.0) (480.0) (310.0)Changes in Investments (1.8) (8.9) 0.0 0.0 0.0Others (222.3) (409.5) 331.0 (91.7) (96.9)Net investing cash flow (192.9) (553.8) (79.0) (571.7) (406.9)
Proceed/(payment) loans 531.8 (164.3) (291.3) (165.1) 384.1Dividend paid (35.4) (20.8) (37.1) (47.1) (64.4)Others 5.3 1.5 239.9 0.0 0.0Net financing cash flow 501.7 (183.6) (88.5) (212.2) 319.7
Net changes (271.6) 373.1 507.5 (266.0) (105.1)Cash at beginning 305.5 260.8 633.2 1,140.7 874.7Cash at end 33.9 634.0 1,140.7 874.7 769.6
Source: Company and Danareksa Sekuritas
Exhibit 9. Ratios (%)
2008 2009 2010F 2011F 2012F
Gross margin 40.3 50.5 49.8 46.9 45.9Operating margin 17.4 26.6 26.3 22.9 21.9Pre-tax margin 13.7 24.1 20.3 20.4 20.4Net margin 7.4 14.0 15.2 14.3 12.5
ROA 2.8 4.1 4.5 5.6 5.8ROE 6.1 10.2 11.0 12.9 12.6Debt to Equity 76.0 58.6 33.6 23.2 35.6Net gearing 57.4 21.2 (20.4) (14.1) 5.9
Source: Company and Danareksa Sekuritas
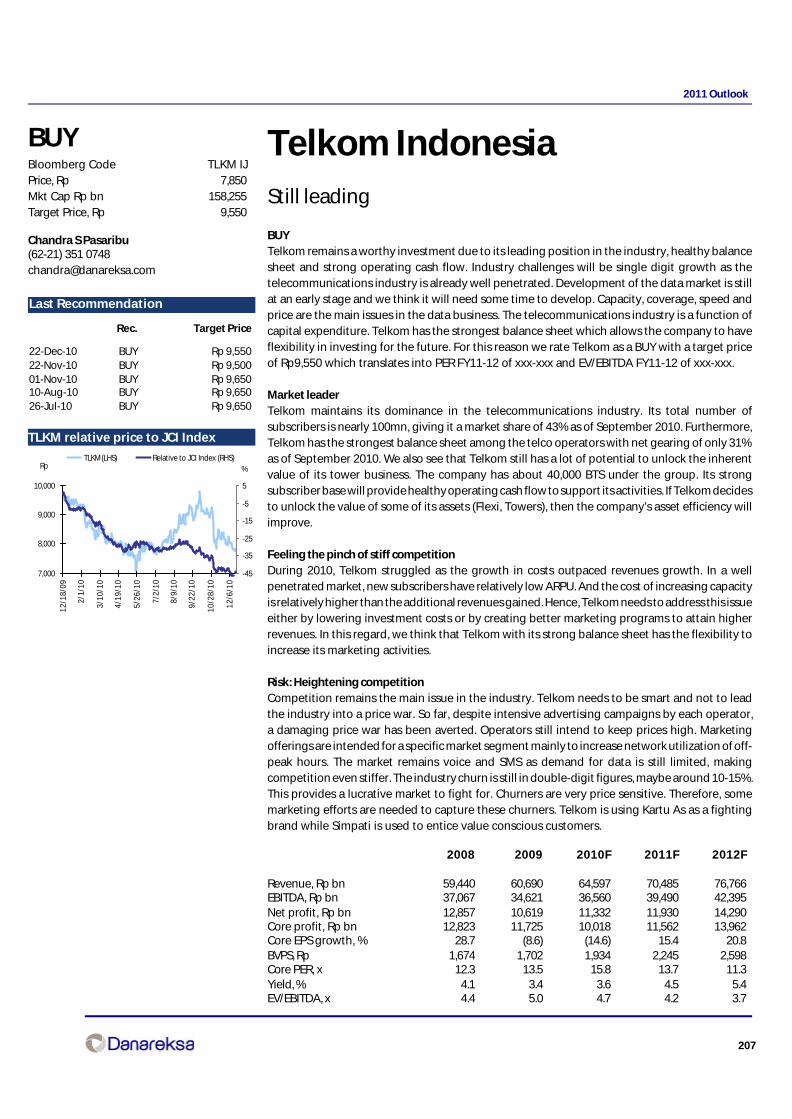
207
2011 Outlook
Telkom IndonesiaStill leading
BUYTelkom remains a worthy investment due to its leading position in the industry, healthy balancesheet and strong operating cash flow. Industry challenges will be single digit growth as thetelecommunications industry is already well penetrated. Development of the data market is stillat an early stage and we think it will need some time to develop. Capacity, coverage, speed andprice are the main issues in the data business. The telecommunications industry is a function ofcapital expenditure. Telkom has the strongest balance sheet which allows the company to haveflexibility in investing for the future. For this reason we rate Telkom as a BUY with a target priceof Rp9,550 which translates into PER FY11-12 of xxx-xxx and EV/EBITDA FY11-12 of xxx-xxx.
Market leaderTelkom maintains its dominance in the telecommunications industry. Its total number ofsubscribers is nearly 100mn, giving it a market share of 43% as of September 2010. Furthermore,Telkom has the strongest balance sheet among the telco operators with net gearing of only 31%as of September 2010. We also see that Telkom still has a lot of potential to unlock the inherentvalue of its tower business. The company has about 40,000 BTS under the group. Its strongsubscriber base will provide healthy operating cash flow to support its activities. If Telkom decidesto unlock the value of some of its assets (Flexi, Towers), then the company’s asset efficiency willimprove.
Feeling the pinch of stiff competitionDuring 2010, Telkom struggled as the growth in costs outpaced revenues growth. In a wellpenetrated market, new subscribers have relatively low ARPU. And the cost of increasing capacityis relatively higher than the additional revenues gained. Hence, Telkom needs to address this issueeither by lowering investment costs or by creating better marketing programs to attain higherrevenues. In this regard, we think that Telkom with its strong balance sheet has the flexibility toincrease its marketing activities.
Risk: Heightening competitionCompetition remains the main issue in the industry. Telkom needs to be smart and not to leadthe industry into a price war. So far, despite intensive advertising campaigns by each operator,a damaging price war has been averted. Operators still intend to keep prices high. Marketingofferings are intended for a specific market segment mainly to increase network utilization of off-peak hours. The market remains voice and SMS as demand for data is still limited, makingcompetition even stiffer. The industry churn is still in double-digit figures, maybe around 10-15%.This provides a lucrative market to fight for. Churners are very price sensitive. Therefore, somemarketing efforts are needed to capture these churners. Telkom is using Kartu As as a fightingbrand while Simpati is used to entice value conscious customers.
Chandra S Pasaribu(62-21) 351 [email protected]
BUYBloomberg Code TLKM IJPrice, Rp 7,850Mkt Cap Rp bn 158,255Target Price, Rp 9,550
TLKM relative price to JCI Index
Last Recommendation
Rec. Target Price
22-Dec-10 BUY Rp 9,55022-Nov-10 BUY Rp 9,50001-Nov-10 BUY Rp 9,65010-Aug-10 BUY Rp 9,65026-Jul-10 BUY Rp 9,650
7,000
8,000
9,000
10,000
12/1
8/09
2/1/
10
3/10
/10
4/19
/10
5/26
/10
7/2/
10
8/9/
10
9/22
/10
10/2
8/10
12/6
/10
-45
-35
-25
-15
-5
5
TLKM (LHS) Relative to JCI Index (RHS)%Rp
2008 2009 2010F 2011F 2012F
Revenue, Rp bn 59,440 60,690 64,597 70,485 76,766EBITDA, Rp bn 37,067 34,621 36,560 39,490 42,395Net profit, Rp bn 12,857 10,619 11,332 11,930 14,290Core profit, Rp bn 12,823 11,725 10,018 11,562 13,962Core EPS growth, % 28.7 (8.6) (14.6) 15.4 20.8BVPS, Rp 1,674 1,702 1,934 2,245 2,598Core PER, x 12.3 13.5 15.8 13.7 11.3Yield, % 4.1 3.4 3.6 4.5 5.4EV/EBITDA, x 4.4 5.0 4.7 4.2 3.7

208
2011 Outlook
Exhibit 1. RPM and MoU
Source: Company
Exhibit 2. Quarterly Net additions
Source: Company
Exhibit 3. Total subscriber breakdown by pre and post paid
Source: Company
Exhibit 4. Net grearing
Source: Company
Exhibit 5. 12-mth forward PE
Source: Company
Exhibit 6. 12-mth forward EV/EBITDA
Source: Company
-
200400
600800
1,0001,200
1,400
Sep-
06D
ec-0
6M
ar-0
7Ju
n-07
Sep-
07D
ec-0
7M
ar-0
8Ju
n-08
Sep-
08D
ec-0
8M
ar-0
9Ju
n-09
Sep-
09D
ec-0
9M
ar-1
0Ju
n-10
Sep-
10
-510152025303540
RPM (Rp/minute) - LHS Mou (bn minutes) - RHS
1,646
3,4333,445
1,108
8,060
4,797
6,833
3,8813,760
1,870
306
6,366
4,819
Sep-
07
Dec
-07
Mar
-08
Jun-
08
Sep-
08
Dec
-08
Mar
-09
Jun-
09
Sep-
09
Dec
-09
Mar
-10
Jun-
10
Sep-
10
-40
-20
0
20
40
60
80
2002 2003 2007 2008 2009F 2010F 2011F 2012F
Net gearing, %
-
20,000
40,000
60,000
80,000
100,000
Sep
-07
Dec
-07
Mar
-08
Jun
-08
Sep
-08
Dec
-08
Mar
-09
Jun
-09
Sep
-09
Dec
-09
Mar
-10
Jun
-10
Sep
-10
kartu HALO simPATI KARTU As'000 subs
Mean
+1SD
-1SD
+2SD
-2SD
4
9
14
19
24
03 04 05 06 07 08 09 10
Mean
+1SD
-1SD
+2SD
-2SD2
3
4
5
6
7
8
9
03 04 05 06 07 08 09 10
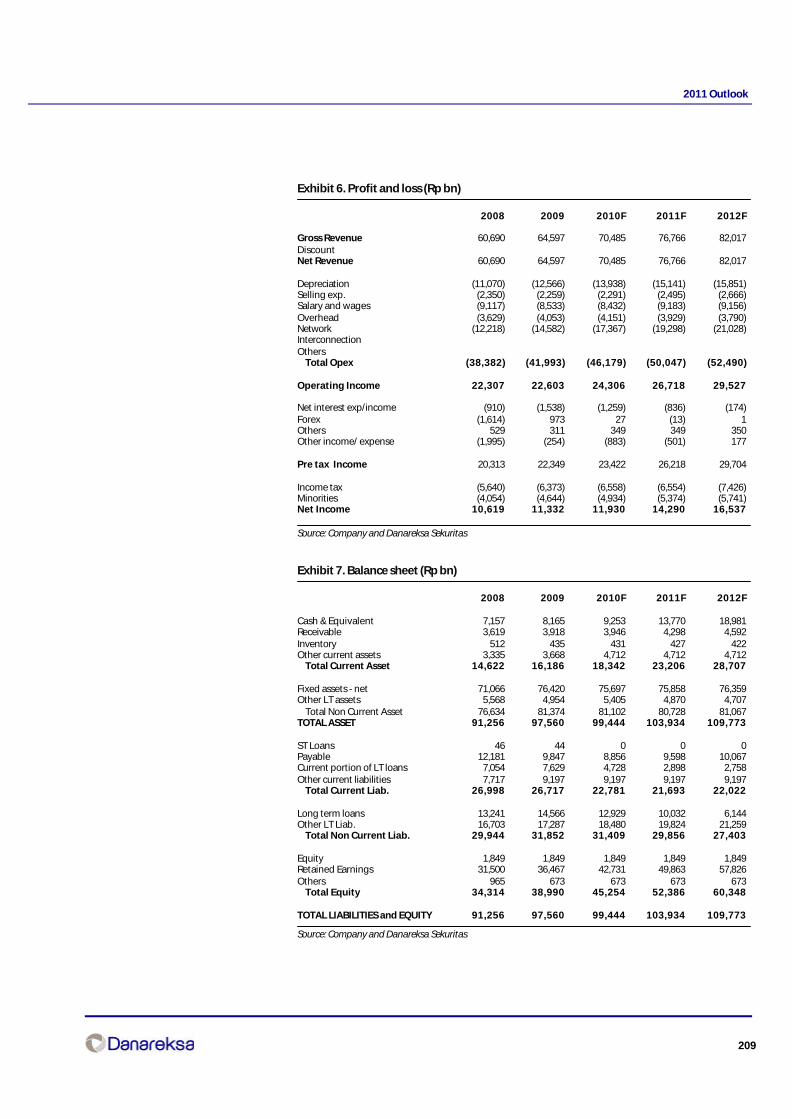
209
2011 Outlook
Exhibit 6. Profit and loss (Rp bn)
2008 2009 2010F 2011F 2012F
Gross Revenue 60,690 64,597 70,485 76,766 82,017DiscountNet Revenue 60,690 64,597 70,485 76,766 82,017
Depreciation (11,070) (12,566) (13,938) (15,141) (15,851)Selling exp. (2,350) (2,259) (2,291) (2,495) (2,666)Salary and wages (9,117) (8,533) (8,432) (9,183) (9,156)Overhead (3,629) (4,053) (4,151) (3,929) (3,790)Network (12,218) (14,582) (17,367) (19,298) (21,028)InterconnectionOthers Total Opex (38,382) (41,993) (46,179) (50,047) (52,490)
Operating Income 22,307 22,603 24,306 26,718 29,527
Net interest exp/income (910) (1,538) (1,259) (836) (174)Forex (1,614) 973 27 (13) 1Others 529 311 349 349 350Other income/ expense (1,995) (254) (883) (501) 177
Pre tax Income 20,313 22,349 23,422 26,218 29,704
Income tax (5,640) (6,373) (6,558) (6,554) (7,426)Minorities (4,054) (4,644) (4,934) (5,374) (5,741)Net Income 10,619 11,332 11,930 14,290 16,537
Source: Company and Danareksa Sekuritas
Exhibit 7. Balance sheet (Rp bn)
2008 2009 2010F 2011F 2012F
Cash & Equivalent 7,157 8,165 9,253 13,770 18,981Receivable 3,619 3,918 3,946 4,298 4,592Inventory 512 435 431 427 422Other current assets 3,335 3,668 4,712 4,712 4,712 Total Current Asset 14,622 16,186 18,342 23,206 28,707
Fixed assets - net 71,066 76,420 75,697 75,858 76,359Other LT assets 5,568 4,954 5,405 4,870 4,707 Total Non Current Asset 76,634 81,374 81,102 80,728 81,067TOTAL ASSET 91,256 97,560 99,444 103,934 109,773
ST Loans 46 44 0 0 0Payable 12,181 9,847 8,856 9,598 10,067Current portion of LT loans 7,054 7,629 4,728 2,898 2,758Other current liabilities 7,717 9,197 9,197 9,197 9,197 Total Current Liab. 26,998 26,717 22,781 21,693 22,022
Long term loans 13,241 14,566 12,929 10,032 6,144Other LT Liab. 16,703 17,287 18,480 19,824 21,259 Total Non Current Liab. 29,944 31,852 31,409 29,856 27,403
Equity 1,849 1,849 1,849 1,849 1,849Retained Earnings 31,500 36,467 42,731 49,863 57,826Others 965 673 673 673 673 Total Equity 34,314 38,990 45,254 52,386 60,348
TOTAL LIABILITIES and EQUITY 91,256 97,560 99,444 103,934 109,773
Source: Company and Danareksa Sekuritas

210
2011 Outlook
Exhibit 8. Cash flow (Rp bn)
2008 2009 2010F 2011F 2012FOperating cash flow
Net profit 10,619 11,332 11,930 14,290 16,537Non-cash adjustmentsSub-total 10,751 11,504 15,235 15,727 16,065Working capital changesSub-total 2,654 (1,409) (2,058) 395 179Other assets/liabilitiesSub-total 379 1,250 1,193 1,343 1,435Operating cash flow 24,404 22,676 26,301 31,755 34,216
Investing cash flowCapex (18,425) (16,389) (14,009) (15,353) (16,403)FA liquidationAdditions/liquidation of investments (8,834) (146) (955) 0 0Investing cash flow (27,259) (16,535) (14,964) (15,353) (16,403)
Financing cash flowLoan principal drawdown/payment 0 1,898 (4,582) (4,727) (4,028)Other liabilities 5,955 (666) 0 0 0Equity injection 0 0 0 0Dividend payment (6,428) (6,365) (5,666) (7,158) (8,574)Financing cash flow (473) (5,133) (10,248) (11,885) (12,602)
Total cash flow movement (3,329) 1,008 1,089 4,517 5,211Beginning cash balance 10,220 7,157 8,165 9,253 13,770Ending cash balance 7,157 8,165 9,253 13,770 18,981
Source: Company and Danareksa Sekuritas
Exhibit 9. Ratios
2008 2009 2010F 2011F 2012F
Operating margin, % 37 35 34 35 36EBITDA margin, % 57.0 56.6 56.0 55.2 55.5Net margin, % 17 18 17 19 20ROAA, % 12.3 12.0 12 14 15ROAE, % 31.2 30.9 28 29 29
Current ratio, x 0.5 0.6 0.8 1.1 1.3Quick ratio, x 0.4 0.5 0.6 0.8 1.1
Accounts receivable turnover, days 20 20 20 20 20Accounts payable turnover, days 116 70 70 70 70Working capital cycle, days (95) (50) (50) (50) (50)
Gearing, % 59.3 57.0 39.0 24.7 14.8Net gearing, % 39.2 37.0 19.4 (0.9) (16.1)Debt/capital, % 37.2 36.3 28.1 19.8 12.9
Source: Company and Danareksa Sekuritas
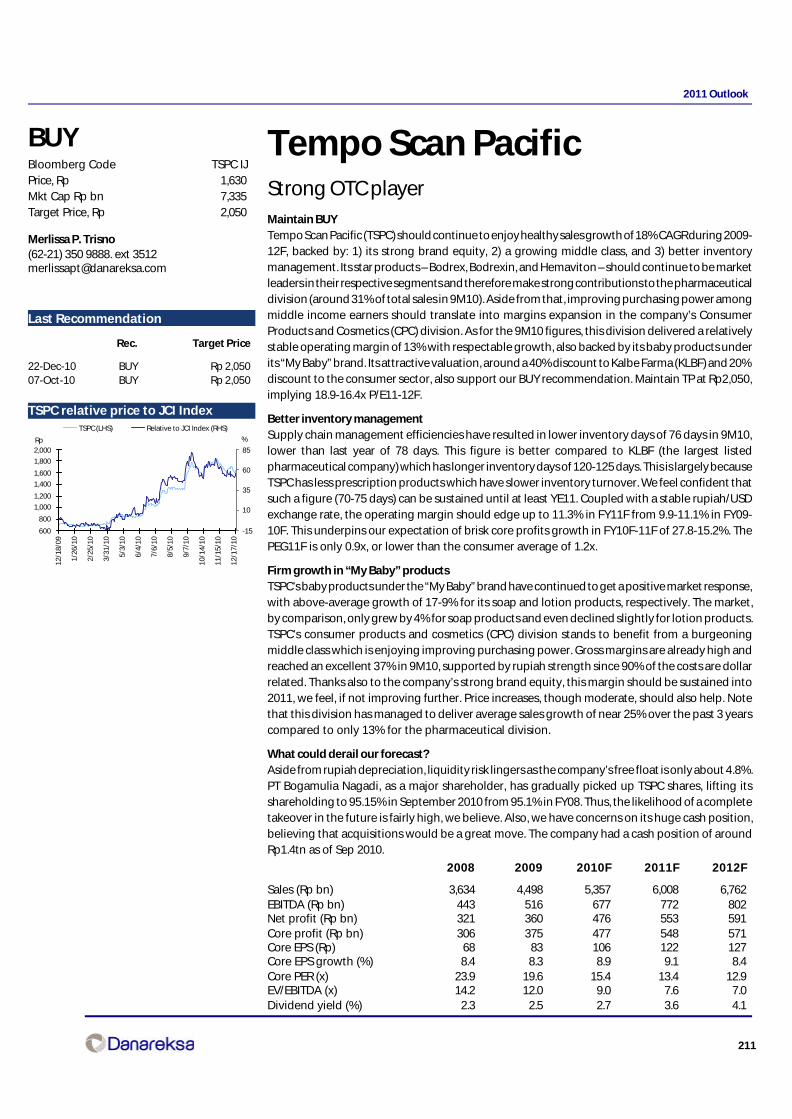
211
2011 Outlook
Tempo Scan PacificStrong OTC playerMaintain BUYTempo Scan Pacific (TSPC) should continue to enjoy healthy sales growth of 18% CAGR during 2009-12F, backed by: 1) its strong brand equity, 2) a growing middle class, and 3) better inventorymanagement. Its star products – Bodrex, Bodrexin, and Hemaviton – should continue to be marketleaders in their respective segments and therefore make strong contributions to the pharmaceuticaldivision (around 31% of total sales in 9M10). Aside from that, improving purchasing power amongmiddle income earners should translate into margins expansion in the company’s ConsumerProducts and Cosmetics (CPC) division. As for the 9M10 figures, this division delivered a relativelystable operating margin of 13% with respectable growth, also backed by its baby products underits “My Baby” brand. Its attractive valuation, around a 40% discount to Kalbe Farma (KLBF) and 20%discount to the consumer sector, also support our BUY recommendation. Maintain TP at Rp2,050,implying 18.9-16.4x P/E11-12F.
Better inventory managementSupply chain management efficiencies have resulted in lower inventory days of 76 days in 9M10,lower than last year of 78 days. This figure is better compared to KLBF (the largest listedpharmaceutical company) which has longer inventory days of 120-125 days. This is largely becauseTSPC has less prescription products which have slower inventory turnover. We feel confident thatsuch a figure (70-75 days) can be sustained until at least YE11. Coupled with a stable rupiah/USDexchange rate, the operating margin should edge up to 11.3% in FY11F from 9.9-11.1% in FY09-10F. This underpins our expectation of brisk core profits growth in FY10F-11F of 27.8-15.2%. ThePEG11F is only 0.9x, or lower than the consumer average of 1.2x.
Firm growth in “My Baby” productsTSPC’s baby products under the “My Baby” brand have continued to get a positive market response,with above-average growth of 17-9% for its soap and lotion products, respectively. The market,by comparison, only grew by 4% for soap products and even declined slightly for lotion products.TSPC’s consumer products and cosmetics (CPC) division stands to benefit from a burgeoningmiddle class which is enjoying improving purchasing power. Gross margins are already high andreached an excellent 37% in 9M10, supported by rupiah strength since 90% of the costs are dollarrelated. Thanks also to the company’s strong brand equity, this margin should be sustained into2011, we feel, if not improving further. Price increases, though moderate, should also help. Notethat this division has managed to deliver average sales growth of near 25% over the past 3 yearscompared to only 13% for the pharmaceutical division.
What could derail our forecast?Aside from rupiah depreciation, liquidity risk lingers as the company’s free float is only about 4.8%.PT Bogamulia Nagadi, as a major shareholder, has gradually picked up TSPC shares, lifting itsshareholding to 95.15% in September 2010 from 95.1% in FY08. Thus, the likelihood of a completetakeover in the future is fairly high, we believe. Also, we have concerns on its huge cash position,believing that acquisitions would be a great move. The company had a cash position of aroundRp1.4tn as of Sep 2010.
Merlissa P. Trisno(62-21) 350 9888. ext [email protected]
BUYBloomberg Code TSPC IJPrice, Rp 1,630Mkt Cap Rp bn 7,335Target Price, Rp 2,050
Last RecommendationMajor shareholders (%)
TSPC relative price to JCI Index
Last Recommendation
Rec. Target Price
22-Dec-10 BUY Rp 2,05007-Oct-10 BUY Rp 2,050
TSPC relative price to JCI Index
600
800
1,000
1,200
1,400
1,600
1,800
2,000
12/1
8/09
1/26
/10
2/25
/10
3/31
/10
5/3/
10
6/4/
10
7/6/
10
8/5/
10
9/7/
10
10/1
4/10
11/1
5/10
12/1
7/10
-15
10
35
60
85
TSPC (LHS) Relative to JCI Index (RHS)
%Rp
2008 2009 2010F 2011F 2012F
Sales (Rp bn) 3,634 4,498 5,357 6,008 6,762EBITDA (Rp bn) 443 516 677 772 802Net profit (Rp bn) 321 360 476 553 591Core profit (Rp bn) 306 375 477 548 571Core EPS (Rp) 68 83 106 122 127Core EPS growth (%) 8.4 8.3 8.9 9.1 8.4Core PER (x) 23.9 19.6 15.4 13.4 12.9EV/EBITDA (x) 14.2 12.0 9.0 7.6 7.0Dividend yield (%) 2.3 2.5 2.7 3.6 4.1
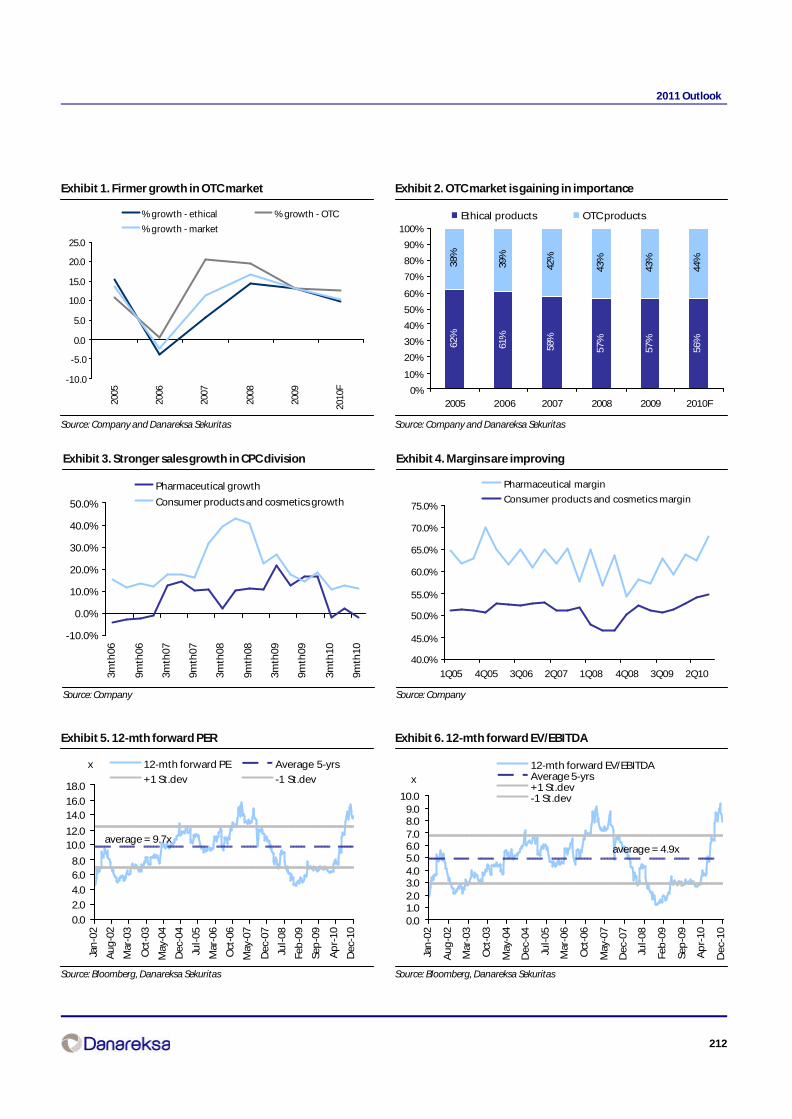
212
2011 Outlook
Exhibit 1. Firmer growth in OTC market
Source: Company and Danareksa Sekuritas
Exhibit 2. OTC market is gaining in importance
Source: Company and Danareksa Sekuritas
Exhibit 3. Stronger sales growth in CPC division
Source: Company
Exhibit 4. Margins are improving
Source: Company
-10.0
-5.0
0.0
5.0
10.0
15.0
20.0
25.0
2005
2006
2007
2008
2009
2010
F
% growth - ethical % growth - OTC
% growth - market
62%
61%
58%
57%
57%
56%
38%
39%
42%
43%
43%
44%
0%
10%
20%
30%
40%
50%
60%
70%
80%
90%
100%
2005 2006 2007 2008 2009 2010F
Ethical products OTC products
-10.0%
0.0%
10.0%
20.0%
30.0%
40.0%
50.0%
3mth
06
9mth
06
3mth
07
9mth
07
3mth
08
9mth
08
3mth
09
9mth
09
3mth
10
9mth
10
Pharmaceutical growth
Consumer products and cosmetics growth
40.0%
45.0%
50.0%
55.0%
60.0%
65.0%
70.0%
75.0%
1Q05 4Q05 3Q06 2Q07 1Q08 4Q08 3Q09 2Q10
Pharmaceutical margin
Consumer products and cosmetics margin
Exhibit 5. 12-mth forward PER
Source: Bloomberg, Danareksa Sekuritas
Exhibit 6. 12-mth forward EV/EBITDA
Source: Bloomberg, Danareksa Sekuritas
0.0
2.0
4.0
6.08.0
10.012.0
14.016.0
18.0
Jan
-02
Au
g-0
2
Mar
-03
Oct
-03
May
-04
Dec
-04
Jul-
05
Mar
-06
Oct
-06
May
-07
Dec
-07
Jul-
08
Feb
-09
Sep
-09
Ap
r-10
Dec
-10
12-mth forward PE Average 5-yrs
+1 St.dev -1 St.dev
x
average = 9.7x
0.01.02.03.04.05.06.07.08.09.0
10.0
Jan
-02
Au
g-0
2
Mar
-03
Oct
-03
May
-04
De
c-0
4
Jul-
05
Mar
-06
Oct
-06
May
-07
De
c-0
7
Jul-
08
Feb
-09
Sep
-09
Ap
r-1
0
De
c-1
0
12-mth forward EV/EBITDAAverage 5-yrs+1 St.dev-1 St.dev
x
average = 4.9x
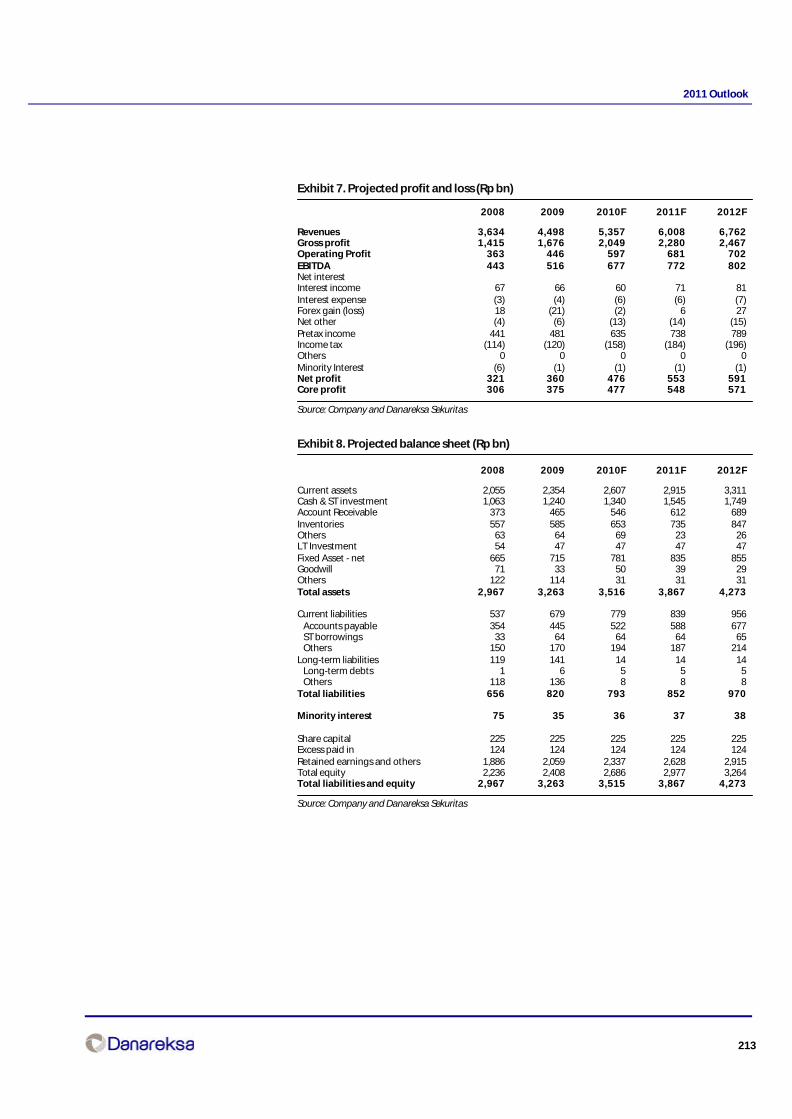
213
2011 Outlook
Exhibit 7. Projected profit and loss (Rp bn)
2008 2009 2010F 2011F 2012F
Revenues 3,634 4,498 5,357 6,008 6,762Gross profit 1,415 1,676 2,049 2,280 2,467Operating Profit 363 446 597 681 702EBITDA 443 516 677 772 802Net interestInterest income 67 66 60 71 81Interest expense (3) (4) (6) (6) (7)Forex gain (loss) 18 (21) (2) 6 27Net other (4) (6) (13) (14) (15)Pretax income 441 481 635 738 789Income tax (114) (120) (158) (184) (196)Others 0 0 0 0 0Minority Interest (6) (1) (1) (1) (1)Net profit 321 360 476 553 591Core profit 306 375 477 548 571
Source: Company and Danareksa Sekuritas
Exhibit 8. Projected balance sheet (Rp bn)
2008 2009 2010F 2011F 2012F
Current assets 2,055 2,354 2,607 2,915 3,311Cash & ST investment 1,063 1,240 1,340 1,545 1,749Account Receivable 373 465 546 612 689Inventories 557 585 653 735 847Others 63 64 69 23 26LT Investment 54 47 47 47 47Fixed Asset - net 665 715 781 835 855Goodwill 71 33 50 39 29Others 122 114 31 31 31Total assets 2,967 3,263 3,516 3,867 4,273
Current liabilities 537 679 779 839 956 Accounts payable 354 445 522 588 677 ST borrowings 33 64 64 64 65 Others 150 170 194 187 214Long-term liabilities 119 141 14 14 14 Long-term debts 1 6 5 5 5 Others 118 136 8 8 8Total liabilities 656 820 793 852 970
Minority interest 75 35 36 37 38
Share capital 225 225 225 225 225Excess paid in 124 124 124 124 124Retained earnings and others 1,886 2,059 2,337 2,628 2,915Total equity 2,236 2,408 2,686 2,977 3,264Total liabilities and equity 2,967 3,263 3,515 3,867 4,273
Source: Company and Danareksa Sekuritas
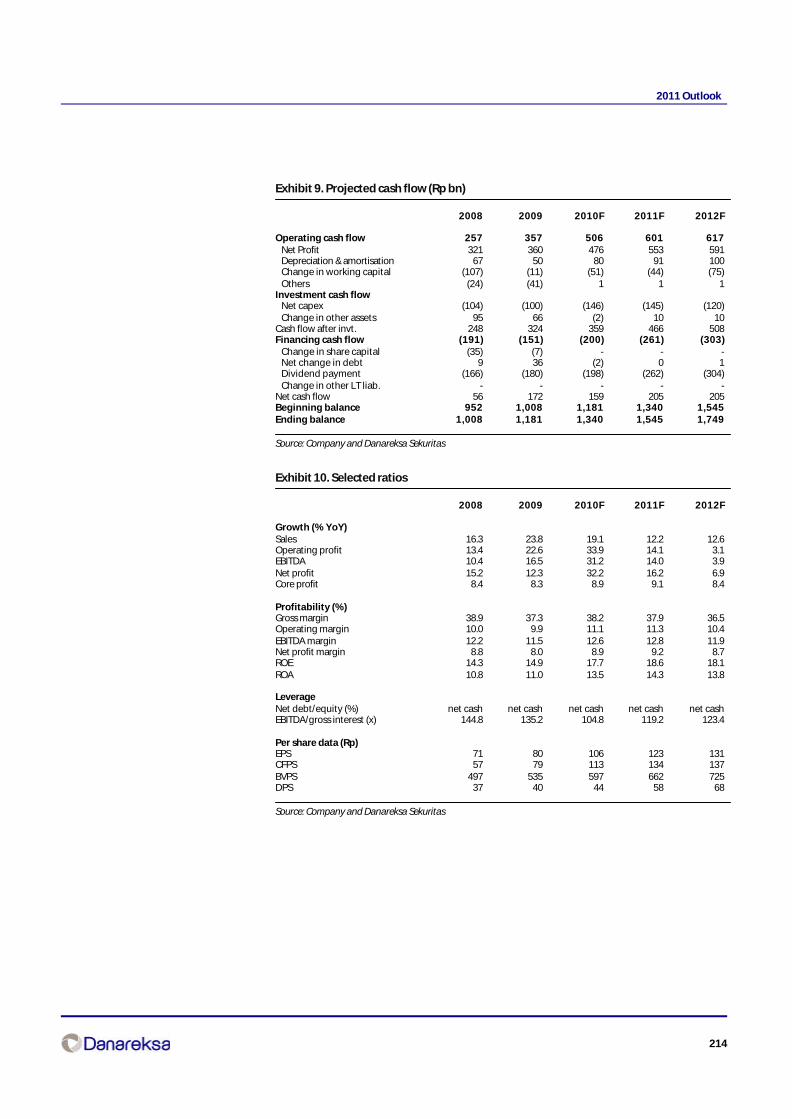
214
2011 Outlook
Exhibit 9. Projected cash flow (Rp bn)
2008 2009 2010F 2011F 2012F
Operating cash flow 257 357 506 601 617 Net Profit 321 360 476 553 591 Depreciation & amortisation 67 50 80 91 100 Change in working capital (107) (11) (51) (44) (75) Others (24) (41) 1 1 1Investment cash flow Net capex (104) (100) (146) (145) (120) Change in other assets 95 66 (2) 10 10Cash flow after invt. 248 324 359 466 508Financing cash flow (191) (151) (200) (261) (303) Change in share capital (35) (7) - - - Net change in debt 9 36 (2) 0 1 Dividend payment (166) (180) (198) (262) (304) Change in other LT liab. - - - - -Net cash flow 56 172 159 205 205Beginning balance 952 1,008 1,181 1,340 1,545Ending balance 1,008 1,181 1,340 1,545 1,749
Source: Company and Danareksa Sekuritas
Exhibit 10. Selected ratios
2008 2009 2010F 2011F 2012F
Growth (% YoY)Sales 16.3 23.8 19.1 12.2 12.6Operating profit 13.4 22.6 33.9 14.1 3.1EBITDA 10.4 16.5 31.2 14.0 3.9Net profit 15.2 12.3 32.2 16.2 6.9Core profit 8.4 8.3 8.9 9.1 8.4
Profitability (%)Gross margin 38.9 37.3 38.2 37.9 36.5Operating margin 10.0 9.9 11.1 11.3 10.4EBITDA margin 12.2 11.5 12.6 12.8 11.9Net profit margin 8.8 8.0 8.9 9.2 8.7ROE 14.3 14.9 17.7 18.6 18.1ROA 10.8 11.0 13.5 14.3 13.8
LeverageNet debt/equity (%) net cash net cash net cash net cash net cashEBITDA/gross interest (x) 144.8 135.2 104.8 119.2 123.4
Per share data (Rp)EPS 71 80 106 123 131CFPS 57 79 113 134 137BVPS 497 535 597 662 725DPS 37 40 44 58 68
Source: Company and Danareksa Sekuritas
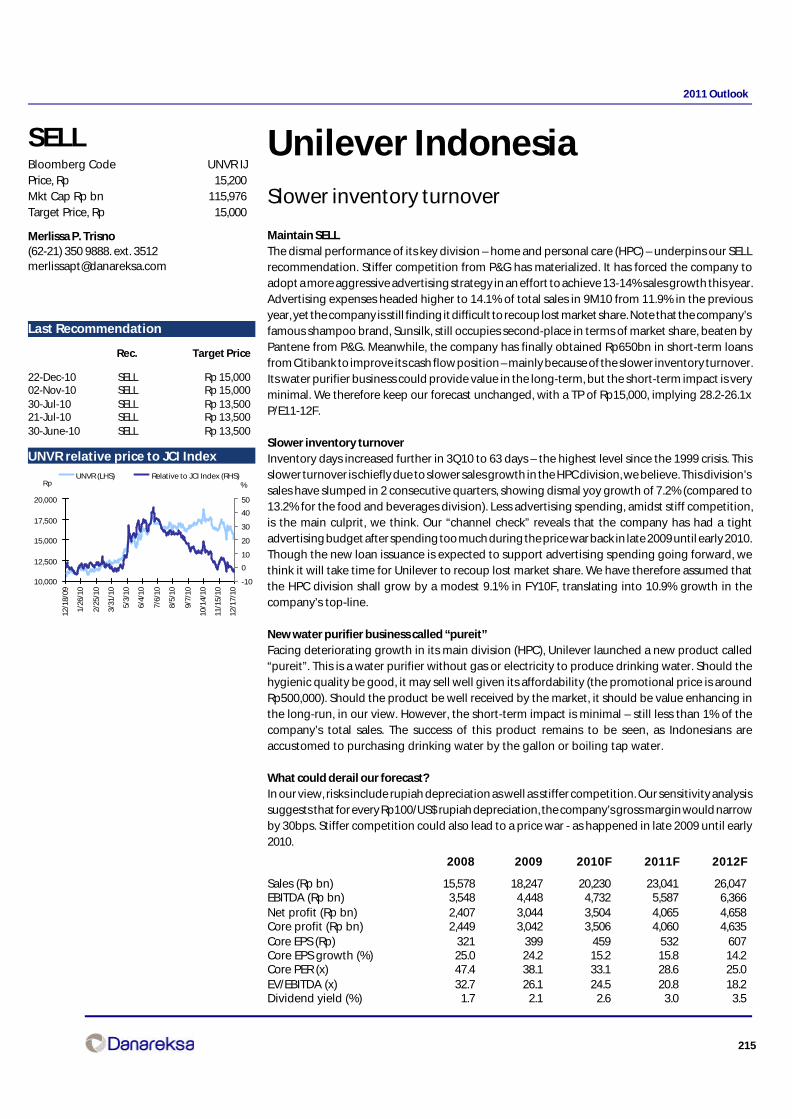
215
2011 Outlook
Unilever IndonesiaSlower inventory turnover
Maintain SELLThe dismal performance of its key division – home and personal care (HPC) – underpins our SELLrecommendation. Stiffer competition from P&G has materialized. It has forced the company toadopt a more aggressive advertising strategy in an effort to achieve 13-14% sales growth this year.Advertising expenses headed higher to 14.1% of total sales in 9M10 from 11.9% in the previousyear, yet the company is still finding it difficult to recoup lost market share. Note that the company’sfamous shampoo brand, Sunsilk, still occupies second-place in terms of market share, beaten byPantene from P&G. Meanwhile, the company has finally obtained Rp650bn in short-term loansfrom Citibank to improve its cash flow position – mainly because of the slower inventory turnover.Its water purifier business could provide value in the long-term, but the short-term impact is veryminimal. We therefore keep our forecast unchanged, with a TP of Rp15,000, implying 28.2-26.1xP/E11-12F.
Slower inventory turnoverInventory days increased further in 3Q10 to 63 days – the highest level since the 1999 crisis. Thisslower turnover is chiefly due to slower sales growth in the HPC division, we believe. This division’ssales have slumped in 2 consecutive quarters, showing dismal yoy growth of 7.2% (compared to13.2% for the food and beverages division). Less advertising spending, amidst stiff competition,is the main culprit, we think. Our “channel check” reveals that the company has had a tightadvertising budget after spending too much during the price war back in late 2009 until early 2010.Though the new loan issuance is expected to support advertising spending going forward, wethink it will take time for Unilever to recoup lost market share. We have therefore assumed thatthe HPC division shall grow by a modest 9.1% in FY10F, translating into 10.9% growth in thecompany’s top-line.
New water purifier business called “pureit”Facing deteriorating growth in its main division (HPC), Unilever launched a new product called“pureit”. This is a water purifier without gas or electricity to produce drinking water. Should thehygienic quality be good, it may sell well given its affordability (the promotional price is aroundRp500,000). Should the product be well received by the market, it should be value enhancing inthe long-run, in our view. However, the short-term impact is minimal – still less than 1% of thecompany’s total sales. The success of this product remains to be seen, as Indonesians areaccustomed to purchasing drinking water by the gallon or boiling tap water.
What could derail our forecast?In our view, risks include rupiah depreciation as well as stiffer competition. Our sensitivity analysissuggests that for every Rp100/US$ rupiah depreciation, the company’s gross margin would narrowby 30bps. Stiffer competition could also lead to a price war - as happened in late 2009 until early2010.
SELLBloomberg Code UNVR IJPrice, Rp 15,200Mkt Cap Rp bn 115,976Target Price, Rp 15,000
Last Recommendation
Rec. Target Price
22-Dec-10 SELL Rp 15,00002-Nov-10 SELL Rp 15,00030-Jul-10 SELL Rp 13,50021-Jul-10 SELL Rp 13,50030-June-10 SELL Rp 13,500
Merlissa P. Trisno(62-21) 350 9888. ext. [email protected]
UNVR relative price to JCI Index
2008 2009 2010F 2011F 2012F
Sales (Rp bn) 15,578 18,247 20,230 23,041 26,047EBITDA (Rp bn) 3,548 4,448 4,732 5,587 6,366Net profit (Rp bn) 2,407 3,044 3,504 4,065 4,658Core profit (Rp bn) 2,449 3,042 3,506 4,060 4,635Core EPS (Rp) 321 399 459 532 607Core EPS growth (%) 25.0 24.2 15.2 15.8 14.2Core PER (x) 47.4 38.1 33.1 28.6 25.0EV/EBITDA (x) 32.7 26.1 24.5 20.8 18.2Dividend yield (%) 1.7 2.1 2.6 3.0 3.5
10,000
12,500
15,000
17,500
20,000
12/1
8/09
1/26
/10
2/25
/10
3/31
/10
5/3/
10
6/4/
10
7/6/
10
8/5/
10
9/7/
10
10/1
4/10
11/1
5/10
12/1
7/10
-10
0
10
20
30
40
50
UNVR (LHS) Relative to JCI Index (RHS)%Rp

216
2011 Outlook
Exhibit 1. Advertising spending trend
Source: Company
Exhibit 2. HPC vs F&B sales growth
Source: Company
Exhibit 3. Inventory turnover days trend
Source: Company
Exhibit 4. Pure it
Source: Internet
Exhibit 5. 12-mth forward PER
Source: Bloomberg and Danareksa Sekuritas
Exhibit 6. 12-mth forward EV/EBITDA
Source: Bloomberg and Danareksa Sekuritas
-30%
-20%
-10%
0%
10%
20%
30%
40%
50%
60%
1Q05
3Q05
1Q06
3Q06
1Q07
3Q07
1Q08
3Q08
1Q09
3Q09
1Q10
3Q10
A&P, as % of sales A&P, yoy growth
A&P = advertising and promotional expense
0%
5%
10%
15%
20%
25%
30%
35%
40%
9M08 FY08 1Q09 1H09 9M09 FY09 1Q10 1H10
HPC, yoy growth F&B, yoy growth
0.0
10.0
20.0
30.0
40.0
50.0
60.0
70.0
1Q00 1H01 9M02 FY03 1Q05 1H06 9M07 FY08 1Q10
0.0
5.0
10.0
15.0
20.0
25.0
30.0
35.0
40.0
Jan
-02
Au
g-0
2
Mar
-03
Oct
-03
May
-04
Dec
-04
Jul-
05
Mar
-06
Oct
-06
May
-07
Dec
-07
Jul-
08
Feb
-09
Sep
-09
Ap
r-10
Dec
-10
12-mth forward PE Average 5-yrs
+1 St.dev -1 St.devx
average =
0.0
5.0
10.0
15.0
20.0
25.0
30.0
Jan
-02
Au
g-0
2
Mar
-03
Oct
-03
May
-04
De
c-0
4
Jul-
05
Mar
-06
Oct
-06
May
-07
De
c-0
7
Jul-
08
Feb
-09
Sep
-09
Ap
r-1
0
De
c-1
0
12-mth forward EV/EBITDAAverage 5-yrs+1 St.dev-1 St.devx
average = 13.8x

217
2011 Outlook
Exhibit 7. Projected profit and loss (Rp bn)
2008 2009 2010F 2011F 2012F
Revenues 15,578 18,247 20,230 23,041 26,047Gross profit 7,631 9,046 10,431 11,781 13,247Operating Profit 3,431 4,215 4,651 5,429 6,194EBITDA 3,548 4,448 4,732 5,587 6,366Net interest 39 31 22 (17) (17)Interest income 39 31 35 35 35Interest expense 0 0 -13 -52 -52Forex gain (loss) (60) 2 (2) 7 31Net other 38.471 0.444 0 0 0Pretax income 3,448 4,249 4,671 5,419 6,209Income tax (1,037) (1,205) (1,168) (1,355) (1,552)Others 0 0 0 0 0Minority Interest (5) 1 1 1 1Net profit 2,407 3,044 3,504 4,065 4,658
Source: Company and Danareksa Sekuritas
Exhibit 8. Projected balance sheet (Rp bn)
2008 2009 2010F 2011F 2012F
Total assets 6,505 7,485 8,898 10,057 11,354Current assets 3,103 3,599 4,215 4,502 4,890Cash & ST investment 722 858 1,054 884 1,032Account Receivable 994 1,345 1,592 1,816 1,950Inventories 1,285 1,340 1,508 1,732 1,829Others 102 55 61 70 79LT Investment 0 0 0 0 0Fixed Asset 2,560 3,036 3,989 4,901 5,851Others 842 850 694 654 614Total liabilities 3,404 3,782 4,736 5,333 6,037Current liabilities 3,091 3,455 4,396 4,944 5,594 Accounts payable 1,097 1,430 1,580 1,816 2,133 ST borrowings 0 0 650 650 650 Others 1,994 2,025 2,166 2,478 2,810Long-term liabilities 313 327 339 389 443 Long-term debts 0 0 0 0 0 Others 313 327 339 389 443Shareholder’s equity 3,100 3,703 4,163 4,724 5,317
Source: Company and Danareksa Sekuritas

218
2011 Outlook
Exhibit 9. Projected cash flow (Rp bn)
2008 2009 2010F 2011F 2012F
Operating cash flow 2,588 3,240 3,415 4,274 5,199 Operating Profit 3,431 4,215 4,651 5,429 6,194 Depreciation & amortisation 117 233 81 159 171 Change in working capital 92 4 (129) 91 410 Tax payment (1,037) (1,205) (1,168) (1,355) (1,552) Others (15) (6) (20) (49) (25)Investment cash flow (851) (677) (837) (989) (1,040) Net capex (449) (668) (994) (1,030) (1,080) Change in other assets (403) (9) 156 40 40Cash flow after invt. 1,736 2,564 2,578 3,285 4,159Financing cash flow (1,899) (2,428) (2,382) (3,455) (4,011) Change in share capital (1,999) (2,442) (3,044) (3,504) (4,065) Net change in debt 0 0 650 0 0 Change in other LT liab. 100 14 12 49 55Net cash flow (163) 136 196 (170) 148Cash balance, beginning 885 722 858 1,054 884Cash balance, ending 722 858 1,054 884 1,032
Source: Company and Danareksa Sekuritas
Exhibit 10. Selected ratios
2008 2009 2010F 2011F 2012FGrowth, %Sales 24.2 17.1 10.9 13.9 13.0EBIT 23.5 22.8 10.4 16.7 14.1EBITDA 22.9 25.4 6.4 18.1 13.9Net Profit 22.5 26.5 15.1 16.0 14.6
Profitability (%)Gross margin 49.0 49.6 51.6 51.1 50.9Operating margin 22.0 23.1 23.0 23.6 23.8EBITDA margin 22.8 24.4 23.4 24.2 24.4Net Profit margin 15.5 16.7 17.3 17.6 17.9ROE 83.1 89.5 89.1 91.5 92.8ROA 40.7 43.5 42.8 42.9 43.5
LeverageNet debt/equity (%) net cash net cash net cash net cash net cashEBITDA/Gross Interest (X) nm nm nm nm nm
Per share data (Rp)EPS 315 399 459 533 610CFPS 346 430 453 566 687BVPS 406 485 546 619 697DPS 262 320 399 459 533
Source: Company and Danareksa Sekuritas
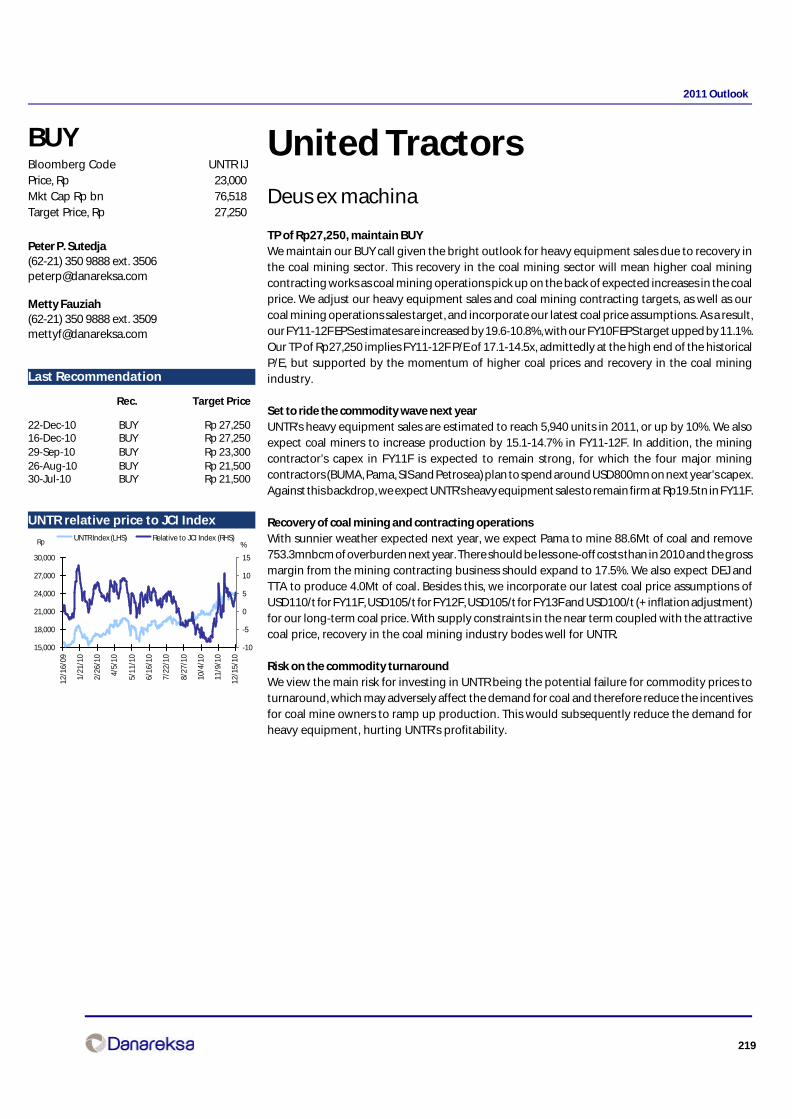
219
2011 Outlook
United TractorsDeus ex machina
TP of Rp27,250, maintain BUYWe maintain our BUY call given the bright outlook for heavy equipment sales due to recovery inthe coal mining sector. This recovery in the coal mining sector will mean higher coal miningcontracting works as coal mining operations pick up on the back of expected increases in the coalprice. We adjust our heavy equipment sales and coal mining contracting targets, as well as ourcoal mining operations sales target, and incorporate our latest coal price assumptions. As a result,our FY11-12F EPS estimates are increased by 19.6-10.8%, with our FY10F EPS target upped by 11.1%.Our TP of Rp27,250 implies FY11-12F P/E of 17.1-14.5x, admittedly at the high end of the historicalP/E, but supported by the momentum of higher coal prices and recovery in the coal miningindustry.
Set to ride the commodity wave next yearUNTR’s heavy equipment sales are estimated to reach 5,940 units in 2011, or up by 10%. We alsoexpect coal miners to increase production by 15.1-14.7% in FY11-12F. In addition, the miningcontractor’s capex in FY11F is expected to remain strong, for which the four major miningcontractors (BUMA, Pama, SIS and Petrosea) plan to spend around USD800mn on next year’s capex.Against this backdrop, we expect UNTR’s heavy equipment sales to remain firm at Rp19.5tn in FY11F.
Recovery of coal mining and contracting operationsWith sunnier weather expected next year, we expect Pama to mine 88.6Mt of coal and remove753.3mnbcm of overburden next year. There should be less one-off costs than in 2010 and the grossmargin from the mining contracting business should expand to 17.5%. We also expect DEJ andTTA to produce 4.0Mt of coal. Besides this, we incorporate our latest coal price assumptions ofUSD110/t for FY11F, USD105/t for FY12F, USD105/t for FY13F and USD100/t (+ inflation adjustment)for our long-term coal price. With supply constraints in the near term coupled with the attractivecoal price, recovery in the coal mining industry bodes well for UNTR.
Risk on the commodity turnaroundWe view the main risk for investing in UNTR being the potential failure for commodity prices toturnaround, which may adversely affect the demand for coal and therefore reduce the incentivesfor coal mine owners to ramp up production. This would subsequently reduce the demand forheavy equipment, hurting UNTR’s profitability.
Metty Fauziah(62-21) 350 9888 ext. [email protected]
BUYBloomberg Code UNTR IJPrice, Rp 23,000Mkt Cap Rp bn 76,518Target Price, Rp 27,250
Peter P. Sutedja(62-21) 350 9888 ext. [email protected]
Last Recommendation
Rec. Target Price
22-Dec-10 BUY Rp 27,25016-Dec-10 BUY Rp 27,25029-Sep-10 BUY Rp 23,30026-Aug-10 BUY Rp 21,50030-Jul-10 BUY Rp 21,500
UNTR relative price to JCI Index
15,000
18,000
21,000
24,000
27,000
30,000
12/1
6/09
1/21
/10
2/26
/10
4/5/
10
5/11
/10
6/16
/10
7/22
/10
8/27
/10
10/4
/10
11/9
/10
12/1
5/10
-10
-5
0
5
10
15
UNTR Index (LHS) Relative to JCI Index (RHS)%Rp

220
2011 Outlook
Exhibit 1. Sensitivity of heavy equipment sales to UNTR’sFY11F core profit
UNTR FY11F Core profit ChangeRp bn %
Base case + 20% 5,721.2 7.8Base case + 10% 5,514.2 3.9Base case + 0% 5,307.3 0.0Base case - 10% 5,100.4 -3.9Base case - 20% 4,893.4 -7.8
Note: Base case of heavy equipments sales of 5,940 units in FY11F
Source: Danareksa
Exhibit 2. Sensitivity of coal price to UNTR’s FY11F core profit
UNTR FY11F Core profit ChangeRp bn %
Base case + 20% 5,897.7 11.1Base case + 10% 5,602.5 5.6Base case + 0% 5,307.3 0.0Base case - 10% 5,012.1 -5.6Base case - 20% 4,716.9 -11.1
Note: Base case of coal price of USD110/t in FY11F
Source: Danareksa
Exhibit 3. Sensitivity of coal production and overburden removal done by Pama to UNTR’s FY11F core profit
Overburden removalBase case - 20% Base case - 10% Base case + 0% Base case + 10% Base case + 20%
UNTR FY11F Core profit, Rp bn Base case + 20% 4,648.3 5,044.7 5,441.2 5,837.6 6,234.0 Base case + 10% 4,581.4 4,977.8 5,374.2 5,770.7 6,167.1 Base case + 0% 4,514.5 4,910.9 5,307.3 5,703.7 6,100.2 Base case - 10% 4,447.5 4,844.0 5,240.4 5,636.8 6,033.3 Base case - 20% 4,380.6 4,777.0 5,173.5 5,569.9 5,966.3
Overburden removal Change Base case - 20% Base case - 10% Base case + 0% Base case + 10% Base case + 20% Base case + 20% -12.4% -4.9% 2.5% 10.0% 17.5% Base case + 10% -13.7% -6.2% 1.3% 8.7% 16.2% Base case + 0% -14.9% -7.5% 0.0% 7.5% 14.9% Base case - 10% -16.2% -8.7% -1.3% 6.2% 13.7% Base case - 20% -17.5% -10.0% -2.5% 4.9% 12.4%
Note: Base case of Pama coal production and overburden removal of 88.6Mt and 753.3mnbcm in FY11F
Source: Danareksa
Co
alp
rod
uct
ion
Co
alp
rod
uct
ion
Exhibit 3. UNTR’s rolling PE
Source: Company
Exhibit 4. UNTR’s rolling EV/EBITDA
Source: Company
0
4
8
12
16
20
Jan
-08
May
-08
Sep
-08
Jan
-09
May
-09
Sep
-09
Jan
-10
May
-10
Sep
-10
Rolling P/E -2 stdev -1 stdev
Average +1 stdev +2 stdev
0
2
4
6
8
10
Jan
-08
May
-08
Sep
-08
Jan
-09
May
-09
Sep
-09
Jan
-10
May
-10
Sep
-10
Rolling EV/EBITDA -2 stdev -1 stdev
Average +1 stdev +2 stdev
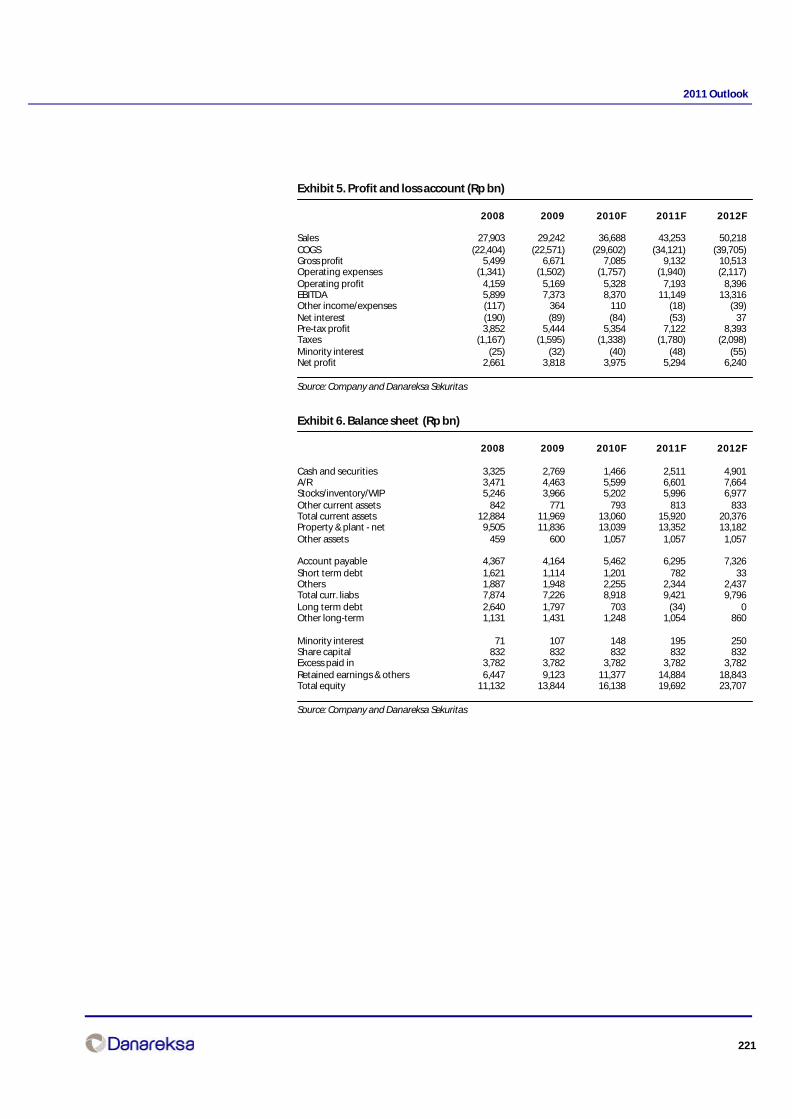
221
2011 Outlook
Exhibit 5. Profit and loss account (Rp bn)
2008 2009 2010F 2011F 2012F
Sales 27,903 29,242 36,688 43,253 50,218COGS (22,404) (22,571) (29,602) (34,121) (39,705)Gross profit 5,499 6,671 7,085 9,132 10,513Operating expenses (1,341) (1,502) (1,757) (1,940) (2,117)Operating profit 4,159 5,169 5,328 7,193 8,396EBITDA 5,899 7,373 8,370 11,149 13,316Other income/expenses (117) 364 110 (18) (39)Net interest (190) (89) (84) (53) 37Pre-tax profit 3,852 5,444 5,354 7,122 8,393Taxes (1,167) (1,595) (1,338) (1,780) (2,098)Minority interest (25) (32) (40) (48) (55)Net profit 2,661 3,818 3,975 5,294 6,240
Source: Company and Danareksa Sekuritas
Exhibit 6. Balance sheet (Rp bn)
2008 2009 2010F 2011F 2012F
Cash and securities 3,325 2,769 1,466 2,511 4,901A/R 3,471 4,463 5,599 6,601 7,664Stocks/inventory/WIP 5,246 3,966 5,202 5,996 6,977Other current assets 842 771 793 813 833Total current assets 12,884 11,969 13,060 15,920 20,376Property & plant - net 9,505 11,836 13,039 13,352 13,182Other assets 459 600 1,057 1,057 1,057
Account payable 4,367 4,164 5,462 6,295 7,326Short term debt 1,621 1,114 1,201 782 33Others 1,887 1,948 2,255 2,344 2,437Total curr. liabs 7,874 7,226 8,918 9,421 9,796Long term debt 2,640 1,797 703 (34) 0Other long-term 1,131 1,431 1,248 1,054 860
Minority interest 71 107 148 195 250Share capital 832 832 832 832 832Excess paid in 3,782 3,782 3,782 3,782 3,782Retained earnings & others 6,447 9,123 11,377 14,884 18,843Total equity 11,132 13,844 16,138 19,692 23,707
Source: Company and Danareksa Sekuritas

222
2011 Outlook
Exhibit 7. Cash flow (Rp bn)
2008 2009 2010F 2011F 2012F
Net Income 2,661 3,818 3,975 5,294 6,240Deprec n amortization 1,740 2,204 3,042 3,956 4,920Adjustment to work cap (1,307) 222 (743) (882) (942)Differed cost (56) (33) 0 0 0Others 744 (238) 1 66 95Operating cash flow 3,783 5,972 6,276 8,434 10,313
PPE (5,030) (3,153) (4,245) (4,270) (4,750)Investment in share 0 14 (456) 0 0Others 79 78 0 0 0Investing cash flow (4,951) (3,060) (4,702) (4,270) (4,750)
Bank loans 815 (675) (1,077) (928) (944)Minority interest in subs 25 32 40 48 55Dividend paid (767) (1,175) (1,545) (1,740) (2,225)Financing cash flow 2,853 (2,208) (2,751) (3,114) (3,169)
Net change in cash 1,684 703 (1,178) 1,050 2,394Net cash (debt) at start 1,062 3,325 2,769 1,466 2,511Net cash (debt) at end 2,746 4,028 1,466 2,511 4,901
Source: Company and Danareksa Sekuritas
Exhibit 8. Ratios
2008 2009 2010F 2011F 2012F
Gross margin, % 19.7 22.8 19.3 21.1 20.9Operating margin, % 14.9 17.7 14.5 16.6 16.7EBITDA margin, % 21.1 25.2 22.8 25.8 26.5Net margin, % 9.5 13.1 10.8 12.2 12.4ROE, % 23.9 27.6 24.6 26.9 26.3ROA, % 11.6 15.6 14.6 17.5 18.0Current ratio, x 1.6 1.7 1.5 1.7 2.1Net gearing, % 8.4 1.3 2.9 (8.8) (20.4)
Source: Company and Danareksa Sekuritas

223
2011 Outlook
XL AxiataStrong turn around
BUYConsistent implementation of an innovative pricing strategy was the key success factor for XLAxiata in beating off the competition. With significant idle capacity, XL’s pricing strategy was toincrease the network utilization rate. By doing so, XL Axiata was able to crank up its revenuegeneration while maintaining flat costs. As a result, the EBITDA margin improved significantly.During 9M10, XL Axiata was the only operator with double digit revenues growth and marginsexpansion. Going forward, we think the company should be able to sustain its performance. Werecommend a BUY on the stock with a Target Price of Rp7,500.
Adopting the right strategyXL Axiata has adopted the right strategy in a highly competitive market. However, the companydid get some help from its parent company with the rights issue to strengthen its capital structure.Recall that XL Axiata is the only operator to hold a rights issue. Having abundant idle networkcapacity, XL Axiata aimed to improve its network utilization rate - especially for the off peak hours.Hence, an aggressive marketing program was devised to attract usage to off peak hours. Thishelped give rise to additional revenues whilst keeping costs steady, thereby boosting the bottomline. As a result, XL Axiata was able to expand its EBITDA margin to 52.4% in September 2010 froman average of 49.5% in FY09. The total number of subscribers stood at 38.5mn in September 2009,making the company a very serious contender to take second spot from Indosat.
Healthier balance sheetThanks to the support from the parent company in subscribing to the rights issue back in FY09,XL Axiata’s net gearing has plummeted to 90% in September 2010 from 310% in the previous year.With a stronger balance sheet, XL Axiata was able to implement the right strategy of reduced capexand aggressive marketing programs to boost the utilization rate, subsequently leading toimproved profitability. As a result, the ROE improved significantly to 36.8% in September 2009 from20.8% in 4Q09.
Risk: Stiff competitionSo far, XL Axiata has been able to remain competitive. Net additions have been steady since FY09’sprice war. However, given the dominance of prepaid services, it is easy for subscribers to migrateto other operators. Hence, operators must compete not only to acquire new subscribers but alsoto retain existing ones. In this regard, XL Axiata has become known for its pricing innovationoffering good value for money. At the moment XL also has the capacity to offer different pricingfor different regions and different time bands. If that capacity is exhausted, however, then XL Axiatawill need to invest more funds in order to keep up with the market growth, even though investmentcosts are high relative to the additional revenues from marginal subscribers.
Chandra S Pasaribu(62-21) 351 [email protected]
BUYBloomberg Code EXCL IJPrice, Rp 5,350Mkt Cap Rp bn 45,518Target Price, Rp 7,500
Last Recommendation
Rec. Target Price
22-Dec-10 BUY Rp 7,50022-Nov-10 BUY Rp 6,85012-May-10 BUY Rp 4,20015-Feb-10 BUY Rp 3,25008-Feb-10 BUY Rp 3,250
EXCL relative price to JCI Index
1,500
2,500
3,500
4,500
5,500
6,500
12/1
8/09
2/4/
10
3/15
/10
4/22
/10
6/1/
10
7/7/
10
8/12
/10
9/27
/10
11/2
/10
12/1
0/10
-10
20
50
80
110
140
EXCL (LHS) Relative to JCI Index (RHS)%Rp
2008 2009 2010F 2011F 2012F
Revenue, Rp bn 12,156 13,880 17,170 19,238 20,911EBITDA, Rp bn 5,088 6,166 8,759 10,043 10,680Net profit, Rp bn (15) 1,710 2,987 4,122 4,585Core profit, Rp bn 718 606 3,315 4,158 4,706Core EPS, Rp 101 85 390 489 553Core EPS growth, % -15.4 -16.4 359.7 25.4 13.2BVPS, Rp 608 1,232 1,311 1,698 2,129Core PER, x 52.8 63.1 13.7 10.9 9.7Yield, % 0.0 0.5 1.3 1.8 2.0EV/EBITDA, x 10.9 8.3 6.4 5.3 4.7
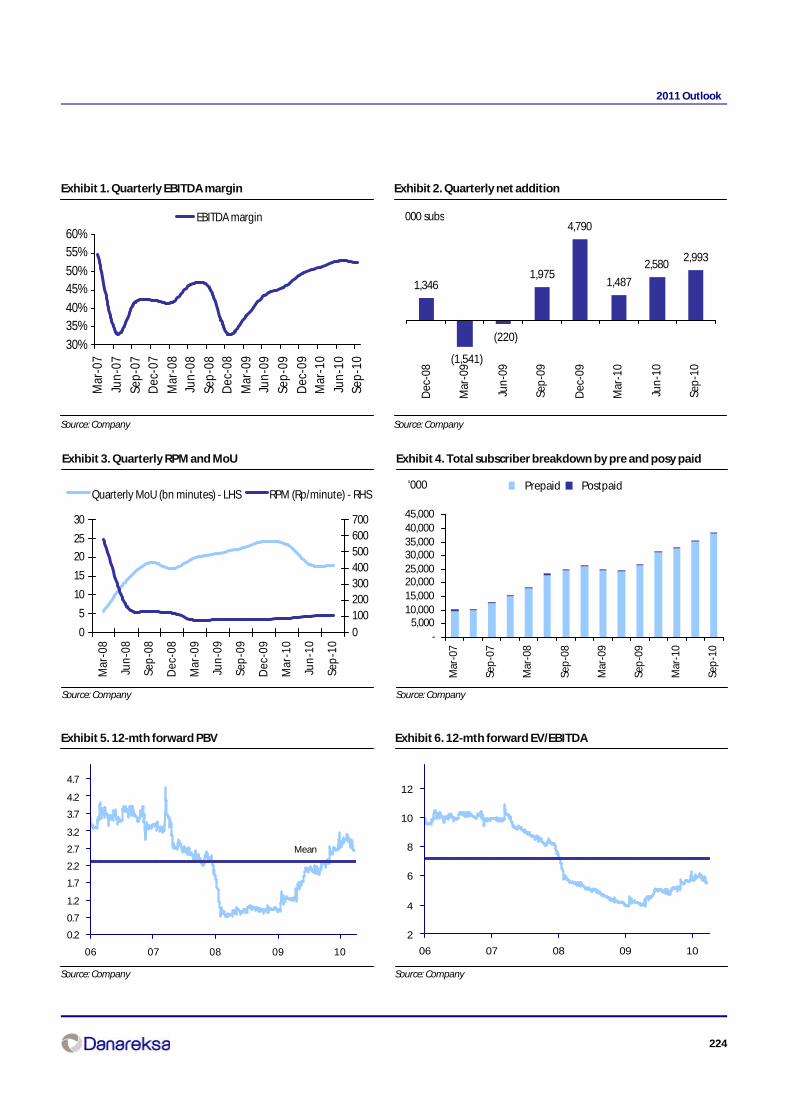
224
2011 Outlook
Exhibit 1. Quarterly EBITDA margin
Source: Company
Exhibit 2. Quarterly net addition
Source: Company
Exhibit 3. Quarterly RPM and MoU
Source: Company
Exhibit 4. Total subscriber breakdown by pre and posy paid
Source: Company
Exhibit 5. 12-mth forward PBV
Source: Company
Exhibit 6. 12-mth forward EV/EBITDA
Source: Company
30%
35%40%
45%50%
55%60%
Mar
-07
Jun-
07
Sep
-07
Dec
-07
Mar
-08
Jun-
08
Sep
-08
Dec
-08
Mar
-09
Jun-
09
Sep
-09
Dec
-09
Mar
-10
Jun-
10Se
p-1
0
EBITDA margin
1,346
(1,541)
(220)
1,975
4,790
1,487
2,5802,993
Dec
-08
Mar
-09
Jun-
09
Sep
-09
Dec
-09
Mar
-10
Jun-
10
Sep
-10
000 subs
0
5
10
15
20
25
30
Mar
-08
Jun
-08
Sep
-08
Dec
-08
Mar
-09
Jun
-09
Sep
-09
Dec
-09
Mar
-10
Jun
-10
Sep
-10
0
100200300400500600700
Quarterly MoU (bn minutes) - LHS RPM (Rp/minute) - RHS
-5,000
10,00015,00020,00025,00030,00035,00040,00045,000
Mar
-07
Sep
-07
Mar
-08
Sep
-08
Mar
-09
Sep
-09
Mar
-10
Sep
-10
Prepaid Postpaid'000
0.2
0.7
1.2
1.7
2.2
2.7
3.2
3.7
4.2
4.7
06 07 08 09 10
Mean
2
4
6
8
10
12
06 07 08 09 10
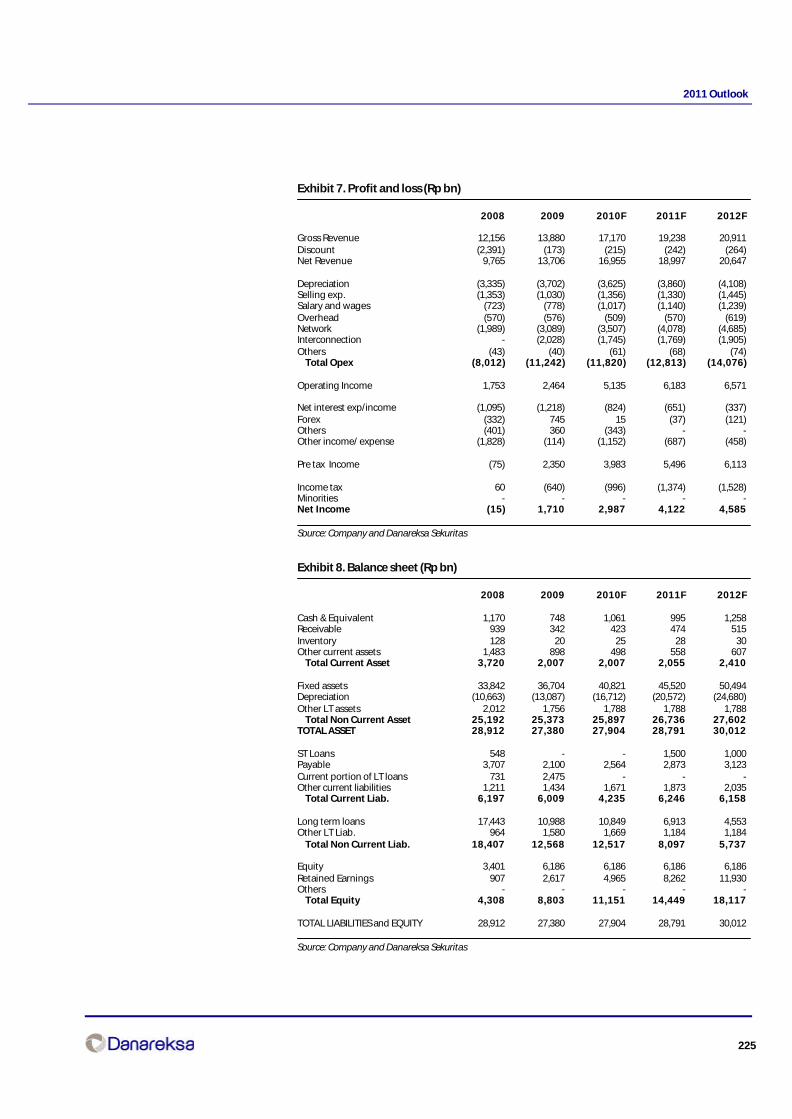
225
2011 Outlook
Exhibit 7. Profit and loss (Rp bn)
2008 2009 2010F 2011F 2012F
Gross Revenue 12,156 13,880 17,170 19,238 20,911Discount (2,391) (173) (215) (242) (264)Net Revenue 9,765 13,706 16,955 18,997 20,647
Depreciation (3,335) (3,702) (3,625) (3,860) (4,108)Selling exp. (1,353) (1,030) (1,356) (1,330) (1,445)Salary and wages (723) (778) (1,017) (1,140) (1,239)Overhead (570) (576) (509) (570) (619)Network (1,989) (3,089) (3,507) (4,078) (4,685)Interconnection - (2,028) (1,745) (1,769) (1,905)Others (43) (40) (61) (68) (74) Total Opex (8,012) (11,242) (11,820) (12,813) (14,076)
Operating Income 1,753 2,464 5,135 6,183 6,571
Net interest exp/income (1,095) (1,218) (824) (651) (337)Forex (332) 745 15 (37) (121)Others (401) 360 (343) - -Other income/ expense (1,828) (114) (1,152) (687) (458)
Pre tax Income (75) 2,350 3,983 5,496 6,113
Income tax 60 (640) (996) (1,374) (1,528)Minorities - - - - -Net Income (15) 1,710 2,987 4,122 4,585
Source: Company and Danareksa Sekuritas
Exhibit 8. Balance sheet (Rp bn)
2008 2009 2010F 2011F 2012F
Cash & Equivalent 1,170 748 1,061 995 1,258Receivable 939 342 423 474 515Inventory 128 20 25 28 30Other current assets 1,483 898 498 558 607 Total Current Asset 3,720 2,007 2,007 2,055 2,410
Fixed assets 33,842 36,704 40,821 45,520 50,494Depreciation (10,663) (13,087) (16,712) (20,572) (24,680)Other LT assets 2,012 1,756 1,788 1,788 1,788 Total Non Current Asset 25,192 25,373 25,897 26,736 27,602TOTAL ASSET 28,912 27,380 27,904 28,791 30,012
ST Loans 548 - - 1,500 1,000Payable 3,707 2,100 2,564 2,873 3,123Current portion of LT loans 731 2,475 - - -Other current liabilities 1,211 1,434 1,671 1,873 2,035 Total Current Liab. 6,197 6,009 4,235 6,246 6,158
Long term loans 17,443 10,988 10,849 6,913 4,553Other LT Liab. 964 1,580 1,669 1,184 1,184 Total Non Current Liab. 18,407 12,568 12,517 8,097 5,737
Equity 3,401 6,186 6,186 6,186 6,186Retained Earnings 907 2,617 4,965 8,262 11,930Others - - - - - Total Equity 4,308 8,803 11,151 14,449 18,117
TOTAL LIABILITIES and EQUITY 28,912 27,380 27,904 28,791 30,012
Source: Company and Danareksa Sekuritas

226
2011 Outlook
Exhibit 9. Cash flow (Rp bn)
2008 2009 2010F 2011F 2012F
EBT (161) 1,891 2,946 4,122 4,585Depreciation 3,056 2,425 3,625 3,860 4,108Tax (526) 923 511 18 15Changes of W/C 310 (818) 638 378 306 CFO 2,678 4,421 7,720 8,378 9,014
Capex (10,925) (2,348) (4,005) (4,699) (4,974)Investment (175) (257) (144) - -Others (66) - - - - CFI (11,166) (2,605) (4,149) (4,699) (4,974)
Short term debt 548 (548) - 1,500 (500)Current portion LT (2,953) 1,911 (2,642) - -LT Loan 11,254 (6,205) (18) (4,421) (2,360)Equity - 2,786 - - -Dividend 5 (182) (597) (824) (917)Others - - - - - CFF 8,853 (2,237) (3,257) (3,745) (3,777)
Change in Cash 364 (422) 313 (67) 264
Source: Company and Danareksa Sekuritas
Exhibit 10. Ratios (Rp bn)
2008 2009 2010F 2011F 2012F
ROE, % -0.1 6.1 10.8 14.5 15.6ROA, % -0.3 26.1 29.9 32.2 28.2EBITDA margin, % 41.9 44.4 51.0 52.2 51.1Operating margin, % 14.4 17.8 29.9 32.1 31.4Net margin, % -0.1 12.3 17.4 21.4 21.9
Receivable TO (days) 28.18 8.99 8.99 8.99 8.99Payable TO (days) 97.60 54.51 54.51 54.51 54.51Inventory TO (days) 3.83 0.52 0.52 0.52 0.52
Debt to Equity (X) 5.7 2.1 1.5 1.0 0.7Interest Coverage Ratio (X) 0.9 2.8 5.7 9.1 17.5Net Gearing (%) 410.0 148.6 92.1 51.3 23.7
Current Ratio (X) 0.6 0.3 0.5 0.3 0.4Quick Ratio (X) 0.6 0.3 0.5 0.3 0.4
Source: Company and Danareksa Sekuritas

227
2011 Outlook
DISCLAIMER
The information contained in this report has been taken from sources which we deem reliable. However, none of P.T. Danareksa Sekuritas and/or its affiliatedcompanies and/or their respective employees and/or agents makes any representation or warranty (express or implied) or accepts any responsibility or liability asto, or in relation to, the accuracy or completeness of the information and opinions contained in this report or as to any information contained in this report or anyother such information or opinions remaining unchanged after the issue hereof.
This document does not constitute, nor is it calculated to invite, an offer or invitation to subscribe for or purchase any securities or financial instruments and neitherthis document nor anything contained herein shall form the basis for or be relied upon in connection with any contract or commitment whatsoever. To the extentthat any securities or financial instruments or issues are discussed in this report, please note that P.T. Danareksa Sekuritas and/or its affiliated companies and/ortheir respective employees and/or agents may from time to time make markets in such securities or financial instruments, hold share options, rights and/orwarrants in respect thereof and may, as principal or agent, buy or sell such securities or financial instruments. No action has been or will be taken in any country orjurisdiction that would permit a public offering of any investments referred to in this document, or possession or distribution of this document, or any otheroffering or publicity material relating to any company or investment mentioned in this document, in any country or jurisdiction where action for that purpose isrequired.
We have no responsibility to update this report in respect of events and circumstances occurring after the date of this report. We expressly disclaim anyresponsibility or liability (express or implied) of P.T. Danareksa Sekuritas and/or its affiliated companies and/or their respective employees and/or agentswhatsoever and howsoever arising (including, without limitation for any claims, proceedings, actions, suits, losses, expenses, damages or costs) which may bebrought against or suffered by any person as a result of acting in reliance upon the whole or any part of the contents of this report and neither P.T. DanareksaSekuritas and/or its affiliated companies and/or their respective employees and/or agents accepts liability for any errors, omissions or mis-statements, negligent orotherwise, in this report and any liability in respect of this report or any inaccuracy herein or omission herefrom which might otherwise arise is hereby expresslydisclaimed.
Accordingly, none of P.T Danareksa Sekuritas and/or its affiliated companies and/or their respective employees and/or agents shall be liable for any direct, indirector consequential loss or damage suffered by any person as a result of relying on any statement or omission in any information contained in this report. Theinformation contained in this report is not to be taken as any recommendation made by P.T. Danareksa Sekuritas and/or its affiliated companies and/or theiremployees and/or agents to enter into any agreement with regard to any investment mentioned in this document. This report is prepared for general circulation.It does not have regard to the specific person who may receive this report. In considering any investment you should make your own independent assessmentand seek your own professional financial and legal advice. U.S. Distribution: This report is only intended for distribution in the United States to “major U.S.institutional investors” as defined by Rule 15a-6 under the Securities Exchange Act of 1934 and may not be reproduced, transmitted and/or distributed, directly orindirectly, to any other person in the United States.
Hong Kong Distribution: This document has not been registered as a prospectus with the Registrar of Companies in Hong Kong and may not be issued or passedon in Hong Kong to any persons other than to a person whose ordinary business is to buy and sell shares or debentures. UK Distribution : This document has notbeen approved as an investment advertisement in the United Kingdom pursuant to Section 57 of the Financial Services Act 1986 and may not be issued orpassed on in the United Kingdom except to a person who is of a kind described in Article 11(3) of the Financial Services Act 1986 (Investment Advertisements)(Exemption) Order 1996 or is a person to whom the document may otherwise lawfully be issued or passed on. At your request, this report is being provided to youas a potential investor who is a person of a kind described in Article 11(3) of the Financial Services Act 1986 (Investment Advertisement) (Exemption) Order 1995despite our pointing out to you that this report should not be relied upon by you. Accordingly any degree of reliance placed on this report in your decision tomake any investment will be at your own risk. Japanese Distribution: This report is not intended to serve as a solicitation in connection with any offering orsecondary distribution of securities under the Securities and Exchange Law, nor does it contain any ‘investment judgment’ under the Investments Advisory
