danaher corporation tom joyce, president … tax adjustments and other tax-related adjustments...
TRANSCRIPT

DANAHER CORPORATION
Tom Joyce, President & CEO
BERNSTEIN STRATEGIC DECISIONS CONFERENCE
MAY 31, 2018
2
Forward Looking StatementsStatements in this presentation that are not strictly historical, including any statements regarding events or developments that we anticipate will or may occur in the future are "forward-
looking" statements within the meaning of the federal securities laws. There are a number of important factors that could cause actual results, developments and business decisions to
differ materially from those suggested or indicated by such forward-looking statements and you should not place undue reliance on any such forward-looking statements. These factors
include, among other things deterioration of or instability in the economy, the markets we serve and the financial markets, contractions or growth rates and cyclicality of markets we
serve, competition, our ability to develop and successfully market new products and technologies and expand into new markets, the potential for improper conduct by our employees,
agents or business partners, our compliance with applicable laws and regulations (including regulations relating to medical devices and the health care industry), our ability to effectively
address cost reductions and other changes in the health care industry, our ability to successfully identify and consummate appropriate acquisitions and strategic investments and
successfully complete divestitures and other dispositions, our ability to integrate the businesses we acquire and achieve the anticipated benefits of such acquisitions, contingent
liabilities relating to acquisitions, investments and divestitures (including tax-related and other contingent liabilities relating to the distributions of each of Fortive Corporation and our
communications business), security breaches or other disruptions of our information technology systems or violations of data privacy laws, the impact of our restructuring activities on
our ability to grow, risks relating to potential impairment of goodwill and other intangible assets, currency exchange rates, tax audits and changes in our tax rate and income tax liabilities,
changes in tax laws applicable to multinational companies, litigation and other contingent liabilities including intellectual property and environmental, health and safety matters, the rights
of the United States government to use, disclose and license certain intellectual property we license if we fail to commercialize it, risks relating to product, service or software defects,
product liability and recalls, risks relating to product manufacturing, the impact of our debt obligations on our operations and liquidity, our relationships with and the performance of our
channel partners, uncertainties relating to collaboration arrangements with third parties, commodity costs and surcharges, our ability to adjust purchases and manufacturing capacity to
reflect market conditions, reliance on sole sources of supply, the impact of deregulation on demand for our products and services, labor matters, international economic, political, legal,
compliance and business factors (including the impact of the UK’s decision to leave the EU and changes in US policy stemming from the current administration, such as changes in US
trade policies and the reaction of other countries thereto), disruptions relating to man-made and natural disasters, and pension plan costs. Additional information regarding the factors
that may cause actual results to differ materially from these forward-looking statements is available in our SEC filings, including our 2017 Annual Report on Form 10-K and Quarterly
Report on Form 10-Q for the first quarter of 2018. These forward-looking statements speak only as of the date of this presentation and except to the extent required by applicable law, the
Company does not assume any obligation to update or revise any forward-looking statement, whether as a result of new information, future events and developments or otherwise.
With respect to the non-GAAP financial measures referenced in the following presentation, the accompanying information required by SEC Regulation G can be found in the back of the
presentation and in the “Investors” section of Danaher’s web site, www.danaher.com, under the heading “Quarterly Earnings.” All references in this presentation (1) to company-specific
financial metrics relate only to the continuing operations of Danaher’s business, unless otherwise noted; (2) to “growth” or other period-to-period changes refer to year-over-year
comparisons unless otherwise indicated; (3) to Operating Profit below the segment level exclude amortization; and (4) to “today” refers to the Company’s 2017 performance. We may also
describe certain products and devices which have applications submitted and pending for certain regulatory approvals.
Building a better, stronger Danaher
How we create long-term value for shareholders
What You’ll Hear Today
DBS is our competitive advantage: taking a deeper look at Leadership
3

LIFE
SCIENCESDIAGNOSTICS DENTAL
WATER QUALITY
ENVIRONMENTAL & APPLIED SOLUTIONS
All financial metrics shown reflect FY 2017 revenues
PRODUCT ID
~$5.7B ~$5.8B ~$2.8B ~$4.0B
Danaher Today
Multi-industry science & technology portfolio provides competitive advantages
4
KEY ACQUISITIONS & PORTFOLIO MOVES
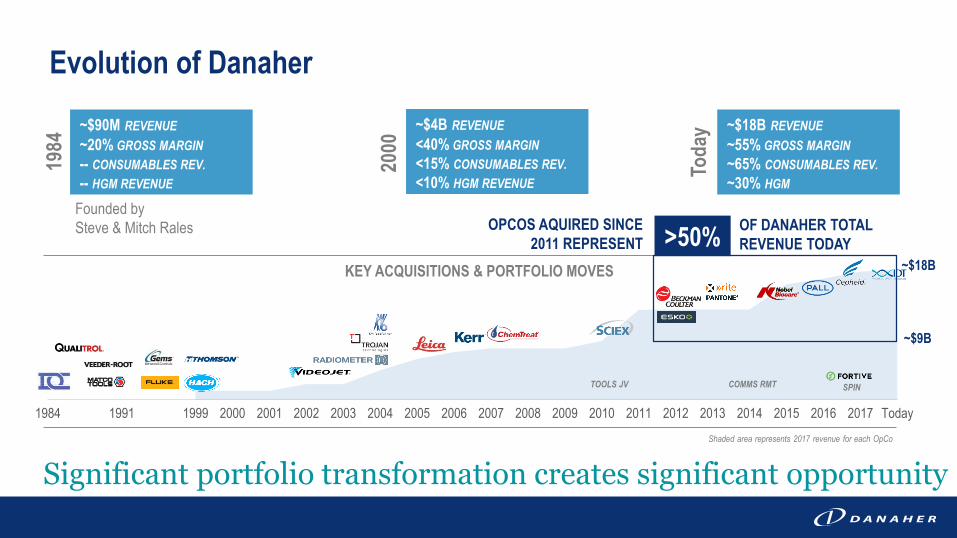
Evolution of Danaher
Significant portfolio transformation creates significant opportunity
>50%OF DANAHER TOTAL
REVENUE TODAY
~$90M REVENUE
~20% GROSS MARGIN
-- CONSUMABLES REV.
-- HGM REVENUE
~$18B REVENUE
~55% GROSS MARGIN
~65% CONSUMABLES REV.
~30% HGM
~$4B REVENUE
<40% GROSS MARGIN
<15% CONSUMABLES REV.
<10% HGM REVENUE
1984
2000
Tod
ay
Founded by
Steve & Mitch Rales OPCOS AQUIRED SINCE
2011 REPRESENT
~$18B
Shaded area represents 2017 revenue for each OpCo
~$9B
1984 1991 1999 2000 2001 2002 2003 2004 2005 2006 2007 2008 2009 2010 2011 2012 2013 2014 2015 2016 2017 Today
TOOLS JV SPINCOMMS RMT
ROW
6%NA
40%
EU
24%
HGM
30%
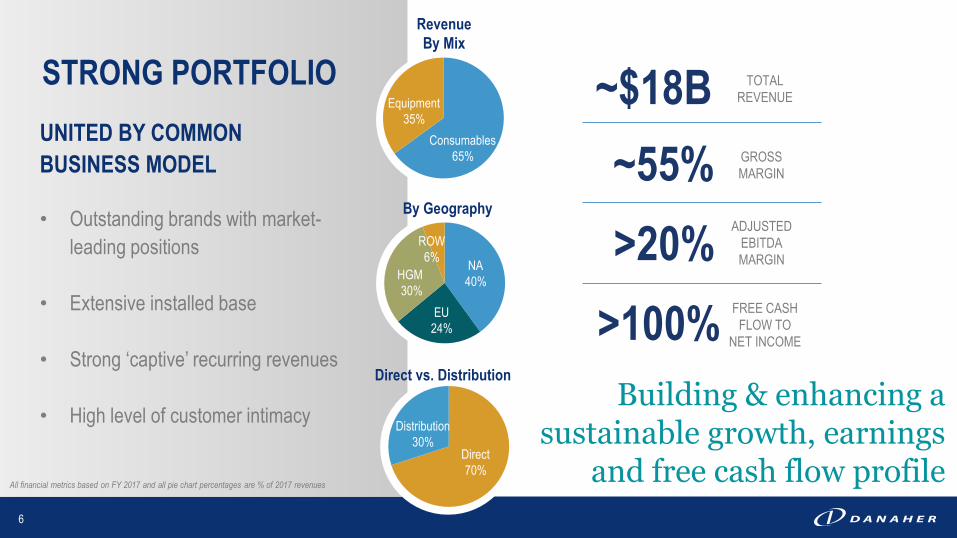
Revenue
By Mix
By Geography
Consumables
65%
Equipment
35%
GROSS
MARGIN
FREE CASH
FLOW TO
NET INCOME
~55%
>100%
UNITED BY COMMON
BUSINESS MODEL
• Outstanding brands with market-
leading positions
• Extensive installed base
• Strong ‘captive’ recurring revenues
• High level of customer intimacy
All financial metrics based on FY 2017 and all pie chart percentages are % of 2017 revenues
ADJUSTED
EBITDA
MARGIN>20%
Distribution
30%Direct
70%
Direct vs. Distribution
TOTAL
REVENUE~$18BSTRONG PORTFOLIO
Building & enhancing a sustainable growth, earnings
and free cash flow profile
6
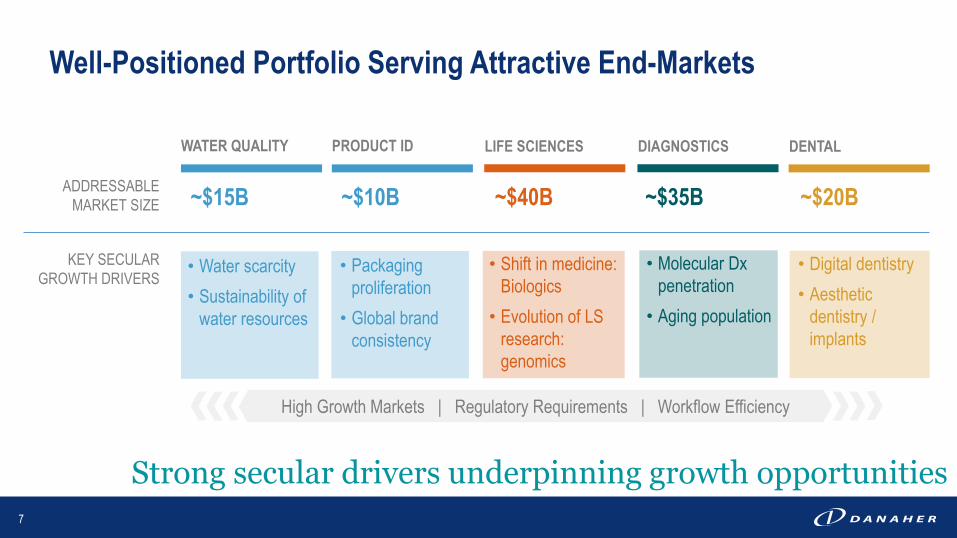
LIFE SCIENCES DIAGNOSTICS DENTAL
~$40B ~$35B ~$20B ~$15B
KEY SECULAR
GROWTH DRIVERS
ADDRESSABLE
MARKET SIZE
Strong secular drivers underpinning growth opportunities
WATER QUALITY
~$10B
PRODUCT ID
Well-Positioned Portfolio Serving Attractive End-Markets
7
• Shift in medicine:
Biologics
• Evolution of LS
research:
genomics
• Water scarcity
• Sustainability of
water resources
• Digital dentistry
• Aesthetic
dentistry /
implants
• Packaging
proliferation
• Global brand
consistency
• Molecular Dx
penetration
• Aging population
High Growth Markets | Regulatory Requirements | Workflow Efficiency

Core Revenue Growth
+Margin Expansion
+Strong Free Cash Flow
+Acquisitions
=TOP QUARTILE EPS GROWTH &
COMPOUNDING RETURNS
How We Create Value: Running the Danaher Playbook
IMPROVE COST
STRUCTURE
Balanced approach to create shareholder value
G&A
S&M
OMXCore
Growth
R&D
Gross
Margins
REINVEST
FOR GROWTH
ACCELERATE
MARGINS &
CORE GROWTH
8
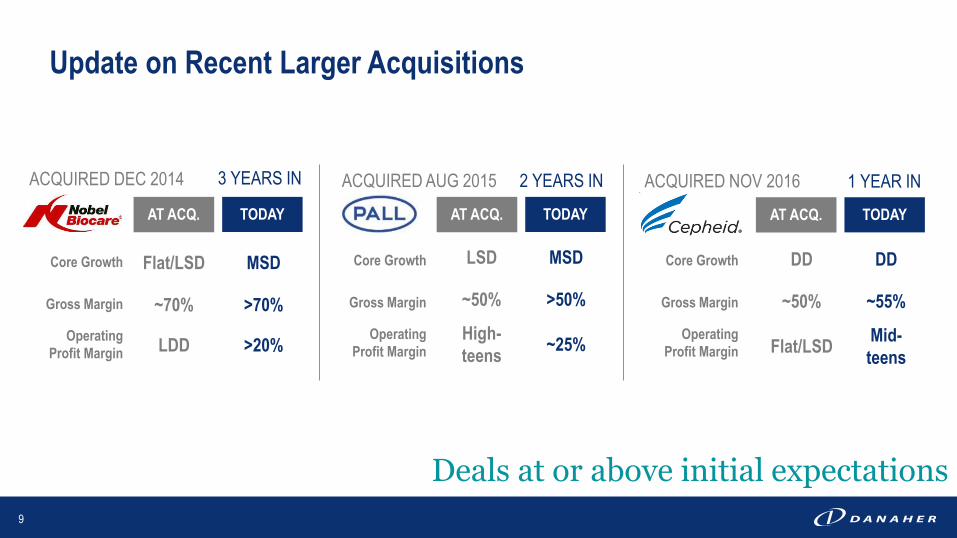
DD DD
~50% ~55%
Flat/LSDMid-
teens
AT ACQ. TODAY
1 YEAR IN
LSD MSD
~50% >50%
High-
teens~25%
Core Growth
Gross Margin
Operating
Profit Margin
Flat/LSD MSD
~70% >70%
LDD >20%
Core Growth
Gross Margin
Operating
Profit Margin
Update on Recent Larger Acquisitions
AT ACQ. TODAYAT ACQ. TODAY
Deals at or above initial expectations
2 YEARS IN3 YEARS INACQUIRED DEC 2014 ACQUIRED AUG 2015 ACQUIRED NOV 2016
Core Growth
Gross Margin
Operating
Profit Margin
9
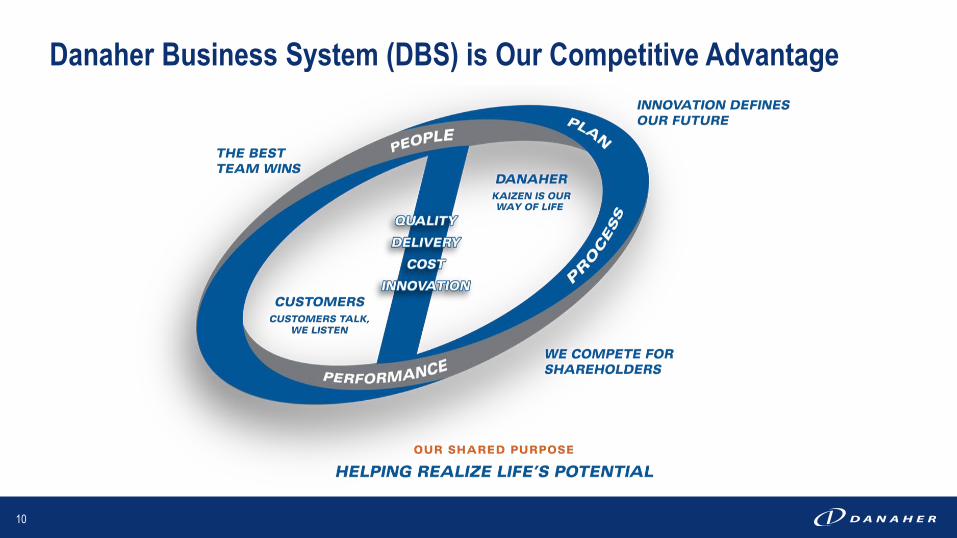
Danaher Business System (DBS) is Our Competitive Advantage
10
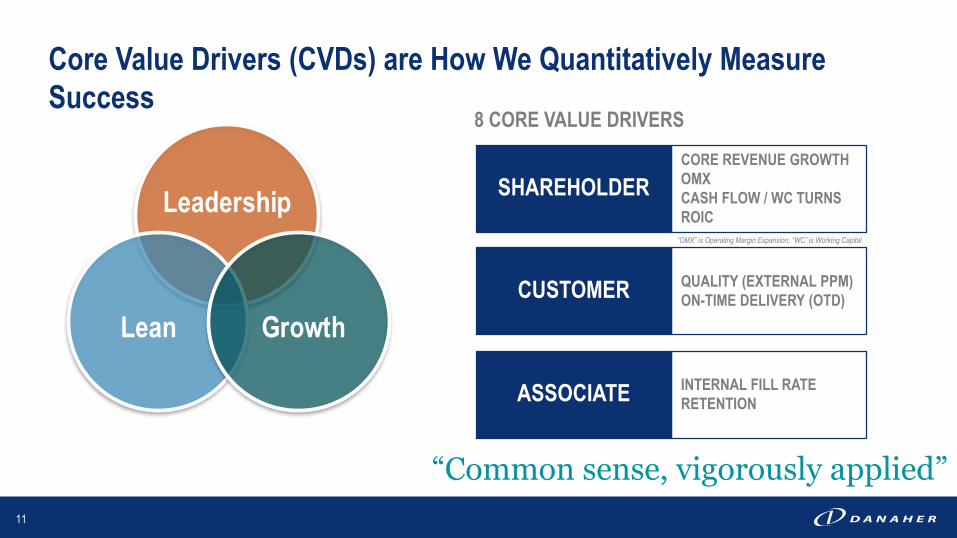
“OMX” is Operating Margin Expansion; “WC” is Working Capital
SHAREHOLDER
CORE REVENUE GROWTH
OMX
CASH FLOW / WC TURNS
ROIC
CUSTOMER QUALITY (EXTERNAL PPM)
ON-TIME DELIVERY (OTD)
ASSOCIATEINTERNAL FILL RATE
RETENTION
8 CORE VALUE DRIVERS
Core Value Drivers (CVDs) are How We Quantitatively Measure
Success
“Common sense, vigorously applied”
Leadership
Lean Growth
11
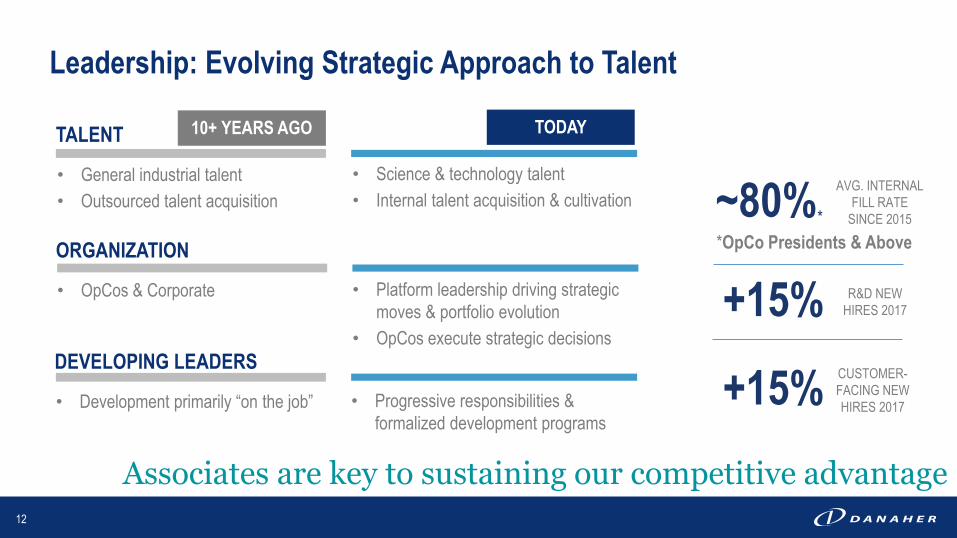
Associates are key to sustaining our competitive advantage
Leadership: Evolving Strategic Approach to Talent
DEVELOPING LEADERS
• Development primarily “on the job”
TALENT
• General industrial talent
• Outsourced talent acquisition
ORGANIZATION
• OpCos & Corporate
10+ YEARS AGO
• Progressive responsibilities &
formalized development programs
• Science & technology talent
• Internal talent acquisition & cultivation
• Platform leadership driving strategic
moves & portfolio evolution
• OpCos execute strategic decisions
TODAY
*OpCo Presidents & Above
~80%*
AVG. INTERNAL
FILL RATE
SINCE 2015
+15% R&D NEW
HIRES 2017
+15%CUSTOMER-
FACING NEW
HIRES 2017
12

LIFE
SCIENCESDIAGNOSTICS DENTALENVIRONMENTAL & APPLIED SOLUTIONS
Leadership Development Across Danaher: Recent Moves
Multi-industry structure a differentiator in talent attraction, development, retention
WATER QUALITY PRODUCT ID
PREVIOUSLY
PRESIDENT
EVP OF LIFE SCIENCES
PLATFORM
PREVIOUSLY
PRESIDENT
PRESIDENT
PREVIOUSLY EVP OF
LS & PID PLATFORMS
EVP OF DX & DENTAL
PLATFORMSPREVIOUSLY EVP OF
LS & PID PLATFORMS
EVP OF DX & DENTAL
PLATFORMS
PREVIOUSLY
PRESIDENT
PRESIDENT
PREVIOUSLY
HEAD OF R&D
PRESIDENT
PREVIOUSLY HEAD OF T&M
GROUP EXECUTIVE FOR
DENTAL
PREVIOUSLY
PRESIDENT
PREVIOUSLY
PRESIDENT IND.
PREVIOUSLY
PRESIDENT
PREVIOUSLY GROUP EXEC
OF PID PLATFORM
EVP OF EAS PLATFORM
PREVIOUSLY
HEAD OF R&D
PRESIDENT
PREVIOUSLY
PRESIDENT
GROUP EXECUTIVE FOR
WATER QUALITY
PREVIOUSLY
FINANCE
CFO
13

14
Putting It All Together
DBS driving tremendous value creation
$18.3B
2014 2015 2016 2017
$14.4B
$16.9B
$12.9B
$2.98
$4.03
$3.61
$2.66
TOTAL
REVENUE
ADJUSTED
EPS
G&A
AS % OF SALES
AVG. ANNUAL
CORE OMX
GROSS
MARGIN+200BPS
DHR RESULTS: LAST 3 YEARS
-50BPS
+50BPS
>75BPS
AVG. ANNUAL
EPS GROWTHMid-teens
R&D
AS % OF SALES
All financial metrics based on FY 2017 unless otherwise indicated
DANAHER HISTORICAL
PERFORMANCE
Resilient portfolio with exposure to attractive secular drivers
“Running the Danaher Playbook”: balanced approach to deliver long-term
value to shareholders
Summary
DBS remains our competitive advantage: “The Best Team Wins”
15

Non-GAAP Reconciliations
17
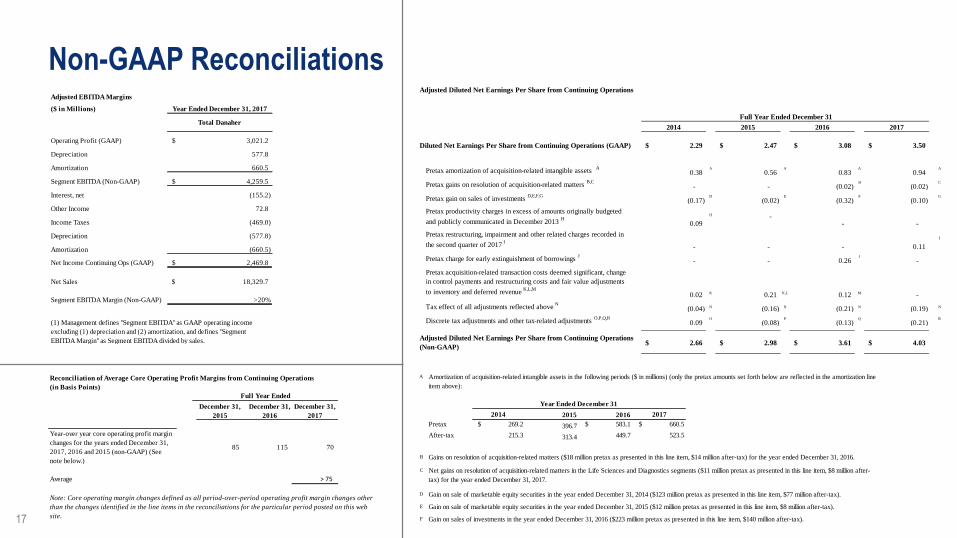
Adjusted EBITDA Margins
($ in Millions)
Total Danaher
Operating Profit (GAAP) 3,021.2$
Depreciation 577.8
Amortization 660.5
Segment EBITDA (Non-GAAP) 4,259.5$
Interest, net (155.2)
Other Income 72.8
Income Taxes (469.0)
Depreciation (577.8)
Amortization (660.5)
Net Income Continuing Ops (GAAP) 2,469.8$
Net Sales 18,329.7$
Segment EBITDA Margin (Non-GAAP) >20%
Year Ended December 31, 2017
(1) Management defines "Segment EBITDA" as GAAP operating income
excluding (1) depreciation and (2) amortization, and defines "Segment
EBITDA Margin" as Segment EBITDA divided by sales.
Adjusted Diluted Net Earnings Per Share from Continuing Operations
2014 2015 2016 2017
Diluted Net Earnings Per Share from Continuing Operations (GAAP) 2.29$ 2.47$ 3.08$ 3.50$
Pretax amortization of acquisition-related intangible assets A
0.38 A
0.56 A
0.83 A
0.94 A
Pretax gains on resolution of acquisition-related matters B,C
- - (0.02) B
(0.02) C
Pretax gain on sales of investments D,E,F,G
(0.17) D
(0.02) E
(0.32) F
(0.10) G
Pretax productivity charges in excess of amounts originally budgeted
and publicly communicated in December 2013 H
0.09
H - - -
Pretax restructuring, impairment and other related charges recorded in
the second quarter of 2017 I
- - - 0.11
I
Pretax charge for early extinguishment of borrowings J
- - 0.26 J
-
Pretax acquisition-related transaction costs deemed significant, change
in control payments and restructuring costs and fair value adjustments
to inventory and deferred revenue K,L,M
0.02 K 0.21 K,L 0.12 M -
Tax effect of all adjustments reflected above N
(0.04) N (0.16) N (0.21) N (0.19) N
Discrete tax adjustments and other tax-related adjustments O,P,Q,R
0.09 O
(0.08) P
(0.13) Q
(0.21) R
2.66$ 2.98$ 3.61$ 4.03$ Adjusted Diluted Net Earnings Per Share from Continuing Operations
(Non-GAAP)
Full Year Ended December 31
A
2014 2015 2016 2017
Pretax $ 269.2 396.7 $ 583.1 $ 660.5
After-tax 215.3 313.4 449.7 523.5
B
C
D
E
F
G
H
I
J
K
L
M
N
O
P
Charge for early extinguishment of borrowings ($179 million pretax as presented in this line item, $112 million after-tax) incurred in the third quarter of 2016.
Amortization of acquisition-related intangible assets in the following periods ($ in millions) (only the pretax amounts set forth below are reflected in the amortization line
item above):
During the year ended December 31, 2017, the Company recorded $76 million of pretax restructuring, impairment and other related charges ($51 million after-tax)
primarily related to the Company’s strategic decision to discontinue a molecular diagnostic product line in its Diagnostics segment. As a result, the Company incurred
noncash charges for the impairment of certain technology-related intangibles as well as related inventory and plant, property and equipment with no further use totaling
$49 million. In addition, the Company incurred cash restructuring costs primarily related to employee severance and related charges totaling $27 million.
Gain on sales of investments in the year ended December 31, 2016 ($223 million pretax as presented in this line item, $140 million after-tax).
Gain on sale of marketable equity securities in the year ended December 31, 2015 ($12 million pretax as presented in this line item, $8 million after-tax).
Gain on sales of investments in the year ended December 31, 2017 ($73 million pretax as presented in this line item, $46 million after-tax).
Continuing operations portion of productivity charges for the year ended December 31, 2014 in excess of amounts originally budgeted and publicly communicated in
December 2013 ($64 million pretax as presented in this line item, $49 million after-tax).
Year Ended December 31
Gains on resolution of acquisition-related matters ($18 million pretax as presented in this line item, $14 million after-tax) for the year ended December 31, 2016.
Net gains on resolution of acquisition-related matters in the Life Sciences and Diagnostics segments ($11 million pretax as presented in this line item, $8 million after-
tax) for the year ended December 31, 2017.
Gain on sale of marketable equity securities in the year ended December 31, 2014 ($123 million pretax as presented in this line item, $77 million after-tax).
This line item reflects the aggregate tax effect of all nontax adjustments reflected in the table above. In addition, the footnotes above indicate the after-tax amount of
each individual adjustment item. Danaher estimates the tax effect of the adjustment items identified in the reconciliation schedule above by applying Danaher’s overall
estimated effective tax rate to the pretax amount, unless the nature of the item and/or the tax jurisdiction in which the item has been recorded requires application of a
specific tax rate or tax treatment, in which case the tax effect of such item is estimated by applying such specific tax rate or tax treatment.
Discrete income tax charges net of discrete income tax gains and benefits from a lower than expected effective tax rate in the year ended December 31, 2014
(compared to the anticipated effective tax rate publicly communicated in December 2013), due primarily to year-end 2014 tax law changes
Discrete income tax gains net of discrete income tax charges incurred in the year ended December 31, 2015 ($58 million).
Acquisition-related transaction costs deemed significant ($12 million pretax as presented in this line item, $9 million after-tax) for the year ended December 31,
2014 and fair value adjustments to inventory ($5 million pretax as presented in this line item, $4 million after-tax) for the year ended December 31, 2014 and fair
value adjustments to inventory ($20 million pretax as presented in this line item, $15 million after-tax) incurred in the year ended December 31, 2015, in each case
incurred in connection with the acquisition of Nobel Biocare. Danaher deems acquisition-related transaction costs incurred in a given period to be significant
(generally relating to Danaher’s larger acquisitions) if it determines that such costs exceed the range of acquisition-related transaction costs typical for Danaher in
a given period.
Acquisition-related transaction costs deemed significant ($21 million pretax as presented in this line item, $16 million after-tax), change in control payments, and fair
value adjustments to inventory and deferred revenue, net of the impact of freezing pension benefits, in each case related to the acquisition of Pall Corporation and
incurred in the year ended December 31, 2015 ($107 million pretax as presented in this line item, $84 million after-tax)
Acquisition-related transaction costs deemed significant ($12 million pretax as presented in this line item, $9 million after-tax), change in control payments and
restructuring costs ($49 million pretax as presented in this line item, $30 million after-tax), and fair value adjustments to inventory and deferred revenue ($23 million
pretax as presented in this line item, $14 million after-tax), in each case related to the acquisitions of Cepheid and Phenomenex and incurred in the year ended
December 31, 2016. The Company deems acquisition-related transaction costs incurred in a given period to be significant (generally relating to the Company’s larger
acquisitions) if it determines that such costs exceed the range of acquisition-related transaction costs typical for Danaher in a given period.
Reconciliation of Average Core Operating Profit Margins from Continuing Operations
(in Basis Points)
December 31,
2015
December 31,
2016
December 31,
2017
Year-over year core operating profit margin
changes for the years ended December 31,
2017, 2016 and 2015 (non-GAAP) (See
note below.)
85 115 70
Average > 75
Note: Core operating margin changes defined as all period-over-period operating profit margin changes other
than the changes identified in the line items in the reconciliations for the particular period posted on this web
site.
Full Year Ended
Non-GAAP Reconciliations
18
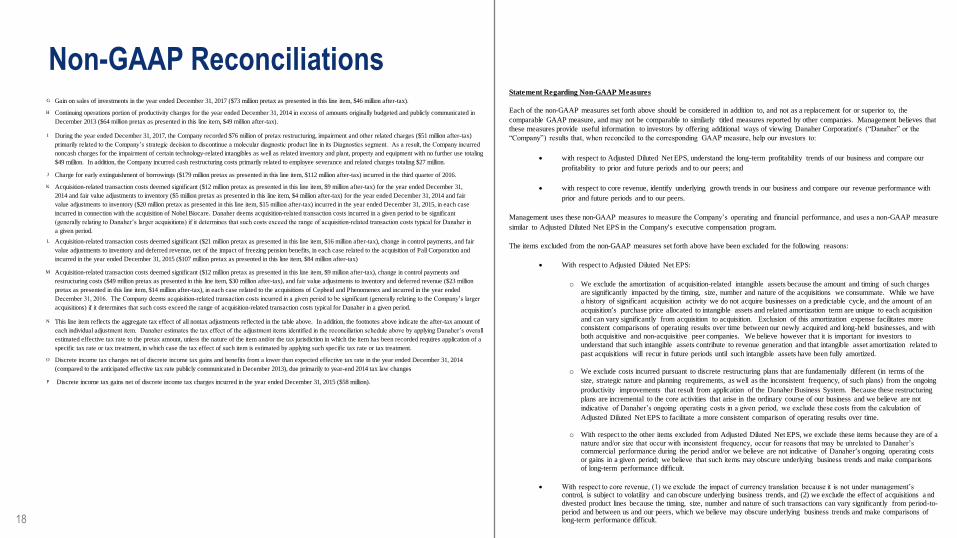
Statement Regarding Non-GAAP Measures
Each of the non-GAAP measures set forth above should be considered in addition to, and not as a replacement for or superior to, the
comparable GAAP measure, and may not be comparable to similarly titled measures reported by other companies. Management believes that
these measures provide useful information to investors by offering additional ways of viewing Danaher Corporation’s (“Danaher” or the
“Company”) results that, when reconciled to the corresponding GAAP measure, help our investors to:
• with respect to Adjusted Diluted Net EPS, understand the long-term profitability trends of our business and compare our
profitability to prior and future periods and to our peers; and
• with respect to core revenue, identify underlying growth trends in our business and compare our revenue performance with
prior and future periods and to our peers.
Management uses these non-GAAP measures to measure the Company’s operating and financial performance, and uses a non-GAAP measure
similar to Adjusted Diluted Net EPS in the Company’s executive compensation program.
The items excluded from the non-GAAP measures set forth above have been excluded for the following reasons:
• With respect to Adjusted Diluted Net EPS:
o We exclude the amortization of acquisition-related intangible assets because the amount and timing of such charges are significantly impacted by the timing, size, number and nature of the acquisitions we consummate. While we have a history of significant acquisition activity we do not acquire businesses on a predictable cycle, and the amount of an
acquisition’s purchase price allocated to intangible assets and related amortization term are unique to each acquisition
and can vary significantly from acquisition to acquisition. Exclusion of this amortization expense facilitates more consistent comparisons of operating results over time between our newly acquired and long-held businesses, and with both acquisitive and non-acquisitive peer companies. We believe however that it is important for investors to understand that such intangible assets contribute to revenue generation and that intangible asset amortization related to
past acquisitions will recur in future periods until such intangible assets have been fully amortized.
o We exclude costs incurred pursuant to discrete restructuring plans that are fundamentally different (in terms of the
size, strategic nature and planning requirements, as well as the inconsistent frequency, of such plans) from the ongoing
productivity improvements that result from application of the Danaher Business System. Because these restructuring
plans are incremental to the core activities that arise in the ordinary course of our business and we believe are not
indicative of Danaher’s ongoing operating costs in a given period, we exclude these costs from the calculation of
Adjusted Diluted Net EPS to facilitate a more consistent comparison of operating results over time.
o With respect to the other items excluded from Adjusted Diluted Net EPS, we exclude these items because they are of a nature and/or size that occur with inconsistent frequency, occur for reasons that may be unrelated to Danaher’s commercial performance during the period and/or we believe are not indicative of Danaher’s ongoing operating costs or gains in a given period; we believe that such items may obscure underlying business trends and make comparisons of long-term performance difficult.
• With respect to core revenue, (1) we exclude the impact of currency translation because it is not under management’s control, is subject to volatility and can obscure underlying business trends, and (2) we exclude the effect of acquisitions a nd divested product lines because the timing, size, number and nature of such transactions can vary significantly from period-to-period and between us and our peers, which we believe may obscure underlying business trends and make comparisons of long-term performance difficult.
A
2014 2015 2016 2017
Pretax $ 269.2 396.7 $ 583.1 $ 660.5
After-tax 215.3 313.4 449.7 523.5
B
C
D
E
F
G
H
I
J
K
L
M
N
O
P
Charge for early extinguishment of borrowings ($179 million pretax as presented in this line item, $112 million after-tax) incurred in the third quarter of 2016.
Amortization of acquisition-related intangible assets in the following periods ($ in millions) (only the pretax amounts set forth below are reflected in the amortization line
item above):
During the year ended December 31, 2017, the Company recorded $76 million of pretax restructuring, impairment and other related charges ($51 million after-tax)
primarily related to the Company’s strategic decision to discontinue a molecular diagnostic product line in its Diagnostics segment. As a result, the Company incurred
noncash charges for the impairment of certain technology-related intangibles as well as related inventory and plant, property and equipment with no further use totaling
$49 million. In addition, the Company incurred cash restructuring costs primarily related to employee severance and related charges totaling $27 million.
Gain on sales of investments in the year ended December 31, 2016 ($223 million pretax as presented in this line item, $140 million after-tax).
Gain on sale of marketable equity securities in the year ended December 31, 2015 ($12 million pretax as presented in this line item, $8 million after-tax).
Gain on sales of investments in the year ended December 31, 2017 ($73 million pretax as presented in this line item, $46 million after-tax).
Continuing operations portion of productivity charges for the year ended December 31, 2014 in excess of amounts originally budgeted and publicly communicated in
December 2013 ($64 million pretax as presented in this line item, $49 million after-tax).
Year Ended December 31
Gains on resolution of acquisition-related matters ($18 million pretax as presented in this line item, $14 million after-tax) for the year ended December 31, 2016.
Net gains on resolution of acquisition-related matters in the Life Sciences and Diagnostics segments ($11 million pretax as presented in this line item, $8 million after-
tax) for the year ended December 31, 2017.
Gain on sale of marketable equity securities in the year ended December 31, 2014 ($123 million pretax as presented in this line item, $77 million after-tax).
This line item reflects the aggregate tax effect of all nontax adjustments reflected in the table above. In addition, the footnotes above indicate the after-tax amount of
each individual adjustment item. Danaher estimates the tax effect of the adjustment items identified in the reconciliation schedule above by applying Danaher’s overall
estimated effective tax rate to the pretax amount, unless the nature of the item and/or the tax jurisdiction in which the item has been recorded requires application of a
specific tax rate or tax treatment, in which case the tax effect of such item is estimated by applying such specific tax rate or tax treatment.
Discrete income tax charges net of discrete income tax gains and benefits from a lower than expected effective tax rate in the year ended December 31, 2014
(compared to the anticipated effective tax rate publicly communicated in December 2013), due primarily to year-end 2014 tax law changes
Discrete income tax gains net of discrete income tax charges incurred in the year ended December 31, 2015 ($58 million).
Acquisition-related transaction costs deemed significant ($12 million pretax as presented in this line item, $9 million after-tax) for the year ended December 31,
2014 and fair value adjustments to inventory ($5 million pretax as presented in this line item, $4 million after-tax) for the year ended December 31, 2014 and fair
value adjustments to inventory ($20 million pretax as presented in this line item, $15 million after-tax) incurred in the year ended December 31, 2015, in each case
incurred in connection with the acquisition of Nobel Biocare. Danaher deems acquisition-related transaction costs incurred in a given period to be significant
(generally relating to Danaher’s larger acquisitions) if it determines that such costs exceed the range of acquisition-related transaction costs typical for Danaher in
a given period.
Acquisition-related transaction costs deemed significant ($21 million pretax as presented in this line item, $16 million after-tax), change in control payments, and fair
value adjustments to inventory and deferred revenue, net of the impact of freezing pension benefits, in each case related to the acquisition of Pall Corporation and
incurred in the year ended December 31, 2015 ($107 million pretax as presented in this line item, $84 million after-tax)
Acquisition-related transaction costs deemed significant ($12 million pretax as presented in this line item, $9 million after-tax), change in control payments and
restructuring costs ($49 million pretax as presented in this line item, $30 million after-tax), and fair value adjustments to inventory and deferred revenue ($23 million
pretax as presented in this line item, $14 million after-tax), in each case related to the acquisitions of Cepheid and Phenomenex and incurred in the year ended
December 31, 2016. The Company deems acquisition-related transaction costs incurred in a given period to be significant (generally relating to the Company’s larger
acquisitions) if it determines that such costs exceed the range of acquisition-related transaction costs typical for Danaher in a given period.