dampier marine services facility - epa wa
TRANSCRIPT
DAMPIER PORT AUTHORITY
Dampier Marine Services Facility Preliminary Site Investigation Sampling and Analysis Plan Implementation Report
301012-01121
3-Dec-09
Infrastructure & Environment Level 7, QV1 Building 250 St Georges Terrace Perth WA 6000 Australia Tel: +61 8 9278 8111 Fax: +61 8 9278 8110 www.worleyparsons.com WorleyParsons Services Pty Ltd ABN 61 001 279 812
© Copyright 2009 WorleyParsons Services Pty Ltd

DAMPIER PORT AUTHORITY DAMPIER MARINE SERVICES FACILITY PRELIMINARY SITE INVESTIGATION SAMPLING AND ANALYSIS PLAN IMPLEMENTATION REPORT
EXECUTIVE SUMMARY
WorleyParsons have implemented a sediment analysis plan (SAP) for the dredging and reclamation works for Dampier Port Authority Marine Service Facility. The contaminates of concern have previously been reviewed and approved by DEWHA when a previous design allowed for offshore disposal. The current configuration is a balance cut and fill operation and so does not require commonwealth approval.
The SAP was developed in consultation with the DEC’s Contaminated Land Series Guidelines and following feedback from the DEC contaminated land branch.
The results indicate no contaminates are an environmental risk to the marine or terrestrial environments. Further they illustrate the low levels of contaminates identified are tightly bound to the sediment and immobile in the current form.
ASS investigations indicate that there is low risk to the environs from PASS and any risk from the reduced inorganic S (TRIS) trail is low. The project can develop with no ASS management.

DAMPIER PORT AUTHORITY
PROJECT 301012-01121 - DAMPIER MARINE SERVICES FACILITY REV DESCRIPTION ORIG REVIEW WORLEY-
PARSONS APPROVAL
DATE CLIENT APPROVAL
DATE
A Issued for internal review B Morna B Morna
P Mellor P Mellor
N/A
30-Oct-09 N/A
0 Issued to Client
P Mellor
H Houridis
P Mellor
2-Dec-09 W Young
23-12-09
Disclaimer
This report has been prepared on behalf of and for the exclusive use of Dampier Port Authority, and is subject to and issued in accordance with the agreement between Dampier Port Authority and WorleyParsons Services Pty Ltd. WorleyParsons Services Pty Ltd accepts no liability or responsibility whatsoever for it in respect of any use of or reliance upon this report by any third party.
Copying this report without the permission of Dampier Port Authority and WorleyParsons Services Pty Ltd is not permitted.

DAMPIER PORT AUTHORITY DAMPIER MARINE SERVICES FACILITY PRELIMINARY SITE INVESTIGATION SAMPLING AND ANALYSIS PLAN IMPLEMENTATION REPORT
i:\projects\i01121 dampier marine services facility project\2.0 reports\ari\appendices\9 - acid sulfate soils assessment\psi -sap-ir 23-12-09.doc Page iv 301012-01121 : Rev 0 : 3-Dec-09
CONTENTS 1. INTRODUCTION ................................................................................................................1
1.1 Purpose & Objectives .........................................................................................................1
1.2 Previous Sediment Surveys................................................................................................3
2. OVERVIEW OF PROPOSED DREDGING RECLAMATION WORKS...............................5
2.1 Project Description and History ..........................................................................................5
2.2 Surrounding Land Use and Existing Environmental ...........................................................7
2.3 Proposed Dredging and Reclamation Works .....................................................................8
2.4 Reclamation ........................................................................................................................9
2.5 Project Schedule...............................................................................................................10
3. REVIEW OF EXISTING INFORMATION AND POTENTIAL CONTAMINANTS OF CONCERN .......................................................................................................................................11
3.1 Overview ...........................................................................................................................11
3.2 Seabed Geology ...............................................................................................................12
3.3 Geotechnical Investigation................................................................................................12
3.4 Previous Relevant Sediment Investigations .....................................................................15
3.4.1 Chemical Characteristics .....................................................................................17
3.5 Previous Acid Sulfate Soils Investigations........................................................................18
3.6 Potential Contaminants.....................................................................................................22
3.7 Other Issues......................................................................................................................22
3.7.1 Nutrients...............................................................................................................22
3.7.2 Acid Sulfate Soils .................................................................................................22
3.7.3 PCBs ....................................................................................................................23
4. SAMPLING AND ANALYSIS ............................................................................................24
4.1 Sampling Rationale...........................................................................................................24
4.2 Sampling Locations (and Horizons)..................................................................................24
4.2.1 Sampling Horizons...............................................................................................25
4.3 Proposed Sediment Quality Analysis Attributes for Analysis ...........................................28

DAMPIER PORT AUTHORITY DAMPIER MARINE SERVICES FACILITY PRELIMINARY SITE INVESTIGATION SAMPLING AND ANALYSIS PLAN IMPLEMENTATION REPORT
i:\projects\i01121 dampier marine services facility project\2.0 reports\ari\appendices\9 - acid sulfate soils assessment\psi -sap-ir 23-12-09.doc Page v 301012-01121 : Rev 0 : 3-Dec-09
4.3.1 Analysis Suite.......................................................................................................28
4.3.2 Elutriate Analysis .................................................................................................29
4.4 Sample Collection and Processing...................................................................................29
4.4.1 Sample Collection ................................................................................................29
4.4.2 Sample Processing ..............................................................................................29
4.4.3 Hold Samples.......................................................................................................31
4.5 Laboratory Analysis ..........................................................................................................31
5. SAMPLING AND ANALYSIS QUALITY CONTROL.........................................................33
5.1 Quality Control – Field Sampling ......................................................................................33
5.2 Quality Control – Analysis.................................................................................................33
6. RESULTS .........................................................................................................................36
6.1 Metals ...............................................................................................................................38
6.2 Organotins ........................................................................................................................39
6.3 Total Petroleum Hydrocarbons (TPHs).............................................................................39
6.4 Polynuclear Aromatic Hydrocarbons (PAHs)....................................................................39
6.5 Nutrients, COD and BOD..................................................................................................39
6.6 Acid Sulphate Soils ...........................................................................................................40
6.6.1 Suspension Peroxide Oxidation Combined Acidity and Sulfate (SPOCAS)........41
6.6.2 Acid Volatile S (AVS) ...........................................................................................45
6.6.3 Total Reduced S ..................................................................................................46
6.7 Particle Size Distribution - SPOCAS.................................................................................47
6.8 Particle Size Distribution...................................................................................................48
6.9 Quality Control ..................................................................................................................50
6.9.1 Laboratory Quality Control Analysis ....................................................................50
6.9.2 Field Quality Control ............................................................................................50
6.9.3 Holding time .........................................................................................................50
7. SUMMARY........................................................................................................................53
8. REFERENCES .................................................................................................................54
DAMPIER PORT AUTHORITY DAMPIER MARINE SERVICES FACILITY PRELIMINARY SITE INVESTIGATION SAMPLING AND ANALYSIS PLAN IMPLEMENTATION REPORT
i:\projects\i01121 dampier marine services facility project\2.0 reports\ari\appendices\9 - acid sulfate soils assessment\psi -sap-ir 23-12-09.doc Page vi 301012-01121 : Rev 0 : 3-Dec-09
Appendices
APPENDIX A – PSI SAP
APPENDIX B – LABORATORY REPORTS
APPENDIX C– TOC QA ANALYSIS

DAMPIER PORT AUTHORITY DAMPIER MARINE SERVICES FACILITY PRELIMINARY SITE INVESTIGATION SAMPLING AND ANALYSIS PLAN IMPLEMENTATION REPORT
i:\projects\i01121 dampier marine services facility project\2.0 reports\ari\appendices\9 - acid sulfate soils assessment\psi -sap-ir 23-12-09.doc Page 1 301012-01121 : Rev 0 : 3-Dec-09
1. INTRODUCTION
The Port of Dampier is located approximately 1550 km north of Perth, within the Shire of Roebourne. The Port limits lie adjacent to the Dampier Archipelago and include the waters of Mermaid Sound, Mermaid Strait and the outer anchorages. The area of seabed and waters inside port limits is currently around 650 km2 with a perimeter of almost 300 km.
A location map and project layout is shown in Figure 1.
The Port of Dampier commenced development in 1963 and since initial commissioning has developed into one of the largest tonnage ports in Australia servicing major export industries of iron ore, solar salt and Liquid Natural Gas (LNG). Annual trade in the Port is expected to triple in the next 25 years.
Dampier Port Authority (DPA) is a state government owned corporation that operates under the Port Authorities Act 1999. Under this act DPA facilitates trade and commerce within and through the port, and maintains several wharf and berth areas, shipping channels and swing basins within the port.
DPA is proposing to increase the handling and export capacity of the cargo wharf by constructing the Dampier Marine Services Facility (DMSF). This will include a new jetty adjacent to the existing berth and reclaiming land to construct associated laydown area and a Land Backed Wharf (Heavy Load Out area).
During construction, approximately 2.2 million m3 of sediment will be dredged to provide safe navigable depth for vessels using the facility. The dredged sediment will be dewatered and used for land reclamation.
The preliminary sampling and analysis plan (SAP) was designed to comply with the sampling and analysis requirements of the National Assessment Guidelines for Dredging (NADG) (Commonwealth of Australia 2009) and the Contaminated Lands Act 2003 (DEC 2003b). A field sampling program was conducted over the 12th and 13th of October 2009. This document provides assessment of the sediments sampled for the capital dredging programme that are proposed for reclamation of the berth area.
1.1 Purpose & Objectives
The purpose of this preliminary site investigation sampling and analysis implementation plan is to provide a level of assessment appropriate for the sediments and to identify any contaminants of concern and their environmental significance.

DAMPIER PORT AUTHORITY DAMPIER MARINE SERVICES FACILITY PRELIMINARY SITE INVESTIGATION SAMPLING AND ANALYSIS PLAN IMPLEMENTATION REPORT
i:\projects\i01121 dampier marine services facility project\2.0 reports\ari\appendices\9 - acid sulfate soils assessment\psi -sap-ir 23-12-09.doc Page 2 301012-01121 : Rev 0 : 3-Dec-09
In order to investigate the suitability of material dredged for land reclamation, sediment within the proposed dredge area was characterised using a sampling and analysis programme (Appendix A) that was prepared in accordance with the NAGD and the contaminated land guidelines for the development of a sampling analysis plan (DEC 2001b). The results of the SAP are reported herein for the Department of Environment and Conservation (DEC) to demonstrate compliance with the requirements and appropriate screening of sediments with reference to the Contaminated Sites Regulations (DEC 2003b) and associated Contaminated Sites Management Series Guidelines (DEC 2003c). Where appropriate, reference has also been made to NAGD as the sediment will be initially mobilised into the water column through dredging.
For the purposes of assessing the impacts of dredging and reclamation at the Port of Dampier, the NAGD (DEWHA 2009) and the Contaminated Sites Fact Sheets (DEC 2003c) has been used. In broad terms the hierarchy to assess the suitability of the sediments for land reclamation from a marine impact and management perspective is as follows:
• provide a summary of the catchment and land-use activities with the potential to impact upon dredged material quality;
• identify a contaminants list for testing of sediments, based on potential contaminant sources and results of prior testing;
• identify the number of samples required to provide an adequate representation of the mean and upper 95% confidence interval for contaminants list analytes;
• describe statistical techniques to determine the status of potential contaminants within dredged material; and
• prescribe a reporting framework for all data, results and conclusions which will address the requirements of the Determining Authority.
The suitability of the material for reclamation will be determined by comparison with the Ecological Investigation Levels prescribed in the Assessment Levels for Soil, Sediment and Water (DEC 2003d). Following discussions with the DEC contaminated land branch extensive ASS tests were carried out to assess and manage any risk of PASS. This was done by sampling all samples for SPOCAS and targeting the reduced inorganic sulfur compounds in selected samples. These are the compounds of major concern in acid sulfate soil assessments due to their ability to rapidly generate persistent acids. SPOCAS was also analysed on the <0.075 mm fraction on selected samples, leading to better prediction of its likely acid-generating potential.
This report provides a summary of the following:
• Overview of proposed dredging and excavation works;
• history of dredging in and adjacent to the Dampier Port;
• history of sediment surveys and analysis for this area;

DAMPIER PORT AUTHORITY DAMPIER MARINE SERVICES FACILITY PRELIMINARY SITE INVESTIGATION SAMPLING AND ANALYSIS PLAN IMPLEMENTATION REPORT
i:\projects\i01121 dampier marine services facility project\2.0 reports\ari\appendices\9 - acid sulfate soils assessment\psi -sap-ir 23-12-09.doc Page 3 301012-01121 : Rev 0 : 3-Dec-09
• determination of likely contaminants of concern and their extent;
• sampling design and rationale;
• results of the investigations; and
• laboratory and field Quality Control analyses.
1.2 Previous Sediment Surveys
The design of the SAP (Appendix A) was based on examination of available information for Dampier including the following:
• Dampier Port Authority: Proposed Port Expansion and Dredging Program - Referral Document, Dampier Port Authority (ENV Australia 2003b);
• Dredging program for the Dampier Port Upgrade, Referral Document (Sinclair Knight Mertz 2006);
• Dampier Port Dredging , Dredging and Dredge Spoil Disposal Management Plan (2006); and
• Dampier Port Authority: DCW Capital Dredging: Sediment Quality Report in Report prepared for the Dampier Port Authority (MScience 2007).

DAMPIER PORT AUTHORITY DAMPIER MARINE SERVICES FACILITY PRELIMINARY SITE INVESTIGATION SAMPLING AND ANALYSIS PLAN IMPLEMENTATION REPORT
i:\projects\i01121 dampier marine services facility project\2.0 reports\ari\appendices\9 - acid sulfate soils assessment\psi -sap-ir 23-12-09.doc Page 4 301012-01121 : Rev 0 : 3-Dec-09
Figure 1: Project

DAMPIER PORT AUTHORITY DAMPIER MARINE SERVICES FACILITY PRELIMINARY SITE INVESTIGATION SAMPLING AND ANALYSIS PLAN IMPLEMENTATION REPORT
i:\projects\i01121 dampier marine services facility project\2.0 reports\ari\appendices\9 - acid sulfate soils assessment\psi -sap-ir 23-12-09.doc Page 5 301012-01121 : Rev 0 : 3-Dec-09
2. OVERVIEW OF PROPOSED DREDGING RECLAMATION WORKS
2.1 Project Description and History
The Dampier Port Authority currently owns and operates the Dampier Cargo Wharf (DCW) (Figure 2). This facility is nearing its design life, and is currently experiencing significant capacity constraints. Further, associated laydown area in the Port is in very short supply, leading to a congested and inefficient work area.
Figure 2: Existing Dampier Cargo Wharf (left) and Dampier Bulk Liquids Berth (Right), with Project Laydown area in foreground (February 2009)
The DPA has worked through various design iterations to resolve these issues since 2006. The current proposal is to develop additional laydown area for the Port via reclamation of 22ha. This area will support approximately 150m of sheet piled wall as a heavy load out facility, and a new wharf of some 300m in length. The areas traversed by the ships using the facility will be dredged to -11m, thus providing safe navigable depth for the maximum anticipated draft vessel along with the tide. Vessels will use the existing access channel as no new channel or increases to this channel width or depth are proposed as part of these works. The berth pockets on the wharf will be dredged to -14m, thus providing safe depth for vessels to berth at all stages of the tide.
The construction sequence will be to build the outer bund wall of the facility first. This will take approximately 6 months to complete, and will be constructed so that it retains the dredge material placed inside the facility.

DAMPIER PORT AUTHORITY DAMPIER MARINE SERVICES FACILITY PRELIMINARY SITE INVESTIGATION SAMPLING AND ANALYSIS PLAN IMPLEMENTATION REPORT
i:\projects\i01121 dampier marine services facility project\2.0 reports\ari\appendices\9 - acid sulfate soils assessment\psi -sap-ir 23-12-09.doc Page 6 301012-01121 : Rev 0 : 3-Dec-09
The next stage will be to dredge the required areas. Material will be pumped directly from the dredge into the reclamation area. Waters will be decanted within the reclamation area, and the return water discharged via controlled weir boxes at several locations.
This stage of the process is anticipated to take some 6 months to complete. It should be noted that while the majority of the waters will be drained from the reclamation area, the sediments within the reclamation area will always remain saturated, though both tidal influence through the wall and capillary action.
During this stage, the sheet pile wall will be installed along the western project margins. The sheet piles will be installed through the bund wall into the sea bed, thus providing approximately 150m of operational wharf area, for use as a heavy load-out facility.
Following the completion of the above work, the new wharf structure will be completed. This is expected to be a deck-on-piles structure, similar to most wharves around the state. Piles will be driven into the substrate, formwork established and headstocks/decks poured and set on-site (Figure 3).
The important design features are:
• Construction of a new wharf facility – this allows the construction to be undertaken while the existing Dampier Cargo Wharf (DCW) is operational, making it safer and ensuring minimal disruption;
• Balanced cut and fill operation – the amount of required dredging is balanced with the land development area to promote the disposal of all material without requiring sea disposal. As laydown area is in short supply in Dampier, this provides for the beneficial reuse of a potentially damaging waste.
• North facing wharf – material offloading facilities are sensitive to movement of the vessel. Rise and fall of the vessel due to swell makes loading and unloading via ship’s crane dangerous. The current DCW works well in ambient swell and sea conditions with minimal shut-down periods, and has been duplicated with the DMSF;
• Location in an existing Port operational area, between existing developments (DCW, DBLB) and current developments (Woodside’s Pluto Project). The project footprint and anticipated impact area is within those areas already disturbed by current projects. This consolidation of projects reduces the footprint of impacts by the port operations.

DAMPIER PORT AUTHORITY DAMPIER MARINE SERVICES FACILITY PRELIMINARY SITE INVESTIGATION SAMPLING AND ANALYSIS PLAN IMPLEMENTATION REPORT
i:\projects\i01121 dampier marine services facility project\2.0 reports\ari\appendices\9 - acid sulfate soils assessment\psi -sap-ir 23-12-09.doc Page 7 301012-01121 : Rev 0 : 3-Dec-09
Figure 3: Photomontage of proposed reclamation area
2.2 Surrounding Land Use and Existing Environmental
The Port of Dampier is located approximately 1,550 km north of Perth. The Port limits (approximately 650km2) lie within the Dampier Archipelago and include the waters of Mermaid Sound, Mermaid Strait and the outer anchorages. Port lands are located on the Burrup Peninsula approximately five km north-west of the Dampier township and 20 km west of Karratha and occupy a combined area of approximately 110 ha.
The town of Dampier was built by Hamersley Iron in the 1960s and has a population of approximately 2000 people. The town is within the Shire of Roebourne.
The Dampier Salt operation is located to the south of Parker Point and North West Shelf Venture Operations lie to the north east of the Burrup Peninsula. There are a number of other industries around the Burrup Peninsula. Much of the western portion of the Burrup Peninsula has been designated for industrial use.
The project is located within the Dampier Archipelago which has a number of environmental values and objectives that require protection from anthropogenic disturbance and threats. The primary

DAMPIER PORT AUTHORITY DAMPIER MARINE SERVICES FACILITY PRELIMINARY SITE INVESTIGATION SAMPLING AND ANALYSIS PLAN IMPLEMENTATION REPORT
i:\projects\i01121 dampier marine services facility project\2.0 reports\ari\appendices\9 - acid sulfate soils assessment\psi -sap-ir 23-12-09.doc Page 8 301012-01121 : Rev 0 : 3-Dec-09
environmental values of this region include maintaining ecological health, water quality, recreational and cultural aspects.
The Dampier Port Facilities are located on the western shore of the Burrup Peninsula. To the west (200m) of the project location is the Dampier Cargo Wharf (DCW) a general cargo facility owned and operated by the DPA. This has been operational since mid 1980’s. Further west (700m) is the Dampier Bulk Liquids Berth (DBLB). This facility has been operational since 2005 with the only current traffic anhydrous ammonia in liquid form. To the east of the project (400m) is the Woodside Pluto development and the North West Shelf Venture (2500m NE). Shore based activities include MiSwaco (drilling mud plants) Patrick Stevedores (cargo movements) and general laydown areas most of which are currently occupied by the Woodside Pluto project.
The area contains Aboriginal rock art, particularly on the Burrup Peninsula, and has moderate tourism and recreational value. The major recreational activities include fishing, camping, swimming and walking.
The Dampier Archipelago provides habitat to a range of species and communities including fringing coral reef systems, seagrass communities, endangered marine turtle and mammal species which require protection and management.
2.3 Proposed Dredging and Reclamation Works
Capital dredging would be undertaken to remove sediments from the seafloor area adjoining the proposed extension of the existing cargo berth and new wharf area, to a maximum water depth of -14 m LAT (below Lowest Astronomical Tide).
The key parameters for the existing dredging proposal are as follows:
• Area of Dredging: The proposed dredging would cover an area of approximately 467,800 m2.
• Depth of Dredging: In the approach areas (403,978 m2), dredging will range 1-6 m and result in a final depth of -11 m LAT. In the area around the jetty (40,786 m2), dredging will be to a maximum depth of 7-9 m resulting in a final depth of -14 m LAT. Inside the existing berth area (23,000 m2) dredging will range 0-3 m resulting in a maximum depth of -8 m LAT.
• Volume of Dredging: The calculated total volume of material to be dredged is approximately 2.2 million m3 of material.
• Material to be Dredged: Geotechnical and sediment sampling investigations undertaken across the proposal area indicate that the material to be dredged is sand – silty sand with some minor clay layers. No rock or consolidated material will need to be dredged.
• Estimated Time for Dredging: the dredging is likely to commence as a single continuous operation in the fourth quarter of 2010, depending on the availability of dredging plant and

DAMPIER PORT AUTHORITY DAMPIER MARINE SERVICES FACILITY PRELIMINARY SITE INVESTIGATION SAMPLING AND ANALYSIS PLAN IMPLEMENTATION REPORT
i:\projects\i01121 dampier marine services facility project\2.0 reports\ari\appendices\9 - acid sulfate soils assessment\psi -sap-ir 23-12-09.doc Page 9 301012-01121 : Rev 0 : 3-Dec-09
coordination with other projects within the region. It is expected that dredging would be completed within 12 months of commencement.
The dredging footprint is shown in Figure 1.
2.4 Reclamation
The reclamation footprint is shown in Figure 3. The dredged sediment will be used for land reclamation of the land-backed wharf. The sediment will be contained within a seawall (outer bund wall) and topped with road-base material. Within the roadways and on the heavy-load out facility, an impervious surface (concrete and/or asphalt) will be applied.
Dredged material will be pumped directly from the dredge to the reclamation area via a cutter suction dredge (Figure 4). The pump discharge will be 10-20% solids and 80-90% seawater. This mix will be decanted within the reclamation area, and the return water discharged via controlled weir boxes at several locations. The location of discharge and discharge volume will vary during construction, and will be determined according to conditions in order to maintain suitable water quality.
It should be noted that while the majority of the water in the pump discharge will be drained from the reclamation area, the sediments within the reclamation area will always remain saturated though both tidal influence through the wall and capillary action.

DAMPIER PORT AUTHORITY DAMPIER MARINE SERVICES FACILITY PRELIMINARY SITE INVESTIGATION SAMPLING AND ANALYSIS PLAN IMPLEMENTATION REPORT
i:\projects\i01121 dampier marine services facility project\2.0 reports\ari\appendices\9 - acid sulfate soils assessment\psi -sap-ir 23-12-09.doc Page 10 301012-01121 : Rev 0 : 3-Dec-09
Figure 4: Cutter Suction Dredge (“Leonardo da Vinci”), AMC berth, July 2007 (source: Oceanica in GHD 2007)
2.5 Project Schedule
It is expected the dredging and reclamation component will commence in the fourth quarter of 2010 and will continue for approximately 6 months.

DAMPIER PORT AUTHORITY DAMPIER MARINE SERVICES FACILITY PRELIMINARY SITE INVESTIGATION SAMPLING AND ANALYSIS PLAN IMPLEMENTATION REPORT
i:\projects\i01121 dampier marine services facility project\2.0 reports\ari\appendices\9 - acid sulfate soils assessment\psi -sap-ir 23-12-09.doc Page 11 301012-01121 : Rev 0 : 3-Dec-09
3. REVIEW OF EXISTING INFORMATION AND POTENTIAL CONTAMINANTS OF CONCERN
3.1 Overview
The Port of Dampier commenced development in 1963 and since initial commissioning the port has developed into one of the largest tonnage ports in Australia servicing major export industries of iron ore, solar Salt and Liquid Natural Gas (LNG). Key developments from initial start up in 1963 include:
• 1963 - Construction of the general cargo wharf to facilitate the establishment of mining and eventually the export of iron ore from the Mt Tom Price mine owned by Hamersley Iron
• 1966 – Construction of the Parker Point iron ore facility designed to accept vessels up to 60,000 DWT
• 1970-71 – Dredging to widen shipping channel and extension of the channel to East Intercourse Island Facility (760,000 m3)
• 1972 – Commencement of Dampier Salt operations
• 1970-1980 –Development of North West Shelf Venture, Offshore Petroleum facilities and onshore LNG production plant and export wharf
• 1984 Construction of the North Rankin ‘A’ production platform 130kms NNW of Dampier connected by a pipeline to an onshore site at Withnell Bay
• 1989 the Dampier Port Authority was established
• 1995 - Export of LNG increased to export of 6,000,000 tonnes per annum initiating the development of a second wharf in 1995
• 2005 – Construction of Dampier Bulk Liquids Berth to assist in the export of anhydrous ammonia
• 2008 – Construction of the Woodside Pluto offshore LNG platform, subsea pipeline, wharf and plant facilities
The main body of water located within DPA port limits, Mermaid Sound, has been subject to episodic large-scale dredging operations since 1965. During this period, both small and large-scale dredging programs have been conducted as part of construction and maintenance of existing shipping channels, port facilities and subsea gas trunkline corridors. In excess of 31 Mm3 of marine sediments have been dredged within Dampier Archipelago in twenty-one separate projects by Hamersley Iron, NWSV (North West Shelf Joint Venture) and DPA. The majority of this spoil has been relocated to the existing spoil grounds in Mermaid Sound.
DAMPIER PORT AUTHORITY DAMPIER MARINE SERVICES FACILITY PRELIMINARY SITE INVESTIGATION SAMPLING AND ANALYSIS PLAN IMPLEMENTATION REPORT
i:\projects\i01121 dampier marine services facility project\2.0 reports\ari\appendices\9 - acid sulfate soils assessment\psi -sap-ir 23-12-09.doc Page 12 301012-01121 : Rev 0 : 3-Dec-09
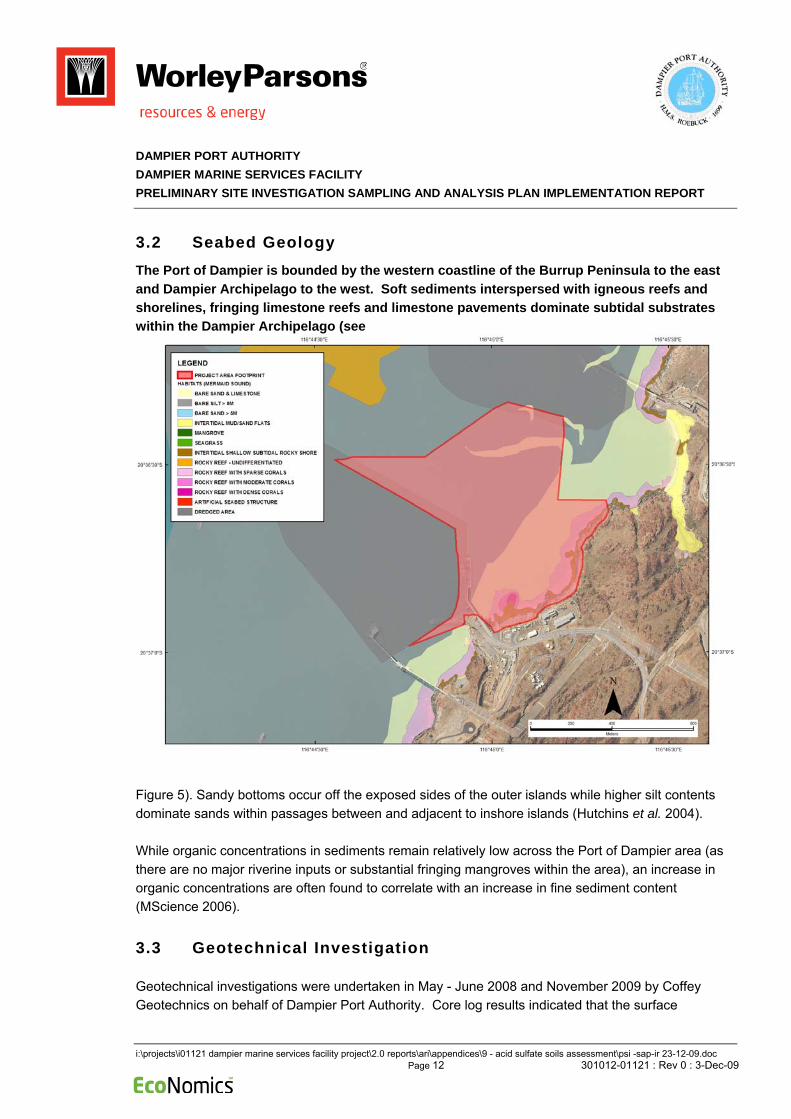
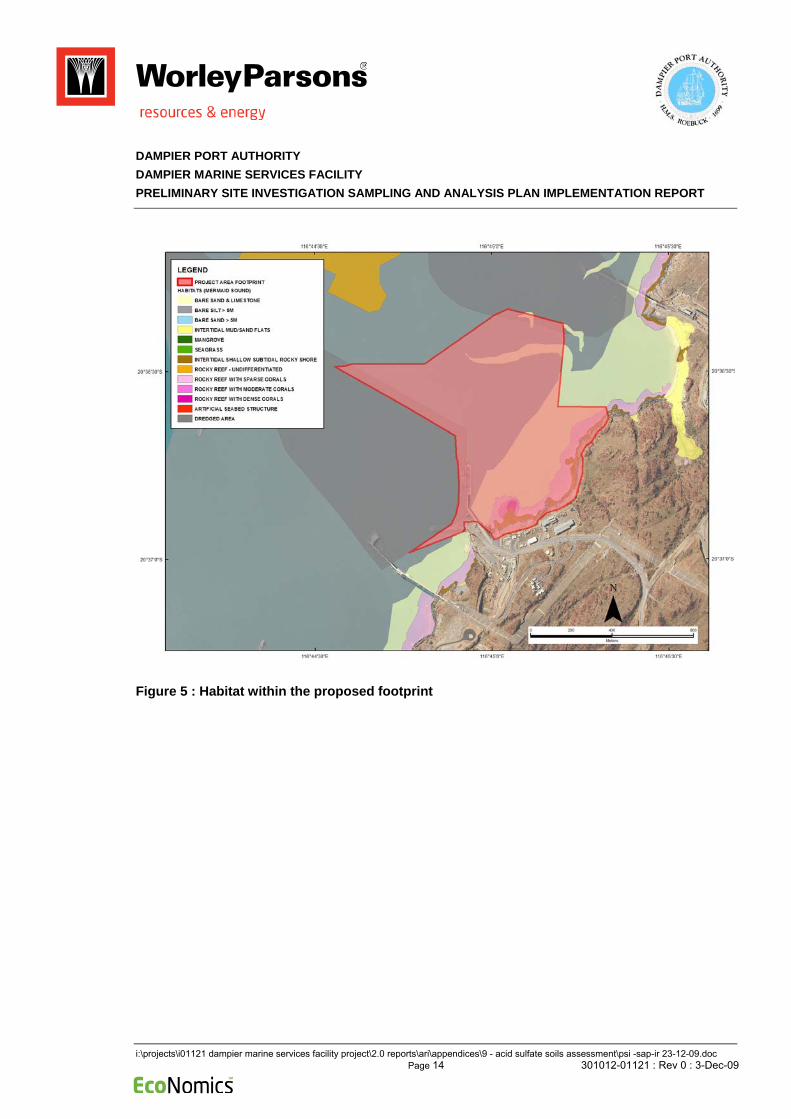
3.2 Seabed Geology The Port of Dampier is bounded by the western coastline of the Burrup Peninsula to the east and Dampier Archipelago to the west. Soft sediments interspersed with igneous reefs and shorelines, fringing limestone reefs and limestone pavements dominate subtidal substrates within the Dampier Archipelago (see
Figure 5). Sandy bottoms occur off the exposed sides of the outer islands while higher silt contents dominate sands within passages between and adjacent to inshore islands (Hutchins et al. 2004).
While organic concentrations in sediments remain relatively low across the Port of Dampier area (as there are no major riverine inputs or substantial fringing mangroves within the area), an increase in organic concentrations are often found to correlate with an increase in fine sediment content (MScience 2006).
3.3 Geotechnical Investigation
Geotechnical investigations were undertaken in May - June 2008 and November 2009 by Coffey Geotechnics on behalf of Dampier Port Authority. Core log results indicated that the surface
DAMPIER PORT AUTHORITY DAMPIER MARINE SERVICES FACILITY PRELIMINARY SITE INVESTIGATION SAMPLING AND ANALYSIS PLAN IMPLEMENTATION REPORT
i:\projects\i01121 dampier marine services facility project\2.0 reports\ari\appendices\9 - acid sulfate soils assessment\psi -sap-ir 23-12-09.doc Page 13 301012-01121 : Rev 0 : 3-Dec-09
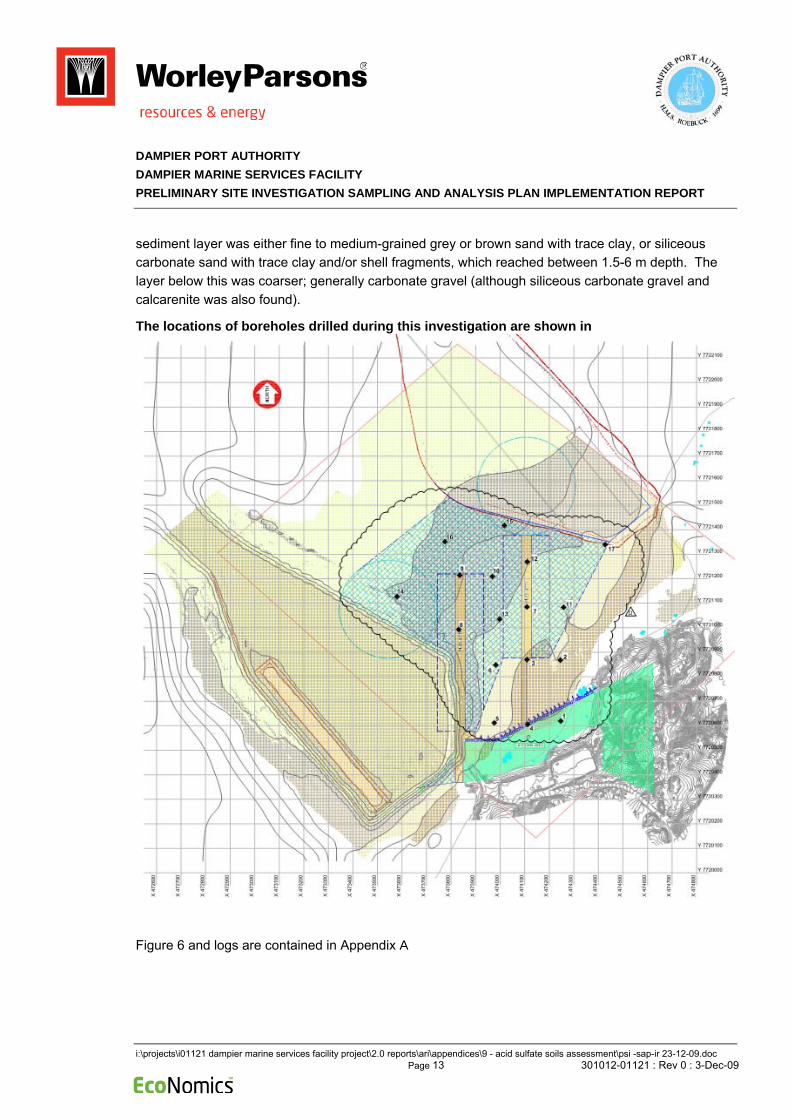
sediment layer was either fine to medium-grained grey or brown sand with trace clay, or siliceous carbonate sand with trace clay and/or shell fragments, which reached between 1.5-6 m depth. The layer below this was coarser; generally carbonate gravel (although siliceous carbonate gravel and calcarenite was also found).
The locations of boreholes drilled during this investigation are shown in
Figure 6 and logs are contained in Appendix A
DAMPIER PORT AUTHORITY DAMPIER MARINE SERVICES FACILITY PRELIMINARY SITE INVESTIGATION SAMPLING AND ANALYSIS PLAN IMPLEMENTATION REPORT
i:\projects\i01121 dampier marine services facility project\2.0 reports\ari\appendices\9 - acid sulfate soils assessment\psi -sap-ir 23-12-09.doc Page 14 301012-01121 : Rev 0 : 3-Dec-09
Figure 5 : Habitat within the proposed footprint

DAMPIER PORT AUTHORITY DAMPIER MARINE SERVICES FACILITY PRELIMINARY SITE INVESTIGATION SAMPLING AND ANALYSIS PLAN IMPLEMENTATION REPORT
i:\projects\i01121 dampier marine services facility project\2.0 reports\ari\appendices\9 - acid sulfate soils assessment\psi -sap-ir 23-12-09.doc Page 15 301012-01121 : Rev 0 : 3-Dec-09
Figure 6: Geotechnical core locations (Coffey 2008)
3.4 Previous Relevant Sediment Investigations
The DEC conducted a regional assessment of sediment quality from the Pilbara coast (DEC 2006b) This work indicated that sediments within the Dampier Archipelago are generally uncontaminated, and that levels of organic contaminants were below levels of detection at all locations.

DAMPIER PORT AUTHORITY DAMPIER MARINE SERVICES FACILITY PRELIMINARY SITE INVESTIGATION SAMPLING AND ANALYSIS PLAN IMPLEMENTATION REPORT
i:\projects\i01121 dampier marine services facility project\2.0 reports\ari\appendices\9 - acid sulfate soils assessment\psi -sap-ir 23-12-09.doc Page 16 301012-01121 : Rev 0 : 3-Dec-09
Within the Mermaid Sound region, a number of sediment quality studies have been undertaken as part of dredging assessments. The most extensive of these was the work completed for the Woodside Pluto project (Woodside Energy Limited 2006) which sampled in excess of 130 sites. All material met the NOGDM screening criteria, and was approved for unconfined sea disposal.
Hamersley Iron undertook sediment sampling as part of its maintenance and capital dredging projects in 2006. Five samples exceeded the Ecological Investigation Levels (EIL’s) (DEC 2003d) for chromium and manganese. These sediments destined for reclamation, did not exceed leachability guidelines.
Within the proposed dredge area, sediment investigations were undertaken in 2003 by ENV Australia (2003b) as part of initial development and construction of the bulk liquids wharf and expansion of the existing cargo wharf. An additional sediment investigation was then undertaken in 2007 by MScience (2007) as part of capital dredging works to expand the current cargo wharf facility. These studies represent the most relevant sediment characterisation studies undertaken to date, however they did not sample the entire area proposed for dredging in this project.
During 2007, sediment samples were collected from eight sampling locations within the existing cargo wharf berth pocket (MScience 2007). A hand corer was used by divers to penetrate sediments to a maximum depth of 0.75 m at each sampling location. Both studies were conducted in accordance with an approved Sediment Sampling and Analysis Plan (Commonwealth of Australia 2002).
These levels were also below the “clean” classification with reference to the DEC Landfill Classification Guidelines (DoE 2005).
Note that there is no guideline for land contamination values for TBT either from WA DEC or indeed in Australia. A useful guide can be obtained from the 2008 US EPA Region 9 Preliminary Remediation Goals residential soil criteria (www.epa.gov/region09/superfund/prg/index.html) for screening criteria to assess suitability for reuse in reclamation works. This work indicates a screening level of 18mg/kg for residential soil, and 180mg/kg for industrial soils. The TBT levels recorded in previous works were well below this level at 9.7mg/kg (MScience 2007). It should also be noted that these levels were confined to the surface sediments, and once dredged and mixed with underlying uncontaminated material would be several orders of magnitude below these guideline levels. All of the material sampled was assessed as suitable for unconfined sea disposal.
A summary of the results determined from each investigation have been provided below.

DAMPIER PORT AUTHORITY DAMPIER MARINE SERVICES FACILITY PRELIMINARY SITE INVESTIGATION SAMPLING AND ANALYSIS PLAN IMPLEMENTATION REPORT
i:\projects\i01121 dampier marine services facility project\2.0 reports\ari\appendices\9 - acid sulfate soils assessment\psi -sap-ir 23-12-09.doc Page 17 301012-01121 : Rev 0 : 3-Dec-09
3.4.1 Chemical Characteristics
2003 INVESTIGATION
Heavy metals, tributyltin (TBT), Polycyclic Aromatic Hydrocarbons (PAHs), Total Petroleum Hydrocarbons (TPHs), Volatile Organic Compounds (VOCs) and Polychlorinated Biphenyls (PCBs) analysed from sediments located within the proposed channel, Berth 2 and Berth 3 of the bulk liquid wharf areas were below background and/or screening levels.
Some TBT contamination was identified adjacent to the public wharf in surface sediments to 1 m depth. The 95% UCL TBT concentration for the DCW dredge area was above the screening levels of 5 µg/kg. TBT elutriate and toxicity testing were undertaken to further assess the risk associated with TBT exposure. Elutriate TBT concentrations were found to be compliant to ANZECC/ARMCANZ guidelines once a dilution factor of 5.5 had been applied to elutriate test results. TBT toxicity testing identified a marginal toxic effect in 20% of tested sediments and was considered suitable for confined ocean disposal. Dredging of this material occurred in 2004 with the material placed at the East Lewis Spoil Ground.
2007 INVESTIGATION
Results from implementation of the 2007 SAP (MScience 2007) established that with the exception of TBT, all parameters met the sea dumping criteria. TBT contamination of surface sediments within the selected cargo wharf berth area exceeded the screening criteria at some locations.
The results of 2007 sediment sampling are summarised below:
Tributyltin (TBT)
TBT was present at the cargo wharf berth area at concentrations above the screening level (5 µg/kg), at five of the eight sites after normalisation to 1% total organic carbon (TOC). The highest TBT concentration recorded was 33 μg/kg after normalisation to 1% TOC, 8.8 μg/kg before normalisation. Subsequently, calculation of the 95% UCL for TBT to determine the level of TBT contamination resulted in a concentration of 9.7 μg/kg which exceeded the screening level. This is not dissimilar to the revised Screening Level of 9 μg/kg that is in the current NAGD (2009).
As a result of the exceedance of the screening level by the 95% UCL, further testing and analysis of sediments from the cargo wharf berth was undertaken following consultation with DEWHA and in accordance with the NODGDM. Additional sediment samples were collected from original site locations within the cargo berth area that returned TBT concentrations above the screening level. The samples were analysed for MBT, DBT, TBT and TOC, and elutriate testing was also undertaken. While four of the five samples returned TBT concentrations above screening levels, TBT elutriate concentrations were below detection levels and therefore below the adopted 95% species protection level of 0.006 μg Sn/L (ANZECC/ARMCANZ 2000). It was concluded that the sediments to be dredged from the new cargo berth were suitable for unconfined ocean disposal.

DAMPIER PORT AUTHORITY DAMPIER MARINE SERVICES FACILITY PRELIMINARY SITE INVESTIGATION SAMPLING AND ANALYSIS PLAN IMPLEMENTATION REPORT
i:\projects\i01121 dampier marine services facility project\2.0 reports\ari\appendices\9 - acid sulfate soils assessment\psi -sap-ir 23-12-09.doc Page 18 301012-01121 : Rev 0 : 3-Dec-09
While a sea dumping approval was granted (and is still current to 31 Dec 2009) no dredging was undertaken due to the inability of the DPA to secure a dredge at an economic rate.
Trace Metals
Metal concentrations were below detection levels except for arsenic, chromium, cobalt, iron, manganese, nickel, vanadium and zinc. All metal concentrations were below the NODGDM screening levels.
PAH (Polycyclic Aromatic Hydrocarbons)
All analyses for PAH compounds recorded concentrations below detection limits.
TPH (Total Petroleum Hydrocarbons)
All analyses for TPH fractions recorded concentrations below detection limits.
Nutrients
All analyses for nutrients (nitrate and nitrite) recorded concentrations below detection limits.
2008 INVESTIGATION
As a previous design concept of the current project sea disposal of a proportion of the dredge sediments was proposed. Using the data collated from the above investigations a SAP was developed and approved by DEWHA in September 2008. Much of the information collated for that approved SAP has been used in the current investigation such as the contaminants of concern.”
3.5 Previous Acid Sulfate Soils Investigations
The majority of dredging projects undertaken with the Port of Dampier have placed material at sea, and hence very little work on Acid Sulfate Soils has been undertaken. Only two recent studies exist.; the Rio Tinto Dredging Program for the Dampier Port Upgrade (Sinclair Knight Mertz 2006) and works undertaken by Mermaid Marine Australia in 2009, and provided to the DPA as part of a Development Approval application.
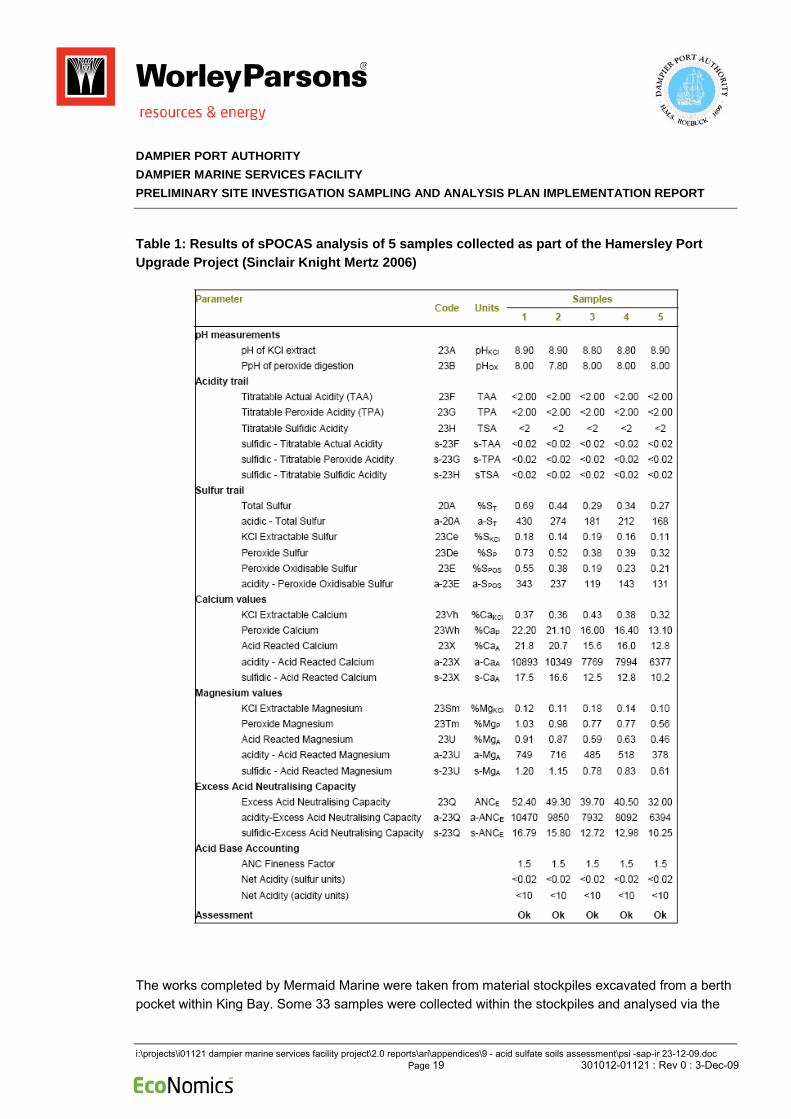
The Rio Tinto works completed sPOCAS analysis on 5 samples from the dredge area, which is located approximately 2km from the DMSF proposed area in a similar environment. The acid based accounting returned net acidity results below the level of detection (Sulphur Units <0.02), with significant excess neutralising capacity (Table 1)
DAMPIER PORT AUTHORITY DAMPIER MARINE SERVICES FACILITY PRELIMINARY SITE INVESTIGATION SAMPLING AND ANALYSIS PLAN IMPLEMENTATION REPORT
i:\projects\i01121 dampier marine services facility project\2.0 reports\ari\appendices\9 - acid sulfate soils assessment\psi -sap-ir 23-12-09.doc Page 19 301012-01121 : Rev 0 : 3-Dec-09
Table 1: Results of sPOCAS analysis of 5 samples collected as part of the Hamersley Port Upgrade Project (Sinclair Knight Mertz 2006)
The works completed by Mermaid Marine were taken from material stockpiles excavated from a berth pocket within King Bay. Some 33 samples were collected within the stockpiles and analysed via the

DAMPIER PORT AUTHORITY DAMPIER MARINE SERVICES FACILITY PRELIMINARY SITE INVESTIGATION SAMPLING AND ANALYSIS PLAN IMPLEMENTATION REPORT
i:\projects\i01121 dampier marine services facility project\2.0 reports\ari\appendices\9 - acid sulfate soils assessment\psi -sap-ir 23-12-09.doc Page 20 301012-01121 : Rev 0 : 3-Dec-09
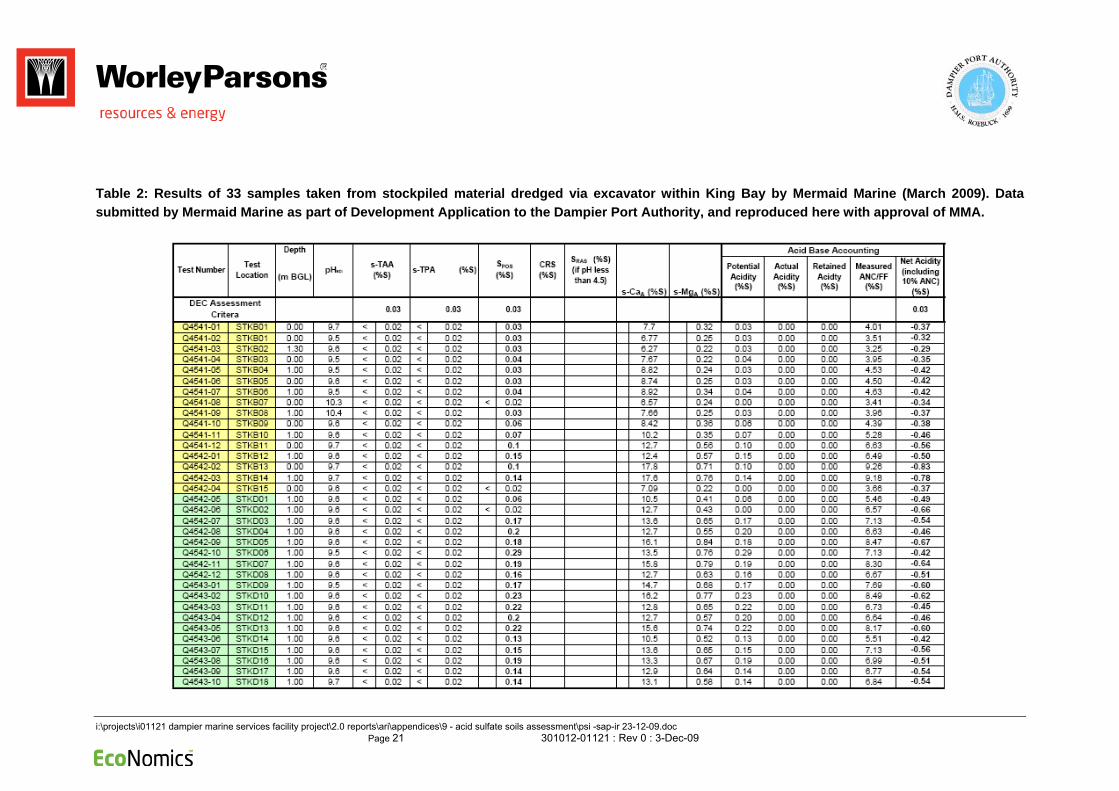
sPOCAS method. Results indicated that the total percentage sulphur was below detection and all the samples had excess neutralising capacity (see Table 2).
The sediments within Mermaid Sound are generally very low in Total Organic Carbon (TOC), with results typically less than 0.1%. Results from total organic carbon analysis indicate that the total organic content of the sediments is too low for monosulfidic black oozes (MBOs) to be present.
i:\projects\i01121 dampier marine services facility project\2.0 reports\ari\appendices\9 - acid sulfate soils assessment\psi -sap-ir 23-12-09.doc Page 21 301012-01121 : Rev 0 : 3-Dec-09
Table 2: Results of 33 samples taken from stockpiled material dredged via excavator within King Bay by Mermaid Marine (March 2009). Data submitted by Mermaid Marine as part of Development Application to the Dampier Port Authority, and reproduced here with approval of MMA.

DAMPIER PORT AUTHORITY DAMPIER MARINE SERVICES FACILITY PRELIMINARY SITE INVESTIGATION SAMPLING AND ANALYSIS PLAN IMPLEMENTATION REPORT
i:\projects\i01121 dampier marine services facility project\2.0 reports\ari\appendices\9 - acid sulfate soils assessment\psi -sap-ir 23-12-09.doc Page 22 301012-01121 : Rev 0 : 3-Dec-09
3.6 Potential Contaminants
The Port of Dampier is remote from urban, agriculture and commercial centres. The nearest townships are Dampier, located 5 km to the south west of the port, and Karratha, located 20 km to the east of the port. The Port is remote from any catchment influences such as agricultural and urban runoff due its physical location on the Burrup Peninsular and low annual rainfall.
Industrial land uses are the primary source for potential contamination of sediments in the proposed dredge area. Desalination plant discharge outfalls, vessel maintenance activities, mooring and bunkering of tugs and stormwater inputs exist within King Bay to the south of the proposed development area while fuel storage, shipping activities, including the export of bulk liquids (anhydrous ammonia loading), general cargo, copper and nickel metal concentrate exist adjacent to the proposed dredge area (DPA 2007). Land uses surrounding the site are shown in Appendix A.
Previous investigations (ENV Australia 2003a; MScience 2007) indicated that TBT was the main contaminant of potential concern since it was the only analyte that exceeded the NODGDM (Environment Australia 2002) screening levels for 95% UCL concentrations calculated for each dredge area. While all other contaminants were below screening levels, a number of metal species were recorded above their respective detection limits. While PAHs and TPHs were not detected in the sediments located within and adjacent to the proposed dredge area in 2003 and 2007, it is possible that these contaminants which are typically related to shipping and wharf activities could be present in the sediments from the existing cargo berth, in existing shipping areas or have migrated to surrounding areas via currents and propeller wash.
3.7 Other Issues
3.7.1 Nutrients
Nutrient concentrations (total N, nitrate, nitrite, ammonia and total P) were also proposed for analysis as a concern was raised regarding the loading of Ammonia at the BLB. For clarification the ammonia that goes over the DBLB is as a low temp high pressure liquid. If spilt it instantly “boils off” and reverts to a gas and is not available to make nutrient levels high.
Assessment of nutrient concentrations in sediments will provide information on the productivity of the sediments and the potential for the release of nutrients in significant concentrations to the water column during reclamation and tail water discharge. It also provides background concentrations for subsequent impact assessment if required.
3.7.2 Acid Sulfate Soils
Review of existing data published by the Western Australia Planning commission (WAPC) of the terrestrial environment located adjacent to the proposed dredge footprint have categorised the areas as low risk. However, this data does not extend down to intertidal/subtidal areas. In consideration of

DAMPIER PORT AUTHORITY DAMPIER MARINE SERVICES FACILITY PRELIMINARY SITE INVESTIGATION SAMPLING AND ANALYSIS PLAN IMPLEMENTATION REPORT
i:\projects\i01121 dampier marine services facility project\2.0 reports\ari\appendices\9 - acid sulfate soils assessment\psi -sap-ir 23-12-09.doc Page 23 301012-01121 : Rev 0 : 3-Dec-09
this limitation, a preliminary site investigation was undertaken as part of this sampling program to identify ASS, since DPA propose to use the dredge material for reclamation fill.
3.7.3 PCBs
The Dampier Port area catchment is largely in its natural state, and mostly undeveloped. Several major installations (North West Shelf venture Gas Plant, developing Woodside Pluto gas plant, King Bay Industrial Estate and Rio Tinto’s Iron Ore facilities) are located within the area. The Port area in general, and more specifically the proposed dredging area receives very little runoff (as a potential transmission pathway) from developed areas relative to other Port areas in Australia. Annual rainfall is less than 300 mm, and the Port is not located at the terminus of a river system like many Australian Ports.
Sampling undertaken by the DPA in 2003 of the adjacent Bulk Liquids berth (approximately 700 m from the proposed dredging area) included PCB’s. All samples returned levels below limits of detection.
Since previous approved SAP documents of 2003, 2007 and 2008 there has been no change of use associated with port facilities within the vicinity of proposed dredge area and no reported chemical spill, fire or disposal of wastes that could have lead to PCBs entering the marine environment. Consequently PCBs are unlikely to be present within the proposed dredge area and were not tested as part of this preliminary site investigation.
DAMPIER PORT AUTHORITY DAMPIER MARINE SERVICES FACILITY PRELIMINARY SITE INVESTIGATION SAMPLING AND ANALYSIS PLAN IMPLEMENTATION REPORT
i:\projects\i01121 dampier marine services facility project\2.0 reports\ari\appendices\9 - acid sulfate soils assessment\psi -sap-ir 23-12-09.doc Page 24 301012-01121 : Rev 0 : 3-Dec-09
4. SAMPLING AND ANALYSIS
4.1 Sampling Rationale
The sampling and analysis of sediments undertaken complies with the requirements for large capital dredging projects (greater than 500,000 m3) in Appendix D of the NAGD and with the DEC requirements for Contaminated Sites. Although approval is not required from the Commonwealth for land based disposal and reclamation, the methods described have been developed in accordance with NAGD as they represent best practice in the sampling and assessment of marine sediments. Sediment quality results have be compared with the NAGD Screening Levels (which mirror the ANZECC/ARMCANZ 2000 sediment quality guidelines) and with the Investigation Levels prescribed in the Assessment Levels for Soil, Sediment and Water (DEC 2003a).
The number of samples and sample locations has been derived from the NAGD (Commonwealth of Australia 2009) as described in Section 4.2 and has also considered the requirements of the Contaminated Sites Management Series: Development of Sampling and Analysis Programs (DEC 2001a).
The SAP (Appendix A) was submitted to DEC contaminated land branch for comment prior to implementation. Comments received were incorporated into the Final SAP (Appendix A) and incorporated into this report.
4.2 Sampling Locations (and Horizons)
The number of sampling locations is based on Table 6 of the NAGD (Commonwealth of Australia 2009).
The NAGD states that for proposed dredge volumes over 500,000 m3 the sampling design should be based on a stratified approach in consideration of volume of contaminated and potentially contaminated dredge material at each site. Sediments located below 1 m depth represent 'underlying natural geological materials' that have not been exposed to contamination from anthropogenic sources. In consideration of this, the sampling area presented in Figure 10 of Appendix A has excluded sampling of sediments located deeper than 1 m.
Quantification of the number of sampling locations of the proposed dredge area has been calculated as follows:
• Previous SAP approved sediment investigations have identified contamination only in sediments <1m depth due to either core refusal and/or approved SAP requirements. Any contamination below 1m in capital material within the proposed dredge area is considered

DAMPIER PORT AUTHORITY DAMPIER MARINE SERVICES FACILITY PRELIMINARY SITE INVESTIGATION SAMPLING AND ANALYSIS PLAN IMPLEMENTATION REPORT
i:\projects\i01121 dampier marine services facility project\2.0 reports\ari\appendices\9 - acid sulfate soils assessment\psi -sap-ir 23-12-09.doc Page 25 301012-01121 : Rev 0 : 3-Dec-09
unlikely given there is historically low fine sediment deposition and the semi lithified nature of the sediments within the Port of Dampier (ENV Australia 2003a).
• NAGD (2009) states that for capital dredging projects in a port where there is some existing contamination overlying natural material, the number of sampling locations can be determined based on the volume of the contaminated or potentially contaminated material. The existing berth area covers an area of 23,000 m2 and has been classified as “suspect” requiring sampling from 9 sampling locations. The remaining approach and jetty areas covers an area of 444,764 m2 and has been classified as “probably clean” requiring sampling from a total of 27 sampling locations.
• Based on Table 2 of the DEC’s Draft Identification and Investigation of Acid Sulfate Soils the number of sampling locations required for PASS is usually 1 per 5,000 m2. For project areas greater than 40,000 m2 there is provision for reducing sampling densities providing the investigation program satisfactorily captures the various geological/geomorphological units at a site (DEC 2006c). Given the survey is preliminary in nature and there is a low risk of encountering PASS, acid sulfate soils were tested at each of the contaminant sampling locations described in Section 4.2.1 at each of the specified horizons within the dredge area. This correspond to 1 sample per 13,000 m2 on average. .
• PAHs and TPHs were not detected in the sediments located within and adjacent to the proposed dredge area in 2003 and 2007., However, as they are often associated with shipping activities they were sampled at all sampling locations within the existing shipping berth and at a randomly selected 25% (7 samples) of the sampling sites in the approach and jetty areas. The randomly selected sampling sites are specified in Table 4.
The position of each sampling location was determined based on the grid based sampling scheme detailed in NADG (2009). Sampling locations were randomly selected from the grid, and positioned in the centre of each selected grid square.
The 36 sampling locations associated with the proposed dredge area are presented in Figure 10 of Appendix A, with coordinates are provided in Table 3 and Table 4.
4.2.1 Sampling Horizons
As described in previous sections only surface sediments are sampled in the first instance, given that any contamination is likely to be restricted to the surface sediment layers. Up to two sampling horizons have been implemented as follows:
• 0-0.5 m using a sediment grab or diver core
• 0.5-1 m from diver core

DAMPIER PORT AUTHORITY DAMPIER MARINE SERVICES FACILITY PRELIMINARY SITE INVESTIGATION SAMPLING AND ANALYSIS PLAN IMPLEMENTATION REPORT
i:\projects\i01121 dampier marine services facility project\2.0 reports\ari\appendices\9 - acid sulfate soils assessment\psi -sap-ir 23-12-09.doc Page 26 301012-01121 : Rev 0 : 3-Dec-09
At each horizon a suite of contaminants were tested as described in Section 4.3. Refusal was not met at any site.
Table 3: Coordinates of sampling locations for sediment analysis in the existing berth area
Grid Column (Y) Grid Row (X) Easting (m) Northing (m) Elutriate TPH/PAH
7 10 473975 7720579 Y Y
6 5 473865 7720601 N Y
5 7 473909 7720623 Y Y
5 9 473953 7720623 N Y
4 5 473865 7720645 N Y
4 6 473887 7720645 N Y
4 10 473975 7720645 Y Y
3 11 473997 7720667 N Y
2 8 473931 7720689 N Y
Projection - WGS84 (UTM Zone 50)
Table 4: Coordinates of sampling locations for sediment analysis in the approach and jetty area
Grid Column (Y) Grid Row (X) Easting (m) Northing (m) Elutriate TPH/PAH
21 21 473777 7720377 N N
13 22 473832 7720817 N N
13 25 473997 7720817 N N
12 22 473832 7720872 N N
12 24 473942 7720872 Y Y
DAMPIER PORT AUTHORITY DAMPIER MARINE SERVICES FACILITY PRELIMINARY SITE INVESTIGATION SAMPLING AND ANALYSIS PLAN IMPLEMENTATION REPORT
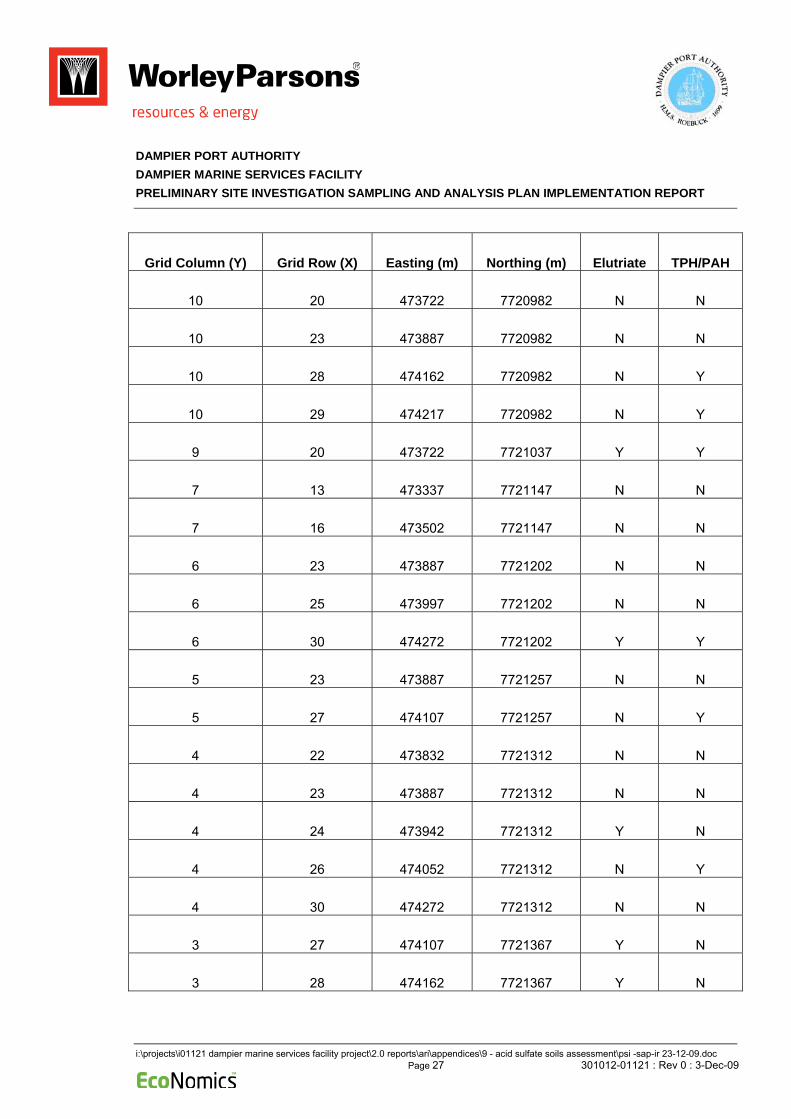
i:\projects\i01121 dampier marine services facility project\2.0 reports\ari\appendices\9 - acid sulfate soils assessment\psi -sap-ir 23-12-09.doc Page 27 301012-01121 : Rev 0 : 3-Dec-09
Grid Column (Y) Grid Row (X) Easting (m) Northing (m) Elutriate TPH/PAH
10 20 473722 7720982 N N
10 23 473887 7720982 N N
10 28 474162 7720982 N Y
10 29 474217 7720982 N Y
9 20 473722 7721037 Y Y
7 13 473337 7721147 N N
7 16 473502 7721147 N N
6 23 473887 7721202 N N
6 25 473997 7721202 N N
6 30 474272 7721202 Y Y
5 23 473887 7721257 N N
5 27 474107 7721257 N Y
4 22 473832 7721312 N N
4 23 473887 7721312 N N
4 24 473942 7721312 Y N
4 26 474052 7721312 N Y
4 30 474272 7721312 N N
3 27 474107 7721367 Y N
3 28 474162 7721367 Y N
DAMPIER PORT AUTHORITY DAMPIER MARINE SERVICES FACILITY PRELIMINARY SITE INVESTIGATION SAMPLING AND ANALYSIS PLAN IMPLEMENTATION REPORT
i:\projects\i01121 dampier marine services facility project\2.0 reports\ari\appendices\9 - acid sulfate soils assessment\psi -sap-ir 23-12-09.doc Page 28 301012-01121 : Rev 0 : 3-Dec-09
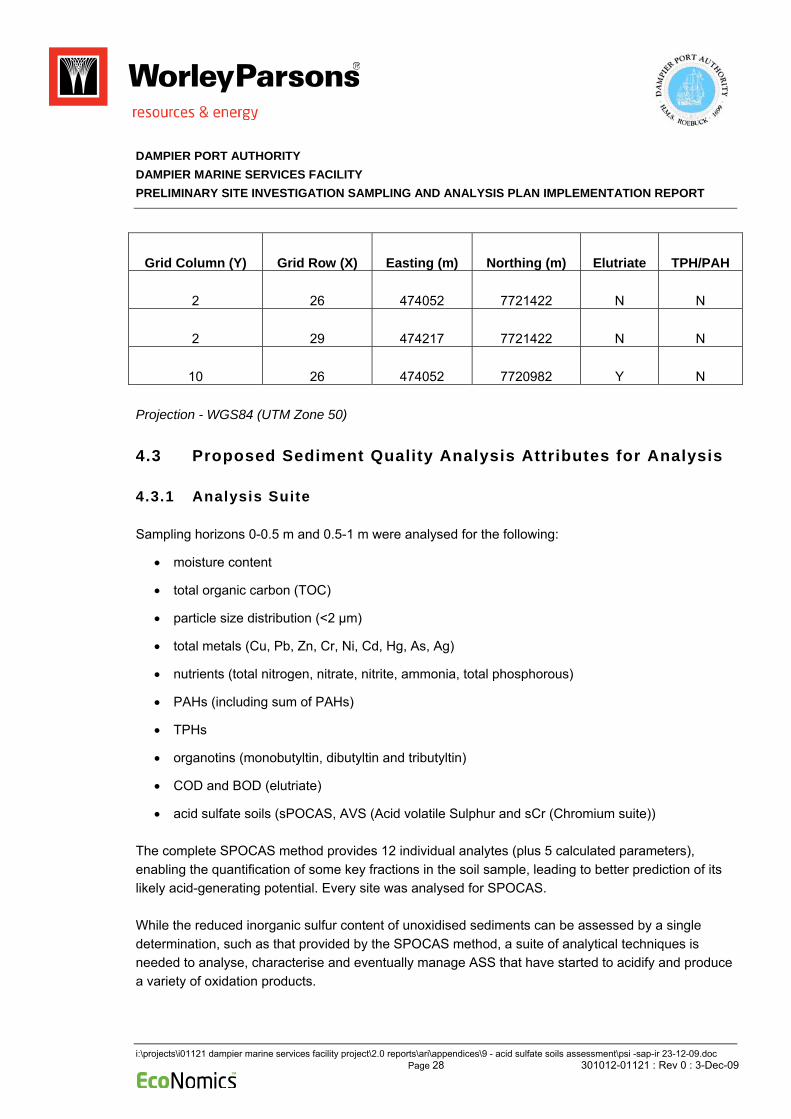
Grid Column (Y) Grid Row (X) Easting (m) Northing (m) Elutriate TPH/PAH
2 26 474052 7721422 N N
2 29 474217 7721422 N N
10 26 474052 7720982 Y N
Projection - WGS84 (UTM Zone 50)
4.3 Proposed Sediment Quality Analysis Attributes for Analysis
4.3.1 Analysis Suite
Sampling horizons 0-0.5 m and 0.5-1 m were analysed for the following:
• moisture content
• total organic carbon (TOC)
• particle size distribution (<2 µm)
• total metals (Cu, Pb, Zn, Cr, Ni, Cd, Hg, As, Ag)
• nutrients (total nitrogen, nitrate, nitrite, ammonia, total phosphorous)
• PAHs (including sum of PAHs)
• TPHs
• organotins (monobutyltin, dibutyltin and tributyltin)
• COD and BOD (elutriate)
• acid sulfate soils (sPOCAS, AVS (Acid volatile Sulphur and sCr (Chromium suite))
The complete SPOCAS method provides 12 individual analytes (plus 5 calculated parameters), enabling the quantification of some key fractions in the soil sample, leading to better prediction of its likely acid-generating potential. Every site was analysed for SPOCAS.
While the reduced inorganic sulfur content of unoxidised sediments can be assessed by a single determination, such as that provided by the SPOCAS method, a suite of analytical techniques is needed to analyse, characterise and eventually manage ASS that have started to acidify and produce a variety of oxidation products.

DAMPIER PORT AUTHORITY DAMPIER MARINE SERVICES FACILITY PRELIMINARY SITE INVESTIGATION SAMPLING AND ANALYSIS PLAN IMPLEMENTATION REPORT
i:\projects\i01121 dampier marine services facility project\2.0 reports\ari\appendices\9 - acid sulfate soils assessment\psi -sap-ir 23-12-09.doc Page 29 301012-01121 : Rev 0 : 3-Dec-09
In consultation with the DEC Contaminated Land Unit, it was decided to analyse a subset of fifteen samples for AVS and sCr. This subset of biogenic monosulfides are formed during the early stages of sulfate reduction by sulfate-reducing-bacteria and commonly called AVS, and they can be transformed to FeS2 (pyrite), which is known as CRS, and are main components of inorganic sulfur compositions of marine sediments. The sequential extractions of AVS and CRS have given a better appreciation of the acidity risk.
4.3.2 Elutriate Analysis
To minimise the need to recollect material for Phase 3 elutriate testing (if required), hold samples were taken for the horizon in the top 1m of sediment at selected sampling locations (refer to Section 4.2) and stored at the laboratory in the event that further testing is required.
4.4 Sample Collection and Processing
4.4.1 Sample Collection
Samples were collected using a Van Veen grab and supplemented by diver coring (push cores) at selected sites.
As the sampling locations are in areas subject to frequent ship traffic, sampling at most locations was restricted to using the grab sampler. Sampling by diver corer was undertaken at 5 sites
The sampling was be led by a suitably qualified environmental professional with experience in the application of the NAGD and sediment quality assessment. The following details/equipment were utilised by the team:
• onboard GPS (accurate to at least ± 10 m);
• onboard depth sounder (accurate to ± 0.25 m);
• an ability to maintain clean surfaces e.g. an on-board deck-hose for wash down (seawater to be drawn from below the surface);
• working areas were cleaned and prepared for sediment sampling activities prior to leaving moorings in the Port of Dampier to mobilise to the proposed dredge area; and
• Data sheets were completed in the field (for each sampling location) to document collection details and sediment descriptions.
4.4.2 Sample Processing
Samples were collected using either a stainless steel grab or polycarbonate diver cores (Figure 7).

DAMPIER PORT AUTHORITY DAMPIER MARINE SERVICES FACILITY PRELIMINARY SITE INVESTIGATION SAMPLING AND ANALYSIS PLAN IMPLEMENTATION REPORT
i:\projects\i01121 dampier marine services facility project\2.0 reports\ari\appendices\9 - acid sulfate soils assessment\psi -sap-ir 23-12-09.doc Page 30 301012-01121 : Rev 0 : 3-Dec-09
Figure 7: Van Veen grab used for surface sample collection
All samples were inspected for integrity to ensure that samples collected are representative of the sediment sampled. Sample handling onboard the vessel included sediment description logging, sample homogenisation, and containment for dispatch to analytical laboratories under chain of custody documentation. Samples were homogenised in large stainless steel mixing bowls using gloved hands (powderless latex gloves). A table of containers used for samples is provided in Table 5. Sample containers were labelled using indelible ink to record the sample location number and date on both the label and lid of the container, and were stored either in refrigerators or in eskies with ice packs, remained refrigerated until dispatched to the analytical testing laboratory were they are maintained at 4°C. ASS samples were frozen with no head space and dispatched frozen to the laboratory.
Table 5: Sample containers
Analyte Containers per sample
Chemical suite 2 x 500 ml solvent washed, glass jar with a Teflon lined lid
Particle size 1 x plastic bag to hold a minimum of 500 g sample
Acid sulfate soils 1 x plastic bag to hold a minimum of 200 g sample
Elutriate water (sea water) 1 x 15 L seawater in clean polythene carbouoy (1.5L per sample)
DAMPIER PORT AUTHORITY DAMPIER MARINE SERVICES FACILITY PRELIMINARY SITE INVESTIGATION SAMPLING AND ANALYSIS PLAN IMPLEMENTATION REPORT
i:\projects\i01121 dampier marine services facility project\2.0 reports\ari\appendices\9 - acid sulfate soils assessment\psi -sap-ir 23-12-09.doc Page 31 301012-01121 : Rev 0 : 3-Dec-09
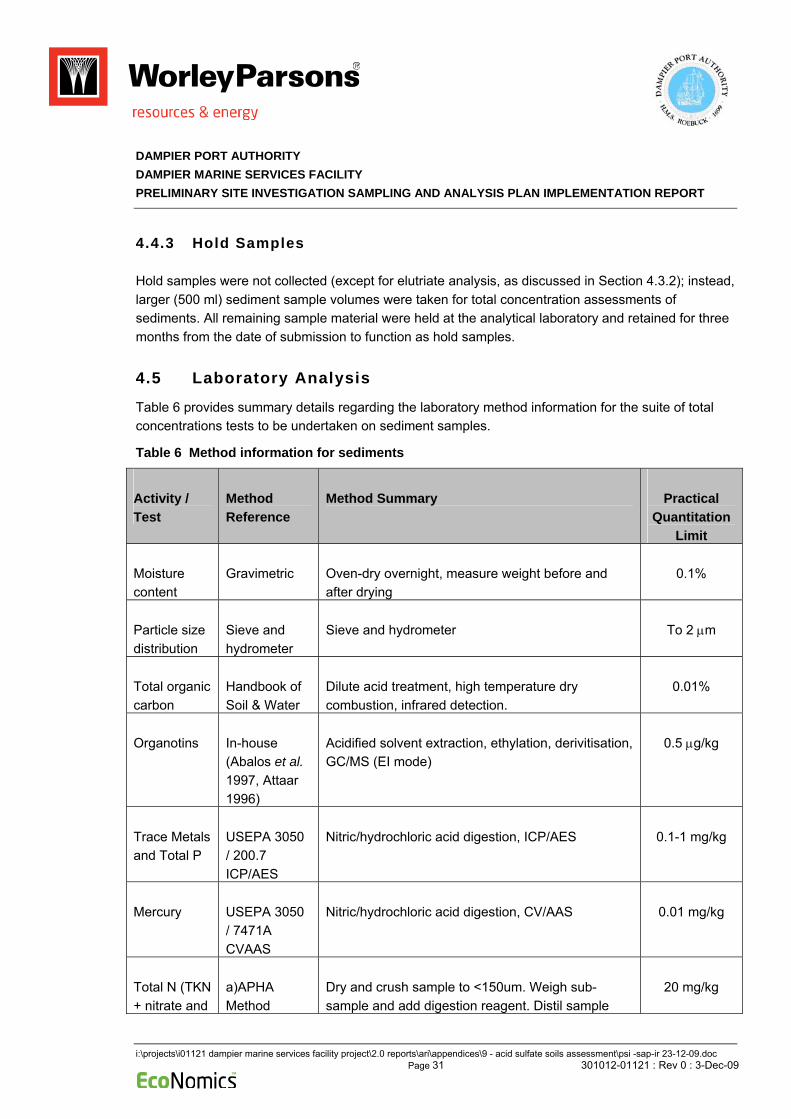
4.4.3 Hold Samples
Hold samples were not collected (except for elutriate analysis, as discussed in Section 4.3.2); instead, larger (500 ml) sediment sample volumes were taken for total concentration assessments of sediments. All remaining sample material were held at the analytical laboratory and retained for three months from the date of submission to function as hold samples.
4.5 Laboratory Analysis
Table 6 provides summary details regarding the laboratory method information for the suite of total concentrations tests to be undertaken on sediment samples.
Table 6 Method information for sediments
Activity / Test
Method Reference
Method Summary Practical Quantitation
Limit
Moisture content
Gravimetric Oven-dry overnight, measure weight before and after drying
0.1%
Particle size distribution
Sieve and hydrometer
Sieve and hydrometer To 2 μm
Total organic carbon
Handbook of Soil & Water
Dilute acid treatment, high temperature dry combustion, infrared detection.
0.01%
Organotins In-house (Abalos et al. 1997, Attaar 1996)
Acidified solvent extraction, ethylation, derivitisation, GC/MS (EI mode)
0.5 μg/kg
Trace Metals and Total P
USEPA 3050 / 200.7 ICP/AES
Nitric/hydrochloric acid digestion, ICP/AES 0.1-1 mg/kg
Mercury USEPA 3050 / 7471A CVAAS
Nitric/hydrochloric acid digestion, CV/AAS 0.01 mg/kg
Total N (TKN + nitrate and
a)APHA Method
Dry and crush sample to <150um. Weigh sub-sample and add digestion reagent. Distil sample
20 mg/kg

DAMPIER PORT AUTHORITY DAMPIER MARINE SERVICES FACILITY PRELIMINARY SITE INVESTIGATION SAMPLING AND ANALYSIS PLAN IMPLEMENTATION REPORT
i:\projects\i01121 dampier marine services facility project\2.0 reports\ari\appendices\9 - acid sulfate soils assessment\psi -sap-ir 23-12-09.doc Page 32 301012-01121 : Rev 0 : 3-Dec-09
Activity / Test
Method Reference
Method Summary Practical Quantitation
Limit nitrite) 4500B +
b) APHA Method 4500F
and titrate with sulphuric acid.
+ 1:5 sediment/water extraction followed by Flow Injection Analyser (FIA) with spectrophotometric detection.
ASS (SPOCAS)
Ahern 2004 Extraction with 1M KCL, oxidation of the soil with hydrogen peroxide, digested solution is analysed by ICP – AES and then titration with 0.05 M NaOH.
0.02% S 2mol H+/t
TPHs USEPA 3510/8015
Sample extracts are analysed by Capillary GC/FID and quantified against alkane standards over the range C10 - C36. This method is compliant with NEPM (1999) Schedule B (3) (Method 506.1).
3-5 mg/kg per fraction
PAHs USEPA 3640/8270
8270 GCMS Capillary column, SIM mode using large volume programmed temperature vaporisation injection.
0.004-0.005 mg/kg
Elutriate TBT Sample is extracted with seawater (at a ratio or 1:4) by tumbling for 1 hour and filtered or siphoned off. 500 mL of water is then spiked with surrogate, extracted with hexane, acidified to pH <2 and extracted with hexane. Extracts are combined, concentrated to 1 mL and derivatised using sodium tetraethylborate. The final extract is analysed for tributyltin by GCMS in SIM mode.
0.005 μg Sn/L
Porewater TBT
Extraction of pore water was performed by application of positive pressure and/or centrifuging. 500 mL of water is then spiked with surrogate, extracted with hexane, acidified to pH <2 and extracted with hexane. Extracts are combined, concentrated to 1 mL and derivatised using sodium tetraethylborate. The final extract is analysed for tributyltin by GCMS in SIM mode.
0.005 μg Sn/L

DAMPIER PORT AUTHORITY DAMPIER MARINE SERVICES FACILITY PRELIMINARY SITE INVESTIGATION SAMPLING AND ANALYSIS PLAN IMPLEMENTATION REPORT
i:\projects\i01121 dampier marine services facility project\2.0 reports\ari\appendices\9 - acid sulfate soils assessment\psi -sap-ir 23-12-09.doc Page 33 301012-01121 : Rev 0 : 3-Dec-09
5. SAMPLING AND ANALYSIS QUALITY CONTROL
5.1 Quality Control – Field Sampling
Quality Control during sampling was ensured by:
• using suitably qualified environmental staff experienced in sediment sampling, field supervision and sediment logging
• logs were competed for each sample collected including time, location, initials of sampler, duplicate type, chemical analyses to be performed and site observations
• chain of custody forms identifying (for each sample) the sampler, nature of the sample, collection date and time, analyses to be performed, sample preservation method and departure time from the site
• using a surveyed vessel which is thoroughly inspected and washed down
• samples contained in appropriately cleaned, pre-treated and labeled sample containers
• samples kept cool (4°C) after sampling and during transport, stored in eskies with pre-frozen ice bricks
• transportation of samples under chain of custody documentation
• additional QC samples to be generated in accordance with the NAGD (refer Section 5.2 below)
• all field QC duplicate/triplicate samples are to be ‘blind’ labeled in the field with QC field numbers which do not relate to sampling location names
• all sampling equipment, including mixing bowls etc. is to be decontaminated between sampling locations via a decontamination procedure involving a wash with ambient sea water and a laboratory grade detergent, and successive rinsing with deionised water; or by a similarly acceptable method.
5.2 Quality Control – Analysis
Advanced Analytical was used as the primary laboratory, who are NATA accredited for the methods used and are experienced in the analysis of marine sediments.
NAGD specifies the following quality control measures:
• Where volatile substances such as some chlorinated organics are being determined, one container (trip) blank filled with inert material, for example chromatographic sand.
DAMPIER PORT AUTHORITY DAMPIER MARINE SERVICES FACILITY PRELIMINARY SITE INVESTIGATION SAMPLING AND ANALYSIS PLAN IMPLEMENTATION REPORT
i:\projects\i01121 dampier marine services facility project\2.0 reports\ari\appendices\9 - acid sulfate soils assessment\psi -sap-ir 23-12-09.doc Page 34 301012-01121 : Rev 0 : 3-Dec-09
• For 10% of locations, one field triplicate (3 separate samples taken at the same location) to determine the variability of the sediment physical and chemical characteristics.
• Five percent of samples should be split into two containers to assess variation associated with sub-sample handling.
• One sample that has been analysed in a previous batch (if more that one batch is sent) to determine the analytical variation between batches.
• Hence the analytical laboratory were required to analyse the following additional quality assurance samples collected in the field:
• three ‘triplicate’ sets of samples (i.e. separate samples from the one location), which were tested for contaminant concentrations (organotins, trace metals, TPHs and PAHs) in the proposed dredge area
• five ‘duplicate’ split sample (i.e. duplicate samples formed from a homogenised sample at two locations), which were tested for contaminant concentrations (organotins, trace metals and PAHs) within the proposed dredge area.
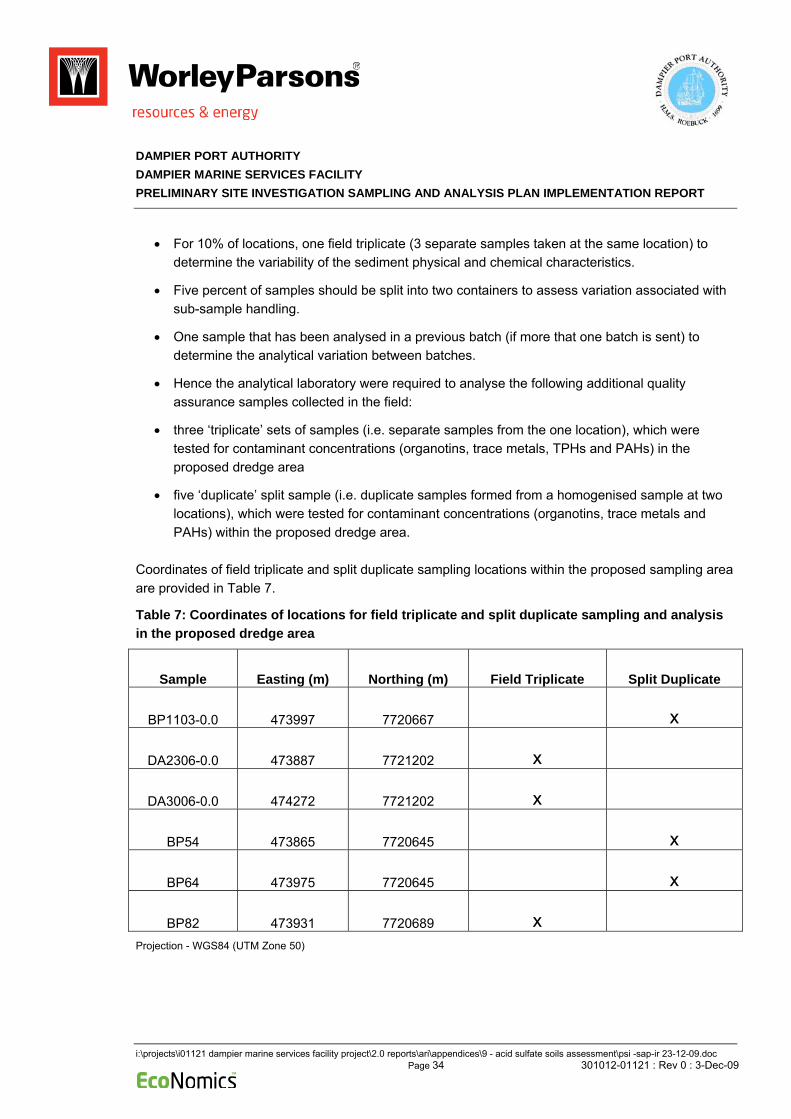
Coordinates of field triplicate and split duplicate sampling locations within the proposed sampling area are provided in Table 7.
Table 7: Coordinates of locations for field triplicate and split duplicate sampling and analysis in the proposed dredge area
Sample Easting (m) Northing (m) Field Triplicate Split Duplicate
BP1103-0.0 473997 7720667 x
DA2306-0.0 473887 7721202 x
DA3006-0.0 474272 7721202 x
BP54 473865 7720645 x
BP64 473975 7720645 x
BP82 473931 7720689 x Projection - WGS84 (UTM Zone 50)

DAMPIER PORT AUTHORITY DAMPIER MARINE SERVICES FACILITY PRELIMINARY SITE INVESTIGATION SAMPLING AND ANALYSIS PLAN IMPLEMENTATION REPORT
i:\projects\i01121 dampier marine services facility project\2.0 reports\ari\appendices\9 - acid sulfate soils assessment\psi -sap-ir 23-12-09.doc Page 35 301012-01121 : Rev 0 : 3-Dec-09
The analytical laboratory complied with the laboratory and quality assurance procedures specified in Appendix A and Appendix F of the NAGD (2009).
The laboratory quality assurance program should include the following quality control samples to be analysed in each batch (10-20 samples). This is in addition to its own internal procedures to ensure analytical procedures are conducted properly and produce reliable results:
• one laboratory blank sample
• one Standard Reference Material (SRM) i.e. a sample of certified composition such as MESS-1 or BCSS-1, or BEST-1 (for mercury)
• one sample spiked with the parameters being determined (or a surrogate spike for certain organics) at a concentration within the range of the method being employed
• one replicate sample to determine the precision of the analysis; the standard deviation and coefficient of variation to be documented.
A validation of the analytical data obtained has been undertaken in accordance with Appendix F of the NAGD (Commonwealth of Australia 2009) to confirm it is of a quality suitable for undertaking an assessment of dredge material suitability for sea disposal. This validation included a consideration of results for blanks, standards and spikes, and replicate and duplicate samples. Relative percent differences and relative standard deviations between quality control duplicate and triplicate samples has been compared against relevant criteria.
In accordance with DEC requirements, signed chain-of-custody forms recorded the receipt date and time and identify of samples included in shipments.

DAMPIER PORT AUTHORITY DAMPIER MARINE SERVICES FACILITY PRELIMINARY SITE INVESTIGATION SAMPLING AND ANALYSIS PLAN IMPLEMENTATION REPORT
i:\projects\i01121 dampier marine services facility project\2.0 reports\ari\appendices\9 - acid sulfate soils assessment\psi -sap-ir 23-12-09.doc Page 36 301012-01121 : Rev 0 : 3-Dec-09
6. RESULTS
Sediment samples were taken from Dampier Port at surface and 1m depths and analysed for a range contaminants as outlined in the National Assessment Guidelines for Dredging (Commonwealth of Australia 2009) and the Contaminated Sites Regulations (DEC 2003b).
Sections 6.1 through to 6.9 summarises the results from this investigation, and key statistics are presented in Table 8. Further information regarding analyte concentrations at all sampling locations can be observed in the laboratory reports in Appendix C.
Two sets of guidelines were used for this assessment. NAGD screening and guideline levels were used for assessment of impact relating to dredging and mobilisation of sediments (and potential contaminants into the water column) and the Ecological Investigation Levels prescribed in the Assessment Levels for Soil, Sediment and Water (DEC 2003d), to assess potential impacts relating to disposal of dredged material for reclamation purposes.

DAMPIER PORT AUTHORITY DAMPIER MARINE SERVICES FACILITY PRELIMINARY SITE INVESTIGATION SAMPLING AND ANALYSIS PLAN IMPLEMENTATION REPORT
i:\projects\i01121 dampier marine services facility project\2.0 reports\ari\appendices\9 - acid sulfate soils assessment\psi -sap-ir 23-12-09.doc Page 37 301012-01121 : Rev 0 : 3-Dec-09
Table 8: Sediment chemical results for the proposed dredge footprint
NAGD
Analytes Units PQL
Scre
enin
g
Max
imum
EILsa
Sedi
men
t C
once
ntra
tion
s (9
5% U
CL)
Max
imum
d
Min
imum
d
Mea
nb
Metals Silver mg/kg <0.1 1 3.7 - 0.05 0.05 0.05 0.05 Arsenic mg/kg <0.4 20 70 20 13.05 21 1.1 12.00 Cadmium mg/kg <0.1 1.5 10 3 0.17 0.26 0.05 0.16 Chromium mg/kg <0.1 80 370 50 43.13 59 2.3 39.76 Copper mg/kg <0.1 65 270 60 12.19 16 0.76 11.24 Mercury mg/kg <0.01 0.15 1 1 0.01 0.005 0.005 0.01 Nickel mg/kg <0.1 21 52 60 15.39 21 1.2 14.23 Lead mg/kg <0.5 50 220 300 3.37 4.1 1.4 3.24 Zinc mg/kg <0.5 200 410 200 15.32 20 1.7 14.30 Total Petroleum Hydrocarbonsc TPH C6-C9 mg/kg <10 - - 100 2.50 5 5 2.26 TPH C10-14 mg/kg <10 - - 500 2.50 5 5 2.26 TPH C15-28 mg/kg <50 - - 1000 2.50 2.5 2.5 1.13 TPH C29-36 mg/kg <50 - - - 2.50 2.5 2.5 1.13 Poly Aromatic Hydrocarbonsc
Naphthalene µg/kg <5 160 2100 5000 2.50 2.5 2.5 1.13 1-Methylnaphthalene µg/kg <5 - - - 2.50 2.5 2.5 1.13 2-Methylnaphthalene µg/kg <5 70 670 - 2.50 2.5 2.5 1.13 Acenaphthylene µg/kg <5 44 640 - 2.50 2.5 2.5 1.13 Acenaphthene µg/kg <5 16 500 - 2.50 2.5 2.5 1.13 Fluorene µg/kg <5 19 540 - 2.50 2.5 2.5 1.13 Phenanthrene µg/kg <5 240 1500 10000 3.99 70 2.5 2.74 Anthracene µg/kg <5 85 110 10000 2.50 2.5 2.5 1.13 Fluoranthene µg/kg <5 600 5100 10000 5.36 100 2.5 3.54 Pyrene µg/kg <5 665 2600 10000 4.75 72 2.5 2.79 Benz(a)anthracene µg/kg <5 261 1600 - 3.13 20 2.5 1.55 Chrysene µg/kg <5 384 280 - 4.13 40 2.5 2.02 Benzo(b)&(k)fluoranthene µg/kg <10 - - - 7.26 60 5 3.57 Benzo(a)pyrene µg/kg <5 430 1600 1000 3.43 26 2.5 1.69 Indeno(1,2,3-cd)pyrene µg/kg <5 4.13 40 2.5 2.02 Dibenz(a,h)anthracene µg/kg <5 63 260 - 2.50 2.5 2.5 1.13 Benzo(g,h,i)perylene µg/kg <5 - - - 3.63 30 2.5 1.79 Coronene µg/kg <10 - - - 5.00 5 5 2.26 Benzo(e)pyrene µg/kg <5 - - - 3.43 26 2.5 1.69
Tibutyltinc Tributyltin µg/kgc <0.5 9 70 50000 2.04 36 0.25 1.19
Total Organic Carbon Total Organic Carbon % <0.01 - - - 3.91 5.1 2.4 3.75
Nutrients Nitrate as N mg/kg <0.1 - - - 0.25 0.2 0.05 0.05 Nitrite as N mg/kg <0.1 - - - 0.25 0.2 0.05 0.05 Total Kjeldahl Nitrogen mg/kg <20 - - - 266.33 410 120 244.52 Total Ammonia as N mg/kg <0.1 - - - 4.91 12 2 4.42 Total Nitrogen mg/kg <20 - - - 266.33 410 120 244.52 Phosphorus mg/kg <1 - - - 375.06 530 33 353.10
a – Assessment levels for soil, sediment and water, Department of Environment, 2003 b - 95% upper confidence limit (UCL) of the arithmetic mean if normally distributed and the geomean if not normally distributed c – Normalised to 1% TOC d - Results less than LOR have been halved for statistical analysis.

DAMPIER PORT AUTHORITY DAMPIER MARINE SERVICES FACILITY PRELIMINARY SITE INVESTIGATION SAMPLING AND ANALYSIS PLAN IMPLEMENTATION REPORT
i:\projects\i01121 dampier marine services facility project\2.0 reports\ari\appendices\9 - acid sulfate soils assessment\psi -sap-ir 23-12-09.doc Page 38 301012-01121 : Rev 0 : 3-Dec-09
6.1 Metals
Two nickel surface and subsurface sediments samples were equivalent to the NAGD screening level of 21 mg/kg. One arsenic result exceeded the NAGD screening levels. The 95% UCLs of the sample results have been calculated (95% confidence limits of the mean) and compared to the Screening Levels (Table 8) in accordance with NADG. This analysis shows that metal concentrations were consistently below the screening levels.
Only chromium exceeded the EIL guidelines for land disposal at nine locations. The chromium exceedances of the EIL levels triggered assessment by determining the leachable concentration by ASLP1 and comparison to guidelines for Inert Landfill (Department of Environment and Conservation 1996).
Table 9 indicates that all samples were below the PQL for the laboratory and chromium levels observed are in an immobile form. Based on the ASLP guidelines the sediments are suitable for disposal ashore as reclamation (results are detailed in the laboratory results contained in Appendix C).
Table 9: Comparison of sediment and leachate data with landfill guidelines
Guidelines Sediment ASLP EILa ASLP1b
Parameter
mg/kg mg/kg mg/kg
Exceedances (% of total in parenthesis)
mg/L Exceedances(% of total in parenthesis)
Cr 50 - 39.76±13.0 9 (21%) <0.002±0 0 (0%)
1 The Australian Standard Leachate Procedure (ASLP) provides a method for the preparation of leachates from liquid and solid wastes, sediments, sludges and soils for assessing the potential of inorganic and semi-volatile organic contamination of groundwater, in a variety of disposal-to-land scenarios. The percentage of solids is determined and if sufficient liquid is extracted from the sample, the liquid is analysed separately from the leachate. A separate test portion is reduced in size to pass a 2.4 mm sieve and leached in an end over end manner for 18 hours at 30 rpm using an appropriate extraction solution. The solution used depends on the sample and water pH, acid/base properties and the nature of the landfill. Reference AS 4439.3-1997.

DAMPIER PORT AUTHORITY DAMPIER MARINE SERVICES FACILITY PRELIMINARY SITE INVESTIGATION SAMPLING AND ANALYSIS PLAN IMPLEMENTATION REPORT
i:\projects\i01121 dampier marine services facility project\2.0 reports\ari\appendices\9 - acid sulfate soils assessment\psi -sap-ir 23-12-09.doc Page 39 301012-01121 : Rev 0 : 3-Dec-09
6.2 Organotins
Sediment samples were analysed for TBT2 and one TBT result exceeded the NAGD screening levels. The 95% UCLs of the sample results have been calculated and standardised to 1% TOC and expressed as the 95% Upper Confidence Interval (95% UCL) (Table 8). This analysis shows that TBT concentrations were consistently below the screening levels. TBT did not exceed the EIL guidelines for land disposal.
6.3 Total Petroleum Hydrocarbons (TPHs)
Concentrations of normalised total petroleum hydrocarbons could not be compared to the NAGD because there are no screening or maximum levels for these contaminants. None of the individual or summed TPH levels in surface and subsurface sediments exceeded the EIL guidelines for land disposal.
6.4 Polynuclear Aromatic Hydrocarbons (PAHs)
None of the normalised total PAHs in surface and subsurface exceeded the NAGD maximum levels. None of the individual PAH levels in surface or subsurface sediments exceeded the EIL guidelines for land disposal.
6.5 Nutrients, COD and BOD
Concentrations of nutrients could not be compared to the NAGD because there are no screening or maximum levels for these analytes. Concentrations of nutrients could not be compared to the EIL guidelines as there are no limits for these analytes.
The nutrient concentrations recorded are similar to other studies in the area (Yannarie Solar 2007) and are generally low, which can be attributed to the relatively low nutrient supply . The main concern with resuspension of nutrients in sediments is exposure of previously deeply buried sediments and in situ porewaters to overlying waters, often resulting in exceedance of water quality objectives.
The waters of the northwest shelf region are oligotrophic with low availability of nitrogen, limiting rates of primary production (Woodside Energy Limited 2006). A proportion of resuspended material during dredging is inorganic and chemically inert. Fine sediments can remain in suspension for longer periods of time and become exposed to physical and chemical processes that result in desorbtion and/or absorption of nutrients. Phosphorous and ammonium nitrogen have high absorption rates to
2 and its degradation products dibutyltin and monobutyltin – See lab reports for results

DAMPIER PORT AUTHORITY DAMPIER MARINE SERVICES FACILITY PRELIMINARY SITE INVESTIGATION SAMPLING AND ANALYSIS PLAN IMPLEMENTATION REPORT
i:\projects\i01121 dampier marine services facility project\2.0 reports\ari\appendices\9 - acid sulfate soils assessment\psi -sap-ir 23-12-09.doc Page 40 301012-01121 : Rev 0 : 3-Dec-09
smaller particles and are most likely to be released to overlying waters due to physical and chemical changes to bottom substrate during dredging.
The COD and BOD results (Table 10) indicate there are low levels of readily available forms of bioavailable nutrients, and the mobilisation of sediments should not release nutrients capable of oxygen depletion from degradation of nutrients.
Table 10: COD & BOD results from elutriate analysis
Sample COD on Sediment Elutriate BOD on Sediment Elutriate mg/L mg/L
BP1103-0.0 6 5 DA1607-0.0 4 <2 DA2009-0.0 8 5 DA2204 3 <2 DA2304-0.0 4 3 DA2305 <2 <2 DA2306-0.0 4 <2 DA2404 6 <2 DA2602 5 <2 DA2604 5 <2 DA2703 9 9 DA2803 4 2 DA2902 <2 <2 DA3004 <2 <2 DA3006-0.0 4 4
Elutriate Blank <2 <2
6.6 Total Organic Carbon
Sediments of the Dampier Harbour are generally low in organic carbon as there are no major riverine inputs or substantial fringing mangroves within the area. In particular, the sediments in and around berths have been shown to be particularly low in ToC in studies of the same area (MScience 2005a; MScience 2005b). ToC levels here were higher than expected i.e. mean of 3.75% (Table 8). Samples with the highest TOC values were sent to an alternative laboratory to act as a QA sample. Results indicated the original TOC results (Appendix C and Table 8) were an artefact of a laboratory matrix error. Results from the QA analysis are detailed in Appendix D. Results that were normalised were rechecked against this new data and the results presented in this report remain true.
6.7 Acid Sulphate Soils
Potential Acid Sulphate Soils (PASS) are naturally occurring soils, sediments and peats that contain iron sulphides, predominantly in the form of pyrite which have not been oxidised . PASS are benign

DAMPIER PORT AUTHORITY DAMPIER MARINE SERVICES FACILITY PRELIMINARY SITE INVESTIGATION SAMPLING AND ANALYSIS PLAN IMPLEMENTATION REPORT
i:\projects\i01121 dampier marine services facility project\2.0 reports\ari\appendices\9 - acid sulfate soils assessment\psi -sap-ir 23-12-09.doc Page 41 301012-01121 : Rev 0 : 3-Dec-09
when in a waterlogged environment; however, when exposed to the atmosphere they become oxidised and can result in the production of sulphuric acid.
DEC has compiled maps of Acid Sulphate Soils risk areas for several coastal regions of WA. These provide a broad-scale indication of the areas where ASS are most likely to exist. The risk map identifies the Dampier Port as a low risk ASS area. The following sections indicate the results of the field survey which confirm the map series.
In consultation with DEC Contaminated Lands Branch, DPA adopted a combination of analyses to develop a more detailed knowledge of the soil chemistry in the dredge footprint.
In the first instance all samples were analysed for Suspension Peroxide Oxidation Combined Acidity and Sulfate (SPOCAS) (Section 6.7.1). Total sulfur (STotal) as determined in SPOCAS, is considered to consist of three fractions: total reduced inorganic S (TRIS), oxidised S (or sulfate) and organic S (i.e. Total S = TRIS + SO4 + Organic S).
Reduced inorganic S (TRIS)3 was further subdivided into elemental S (S0), acid volatile S (AVS) and pyrite S. To determine these various fractions, two analytical methods were used. One method measures only acid volatile sulphur (AVS) (Section 6.7.2) and the chromium reduction method (SCr) (Section 6.7.3) measures the total reduced S, including S0. These methods were employed on the same samples.
6.7.1 Suspension Peroxide Oxidation Combined Acidity and Sulfate (SPOCAS)
The SPOCAS method was utilised for sediment samples which were analysed in the laboratory. It provides a measurement of the maximum oxidisable sulphur, Titratable Actual Acicidty, Titratable Peroxide Acidity and the potential Acid Neutralising Capacity present in the sediment sample. The SPOCAS method allows the net acidity of samples to be determined (Department of Environment 2006). The discussion below outlines the results of the SPOCAS analysis.
pHKCl: This provides an indication of Actual Acidity. Determination of Actual Acidity is necessary on soil with a laboratory pHKCL less than 5.5; however, this does not detect any unoxidised sulfides (e.g. Potential Acid Sulfate Soils-PASS). The results for pHKCL show high pH values, indicating basic conditions, with the lowest recorded pH being 9.32. This is to be expected as marine muds which are
3 While the reduced inorganic sulfur content of unoxidised sediments can be assessed by a single determination, such as that provided by the chromium reducible sulfur method, a suite of analytical techniques is needed to analyze, characterise and eventually manage ASS that have started to acidify and produce a variety of oxidation products.

DAMPIER PORT AUTHORITY DAMPIER MARINE SERVICES FACILITY PRELIMINARY SITE INVESTIGATION SAMPLING AND ANALYSIS PLAN IMPLEMENTATION REPORT
i:\projects\i01121 dampier marine services facility project\2.0 reports\ari\appendices\9 - acid sulfate soils assessment\psi -sap-ir 23-12-09.doc Page 42 301012-01121 : Rev 0 : 3-Dec-09
water logged and commonly have a pH greater than 7 (this reflects seawater influence which has a pH of 8.2. Therefore the oxidation potential requires analysis.
pHOx: This parameter provides an indication of the potential acid sulfate soil (PASS) or stored acidity within the profile. When the pHOX is less than 3, then this indicates that PASS is likely. From the results it can be seen that the pHOX values are quite high with the lowest value being 8.0. This is indicates that PASS is unlikely; however, the test is qualitative, it simply provides an indication of whether sulfides may occur (Department of Environment 2006).
The Acid Neutralising Capacity (ANC) is a measure of the soils ability to buffer acidity and resist the lowering of pH. The ANC may be provided by dissolution of calcium and or magnesium Carbonates (shell or limestone), cation exchange reactions and by reaction with the organic and clay fractions (Acid Sulphate Soils Management Series guidelines). Results demonstrate that the ANC ranges from 15% CaCO3 to 20.4% (however the effectiveness of this buffering capacity is dependent on the type and quantities of clay minerals in the soil, the type and amount and particle size of carbonates or other mineral present.
Total Sulfur (STotal) can be measured using a variety of chemical and instrumental techniques. The measurement of total sulphur provides a low-cost alternative for estimating the maximum potential environmental risk from acid produced by the oxidation of sulphides. The total sulphur value can be converted to equivalent acid neutralising capacity (eg. a-STotal):
STotal (%) x 623.7 = a-STotal (mol H+/t)
Peroxide sulphur SP is measured on a filtered solution, following soil digestion with peroxide and TPA titration. The SP measurement by itself has limited application since it includes sulphate salts with no acid-generating potential (such as gypsum), sulphur from the oxidation of organic matter, as well as that derived from sulphides. In acid sulphate soil without appreciable jarositic sulphur or other relatively insoluble acid-producing sulphates, the peroxide sulphur should approximately equal the total sulphur.
SPOCAS RESULTS
Action criteria define when acid sulphate soils disturbed at a site will need to be managed. Action criteria are based on the sum of existing plus potential acidity. The highest result(s) should always be used to assess if the relevant action criteria level has been met or exceeded as using the average or mean of a range of results is not appropriate (Dear et al. 2002). If a soil shows evidence of self neutralising or self-buffering (eg. TPA = 0 or not detectable and the ANCE>a-STotal) then a case may be made for reduced or no treatment (Dear et al. 2002).
The data in Table 11 indicate the following:
DAMPIER PORT AUTHORITY DAMPIER MARINE SERVICES FACILITY PRELIMINARY SITE INVESTIGATION SAMPLING AND ANALYSIS PLAN IMPLEMENTATION REPORT
i:\projects\i01121 dampier marine services facility project\2.0 reports\ari\appendices\9 - acid sulfate soils assessment\psi -sap-ir 23-12-09.doc Page 43 301012-01121 : Rev 0 : 3-Dec-09
• All samples had acidity trail parameters below detection; and
• All samples had an ANCE > Total Sulphur.
The dredge material is therefore self-neutralising and is suitable for disposal ashore as landfill in the reclamation area.

DAMPIER PORT AUTHORITY DAMPIER MARINE SERVICES FACILITY PRELIMINARY SITE INVESTIGATION SAMPLING AND ANALYSIS PLAN IMPLEMENTATION REPORT
i:\projects\i01121 dampier marine services facility project\2.0 reports\ari\appendices\9 - acid sulfate soils assessment\psi -sap-ir 23-12-09.doc Page 44 301012-01121 : Rev 0 : 3-Dec-09
Table 11 : Acid Sulphate Soil Assessment - SPOCAS
SPOCAS
Field Observations Lab pH Acidity Trail Sulfur Trail pH
KC
l
pH O
X
TAA
TPA
TSA
s-TA
A
s-TP
A
s-TS
A
S KC
L
S P
S PO
S
S AS
AN
CE
Net
Aci
dity
ID
pH units
pH units
mole H+/t
mole H+/t
mole H+/t %S %S %S %S %S %S mole
H+/t %S %S
Assessment Criteria* NV NV NV NV NV 0.03 0.03 NV NV NV 0.03 NV NV NV
BP1103-0.0 9.3 8.6 <2 <2 <2 <0.02 <0.02 <0.02 0.1 0.38 0.29 171 16.1 <0.02 DA1607 - 0.0 9.3 8.3 <2 <2 <2 <0.02 <0.02 <0.02 0.14 0.58 0.34 280 15.5 <0.02 DA2009 - 0.0 9.4 8.6 <2 <2 <2 <0.02 <0.02 <0.02 0.14 0.66 0.23 321 16.4 <0.02 DA2204 9.3 8.3 <2 <2 <2 <0.02 <0.02 <0.02 0.12 0.53 0.41 256 15.6 <0.02 DA2304-0.0 9.4 8.6 <2 <2 <2 <0.02 <0.02 <0.02 0.16 0.62 0.46 287 15.8 <0.02 DA2305 9.3 8.2 <2 <2 <2 <0.02 <0.02 <0.02 0.11 0.58 0.43 294 15.7 <0.02 DA2306-0.0 9.3 8.5 <2 <2 <2 <0.02 <0.02 <0.02 0.1 0.5 0.38 249 15.4 <0.02 DA2404 9.3 8 <2 <2 <2 <0.02 <0.02 <0.02 0.14 0.63 0.39 305 15.9 <0.02 DA2602 9.3 8.5 <2 <2 <2 <0.02 <0.02 <0.02 0.14 0.52 0.35 238 15.5 <0.02 DA2704 9.4 8.6 <2 <2 <2 <0.02 <0.02 <0.02 0.13 0.49 0.35 226 15.7 <0.02 DA2703 9.4 8.3 <2 <2 <2 <0.02 <0.02 <0.02 0.11 0.44 0.43 210 16.1 <0.02 DA2803 9.3 8.5 <2 <2 <2 <0.02 <0.02 <0.02 0.13 0.53 0.39 250 15.3 <0.02 DA2902 9.3 8.3 <2 <2 <2 <0.02 <0.02 <0.02 0.12 0.49 0.4 230 15 <0.02 DA3004 9.4 8.6 <2 <2 <2 <0.02 <0.02 <0.02 0.08 0.44 0.35 226 16.2 <0.02 DA3006-0.0 9.3 8.4 <2 <2 <2 <0.02 <0.02 <0.02 0.17 0.47 0.33 191 16.4 <0.02 BP1103 - 1.0 9.3 8.2 <2 <2 <2 <0.02 <0.02 <0.02 0.14 0.38 0.23 144 17.3 <0.02 DA1607 - 1.0 9.2 8.4 <2 <2 <2 <0.02 <0.02 <0.02 0.22 0.5 0.29 179 17.4 <0.02 DA2009 - 1.0 9.3 8.4 <2 <2 <2 <0.02 <0.02 <0.02 0.18 0.76 0.58 362 19.5 <0.02 DA2304 - 1.0 9.2 8.6 <2 <2 <2 <0.02 <0.02 <0.02 0.13 0.44 0.3 190 16.6 <0.02 DA2306 - 1.0 9.2 8.4 <2 <2 <2 <0.02 <0.02 <0.02 0.13 0.45 0.32 202 16.4 <0.02 DA2705 9.3 8.5 <2 <2 <2 <0.02 <0.02 <0.02 0.19 0.44 0.25 158 16.7 <0.02 DA3006 - 1.0 9.4 8.6 <2 <2 <2 <0.02 <0.02 <0.02 0.14 0.35 0.21 129 19.6 <0.02 BP54 9.4 8.6 <2 <2 <2 <0.02 <0.02 <0.02 0.14 0.32 0.18 113 20.4 <0.02 BP56 9.4 8.4 <2 <2 <2 <0.02 <0.02 <0.02 0.13 0.3 0.17 107 17.9 <0.02 BP64 9.4 8.7 <2 <2 <2 <0.02 <0.02 <0.02 0.11 0.34 0.23 141 18.5 <0.02 BP75 9.4 8.5 <2 <2 <2 <0.02 <0.02 <0.02 0.15 0.37 0.21 132 18.8 <0.02 BP82 9.4 8.4 <2 <2 <2 <0.02 <0.02 <0.02 0.15 0.35 0.2 124 18.9 <0.02 BP95 9.4 8.1 <2 <2 <2 <0.02 <0.02 <0.02 0.16 0.34 0.18 112 18 <0.02 BP104 9.4 8.3 <2 <2 <2 <0.02 <0.02 <0.02 0.13 0.35 0.22 136 18.1 <0.02 BP107 9.5 8.2 <2 <2 <2 <0.02 <0.02 <0.02 0.11 0.3 0.19 120 18.7 <0.02 DA1307 9.4 8.2 <2 <2 <2 <0.02 <0.02 <0.02 0.18 0.36 0.18 111 17.6 <0.02 DA2010 9.3 8.1 <2 <2 <2 <0.02 <0.02 <0.02 0.17 0.38 0.21 131 17 <0.02 DA2121 9.3 8.3 <2 <2 <2 <0.02 <0.02 <0.02 0.15 0.42 0.27 166 17.2 <0.02 DA2212 9.4 8.2 <2 <2 <2 <0.02 <0.02 <0.02 0.19 0.41 0.22 137 18.7 <0.02 DA2213 9.4 8.3 <2 <2 <2 <0.02 <0.02 <0.02 0.17 0.32 0.15 93 19.3 <0.02 DA2310 9.3 8.1 <2 <2 <2 <0.02 <0.02 <0.02 0.13 0.38 0.25 157 17 <0.02 DA2412 9.4 8.1 <2 <2 <2 <0.02 <0.02 <0.02 0.11 0.34 0.23 143 16.9 <0.02 DA2506 9.4 8.2 <2 <2 <2 <0.02 <0.02 <0.02 0.18 0.45 0.27 167 17.1 <0.02 DA2513 9.3 8.2 <2 <2 <2 <0.02 <0.02 <0.02 0.14 0.31 0.18 110 17.7 <0.02 DA2610 9.3 8.2 <2 <2 <2 <0.02 <0.02 <0.02 0.15 0.41 0.26 164 17.2 <0.02 DA2810 9.4 8.2 <2 <2 <2 <0.02 <0.02 <0.02 0.17 0.43 0.26 165 16.9 <0.02 DA2910 9.3 8.1 <2 <2 <2 <0.02 <0.02 <0.02 0.16 0.39 0.23 144 17 <0.02

DAMPIER PORT AUTHORITY DAMPIER MARINE SERVICES FACILITY PRELIMINARY SITE INVESTIGATION SAMPLING AND ANALYSIS PLAN IMPLEMENTATION REPORT
i:\projects\i01121 dampier marine services facility project\2.0 reports\ari\appendices\9 - acid sulfate soils assessment\psi -sap-ir 23-12-09.doc Page 45 301012-01121 : Rev 0 : 3-Dec-09
6.7.2 Acid Volatile S (AVS)
The acid volatile S fraction was analysed in 15 randomly selected sampled (also analysed for SPOCAS). AVS has been shown to be a major factor controlling the bioavailability and toxicity of many common trace metals, such as Cd, Cu, Ni, Pb, and Zn (Burton GA et al. 2007).
Results from total organic carbon analysis indicate that the total organic content of the sediments is too low for monosulfidic black oozes (MBOs) or AVS to be present.
Table 12 summarises the results of laboratory analysis on samples that were collected and indicate AVS is not of concern with the dredging and reclamation of sediments.
Table 12: AVS laboratory results
Field Observations Lab pH AVS
pH K
Cl
pH O
X
AVS
ID
pH units pH units %
Assessment Criteria* NV NV NV BP1103-0.0 9.3 8.6 <0.001 DA1607 - 0.0 9.3 8.3 0.002 DA2009 - 0.0 9.4 8.6 <0.001 DA2204 9.3 8.3 <0.001 DA2304-0.0 9.4 8.6 <0.001 DA2305 9.3 8.2 <0.001 DA2306-0.0 9.3 8.5 <0.001 DA2404 9.3 8 <0.001 DA2602 9.3 8.5 <0.001 DA2704 9.4 8.6 <0.001 DA2703 9.4 8.3 0.001 DA2803 9.3 8.5 0.001 DA2902 9.3 8.3 0.001 DA3004 9.4 8.6 <0.001 DA3006-0.0 9.3 8.4 <0.001

DAMPIER PORT AUTHORITY DAMPIER MARINE SERVICES FACILITY PRELIMINARY SITE INVESTIGATION SAMPLING AND ANALYSIS PLAN IMPLEMENTATION REPORT
i:\projects\i01121 dampier marine services facility project\2.0 reports\ari\appendices\9 - acid sulfate soils assessment\psi -sap-ir 23-12-09.doc Page 46 301012-01121 : Rev 0 : 3-Dec-09
6.7.3 Total Reduced S
The chromium reduction method (SCr) measures the total reduced S, including S0. SCr was analysed in 15 randomly selected sampled (also analysed for SPOCAS). Reduced inorganic sulfur compounds in acid sulfate soil are of environmental concern due to their acid-generating potential. DEC’s preference is to use SPOCAS unless the soils are highly organic, such as peat.
For soils with oxidisable sulfur results close to the action criteria, particularly sands (current action limit = 0.03 %S or 18 mol H+/t), the SCR method generally provides a better estimate of the soil’s sulfide content. Whenever there is a variation between the sulfur measurement results from various sulfur methods used to predict sulfidic acidity (e.g. SCR, SPOS), then the SCR result should take precedence for use in the acid-base account.
Adopting the above it can be seen in Table 13, that Spos is higher than Scr, increasing the ANCe and demonstrating the material is suitable for onshore disposal.
Table 13: Chromium suite results and comparison to SPOCAS (Spos)
Lab pH SCR Suite SPOCAS
pH K
Cl
pH O
X
pH K
Cl
TAA
Scr
Spos
Diff
eren
ce
ID pH
units pH units pH units %S %S %S %S
Assessment Criteria*
NV NV NV 0.03 0.03 0.03 NV
BP1103-0.0 9.3 8.6 9.4 <0.02 0.13 0.27 -0.14 DA1607 - 0.0 9.3 8.3 9.3 <0.02 0.13 0.45 -0.32 DA2009 - 0.0 9.4 8.6 9.3 <0.02 0.11 0.52 -0.41 DA2204 9.3 8.3 9.4 <0.02 0.21 0.41 -0.2 DA2304-0.0 9.4 8.6 9.4 <0.02 0.22 0.46 -0.24 DA2305 9.3 8.2 9.4 <0.02 0.23 0.47 -0.24 DA2306-0.0 9.3 8.5 9.4 <0.02 0.22 0.4 -0.18 DA2404 9.3 8 9.4 <0.02 0.14 0.49 -0.35 DA2602 9.3 8.5 9.4 <0.02 0.19 0.38 -0.19 DA2704 9.4 8.6 9.4 <0.02 0.14 0.36 -0.22 DA2703 9.4 8.3 9.4 <0.02 0.17 0.34 -0.17 DA2803 9.3 8.5 9.4 <0.02 0.21 0.4 -0.19 DA2902 9.3 8.3 9.4 <0.02 0.22 0.37 -0.15 DA3004 9.4 8.6 9.4 <0.02 0.11 0.36 -0.25 DA3006-0.0 9.3 8.4 9.3 <0.02 0.17 0.31 -0.14

DAMPIER PORT AUTHORITY DAMPIER MARINE SERVICES FACILITY PRELIMINARY SITE INVESTIGATION SAMPLING AND ANALYSIS PLAN IMPLEMENTATION REPORT
i:\projects\i01121 dampier marine services facility project\2.0 reports\ari\appendices\9 - acid sulfate soils assessment\psi -sap-ir 23-12-09.doc Page 47 301012-01121 : Rev 0 : 3-Dec-09
6.8 Particle Size Distribution - SPOCAS
The larger the particle size of a material, the lower the surface area to volume ratio, and thus the lower the reactivity which in turn reduces the effective acid neutralising capacity. Titratable Sulfidic Acidity (TSA) results and ANC results often underestimate the potential risk of acid leakage to the environment as it is likely that not all of the shell/carbonate materials within the soils would be available for immediate neutralisation of acid because of low unit surface area, and the likelihood of the formation of insoluble coatings on the shell surfaces. In particular, shell fragments >2 mm diameter cannot be relied upon to provide any real neutralisation value.
The proposed works involve the dredging, hydraulic pumping and placement of sediments into a reclamation paddock. The settlement of the sediments away from the end of pipe will cause some separation of the particle size distribution with finer material settling furthers away. As pyritic material is often associated with the finers sediments as calcium present as shell can be associated with heavier materials this may lead to the concentration of an acid sulfate issue. Samples analysed as whole samples may not be representative of the material as-placed in the dredge paddocks and may underestimate management requirements. To address this issue visible shell fragments were removed from the sample (15 samples already being analysed for SPOCAS) and the sample sieved to remove the fractions larger than silt (0.075mm) and analysis undertaken on the remaining portion of the sample and compared with the full PSD range (Table 11).
Results indicated all samples had acidity trail parameters below detection, all samples had an ANCE > Total Sulphur (Table 14). The dredge material is therefore self-neutralising and is suitable for disposal ashore as landfill in the reclamation area. This indicates that there is no issue even when the sediments do separate within the reclamation paddock.

DAMPIER PORT AUTHORITY DAMPIER MARINE SERVICES FACILITY PRELIMINARY SITE INVESTIGATION SAMPLING AND ANALYSIS PLAN IMPLEMENTATION REPORT
i:\projects\i01121 dampier marine services facility project\2.0 reports\ari\appendices\9 - acid sulfate soils assessment\psi -sap-ir 23-12-09.doc Page 48 301012-01121 : Rev 0 : 3-Dec-09
Table 14: Acid Sulphate Soil Assessment – SPOCAS 0.75um
SPOCAS (0.75 um) Field
Observations Lab pH Acidity Trail Sulfur Trail
pH K
Cl
pH O
X
TAA
TPA
TSA
s-TA
A
s-TP
A
s-TS
A
S KC
L
S P
S PO
S
S AS
AN
CE
Net
Aci
dity
ID
pH units
pH units
mole H+/t
mole H+/t
mole H+/t %S %S %S %S %S %S mole
H+/t %S %S
Assessment Criteria* NV NV NV NV NV 0.03 0.03 NV NV NV 0.03 NV NV NV
BP1103-0.0 9.4 8.3 <2 <2 <2 <0.02 <0.02 <0.02 0.14 0.44 0.27 184 17.4 <0.02DA1607 - 0.0 9.3 8.3 <2 <2 <2 <0.02 <0.02 <0.02 0.12 0.46 0.45 211 15.7 <0.02DA2009 - 0.0 9.3 8.1 <2 <2 <2 <0.02 <0.02 <0.02 0.09 0.32 0.52 146 15.7 <0.02DA2204 9.4 8.5 <2 <2 <2 <0.02 <0.02 <0.02 0.15 0.56 0.41 255 16.2 <0.02DA2304-0.0 9.4 8.2 <2 <2 <2 <0.02 <0.02 <0.02 0.1 0.57 0.46 289 16.2 <0.02DA2305 9.4 8.4 <2 <2 <2 <0.02 <0.02 <0.02 0.12 0.55 0.47 269 16.1 <0.02DA2306-0.0 9.4 8.3 <2 <2 <2 <0.02 <0.02 <0.02 0.1 0.48 0.4 238 15.7 <0.02DA2404 9.4 8.4 <2 <2 <2 <0.02 <0.02 <0.02 0.14 0.52 0.49 241 16.1 <0.02DA2602 9.4 8.3 <2 <2 <2 <0.02 <0.02 <0.02 0.12 0.48 0.38 220 15.4 <0.02DA2704 9.4 8.5 <2 <2 <2 <0.02 <0.02 <0.02 0.12 0.47 0.36 221 16.7 <0.02DA2703 9.4 8.4 <2 <2 <2 <0.02 <0.02 <0.02 0.15 0.57 0.34 266 16.5 <0.02DA2803 9.4 8.3 <2 <2 <2 <0.02 <0.02 <0.02 0.18 0.57 0.4 246 15.8 <0.02DA2902 9.4 8.5 <2 <2 <2 <0.02 <0.02 <0.02 0.18 0.58 0.37 247 16.7 <0.02DA3004 9.4 8.5 <2 <2 <2 <0.02 <0.02 <0.02 0.14 0.5 0.36 221 15.8 <0.02DA3006-0.0 9.3 8.3 <2 <2 <2 <0.02 <0.02 <0.02 0.11 0.44 0.31 207 15.5 <0.02
6.9 Particle Size Distribution
Sediments located within the proposed development area are predominantly made up of the less than 2mm fraction (i.e. sand, silt and clay). Gravel was recorded in 9 samples only (Figure 8).
Typical particle size distributions of sediments from the Hamersley Iron 2005 Capital and Maintenece Dredging Program is presented in Figure 9. In general results have similar trends to that observed as part of these works.

DAMPIER PORT AUTHORITY DAMPIER MARINE SERVICES FACILITY PRELIMINARY SITE INVESTIGATION SAMPLING AND ANALYSIS PLAN IMPLEMENTATION REPORT
i:\projects\i01121 dampier marine services facility project\2.0 reports\ari\appendices\9 - acid sulfate soils assessment\psi -sap-ir 23-12-09.doc Page 49 301012-01121 : Rev 0 : 3-Dec-09
Samples
0 5 10 15 20 25 30 35 40
Parti
cle
Size
Dis
tribu
tion
(%)
0
20
40
60
80
100
Gravel Sand Silt Clay
Figure 8: Particle Size Distribution, Current Survey
Samples
0 10 20 30 40 50 60
Parti
cle
Siz
e D
istri
butio
n (%
)
0.0
0.2
0.4
0.6
0.8
1.0
Gravel Sand Silt Clay
Figure 9: Particle Size Distribution Results from Capital and Maintenance Dredging Program (Hamersley Iron 2005)

DAMPIER PORT AUTHORITY DAMPIER MARINE SERVICES FACILITY PRELIMINARY SITE INVESTIGATION SAMPLING AND ANALYSIS PLAN IMPLEMENTATION REPORT
i:\projects\i01121 dampier marine services facility project\2.0 reports\ari\appendices\9 - acid sulfate soils assessment\psi -sap-ir 23-12-09.doc Page 50 301012-01121 : Rev 0 : 3-Dec-09
6.10 Quality Control
Detailed sampling analysis quality control is detailed in the sampling analysis plan, contained in Appendix A. Overall, the results of the quality programs adopted by the selected laboratories and by WorleyParsons are believed to indicate that results of chemical analysis reported by the laboratories are of sufficient quality to be confidently used for determining the concentrations of substances within the dredge footprint and for comparison with the site investigation levels.
6.10.1 Laboratory Quality Control Analysis
Analytical quality control data (blanks, duplicates and spiked samples) for the various sediment analyses are contained in the laboratory reports in Appendix C. All laboratory test parameters met NATA criteria.
6.10.2 Field Quality Control
The quality control data for the field samples (triplicates and split samples) are provided as relative standard deviation (RSD) and relative percent difference (RPD) of each parameter for the Dampier Port. The relative percent difference (RPD) of the results was calculated using the following formula:
Generally acceptable RPDs are less than 50% (Council of Standards Australia 2005; DEWHA 2009).
Results of the field survey QA/QC program indicates all parameters were inside the 50% criterion. These datasets indicate that the sampling program and subsequent analysis were within the agreed level of variability for replicates.
6.10.3 Holding time
The holding time prior to the date the analyses (extraction) of the samples commenced were within the stated holding times and are considered to be acceptable. Analyses completion dates provided indicate that analyses had been undertaken within the stated holding times (Appendix C).

DAMPIER PORT AUTHORITY DAMPIER MARINE SERVICES FACILITY PRELIMINARY SITE INVESTIGATION SAMPLING AND ANALYSIS PLAN IMPLEMENTATION REPORT
i:\projects\i01121 dampier marine services facility project\2.0 reports\ari\appendices\9 - acid sulfate soils assessment\psi -sap-ir 23-12-09.doc Page 51 301012-01121 : Rev 0 : 3-Dec-09
Table 15: Quality Control Data for Dampier Marine Services Sediment Implementation Results
Reference Units PQL
BP1
103-
0.0
BP1
108-
0.0-
2
RPD
BP1
103-
0.0
BP1
108-
0.0-
3
RPD
DA
2306
-0.0
DA
2806
-0.
0-2
RPD
DA
2306
-0.0
DA
2806
-0.
0-3
RPD
DA
3006
-0.0
DA
8006
-0.
0-2
RPD
DA
3006
-0.0
DA
8006
-0.
0-3
RPD
BP5
4
BP8
4-2
RPD
BP6
4
BP6
8-2
RPD
BP8
2
BP8
8-2
RPD
BP8
2
BP8
8-3
RPD
Metals OS Dup OS Dup OS Dup OS Trip OS Dup OS Trip OS Split OS Split OS Dup OS Trip
Silver mg/kg 0.05 0.05 0.05 0% 0.05 0.05 0% 0.05 0.05 0% 0.05 0.05 0% 0.05 0.05 0% 0.05 0.05 0% 0.05 0.05 0% 0.05 0.05 0% 0.05 0.05 0% 0.05 0.05 0% Arsenic mg/kg <0.4 14 14 0% 14 14 0% 12 12 0% 12 12 0% 13 12 2% 13 12 2% 16 14 3% 15 15 0% 15 15 0% 15 13 4% Cadmium mg/kg 0.05 0.18 0.17 1% 0.18 0.17 1% 0.16 0.18 3% 0.16 0.17 2% 0.17 0.17 0% 0.17 0.16 2% 0.2 0.17 4% 0.17 0.16 2% 0.17 0.18 1% 0.17 0.17 0% Chromium mg/kg 0.05 35 34 1% 35 35 0% 57 56 0% 57 60 1% 53 51 1% 53 53 0% 34 29 4% 31 28 3% 31 30 1% 31 32 1% Copper mg/kg 0.05 11 11 0% 11 11 0% 14 14 0% 14 16 3% 15 15 0% 15 15 0% 13 11 4% 10 9.1 2% 10 11 2% 10 11 2% Mercury mg/kg 0.005 0.005 0.005 0% 0.005 0.005 0% 0.005 0.005 0% 0.005 0.005 0% 0.005 0.005 0% 0.005 0.005 0% 0.005 0.005 0% 0.005 0.005 0% 0.005 0.005 0% 0.005 0.005 0% Nickel mg/kg 0.05 13 12 2% 13 13 0% 20 20 0% 20 21 1% 19 18 1% 19 19 0% 12 10 5% 11 9.9 3% 11 11 0% 11 12 2% Phosphorus mg/kg <1 380 380 0% 380 370 1% 420 420 0% 420 430 1% 370 360 1% 370 370 0% 440 360 5% 370 360 1% 370 380 1% 370 360 1% Lead mg/kg 0.25 3.2 3.2 0% 3.2 3.1 1% 3.4 3.7 2% 3.4 3.8 3% 3.6 3.6 0% 3.6 3.6 0% 3.1 2.7 3% 2.9 2.8 1% 2.8 2.9 1% 2.8 3 2% Zinc mg/kg 0.25 16 15 2% 16 15 2% 17 17 0% 17 18 1% 18 17 1% 18 17 1% 16 15 2% 15 13 4% 15 15 0% 15 14 2% Total Petroleum Hydrocarbons (TPHs) TPH C6-C9 mg/kg 5 5 5 0% 5 5 0% - - - - 5 5 0% 5 5 0% 5 5 0% 5 5 0% 5 5 0% 5 5 0% TPH C10-14 mg/kg 5 5 5 0% 5 5 0% - - - - 5 5 0% 5 5 0% 5 5 0% 5 5 0% 5 5 0% 5 5 0% TPH C15-28 mg/kg 2.5 2.5 2.5 0% 2.5 2.5 0% - - - - 2.5 2.5 0% 2.5 2.5 0% 2.5 2.5 0% 2.5 2.5 0% 2.5 2.5 0% 2.5 2.5 0% TPH C29-36 mg/kg 2.5 2.5 2.5 0% 2.5 2.5 0% - - - - 2.5 2.5 0% 2.5 2.5 0% 2.5 2.5 0% 2.5 2.5 0% 2.5 2.5 0% 2.5 2.5 0% Polynuclear Aromatic Hydrocarbons (PAHs) Naphthalene µg/kg 2.5 2.5 2.5 0% 2.5 2.5 0% - - - - 2.5 8 26% 2.5 2.5 0% 2.5 2.5 0% 2.5 2.5 0% 2.5 2.5 0% 2.5 2.5 0% 1-Methylnaphthalene µg/kg 2.5 2.5 2.5 0% 2.5 2.5 0% - - - - 2.5 2.5 0% 2.5 2.5 0% 2.5 2.5 0% 2.5 2.5 0% 2.5 2.5 0% 2.5 2.5 0% 2-Methylnaphthalene µg/kg 2.5 2.5 2.5 0% 2.5 2.5 0% - - - - 2.5 2.5 0% 2.5 2.5 0% 2.5 2.5 0% 2.5 2.5 0% 2.5 2.5 0% 2.5 2.5 0% Acenaphthylene µg/kg 2.5 2.5 2.5 0% 2.5 2.5 0% - - - - 2.5 2.5 0% 2.5 2.5 0% 2.5 2.5 0% 2.5 2.5 0% 2.5 2.5 0% 2.5 2.5 0% Acenaphthene µg/kg 2.5 2.5 2.5 0% 2.5 2.5 0% - - - - 2.5 2.5 0% 2.5 2.5 0% 2.5 20 39% 2.5 2.5 0% 2.5 2.5 0% 2.5 2.5 0% Fluorene µg/kg 2.5 2.5 2.5 0% 2.5 2.5 0% - - - - 2.5 2.5 0% 2.5 2.5 0% 2.5 10 30% 2.5 2.5 0% 2.5 2.5 0% 2.5 2.5 0% Phenanthrene µg/kg 2.5 2.5 2.5 0% 2.5 2.5 0% - - - - 2.5 2.5 0% 2.5 2.5 0% 2.5 50 45% 2.5 2.5 0% 2.5 2.5 0% 2.5 2.5 0% Anthracene µg/kg 2.5 2.5 2.5 0% 2.5 2.5 0% - - - - 2.5 2.5 0% 2.5 2.5 0% 2.5 2.5 0% 2.5 2.5 0% 2.5 2.5 0% 2.5 2.5 0% Fluoranthene µg/kg 2.5 2.5 6 21% 2.5 2.5 0% - - - - 2.5 6 21% 2.5 2.5 0% 2.5 80 47% 2.5 2.5 0% 2.5 20 39% 2.5 6 21% Pyrene µg/kg 2.5 2.5 2.5 0% 2.5 2.5 0% - - - - 2.5 2.5 0% 2.5 2.5 0% 2.5 56 46% 2.5 2.5 0% 2.5 14 35% 2.5 2.5 0% Benz(a)anthracene µg/kg 2.5 2.5 2.5 0% 2.5 2.5 0% - - - - 2.5 2.5 0% 2.5 2.5 0% 2.5 40 44% 2.5 2.5 0% 2.5 6 21% 2.5 2.5 0% Chrysene µg/kg 2.5 2.5 2.5 0% 2.5 2.5 0% - - - - 2.5 5 17% 2.5 2.5 0% 2.5 40 44% 2.5 2.5 0% 2.5 8 26% 2.5 2.5 0% Benzo(b)&(k)fluoranthene µg/kg 5 5 5 0% 5 5 0% - - - - 5 5 0% 5 5 0% 5 50 41% 5 5 0% 5 10 17% 5 5 0% Benzo(a)pyrene µg/kg 2.5 2.5 2.5 0% 2.5 2.5 0% - - - - 2.5 2.5 0% 2.5 2.5 0% 2.5 21 39% 2.5 2.5 0% 2.5 2.5 0% 2.5 2.5 0% Indeno(1,2,3-cd)pyrene µg/kg 2.5 2.5 2.5 0% 2.5 2.5 0% - - - - 2.5 2.5 0% 2.5 2.5 0% 2.5 20 39% 2.5 2.5 0% 2.5 5 17% 2.5 2.5 0% Dibenz(a,h)anthracene µg/kg 2.5 2.5 2.5 0% 2.5 2.5 0% - - - - 2.5 2.5 0% 2.5 2.5 0% 2.5 2.5 0% 2.5 2.5 0% 2.5 2.5 0% 2.5 2.5 0% Benzo(g,h,i)perylene µg/kg 2.5 2.5 2.5 0% 2.5 2.5 0% - - - - 2.5 2.5 0% 2.5 2.5 0% 2.5 20 39% 2.5 2.5 0% 2.5 7 24% 2.5 6 21% Coronene µg/kg 5 5 5 0% 5 5 0% - - - - 5 5 0% 5 5 0% 5 5 0% 5 5 0% 5 5 0% 5 5 0% Benzo(e)pyrene µg/kg 2.5 2.5 2.5 0% 2.5 2.5 0% - - - - 2.5 2.5 0% 2.5 2.5 0% 2.5 18 38% 2.5 2.5 0% 2.5 2.5 0% 2.5 2.5 0% Total PAHs (as above) µg/kg 50 50 50 0% 50 50 0% - - - - 50 50 0% 50 50 0% 50 410 39% 50 50 0% 50 50 0% 50 50 0%

DAMPIER PORT AUTHORITY DAMPIER MARINE SERVICES FACILITY PRELIMINARY SITE INVESTIGATION SAMPLING AND ANALYSIS PLAN IMPLEMENTATION REPORT
i:\projects\i01121 dampier marine services facility project\2.0 reports\ari\appendices\9 - acid sulfate soils assessment\psi -sap-ir 23-12-09.doc Page 52 301012-01121 : Rev 0 : 3-Dec-09
Reference Units PQL
BP1
103-
0.0
BP1
108-
0.0-
2
RPD
BP1
103-
0.0
BP1
108-
0.0-
3
RPD
DA
2306
-0.0
DA
2806
-0.
0-2
RPD
DA
2306
-0.0
DA
2806
-0.
0-3
RPD
DA
3006
-0.0
DA
8006
-0.
0-2
RPD
DA
3006
-0.0
DA
8006
-0.
0-3
RPD
BP5
4
BP8
4-2
RPD
BP6
4
BP6
8-2
RPD
BP8
2
BP8
8-2
RPD
BP8
2
BP8
8-3
RPD
Metals OS Dup OS Dup OS Dup OS Trip OS Dup OS Trip OS Split OS Split OS Dup OS Trip
Organotins Monobutyl tin µg/Kg 0.25 0.25 0.25 0% 0.25 0.25 0% 0.25 0.25 0% 0.25 0.25 0% 0.25 0.25 0% 0.25 0.25 0% 0.25 0.25 0% 0.25 0.25 0% 0.25 0.25 0% 0.25 0.25 0% Dibutyl tin µg/kg 0.25 0.25 0.25 0% 0.25 0.25 0% 0.25 0.25 0% 0.25 0.25 0% 0.25 0.25 0% 0.25 0.25 0% 0.25 0.25 0% 0.25 0.25 0% 0.25 0.25 0% 0.25 0.25 0% Tributyl tin µg/kg 0.25 0.25 0.25 0% 0.25 0.25 0% 0.25 0.25 0% 0.25 0.25 0% 0.25 0.25 0% 0.25 0.25 0% 1 1.5 10% 0.8 1.4 14% 0.25 0.25 0% 0.25 1.8 38% Nutrients Total Organic Carbon % 0.005 4.3 4.1 1% 4.3 4.6 2% 3.3 2.7 5% 3.3 4.2 6% 2.9 4.2 9% 2.9 3.3 3% 3.6 3.7 1% 4.4 3.9 3% 3.5 3.3 1% 3.5 3.3 1% Nitrate as N mg/kg 0.05 0.05 0.05 0% 0.05 0.05 0% 0.05 0.05 0% 0.05 0.05 0% 0.05 0.05 0% 0.05 0.05 0% 0.05 0.2 30% 0.05 0.05 0% 0.05 0.1 17% 0.05 0.05 0% Nitrite as N mg/kg 0.05 0.05 0.05 0% 0.05 0.05 0% 0.05 0.05 0% 0.05 0.05 0% 0.05 0.05 0% 0.05 0.05 0% 0.05 0.05 0% 0.05 0.05 0% 0.05 0.05 0% 0.05 0.05 0% Total Kjeldahl Nitrogen mg/kg 10 230 230 0% 230 210 2% 210 320 10% 210 290 8% 310 290 2% 310 330 2% 200 140 9% 250 290 4% 170 170 0% 170 320 15% Total Ammonia as N mg/kg 0.05 4 4.5 3% 4 2.5 12% 5 5.5 2% 5 5 0% 4 4.5 3% 4 4 0% 3 3 0% 3 3 0% 3 3.5 4% 3 3.5 4%
Total Nitrogen mg/kg 10 230 230 0% 230 210 2% 210 320 10% 210 290 8% 310 290 2% 310 330 2% 200 140 9% 250 290 4% 170 170 0% 170 320 15%

DAMPIER PORT AUTHORITY DAMPIER MARINE SERVICES FACILITY PRELIMINARY SITE INVESTIGATION SAMPLING AND ANALYSIS PLAN IMPLEMENTATION REPORT
i:\projects\i01121 dampier marine services facility project\2.0 reports\ari\appendices\9 - acid sulfate soils assessment\psi -sap-ir 23-12-09.doc Page 53 301012-01121 : Rev 0 : 3-Dec-09
7. SUMMARY
The results of this sampling and analysis plan implementation report can be summarised as follows:
• Of the metals tested, only chromium exceeded the EIL values. ASLP leachate analysis indicated all results for chromium below PQL and chromium is in an immobile form. The DEC (DEC 2006a) found the natural levels in the Dampier Archipelago of Chromium were elevated and similar to the results of this study (37.4 predicted natural compared to 39.76±13.0 this study).
• Nutrients, COD and BOD, Polynuclear Aromatic Hydrocarbons, Total Petroleum Hydrocarbons, and Organotins normalised and individually did not exceed EIL’s or the NAGD screening levels
• Results from the acid sulphate assessment indicate the dredge material is self-neutralising and is suitable for disposal onshore as landfill in a bunded reclamation area, with no active ASS management required.
• Reduced inorganic sulphur measured as both, acid volatile S (AVS) and total reduced S, including S (SCr) have shown no elevated levels of reduced inorganic S and are deemed acceptable for onshore disposal.

DAMPIER PORT AUTHORITY DAMPIER MARINE SERVICES FACILITY PRELIMINARY SITE INVESTIGATION SAMPLING AND ANALYSIS PLAN IMPLEMENTATION REPORT
i:\projects\i01121 dampier marine services facility project\2.0 reports\ari\appendices\9 - acid sulfate soils assessment\psi -sap-ir 23-12-09.doc Page 54 301012-01121 : Rev 0 : 3-Dec-09
8. REFERENCES
ANZECC/ARMCANZ (2000). Water Quality and Monitoring Guidelines. National Water Quality Management Strategy.
Burton GA, Green A, et al. (2007). "Characterizing sediment acid volatile sulfide concentrations in European streams." Environmental Toxicology and Chemistry 26(1): 1-12.
Commonwealth of Australia (2002). National Ocean Disposal Guidelines for Dredged Material. Commonwealth of Australia. Canberra.
Commonwealth of Australia (2009). National Assessment Guidelines for Dredging (NAGD). Canberra.
Council of Standards Australia (2005). Guide to the sampling and investigation of potentially contaminated soil. Part 1: Non-volatile and semivolatile compounds.
Dear, S., S. Moor, et al. (2002). Soil Management Guidelines. Queensland Acid Sulphate Soil Technical Manual, Department of Natural Resources and Mines.
DEC (2001a). Contaminated Sites Management Series: Development of Sampling and Analysis Programs. D. o. E. a. C. (DEC). Perth.
DEC (2001b). Development of Sampling and Analysis Plans, Contaminated Land Management Series.
DEC (2003a). Assessment Levels for Soil, Sediment and Water. D. o. E. a. C. (DEC). Contaminated Sites Management Series, Perth.
DEC (2003b). Contaminated Sites Act (Act).
DEC. (2003c). "Contaminated Sites Fact Sheets ", from http://portal.environment.wa.gov.au/portal/page?_pageid=53,6004114&_dad=portal&_schema=PORTAL.
DEC (2003d). "Contaminated Sites Management Series: Assessment Levels for Soil, Sediment and Water."
DEC (2006a). Background quality of the marine sediments of the Pilbara coast. Marine Technical Report Series 1.
DEC (2006b). Background quality of the marine sediments of the Pilbara coast - Marine Technical Report Series.

DAMPIER PORT AUTHORITY DAMPIER MARINE SERVICES FACILITY PRELIMINARY SITE INVESTIGATION SAMPLING AND ANALYSIS PLAN IMPLEMENTATION REPORT
i:\projects\i01121 dampier marine services facility project\2.0 reports\ari\appendices\9 - acid sulfate soils assessment\psi -sap-ir 23-12-09.doc Page 55 301012-01121 : Rev 0 : 3-Dec-09
DEC (2006c). Draft Identification and Investigation of Acid Sulfate Soils. Acid Sulfate Soils Guideline Series, Department of Environment and Conservation Land & Water Quality Branch.
Department of Environment (2006). Draft identification and Investigation of Acid Sulfate Soils. Acid Sulfate Soils Guideline Series. Perth, Acid Sulfate Soils Guideline Series. Government of Western Australia.
Department of Environment and Conservation (1996). Landfill Waste Classification and Waste Definition. Published Report.
DEWHA. (2009). "National Assessment Guidelines for Dredging." from http://environment.gov.au.
DoE (2005). Landfill Waste Classification and Waste Definitions 1996 (as amended).
DPA (2007). Marine Management Plan. Dampier, WA, Dampier Port Authority.
ENV Australia (2003a). Dampier Cargo Wharf Expansion: Sediment Quality Investigation. Dampier, WA, Dampier Port Authority.
ENV Australia (2003b). Dampier Port Authority: Proposed Port Expansion and Dredging Program - Referral Document. Dampier, WA, Dampier Port Authority.
Environment Australia (2002). National Ocean Disposal Guidelines for Dredged Material (NODGDM). Canberra.
GHD (2007). Fremantle Ports EIS. Department for Planning and Infrastructure Kwinana Quay Project.
Hutchins, J. B., S. M. Slack-Smith, et al. (2004). "Methodology." Records of the Western Australian Museum Supplement 66: 3-5.
MScience (2005a). Dampier Port Upgrade Project 2004 Maintenance Dredging Program: Sediment Quality Assessment. Prepared for Pilbara Iron Pty Ltd.
MScience (2005b). Dampier Port Upgrade Project: Capital Dredging Program 2004: Sediment Quality Report. Prepared for Pilbara Iron Pty Ltd.
MScience (2006). Dampier Port Upgrade - 2006 Maintenance Dredging Project: Sediment Quality Assessment: September 2005. Prepared for Pilbara Iron Pty Ltd. Perth, WA, Pilbara Iron Pty Ltd.
MScience (2007). Dampier Port Authority: DCW Capital Dredging: Sediment Quality Report. Report prepared for the Dampier Port Authority. Dampier, WA, MScience Pty Ltd.
Sinclair Knight Mertz (2006). Dredging and Dredge Spoil Disposal Management Plan Dampier Port Dredging. Perth, WA, Hamersley Iron Pty Ltd.

DAMPIER PORT AUTHORITY DAMPIER MARINE SERVICES FACILITY PRELIMINARY SITE INVESTIGATION SAMPLING AND ANALYSIS PLAN IMPLEMENTATION REPORT
i:\projects\i01121 dampier marine services facility project\2.0 reports\ari\appendices\9 - acid sulfate soils assessment\psi -sap-ir 23-12-09.doc Page 56 301012-01121 : Rev 0 : 3-Dec-09
Woodside Energy Limited (2006). Draft Public Environmental Report - PER.
Yannarie Solar (2007). Yannarie Solar - ERMP.

DAMPIER PORT AUTHORITY DAMPIER MARINE SERVICES FACILITY PRELIMINARY SITE INVESTIGATION SAMPLING AND ANALYSIS PLAN IMPLEMENTATION REPORT
i:\projects\i01121 dampier marine services facility project\2.0 reports\ari\appendices\9 - acid sulfate soils assessment\psi -sap-ir 23-12-09.doc Page 57 301012-01121 : Rev 0 : 3-Dec-09
Appendix A – PSI SAP

DAMPIER PORT AUTHORITY
Dampier Port Expansion Preliminary Site Investigation Sampling and Analysis Plan
301012/01121
23-Oct-09
Infrastructure & Environment Level 7, QV1 Building 250 St Georges Terrace Perth WA 6000 Australia Tel: +61 8 9278 8111 Fax: +61 8 9278 8110 www.worleyparsons.com WorleyParsons Services Pty Ltd ABN 61 001 279 812
© Copyright 2009 WorleyParsons Services Pty Ltd

DAMPIER PORT AUTHORITY DAMPIER MARINE SERVICES FACILITY PRELIMINARY SITE INVESTIGATION SAMPLING AND ANALYSIS PLAN
PROJECT 301012/01121 - DAMPIER MARINE SERVICES FACILITY
REV DESCRIPTION ORIG REVIEW WORLEY- PARSONS APPROVAL
DATE CLIENT APPROVAL
DATE
A Issued for internal review pp R Beaton
pp H Houridis
N/A
1-Oct-09 N/A
0 Issued for Use
P Mellor pp H Houridis P Mellor
23-Oct-09
W Young
23-10-09
x:\projects\i01121 dampier marine services facility project\2.0 reports\ari\appendices\9 - acid sulfate soils assessment\psi sapappendix a).doc Page ii
Disclaimer
This report has been prepared on behalf of and for the exclusive use of Dampier Port Authority, and is subject to and issued in accordance with the agreement between Dampier Port Authority and WorleyParsons Services Pty Ltd. WorleyParsons Services Pty Ltd accepts no liability or responsibility whatsoever for it in respect of any use of or reliance upon this report by any third party.
Copying this report without the permission of Dampier Port Authority and WorleyParsons Services Pty Ltd is not permitted.

DAMPIER PORT AUTHORITY DAMPIER MARINE SERVICES FACILITY PRELIMINARY SITE INVESTIGATION SAMPLING AND ANALYSIS PLAN
x:\projects\i01121 dampier marine services facility project\2.0 reports\ari\appendices\9 - acid sulfate soils assessment\psi sapappendix a).doc Page iii 301012/01121 : Rev 0 : 23-Oct-09
CONTENTS 1. INTRODUCTION ................................................................................................................1
1.1 Objectives ...........................................................................................................................2
1.2 Description of the Proposed Dredging................................................................................2
1.3 Reclamation ........................................................................................................................5
2. REVIEW OF EXISTING INFORMATION............................................................................6
2.1 Overview .............................................................................................................................6
2.2 Seabed Geology .................................................................................................................7
2.3 Hydrodynamic Regime .......................................................................................................7
2.4 Water Quality ......................................................................................................................8
2.5 Geotechnical Investigation..................................................................................................9
2.6 Previous Relevant Sediment Investigations .......................................................................4
2.6.1 Physical Characteristics........................................ Error! Bookmark not defined.
2.6.2 Chemical Characteristics .......................................................................................5
2.7 Potential Contaminants.......................................................................................................7
2.8 Other Issues......................................................................................................................15
2.8.1 Nutrients...............................................................................................................15
2.8.2 Acid Sulfate Soils .................................................................................................15
2.8.3 PCBs ....................................................................................................................16
2.9 Contaminants List .............................................................................................................16
3. SAMPLING AND ANALYSIS ............................................................................................17
3.1 Sampling Rationale...........................................................................................................17
3.2 Sampling Locations (and Horizons)..................................................................................17
3.2.1 Sampling Horizons...............................................................................................18
3.3 Proposed Sediment Quality Analysis Attributes for Analysis ...........................................21
3.3.1 Analysis Suite.......................................................................................................21
3.3.2 Elutriate Analysis .................................................................................................22

DAMPIER PORT AUTHORITY DAMPIER MARINE SERVICES FACILITY PRELIMINARY SITE INVESTIGATION SAMPLING AND ANALYSIS PLAN
x:\projects\i01121 dampier marine services facility project\2.0 reports\ari\appendices\9 - acid sulfate soils assessment\psi sapappendix a).doc Page iv 301012/01121 : Rev 0 : 23-Oct-09
3.4 Sample Collection and Processing...................................................................................22
3.4.1 Sample Collection ................................................................................................22
3.4.2 Sample Processing ..............................................................................................23
3.4.3 Hold Samples.......................................................................................................23
3.5 Contingency Plan..............................................................................................................24
3.6 Laboratory Analysis ..........................................................................................................24
4. SAMPLING AND ANALYSIS QUALITY CONTROL.........................................................26
4.1 Quality Control – Field Sampling ......................................................................................26
4.2 Quality Control – Analysis.................................................................................................26
5. ANALYSIS OF RESULTS.................................................................................................29
5.1 Assessment Framework ...................................................................................................29
5.2 Sediment Analysis for Total Sediment Concentrations ....................................................29
5.3 Elutriate Analyses .............................................................................................................30
5.4 Bioavailability Analyses ....................................................................................................30
5.5 Acid Sulfate Soils Analyses ..............................................................................................30
6. REPORTING.....................................................................................................................32
7. REFERENCES .................................................................................................................33
Appendices
APPENDIX 1– FIGURES
APPENDIX 2– GEOTECHNICAL SURVEY SOIL CORE LOGS
APPENDIX 3– TOC QA ANALYSIS

DAMPIER PORT AUTHORITY DAMPIER MARINE SERVICES FACILITY PRELIMINARY SITE INVESTIGATION SAMPLING AND ANALYSIS PLAN
x:\projects\i01121 dampier marine services facility project\2.0 reports\ari\appendices\9 - acid sulfate soils assessment\psi sapappendix a).doc Page 1 301012/01121 : Rev 0 : 23-Oct-09
1. INTRODUCTION
The Port of Dampier is located approximately 1550 km north of Perth, within the Shire of Roebourne. The Port limits lie adjacent to the Dampier Archipelago and include the waters of Mermaid Sound, Mermaid Strait and the outer anchorages. The area of seabed and waters inside port limits is currently around 650 km2 with a perimeter of almost 300 km.
A location map is shown in Figure 1 of Appendix 1.
The Port of Dampier commenced development in 1963 and since initial commissioning has developed into one of the largest tonnage ports in Australia servicing major export industries of iron ore, solar salt and Liquid Natural Gas (LNG). Annual trade in the Port is expected to triple in the next 25 years.
Dampier Port Authority (DPA) is a state government owned corporation that operates under the Port Authorities Act 1999. Under this act DPA facilitates trade and commerce within and through the port, and maintains several wharf and berth areas, shipping channels and swing basins within the port.
DPA is proposing to increase the handling and export capacity of the cargo wharf by constructing the Dampier marine Services Facility (DMSF). This will include a new jetty adjacent to the existing berth and reclaiming land to construct associated laydown area and a Land Backed Wharf (Heavy Load Out area).
During construction, approximately 2.2 million m3 of sediment will be dredged to provide safe navigable depth for vessels using the facility. The dredged sediment will be dewatered and used for land reclamation.
This document provides the proposed plan for the sampling and analysis of sediments that would be dredged during the capital dredging program and used for reclamation of the berth area. This sampling and analysis plan (SAP) is designed to comply with the sampling and analysis requirements of the National Assessment Guidelines for Dredging (Commonwealth of Australia 2009) and the Contaminated Lands Act 2003.
DPA seeks approval of this SAP by the Determining Authority (Department of Environment and Conservation – DEC) prior to undertaking sampling. Sampling is planned for October 12th to 15th.

DAMPIER PORT AUTHORITY DAMPIER MARINE SERVICES FACILITY PRELIMINARY SITE INVESTIGATION SAMPLING AND ANALYSIS PLAN
x:\projects\i01121 dampier marine services facility project\2.0 reports\ari\appendices\9 - acid sulfate soils assessment\psi sapappendix a).doc Page 2 301012/01121 : Rev 0 : 23-Oct-09
1.1 Objectives
This sampling and analysis plan (SAP) proposes a program of data collection for the assessment of dredge spoil suitability for land reclamation according to prescribed procedures in the NAGD (Commonwealth of Australia 2009) and the Contaminated Sites Regulations 2006, associated Contaminated Sites Management Series Guidelines.
The specific objectives of the SAP are to:
• provide a brief summary of the dredging operations relevant to the SAP;
• provide a summary of the catchment and land-use activities with the potential to impact upon dredged material quality;
• identify a contaminants list for testing of sediments, based on potential contaminant sources and results of prior testing;
• identify the number of samples required to provide an adequate representation of the mean and upper 95% confidence interval for contaminants list analytes;
• develop protocols for the collection and handling of sediment samples for analysis;
• identify the types of analyses to be performed on sediment samples;
• outline quality assurance and quality control (QA/QC) procedures for the collection, handling and laboratory analysis of samples;
• describe statistical techniques to determine the status of potential contaminants within dredged material; and
• prescribe a reporting framework for all data, results and conclusions which will address the requirements of the Determining Authority.
1.2 Project Description
The Dampier Port Authority (DPA) currently owns and operates the Dampier Cargo Wharf (DCW). This facility is nearing its design life, and is currently experiencing significant capacity issues. Further, associated laydown area in the Port is in very short supply, leading to a congested and inefficient work area.
Plate 1: Existing Dampier Cargo Wharf (left) and Dampier Bulk Liquids Berth (Right), with Project Laydown area in foreground (February 2009)
DAMPIER PORT AUTHORITY DAMPIER MARINE SERVICES FACILITY PRELIMINARY SITE INVESTIGATION SAMPLING AND ANALYSIS PLAN
x:\projects\i01121 dampier marine services facility project\2.0 reports\ari\appendices\9 - acid sulfate soils assessment\psi sapappendix a).doc Page 3 301012/01121 : Rev 0 : 23-Oct-09
The DPA has worked through various design iterations to resolve these issues since 2006. The current proposal (Figure 2, Appendix 1) is to develop some 22 ha of additional laydown area for the Port via reclamation. This area will support approximately 150m of sheet piled wall as a heavy load out facility, and a new wharf of some 300m in length. The areas traversed by the ships using the facility will be dredged to -11m, thus providing safe navigable depth for the maximum anticipated draft vessel along with the tide. Vessels will use the existing access channel as no new channel or increases to this channel width or depth are proposed as part of these works. The berth pockets on the wharf will be dredged to -14m, thus providing safe depth for vessels to berth at all stages of the tide.
The construction sequence will be to build the outer bund wall of the facility first. This will take approximately 6mths to complete, and be constructed such that it retains the dredge material placed inside the facility.
The next stage will be to dredge the required areas. Material will be pumped directly from the dredge to the reclamation area. This will most likely be via a cutter suction dredge, where the percentage solids in the pump discharge will be 10-20%, with the remaining 80-90% seawater. This mix will be decanted within the reclamation area, and the return water discharged via controlled weir boxes at several locations. Day-to-day management of the site will determine which weir box is used, and the discharge volume to retain water quality.
This stage of the process is anticipated to take some 6mths to complete. It should be noted that while the majority of the waters will be drained from the reclamation area, the sediments within the reclamation area will always remain saturated, though both tidal influence through the wall and capillary action.
During this stage, the sheet pile wall will be installed along the southern project margins. The sheet piles will be installed through the bund wall into the sea bed, and thus provide some 150m of operational wharf area, predominately used as a heavy load-out facility.
Following the completion of the above work, the new wharf structure will be completed. This is expected to be a deck-on-piles structure, similar to most wharves around the state. Piles will be driven into the substrate, formwork established and headstocks/decks poured and set on-site.
The important design features are :
Construction of a new wharf facility – this allows the construction to be undertaken while the existing Dampier Cargo Wharf (DCW) is operational, making it safer and ensuring minimal disruption;
DAMPIER PORT AUTHORITY DAMPIER MARINE SERVICES FACILITY PRELIMINARY SITE INVESTIGATION SAMPLING AND ANALYSIS PLAN
x:\projects\i01121 dampier marine services facility project\2.0 reports\ari\appendices\9 - acid sulfate soils assessment\psi sapappendix a).doc Page 4 301012/01121 : Rev 0 : 23-Oct-09
Balanced cut and fill operation – the amount of required dredging is balanced with the land development area to promote the disposal of all material without requiring sea disposal. As laydown area is in such short supply in Dampier, this provides for the beneficial reuse of a potentially damaging waste.
North facing wharf – material offloading facilities are sensitive to movement of the vessel. Rise and fall of the vessel due to swell makes loading and unloading via ship’s crane dangerous. The current DCW works well in ambient swell and sea conditions with minimal shut-down periods, and has been duplicated with the DMSF;
Location in an existing Port operational area, between existing developments (DCW, DBLB) and current developments (Woodside’s Pluto Project). The project footprint and anticipated impact area is within those areas already disturbed by current projects. This consolidation of projects reduces footprint of impacts by the port operations.
1.3 Description of the Proposed Dredging
Capital dredging would be undertaken to remove parent sediments from the seafloor area adjoining the proposed extension of the existing cargo berth and new wharf area, to a maximum water depth of -14 m LAT (below Lowest Astronomical Tide).
The key parameters for the existing dredging proposal are as follows:
• Area of Dredging: The proposed dredging would cover an area of approximately 467,800 m2.
• Depth of Dredging: In the approach areas (403,978 m2), dredging will range 1-6 m and result in a final depth of -11 m LAT. In the area around the jetty (40,786 m2), dredging will be to a maximum depth of 7-9 m resulting in a final depth of -14 m LAT. Inside the existing berth area (23,000 m2) dredging will range 0-3 m resulting in a maximum depth of -8 m LAT.
• Volume of Dredging: The calculated total volume of material to be dredged is approximately 2.2 million m3 of material.
• Material to be Dredged: Geotechnical and sediment sampling investigations undertaken across the proposal area indicate that the material to be dredged is sand – silty sand with some clay layers.
• Estimated Time for Dredging: the dredging is likely to commence as a single continuous operation in the third quarter of 2010, dependent on the availability of dredging plant and coordination with other projects within the region. It is expected that dredging would be completed within 6 months of commencement.
The dredging footprint is shown in Figure 2 of Appendix 1.

DAMPIER PORT AUTHORITY DAMPIER MARINE SERVICES FACILITY PRELIMINARY SITE INVESTIGATION SAMPLING AND ANALYSIS PLAN
x:\projects\i01121 dampier marine services facility project\2.0 reports\ari\appendices\9 - acid sulfate soils assessment\psi sapappendix a).doc Page 5 301012/01121 : Rev 0 : 23-Oct-09
1.4 Reclamation
The dredged sediment will be used for land reclamation. The sediment will be contained within a seawall (bund) and topped road-base material in general laydown areas. Within the roadways and heavy-load out facility, and impervious surface (concrete, asphalt) will be applied. Seawall construction will be undertaken between the second and third quarters of 2010 and reclamation will being in the third quarter of 2010 in conjunction with dredging activities.
The proposed reclamation area is shown in Figure 2 of Appendix 1.

DAMPIER PORT AUTHORITY DAMPIER MARINE SERVICES FACILITY PRELIMINARY SITE INVESTIGATION SAMPLING AND ANALYSIS PLAN
x:\projects\i01121 dampier marine services facility project\2.0 reports\ari\appendices\9 - acid sulfate soils assessment\psi sapappendix a).doc Page 6 301012/01121 : Rev 0 : 23-Oct-09
REVIEW OF EXISTING INFORMATION
1.5 Overview
The port of Dampier commenced development in 1963 and since initial commissioning the port has developed into one of the largest tonnage Ports in Australia servicing major export industries of iron ore, solar Salt and Liquid Natural Gas (LNG). Key developments from initial start up in 1963 include:
• 1963 - Construction of the general cargo wharf to facilitate the establishment of mining and eventually the export of iron ore from the Mt Tom Price mine owned by Hamersley Iron
• 1966 – Construction of the Parker Point iron ore facility designed to accept vessels up to 60,000 DWT
• 1970-71 – Dredging to widen shipping channel and extension of the channel to East Intercourse Island Facility (760,000 m3)
• 1972 – Commencement of Dampier Salt operations
• 1970-1980 –Development of Offshore Petroleum facilities and onshore LNG production plant and export wharf
• 1989 the Dampier Port Authority was established
• 1984 Construction of the North Rankin ‘A’ production platform 130kms NNW of Dampier connected by a pipeline to an onshore site at Withnell Bay
• 1995 - Export of LNG increased to export of 6,000,000 tonnes per annum initiating the development of a second wharf in 1995
• 2005 – Construction of Dampier Bulk Liquids Berth to assist in the export of anhydrous ammonia
• 2008 – Construction of the Woodside Pluto offshore LNG platform, subsea pipeline, wharf and plant facilities
The main body of water located within DPA port limits, Mermaid Sound, has been subject to episodic large-scale dredging operations since 1965. During this period, both small and large-scale dredging programs have been conducted as part of construction and maintenance of existing shipping channels, port facilities and subsea gas trunkline corridors. In excess of 31 Mm3 of marine sediments have been dredged within Dampier Archipelago in twenty-one separate projects by Hamersley Iron, NWSV and DPA. The majority of this spoil has been relocated to the existing spoil grounds in Mermaid Sound.

DAMPIER PORT AUTHORITY DAMPIER MARINE SERVICES FACILITY PRELIMINARY SITE INVESTIGATION SAMPLING AND ANALYSIS PLAN
x:\projects\i01121 dampier marine services facility project\2.0 reports\ari\appendices\9 - acid sulfate soils assessment\psi sapappendix a).doc Page 7 301012/01121 : Rev 0 : 23-Oct-09
1.6 Seabed Geology
The Port of Dampier is bounded by the western coastline of the Burrup Peninsula to the east and Dampier Archipelago to the west. Soft sediments interspersed with igneous reefs and shorelines, fringing limestone reefs and limestone pavements dominate subtidal substrates within the Dampier Archipelago. Sandy bottoms occur off the exposed sides of the outer islands while higher silt contents dominate sands within passages between and adjacent to inshore islands (Hutchins et al. 2004). Fringing and subtidal reef systems provide habitat for a range of species including diverse coral, fish and invertebrate communities.
While organic concentrations in sediments remain relatively low across the Port of Dampier area (as there are no major riverine inputs or substantial fringing mangroves within the area), an increase in organic concentrations are often found to correlate with an increase in fine sediment content (MScience 2006).
1.7 Hydrodynamic Regime
Water circulation and currents in the Dampier Archipelago are determined by a combination of large scale ocean circulation, tides, local winds (including tropical cyclones) and non-tidal long period waves (continental shelf waves and meteorological effects) (Pearce et al. 2003). The magnitude of currents in the Archipelago are firstly influenced by localised bathymetry and secondly by the location of islands (Pearce et al. 2003). Consequently, strong currents flow along the axis of Mermaid Sound and in the channels between the islands due to the narrow passages and the shallow bathymetry (DPA 2007a).
Tides have the most influence on water movement within the Port of Dampier. Tides are typically semi-diurnal which range from 1.0 m during neap tides to 3.7 m during spring tides (Australian Hydrographic Service 2008). Tides contribute most to the instantaneous water movement, while other forces such as waves act to produce a net residual drift effects (Pearce et al. 2003).
Wave height and direction within port limits are heavily influenced by the sheltering effect of the archipelago itself determined by oceanography, refraction and bottom friction (Pearce et al. 2003). The Archipelago shelters the port area from the Southern Ocean swell due to the shallow waters between Barrow Island to the west and the mainland. Wind-generated waves are generally less than 1.3 m but topical cyclones (from December to April) may generate large waves and increase wave height to 10 m at the entrance to Mermaid Sound (Pearce et al. 2003).
The existing bathymetry is shown in Figure 3 of Appendix 1.

DAMPIER PORT AUTHORITY DAMPIER MARINE SERVICES FACILITY PRELIMINARY SITE INVESTIGATION SAMPLING AND ANALYSIS PLAN
x:\projects\i01121 dampier marine services facility project\2.0 reports\ari\appendices\9 - acid sulfate soils assessment\psi sapappendix a).doc Page 8 301012/01121 : Rev 0 : 23-Oct-09
1.8 Water Quality
Water Temperature within the Dampier Archipelago ranges between 22.5oC during winter to 30.4oC during summer. While salinity remains relatively constant (34.6-35.6ppt) temporally, spatially, salinity generally decreases in concentration between nearshore and offshore areas (Pearce et al. (2003). Waters are generally well mixed with little stratification. Within Kings Bay, which is adjacent to the proposed development, greater extremes of temperature and salinity are often encountered compared to the offshore environment.
Suspended sediment parameters are influenced primarily by natural circulation of water driven by localised hydrodynamics and bathymetric conditions. Turbidity and suspended solid concentrations display a distinct negative correlation with increasing distance offshore (Simpson 1988). While deeper offshore waters display relatively low turbidity, nearshore coastal waters frequently display elevated turbidity and total suspended solids (TSS) concentrations due to:
• Shallow bathymetry;
• Fine sediment resuspension from wind induced wave action and tidal currents (Stoddart & Anstee 2004);
• Sediment transportation by terrestrial fluvial and erosion processes (Semeniuk, Chalmer & LeProvost 1982);
• Sediment resuspension from vessel propeller wash (Stoddart & Anstee 2004); and
• Tropical cyclone and rainfall events (Stoddart & Anstee 2004)
Refractory sediment deposition rates have been recorded in the southern area of the Sound (Forde 1985). Sediment depositions rates range from 70g/red (range 34-140 gfm2/d) during winter to 120 g/red (range 33-211 g/m2/d) in summer. Depositional rates in the mid to northern parts of Mermaid Sound can increase by 64-118% following a cyclonic event (Forde 1985).
Recent background water quality monitoring undertaken by MScience (2006) adjacent to the DPA proposed development site indicates highly variable TSS regime ranging from approximately 0-250 mg/L with mean of 7 mg/L at a water depth of 1.1m. Suspended solid concentrations are characterised by a series of peaks and troughs in response to natural resuspension events (MScience 2006). Monitoring of light intensity conducted in sequence with suspended solid concentrations displayed some light attenuation during periods of elevated TSS concentrations.
TRACE METALS AND ORGANICS
The coastal waters of the Dampier Archipelago generally display low metal and organic contaminant concentrations. Recent sampling investigations identified that concentrations of cadmium, chromium, copper, lead and zinc, total mercury, polycyclic aromatic hydrocarbons (PAHs), phenols, BTEX

DAMPIER PORT AUTHORITY DAMPIER MARINE SERVICES FACILITY PRELIMINARY SITE INVESTIGATION SAMPLING AND ANALYSIS PLAN
x:\projects\i01121 dampier marine services facility project\2.0 reports\ari\appendices\9 - acid sulfate soils assessment\psi sapappendix a).doc Page 9 301012/01121 : Rev 0 : 23-Oct-09
chemicals and petroleum hydrocarbons were below the 99% species protection (ANZECC/ARMCANZ 2000) guideline for each respective contaminant and were comparable to water quality from the North West shelf (Wenziker et al. 2006). While all contaminant concentrations were compliant to adopted 99% species protection guidelines, water samples collected from King Bay adjacent to the DPA cargo wharf did display elevated cadmium and copper concentrations compared with all other sites.
1.9 Geotechnical Investigation
In the area of the proposed works, a geotechnical investigation has been conducted by Coffey Geotechnics in May and June 2008 (Coffey 2008). While this investigation was based on a previous layout, it provides a good indication of the sediments to be dredged. Borehole locations for this work are shown on Figure 2 (Appendix 1), with typical cross-section borehole records shown in plates 2 and 3 below, with typical bore photographs shown in Plate 4.
Core log results indicated that the surface sediment layer was either fine to medium-grained grey or brown sand with trace clay, or siliceous carbonate sand with trace clay and/or shell fragments, which reached between 1.5-6 m depth. The layer below this was coarser; generally carbonate gravel (although siliceous carbonate gravel and calcarenite were also found), grading to hard to very hard rock (granophyres).
This report indicated that the sediments to be dredged are relatively consistent. As a gross indication of the sediment type and consistency, the particle size distribution information collected at each of the bores within the current DMSF design were averaged, and the standard deviation calculated.
0
10
20
30
40
50
60
70
80
Gravel Sand Fines
Nominal Size Class
Perc
enta
ge b
y W
eigh
t (%
)
Particle Size Distribution (Average +- Standard Deviation) for 22 samples collected within the current DMSF design dredge profile. Adapted from Coffey Factual Geotechnical Report October 2008.

DAMPIER PORT AUTHORITY DAMPIER MARINE SERVICES FACILITY PRELIMINARY SITE INVESTIGATION SAMPLING AND ANALYSIS PLAN
x:\projects\i01121 dampier marine services facility project\2.0 reports\ari\appendices\9 - acid sulfate soils assessment\psi sapappendix a).doc Page 10 301012/01121 : Rev 0 : 23-Oct-09
It should be noted that the DMSF was redesigned on the basis of the Coffey October 2008 report to avoid having to dredge into this hard and very hard material (as this would involve drill and blast operations) and provide sheet pile/pile penetration sufficient to obtain design loads by driving.

DAMPIER PORT AUTHORITY DAMPIER MARINE SERVICES FACILITY PRELIMINARY SITE INVESTIGATION SAMPLING AND ANALYSIS PLAN
x:\projects\i01121 dampier marine services facility project\2.0 reports\ari\appendices\9 - acid sulfate soils assessment\psi sapappendix a).doc Page 1 301012/01121 : Rev 0 : 23-Oct-09
Approx limit of dredging
Plate 2: Geotechnical profile from Boreholes 16, 9 and 8 showing approximate limit of dredging. See Figure 2 for Borehole Location. Figure adapted from Coffey Factual Geotechnical Report, October 2008

DAMPIER PORT AUTHORITY DAMPIER MARINE SERVICES FACILITY PRELIMINARY SITE INVESTIGATION SAMPLING AND ANALYSIS PLAN
x:\projects\i01121 dampier marine services facility project\2.0 reports\ari\appendices\9 - acid sulfate soils assessment\psi sapappendix a).doc Page 2 301012/01121 : Rev 0 : 23-Oct-09
Plate 3: Geotechnical profile from Boreholes 14, 9, 10, 12 and 17 showing approximate limit of dredging. See Figure 2, Appendix 1 for Borehole Locations. Figure adapted from Coffey Factual Geotechnical Report, October 2008
Approx limit of dredging

DAMPIER PORT AUTHORITY DAMPIER MARINE SERVICES FACILITY PRELIMINARY SITE INVESTIGATION SAMPLING AND ANALYSIS PLAN
x:\projects\i01121 dampier marine services facility project\2.0 reports\ari\appendices\9 - acid sulfate soils assessment\psi sapappendix a).doc Page 3 301012/01121 : Rev 0 : 23-Oct-09
Plate 4 : Typical Borehole section – core photographs. Boreholes 6 (top), and 8 (bottom) shown. Dashed red line indicates approximate limit of dredging. See Figure 2, Appendix 1 for Borehole Locations. Adapted from Coffey Factual Geotechnical Report October 2008.

DAMPIER PORT AUTHORITY DAMPIER MARINE SERVICES FACILITY PRELIMINARY SITE INVESTIGATION SAMPLING AND ANALYSIS PLAN
x:\projects\i01121 dampier marine services facility project\2.0 reports\ari\appendices\9 - acid sulfate soils assessment\psi sapappendix a).doc Page 4 301012/01121 : Rev 0 : 23-Oct-09
The locations of boreholes drilled during this investigation are shown in Figure 2 of Appendix 1. Complete soil core logs are provided in Appendix 2.
1.10 Previous Relevant Sediment Investigations
The DEC conducted a regional assessment of sediments of the Pilbara coast in 2006 (Background quality of the marine sediments of the Pilbara coast. DEC MTR1 2006). This work indicated that the sediments within the Dampier Archipelago are generally uncontaminated, and that levels of organic contaminants were below levels of detection at all locations.
Within Mermaid Sound region, a number of sediment sampling studies have been undertaken in conjunction with dredging projects. The most recent and extensive of these was the work completed for the Woodside Pluto project (Pluto LNG Development December 2006) which sampled in excess of 130 sites. All material met the NODG screening criteria, and was approved for unconfined sea disposal.
Within the proposed dredge, sediment investigations area were undertaken in 2003 by ENV Australia (2003) as part of initial development and construction of the bulk liquids wharf and expansion of the existing cargo wharf. An additional sediment investigation was then undertaken again in 2007 by MScience (2007) as part of capital dredging works to expand the current cargo wharf facility a second

DAMPIER PORT AUTHORITY DAMPIER MARINE SERVICES FACILITY PRELIMINARY SITE INVESTIGATION SAMPLING AND ANALYSIS PLAN
x:\projects\i01121 dampier marine services facility project\2.0 reports\ari\appendices\9 - acid sulfate soils assessment\psi sapappendix a).doc Page 5 301012/01121 : Rev 0 : 23-Oct-09
time. These studies represent the most relevant sediment characterisation studies undertaken to date, however they did not sample the entire area proposed for dredging in this project.
During 2003 (ENV Australia 2003b), piston core samples were collected from a total 49 sites located within the proposed dredge area. During the 2007 investigation (MScience 2007), sediment samples were collected from eight sampling locations within the existing cargo wharf berth pocket. A hand corer was used by divers to penetrate sediments to a maximum depth of 0.75 m at each sampling location. Both studies were conducted in accordance with an approved Sediment Sampling and Analysis Plan in accordance with the NODGDM guidelines (Commonwealth of Australia 2002).
In general, the sediments returned contamination levels below the National Ocean Disposal Guidelines for all parameters except tributyltin (TBT), which was recorded in the surface layers at some locations. This was a common component of antifouling paints in the shipping industry, but is now being phased out.
These levels were also below the “clean” classification with reference to the DEC Landfill Classification Guidelines.
Note that there is no guideline for Land Contamination values for TBT either from WA DEC or indeed in Australia. A useful guide can be obtained from the 2008 US EPA Region 9 Preliminary Remediation Goals residential soil criteria (www.epa.gov/region09/superfund/prg/index.html) for screening criteria to assess suitability for reuse in reclamation works. This work indicates a screening level of 18mg/kg for residential soil, and 180mg/kg for Industrial soils. The TBT levels recorded in previous works were well below this level. It should also be noted that these levels were in the upper sediments, and once dredged and mixed with underlying uncontaminated material will be orders of magnitude below these levels.
All of the material sampled was suitable for sea disposal, meeting the stringent NOGM guidleines.
A summary of the results determined from each investigation have been provided below.
1.10.1 Chemical Characteristics
2003 INVESTIGATION
Heavy metals, tributyltin (TBT), Polycyclic Aromatic Hydrocarbons (PAHs), Total Petroleum Hydrocarbons (TPHs), Volatile Organic Compounds (VOCs) and Polychlorinated Biphenyl (PCBs) analysed from sediments located within the proposed channel, berth 2 and berth 3 of the bulk liquid wharf areas were below background and/or screening levels.
Some TBT contamination was identified adjacent to the public wharf in surface sediments to 1 m depth. The 95% UCL TBT concentration for the DCW dredge area was above screening levels at 5 µg/kg. TBT elutriate and toxicity testing were undertaken to define the true extent of TBT. Elutriate TBT concentrations were found to be compliant to ANZECC/ARMCANZ guidelines once a dilution factor of 5.5 had been applied to elutriate test results. TBT toxicity testing identified a marginal toxic effect in 20% of tested sediments and was considered suitable for confined ocean disposal.

DAMPIER PORT AUTHORITY DAMPIER MARINE SERVICES FACILITY PRELIMINARY SITE INVESTIGATION SAMPLING AND ANALYSIS PLAN
x:\projects\i01121 dampier marine services facility project\2.0 reports\ari\appendices\9 - acid sulfate soils assessment\psi sapappendix a).doc Page 6 301012/01121 : Rev 0 : 23-Oct-09
2007 INVESTIGATION
Results from implementation of the 2007 SAP (MScience 2007) established that with the exception of TBT, all parameters met the sea dumping criteria. TBT contamination of surface sediments within the selected cargo wharf berth area exceeded the screening criteria at some locations.
The results of 2007 sediment sampling are summarised below:
Tributyltin (TBT)
During the 2007 investigation, TBT was present at the cargo wharf berth area at concentrations above the screening level (5 µg Sn/kg), at five of the eight sites after normalisation to 1% total organic carbon (TOC). The highest TBT concentration recorded was 33 µg Sn/kg after normalisation to 1%TOC, 8.8 µg Sn/kg before normalisation. Subsequently, calculation of the 95% UCL for TBT to determine the level of TBT contamination displayed a concentration of 9.7 µg Sn/kg above the screening level.
As a result of the exceedance of the screening level by the 95% UCL, further testing and analysis of sediments from the cargo wharf berth was undertaken in accordance with the NODGDM and following liaison with DEWHA. Additional sediment samples were collected from original site locations within the cargo berth area that returned TBT concentrations above the screening level. The samples were analysed for MBT, DBT, TBT and TOC, and elutriate testing was also undertaken. While four of the five samples returned TBT concentrations above screening levels, TBT elutriate concentrations were below detection levels and therefore below adopted 95% species protection level of 0.006 µg Sn/L (ANZECC/ARMCANZ 2000). It was concluded that the sediments to be dredged from the new cargo berth were suitable for unconfined ocean disposal.
Trace Metals
During the 2007 investigation, metal concentrations were below detection levels except for arsenic, chromium, cobalt, iron, manganese, nickel, vanadium and zinc. All metal concentrations were below the NODGDM screening levels.
PAH (Polycyclic Aromatic Hydrocarbons)
All analyses for PAH compounds recorded concentrations below detection limits.
TPH (Total Petroleum Hydrocarbons)
All analyses for TPH fractions recorded concentrations below detection limits.
Nutrients
All analyses for nutrients (nitrate and nitrite) recorded concentrations below detection limits.

DAMPIER PORT AUTHORITY DAMPIER MARINE SERVICES FACILITY PRELIMINARY SITE INVESTIGATION SAMPLING AND ANALYSIS PLAN
x:\projects\i01121 dampier marine services facility project\2.0 reports\ari\appendices\9 - acid sulfate soils assessment\psi sapappendix a).doc Page 7 301012/01121 : Rev 0 : 23-Oct-09
1.11 Previous Acid Sulfate Soils Investigations
The vast majority of dredging projects undertaken with the Port of Dampier have placed material at sea, and hence very little work on Acid Sulfate Soils has been undertaken. Only two recent studies have been discovered, Rio Tinto Dredging Program for the Dampier Port Upgrade (Referral Document June 20061) and works undertaken by Mermaid Marine Australia in 2009, and provided to the DPA as part of a Development Approval application.
The Rio works completed sPOCAS analysis on 5 samples from the dredge area, which is located approximately 2km from the DMSF proposed area in a similar environment. The acid based accounting returned net acidity results below the level of detection (Sulphur Units <0.02), with significant excess neutralising capacity (Table 1)
1 Available at http://www.epa.wa.gov.au/docs/2300_ARI_DampierPort_HamerslyIron.pdf

DAMPIER PORT AUTHORITY DAMPIER MARINE SERVICES FACILITY PRELIMINARY SITE INVESTIGATION SAMPLING AND ANALYSIS PLAN
x:\projects\i01121 dampier marine services facility project\2.0 reports\ari\appendices\9 - acid sulfate soils assessment\psi sapappendix a).doc Page 8 301012/01121 : Rev 0 : 23-Oct-09
Table 1: Results of sPOCAS analysis of 5 samples collected as part of the Hamersley Port Upgrade Project (Rio 2006)
The works completed by Mermaid Marine were taken from material stockpiles excavated from a berth pocket within King Bay. Some 33 samples were collected within the stockpiles and analysed via the

DAMPIER PORT AUTHORITY DAMPIER MARINE SERVICES FACILITY PRELIMINARY SITE INVESTIGATION SAMPLING AND ANALYSIS PLAN
x:\projects\i01121 dampier marine services facility project\2.0 reports\ari\appendices\9 - acid sulfate soils assessment\psi sapappendix a).doc Page 9 301012/01121 : Rev 0 : 23-Oct-09
sPOCAS method. Results indicated that the total percentage sulphur was below detection, and again the samples had excess neutralising capacity (see Table 2).
The sediments with Mermaid Sound are generally very low in Total Organic Carbon (TOC), with results typically less than 0.1%. Results from total organic carbon analysis indicate that the total organic content of the sediments is too low for monosulfidic black oozes (MBOs) to be present.

DAMPIER PORT AUTHORITY DAMPIER MARINE SERVICES FACILITY PRELIMINARY SITE INVESTIGATION SAMPLING AND ANALYSIS PLAN
x:\projects\i01121 dampier marine services facility project\2.0 reports\ari\appendices\9 - acid sulfate soils assessment\psi sapappendix a).doc Page 10 301012/01121 : Rev 0 : 23-Oct-09

DAMPIER PORT AUTHORITY DAMPIER MARINE SERVICES FACILITY PRELIMINARY SITE INVESTIGATION SAMPLING AND ANALYSIS PLAN
x:\projects\i01121 dampier marine services facility project\2.0 reports\ari\appendices\9 - acid sulfate soils assessment\psi sapappendix a).doc Page 11 301012/01121 : Rev 0 : 23-Oct-09
Table 2: Results of 33 samples taken from stockpiled material dredged via excavator within King Bay by Mermaid Marine (March 2009). Data submitted by Mermaid Marine as part of Development Application to the Dampier Port Authority, and reproduced here with approval of MMA.

DAMPIER PORT AUTHORITY DAMPIER MARINE SERVICES FACILITY PRELIMINARY SITE INVESTIGATION SAMPLING AND ANALYSIS PLAN
x:\projects\i01121 dampier marine services facility project\2.0 reports\ari\appendices\9 - acid sulfate soils assessment\psi sapappendix a).doc Page 12 301012/01121 : Rev 0 : 23-Oct-09

DAMPIER PORT AUTHORITY DAMPIER MARINE SERVICES FACILITY PRELIMINARY SITE INVESTIGATION SAMPLING AND ANALYSIS PLAN
x:\projects\i01121 dampier marine services facility project\2.0 reports\ari\appendices\9 - acid sulfate soils assessment\psi sapappendix a).doc Page 13 301012/01121 : Rev 0 : 23-Oct-09

DAMPIER PORT AUTHORITY DAMPIER MARINE SERVICES FACILITY PRELIMINARY SITE INVESTIGATION SAMPLING AND ANALYSIS PLAN
x:\projects\i01121 dampier marine services facility project\2.0 reports\ari\appendices\9 - acid sulfate soils assessment\psi sapappendix a).doc Page 14 301012/01121 : Rev 0 : 23-Oct-09
1.12 Potential Contaminants
The Port of Dampier is remote from urban, agriculture and commercial centres. The nearest townships are Dampier, located 5 km to the south west of the port, and Karratha, located 20 km to the east of the port. The Port is remote from any catchment influences such as agricultural and urban runoff due its physical location on the Burrup Peninsular and low annual rainfall.
Industrial land uses are the primary source for potential contamination of sediments in the proposed dredge area. Desalination plant discharge outfalls, vessel maintenance activities, mooring and bunkering of tugs and stormwater inputs exist within King Bay to the south of the proposed development area while fuel storage, shipping activities, including the export of bulk liquids (anhydrous ammonia loading), general cargo, copper and nickel metal concentrate exist adjacent to the proposed dredge area (DPA 2007b). Land uses surrounding the site are shown in Figure 4 of Appendix 1.
Previous investigations (ENV Australia 2003a; MScience 2007) indicated that TBT was the main contaminant of potential concern since it was the only analyte that exceeded the respective NODGDM (Environment Australia 2002) screening levels for 95% UCL concentrations calculated for each dredge area. While all other contaminants were below screening levels, a number of metal species were recorded above their respective detection limits. The NAGD (2009) specifies that contaminants of potential concern (COPC) are those contaminants that exceed background concentrations and the Screening Level (or elevated concentrations of contaminants for which guidelines do not exist). There is limited information on background contaminant concentrations as the majority of investigations that have been undertaken within the Port of Dampier tend to be located in areas influenced by port activities.
Sampling of sediments adjacent to the northern disposal ground undertaken in 2003 identified elevated concentrations of nickel, iron, chromium, copper and manganese compared with metal concentrations in sediments located within the cargo wharf berth. It was suggested that impacts associated with the disposal of mining ore material at the northern disposal ground during previous dredging events and subsequent natural transportation of sediments outside of the spoil ground boundaries were the cause of these elevated concentrations (ENV Australia 2003a).
Previous investigations undertaken on sediments located within the proposed deep water disposal ground displayed concentrations below detection limits except for an anomalous nickel concentration of 35 mg/kg, above the screening level of 21 mg/kg (SKM 2006). Other studies undertaken within the Port of Dampier have identified TBT contamination and high metal concentrations for some metal species (Ni and Fe) (MScience 2006). Elevated metal concentrations such as nickel and iron are often found to naturally occur in Australian coastal waters. Pilbara marine sediments have previously displayed elevated concentrations of zinc, nickel, iron and arsenic, thought to be naturally higher due

DAMPIER PORT AUTHORITY DAMPIER MARINE SERVICES FACILITY PRELIMINARY SITE INVESTIGATION SAMPLING AND ANALYSIS PLAN
x:\projects\i01121 dampier marine services facility project\2.0 reports\ari\appendices\9 - acid sulfate soils assessment\psi sapappendix a).doc Page 15 301012/01121 : Rev 0 : 23-Oct-09
to local geology (DEC 2006b) and are therefore likely to represent background conditions within the Port of Dampier (DAL Science & Engineering Pty Ltd 2004).
While PAHs and TPHs were not detected in the sediments located within and adjacent to the proposed dredge area in 2003 and 2007, it is possible that these contaminants which are typically related to shipping and wharf maintenance activities could be present in the sediments from the existing cargo berth, in existing shipping areas or have migrated to surrounding areas via currents and propeller wash.
1.13 Other Issues
1.13.1 Nutrients
Nutrient concentrations (total N, nitrate, nitrite, ammonia and total P) are also proposed for analysis as frequent loading of ammonia products at the bulk liquids wharf adjacent to the proposed dredge area have the potential to impact on sediments within the proposed dredged area.
Assessment of nutrient concentrations in sediments will provide information on the productivity of the sediments and the potential for the release of nutrients in significant concentrations to the water column. It also provides background concentrations for subsequent impact assessment if required.
1.13.2 Acid Sulfate Soils
Review of existing data published by the Western Australia Planning commission (WAPC) of the terrestrial environment located adjacent to the proposed dredge footprint has been categorised as low risk. However this data does not extend down to intertidal/subtidal areas. In consideration of this, a preliminary site investigation will be undertaken as part of the sampling program to identify the potential for ASS, since DPA plans to use the dredge material for reclamation fill. Results of this initial investigation will be used to identify whether any further assessment will be required.
In the event that ASS is discovered in the PSI sampling then further testing will be undertaken to delineate the extents of the material. In addition an Acid Sulfate Soil Management Plant will be prepared and implemented.

DAMPIER PORT AUTHORITY DAMPIER MARINE SERVICES FACILITY PRELIMINARY SITE INVESTIGATION SAMPLING AND ANALYSIS PLAN
x:\projects\i01121 dampier marine services facility project\2.0 reports\ari\appendices\9 - acid sulfate soils assessment\psi sapappendix a).doc Page 16 301012/01121 : Rev 0 : 23-Oct-09
1.13.3 PCBs
The Dampier Port area catchment is largely in its natural state, and mostly undeveloped. Several major installations (North West Shelf venture Gas Plant, developing Woodside Pluto gas plant, King Bay Industrial Estate and Rio Tinto’s Iron Ore facilities) are located within the area. The Port area in general, and more specifically the proposed dredging area receives very little runoff (as a potential transmission pathway) from developed areas relative to other Port areas in Australia. Annual rainfall is less than 300 mm, and the Port is not located at the terminus of a river system like many Australian Ports.
Sampling undertaken by the DPA in 2003 of the adjacent Bulk Liquids berth (approximately 700 m from the proposed dredging area) included PCB’s. All samples returned levels below limits of detection.
Since previous approved SAP documents of 2003 and 2007, there has been no change of use associated with port facilities within the vicinity of proposed dredge area and no reported chemical spill, fire or disposal of wastes that could have lead to PCB’s entering the marine environment. Consequently PCBs are unlikely to be present within the proposed dredge area and therefore not proposed to be tested as part of this preliminary site investigation.
1.14 Contaminants List
Appendix A of the NAGD requires that a contaminants list is to be developed and should include:
Toxic substances known, from previous investigations to occur in dredge area sediments at levels greater than one tenth of the Screening Levels, or
Based on historical review, substances potentially present at such levels in the sediments to be dredged.
In consideration of all previous investigations, the contaminant list should include:
• TBT;
• PAHs;
• TPHs; and
• Trace metals.
Other parameters to be analysed during sediment sampling are nutrient concentrations (total N, nitrate, nitrite, ammonia and total P) and Acid Sulfate Soils.

DAMPIER PORT AUTHORITY DAMPIER MARINE SERVICES FACILITY PRELIMINARY SITE INVESTIGATION SAMPLING AND ANALYSIS PLAN
x:\projects\i01121 dampier marine services facility project\2.0 reports\ari\appendices\9 - acid sulfate soils assessment\psi sapappendix a).doc Page 17 301012/01121 : Rev 0 : 23-Oct-09
2. SAMPLING AND ANALYSIS
2.1 Sampling Rationale
The sampling and analysis of sediments proposed below complies with the requirements for large capital dredging projects (greater than 500,000 m3) in Appendix D of the NAGD and with the DEC requirements for Contaminated Sites. Although approval is not required from the Commonwealth for land based disposal and reclamation, the methods described within the sampling plan have been developed in accordance with NAGD (Commonwealth of Australia 2009) as they represent best practice in the sampling and assessment of marine sediments. Sediment quality results will be compared with the NAGD Screening Levels (which mirror the ANZECC/ARMCANZ (2000) sediment quality guidelines) and with the Investigation Levels prescribed in the Assessment Levels for Soil, Sediment and Water (DEC 2003).
The number of samples and sample locations has been derived from the NAGD (Commonwealth of Australia 2009) as described in Section 3.2 and has also considered the requirements of the Contaminated Sites Management Series: Development of Sampling and Analysis Programs (DEC 2001).
2.2 Sampling Locations (and Horizons)
The number of sampling locations has been based on Table 6 of the NAGD (Commonwealth of Australia 2009).
The NAGD states that for proposed dredge volumes over 500,000 m3 the sampling design should be based on a stratified approach in consideration of volume of contaminated and potentially contaminated dredge material at each site. Sediments located below 1 m depth represent ”underlying natural geological materials” that have not been exposed to contamination from anthropogenic sources. In consideration of this, the proposed sampling area presented in Figure 5 of Appendix 1 will exclude sampling of sediments located deeper than 1 m.
Quantification of the number of sampling locations of the proposed dredge area has been calculated as follows:
• Previous SAP approved sediment investigations have identified contamination only in sediments <1m depth due to either core refusal and/or approved SAP requirements. Any contamination below 1m in capital material within the proposed dredge area is considered unlikely given there is historically low fine sediment deposition and the semi lithified nature of the sediments within the Port of Dampier (ENV Australia 2003a).
• NAGD (2009) states that for capital dredging projects in a port where there is some existing contamination overlying natural material, the number of sampling locations can be determined

DAMPIER PORT AUTHORITY DAMPIER MARINE SERVICES FACILITY PRELIMINARY SITE INVESTIGATION SAMPLING AND ANALYSIS PLAN
x:\projects\i01121 dampier marine services facility project\2.0 reports\ari\appendices\9 - acid sulfate soils assessment\psi sapappendix a).doc Page 18 301012/01121 : Rev 0 : 23-Oct-09
based on the volume of the contaminated or potentially contaminated material. The existing berth area covers an area of 23,000 m2 and has been classified as “suspect” requiring sampling from 9 sampling locations. The remaining approach and jetty areas covers an area of 444,764 m2 and has been classified as “probably clean” requiring sampling from a total of 27 sampling locations.
• Based on Table 2 of the DEC’s Draft Identification and Investigation of Acid Sulfate Soils the number of sampling locations required for PASS is usually 1 per 5,000 m2 for project areas greater than 40,000 m2 There is provision for reducing sampling densities providing the investigation program satisfactorily captures the various geological/geomorphological units at a site (DEC 2006a). Given the survey is preliminary in nature and there is a low risk of encountering PASS, acid sulfate soils will be tested at each of the contaminant sampling locations described in Section 2.2.1 at each of the specified horizons within the dredge area. This will correspond to 1 sample per 13,000 m2 on average. The results will indicate whether further sampling is required, as discussed in Section 1.13.2.
• PAHs and TPHs were not detected in the sediments located within and adjacent to the proposed dredge area in 2003 and 2007, as discussed in Section 1.11. However, as they are often associated with shipping activities they will be sampled at all sampling locations within the existing shipping berth and at a randomly selected 25% (7 samples) of the sampling sites in the approach and jetty areas. The randomly selected sampling sites are specified in Table 4.
The position of each sampling location was determined based on the grid based sampling scheme detailed in NADG (2009). Sampling locations were randomly selected from the grid, and positioned in the centre of each selected grid square.
The 36 sampling locations associated with the proposed dredge area are presented in Figure 5 of Appendix 1, with coordinates provided in Table 3 and Table 4. Every effort will be made to accommodate sampling at the locations identified. Any changes to sampling locations will be recorded, and new sampling locations will be provided in the resultant report with annotations of the change, distance and reason. Any changes to positions will be in the maximum order of tens of metres, and are most likely to result as measures to ensure diver safety in proximity to operating vessels. This is most likely in areas close to the existing berth pocket. The GPS coordinates, distance and reason for relocation of the amended sampling site from the original sampling site will be recorded and documented within the SAP implementation report.
2.2.1 Sampling Horizons
It is proposed that only surface sediments are sampled in the first instance, given that any contamination is likely to be restricted to the surface sediment layers. Up to two sampling horizons will be implemented as follows:
• 0-0.5 m using a sediment grab or diver core

DAMPIER PORT AUTHORITY DAMPIER MARINE SERVICES FACILITY PRELIMINARY SITE INVESTIGATION SAMPLING AND ANALYSIS PLAN
x:\projects\i01121 dampier marine services facility project\2.0 reports\ari\appendices\9 - acid sulfate soils assessment\psi sapappendix a).doc Page 19 301012/01121 : Rev 0 : 23-Oct-09
• 0.5-1 m from diver core
At each horizon a suite of contaminants will be tested as described in Section 2.3.
If refusal is met prior to reaching the proposed dredge depth samples will be collected to the nearest horizon providing there is sufficient sample material available. The depth of refusal and refusal material type will be recorded.

DAMPIER PORT AUTHORITY DAMPIER MARINE SERVICES FACILITY PRELIMINARY SITE INVESTIGATION SAMPLING AND ANALYSIS PLAN
x:\projects\i01121 dampier marine services facility project\2.0 reports\ari\appendices\9 - acid sulfate soils assessment\psi sapappendix a).doc Page 20 301012/01121 : Rev 0 : 23-Oct-09
Table 3 Coordinates of sampling locations for sediment analysis in the existing berth area
Grid Column (Y) Grid Row (X) Easting (m) Northing (m) Elutriate TPH/PAH
7 10 473975 7720579 Y Y
6 5 473865 7720601 N Y
5 7 473909 7720623 Y Y
5 9 473953 7720623 N Y
4 5 473865 7720645 N Y
4 6 473887 7720645 N Y
4 10 473975 7720645 Y Y
3 11 473997 7720667 N Y
2 8 473931 7720689 N Y
Projection - WGS84 (UTM Zone 50)
Table 4 Coordinates of sampling locations for sediment analysis in the approach and jetty area
Grid Column (Y) Grid Row (X) Easting (m) Northing (m) Elutriate TPH/PAH
21 21 473777 7720377 N N
13 22 473832 7720817 N N
13 25 473997 7720817 N N
12 22 473832 7720872 N N
12 24 473942 7720872 Y Y
10 20 473722 7720982 N N
10 23 473887 7720982 N N
10 28 474162 7720982 N Y
10 29 474217 7720982 N Y
9 20 473722 7721037 Y Y
7 13 473337 7721147 N N
7 16 473502 7721147 N N
6 23 473887 7721202 N N

DAMPIER PORT AUTHORITY DAMPIER MARINE SERVICES FACILITY PRELIMINARY SITE INVESTIGATION SAMPLING AND ANALYSIS PLAN
x:\projects\i01121 dampier marine services facility project\2.0 reports\ari\appendices\9 - acid sulfate soils assessment\psi sapappendix a).doc Page 21 301012/01121 : Rev 0 : 23-Oct-09
Grid Column (Y) Grid Row (X) Easting (m) Northing (m) Elutriate TPH/PAH
6 25 473997 7721202 N N
6 30 474272 7721202 Y Y
5 23 473887 7721257 N N
5 27 474107 7721257 N Y
4 22 473832 7721312 N N
4 23 473887 7721312 N N
4 24 473942 7721312 Y N
4 26 474052 7721312 N Y
4 30 474272 7721312 N N
3 27 474107 7721367 Y N
3 28 474162 7721367 Y N
2 26 474052 7721422 N N
2 29 474217 7721422 N N
10 26 474052 7720982 Y N
Projection - WGS84 (UTM Zone 50)
2.3 Proposed Sediment Quality Analysis Attributes for Analysis
The upper two horizons will be analysed for a detailed suite of contaminants. No testing is proposed below the 1 m horizon as the presence of anthropogenic compounds such as organotins, PAHs and TPHs in sediments 1 m below the seabed is considered unlikely. Acid sulfate soils will be tested at all sampling locations up to the point of refusal.
2.3.1 Analysis Suite
Sampling horizons 0-0.5 m and 0.5-1 m will be analysed for the following:
• moisture content
• total organic carbon (TOC)
• particle size distribution (<2 µm)
• total metals (Cu, Pb, Zn, Cr, Ni, Cd, Hg, As, Ag)
• nutrients (total nitrogen, nitrate, nitrite, ammonia, total phosphorous)

DAMPIER PORT AUTHORITY DAMPIER MARINE SERVICES FACILITY PRELIMINARY SITE INVESTIGATION SAMPLING AND ANALYSIS PLAN
x:\projects\i01121 dampier marine services facility project\2.0 reports\ari\appendices\9 - acid sulfate soils assessment\psi sapappendix a).doc Page 22 301012/01121 : Rev 0 : 23-Oct-09
• PAHs (including sum of PAHs)
• TPHs
• organotins (monobutyltin, dibutyltin and tributyltin)
• acid sulfate soils (sPOCAS)
2.3.2 Elutriate Analysis
To minimise the need to recollect material for Phase 3 elutriate testing (if required), hold samples will be taken for horizon in the top 1m of sediment at selected sampling locations (refer to Section 2.2)and stored at the laboratory in the event that further testing is required.
If elutriate analysis) is required, hold samples from the locations of the highest sampling locations would be analysed. Seven sample locations are required for Phase 3 testing according to Table 6 of the NAGD for the volume of dredging proposed from the approach and jetty area and three sample locations are required from the berth area.
2.4 Sample Collection and Processing
2.4.1 Sample Collection
Samples will be collected using a Van Veen grab (or equivalent device) that is suitable for sampling of surface sediments and supplemented by diver coring at selected sites.
As the sampling locations are in areas subject to frequent ship traffic, sampling at most of the locations will be undertaken using the grab sampler. Sampling by diver corer will be restricted to no more than 12 locations to minimise interruption to shipping movements. Sampling by diver corer will be undertaken at a combination of approach and existing berth locations depending on shipping traffic on the day of sampling.
The sampling will be led by a suitably qualified environmental professional with experience in the application of the NAGD and sediment quality assessment.
The vessel will be used as the platform for the sampling and will be operated by a licensed coxswain, Master Class 5 or Master Class 4. The vessel will include:
• onboard GPS (accurate to at least ± 10 m);
• onboard depth sounder (accurate to ± 0.25 m); and
• an ability to maintain clean surfaces e.g. an on-board deck-hose for wash down (seawater to be drawn from below the surface).

DAMPIER PORT AUTHORITY DAMPIER MARINE SERVICES FACILITY PRELIMINARY SITE INVESTIGATION SAMPLING AND ANALYSIS PLAN
x:\projects\i01121 dampier marine services facility project\2.0 reports\ari\appendices\9 - acid sulfate soils assessment\psi sapappendix a).doc Page 23 301012/01121 : Rev 0 : 23-Oct-09
All working areas of the vessel will be thoroughly checked, cleaned and prepared for sediment sampling activities prior to leaving moorings in the Port of Dampier to mobilise to the proposed dredge area.
Data sheets will be completed in the field (for each sampling location) to document collection details and sediment descriptions for later compilation onto a standardised core description log. Photographs will be taken of samples obtained at each sampling location.
2.4.2 Sample Processing
Samples will be collected using either a stainless steel grab or polycarbonate diver cores.
All samples will be inspected for integrity to ensure that samples collected are representative of the sediment sampled. Sample handling onboard the vessel will include sediment description logging, sample homogenisation, and containment for dispatch to analytical laboratories under chain of custody documentation. Samples will be homogenised in large stainless steel mixing bowls using gloved hands (powderless latex gloves). Samples will be stored in Teflon-lined, acid-rinsed containers, which comply with the NAGD standards. A table of containers to be used for samples is provided in Table 5. Sample containers will be labelled using indelible ink to record the sample location number and date on both the label and lid of the container, and will be stored either in refrigerators or in eskies with ice packs, and will remain refrigerated until dispatched to the analytical testing laboratory where they will be maintained at 4°C.
Table 5 Sample containers
Analyte Containers per sample
Chemical suite 2 x 500 ml solvent washed, glass jar with a Teflon lined lid
Particle size 1 x plastic bag to hold a minimum of 500 g sample
Acid sulfate soils 1 x plastic bag to hold a minimum of 200 g sample
Elutriate water (sea water) 1 x 15 L seawater in clean polythene carbouoy (1.5L per sample)
2.4.3 Hold Samples
Hold samples will not be collected in this SAP (except for elutriate analysis, as discussed in Section 2.3.2); instead, larger (500 ml) sediment sample volumes will be taken for total concentration assessments of sediments. All remaining sample material will be held at the analytical laboratory and retained for three months from the date of submission to function as hold samples and to be available for repeat/verification testing as may be required.

DAMPIER PORT AUTHORITY DAMPIER MARINE SERVICES FACILITY PRELIMINARY SITE INVESTIGATION SAMPLING AND ANALYSIS PLAN
x:\projects\i01121 dampier marine services facility project\2.0 reports\ari\appendices\9 - acid sulfate soils assessment\psi sapappendix a).doc Page 24 301012/01121 : Rev 0 : 23-Oct-09
2.5 Contingency Plan
Sampling is proposed to be undertaken in early October 2009. The sampling must be undertaken during a refueling window in dredging activities currently being undertaken by Woodside WEL for the Pluto project, in order to ensure sufficient diving visibility.
Weather forecasts will be reviewed prior to mobilisation with field work rescheduled if conditions are unsafe or likely to significantly disrupt sample collection. If significant weather conditions arise during sample collection, weather forecasts will be reviewed and sample collection will be either temporarily suspended on site, or the team will be demobilised and rescheduled for mobilisation.
The potential for contingency due to gear failure will be minimised through properly maintained equipment. If an equipment failure occurs, some parts may be repaired with spare parts taken to site or repaired locally at Dampier. If serious equipment failure occurs, then demobilisation and rescheduling following equipment repair would be required.
2.6 Laboratory Analysis
Table 6 provides summary details regarding the laboratory method information for the suite of total concentrations tests to be undertaken on sediment samples.

DAMPIER PORT AUTHORITY DAMPIER MARINE SERVICES FACILITY PRELIMINARY SITE INVESTIGATION SAMPLING AND ANALYSIS PLAN
x:\projects\i01121 dampier marine services facility project\2.0 reports\ari\appendices\9 - acid sulfate soils assessment\psi sapappendix a).doc Page 25 301012/01121 : Rev 0 : 23-Oct-09
Table 6 Method information for sediments
Activity / Test
Method Reference
Method Summary Practical Quantitation Limit
Moisture content
Gravimetric Oven-dry overnight, measure weight before and after drying 0.1%
Particle size distribution
Sieve and hydrometer
Sieve and hydrometer To 2 µm
Total organic carbon
Handbook of Soil & Water
Dilute acid treatment, high temperature dry combustion, infrared detection.
0.01%
Organotins In-house (Abalos et al. 1997, Attaar 1996)
Acidified solvent extraction, ethylation, derivitisation, GC/MS (EI mode)
0.5 µg Sn/kg
Trace Metals and Total P
USEPA 3050 / 200.7 ICP/AES
Nitric/hydrochloric acid digestion, ICP/AES 0.1-1 mg/kg
Mercury USEPA 3050 / 7471A CVAAS
Nitric/hydrochloric acid digestion, CV/AAS 0.01 mg/kg
Total N (TKN + nitrate and nitrite)
a)APHA Method 4500B +
b) APHA Method 4500F
Dry and crush sample to <150um. Weigh sub-sample and add digestion reagent. Distil sample and titrate with sulphuric acid.
+ 1:5 sediment/water extraction followed by Flow Injection Analyser (FIA) with spectrophotometric detection.
20 mg/kg
ASS (SPOCAS)
Ahern 2004 Extraction with 1M KCL, oxidation of the soil with hydrogen peroxide, digested solution is analysed by ICP – AES and then titration with 0.05 M NaOH.
0.02% S 2mol H+/t
TPHs USEPA 3510/8015
Sample extracts are analysed by Capillary GC/FID and quantified against alkane standards over the range C10 - C36. This method is compliant with NEPM (1999) Schedule B(3) (Method 506.1).
3-5 mg/kg per fraction
PAHs USEPA 3640/8270
8270 GCMS Capillary column, SIM mode using large volume programmed temperature vaporisation injection.
0.004-0.005 mg/kg
Elutriate TBT
Sample is extracted with seawater (at a ratio or 1:4) by tumbling for 1 hour and filtered or siphoned off. 500 mL of water is then spiked with surrogate, extracted with hexane, acidified to pH <2 and extracted with hexane. Extracts are combined, concentrated to 1 mL and derivatised using sodium tetraethylborate. The final extract is analysed for tributyltin by GCMS in SIM mode.
0.005 µg Sn/L
Porewater TBT
Extraction of pore water was performed by application of positive pressure and/or centrifuging. 500 mL of water is then spiked with surrogate, extracted with hexane, acidified to pH <2 and extracted with hexane. Extracts are combined, concentrated to 1 mL and derivatised using sodium tetraethylborate. The final extract is analysed for tributyltin by GCMS in SIM mode.
0.005 µg Sn/L

DAMPIER PORT AUTHORITY DAMPIER MARINE SERVICES FACILITY PRELIMINARY SITE INVESTIGATION SAMPLING AND ANALYSIS PLAN
x:\projects\i01121 dampier marine services facility project\2.0 reports\ari\appendices\9 - acid sulfate soils assessment\psi sapappendix a).doc Page 26 301012/01121 : Rev 0 : 23-Oct-09
3. SAMPLING AND ANALYSIS QUALITY CONTROL
3.1 Quality Control – Field Sampling
Quality Control during sampling will be ensured by:
• using suitably qualified environmental staff experienced in sediment sampling, field supervision and sediment logging
• logs will be competed for each sample collected including time, location, initials of sampler, duplicate type, chemical analyses to be performed and site observations
• chain of custody forms identifying (for each sample) the sampler, nature of the sample, collection date and time, analyses to be performed, sample preservation method and departure time from the site
• using a surveyed vessel which is thoroughly inspected and washed down
• samples contained in appropriately cleaned, pre-treated and labeled sample containers
• samples kept cool (4°C) after sampling and during transport, stored in eskies with pre-frozen ice bricks
• transportation of samples under chain of custody documentation
• additional QC samples to be generated in accordance with the NAGD (refer Section 3.2 below)
• all field QC duplicate/triplicate samples are to be ‘blind’ labeled in the field with QC field numbers which do not relate to sampling location names
• all sampling equipment, including mixing bowls etc. is to be decontaminated between sampling locations via a decontamination procedure involving a wash with ambient sea water and a laboratory grade detergent, and successive rinsing with deionised water; or by a similarly acceptable method.
3.2 Quality Control – Analysis
All laboratories used for analyses will be NATA accredited for the methods used and will be experienced in the analysis of marine sediments.
NAGD specifies the following quality control measures:
• Where volatile substances such as some chlorinated organics are being determined, one container (trip) blank filled with inert material, for example chromatographic sand.

DAMPIER PORT AUTHORITY DAMPIER MARINE SERVICES FACILITY PRELIMINARY SITE INVESTIGATION SAMPLING AND ANALYSIS PLAN
x:\projects\i01121 dampier marine services facility project\2.0 reports\ari\appendices\9 - acid sulfate soils assessment\psi sapappendix a).doc Page 27 301012/01121 : Rev 0 : 23-Oct-09
• For 10% of locations, one field triplicate (3 separate samples taken at the same location) to determine the variability of the sedime nt physical and chemical characteristics.
• Five percent of samples should be split into two containers to assess variation associated with sub-sample handling.
• One sample that has been analysed in a previous batch (if more that one batch is sent) to determine the analytical variation between batches.
• Hence the analytical laboratory will be required to analyse the following additional quality assurance samples collected in the field:
• three ‘triplicate’ sets of samples (i.e. separate samples from the one location), which will be tested for contaminant concentrations (organotins, trace metals, TPHs and PAHs) in the proposed dredge area
• five ‘duplicate’ split sample (i.e. duplicate samples formed from a homogenised sample at two locations), which will be tested for contaminant concentrations (organotins, trace metals and PAHs) within the proposed dredge area.
Coordinates of field triplicate and split duplicate sampling locations within the proposed sampling area are provided in Table 7.
Table 7 Coordinates of locations for field triplicate and split duplicate sampling and analysis in the proposed dredge area
Grid Column (Y) Grid Row (X) Easting (m) Northing (m) Field Triplicate Split Duplicate
6 5 473865 7720601 X
4 10 473975 7720645 X
10 20 473722 7720982 X
3 27 474107 7721367 X
10 26 474052 7720982 X
7 10 473975 7720579 X
Projection - WGS84 (UTM Zone 50)
One inter-batch quality assurance sample will be submitted for analysis for each batch of samples.
The analytical laboratory will need to comply with the laboratory and quality assurance procedures specified in Appendix A and Appendix F of the NAGD (2009).

DAMPIER PORT AUTHORITY DAMPIER MARINE SERVICES FACILITY PRELIMINARY SITE INVESTIGATION SAMPLING AND ANALYSIS PLAN
x:\projects\i01121 dampier marine services facility project\2.0 reports\ari\appendices\9 - acid sulfate soils assessment\psi sapappendix a).doc Page 28 301012/01121 : Rev 0 : 23-Oct-09
The laboratory quality assurance program should include the following quality control samples to be analysed in each batch (10-20 samples). This is in addition to its own internal procedures to ensure analytical procedures are conducted properly and produce reliable results:
• one laboratory blank sample
• one Standard Reference Material (SRM) i.e. a sample of certified composition such as MESS-1 or BCSS-1, or BEST-1 (for mercury)
• one sample spiked with the parameters being determined (or a surrogate spike for certain organics) at a concentration within the range of the method being employed – this will determine whether the recovery rate of the analytical method is adequate or not (that is, that all the chemicals present in the sample are actually being found in the analysis)
• one replicate sample to determine the precision of the analysis; the standard deviation and coefficient of variation to be documented.
A validation of the analytical data obtained will be undertaken in accordance with Appendix F of the NAGD (Commonwealth of Australia 2009) to confirm it is of a quality suitable for undertaking an assessment of dredge material suitability for sea disposal. This validation will include a consideration of results for blanks, standards and spikes, and replicate and duplicate samples. Relative percent differences and relative standard deviations between quality control duplicate and triplicate samples will be compared against relevant criteria.
In accordance with DEC requirements, signed chain-of-custody forms will record the receipt date and time and identify of samples included in shipments.

DAMPIER PORT AUTHORITY DAMPIER MARINE SERVICES FACILITY PRELIMINARY SITE INVESTIGATION SAMPLING AND ANALYSIS PLAN
x:\projects\i01121 dampier marine services facility project\2.0 reports\ari\appendices\9 - acid sulfate soils assessment\psi sapappendix a).doc Page 29 301012/01121 : Rev 0 : 23-Oct-09
4. ANALYSIS OF RESULTS
4.1 Assessment Framework
The suitability of the material for use in land based reclamation will be assessed by comparing concentrations of contaminants with both the NADG Screening Levels (Commonwealth of Australia 2009) and the Ecological Investigation Levels prescribed in the Assessment Levels for Soil, Sediment and Water (DEC 2003).
The hierarchy of assessment will be as follows:
Where all sediment contaminants are below the NAGD Screening Levels, no further testing will be required.
Where sediment contaminants are above the NAGD Screening Level, the following will be carried out:
o Elutriate testing to be undertaken and compared against relevant ANZECC/ARMCANZ (2000) guideline values;
o If water quality guidelines are exceeded then a toxicity assessment will be undertaken on the elutriate samples to determine whether the return water is likely to be toxic
o If return water is likely to be toxic, modeling to determine the area of plume dispersion
Where sediment contaminants are above the NAGD High Values, further sediment sampling will be undertaken to delineate “hot spot” areas.
4.2 Sediment Analysis for Total Sediment Concentrations
Sediment contaminant concentrations in the berth sediments will be compared to relevant NAGD guidelines (Commonwealth of Australia 2009) to determine their contaminant status. This will involve the following steps:
o The methods proposed to be used to calculate the 95% UCLs are based on the methods recommended in Appendix A of the NAGD (P58, Comparison of Data to Screening Levels). Normality of datasets will be determined using Shapiro-Wilks test in ProUCL Version 4 (4.00.02) developed by the US EPA. Datasets will be determined as being either normal, log-normal or other in their distributions. Normal datasets will be analysed using the 1-tailed

DAMPIER PORT AUTHORITY DAMPIER MARINE SERVICES FACILITY PRELIMINARY SITE INVESTIGATION SAMPLING AND ANALYSIS PLAN
x:\projects\i01121 dampier marine services facility project\2.0 reports\ari\appendices\9 - acid sulfate soils assessment\psi sapappendix a).doc Page 30 301012/01121 : Rev 0 : 23-Oct-09
student’s t UCL. Log-normal and other datasets will be analysed using non-parametric bootstrap or jack-knife analysis.
o The comparison against guideline levels involves the comparison of mean contaminant concentrations at the upper 95% confidence level of the mean (95%UCL). For the purposes of calculation of 95% UCLs, values below detection limit will be set to one-half of the laboratory detection limit (LOR) in accordance with NAGD recommendations. Results above detection for organic parameters are normalised to 1% TOC where the recorded value is within the range of 0.2 – 10%. If TOC values are outside this range, then the highest or lowest of the 0.2 – 10% range is adopted as appropriate.
• The upper 95% confidence interval (95% UCL) of each analyte will be compared to relevant Screening and Maximum levels in Table 2 and Table 4 of the NAGD, respectively.
• All contaminants will be compared against Ecological Investigation Levels prescribed in the Assessment Levels for Soil, Sediment and Water (DEC 2003).
4.3 Elutriate Analyses
If required, elutriate analyses will be undertaken using sediments prepared in a 1:4 suspension of Port of Dampier seawater. The elutriate concentrations at the 95th percentile for the relevant dredge area will be compared with the relevant toxicant trigger level in the ANZECC/ARMCANZ (2000) Australian and New Zealand Guidelines for Fresh and Marine Water Quality, following the procedures outlined in Appendix A of the NAGD (Commonwealth of Australia, 2009).
4.4 Bioavailability Analyses
If required, dilute acid extraction using weak acid (1M HCl) would be undertaken for metals. Laboratory results would be analysed similar to that for total metals contaminants, as presented in Section 4.2. For organic contaminants, freshly collected sediment samples would be pressure squeezed or centrifuged to provide the chemical laboratory with porewater for chemical analysis. The 95th percentile of porewater concentrations would be compared with the relevant trigger level in the ANZECC/ARMCANZ (2000) Australian and New Zealand Guidelines for Fresh and Marine Water Quality, following the procedures outlined in Appendix A of the NAGD (Commonwealth of Australia, 2009). Note that if porewater analysis is required, then further sample collection will be required to obtain the bulk material necessary to achieve suitable porewater sample volumes.
4.5 Acid Sulfate Soils Analyses
The SPOCAS results for levels of oxidizable sulfur will be assessed using the action criteria in Table 2 of the Guidelines for Sampling and Analysis of Lowland Acid Sulfate Soils in Queensland (Ahern,
DAMPIER PORT AUTHORITY DAMPIER MARINE SERVICES FACILITY PRELIMINARY SITE INVESTIGATION SAMPLING AND ANALYSIS PLAN
x:\projects\i01121 dampier marine services facility project\2.0 reports\ari\appendices\9 - acid sulfate soils assessment\psi sapappendix a).doc Page 31 301012/01121 : Rev 0 : 23-Oct-09
Ahern & Powell 1998). These guidelines are recommended by the Draft Treatment and management of soils and water in acid sulfate soil landscapes (DEC 2009).
4.6 Nutrient Analyses
There are no available guidelines for nutrient concentrations in sediment in the NAGD (Commonwealth of Australia 2009) or in the Contaminated Sites Series (DEC 2003). Nutrient concentrations will be compared to scientific literature and previous sediment studies in the area to determine whether concentrations are elevated and whether sediment disturbance poses any risk of eutrophication to the water column.

DAMPIER PORT AUTHORITY DAMPIER MARINE SERVICES FACILITY PRELIMINARY SITE INVESTIGATION SAMPLING AND ANALYSIS PLAN
x:\projects\i01121 dampier marine services facility project\2.0 reports\ari\appendices\9 - acid sulfate soils assessment\psi sapappendix a).doc Page 32 301012/01121 : Rev 0 : 23-Oct-09
5. REPORTING
A Preliminary Site Investigation report containing the following information will be prepared at the conclusion of sampling and analysis for submission to the DEC:
Executive Summary;
Introduction and description of the study area;
Details of the sampling methodology including any deviations from the approved SAP;
A figure showing the sampling locations;
Descriptions of the core samples, based upon the photographs and core logs;
Descriptions of any observations or anomalies during sampling and/or analysis;
Table of laboratories used and the analytical methods employed;
Quality Assurance Procedures and Results;
Summary table of results for each parameter analysed;
Comparison and interpretation of the results as indicated above;
Conclusions;
Recommendations; and
Appendices containing all laboratory reports and Quality Assurance and Quality Control analyses.

DAMPIER PORT AUTHORITY DAMPIER MARINE SERVICES FACILITY PRELIMINARY SITE INVESTIGATION SAMPLING AND ANALYSIS PLAN
x:\projects\i01121 dampier marine services facility project\2.0 reports\ari\appendices\9 - acid sulfate soils assessment\psi sapappendix a).doc Page 33 301012/01121 : Rev 0 : 23-Oct-09
6. REFERENCES
Ahern, C, Ahern, M & Powell, B 1998, Guidelines for Sampling and Analysis of Lowland Acid Sulfate Soils in Queensland.
ANZECC/ARMCANZ 2000, Water Quality and Monitoring Guidelines in National Water Quality Management Strategy.
Astron Environmental 2003, Dampier Cargo Wharf Loadout Facility and Laydown Area Extension - Benthic Survey.
Australian Hydrographic Service 2008, 'Australian National Tide Tables', http://www.hydro.gov.au/.
Commonwealth of Australia 2002, National Ocean Disposal Guidelines for Dredged Material, Canberra.
Commonwealth of Australia 2009, National Assessment Guidelines for Dredging (NAGD), Canberra.
DAL Science & Engineering Pty Ltd 2004, Pilbara Iron Ore and Infrastructure Project Marine Environmental Impacts and their Management, 389/1.
DEC 2001, Contaminated Sites Management Series: Development of Sampling and Analysis Programs, Perth.
DEC 2003, Assessment Levels for Soil, Sediment and Water, Contaminated Sites Management Series, Perth.
DEC 2006a, Draft Identification and Investigation of Acid Sulfate Soils, Acid Sulfate Soils Guideline Series, Department of Environment and Conservation Land & Water Quality Branch.
DEC, 2007, Marine Contamination. Available from: www.soe.wa.gov.au/report/marine/marine-contamination.html [July 14, 2008].
DEC 2009, Draft Treatment and management of soils and water in acid sulfate soil landscapes
DPA 2007a, Dredging & Spoil Management Plan, PL-914.
DPA 2007b, Marine Management Plan, PL-602, Dampier Port Authority, Dampier, WA.
ENV Australia 2003a, Dampier Cargo Wharf Expansion: Sediment Quality Investigation, Dampier Port Authority, Dampier, WA.
ENV Australia 2003b, Dampier Port Authority: Proposed Port Expansion and Dredging Program - Referral Document, Dampier Port Authority, Dampier, WA.

DAMPIER PORT AUTHORITY DAMPIER MARINE SERVICES FACILITY PRELIMINARY SITE INVESTIGATION SAMPLING AND ANALYSIS PLAN
x:\projects\i01121 dampier marine services facility project\2.0 reports\ari\appendices\9 - acid sulfate soils assessment\psi sapappendix a).doc Page 34 301012/01121 : Rev 0 : 23-Oct-09
Environment Australia 2002, National Ocean Disposal Guidelines for Dredged Material (NODGDM), Canberra.
Forde, MJ 1985, Technical report on suspended matter in Mermaid Sound, Dampier Archipelago. , Perth, Western Australia.
Hutchins, JB, Slack-Smith, SM, Berry, PF & Jones, DS 2004, 'Methodology', Records of the Western Australian Museum Supplement, vol. 66, pp. 3-5.
MScience 2006, Dampier Port Upgrade - 2006 Maintenance Dredging Project: Sediment Quality Assessment: September 2005, MSA44R2, Pilbara Iron Pty Ltd, Perth, WA.
MScience 2007, Dampier Port Authority: DCW Capital Dredging: Sediment Quality Report in Report prepared for the Dampier Port Authority, MScience Pty Ltd, Dampier, WA.
Pearce, A, Buchan, S, Chiffings, T, D'Adamo, N, Fandry, C, Fearns, P, Mills, D, Phillips, R & Simpson, C 2003, 'A review of oceanorgaphy of the Dampier Archipeligo, Western Australia', in The marine flora and fauna of Dampier, Western Australia, eds Wells F. E, Walker D. I & Jones D. S, Western Australia Museum, Perth, pp. 13-50.
Semeniuk, V, Chalmer, PN & LeProvost, I 1982, 'The marine environments of the Dampier Archipelago', Journal of the Royal Society of Western Australia, , vol. 65 no. 3, pp. 97-114.
Simpson, CJ 1988, Ecology of scleractinian corals in the Dampier Archipelago, Western Australia, Western Australian Environmental Protection Authority.
SKM 2006, Pluto LNG Development, Draft Public Environmental Report/Public Environmental Review, Assessment Number 1632, Woodside Petroleum Ltd.
Stoddart, JA & Anstee, S 2004, 'Water quality, plume modelling and tracking before and during dredging in Mermaid Sound, Dampier, Western Australia', in Corals of the Dampier Harbour: Their Survival and Reproduction During the Dredging Programs of 2004, eds Stoddart J.A. & Stoddart S.E., Mscience Pty Ltd, Perth Western Australia, pp. 13-33.
Wenziker, K, McAlpine, K, Apte, S & Masini, R 2006, Background quality for coastal marine waters of the North West Shelf Western Australia. North West Shelf Joint Environmental Management Study, CSIRO Marine and Atmospheric Research.

DAMPIER PORT AUTHORITY DAMPIER MARINE SERVICES FACILITY PRELIMINARY SITE INVESTIGATION SAMPLING AND ANALYSIS PLAN
x:\projects\i01121 dampier marine services facility project\2.0 reports\ari\appendices\9 - acid sulfate soils assessment\psi sapappendix a).doc Appendix 301012/01121 : Rev 0 : 23-Oct-09
Appendix 1– Figures

DAMPIER PORT AUTHORITY DAMPIER PORT EXPANSION PRELIMINARY SITE INVESTIGATION SAMPLING AND ANALYSIS PLAN
x:\projects\i01121 dampier marine services facility project\2.0 reports\ari\appendices\9 - acid sulfate soils assessment\psi sapappendix a).doc Page 1 301012/01121 : Rev 0 : 23-Oct-09
Appendix 2– Geotechnical Survey Soil Core Logs
DAMPIER PORT AUTHORITY DAMPIER MARINE SERVICES FACILITY PRELIMINARY SITE INVESTIGATION SAMPLING AND ANALYSIS PLAN IMPLEMENTATION REPORT
i:\projects\i01121 dampier marine services facility project\2.0 reports\ari\appendices\9 - acid sulfate soils assessment\psi -sap-ir 23-12-09.doc Page 58 301012-01121 : Rev 0 : 3-Dec-09
Appendix B – Laboratory Reports


EP0905895
False
CERTIFICATE OF ANALYSIS
Work Order : EP0905895 Page : 1 of 18
:: LaboratoryClient Environmental Division PerthADVANCED ANALYTICAL AUSTRALIA
: :ContactContact JANE STRUTHERS Michael Sharp
:: AddressAddress 7 FORREST AVENUE
EAST PERTH WA, AUSTRALIA 6004
10 Hod Way Malaga WA Australia 6090
:: E-mailE-mail [email protected] [email protected]
:: TelephoneTelephone 9325 9799 +61-8-9209 7655
:: FacsimileFacsimile 9325 4299 +61-8-9209 7600
:Project A09 3208 & A09 3223 QC Level : NEPM 1999 Schedule B(3) and ALS QCS3 requirement
:Order number ----
:C-O-C number ---- Date Samples Received : 15-OCT-2009
Sampler : ---- Issue Date : 22-OCT-2009
Site : ----
37:No. of samples received
Quote number : ---- 37:No. of samples analysed
This report supersedes any previous report(s) with this reference. Results apply to the sample(s) as submitted. All pages of this report have been checked and approved for
release.
This Certificate of Analysis contains the following information:
l General Comments
l Analytical Results
NATA Accredited Laboratory 825
This document is issued in
accordance with NATA
accreditation requirements.
Accredited for compliance with
ISO/IEC 17025.
SignatoriesThis document has been electronically signed by the authorized signatories indicated below. Electronic signing has been
carried out in compliance with procedures specified in 21 CFR Part 11.
Signatories Accreditation CategoryPosition
Stacey Hawkins Senior Chemist - Acid Sulphate Soils Perth ASS
Environmental Division Perth
10 Hod Way Malaga WA Australia 6090
Tel. +61-8-9209 7655 Fax. +61-8-9209 7600 www.alsglobal.com

2 of 18:Page
Work Order :
:Client
EP0905895
ADVANCED ANALYTICAL AUSTRALIA
A09 3208 & A09 3223:Project
General Comments
The analytical procedures used by the Environmental Division have been developed from established internationally recognized procedures such as those published by the USEPA, APHA, AS and NEPM. In house
developed procedures are employed in the absence of documented standards or by client request.
Where moisture determination has been performed, results are reported on a dry weight basis.
Where a reported less than (<) result is higher than the LOR, this may be due to primary sample extract/digestate dilution and/or insuffient sample for analysis.
Where the LOR of a reported result differs from standard LOR, this may be due to high moisture content, insufficient sample (reduced weight employed) or matrix interference.
When date(s) and/or time(s) are shown bracketed, these have been assumed by the laboratory for processing purposes. If the sampling time is displayed as 0:00 the information was not provided by client.
CAS Number = CAS registry number from database maintained by Chemical Abstracts Services. The Chemical Abstracts Service is a division of the American Chemical Society.
LOR = Limit of reporting
^ = This result is computed from individual analyte detections at or above the level of reporting
Key :
Liming rate is calculated and reported on a dry weight basis assuming use of fine agricultural lime (CaCO3) and using a safety factor of 1.5 to allow for non-homogeneous mixing and
poor reactivity of lime. For conversion of Liming Rate from 'kg/t dry weight' to 'kg/m3 in-situ soil', multiply 'reported results' x 'wet bulk density of soil in t/m3'.
l
Retained Acidity not required because pH KCl greater than or equal to 4.5l

3 of 18:Page
Work Order :
:Client
EP0905895
ADVANCED ANALYTICAL AUSTRALIA
A09 3208 & A09 3223:Project
Analytical Results
A09/3208 - 8
DA2009 - 1.0
A09/3208 - 6
DA1607 - 1.0
A09/3208 - 4
BP1108 - 0.0-3
A09/3208 - 3
BP1108 - 0.0-2
A09/3208 - 2
BP1103 - 1.0
Client sample IDSub-Matrix: SOIL
14-OCT-2009 15:0014-OCT-2009 15:0014-OCT-2009 15:0014-OCT-2009 15:0014-OCT-2009 15:00Client sampling date / time
EP0905895-005EP0905895-004EP0905895-003EP0905895-002EP0905895-001UnitLORCAS NumberCompound
EA029-A: pH Measurements
9.39.3 9.4 9.2 9.3pH Unit0.1----pH KCl (23A)
8.78.2 8.5 8.4 8.4pH Unit0.1----pH OX (23B)
EA029-B: Acidity Trail<2<2 <2 <2 <2mole H+ / t2----Titratable Actual Acidity (23F)
<2<2 <2 <2 <2mole H+ / t2----Titratable Peroxide Acidity (23G)
<2<2 <2 <2 <2mole H+ / t2----Titratable Sulfidic Acidity (23H)
<0.02<0.02 <0.02 <0.02 <0.02% pyrite S0.02----sulfidic - Titratable Actual Acidity (s-23F)
<0.02<0.02 <0.02 <0.02 <0.02% pyrite S0.02----sulfidic - Titratable Peroxide Acidity
(s-23G)
<0.02<0.02 <0.02 <0.02 <0.02% pyrite S0.02----sulfidic - Titratable Sulfidic Acidity (s-23H)
EA029-C: Sulfur Trail
0.120.14 0.03 0.22 0.18% S0.02----KCl Extractable Sulfur (23Ce)
0.300.38 0.26 0.50 0.76% S0.02----Peroxide Sulfur (23De)
0.180.23 0.23 0.29 0.58% S0.02----Peroxide Oxidisable Sulfur (23E)
113144 142 179 362mole H+ / t10----acidity - Peroxide Oxidisable Sulfur
(a-23E)
EA029-D: Calcium Values
0.340.38 0.10 0.43 0.34% Ca0.02----KCl Extractable Calcium (23Vh)
22.521.9 19.8 21.7 23.7% Ca0.02----Peroxide Calcium (23Wh)
22.121.5 19.7 21.3 23.4% Ca0.02----Acid Reacted Calcium (23X)
1100010700 9810 10600 11700mole H+ / t10----acidity - Acid Reacted Calcium (a-23X)
17.717.2 15.7 17.0 18.7% S0.02----sulfidic - Acid Reacted Calcium (s-23X)
EA029-E: Magnesium Values
0.120.14 0.04 0.19 0.14% Mg0.02----KCl Extractable Magnesium (23Sm)
0.780.89 0.66 1.02 0.94% Mg0.02----Peroxide Magnesium (23Tm)
0.660.74 0.62 0.82 0.80% Mg0.02----Acid Reacted Magnesium (23U)
542613 512 679 655mole H+ / t10----Acidity - Acid Reacted Magnesium (a-23U)
0.870.98 0.82 1.09 1.05% S0.02----sulfidic - Acid Reacted Magnesium
(s-23U)
EA029-F: Excess Acid Neutralising Capacity
54.654.0 51.8 54.4 61.0% CaCO30.02----Excess Acid Neutralising Capacity (23Q)
1090010800 10300 10900 12200mole H+ / t10----acidity - Excess Acid Neutralising
Capacity (a-23Q)
17.517.3 16.6 17.4 19.5% S0.02----sulfidic - Excess Acid Neutralising
Capacity (s-23Q)
EA029-H: Acid Base Accounting

4 of 18:Page
Work Order :
:Client
EP0905895
ADVANCED ANALYTICAL AUSTRALIA
A09 3208 & A09 3223:Project
Analytical Results
A09/3208 - 8
DA2009 - 1.0
A09/3208 - 6
DA1607 - 1.0
A09/3208 - 4
BP1108 - 0.0-3
A09/3208 - 3
BP1108 - 0.0-2
A09/3208 - 2
BP1103 - 1.0
Client sample IDSub-Matrix: SOIL
14-OCT-2009 15:0014-OCT-2009 15:0014-OCT-2009 15:0014-OCT-2009 15:0014-OCT-2009 15:00Client sampling date / time
EP0905895-005EP0905895-004EP0905895-003EP0905895-002EP0905895-001UnitLORCAS NumberCompound
EA029-H: Acid Base Accounting - Continued
1.51.5 1.5 1.5 1.5-0.5----ANC Fineness Factor
<0.02<0.02 <0.02 <0.02 <0.02% S0.02----Net Acidity (sulfur units)
<10<10 <10 <10 <10mole H+ / t10----Net Acidity (acidity units)
<1<1 <1 <1 <1kg CaCO3/t1----Liming Rate
0.180.23 0.23 0.29 0.58% S0.02----Net Acidity excluding ANC (sulfur units)
113144 142 179 362mole H+ / t10----Net Acidity excluding ANC (acidity units)
811 11 13 27kg CaCO3/t1----Liming Rate excluding ANC

5 of 18:Page
Work Order :
:Client
EP0905895
ADVANCED ANALYTICAL AUSTRALIA
A09 3208 & A09 3223:Project
Analytical Results
A09/3208 - 22
DA2806 - 0.0-3
A09/3208 - 21
DA2806 - 0.0-2
A09/3208 - 19
DA2705
A09/3208 - 14
DA2306 - 1.0
A09/3208 - 11
DA2304 - 1.0
Client sample IDSub-Matrix: SOIL
14-OCT-2009 15:0014-OCT-2009 15:0014-OCT-2009 15:0014-OCT-2009 15:0014-OCT-2009 15:00Client sampling date / time
EP0905895-010EP0905895-009EP0905895-008EP0905895-007EP0905895-006UnitLORCAS NumberCompound
EA029-A: pH Measurements
9.29.2 9.3 9.2 9.3pH Unit0.1----pH KCl (23A)
8.48.6 8.5 8.3 8.6pH Unit0.1----pH OX (23B)
EA029-B: Acidity Trail<2<2 <2 <2 <2mole H+ / t2----Titratable Actual Acidity (23F)
<2<2 <2 <2 <2mole H+ / t2----Titratable Peroxide Acidity (23G)
<2<2 <2 <2 <2mole H+ / t2----Titratable Sulfidic Acidity (23H)
<0.02<0.02 <0.02 <0.02 <0.02% pyrite S0.02----sulfidic - Titratable Actual Acidity (s-23F)
<0.02<0.02 <0.02 <0.02 <0.02% pyrite S0.02----sulfidic - Titratable Peroxide Acidity
(s-23G)
<0.02<0.02 <0.02 <0.02 <0.02% pyrite S0.02----sulfidic - Titratable Sulfidic Acidity (s-23H)
EA029-C: Sulfur Trail
0.130.13 0.19 0.20 0.18% S0.02----KCl Extractable Sulfur (23Ce)
0.450.44 0.44 0.56 0.54% S0.02----Peroxide Sulfur (23De)
0.320.30 0.25 0.36 0.36% S0.02----Peroxide Oxidisable Sulfur (23E)
202190 158 222 223mole H+ / t10----acidity - Peroxide Oxidisable Sulfur
(a-23E)
EA029-D: Calcium Values
0.360.39 0.41 0.46 0.44% Ca0.02----KCl Extractable Calcium (23Vh)
21.021.6 20.8 20.3 21.0% Ca0.02----Peroxide Calcium (23Wh)
20.721.2 20.4 19.8 20.6% Ca0.02----Acid Reacted Calcium (23X)
1030010600 10200 9900 10300mole H+ / t10----acidity - Acid Reacted Calcium (a-23X)
16.517.0 16.3 15.9 16.5% S0.02----sulfidic - Acid Reacted Calcium (s-23X)
EA029-E: Magnesium Values
0.130.15 0.17 0.20 0.20% Mg0.02----KCl Extractable Magnesium (23Sm)
0.800.86 0.94 1.06 1.09% Mg0.02----Peroxide Magnesium (23Tm)
0.670.72 0.77 0.86 0.89% Mg0.02----Acid Reacted Magnesium (23U)
550588 632 709 732mole H+ / t10----Acidity - Acid Reacted Magnesium (a-23U)
0.880.94 1.01 1.14 1.17% S0.02----sulfidic - Acid Reacted Magnesium
(s-23U)
EA029-F: Excess Acid Neutralising Capacity
51.251.8 52.2 49.6 50.7% CaCO30.02----Excess Acid Neutralising Capacity (23Q)
1020010300 10400 9910 10100mole H+ / t10----acidity - Excess Acid Neutralising
Capacity (a-23Q)
16.416.6 16.7 15.9 16.2% S0.02----sulfidic - Excess Acid Neutralising
Capacity (s-23Q)
EA029-H: Acid Base Accounting

6 of 18:Page
Work Order :
:Client
EP0905895
ADVANCED ANALYTICAL AUSTRALIA
A09 3208 & A09 3223:Project
Analytical Results
A09/3208 - 22
DA2806 - 0.0-3
A09/3208 - 21
DA2806 - 0.0-2
A09/3208 - 19
DA2705
A09/3208 - 14
DA2306 - 1.0
A09/3208 - 11
DA2304 - 1.0
Client sample IDSub-Matrix: SOIL
14-OCT-2009 15:0014-OCT-2009 15:0014-OCT-2009 15:0014-OCT-2009 15:0014-OCT-2009 15:00Client sampling date / time
EP0905895-010EP0905895-009EP0905895-008EP0905895-007EP0905895-006UnitLORCAS NumberCompound
EA029-H: Acid Base Accounting - Continued
1.51.5 1.5 1.5 1.5-0.5----ANC Fineness Factor
<0.02<0.02 <0.02 <0.02 <0.02% S0.02----Net Acidity (sulfur units)
<10<10 <10 <10 <10mole H+ / t10----Net Acidity (acidity units)
<1<1 <1 <1 <1kg CaCO3/t1----Liming Rate
0.320.30 0.25 0.36 0.36% S0.02----Net Acidity excluding ANC (sulfur units)
202190 158 222 223mole H+ / t10----Net Acidity excluding ANC (acidity units)
1514 12 17 17kg CaCO3/t1----Liming Rate excluding ANC

7 of 18:Page
Work Order :
:Client
EP0905895
ADVANCED ANALYTICAL AUSTRALIA
A09 3208 & A09 3223:Project
Analytical Results
A09/3223 - 2
BP56
A09/3223 - 1
BP54
A09/3208 - 28
DA8006 - 0.0-3
A09/3208 - 27
DA8006 - 0.0-2
A09/3208 - 26
DA3006 - 1.0
Client sample IDSub-Matrix: SOIL
14-OCT-2009 15:0014-OCT-2009 15:0014-OCT-2009 15:0014-OCT-2009 15:0014-OCT-2009 15:00Client sampling date / time
EP0905895-015EP0905895-014EP0905895-013EP0905895-012EP0905895-011UnitLORCAS NumberCompound
EA029-A: pH Measurements
9.29.4 9.3 9.4 9.4pH Unit0.1----pH KCl (23A)
8.48.6 8.3 8.6 8.4pH Unit0.1----pH OX (23B)
EA029-B: Acidity Trail<2<2 <2 <2 <2mole H+ / t2----Titratable Actual Acidity (23F)
<2<2 <2 <2 <2mole H+ / t2----Titratable Peroxide Acidity (23G)
<2<2 <2 <2 <2mole H+ / t2----Titratable Sulfidic Acidity (23H)
<0.02<0.02 <0.02 <0.02 <0.02% pyrite S0.02----sulfidic - Titratable Actual Acidity (s-23F)
<0.02<0.02 <0.02 <0.02 <0.02% pyrite S0.02----sulfidic - Titratable Peroxide Acidity
(s-23G)
<0.02<0.02 <0.02 <0.02 <0.02% pyrite S0.02----sulfidic - Titratable Sulfidic Acidity (s-23H)
EA029-C: Sulfur Trail
0.180.14 0.17 0.14 0.13% S0.02----KCl Extractable Sulfur (23Ce)
0.460.35 0.44 0.32 0.30% S0.02----Peroxide Sulfur (23De)
0.270.21 0.28 0.18 0.17% S0.02----Peroxide Oxidisable Sulfur (23E)
170129 172 113 107mole H+ / t10----acidity - Peroxide Oxidisable Sulfur
(a-23E)
EA029-D: Calcium Values
0.430.35 0.42 0.34 0.39% Ca0.02----KCl Extractable Calcium (23Vh)
19.626.0 20.5 24.3 20.8% Ca0.02----Peroxide Calcium (23Wh)
19.125.7 20.1 24.0 20.5% Ca0.02----Acid Reacted Calcium (23X)
955012800 10000 12000 10200mole H+ / t10----acidity - Acid Reacted Calcium (a-23X)
15.320.6 16.1 19.2 16.4% S0.02----sulfidic - Acid Reacted Calcium (s-23X)
EA029-E: Magnesium Values
0.180.12 0.16 0.12 0.16% Mg0.02----KCl Extractable Magnesium (23Sm)
1.060.96 0.87 0.82 0.89% Mg0.02----Peroxide Magnesium (23Tm)
0.880.84 0.71 0.70 0.73% Mg0.02----Acid Reacted Magnesium (23U)
724692 582 575 602mole H+ / t10----Acidity - Acid Reacted Magnesium (a-23U)
1.161.11 0.93 0.92 0.96% S0.02----sulfidic - Acid Reacted Magnesium
(s-23U)
EA029-F: Excess Acid Neutralising Capacity
56.461.3 50.4 63.7 56.0% CaCO30.02----Excess Acid Neutralising Capacity (23Q)
1130012200 10100 12700 11200mole H+ / t10----acidity - Excess Acid Neutralising
Capacity (a-23Q)
18.119.6 16.1 20.4 17.9% S0.02----sulfidic - Excess Acid Neutralising
Capacity (s-23Q)
EA029-H: Acid Base Accounting
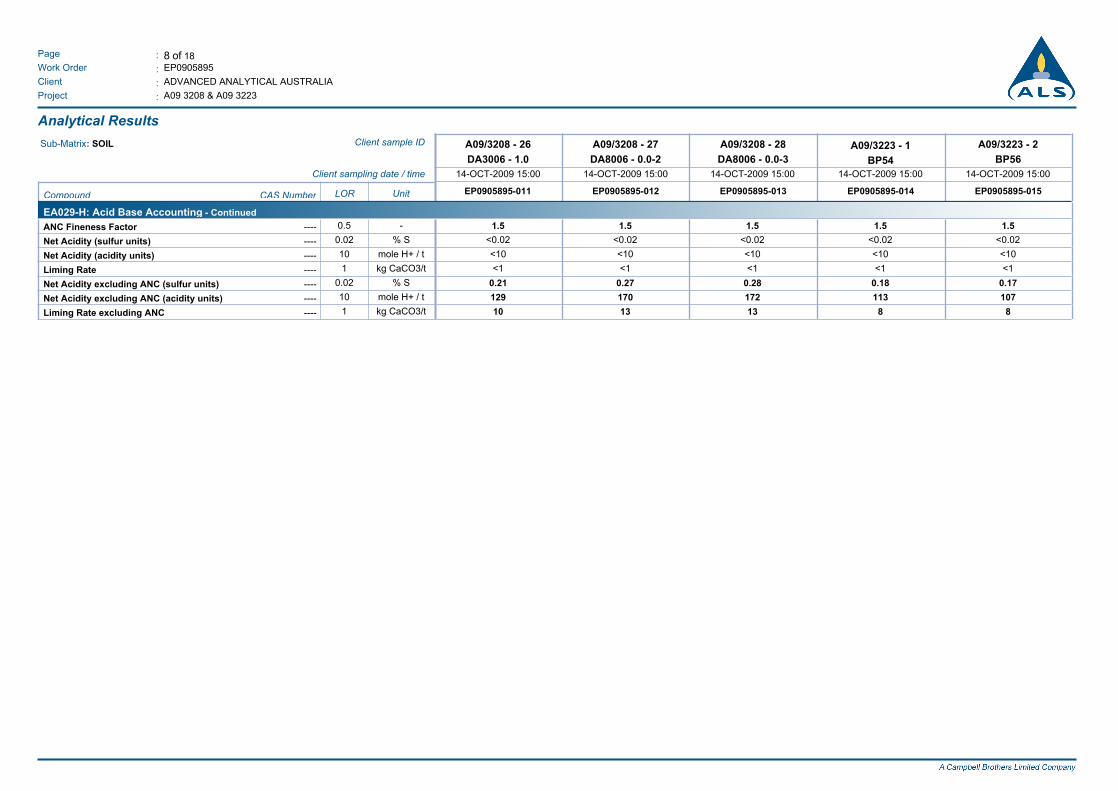
8 of 18:Page
Work Order :
:Client
EP0905895
ADVANCED ANALYTICAL AUSTRALIA
A09 3208 & A09 3223:Project
Analytical Results
A09/3223 - 2
BP56
A09/3223 - 1
BP54
A09/3208 - 28
DA8006 - 0.0-3
A09/3208 - 27
DA8006 - 0.0-2
A09/3208 - 26
DA3006 - 1.0
Client sample IDSub-Matrix: SOIL
14-OCT-2009 15:0014-OCT-2009 15:0014-OCT-2009 15:0014-OCT-2009 15:0014-OCT-2009 15:00Client sampling date / time
EP0905895-015EP0905895-014EP0905895-013EP0905895-012EP0905895-011UnitLORCAS NumberCompound
EA029-H: Acid Base Accounting - Continued
1.51.5 1.5 1.5 1.5-0.5----ANC Fineness Factor
<0.02<0.02 <0.02 <0.02 <0.02% S0.02----Net Acidity (sulfur units)
<10<10 <10 <10 <10mole H+ / t10----Net Acidity (acidity units)
<1<1 <1 <1 <1kg CaCO3/t1----Liming Rate
0.270.21 0.28 0.18 0.17% S0.02----Net Acidity excluding ANC (sulfur units)
170129 172 113 107mole H+ / t10----Net Acidity excluding ANC (acidity units)
1310 13 8 8kg CaCO3/t1----Liming Rate excluding ANC

9 of 18:Page
Work Order :
:Client
EP0905895
ADVANCED ANALYTICAL AUSTRALIA
A09 3208 & A09 3223:Project
Analytical Results
A09/3223 - 7
BP84 - 2
A09/3223 - 6
BP82
A09/3223 - 5
BP75
A09/3223 - 4
BP68 - 2
A09/3223 - 3
BP64
Client sample IDSub-Matrix: SOIL
14-OCT-2009 15:0014-OCT-2009 15:0014-OCT-2009 15:0014-OCT-2009 15:0014-OCT-2009 15:00Client sampling date / time
EP0905895-020EP0905895-019EP0905895-018EP0905895-017EP0905895-016UnitLORCAS NumberCompound
EA029-A: pH Measurements
9.49.4 9.4 9.4 9.4pH Unit0.1----pH KCl (23A)
8.68.7 8.5 8.4 8.5pH Unit0.1----pH OX (23B)
EA029-B: Acidity Trail<2<2 <2 <2 <2mole H+ / t2----Titratable Actual Acidity (23F)
<2<2 <2 <2 <2mole H+ / t2----Titratable Peroxide Acidity (23G)
<2<2 <2 <2 <2mole H+ / t2----Titratable Sulfidic Acidity (23H)
<0.02<0.02 <0.02 <0.02 <0.02% pyrite S0.02----sulfidic - Titratable Actual Acidity (s-23F)
<0.02<0.02 <0.02 <0.02 <0.02% pyrite S0.02----sulfidic - Titratable Peroxide Acidity
(s-23G)
<0.02<0.02 <0.02 <0.02 <0.02% pyrite S0.02----sulfidic - Titratable Sulfidic Acidity (s-23H)
EA029-C: Sulfur Trail
0.150.11 0.15 0.15 0.15% S0.02----KCl Extractable Sulfur (23Ce)
0.350.34 0.37 0.35 0.39% S0.02----Peroxide Sulfur (23De)
0.200.23 0.21 0.20 0.24% S0.02----Peroxide Oxidisable Sulfur (23E)
124141 132 124 150mole H+ / t10----acidity - Peroxide Oxidisable Sulfur
(a-23E)
EA029-D: Calcium Values
0.340.32 0.38 0.35 0.34% Ca0.02----KCl Extractable Calcium (23Vh)
25.223.9 23.6 23.4 23.7% Ca0.02----Peroxide Calcium (23Wh)
24.923.6 23.2 23.0 23.4% Ca0.02----Acid Reacted Calcium (23X)
1240011800 11600 11500 11600mole H+ / t10----acidity - Acid Reacted Calcium (a-23X)
19.918.8 18.6 18.4 18.7% S0.02----sulfidic - Acid Reacted Calcium (s-23X)
EA029-E: Magnesium Values
0.130.09 0.14 0.13 0.11% Mg0.02----KCl Extractable Magnesium (23Sm)
0.900.84 0.94 0.91 0.84% Mg0.02----Peroxide Magnesium (23Tm)
0.770.74 0.80 0.78 0.73% Mg0.02----Acid Reacted Magnesium (23U)
634611 654 641 599mole H+ / t10----Acidity - Acid Reacted Magnesium (a-23U)
1.020.98 1.05 1.03 0.96% S0.02----sulfidic - Acid Reacted Magnesium
(s-23U)
EA029-F: Excess Acid Neutralising Capacity
59.257.7 58.7 59.1 57.4% CaCO30.02----Excess Acid Neutralising Capacity (23Q)
1180011500 11700 11800 11400mole H+ / t10----acidity - Excess Acid Neutralising
Capacity (a-23Q)
19.018.5 18.8 18.9 18.4% S0.02----sulfidic - Excess Acid Neutralising
Capacity (s-23Q)
EA029-H: Acid Base Accounting

10 of 18:Page
Work Order :
:Client
EP0905895
ADVANCED ANALYTICAL AUSTRALIA
A09 3208 & A09 3223:Project
Analytical Results
A09/3223 - 7
BP84 - 2
A09/3223 - 6
BP82
A09/3223 - 5
BP75
A09/3223 - 4
BP68 - 2
A09/3223 - 3
BP64
Client sample IDSub-Matrix: SOIL
14-OCT-2009 15:0014-OCT-2009 15:0014-OCT-2009 15:0014-OCT-2009 15:0014-OCT-2009 15:00Client sampling date / time
EP0905895-020EP0905895-019EP0905895-018EP0905895-017EP0905895-016UnitLORCAS NumberCompound
EA029-H: Acid Base Accounting - Continued
1.51.5 1.5 1.5 1.5-0.5----ANC Fineness Factor
<0.02<0.02 <0.02 <0.02 <0.02% S0.02----Net Acidity (sulfur units)
<10<10 <10 <10 <10mole H+ / t10----Net Acidity (acidity units)
<1<1 <1 <1 <1kg CaCO3/t1----Liming Rate
0.200.23 0.21 0.20 0.24% S0.02----Net Acidity excluding ANC (sulfur units)
124141 132 124 150mole H+ / t10----Net Acidity excluding ANC (acidity units)
911 10 9 11kg CaCO3/t1----Liming Rate excluding ANC

11 of 18:Page
Work Order :
:Client
EP0905895
ADVANCED ANALYTICAL AUSTRALIA
A09 3208 & A09 3223:Project
Analytical Results
A09/3223 - 12
BP107
A09/3223 - 11
BP104
A09/3223 - 10
BP95
A09/3223 - 9
BP88 - 3
A09/3223 - 8
BP88 - 2
Client sample IDSub-Matrix: SOIL
14-OCT-2009 15:0014-OCT-2009 15:0014-OCT-2009 15:0014-OCT-2009 15:0014-OCT-2009 15:00Client sampling date / time
EP0905895-025EP0905895-024EP0905895-023EP0905895-022EP0905895-021UnitLORCAS NumberCompound
EA029-A: pH Measurements
9.59.4 9.4 9.4 9.5pH Unit0.1----pH KCl (23A)
8.28.2 8.1 8.3 8.2pH Unit0.1----pH OX (23B)
EA029-B: Acidity Trail<2<2 <2 <2 <2mole H+ / t2----Titratable Actual Acidity (23F)
<2<2 <2 <2 <2mole H+ / t2----Titratable Peroxide Acidity (23G)
<2<2 <2 <2 <2mole H+ / t2----Titratable Sulfidic Acidity (23H)
<0.02<0.02 <0.02 <0.02 <0.02% pyrite S0.02----sulfidic - Titratable Actual Acidity (s-23F)
<0.02<0.02 <0.02 <0.02 <0.02% pyrite S0.02----sulfidic - Titratable Peroxide Acidity
(s-23G)
<0.02<0.02 <0.02 <0.02 <0.02% pyrite S0.02----sulfidic - Titratable Sulfidic Acidity (s-23H)
EA029-C: Sulfur Trail
0.120.10 0.16 0.13 0.11% S0.02----KCl Extractable Sulfur (23Ce)
0.320.32 0.34 0.35 0.30% S0.02----Peroxide Sulfur (23De)
0.200.23 0.18 0.22 0.19% S0.02----Peroxide Oxidisable Sulfur (23E)
124141 112 136 120mole H+ / t10----acidity - Peroxide Oxidisable Sulfur
(a-23E)
EA029-D: Calcium Values
0.330.31 0.39 0.37 0.32% Ca0.02----KCl Extractable Calcium (23Vh)
24.222.7 21.4 23.7 24.4% Ca0.02----Peroxide Calcium (23Wh)
23.922.4 21.0 23.4 24.0% Ca0.02----Acid Reacted Calcium (23X)
1190011200 10500 11700 12000mole H+ / t10----acidity - Acid Reacted Calcium (a-23X)
19.117.9 16.8 18.7 19.2% S0.02----sulfidic - Acid Reacted Calcium (s-23X)
EA029-E: Magnesium Values
0.100.11 0.15 0.12 0.10% Mg0.02----KCl Extractable Magnesium (23Sm)
0.800.74 0.86 0.90 0.73% Mg0.02----Peroxide Magnesium (23Tm)
0.700.62 0.70 0.77 0.64% Mg0.02----Acid Reacted Magnesium (23U)
576514 580 637 525mole H+ / t10----Acidity - Acid Reacted Magnesium (a-23U)
0.920.82 0.93 1.02 0.84% S0.02----sulfidic - Acid Reacted Magnesium
(s-23U)
EA029-F: Excess Acid Neutralising Capacity
59.259.0 56.3 56.6 58.5% CaCO30.02----Excess Acid Neutralising Capacity (23Q)
1180011800 11200 11300 11700mole H+ / t10----acidity - Excess Acid Neutralising
Capacity (a-23Q)
18.918.9 18.0 18.1 18.7% S0.02----sulfidic - Excess Acid Neutralising
Capacity (s-23Q)
EA029-H: Acid Base Accounting

12 of 18:Page
Work Order :
:Client
EP0905895
ADVANCED ANALYTICAL AUSTRALIA
A09 3208 & A09 3223:Project
Analytical Results
A09/3223 - 12
BP107
A09/3223 - 11
BP104
A09/3223 - 10
BP95
A09/3223 - 9
BP88 - 3
A09/3223 - 8
BP88 - 2
Client sample IDSub-Matrix: SOIL
14-OCT-2009 15:0014-OCT-2009 15:0014-OCT-2009 15:0014-OCT-2009 15:0014-OCT-2009 15:00Client sampling date / time
EP0905895-025EP0905895-024EP0905895-023EP0905895-022EP0905895-021UnitLORCAS NumberCompound
EA029-H: Acid Base Accounting - Continued
1.51.5 1.5 1.5 1.5-0.5----ANC Fineness Factor
<0.02<0.02 <0.02 <0.02 <0.02% S0.02----Net Acidity (sulfur units)
<10<10 <10 <10 <10mole H+ / t10----Net Acidity (acidity units)
<1<1 <1 <1 <1kg CaCO3/t1----Liming Rate
0.200.23 0.18 0.22 0.19% S0.02----Net Acidity excluding ANC (sulfur units)
124141 112 136 120mole H+ / t10----Net Acidity excluding ANC (acidity units)
911 8 10 9kg CaCO3/t1----Liming Rate excluding ANC

13 of 18:Page
Work Order :
:Client
EP0905895
ADVANCED ANALYTICAL AUSTRALIA
A09 3208 & A09 3223:Project
Analytical Results
A09/3223 - 17
DA2213
A09/3223 - 16
DA2212
A09/3223 - 15
DA2121
A09/3223 - 14
DA2010
A09/3223 - 13
DA1307
Client sample IDSub-Matrix: SOIL
14-OCT-2009 15:0014-OCT-2009 15:0014-OCT-2009 15:0014-OCT-2009 15:0014-OCT-2009 15:00Client sampling date / time
EP0905895-030EP0905895-029EP0905895-028EP0905895-027EP0905895-026UnitLORCAS NumberCompound
EA029-A: pH Measurements
9.39.4 9.3 9.4 9.4pH Unit0.1----pH KCl (23A)
8.18.2 8.3 8.2 8.3pH Unit0.1----pH OX (23B)
EA029-B: Acidity Trail<2<2 <2 <2 <2mole H+ / t2----Titratable Actual Acidity (23F)
<2<2 <2 <2 <2mole H+ / t2----Titratable Peroxide Acidity (23G)
<2<2 <2 <2 <2mole H+ / t2----Titratable Sulfidic Acidity (23H)
<0.02<0.02 <0.02 <0.02 <0.02% pyrite S0.02----sulfidic - Titratable Actual Acidity (s-23F)
<0.02<0.02 <0.02 <0.02 <0.02% pyrite S0.02----sulfidic - Titratable Peroxide Acidity
(s-23G)
<0.02<0.02 <0.02 <0.02 <0.02% pyrite S0.02----sulfidic - Titratable Sulfidic Acidity (s-23H)
EA029-C: Sulfur Trail
0.170.18 0.15 0.19 0.17% S0.02----KCl Extractable Sulfur (23Ce)
0.380.36 0.42 0.41 0.32% S0.02----Peroxide Sulfur (23De)
0.210.18 0.27 0.22 0.15% S0.02----Peroxide Oxidisable Sulfur (23E)
131111 166 137 93mole H+ / t10----acidity - Peroxide Oxidisable Sulfur
(a-23E)
EA029-D: Calcium Values
0.400.46 0.41 0.40 0.35% Ca0.02----KCl Extractable Calcium (23Vh)
19.420.6 21.6 24.4 21.8% Ca0.02----Peroxide Calcium (23Wh)
19.020.1 21.2 24.0 21.4% Ca0.02----Acid Reacted Calcium (23X)
946010000 10600 12000 10700mole H+ / t10----acidity - Acid Reacted Calcium (a-23X)
15.216.1 17.0 19.2 17.1% S0.02----sulfidic - Acid Reacted Calcium (s-23X)
EA029-E: Magnesium Values
0.140.19 0.12 0.15 0.14% Mg0.02----KCl Extractable Magnesium (23Sm)
0.850.93 0.88 0.87 0.81% Mg0.02----Peroxide Magnesium (23Tm)
0.710.74 0.76 0.72 0.67% Mg0.02----Acid Reacted Magnesium (23U)
583612 628 592 554mole H+ / t10----Acidity - Acid Reacted Magnesium (a-23U)
0.940.98 1.01 0.95 0.89% S0.02----sulfidic - Acid Reacted Magnesium
(s-23U)
EA029-F: Excess Acid Neutralising Capacity
53.054.9 53.7 58.3 60.3% CaCO30.02----Excess Acid Neutralising Capacity (23Q)
1060011000 10700 11600 12000mole H+ / t10----acidity - Excess Acid Neutralising
Capacity (a-23Q)
17.017.6 17.2 18.7 19.3% S0.02----sulfidic - Excess Acid Neutralising
Capacity (s-23Q)
EA029-H: Acid Base Accounting

14 of 18:Page
Work Order :
:Client
EP0905895
ADVANCED ANALYTICAL AUSTRALIA
A09 3208 & A09 3223:Project
Analytical Results
A09/3223 - 17
DA2213
A09/3223 - 16
DA2212
A09/3223 - 15
DA2121
A09/3223 - 14
DA2010
A09/3223 - 13
DA1307
Client sample IDSub-Matrix: SOIL
14-OCT-2009 15:0014-OCT-2009 15:0014-OCT-2009 15:0014-OCT-2009 15:0014-OCT-2009 15:00Client sampling date / time
EP0905895-030EP0905895-029EP0905895-028EP0905895-027EP0905895-026UnitLORCAS NumberCompound
EA029-H: Acid Base Accounting - Continued
1.51.5 1.5 1.5 1.5-0.5----ANC Fineness Factor
<0.02<0.02 <0.02 <0.02 <0.02% S0.02----Net Acidity (sulfur units)
<10<10 <10 <10 <10mole H+ / t10----Net Acidity (acidity units)
<1<1 <1 <1 <1kg CaCO3/t1----Liming Rate
0.210.18 0.27 0.22 0.15% S0.02----Net Acidity excluding ANC (sulfur units)
131111 166 137 93mole H+ / t10----Net Acidity excluding ANC (acidity units)
108 12 10 7kg CaCO3/t1----Liming Rate excluding ANC

15 of 18:Page
Work Order :
:Client
EP0905895
ADVANCED ANALYTICAL AUSTRALIA
A09 3208 & A09 3223:Project
Analytical Results
A09/3223 - 22
DA2610
A09/3223 - 21
DA2513
A09/3223 - 20
DA2506
A09/3223 - 19
DA2412
A09/3223 - 18
DA2310
Client sample IDSub-Matrix: SOIL
14-OCT-2009 15:0014-OCT-2009 15:0014-OCT-2009 15:0014-OCT-2009 15:0014-OCT-2009 15:00Client sampling date / time
EP0905895-035EP0905895-034EP0905895-033EP0905895-032EP0905895-031UnitLORCAS NumberCompound
EA029-A: pH Measurements
9.49.3 9.4 9.3 9.3pH Unit0.1----pH KCl (23A)
8.18.1 8.2 8.2 8.2pH Unit0.1----pH OX (23B)
EA029-B: Acidity Trail<2<2 <2 <2 <2mole H+ / t2----Titratable Actual Acidity (23F)
<2<2 <2 <2 <2mole H+ / t2----Titratable Peroxide Acidity (23G)
<2<2 <2 <2 <2mole H+ / t2----Titratable Sulfidic Acidity (23H)
<0.02<0.02 <0.02 <0.02 <0.02% pyrite S0.02----sulfidic - Titratable Actual Acidity (s-23F)
<0.02<0.02 <0.02 <0.02 <0.02% pyrite S0.02----sulfidic - Titratable Peroxide Acidity
(s-23G)
<0.02<0.02 <0.02 <0.02 <0.02% pyrite S0.02----sulfidic - Titratable Sulfidic Acidity (s-23H)
EA029-C: Sulfur Trail
0.110.13 0.18 0.14 0.15% S0.02----KCl Extractable Sulfur (23Ce)
0.340.38 0.45 0.31 0.41% S0.02----Peroxide Sulfur (23De)
0.230.25 0.27 0.18 0.26% S0.02----Peroxide Oxidisable Sulfur (23E)
143157 167 110 164mole H+ / t10----acidity - Peroxide Oxidisable Sulfur
(a-23E)
EA029-D: Calcium Values
0.310.38 0.42 0.37 0.40% Ca0.02----KCl Extractable Calcium (23Vh)
22.020.8 22.9 22.2 21.7% Ca0.02----Peroxide Calcium (23Wh)
21.720.4 22.5 21.8 21.3% Ca0.02----Acid Reacted Calcium (23X)
1080010200 11200 10900 10600mole H+ / t10----acidity - Acid Reacted Calcium (a-23X)
17.416.3 18.0 17.5 17.0% S0.02----sulfidic - Acid Reacted Calcium (s-23X)
EA029-E: Magnesium Values
0.090.13 0.18 0.11 0.14% Mg0.02----KCl Extractable Magnesium (23Sm)
0.770.87 1.00 0.82 0.92% Mg0.02----Peroxide Magnesium (23Tm)
0.680.74 0.81 0.70 0.77% Mg0.02----Acid Reacted Magnesium (23U)
563606 670 577 635mole H+ / t10----Acidity - Acid Reacted Magnesium (a-23U)
0.900.97 1.07 0.92 1.02% S0.02----sulfidic - Acid Reacted Magnesium
(s-23U)
EA029-F: Excess Acid Neutralising Capacity
52.953.1 53.4 55.3 53.7% CaCO30.02----Excess Acid Neutralising Capacity (23Q)
1060010600 10700 11000 10700mole H+ / t10----acidity - Excess Acid Neutralising
Capacity (a-23Q)
16.917.0 17.1 17.7 17.2% S0.02----sulfidic - Excess Acid Neutralising
Capacity (s-23Q)
EA029-H: Acid Base Accounting

16 of 18:Page
Work Order :
:Client
EP0905895
ADVANCED ANALYTICAL AUSTRALIA
A09 3208 & A09 3223:Project
Analytical Results
A09/3223 - 22
DA2610
A09/3223 - 21
DA2513
A09/3223 - 20
DA2506
A09/3223 - 19
DA2412
A09/3223 - 18
DA2310
Client sample IDSub-Matrix: SOIL
14-OCT-2009 15:0014-OCT-2009 15:0014-OCT-2009 15:0014-OCT-2009 15:0014-OCT-2009 15:00Client sampling date / time
EP0905895-035EP0905895-034EP0905895-033EP0905895-032EP0905895-031UnitLORCAS NumberCompound
EA029-H: Acid Base Accounting - Continued
1.51.5 1.5 1.5 1.5-0.5----ANC Fineness Factor
<0.02<0.02 <0.02 <0.02 <0.02% S0.02----Net Acidity (sulfur units)
<10<10 <10 <10 <10mole H+ / t10----Net Acidity (acidity units)
<1<1 <1 <1 <1kg CaCO3/t1----Liming Rate
0.230.25 0.27 0.18 0.26% S0.02----Net Acidity excluding ANC (sulfur units)
143157 167 110 164mole H+ / t10----Net Acidity excluding ANC (acidity units)
1112 12 8 12kg CaCO3/t1----Liming Rate excluding ANC

17 of 18:Page
Work Order :
:Client
EP0905895
ADVANCED ANALYTICAL AUSTRALIA
A09 3208 & A09 3223:Project
Analytical Results
------------A09/3223 - 24
DA2910
A09/3223 - 23
DA2810
Client sample IDSub-Matrix: SOIL
------------14-OCT-2009 15:0014-OCT-2009 15:00Client sampling date / time
------------EP0905895-037EP0905895-036UnitLORCAS NumberCompound
EA029-A: pH Measurements
9.39.4 ---- ---- ----pH Unit0.1----pH KCl (23A)
8.18.2 ---- ---- ----pH Unit0.1----pH OX (23B)
EA029-B: Acidity Trail<2<2 ---- ---- ----mole H+ / t2----Titratable Actual Acidity (23F)
<2<2 ---- ---- ----mole H+ / t2----Titratable Peroxide Acidity (23G)
<2<2 ---- ---- ----mole H+ / t2----Titratable Sulfidic Acidity (23H)
<0.02<0.02 ---- ---- ----% pyrite S0.02----sulfidic - Titratable Actual Acidity (s-23F)
<0.02<0.02 ---- ---- ----% pyrite S0.02----sulfidic - Titratable Peroxide Acidity
(s-23G)
<0.02<0.02 ---- ---- ----% pyrite S0.02----sulfidic - Titratable Sulfidic Acidity (s-23H)
EA029-C: Sulfur Trail
0.160.17 ---- ---- ----% S0.02----KCl Extractable Sulfur (23Ce)
0.390.43 ---- ---- ----% S0.02----Peroxide Sulfur (23De)
0.230.26 ---- ---- ----% S0.02----Peroxide Oxidisable Sulfur (23E)
144165 ---- ---- ----mole H+ / t10----acidity - Peroxide Oxidisable Sulfur
(a-23E)
EA029-D: Calcium Values
0.420.39 ---- ---- ----% Ca0.02----KCl Extractable Calcium (23Vh)
20.121.7 ---- ---- ----% Ca0.02----Peroxide Calcium (23Wh)
19.721.4 ---- ---- ----% Ca0.02----Acid Reacted Calcium (23X)
982010600 ---- ---- ----mole H+ / t10----acidity - Acid Reacted Calcium (a-23X)
15.717.1 ---- ---- ----% S0.02----sulfidic - Acid Reacted Calcium (s-23X)
EA029-E: Magnesium Values
0.160.15 ---- ---- ----% Mg0.02----KCl Extractable Magnesium (23Sm)
0.880.92 ---- ---- ----% Mg0.02----Peroxide Magnesium (23Tm)
0.730.77 ---- ---- ----% Mg0.02----Acid Reacted Magnesium (23U)
598636 ---- ---- ----mole H+ / t10----Acidity - Acid Reacted Magnesium (a-23U)
0.961.02 ---- ---- ----% S0.02----sulfidic - Acid Reacted Magnesium
(s-23U)
EA029-F: Excess Acid Neutralising Capacity
53.252.8 ---- ---- ----% CaCO30.02----Excess Acid Neutralising Capacity (23Q)
1060010600 ---- ---- ----mole H+ / t10----acidity - Excess Acid Neutralising
Capacity (a-23Q)
17.016.9 ---- ---- ----% S0.02----sulfidic - Excess Acid Neutralising
Capacity (s-23Q)
EA029-H: Acid Base Accounting

18 of 18:Page
Work Order :
:Client
EP0905895
ADVANCED ANALYTICAL AUSTRALIA
A09 3208 & A09 3223:Project
Analytical Results
------------A09/3223 - 24
DA2910
A09/3223 - 23
DA2810
Client sample IDSub-Matrix: SOIL
------------14-OCT-2009 15:0014-OCT-2009 15:00Client sampling date / time
------------EP0905895-037EP0905895-036UnitLORCAS NumberCompound
EA029-H: Acid Base Accounting - Continued
1.51.5 ---- ---- -----0.5----ANC Fineness Factor
<0.02<0.02 ---- ---- ----% S0.02----Net Acidity (sulfur units)
<10<10 ---- ---- ----mole H+ / t10----Net Acidity (acidity units)
<1<1 ---- ---- ----kg CaCO3/t1----Liming Rate
0.230.26 ---- ---- ----% S0.02----Net Acidity excluding ANC (sulfur units)
144165 ---- ---- ----mole H+ / t10----Net Acidity excluding ANC (acidity units)
1112 ---- ---- ----kg CaCO3/t1----Liming Rate excluding ANC

False
QUALITY CONTROL REPORT
Work Order : EP0905895 Page : 1 of 10
:: LaboratoryClient Environmental Division PerthADVANCED ANALYTICAL AUSTRALIA
: :ContactContact JANE STRUTHERS Michael Sharp
:: AddressAddress 7 FORREST AVENUE
EAST PERTH WA, AUSTRALIA 6004
10 Hod Way Malaga WA Australia 6090
:: E-mailE-mail [email protected] [email protected]
:: TelephoneTelephone 9325 9799 +61-8-9209 7655
:: FacsimileFacsimile 9325 4299 +61-8-9209 7600
:Project A09 3208 & A09 3223 QC Level : NEPM 1999 Schedule B(3) and ALS QCS3 requirement
Site : ----
:C-O-C number ---- Date Samples Received : 15-OCT-2009
Sampler : ---- Issue Date : 22-OCT-2009
:Order number ----
37:No. of samples received
Quote number : ---- 37:No. of samples analysed
This report supersedes any previous report(s) with this reference. Results apply to the sample(s) as submitted. All pages of this report have been checked and approved for
release.
This Quality Control Report contains the following information:
l Laboratory Duplicate (DUP) Report; Relative Percentage Difference (RPD) and Acceptance Limits
l Method Blank (MB) and Laboratory Control Spike (LCS) Report ; Recovery and Acceptance Limits
l Matrix Spike (MS) Report; Recovery and Acceptance Limits
NATA Accredited Laboratory 825
This document is issued in
accordance with NATA
accreditation requirements.
Accredited for compliance with
ISO/IEC 17025.
SignatoriesThis document has been electronically signed by the authorized signatories indicated below. Electronic signing has been
carried out in compliance with procedures specified in 21 CFR Part 11.
Signatories Accreditation CategoryPosition
Stacey Hawkins Senior Chemist - Acid Sulphate Soils Perth ASS
Environmental Division Perth
10 Hod Way Malaga WA Australia 6090
Tel. +61-8-9209 7655 Fax. +61-8-9209 7600 www.alsglobal.com

2 of 10:Page
Work Order :
:Client
EP0905895
ADVANCED ANALYTICAL AUSTRALIA
A09 3208 & A09 3223:Project
General Comments
The analytical procedures used by the Environmental Division have been developed from established internationally recognized procedures such as those published by the USEPA, APHA, AS and NEPM. In house
developed procedures are employed in the absence of documented standards or by client request.
Where moisture determination has been performed, results are reported on a dry weight basis.
Where a reported less than (<) result is higher than the LOR, this may be due to primary sample extract/digestate dilution and/or insuffient sample for analysis.
Where the LOR of a reported result differs from standard LOR, this may be due to high moisture content, insufficient sample (reduced weight employed) or matrix interference.
Anonymous = Refers to samples which are not specifically part of this work order but formed part of the QC process lot
CAS Number = CAS registry number from database maintained by Chemical Abstracts Services. The Chemical Abstracts Service is a division of the American Chemical Society.
LOR = Limit of reporting
RPD = Relative Percentage Difference
# = Indicates failed QC
Key :

3 of 10:Page
Work Order :
:Client
EP0905895
ADVANCED ANALYTICAL AUSTRALIA
A09 3208 & A09 3223:Project
Laboratory Duplicate (DUP) Report
The quality control term Laboratory Duplicate refers to a randomly selected intralaboratory split. Laboratory duplicates provide information regarding method precision and sample heterogeneity. The permitted ranges
for the Relative Percent Deviation (RPD) of Laboratory Duplicates are specified in ALS Method QWI -EN/38 and are dependent on the magnitude of results in comparison to the level of reporting: Result < 10 times LOR:-
No Limit; Result between 10 and 20 times LOR:- 0% - 50%; Result > 20 times LOR:- 0% - 20%.
Sub-Matrix: SOIL Laboratory Duplicate (DUP) Report
Original Result RPD (%)Laboratory sample ID Client sample ID Method: Compound CAS Number LOR Unit Duplicate Result Recovery Limits (%)
EA029-A: pH Measurements (QC Lot: 1133602)
EA029: pH KCl (23A) ---- 0.1 pH Unit 9.3 9.3 0.0 0% - 20%A09/3208 - 2 BP1103 - 1.0EP0905895-001
EA029: pH OX (23B) ---- 0.1 pH Unit 8.2 8.2 0.0 0% - 20%
EA029: pH KCl (23A) ---- 0.1 pH Unit 9.4 9.4 0.0 0% - 20%A09/3208 - 26 DA3006 -
1.0
EP0905895-011
EA029: pH OX (23B) ---- 0.1 pH Unit 8.6 8.6 0.0 0% - 20%
EA029-A: pH Measurements (QC Lot: 1133603)
EA029: pH KCl (23A) ---- 0.1 pH Unit 9.4 9.4 0.0 0% - 20%A09/3223 - 8 BP88 - 2EP0905895-021
EA029: pH OX (23B) ---- 0.1 pH Unit 8.2 8.2 0.0 0% - 20%
EA029: pH KCl (23A) ---- 0.1 pH Unit 9.3 9.3 0.0 0% - 20%A09/3223 - 18 DA2310EP0905895-031
EA029: pH OX (23B) ---- 0.1 pH Unit 8.1 8.3 1.7 0% - 20%
EA029-B: Acidity Trail (QC Lot: 1133602)
EA029: sulfidic - Titratable Actual Acidity (s-23F) ---- 0.02 % pyrite S <0.02 <0.02 0.0 No LimitA09/3208 - 2 BP1103 - 1.0EP0905895-001
EA029: sulfidic - Titratable Peroxide Acidity
(s-23G)
---- 0.02 % pyrite S <0.02 <0.02 0.0 No Limit
EA029: sulfidic - Titratable Sulfidic Acidity
(s-23H)
---- 0.02 % pyrite S <0.02 <0.02 0.0 No Limit
EA029: Titratable Actual Acidity (23F) ---- 2 mole H+ / t <2 <2 0.0 No Limit
EA029: Titratable Peroxide Acidity (23G) ---- 2 mole H+ / t <2 <2 0.0 No Limit
EA029: Titratable Sulfidic Acidity (23H) ---- 2 mole H+ / t <2 <2 0.0 No Limit
EA029: sulfidic - Titratable Actual Acidity (s-23F) ---- 0.02 % pyrite S <0.02 <0.02 0.0 No LimitA09/3208 - 26 DA3006 -
1.0
EP0905895-011
EA029: sulfidic - Titratable Peroxide Acidity
(s-23G)
---- 0.02 % pyrite S <0.02 <0.02 0.0 No Limit
EA029: sulfidic - Titratable Sulfidic Acidity
(s-23H)
---- 0.02 % pyrite S <0.02 <0.02 0.0 No Limit
EA029: Titratable Actual Acidity (23F) ---- 2 mole H+ / t <2 <2 0.0 No Limit
EA029: Titratable Peroxide Acidity (23G) ---- 2 mole H+ / t <2 <2 0.0 No Limit
EA029: Titratable Sulfidic Acidity (23H) ---- 2 mole H+ / t <2 <2 0.0 No Limit
EA029-B: Acidity Trail (QC Lot: 1133603)
EA029: sulfidic - Titratable Actual Acidity (s-23F) ---- 0.02 % pyrite S <0.02 <0.02 0.0 No LimitA09/3223 - 8 BP88 - 2EP0905895-021
EA029: sulfidic - Titratable Peroxide Acidity
(s-23G)
---- 0.02 % pyrite S <0.02 <0.02 0.0 No Limit
EA029: sulfidic - Titratable Sulfidic Acidity
(s-23H)
---- 0.02 % pyrite S <0.02 <0.02 0.0 No Limit
EA029: Titratable Actual Acidity (23F) ---- 2 mole H+ / t <2 <2 0.0 No Limit

4 of 10:Page
Work Order :
:Client
EP0905895
ADVANCED ANALYTICAL AUSTRALIA
A09 3208 & A09 3223:Project
Sub-Matrix: SOIL Laboratory Duplicate (DUP) Report
Original Result RPD (%)Laboratory sample ID Client sample ID Method: Compound CAS Number LOR Unit Duplicate Result Recovery Limits (%)
EA029-B: Acidity Trail (QC Lot: 1133603) - continued
EA029: Titratable Peroxide Acidity (23G) ---- 2 mole H+ / t <2 <2 0.0 No LimitA09/3223 - 8 BP88 - 2EP0905895-021
EA029: Titratable Sulfidic Acidity (23H) ---- 2 mole H+ / t <2 <2 0.0 No Limit
EA029: sulfidic - Titratable Actual Acidity (s-23F) ---- 0.02 % pyrite S <0.02 <0.02 0.0 No LimitA09/3223 - 18 DA2310EP0905895-031
EA029: sulfidic - Titratable Peroxide Acidity
(s-23G)
---- 0.02 % pyrite S <0.02 <0.02 0.0 No Limit
EA029: sulfidic - Titratable Sulfidic Acidity
(s-23H)
---- 0.02 % pyrite S <0.02 <0.02 0.0 No Limit
EA029: Titratable Actual Acidity (23F) ---- 2 mole H+ / t <2 <2 0.0 No Limit
EA029: Titratable Peroxide Acidity (23G) ---- 2 mole H+ / t <2 <2 0.0 No Limit
EA029: Titratable Sulfidic Acidity (23H) ---- 2 mole H+ / t <2 <2 0.0 No Limit
EA029-C: Sulfur Trail (QC Lot: 1133602)
EA029: KCl Extractable Sulfur (23Ce) ---- 0.02 % S 0.14 0.14 0.0 No LimitA09/3208 - 2 BP1103 - 1.0EP0905895-001
EA029: Peroxide Sulfur (23De) ---- 0.02 % S 0.38 0.34 11.6 0% - 50%
EA029: Peroxide Oxidisable Sulfur (23E) ---- 0.02 % S 0.23 0.20 16.7 0% - 50%
EA029: acidity - Peroxide Oxidisable Sulfur
(a-23E)
---- 10 mole H+ / t 144 122 16.7 0% - 50%
EA029: KCl Extractable Sulfur (23Ce) ---- 0.02 % S 0.14 0.14 0.0 No LimitA09/3208 - 26 DA3006 -
1.0
EP0905895-011
EA029: Peroxide Sulfur (23De) ---- 0.02 % S 0.35 0.34 0.0 0% - 50%
EA029: Peroxide Oxidisable Sulfur (23E) ---- 0.02 % S 0.21 0.20 0.0 0% - 50%
EA029: acidity - Peroxide Oxidisable Sulfur
(a-23E)
---- 10 mole H+ / t 129 127 2.0 0% - 50%
EA029-C: Sulfur Trail (QC Lot: 1133603)
EA029: KCl Extractable Sulfur (23Ce) ---- 0.02 % S 0.10 0.13 33.6 No LimitA09/3223 - 8 BP88 - 2EP0905895-021
EA029: Peroxide Sulfur (23De) ---- 0.02 % S 0.32 0.33 0.0 0% - 50%
EA029: Peroxide Oxidisable Sulfur (23E) ---- 0.02 % S 0.23 0.19 16.7 No Limit
EA029: acidity - Peroxide Oxidisable Sulfur
(a-23E)
---- 10 mole H+ / t 141 120 16.7 0% - 50%
EA029: KCl Extractable Sulfur (23Ce) ---- 0.02 % S 0.13 0.11 10.3 No LimitA09/3223 - 18 DA2310EP0905895-031
EA029: Peroxide Sulfur (23De) ---- 0.02 % S 0.38 0.39 0.0 0% - 50%
EA029: Peroxide Oxidisable Sulfur (23E) ---- 0.02 % S 0.25 0.27 8.4 0% - 50%
EA029: acidity - Peroxide Oxidisable Sulfur
(a-23E)
---- 10 mole H+ / t 157 171 8.4 0% - 50%
EA029-D: Calcium Values (QC Lot: 1133602)
EA029: KCl Extractable Calcium (23Vh) ---- 0.02 % Ca 0.38 0.38 0.0 0% - 50%A09/3208 - 2 BP1103 - 1.0EP0905895-001
EA029: Peroxide Calcium (23Wh) ---- 0.02 % Ca 21.9 19.7 10.6 0% - 20%
EA029: Acid Reacted Calcium (23X) ---- 0.02 % Ca 21.5 19.3 10.8 0% - 20%
EA029: sulfidic - Acid Reacted Calcium (s-23X) ---- 0.02 % S 17.2 15.4 10.8 0% - 20%
EA029: acidity - Acid Reacted Calcium (a-23X) ---- 10 mole H+ / t 10700 9630 10.8 0% - 20%

5 of 10:Page
Work Order :
:Client
EP0905895
ADVANCED ANALYTICAL AUSTRALIA
A09 3208 & A09 3223:Project
Sub-Matrix: SOIL Laboratory Duplicate (DUP) Report
Original Result RPD (%)Laboratory sample ID Client sample ID Method: Compound CAS Number LOR Unit Duplicate Result Recovery Limits (%)
EA029-D: Calcium Values (QC Lot: 1133602) - continued
EA029: KCl Extractable Calcium (23Vh) ---- 0.02 % Ca 0.35 0.36 0.0 0% - 50%A09/3208 - 26 DA3006 -
1.0
EP0905895-011
EA029: Peroxide Calcium (23Wh) ---- 0.02 % Ca 26.0 25.7 1.3 0% - 20%
EA029: Acid Reacted Calcium (23X) ---- 0.02 % Ca 25.7 25.4 1.4 0% - 20%
EA029: sulfidic - Acid Reacted Calcium (s-23X) ---- 0.02 % S 20.6 20.3 1.4 0% - 20%
EA029: acidity - Acid Reacted Calcium (a-23X) ---- 10 mole H+ / t 12800 12600 1.4 0% - 20%
EA029-D: Calcium Values (QC Lot: 1133603)
EA029: KCl Extractable Calcium (23Vh) ---- 0.02 % Ca 0.31 0.34 8.9 0% - 50%A09/3223 - 8 BP88 - 2EP0905895-021
EA029: Peroxide Calcium (23Wh) ---- 0.02 % Ca 22.7 22.9 1.0 0% - 20%
EA029: Acid Reacted Calcium (23X) ---- 0.02 % Ca 22.4 22.6 0.9 0% - 20%
EA029: sulfidic - Acid Reacted Calcium (s-23X) ---- 0.02 % S 17.9 18.0 0.9 0% - 20%
EA029: acidity - Acid Reacted Calcium (a-23X) ---- 10 mole H+ / t 11200 11300 0.9 0% - 20%
EA029: KCl Extractable Calcium (23Vh) ---- 0.02 % Ca 0.38 0.37 0.0 0% - 50%A09/3223 - 18 DA2310EP0905895-031
EA029: Peroxide Calcium (23Wh) ---- 0.02 % Ca 20.8 21.0 0.9 0% - 20%
EA029: Acid Reacted Calcium (23X) ---- 0.02 % Ca 20.4 20.6 0.9 0% - 20%
EA029: sulfidic - Acid Reacted Calcium (s-23X) ---- 0.02 % S 16.3 16.5 0.9 0% - 20%
EA029: acidity - Acid Reacted Calcium (a-23X) ---- 10 mole H+ / t 10200 10300 0.9 0% - 20%
EA029-E: Magnesium Values (QC Lot: 1133602)
EA029: KCl Extractable Magnesium (23Sm) ---- 0.02 % Mg 0.14 0.15 0.0 No LimitA09/3208 - 2 BP1103 - 1.0EP0905895-001
EA029: Peroxide Magnesium (23Tm) ---- 0.02 % Mg 0.89 0.79 11.9 0% - 20%
EA029: Acid Reacted Magnesium (23U) ---- 0.02 % Mg 0.74 0.64 15.0 0% - 20%
EA029: sulfidic - Acid Reacted Magnesium
(s-23U)
---- 0.02 % S 0.98 0.85 15.0 0% - 20%
EA029: Acidity - Acid Reacted Magnesium
(a-23U)
---- 10 mole H+ / t 613 528 15.0 0% - 20%
EA029: KCl Extractable Magnesium (23Sm) ---- 0.02 % Mg 0.12 0.15 16.8 No LimitA09/3208 - 26 DA3006 -
1.0
EP0905895-011
EA029: Peroxide Magnesium (23Tm) ---- 0.02 % Mg 0.96 0.95 1.5 0% - 20%
EA029: Acid Reacted Magnesium (23U) ---- 0.02 % Mg 0.84 0.80 4.6 0% - 20%
EA029: sulfidic - Acid Reacted Magnesium
(s-23U)
---- 0.02 % S 1.11 1.06 4.6 0% - 20%
EA029: Acidity - Acid Reacted Magnesium
(a-23U)
---- 10 mole H+ / t 692 661 4.6 0% - 20%
EA029-E: Magnesium Values (QC Lot: 1133603)
EA029: KCl Extractable Magnesium (23Sm) ---- 0.02 % Mg 0.11 0.12 0.0 No LimitA09/3223 - 8 BP88 - 2EP0905895-021
EA029: Peroxide Magnesium (23Tm) ---- 0.02 % Mg 0.74 0.76 2.2 0% - 20%
EA029: Acid Reacted Magnesium (23U) ---- 0.02 % Mg 0.62 0.63 1.6 0% - 20%
EA029: sulfidic - Acid Reacted Magnesium
(s-23U)
---- 0.02 % S 0.82 0.84 1.6 0% - 20%

6 of 10:Page
Work Order :
:Client
EP0905895
ADVANCED ANALYTICAL AUSTRALIA
A09 3208 & A09 3223:Project
Sub-Matrix: SOIL Laboratory Duplicate (DUP) Report
Original Result RPD (%)Laboratory sample ID Client sample ID Method: Compound CAS Number LOR Unit Duplicate Result Recovery Limits (%)
EA029-E: Magnesium Values (QC Lot: 1133603) - continued
EA029: Acidity - Acid Reacted Magnesium
(a-23U)
---- 10 mole H+ / t 514 522 1.6 0% - 20%A09/3223 - 8 BP88 - 2EP0905895-021
EA029: KCl Extractable Magnesium (23Sm) ---- 0.02 % Mg 0.13 0.13 0.0 No LimitA09/3223 - 18 DA2310EP0905895-031
EA029: Peroxide Magnesium (23Tm) ---- 0.02 % Mg 0.87 1.01 15.0 0% - 20%
EA029: Acid Reacted Magnesium (23U) ---- 0.02 % Mg 0.74 0.88 17.2 0% - 20%
EA029: sulfidic - Acid Reacted Magnesium
(s-23U)
---- 0.02 % S 0.97 1.15 17.2 0% - 20%
EA029: Acidity - Acid Reacted Magnesium
(a-23U)
---- 10 mole H+ / t 606 720 17.2 0% - 20%
EA029-F: Excess Acid Neutralising Capacity (QC Lot: 1133602)
EA029: Excess Acid Neutralising Capacity (23Q) ---- 0.02 % CaCO3 54.0 53.8 0.4 0% - 20%A09/3208 - 2 BP1103 - 1.0EP0905895-001
EA029: sulfidic - Excess Acid Neutralising
Capacity (s-23Q)
---- 0.02 % S 17.3 17.2 0.4 0% - 20%
EA029: acidity - Excess Acid Neutralising
Capacity (a-23Q)
---- 10 mole H+ / t 10800 10700 0.4 0% - 20%
EA029: Excess Acid Neutralising Capacity (23Q) ---- 0.02 % CaCO3 61.3 61.7 0.6 0% - 20%A09/3208 - 26 DA3006 -
1.0
EP0905895-011
EA029: sulfidic - Excess Acid Neutralising
Capacity (s-23Q)
---- 0.02 % S 19.6 19.7 0.6 0% - 20%
EA029: acidity - Excess Acid Neutralising
Capacity (a-23Q)
---- 10 mole H+ / t 12200 12300 0.6 0% - 20%
EA029-F: Excess Acid Neutralising Capacity (QC Lot: 1133603)
EA029: Excess Acid Neutralising Capacity (23Q) ---- 0.02 % CaCO3 59.0 59.0 0.1 0% - 20%A09/3223 - 8 BP88 - 2EP0905895-021
EA029: sulfidic - Excess Acid Neutralising
Capacity (s-23Q)
---- 0.02 % S 18.9 18.9 0.1 0% - 20%
EA029: acidity - Excess Acid Neutralising
Capacity (a-23Q)
---- 10 mole H+ / t 11800 11800 0.1 0% - 20%
EA029: Excess Acid Neutralising Capacity (23Q) ---- 0.02 % CaCO3 53.1 53.4 0.7 0% - 20%A09/3223 - 18 DA2310EP0905895-031
EA029: sulfidic - Excess Acid Neutralising
Capacity (s-23Q)
---- 0.02 % S 17.0 17.1 0.7 0% - 20%
EA029: acidity - Excess Acid Neutralising
Capacity (a-23Q)
---- 10 mole H+ / t 10600 10700 0.7 0% - 20%
EA029-H: Acid Base Accounting (QC Lot: 1133602)
EA029: ANC Fineness Factor ---- 0.5 - 1.5 1.5 0.0 No LimitA09/3208 - 2 BP1103 - 1.0EP0905895-001
EA029: Net Acidity (sulfur units) ---- 0.02 % S <0.02 <0.02 0.0 No Limit
EA029: Net Acidity excluding ANC (sulfur units) ---- 0.02 % S 0.23 0.20 16.7 0% - 50%
EA029: Liming Rate ---- 1 kg CaCO3/t <1 <1 0.0 No Limit
EA029: Liming Rate excluding ANC ---- 1 kg CaCO3/t 11 9 16.7 No Limit
EA029: Net Acidity (acidity units) ---- 10 mole H+ / t <10 <10 0.0 No Limit
EA029: Net Acidity excluding ANC (acidity units) ---- 10 mole H+ / t 144 122 16.7 0% - 50%

7 of 10:Page
Work Order :
:Client
EP0905895
ADVANCED ANALYTICAL AUSTRALIA
A09 3208 & A09 3223:Project
Sub-Matrix: SOIL Laboratory Duplicate (DUP) Report
Original Result RPD (%)Laboratory sample ID Client sample ID Method: Compound CAS Number LOR Unit Duplicate Result Recovery Limits (%)
EA029-H: Acid Base Accounting (QC Lot: 1133602) - continued
EA029: ANC Fineness Factor ---- 0.5 - 1.5 1.5 0.0 No LimitA09/3208 - 26 DA3006 -
1.0
EP0905895-011
EA029: Net Acidity (sulfur units) ---- 0.02 % S <0.02 <0.02 0.0 No Limit
EA029: Net Acidity excluding ANC (sulfur units) ---- 0.02 % S 0.21 0.20 0.0 0% - 50%
EA029: Liming Rate ---- 1 kg CaCO3/t <1 <1 0.0 No Limit
EA029: Liming Rate excluding ANC ---- 1 kg CaCO3/t 10 10 0.0 0% - 50%
EA029: Net Acidity (acidity units) ---- 10 mole H+ / t <10 <10 0.0 No Limit
EA029: Net Acidity excluding ANC (acidity units) ---- 10 mole H+ / t 129 127 2.0 0% - 50%
EA029-H: Acid Base Accounting (QC Lot: 1133603)
EA029: ANC Fineness Factor ---- 0.5 - 1.5 1.5 0.0 No LimitA09/3223 - 8 BP88 - 2EP0905895-021
EA029: Net Acidity (sulfur units) ---- 0.02 % S <0.02 <0.02 0.0 No Limit
EA029: Net Acidity excluding ANC (sulfur units) ---- 0.02 % S 0.23 0.19 16.7 No Limit
EA029: Liming Rate ---- 1 kg CaCO3/t <1 <1 0.0 No Limit
EA029: Liming Rate excluding ANC ---- 1 kg CaCO3/t 11 9 16.7 No Limit
EA029: Net Acidity (acidity units) ---- 10 mole H+ / t <10 <10 0.0 No Limit
EA029: Net Acidity excluding ANC (acidity units) ---- 10 mole H+ / t 141 120 16.7 0% - 50%
EA029: ANC Fineness Factor ---- 0.5 - 1.5 1.5 0.0 No LimitA09/3223 - 18 DA2310EP0905895-031
EA029: Net Acidity (sulfur units) ---- 0.02 % S <0.02 <0.02 0.0 No Limit
EA029: Net Acidity excluding ANC (sulfur units) ---- 0.02 % S 0.25 0.27 8.4 0% - 50%
EA029: Liming Rate ---- 1 kg CaCO3/t <1 <1 0.0 No Limit
EA029: Liming Rate excluding ANC ---- 1 kg CaCO3/t 12 13 8.4 0% - 50%
EA029: Net Acidity (acidity units) ---- 10 mole H+ / t <10 <10 0.0 No Limit
EA029: Net Acidity excluding ANC (acidity units) ---- 10 mole H+ / t 157 171 8.4 0% - 50%

8 of 10:Page
Work Order :
:Client
EP0905895
ADVANCED ANALYTICAL AUSTRALIA
A09 3208 & A09 3223:Project
Method Blank (MB) and Laboratory Control Spike (LCS) Report
The quality control term Method / Laboratory Blank refers to an analyte free matrix to which all reagents are added in the same volumes or proportions as used in standard sample preparation. The purpose of this QC
parameter is to monitor potential laboratory contamination. The quality control term Laboratory Control Sample (LCS) refers to a certified reference material, or a known interference free matrix spiked with target
analytes. The purpose of this QC parameter is to monitor method precision and accuracy independent of sample matrix. Dynamic Recovery Limits are based on statistical evaluation of processed LCS.
Sub-Matrix: SOIL Method Blank (MB)
Report
Laboratory Control Spike (LCS) Report
Spike Spike Recovery (%) Recovery Limits (%)
Result Concentration HighLowLCSMethod: Compound CAS Number LOR Unit
EA029-B: Acidity Trail (QCLot: 1133602)
EA029: Titratable Actual Acidity (23F) ---- 2 mole H+ / t <2 -------- --------
EA029: Titratable Peroxide Acidity (23G) ---- 2 mole H+ / t <2 -------- --------
EA029: sulfidic - Titratable Actual Acidity (s-23F) ---- 0.02 % pyrite S <0.02 -------- --------
EA029: sulfidic - Titratable Peroxide Acidity (s-23G) ---- 0.02 % pyrite S <0.02 -------- --------
EA029: sulfidic - Titratable Sulfidic Acidity (s-23H) ---- 0.02 % pyrite S <0.02 -------- --------
EA029-B: Acidity Trail (QCLot: 1133603)
EA029: Titratable Actual Acidity (23F) ---- 2 mole H+ / t <2 -------- --------
EA029: Titratable Peroxide Acidity (23G) ---- 2 mole H+ / t <2 -------- --------
EA029: sulfidic - Titratable Actual Acidity (s-23F) ---- 0.02 % pyrite S <0.02 -------- --------
EA029: sulfidic - Titratable Peroxide Acidity (s-23G) ---- 0.02 % pyrite S <0.02 -------- --------
EA029: sulfidic - Titratable Sulfidic Acidity (s-23H) ---- 0.02 % pyrite S <0.02 -------- --------
EA029-C: Sulfur Trail (QCLot: 1133602)
EA029: KCl Extractable Sulfur (23Ce) ---- 0.02 % S <0.02 -------- --------
EA029: Peroxide Sulfur (23De) ---- 0.02 % S <0.02 -------- --------
EA029: Peroxide Oxidisable Sulfur (23E) ---- 0.02 % S <0.02 -------- --------
EA029: acidity - Peroxide Oxidisable Sulfur (a-23E) ---- 10 mole H+ / t <10 -------- --------
EA029-C: Sulfur Trail (QCLot: 1133603)
EA029: KCl Extractable Sulfur (23Ce) ---- 0.02 % S <0.02 -------- --------
EA029: Peroxide Sulfur (23De) ---- 0.02 % S <0.02 -------- --------
EA029: Peroxide Oxidisable Sulfur (23E) ---- 0.02 % S <0.02 -------- --------
EA029: acidity - Peroxide Oxidisable Sulfur (a-23E) ---- 10 mole H+ / t <10 -------- --------
EA029-D: Calcium Values (QCLot: 1133602)
EA029: KCl Extractable Calcium (23Vh) ---- 0.02 % Ca <0.02 -------- --------
EA029: Peroxide Calcium (23Wh) ---- 0.02 % Ca <0.02 -------- --------
EA029: Acid Reacted Calcium (23X) ---- 0.02 % Ca <0.02 -------- --------
EA029: acidity - Acid Reacted Calcium (a-23X) ---- 10 mole H+ / t <10 -------- --------
EA029: sulfidic - Acid Reacted Calcium (s-23X) ---- 0.02 % S <0.02 -------- --------
EA029-D: Calcium Values (QCLot: 1133603)
EA029: KCl Extractable Calcium (23Vh) ---- 0.02 % Ca <0.02 -------- --------
EA029: Peroxide Calcium (23Wh) ---- 0.02 % Ca <0.02 -------- --------
EA029: Acid Reacted Calcium (23X) ---- 0.02 % Ca <0.02 -------- --------
EA029: acidity - Acid Reacted Calcium (a-23X) ---- 10 mole H+ / t <10 -------- --------
EA029: sulfidic - Acid Reacted Calcium (s-23X) ---- 0.02 % S <0.02 -------- --------
EA029-E: Magnesium Values (QCLot: 1133602)

9 of 10:Page
Work Order :
:Client
EP0905895
ADVANCED ANALYTICAL AUSTRALIA
A09 3208 & A09 3223:Project
Sub-Matrix: SOIL Method Blank (MB)
Report
Laboratory Control Spike (LCS) Report
Spike Spike Recovery (%) Recovery Limits (%)
Result Concentration HighLowLCSMethod: Compound CAS Number LOR Unit
EA029-E: Magnesium Values (QCLot: 1133602) - continued
EA029: KCl Extractable Magnesium (23Sm) ---- 0.02 % Mg <0.02 -------- --------
EA029: Peroxide Magnesium (23Tm) ---- 0.02 % Mg <0.02 -------- --------
EA029: Acid Reacted Magnesium (23U) ---- 0.02 % Mg <0.02 -------- --------
EA029: Acidity - Acid Reacted Magnesium (a-23U) ---- 10 mole H+ / t <10 -------- --------
EA029: sulfidic - Acid Reacted Magnesium (s-23U) ---- 0.02 % S <0.02 -------- --------
EA029-E: Magnesium Values (QCLot: 1133603)
EA029: KCl Extractable Magnesium (23Sm) ---- 0.02 % Mg <0.02 -------- --------
EA029: Peroxide Magnesium (23Tm) ---- 0.02 % Mg <0.02 -------- --------
EA029: Acid Reacted Magnesium (23U) ---- 0.02 % Mg <0.02 -------- --------
EA029: Acidity - Acid Reacted Magnesium (a-23U) ---- 10 mole H+ / t <10 -------- --------
EA029: sulfidic - Acid Reacted Magnesium (s-23U) ---- 0.02 % S <0.02 -------- --------

10 of 10:Page
Work Order :
:Client
EP0905895
ADVANCED ANALYTICAL AUSTRALIA
A09 3208 & A09 3223:Project
Matrix Spike (MS) Report
The quality control term Matrix Spike (MS) refers to an intralaboratory split sample spiked with a representative set of target analytes. The purpose of this QC parameter is to monitor potential matrix effects on analyte
recoveries. Static Recovery Limits as per laboratory Data Quality Objectives (DQOs). Ideal recovery ranges stated may be waived in the event of sample matrix interference.
l No Matrix Spike (MS) Results are required to be reported.

True
INTERPRETIVE QUALITY CONTROL REPORT
Work Order : EP0905895 Page : 1 of 9
:: LaboratoryClient Environmental Division PerthADVANCED ANALYTICAL AUSTRALIA
: :ContactContact JANE STRUTHERS Michael Sharp
:: AddressAddress 7 FORREST AVENUE
EAST PERTH WA, AUSTRALIA 6004
10 Hod Way Malaga WA Australia 6090
:: E-mailE-mail [email protected] [email protected]
:: TelephoneTelephone 9325 9799 +61-8-9209 7655
:: FacsimileFacsimile 9325 4299 +61-8-9209 7600
:Project A09 3208 & A09 3223 QC Level : NEPM 1999 Schedule B(3) and ALS QCS3 requirement
Site : ----
:C-O-C number ---- Date Samples Received : 15-OCT-2009
----:Sampler Issue Date : 22-OCT-2009
:Order number ----
No. of samples received : 37
Quote number : ---- No. of samples analysed : 37
This report supersedes any previous report(s) with this reference. Results apply to the sample(s) as submitted. All pages of this report have been checked and approved for release.
This Interpretive Quality Control Report contains the following information:
l Analysis Holding Time Compliance
l Quality Control Parameter Frequency Compliance
l Brief Method Summaries
l Summary of Outliers
Environmental Division Perth
10 Hod Way Malaga WA Australia 6090
Tel. +61-8-9209 7655 Fax. +61-8-9209 7600 www.alsglobal.com

2 of 9:Page
Work Order :
:Client
EP0905895
ADVANCED ANALYTICAL AUSTRALIA
A09 3208 & A09 3223:Project
Analysis Holding Time Compliance
The following report summarises extraction / preparation and analysis times and compares with recommended holding times. Dates reported represent first date of extraction or analysis and precludes subsequent
dilutions and reruns. Information is also provided re the sample container (preservative) from which the analysis aliquot was taken. Elapsed period to analysis represents number of days from sampling where no
extraction / digestion is involved or period from extraction / digestion where this is present. For composite samples, sampling date is assumed to be that of the oldest sample contributing to the composite. Sample date
for laboratory produced leachates is assumed as the completion date of the leaching process. Outliers for holding time are based on USEPA SW 846, APHA, AS and NEPM (1999). A listing of breaches is provided in
the Summary of Outliers.
Holding times for leachate methods (excluding elutriates) vary according to the analytes being determined on the resulting solution. For non -volatile analytes, the holding time compliance assessment compares the
leach date with the shortest analyte holding time for the equivalent soil method. These soil holding times are: Organics (14 days); Mercury (28 days) & other metals (180 days). A recorded breach therefore does not
guarantee a breach for all non-volatile parameters.
Matrix: SOIL Evaluation: û = Holding time breach ; ü = Within holding time.
AnalysisExtraction / PreparationSample DateMethod
EvaluationDue for analysisDate analysedEvaluationDue for extractionDate extractedContainer / Client Sample ID(s)
EA029-A: pH Measurements
Snap Lock Bag
13-JAN-201015-OCT-2009A09/3208 - 2 - BP1103 - 1.0, A09/3208 - 3 - BP1108 - 0.0-2,
A09/3208 - 4 - BP1108 - 0.0-3, A09/3208 - 6 - DA1607 - 1.0,
A09/3208 - 8 - DA2009 - 1.0, A09/3208 - 11 - DA2304 - 1.0,
A09/3208 - 14 - DA2306 - 1.0, A09/3208 - 19 - DA2705,
A09/3208 - 21 - DA2806 - 0.0-2, A09/3208 - 22 - DA2806 - 0.0-3,
A09/3208 - 26 - DA3006 - 1.0, A09/3208 - 27 - DA8006 - 0.0-2,
A09/3208 - 28 - DA8006 - 0.0-3, A09/3223 - 1 - BP54,
A09/3223 - 2 - BP56, A09/3223 - 3 - BP64,
A09/3223 - 4 - BP68 - 2, A09/3223 - 5 - BP75,
A09/3223 - 6 - BP82, A09/3223 - 7 - BP84 - 2,
A09/3223 - 8 - BP88 - 2, A09/3223 - 9 - BP88 - 3,
A09/3223 - 10 - BP95, A09/3223 - 11 - BP104,
A09/3223 - 12 - BP107, A09/3223 - 13 - DA1307,
A09/3223 - 14 - DA2010, A09/3223 - 15 - DA2121,
A09/3223 - 16 - DA2212, A09/3223 - 17 - DA2213,
A09/3223 - 18 - DA2310, A09/3223 - 19 - DA2412,
A09/3223 - 20 - DA2506, A09/3223 - 21 - DA2513,
A09/3223 - 22 - DA2610, A09/3223 - 23 - DA2810,
A09/3223 - 24 - DA2910
20-OCT-200915-OCT-200914-OCT-2009 ü ü

3 of 9:Page
Work Order :
:Client
EP0905895
ADVANCED ANALYTICAL AUSTRALIA
A09 3208 & A09 3223:Project
Matrix: SOIL Evaluation: û = Holding time breach ; ü = Within holding time.
AnalysisExtraction / PreparationSample DateMethod
EvaluationDue for analysisDate analysedEvaluationDue for extractionDate extractedContainer / Client Sample ID(s)
EA029-B: Acidity Trail
Snap Lock Bag
13-JAN-201015-OCT-2009A09/3208 - 2 - BP1103 - 1.0, A09/3208 - 3 - BP1108 - 0.0-2,
A09/3208 - 4 - BP1108 - 0.0-3, A09/3208 - 6 - DA1607 - 1.0,
A09/3208 - 8 - DA2009 - 1.0, A09/3208 - 11 - DA2304 - 1.0,
A09/3208 - 14 - DA2306 - 1.0, A09/3208 - 19 - DA2705,
A09/3208 - 21 - DA2806 - 0.0-2, A09/3208 - 22 - DA2806 - 0.0-3,
A09/3208 - 26 - DA3006 - 1.0, A09/3208 - 27 - DA8006 - 0.0-2,
A09/3208 - 28 - DA8006 - 0.0-3, A09/3223 - 1 - BP54,
A09/3223 - 2 - BP56, A09/3223 - 3 - BP64,
A09/3223 - 4 - BP68 - 2, A09/3223 - 5 - BP75,
A09/3223 - 6 - BP82, A09/3223 - 7 - BP84 - 2,
A09/3223 - 8 - BP88 - 2, A09/3223 - 9 - BP88 - 3,
A09/3223 - 10 - BP95, A09/3223 - 11 - BP104,
A09/3223 - 12 - BP107, A09/3223 - 13 - DA1307,
A09/3223 - 14 - DA2010, A09/3223 - 15 - DA2121,
A09/3223 - 16 - DA2212, A09/3223 - 17 - DA2213,
A09/3223 - 18 - DA2310, A09/3223 - 19 - DA2412,
A09/3223 - 20 - DA2506, A09/3223 - 21 - DA2513,
A09/3223 - 22 - DA2610, A09/3223 - 23 - DA2810,
A09/3223 - 24 - DA2910
20-OCT-200915-OCT-200914-OCT-2009 ü ü
EA029-C: Sulfur Trail
Snap Lock Bag
13-JAN-201015-OCT-2009A09/3208 - 2 - BP1103 - 1.0, A09/3208 - 3 - BP1108 - 0.0-2,
A09/3208 - 4 - BP1108 - 0.0-3, A09/3208 - 6 - DA1607 - 1.0,
A09/3208 - 8 - DA2009 - 1.0, A09/3208 - 11 - DA2304 - 1.0,
A09/3208 - 14 - DA2306 - 1.0, A09/3208 - 19 - DA2705,
A09/3208 - 21 - DA2806 - 0.0-2, A09/3208 - 22 - DA2806 - 0.0-3,
A09/3208 - 26 - DA3006 - 1.0, A09/3208 - 27 - DA8006 - 0.0-2,
A09/3208 - 28 - DA8006 - 0.0-3, A09/3223 - 1 - BP54,
A09/3223 - 2 - BP56, A09/3223 - 3 - BP64,
A09/3223 - 4 - BP68 - 2, A09/3223 - 5 - BP75,
A09/3223 - 6 - BP82, A09/3223 - 7 - BP84 - 2,
A09/3223 - 8 - BP88 - 2, A09/3223 - 9 - BP88 - 3,
A09/3223 - 10 - BP95, A09/3223 - 11 - BP104,
A09/3223 - 12 - BP107, A09/3223 - 13 - DA1307,
A09/3223 - 14 - DA2010, A09/3223 - 15 - DA2121,
A09/3223 - 16 - DA2212, A09/3223 - 17 - DA2213,
A09/3223 - 18 - DA2310, A09/3223 - 19 - DA2412,
A09/3223 - 20 - DA2506, A09/3223 - 21 - DA2513,
A09/3223 - 22 - DA2610, A09/3223 - 23 - DA2810,
A09/3223 - 24 - DA2910
20-OCT-200915-OCT-200914-OCT-2009 ü ü

4 of 9:Page
Work Order :
:Client
EP0905895
ADVANCED ANALYTICAL AUSTRALIA
A09 3208 & A09 3223:Project
Matrix: SOIL Evaluation: û = Holding time breach ; ü = Within holding time.
AnalysisExtraction / PreparationSample DateMethod
EvaluationDue for analysisDate analysedEvaluationDue for extractionDate extractedContainer / Client Sample ID(s)
EA029-D: Calcium Values
Snap Lock Bag
13-JAN-201015-OCT-2009A09/3208 - 2 - BP1103 - 1.0, A09/3208 - 3 - BP1108 - 0.0-2,
A09/3208 - 4 - BP1108 - 0.0-3, A09/3208 - 6 - DA1607 - 1.0,
A09/3208 - 8 - DA2009 - 1.0, A09/3208 - 11 - DA2304 - 1.0,
A09/3208 - 14 - DA2306 - 1.0, A09/3208 - 19 - DA2705,
A09/3208 - 21 - DA2806 - 0.0-2, A09/3208 - 22 - DA2806 - 0.0-3,
A09/3208 - 26 - DA3006 - 1.0, A09/3208 - 27 - DA8006 - 0.0-2,
A09/3208 - 28 - DA8006 - 0.0-3, A09/3223 - 1 - BP54,
A09/3223 - 2 - BP56, A09/3223 - 3 - BP64,
A09/3223 - 4 - BP68 - 2, A09/3223 - 5 - BP75,
A09/3223 - 6 - BP82, A09/3223 - 7 - BP84 - 2,
A09/3223 - 8 - BP88 - 2, A09/3223 - 9 - BP88 - 3,
A09/3223 - 10 - BP95, A09/3223 - 11 - BP104,
A09/3223 - 12 - BP107, A09/3223 - 13 - DA1307,
A09/3223 - 14 - DA2010, A09/3223 - 15 - DA2121,
A09/3223 - 16 - DA2212, A09/3223 - 17 - DA2213,
A09/3223 - 18 - DA2310, A09/3223 - 19 - DA2412,
A09/3223 - 20 - DA2506, A09/3223 - 21 - DA2513,
A09/3223 - 22 - DA2610, A09/3223 - 23 - DA2810,
A09/3223 - 24 - DA2910
20-OCT-200915-OCT-200914-OCT-2009 ü ü
EA029-E: Magnesium Values
Snap Lock Bag
13-JAN-201015-OCT-2009A09/3208 - 2 - BP1103 - 1.0, A09/3208 - 3 - BP1108 - 0.0-2,
A09/3208 - 4 - BP1108 - 0.0-3, A09/3208 - 6 - DA1607 - 1.0,
A09/3208 - 8 - DA2009 - 1.0, A09/3208 - 11 - DA2304 - 1.0,
A09/3208 - 14 - DA2306 - 1.0, A09/3208 - 19 - DA2705,
A09/3208 - 21 - DA2806 - 0.0-2, A09/3208 - 22 - DA2806 - 0.0-3,
A09/3208 - 26 - DA3006 - 1.0, A09/3208 - 27 - DA8006 - 0.0-2,
A09/3208 - 28 - DA8006 - 0.0-3, A09/3223 - 1 - BP54,
A09/3223 - 2 - BP56, A09/3223 - 3 - BP64,
A09/3223 - 4 - BP68 - 2, A09/3223 - 5 - BP75,
A09/3223 - 6 - BP82, A09/3223 - 7 - BP84 - 2,
A09/3223 - 8 - BP88 - 2, A09/3223 - 9 - BP88 - 3,
A09/3223 - 10 - BP95, A09/3223 - 11 - BP104,
A09/3223 - 12 - BP107, A09/3223 - 13 - DA1307,
A09/3223 - 14 - DA2010, A09/3223 - 15 - DA2121,
A09/3223 - 16 - DA2212, A09/3223 - 17 - DA2213,
A09/3223 - 18 - DA2310, A09/3223 - 19 - DA2412,
A09/3223 - 20 - DA2506, A09/3223 - 21 - DA2513,
A09/3223 - 22 - DA2610, A09/3223 - 23 - DA2810,
A09/3223 - 24 - DA2910
20-OCT-200915-OCT-200914-OCT-2009 ü ü

5 of 9:Page
Work Order :
:Client
EP0905895
ADVANCED ANALYTICAL AUSTRALIA
A09 3208 & A09 3223:Project
Matrix: SOIL Evaluation: û = Holding time breach ; ü = Within holding time.
AnalysisExtraction / PreparationSample DateMethod
EvaluationDue for analysisDate analysedEvaluationDue for extractionDate extractedContainer / Client Sample ID(s)
EA029-F: Excess Acid Neutralising Capacity
Snap Lock Bag
13-JAN-201015-OCT-2009A09/3208 - 2 - BP1103 - 1.0, A09/3208 - 3 - BP1108 - 0.0-2,
A09/3208 - 4 - BP1108 - 0.0-3, A09/3208 - 6 - DA1607 - 1.0,
A09/3208 - 8 - DA2009 - 1.0, A09/3208 - 11 - DA2304 - 1.0,
A09/3208 - 14 - DA2306 - 1.0, A09/3208 - 19 - DA2705,
A09/3208 - 21 - DA2806 - 0.0-2, A09/3208 - 22 - DA2806 - 0.0-3,
A09/3208 - 26 - DA3006 - 1.0, A09/3208 - 27 - DA8006 - 0.0-2,
A09/3208 - 28 - DA8006 - 0.0-3, A09/3223 - 1 - BP54,
A09/3223 - 2 - BP56, A09/3223 - 3 - BP64,
A09/3223 - 4 - BP68 - 2, A09/3223 - 5 - BP75,
A09/3223 - 6 - BP82, A09/3223 - 7 - BP84 - 2,
A09/3223 - 8 - BP88 - 2, A09/3223 - 9 - BP88 - 3,
A09/3223 - 10 - BP95, A09/3223 - 11 - BP104,
A09/3223 - 12 - BP107, A09/3223 - 13 - DA1307,
A09/3223 - 14 - DA2010, A09/3223 - 15 - DA2121,
A09/3223 - 16 - DA2212, A09/3223 - 17 - DA2213,
A09/3223 - 18 - DA2310, A09/3223 - 19 - DA2412,
A09/3223 - 20 - DA2506, A09/3223 - 21 - DA2513,
A09/3223 - 22 - DA2610, A09/3223 - 23 - DA2810,
A09/3223 - 24 - DA2910
20-OCT-200915-OCT-200914-OCT-2009 ü ü
EA029-G: Retained Acidity
Snap Lock Bag
13-JAN-201015-OCT-2009A09/3208 - 2 - BP1103 - 1.0, A09/3208 - 3 - BP1108 - 0.0-2,
A09/3208 - 4 - BP1108 - 0.0-3, A09/3208 - 6 - DA1607 - 1.0,
A09/3208 - 8 - DA2009 - 1.0, A09/3208 - 11 - DA2304 - 1.0,
A09/3208 - 14 - DA2306 - 1.0, A09/3208 - 19 - DA2705,
A09/3208 - 21 - DA2806 - 0.0-2, A09/3208 - 22 - DA2806 - 0.0-3,
A09/3208 - 26 - DA3006 - 1.0, A09/3208 - 27 - DA8006 - 0.0-2,
A09/3208 - 28 - DA8006 - 0.0-3, A09/3223 - 1 - BP54,
A09/3223 - 2 - BP56, A09/3223 - 3 - BP64,
A09/3223 - 4 - BP68 - 2, A09/3223 - 5 - BP75,
A09/3223 - 6 - BP82, A09/3223 - 7 - BP84 - 2,
A09/3223 - 8 - BP88 - 2, A09/3223 - 9 - BP88 - 3,
A09/3223 - 10 - BP95, A09/3223 - 11 - BP104,
A09/3223 - 12 - BP107, A09/3223 - 13 - DA1307,
A09/3223 - 14 - DA2010, A09/3223 - 15 - DA2121,
A09/3223 - 16 - DA2212, A09/3223 - 17 - DA2213,
A09/3223 - 18 - DA2310, A09/3223 - 19 - DA2412,
A09/3223 - 20 - DA2506, A09/3223 - 21 - DA2513,
A09/3223 - 22 - DA2610, A09/3223 - 23 - DA2810,
A09/3223 - 24 - DA2910
20-OCT-200915-OCT-200914-OCT-2009 ü ü

6 of 9:Page
Work Order :
:Client
EP0905895
ADVANCED ANALYTICAL AUSTRALIA
A09 3208 & A09 3223:Project
Matrix: SOIL Evaluation: û = Holding time breach ; ü = Within holding time.
AnalysisExtraction / PreparationSample DateMethod
EvaluationDue for analysisDate analysedEvaluationDue for extractionDate extractedContainer / Client Sample ID(s)
EA029-H: Acid Base Accounting
Snap Lock Bag
13-JAN-201015-OCT-2009A09/3208 - 2 - BP1103 - 1.0, A09/3208 - 3 - BP1108 - 0.0-2,
A09/3208 - 4 - BP1108 - 0.0-3, A09/3208 - 6 - DA1607 - 1.0,
A09/3208 - 8 - DA2009 - 1.0, A09/3208 - 11 - DA2304 - 1.0,
A09/3208 - 14 - DA2306 - 1.0, A09/3208 - 19 - DA2705,
A09/3208 - 21 - DA2806 - 0.0-2, A09/3208 - 22 - DA2806 - 0.0-3,
A09/3208 - 26 - DA3006 - 1.0, A09/3208 - 27 - DA8006 - 0.0-2,
A09/3208 - 28 - DA8006 - 0.0-3, A09/3223 - 1 - BP54,
A09/3223 - 2 - BP56, A09/3223 - 3 - BP64,
A09/3223 - 4 - BP68 - 2, A09/3223 - 5 - BP75,
A09/3223 - 6 - BP82, A09/3223 - 7 - BP84 - 2,
A09/3223 - 8 - BP88 - 2, A09/3223 - 9 - BP88 - 3,
A09/3223 - 10 - BP95, A09/3223 - 11 - BP104,
A09/3223 - 12 - BP107, A09/3223 - 13 - DA1307,
A09/3223 - 14 - DA2010, A09/3223 - 15 - DA2121,
A09/3223 - 16 - DA2212, A09/3223 - 17 - DA2213,
A09/3223 - 18 - DA2310, A09/3223 - 19 - DA2412,
A09/3223 - 20 - DA2506, A09/3223 - 21 - DA2513,
A09/3223 - 22 - DA2610, A09/3223 - 23 - DA2810,
A09/3223 - 24 - DA2910
20-OCT-200915-OCT-200914-OCT-2009 ü ü

7 of 9:Page
Work Order :
:Client
EP0905895
ADVANCED ANALYTICAL AUSTRALIA
A09 3208 & A09 3223:Project
Quality Control Parameter Frequency ComplianceThe following report summarises the frequency of laboratory QC samples analysed within the analytical lot(s) in which the submitted sample(s) was(where) processed. Actual rate should be greater than or equal to
the expected rate. A listing of breaches is provided in the Summary of Outliers.
Matrix: SOIL Evaluation: û = Quality Control frequency not within specification ; ü = Quality Control frequency within specification.
Quality Control SpecificationQuality Control Sample Type
ExpectedQC Regular Actual
Rate (%)Quality Control Sample Type CountEvaluationAnalytical Methods Method
Laboratory Duplicates (DUP)
NEPM 1999 Schedule B(3) and ALS QCS3 requirement 10.8 10.04 37 üSuspension Peroxide Oxidation-Combined Acidity and
Sulphate
EA029
Method Blanks (MB)
NEPM 1999 Schedule B(3) and ALS QCS3 requirement 5.4 5.02 37 üSuspension Peroxide Oxidation-Combined Acidity and
Sulphate
EA029

8 of 9:Page
Work Order :
:Client
EP0905895
ADVANCED ANALYTICAL AUSTRALIA
A09 3208 & A09 3223:Project
Brief Method SummariesThe analytical procedures used by the Environmental Division have been developed from established internationally recognized procedures such as those published by the US EPA, APHA, AS and NEPM. In house
developed procedures are employed in the absence of documented standards or by client request. The following report provides brief descriptions of the analytical procedures employed for results reported in the
Certificate of Analysis. Sources from which ALS methods have been developed are provided within the Method Descriptions.
Analytical Methods Method DescriptionsMatrixMethod
Ahern et al 2004 - a suspension peroxide oxidation method following the 'sulfur trail' by determining the level of
1M KCL extractable sulfur and the sulfur level after oxidation of soil sulphides. The 'acidity trail' is followed by
measurement of TAA, TPA and TSA. Liming Rate is based on results for samples as submitted and
incorporates a minimum safety factor of 1.5.
Suspension Peroxide
Oxidation-Combined Acidity and
Sulphate
EA029 SOIL
Preparation Methods Method DescriptionsMatrixMethod
In houseDrying at 85 degrees, bagging and
labelling (ASS)
EN020PR SOIL

9 of 9:Page
Work Order :
:Client
EP0905895
ADVANCED ANALYTICAL AUSTRALIA
A09 3208 & A09 3223:Project
Summary of Outliers
Outliers : Quality Control Samples
The following report highlights outliers flagged in the Quality Control (QC) Report. Surrogate recovery limits are static and based on USEPA SW846 or ALS-QWI/EN/38 (in the absence of specific USEPA limits). This
report displays QC Outliers (breaches) only.
Duplicates, Method Blanks, Laboratory Control Samples and Matrix Spikes
l For all matrices, no Method Blank value outliers occur.
l For all matrices, no Duplicate outliers occur.
l For all matrices, no Laboratory Control outliers occur.
l For all matrices, no Matrix Spike outliers occur.
Regular Sample Surrogates
l For all regular sample matrices, no surrogate recovery outliers occur.
Outliers : Analysis Holding Time Compliance
This report displays Holding Time breaches only. Only the respective Extraction / Preparation and/or Analysis component is/are displayed.
l No Analysis Holding Time Outliers exist.
Outliers : Frequency of Quality Control Samples
The following report highlights breaches in the Frequency of Quality Control Samples.
l No Quality Control Sample Frequency Outliers exist.


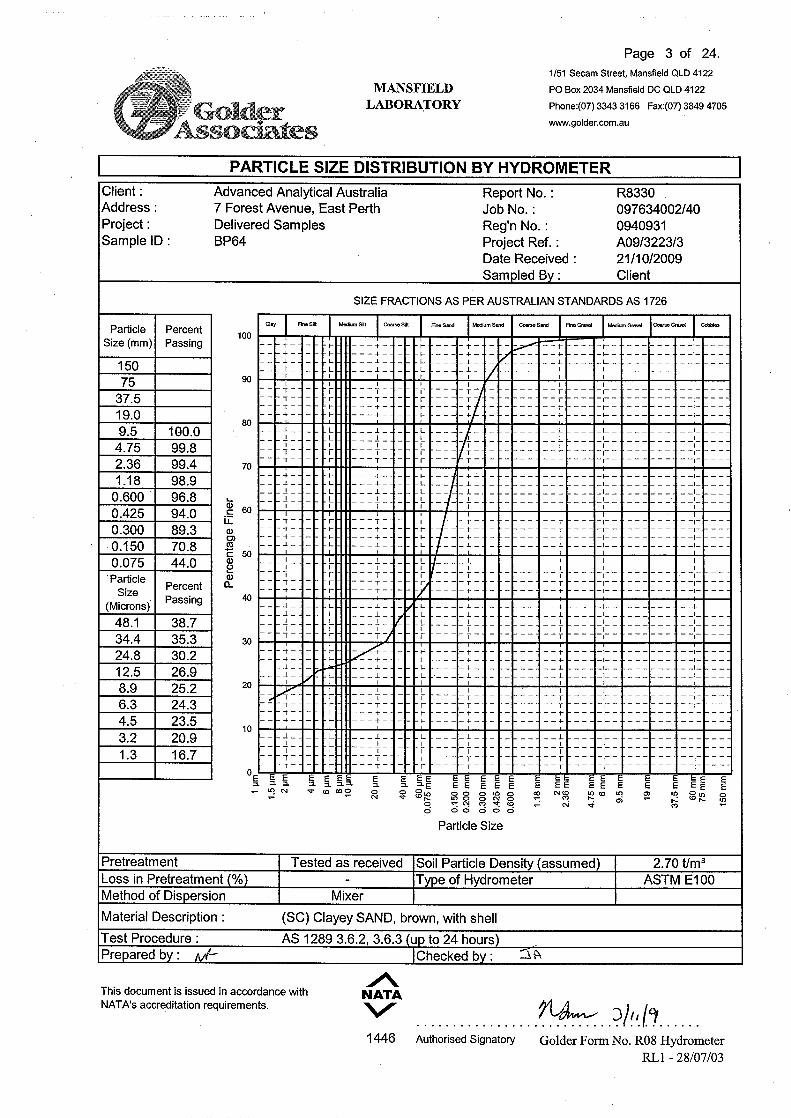


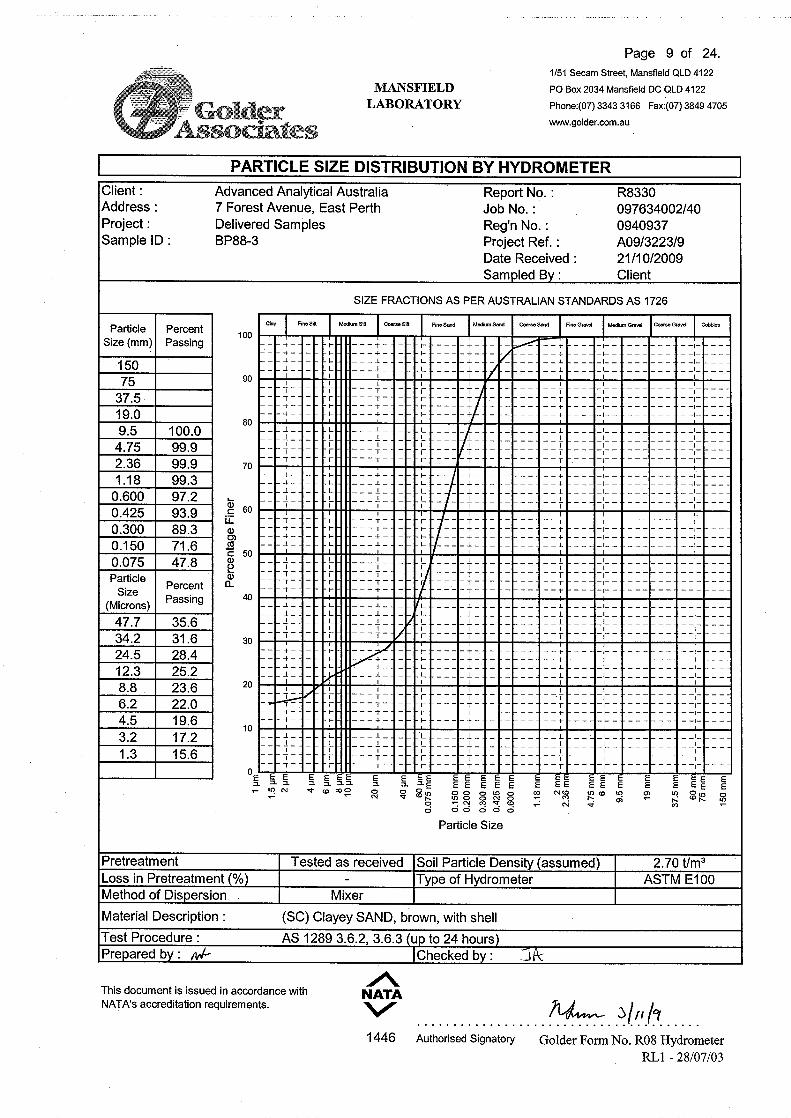


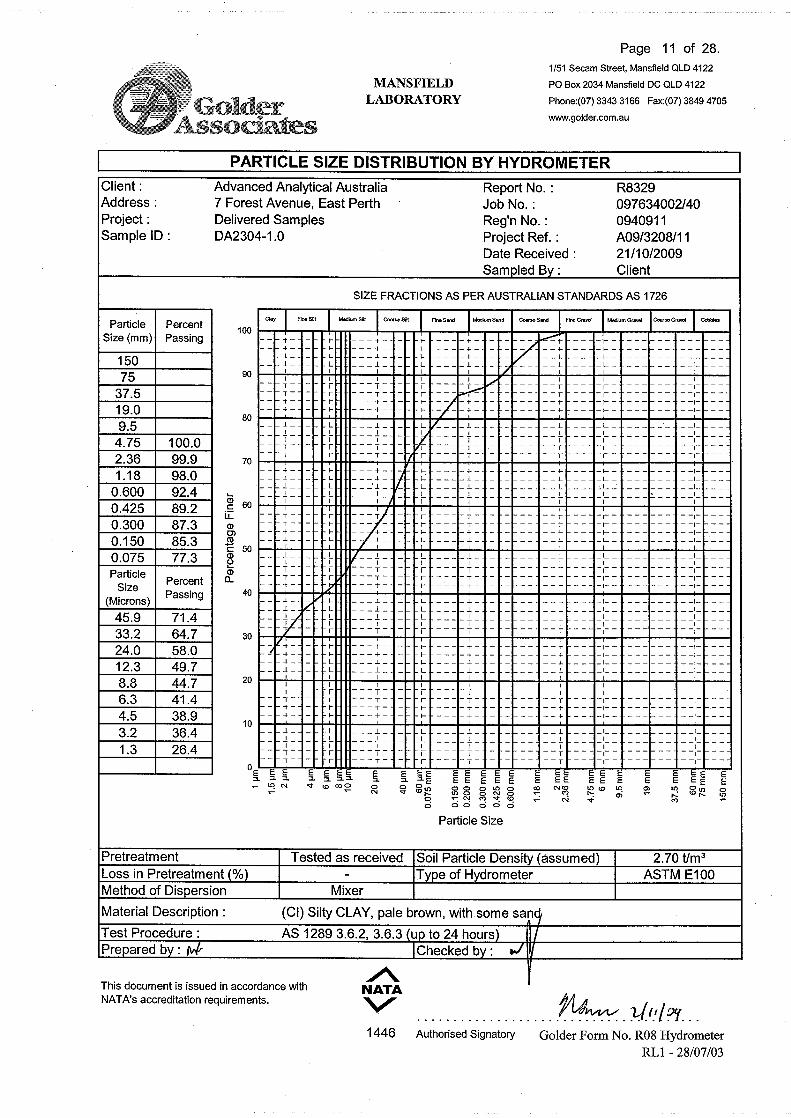


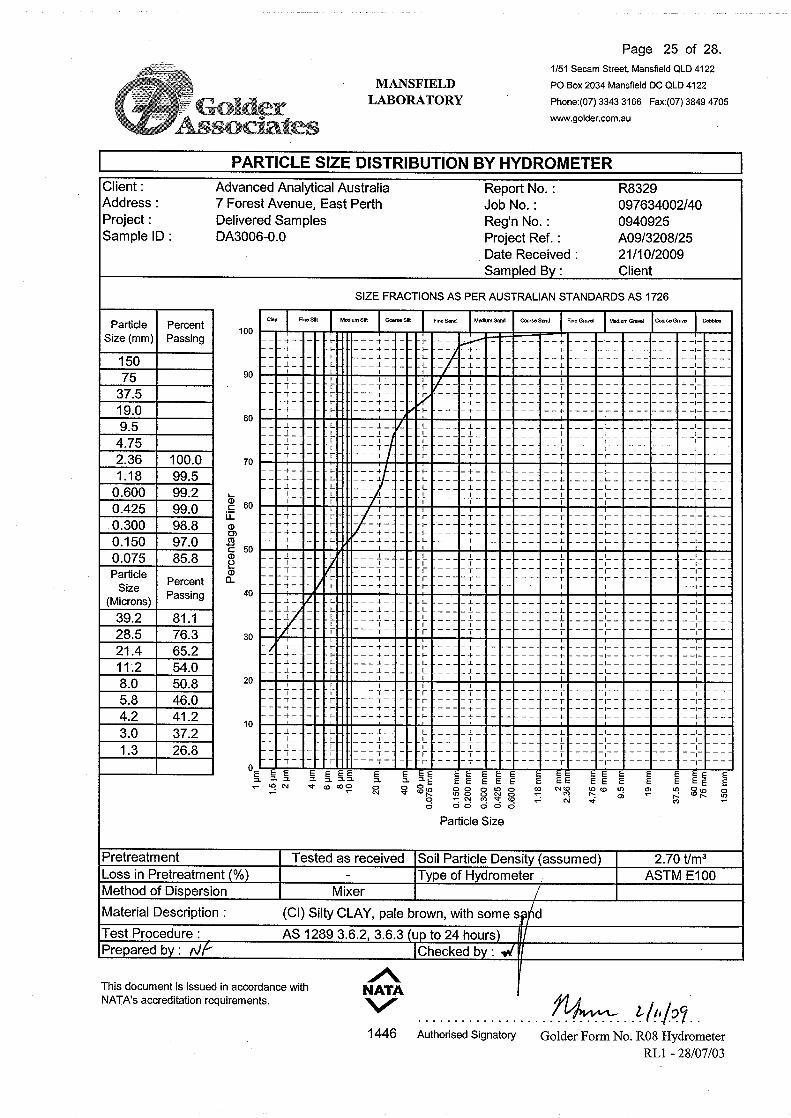


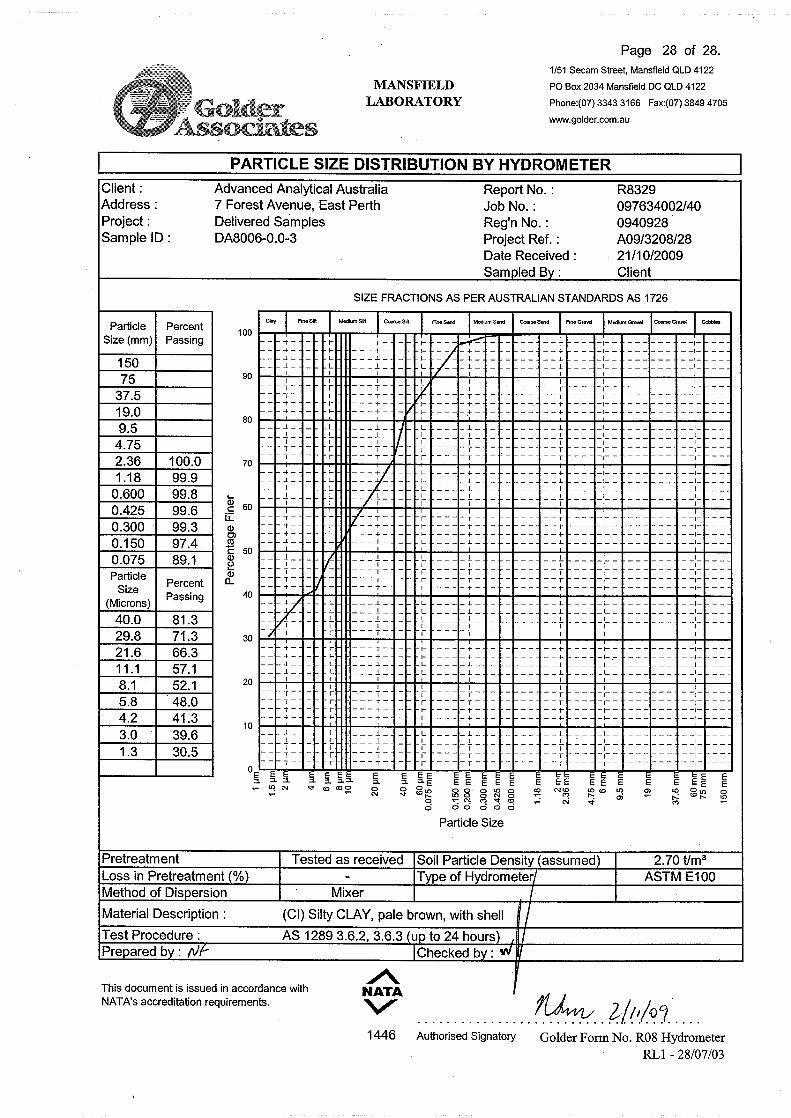


False
QUALITY CONTROL REPORT
Work Order : EP0905867 Page : 1 of 10
:: LaboratoryClient Environmental Division PerthADVANCED ANALYTICAL AUSTRALIA
: :ContactContact JANE STRUTHERS Michael Sharp
:: AddressAddress 7 FORREST AVENUE
EAST PERTH WA, AUSTRALIA 6004
10 Hod Way Malaga WA Australia 6090
:: E-mailE-mail [email protected] [email protected]
:: TelephoneTelephone 9325 9799 +61-8-9209 7655
:: FacsimileFacsimile 9325 4299 +61-8-9209 7600
:Project A09 3208 QC Level : NEPM 1999 Schedule B(3) and ALS QCS3 requirement
Site : ----
:C-O-C number ---- Date Samples Received : 14-OCT-2009
Sampler : ---- Issue Date : 29-OCT-2009
:Order number ----
30:No. of samples received
Quote number : ---- 30:No. of samples analysed
This report supersedes any previous report(s) with this reference. Results apply to the sample(s) as submitted. All pages of this report have been checked and approved for
release.
This Quality Control Report contains the following information:
l Laboratory Duplicate (DUP) Report; Relative Percentage Difference (RPD) and Acceptance Limits
l Method Blank (MB) and Laboratory Control Spike (LCS) Report ; Recovery and Acceptance Limits
l Matrix Spike (MS) Report; Recovery and Acceptance Limits
NATA Accredited Laboratory 825
This document is issued in
accordance with NATA
accreditation requirements.
Accredited for compliance with
ISO/IEC 17025.
SignatoriesThis document has been electronically signed by the authorized signatories indicated below. Electronic signing has been
carried out in compliance with procedures specified in 21 CFR Part 11.
Signatories Accreditation CategoryPosition
Inorganics
Kim McCabe Senior Inorganic Chemist Inorganics
Stacey Hawkins Senior Chemist - Acid Sulphate Soils Perth ASS
Environmental Division Perth
10 Hod Way Malaga WA Australia 6090
Tel. +61-8-9209 7655 Fax. +61-8-9209 7600 www.alsglobal.com

2 of 10:Page
Work Order :
:Client
EP0905867
ADVANCED ANALYTICAL AUSTRALIA
A09 3208:Project
General Comments
The analytical procedures used by the Environmental Division have been developed from established internationally recognized procedures such as those published by the USEPA, APHA, AS and NEPM. In house
developed procedures are employed in the absence of documented standards or by client request.
Where moisture determination has been performed, results are reported on a dry weight basis.
Where a reported less than (<) result is higher than the LOR, this may be due to primary sample extract/digestate dilution and/or insuffient sample for analysis.
Where the LOR of a reported result differs from standard LOR, this may be due to high moisture content, insufficient sample (reduced weight employed) or matrix interference.
Anonymous = Refers to samples which are not specifically part of this work order but formed part of the QC process lot
CAS Number = CAS registry number from database maintained by Chemical Abstracts Services. The Chemical Abstracts Service is a division of the American Chemical Society.
LOR = Limit of reporting
RPD = Relative Percentage Difference
# = Indicates failed QC
Key :

3 of 10:Page
Work Order :
:Client
EP0905867
ADVANCED ANALYTICAL AUSTRALIA
A09 3208:Project
Laboratory Duplicate (DUP) Report
The quality control term Laboratory Duplicate refers to a randomly selected intralaboratory split. Laboratory duplicates provide information regarding method precision and sample heterogeneity. The permitted ranges
for the Relative Percent Deviation (RPD) of Laboratory Duplicates are specified in ALS Method QWI -EN/38 and are dependent on the magnitude of results in comparison to the level of reporting: Result < 10 times LOR:-
No Limit; Result between 10 and 20 times LOR:- 0% - 50%; Result > 20 times LOR:- 0% - 20%.
Sub-Matrix: SOIL Laboratory Duplicate (DUP) Report
Original Result RPD (%)Laboratory sample ID Client sample ID Method: Compound CAS Number LOR Unit Duplicate Result Recovery Limits (%)
EA029-A: pH Measurements (QC Lot: 1133578)
EA029: pH KCl (23A) ---- 0.1 pH Unit 9.4 9.4 0.0 0% - 20%A09/3208-1EP0905867-001
EA029: pH OX (23B) ---- 0.1 pH Unit 8.3 8.1 2.4 0% - 20%
EA029: pH KCl (23A) ---- 0.1 pH Unit 9.4 9.4 0.0 0% - 20%A09/3208-18EP0905867-011
EA029: pH OX (23B) ---- 0.1 pH Unit 8.4 8.6 2.4 0% - 20%
EA029-A: pH Measurements (QC Lot: 1133580)
EA029: pH KCl (23A) ---- 0.1 pH Unit 9.3 9.3 0.0 0% - 20%A09/3208-12 -75umEP0905867-021
EA029: pH OX (23B) ---- 0.1 pH Unit 8.2 8.5 4.2 0% - 20%
EA029-B: Acidity Trail (QC Lot: 1133578)
EA029: sulfidic - Titratable Actual Acidity (s-23F) ---- 0.02 % pyrite S <0.02 <0.02 0.0 No LimitA09/3208-1EP0905867-001
EA029: sulfidic - Titratable Peroxide Acidity
(s-23G)
---- 0.02 % pyrite S <0.02 <0.02 0.0 No Limit
EA029: sulfidic - Titratable Sulfidic Acidity
(s-23H)
---- 0.02 % pyrite S <0.02 <0.02 0.0 No Limit
EA029: Titratable Actual Acidity (23F) ---- 2 mole H+ / t <2 <2 0.0 No Limit
EA029: Titratable Peroxide Acidity (23G) ---- 2 mole H+ / t <2 <2 0.0 No Limit
EA029: Titratable Sulfidic Acidity (23H) ---- 2 mole H+ / t <2 <2 0.0 No Limit
EA029: sulfidic - Titratable Actual Acidity (s-23F) ---- 0.02 % pyrite S <0.02 <0.02 0.0 No LimitA09/3208-18EP0905867-011
EA029: sulfidic - Titratable Peroxide Acidity
(s-23G)
---- 0.02 % pyrite S <0.02 <0.02 0.0 No Limit
EA029: sulfidic - Titratable Sulfidic Acidity
(s-23H)
---- 0.02 % pyrite S <0.02 <0.02 0.0 No Limit
EA029: Titratable Actual Acidity (23F) ---- 2 mole H+ / t <2 <2 0.0 No Limit
EA029: Titratable Peroxide Acidity (23G) ---- 2 mole H+ / t <2 <2 0.0 No Limit
EA029: Titratable Sulfidic Acidity (23H) ---- 2 mole H+ / t <2 <2 0.0 No Limit
EA029-B: Acidity Trail (QC Lot: 1133580)
EA029: sulfidic - Titratable Actual Acidity (s-23F) ---- 0.02 % pyrite S <0.02 <0.02 0.0 No LimitA09/3208-12 -75umEP0905867-021
EA029: sulfidic - Titratable Peroxide Acidity
(s-23G)
---- 0.02 % pyrite S <0.02 <0.02 0.0 No Limit
EA029: sulfidic - Titratable Sulfidic Acidity
(s-23H)
---- 0.02 % pyrite S <0.02 <0.02 0.0 No Limit
EA029: Titratable Actual Acidity (23F) ---- 2 mole H+ / t <2 <2 0.0 No Limit
EA029: Titratable Peroxide Acidity (23G) ---- 2 mole H+ / t <2 <2 0.0 No Limit
EA029: Titratable Sulfidic Acidity (23H) ---- 2 mole H+ / t <2 <2 0.0 No Limit
EA029-C: Sulfur Trail (QC Lot: 1133578)
EA029: KCl Extractable Sulfur (23Ce) ---- 0.02 % S 0.10 0.11 0.0 No LimitA09/3208-1EP0905867-001
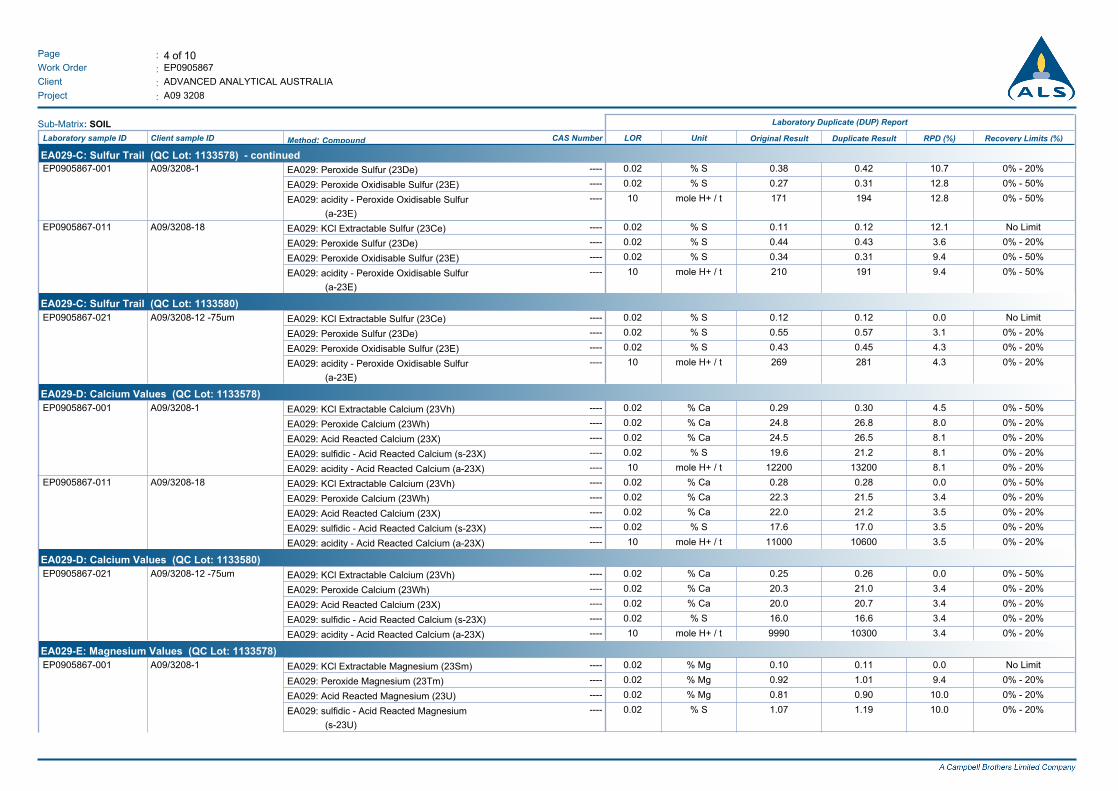
4 of 10:Page
Work Order :
:Client
EP0905867
ADVANCED ANALYTICAL AUSTRALIA
A09 3208:Project
Sub-Matrix: SOIL Laboratory Duplicate (DUP) Report
Original Result RPD (%)Laboratory sample ID Client sample ID Method: Compound CAS Number LOR Unit Duplicate Result Recovery Limits (%)
EA029-C: Sulfur Trail (QC Lot: 1133578) - continued
EA029: Peroxide Sulfur (23De) ---- 0.02 % S 0.38 0.42 10.7 0% - 20%A09/3208-1EP0905867-001
EA029: Peroxide Oxidisable Sulfur (23E) ---- 0.02 % S 0.27 0.31 12.8 0% - 50%
EA029: acidity - Peroxide Oxidisable Sulfur
(a-23E)
---- 10 mole H+ / t 171 194 12.8 0% - 50%
EA029: KCl Extractable Sulfur (23Ce) ---- 0.02 % S 0.11 0.12 12.1 No LimitA09/3208-18EP0905867-011
EA029: Peroxide Sulfur (23De) ---- 0.02 % S 0.44 0.43 3.6 0% - 20%
EA029: Peroxide Oxidisable Sulfur (23E) ---- 0.02 % S 0.34 0.31 9.4 0% - 50%
EA029: acidity - Peroxide Oxidisable Sulfur
(a-23E)
---- 10 mole H+ / t 210 191 9.4 0% - 50%
EA029-C: Sulfur Trail (QC Lot: 1133580)
EA029: KCl Extractable Sulfur (23Ce) ---- 0.02 % S 0.12 0.12 0.0 No LimitA09/3208-12 -75umEP0905867-021
EA029: Peroxide Sulfur (23De) ---- 0.02 % S 0.55 0.57 3.1 0% - 20%
EA029: Peroxide Oxidisable Sulfur (23E) ---- 0.02 % S 0.43 0.45 4.3 0% - 20%
EA029: acidity - Peroxide Oxidisable Sulfur
(a-23E)
---- 10 mole H+ / t 269 281 4.3 0% - 20%
EA029-D: Calcium Values (QC Lot: 1133578)
EA029: KCl Extractable Calcium (23Vh) ---- 0.02 % Ca 0.29 0.30 4.5 0% - 50%A09/3208-1EP0905867-001
EA029: Peroxide Calcium (23Wh) ---- 0.02 % Ca 24.8 26.8 8.0 0% - 20%
EA029: Acid Reacted Calcium (23X) ---- 0.02 % Ca 24.5 26.5 8.1 0% - 20%
EA029: sulfidic - Acid Reacted Calcium (s-23X) ---- 0.02 % S 19.6 21.2 8.1 0% - 20%
EA029: acidity - Acid Reacted Calcium (a-23X) ---- 10 mole H+ / t 12200 13200 8.1 0% - 20%
EA029: KCl Extractable Calcium (23Vh) ---- 0.02 % Ca 0.28 0.28 0.0 0% - 50%A09/3208-18EP0905867-011
EA029: Peroxide Calcium (23Wh) ---- 0.02 % Ca 22.3 21.5 3.4 0% - 20%
EA029: Acid Reacted Calcium (23X) ---- 0.02 % Ca 22.0 21.2 3.5 0% - 20%
EA029: sulfidic - Acid Reacted Calcium (s-23X) ---- 0.02 % S 17.6 17.0 3.5 0% - 20%
EA029: acidity - Acid Reacted Calcium (a-23X) ---- 10 mole H+ / t 11000 10600 3.5 0% - 20%
EA029-D: Calcium Values (QC Lot: 1133580)
EA029: KCl Extractable Calcium (23Vh) ---- 0.02 % Ca 0.25 0.26 0.0 0% - 50%A09/3208-12 -75umEP0905867-021
EA029: Peroxide Calcium (23Wh) ---- 0.02 % Ca 20.3 21.0 3.4 0% - 20%
EA029: Acid Reacted Calcium (23X) ---- 0.02 % Ca 20.0 20.7 3.4 0% - 20%
EA029: sulfidic - Acid Reacted Calcium (s-23X) ---- 0.02 % S 16.0 16.6 3.4 0% - 20%
EA029: acidity - Acid Reacted Calcium (a-23X) ---- 10 mole H+ / t 9990 10300 3.4 0% - 20%
EA029-E: Magnesium Values (QC Lot: 1133578)
EA029: KCl Extractable Magnesium (23Sm) ---- 0.02 % Mg 0.10 0.11 0.0 No LimitA09/3208-1EP0905867-001
EA029: Peroxide Magnesium (23Tm) ---- 0.02 % Mg 0.92 1.01 9.4 0% - 20%
EA029: Acid Reacted Magnesium (23U) ---- 0.02 % Mg 0.81 0.90 10.0 0% - 20%
EA029: sulfidic - Acid Reacted Magnesium
(s-23U)
---- 0.02 % S 1.07 1.19 10.0 0% - 20%

5 of 10:Page
Work Order :
:Client
EP0905867
ADVANCED ANALYTICAL AUSTRALIA
A09 3208:Project
Sub-Matrix: SOIL Laboratory Duplicate (DUP) Report
Original Result RPD (%)Laboratory sample ID Client sample ID Method: Compound CAS Number LOR Unit Duplicate Result Recovery Limits (%)
EA029-E: Magnesium Values (QC Lot: 1133578) - continued
EA029: Acidity - Acid Reacted Magnesium
(a-23U)
---- 10 mole H+ / t 670 740 10.0 0% - 20%A09/3208-1EP0905867-001
EA029: KCl Extractable Magnesium (23Sm) ---- 0.02 % Mg 0.09 0.09 0.0 No LimitA09/3208-18EP0905867-011
EA029: Peroxide Magnesium (23Tm) ---- 0.02 % Mg 0.83 0.83 0.0 0% - 20%
EA029: Acid Reacted Magnesium (23U) ---- 0.02 % Mg 0.74 0.74 0.0 0% - 20%
EA029: sulfidic - Acid Reacted Magnesium
(s-23U)
---- 0.02 % S 0.98 0.97 1.1 0% - 20%
EA029: Acidity - Acid Reacted Magnesium
(a-23U)
---- 10 mole H+ / t 611 605 1.1 0% - 20%
EA029-E: Magnesium Values (QC Lot: 1133580)
EA029: KCl Extractable Magnesium (23Sm) ---- 0.02 % Mg 0.10 0.11 0.0 No LimitA09/3208-12 -75umEP0905867-021
EA029: Peroxide Magnesium (23Tm) ---- 0.02 % Mg 0.92 0.95 2.9 0% - 20%
EA029: Acid Reacted Magnesium (23U) ---- 0.02 % Mg 0.81 0.84 2.6 0% - 20%
EA029: sulfidic - Acid Reacted Magnesium
(s-23U)
---- 0.02 % S 1.07 1.10 2.6 0% - 20%
EA029: Acidity - Acid Reacted Magnesium
(a-23U)
---- 10 mole H+ / t 670 687 2.6 0% - 20%
EA029-F: Excess Acid Neutralising Capacity (QC Lot: 1133578)
EA029: Excess Acid Neutralising Capacity (23Q) ---- 0.02 % CaCO3 54.4 54.7 0.6 0% - 20%A09/3208-1EP0905867-001
EA029: sulfidic - Excess Acid Neutralising
Capacity (s-23Q)
---- 0.02 % S 17.4 17.5 0.6 0% - 20%
EA029: acidity - Excess Acid Neutralising
Capacity (a-23Q)
---- 10 mole H+ / t 10800 10900 0.6 0% - 20%
EA029: Excess Acid Neutralising Capacity (23Q) ---- 0.02 % CaCO3 51.6 51.5 0.2 0% - 20%A09/3208-18EP0905867-011
EA029: sulfidic - Excess Acid Neutralising
Capacity (s-23Q)
---- 0.02 % S 16.5 16.5 0.2 0% - 20%
EA029: acidity - Excess Acid Neutralising
Capacity (a-23Q)
---- 10 mole H+ / t 10300 10300 0.2 0% - 20%
EA029-F: Excess Acid Neutralising Capacity (QC Lot: 1133580)
EA029: Excess Acid Neutralising Capacity (23Q) ---- 0.02 % CaCO3 49.1 49.6 1.0 0% - 20%A09/3208-12 -75umEP0905867-021
EA029: sulfidic - Excess Acid Neutralising
Capacity (s-23Q)
---- 0.02 % S 15.7 15.9 1.0 0% - 20%
EA029: acidity - Excess Acid Neutralising
Capacity (a-23Q)
---- 10 mole H+ / t 9810 9910 1.0 0% - 20%
EA029-H: Acid Base Accounting (QC Lot: 1133578)
EA029: ANC Fineness Factor ---- 0.5 - 1.5 1.5 0.0 No LimitA09/3208-1EP0905867-001
EA029: Net Acidity (sulfur units) ---- 0.02 % S <0.02 <0.02 0.0 No Limit
EA029: Net Acidity excluding ANC (sulfur units) ---- 0.02 % S 0.27 0.31 12.8 0% - 50%
EA029: Liming Rate ---- 1 kg CaCO3/t <1 <1 0.0 No Limit
EA029: Liming Rate excluding ANC ---- 1 kg CaCO3/t 13 15 12.8 0% - 50%

6 of 10:Page
Work Order :
:Client
EP0905867
ADVANCED ANALYTICAL AUSTRALIA
A09 3208:Project
Sub-Matrix: SOIL Laboratory Duplicate (DUP) Report
Original Result RPD (%)Laboratory sample ID Client sample ID Method: Compound CAS Number LOR Unit Duplicate Result Recovery Limits (%)
EA029-H: Acid Base Accounting (QC Lot: 1133578) - continued
EA029: Net Acidity (acidity units) ---- 10 mole H+ / t <10 <10 0.0 No LimitA09/3208-1EP0905867-001
EA029: Net Acidity excluding ANC (acidity units) ---- 10 mole H+ / t 171 194 12.8 0% - 50%
EA029: ANC Fineness Factor ---- 0.5 - 1.5 1.5 0.0 No LimitA09/3208-18EP0905867-011
EA029: Net Acidity (sulfur units) ---- 0.02 % S <0.02 <0.02 0.0 No Limit
EA029: Net Acidity excluding ANC (sulfur units) ---- 0.02 % S 0.34 0.31 9.4 0% - 50%
EA029: Liming Rate ---- 1 kg CaCO3/t <1 <1 0.0 No Limit
EA029: Liming Rate excluding ANC ---- 1 kg CaCO3/t 16 14 9.4 0% - 50%
EA029: Net Acidity (acidity units) ---- 10 mole H+ / t <10 <10 0.0 No Limit
EA029: Net Acidity excluding ANC (acidity units) ---- 10 mole H+ / t 210 191 9.4 0% - 50%
EA029-H: Acid Base Accounting (QC Lot: 1133580)
EA029: ANC Fineness Factor ---- 0.5 - 1.5 1.5 0.0 No LimitA09/3208-12 -75umEP0905867-021
EA029: Net Acidity (sulfur units) ---- 0.02 % S <0.02 <0.02 0.0 No Limit
EA029: Net Acidity excluding ANC (sulfur units) ---- 0.02 % S 0.43 0.45 4.3 0% - 20%
EA029: Liming Rate ---- 1 kg CaCO3/t <1 <1 0.0 No Limit
EA029: Liming Rate excluding ANC ---- 1 kg CaCO3/t 20 21 0.0 0% - 20%
EA029: Net Acidity (acidity units) ---- 10 mole H+ / t <10 <10 0.0 No Limit
EA029: Net Acidity excluding ANC (acidity units) ---- 10 mole H+ / t 269 281 4.3 0% - 20%
EA033-A: Actual Acidity (QC Lot: 1133579)
EA033: sulfidic - Titratable Actual Acidity (s-23F) ---- 0.02 % pyrite S <0.02 <0.02 0.0 No LimitA09/3208-1EP0905867-001
EA033: Titratable Actual Acidity (23F) ---- 2 mole H+ / t <2 <2 0.0 No Limit
EA033: pH KCl (23A) ---- 0.1 pH Unit 9.4 9.4 0.0 0% - 20%
EA033: sulfidic - Titratable Actual Acidity (s-23F) ---- 0.02 % pyrite S <0.02 <0.02 0.0 No LimitA09/3208-18EP0905867-011
EA033: Titratable Actual Acidity (23F) ---- 2 mole H+ / t <2 <2 0.0 No Limit
EA033: pH KCl (23A) ---- 0.1 pH Unit 9.4 9.4 0.0 0% - 20%
EA033-B: Potential Acidity (QC Lot: 1133579)
EA033: Chromium Reducible Sulfur (22B) ---- 0.02 % S 0.13 0.12 0.0 No LimitA09/3208-1EP0905867-001
EA033: acidity - Chromium Reducible Sulfur
(a-22B)
---- 10 mole H+ / t 79 76 3.5 No Limit
EA033: Chromium Reducible Sulfur (22B) ---- 0.02 % S 0.17 0.17 0.0 No LimitA09/3208-18EP0905867-011
EA033: acidity - Chromium Reducible Sulfur
(a-22B)
---- 10 mole H+ / t 109 108 0.9 0% - 50%
EA033-C: Acid Neutralising Capacity (QC Lot: 1133579)
EA033: Acid Neutralising Capacity (19A2) ---- 0.01 % CaCO3 55.4 55.5 0.2 0% - 20%A09/3208-1EP0905867-001
EA033: sulfidic - Acid Neutralising Capacity
(s-19A2)
---- 0.01 % pyrite S 17.8 17.8 0.2 0% - 20%
EA033: acidity - Acid Neutralising Capacity
(a-19A2)
---- 10 mole H+ / t 11100 11100 0.2 0% - 20%
EA033: Acid Neutralising Capacity (19A2) ---- 0.01 % CaCO3 54.3 53.0 2.5 0% - 20%A09/3208-18EP0905867-011

7 of 10:Page
Work Order :
:Client
EP0905867
ADVANCED ANALYTICAL AUSTRALIA
A09 3208:Project
Sub-Matrix: SOIL Laboratory Duplicate (DUP) Report
Original Result RPD (%)Laboratory sample ID Client sample ID Method: Compound CAS Number LOR Unit Duplicate Result Recovery Limits (%)
EA033-C: Acid Neutralising Capacity (QC Lot: 1133579) - continued
EA033: sulfidic - Acid Neutralising Capacity
(s-19A2)
---- 0.01 % pyrite S 17.4 17.0 2.5 0% - 20%A09/3208-18EP0905867-011
EA033: acidity - Acid Neutralising Capacity
(a-19A2)
---- 10 mole H+ / t 10800 10600 2.5 0% - 20%
EA033-E: Acid Base Accounting (QC Lot: 1133579)
EA033: ANC Fineness Factor ---- 0.5 - 1.5 1.5 0.0 No LimitA09/3208-1EP0905867-001
EA033: Net Acidity (sulfur units) ---- 0.02 % S <0.02 <0.02 0.0 No Limit
EA033: Net Acidity excluding ANC (sulfur units) ---- 0.02 % S 0.13 0.12 0.0 No Limit
EA033: Liming Rate ---- 1 kg CaCO3/t <1 <1 0.0 No Limit
EA033: Liming Rate excluding ANC ---- 1 kg CaCO3/t 6 6 0.0 No Limit
EA033: Net Acidity (acidity units) ---- 10 mole H+ / t <10 <10 0.0 No Limit
EA033: Net Acidity excluding ANC (acidity units) ---- 10 mole H+ / t 79 76 3.5 No Limit
EA033: ANC Fineness Factor ---- 0.5 - 8.5 9.5 11.1 0% - 50%A09/3208-18EP0905867-011
EA033: Net Acidity (sulfur units) ---- 0.02 % S <0.02 <0.02 0.0 No Limit
EA033: Net Acidity excluding ANC (sulfur units) ---- 0.02 % S 0.17 0.17 0.0 No Limit
EA033: Liming Rate ---- 1 kg CaCO3/t <1 <1 0.0 No Limit
EA033: Liming Rate excluding ANC ---- 1 kg CaCO3/t 8 8 0.0 No Limit
EA033: Net Acidity (acidity units) ---- 10 mole H+ / t <10 <10 0.0 No Limit
EA033: Net Acidity excluding ANC (acidity units) ---- 10 mole H+ / t 109 108 0.9 0% - 50%
EA038: Acid Volatlile Sulfur (QC Lot: 1142600)
EA038: Acid Volatile Sulfur ---- 0.001 % <0.001 <0.001 0.0 No LimitA09/3208-1EP0905867-001
EA038: Acid Volatile Sulfur ---- 0.001 % <0.001 <0.001 0.0 No LimitA09/3208-17EP0905867-010
EA055: Moisture Content (QC Lot: 1144051)
EA055-103: Moisture Content (dried @ 103°C) ---- 1.0 % 37.5 38.8 3.2 0% - 20%A09/3208-9EP0905867-004
EA055-103: Moisture Content (dried @ 103°C) ---- 1.0 % 36.5 36.8 0.7 0% - 20%A09/3208-18EP0905867-011

8 of 10:Page
Work Order :
:Client
EP0905867
ADVANCED ANALYTICAL AUSTRALIA
A09 3208:Project
Method Blank (MB) and Laboratory Control Spike (LCS) Report
The quality control term Method / Laboratory Blank refers to an analyte free matrix to which all reagents are added in the same volumes or proportions as used in standard sample preparation. The purpose of this QC
parameter is to monitor potential laboratory contamination. The quality control term Laboratory Control Sample (LCS) refers to a certified reference material, or a known interference free matrix spiked with target
analytes. The purpose of this QC parameter is to monitor method precision and accuracy independent of sample matrix. Dynamic Recovery Limits are based on statistical evaluation of processed LCS.
Sub-Matrix: SOIL Method Blank (MB)
Report
Laboratory Control Spike (LCS) Report
Spike Spike Recovery (%) Recovery Limits (%)
Result Concentration HighLowLCSMethod: Compound CAS Number LOR Unit
EA029-B: Acidity Trail (QCLot: 1133578)
EA029: Titratable Actual Acidity (23F) ---- 2 mole H+ / t <2 -------- --------
EA029: Titratable Peroxide Acidity (23G) ---- 2 mole H+ / t <2 -------- --------
EA029: sulfidic - Titratable Actual Acidity (s-23F) ---- 0.02 % pyrite S <0.02 -------- --------
EA029: sulfidic - Titratable Peroxide Acidity (s-23G) ---- 0.02 % pyrite S <0.02 -------- --------
EA029: sulfidic - Titratable Sulfidic Acidity (s-23H) ---- 0.02 % pyrite S <0.02 -------- --------
EA029-B: Acidity Trail (QCLot: 1133580)
EA029: Titratable Actual Acidity (23F) ---- 2 mole H+ / t <2 -------- --------
EA029: Titratable Peroxide Acidity (23G) ---- 2 mole H+ / t <2 -------- --------
EA029: sulfidic - Titratable Actual Acidity (s-23F) ---- 0.02 % pyrite S <0.02 -------- --------
EA029: sulfidic - Titratable Peroxide Acidity (s-23G) ---- 0.02 % pyrite S <0.02 -------- --------
EA029: sulfidic - Titratable Sulfidic Acidity (s-23H) ---- 0.02 % pyrite S <0.02 -------- --------
EA029-C: Sulfur Trail (QCLot: 1133578)
EA029: KCl Extractable Sulfur (23Ce) ---- 0.02 % S <0.02 -------- --------
EA029: Peroxide Sulfur (23De) ---- 0.02 % S <0.02 -------- --------
EA029: Peroxide Oxidisable Sulfur (23E) ---- 0.02 % S <0.02 -------- --------
EA029: acidity - Peroxide Oxidisable Sulfur (a-23E) ---- 10 mole H+ / t <10 -------- --------
EA029-C: Sulfur Trail (QCLot: 1133580)
EA029: KCl Extractable Sulfur (23Ce) ---- 0.02 % S <0.02 -------- --------
EA029: Peroxide Sulfur (23De) ---- 0.02 % S <0.02 -------- --------
EA029: Peroxide Oxidisable Sulfur (23E) ---- 0.02 % S <0.02 -------- --------
EA029: acidity - Peroxide Oxidisable Sulfur (a-23E) ---- 10 mole H+ / t <10 -------- --------
EA029-D: Calcium Values (QCLot: 1133578)
EA029: KCl Extractable Calcium (23Vh) ---- 0.02 % Ca <0.02 -------- --------
EA029: Peroxide Calcium (23Wh) ---- 0.02 % Ca <0.02 -------- --------
EA029: Acid Reacted Calcium (23X) ---- 0.02 % Ca <0.02 -------- --------
EA029: acidity - Acid Reacted Calcium (a-23X) ---- 10 mole H+ / t <10 -------- --------
EA029: sulfidic - Acid Reacted Calcium (s-23X) ---- 0.02 % S <0.02 -------- --------
EA029-D: Calcium Values (QCLot: 1133580)
EA029: KCl Extractable Calcium (23Vh) ---- 0.02 % Ca <0.02 -------- --------
EA029: Peroxide Calcium (23Wh) ---- 0.02 % Ca <0.02 -------- --------
EA029: Acid Reacted Calcium (23X) ---- 0.02 % Ca <0.02 -------- --------
EA029: acidity - Acid Reacted Calcium (a-23X) ---- 10 mole H+ / t <10 -------- --------
EA029: sulfidic - Acid Reacted Calcium (s-23X) ---- 0.02 % S <0.02 -------- --------
EA029-E: Magnesium Values (QCLot: 1133578)

9 of 10:Page
Work Order :
:Client
EP0905867
ADVANCED ANALYTICAL AUSTRALIA
A09 3208:Project
Sub-Matrix: SOIL Method Blank (MB)
Report
Laboratory Control Spike (LCS) Report
Spike Spike Recovery (%) Recovery Limits (%)
Result Concentration HighLowLCSMethod: Compound CAS Number LOR Unit
EA029-E: Magnesium Values (QCLot: 1133578) - continued
EA029: KCl Extractable Magnesium (23Sm) ---- 0.02 % Mg <0.02 -------- --------
EA029: Peroxide Magnesium (23Tm) ---- 0.02 % Mg <0.02 -------- --------
EA029: Acid Reacted Magnesium (23U) ---- 0.02 % Mg <0.02 -------- --------
EA029: Acidity - Acid Reacted Magnesium (a-23U) ---- 10 mole H+ / t <10 -------- --------
EA029: sulfidic - Acid Reacted Magnesium (s-23U) ---- 0.02 % S <0.02 -------- --------
EA029-E: Magnesium Values (QCLot: 1133580)
EA029: KCl Extractable Magnesium (23Sm) ---- 0.02 % Mg <0.02 -------- --------
EA029: Peroxide Magnesium (23Tm) ---- 0.02 % Mg <0.02 -------- --------
EA029: Acid Reacted Magnesium (23U) ---- 0.02 % Mg <0.02 -------- --------
EA029: Acidity - Acid Reacted Magnesium (a-23U) ---- 10 mole H+ / t <10 -------- --------
EA029: sulfidic - Acid Reacted Magnesium (s-23U) ---- 0.02 % S <0.02 -------- --------
EA033-A: Actual Acidity (QCLot: 1133579)
EA033: pH KCl (23A) ---- 0.1 pH Unit <0.1 -------- --------
EA033: Titratable Actual Acidity (23F) ---- 2 mole H+ / t <2 -------- --------
EA033: sulfidic - Titratable Actual Acidity (s-23F) ---- 0.02 % pyrite S <0.02 -------- --------
EA033-B: Potential Acidity (QCLot: 1133579)
EA033: Chromium Reducible Sulfur (22B) ---- 0.02 % S <0.02 -------- --------
EA033: acidity - Chromium Reducible Sulfur (a-22B) ---- 10 mole H+ / t <10 -------- --------
EA033-C: Acid Neutralising Capacity (QCLot: 1133579)
EA033: Acid Neutralising Capacity (19A2) ---- 0.01 % CaCO3 <0.01 -------- --------
EA033: acidity - Acid Neutralising Capacity (a-19A2) ---- 10 mole H+ / t <10 -------- --------
EA033: sulfidic - Acid Neutralising Capacity (s-19A2) ---- 0.01 % pyrite S <0.01 -------- --------
EA033-E: Acid Base Accounting (QCLot: 1133579)
EA033: ANC Fineness Factor ---- 0.5 <0.5 -------- --------
EA033: Net Acidity (sulfur units) ---- 0.02 % S <0.02 -------- --------
EA033: Net Acidity (acidity units) ---- 10 mole H+ / t <10 -------- --------
EA033: Liming Rate ---- 1 kg CaCO3/t <1 -------- --------
EA038: Acid Volatlile Sulfur (QCLot: 1142600)
EA038: Acid Volatile Sulfur ---- 0.001 % <0.001 105.15 % 13070

10 of 10:Page
Work Order :
:Client
EP0905867
ADVANCED ANALYTICAL AUSTRALIA
A09 3208:Project
Matrix Spike (MS) Report
The quality control term Matrix Spike (MS) refers to an intralaboratory split sample spiked with a representative set of target analytes. The purpose of this QC parameter is to monitor potential matrix effects on analyte
recoveries. Static Recovery Limits as per laboratory Data Quality Objectives (DQOs). Ideal recovery ranges stated may be waived in the event of sample matrix interference.
l No Matrix Spike (MS) Results are required to be reported.

EP0905867
False
CERTIFICATE OF ANALYSIS
Work Order : EP0905867 Page : 1 of 14
:: LaboratoryClient Environmental Division PerthADVANCED ANALYTICAL AUSTRALIA
: :ContactContact JANE STRUTHERS Michael Sharp
:: AddressAddress 7 FORREST AVENUE
EAST PERTH WA, AUSTRALIA 6004
10 Hod Way Malaga WA Australia 6090
:: E-mailE-mail [email protected] [email protected]
:: TelephoneTelephone 9325 9799 +61-8-9209 7655
:: FacsimileFacsimile 9325 4299 +61-8-9209 7600
:Project A09 3208 QC Level : NEPM 1999 Schedule B(3) and ALS QCS3 requirement
:Order number ----
:C-O-C number ---- Date Samples Received : 14-OCT-2009
Sampler : ---- Issue Date : 29-OCT-2009
Site : ----
30:No. of samples received
Quote number : ---- 30:No. of samples analysed
This report supersedes any previous report(s) with this reference. Results apply to the sample(s) as submitted. All pages of this report have been checked and approved for
release.
This Certificate of Analysis contains the following information:
l General Comments
l Analytical Results
NATA Accredited Laboratory 825
This document is issued in
accordance with NATA
accreditation requirements.
Accredited for compliance with
ISO/IEC 17025.
SignatoriesThis document has been electronically signed by the authorized signatories indicated below. Electronic signing has been
carried out in compliance with procedures specified in 21 CFR Part 11.
Signatories Accreditation CategoryPosition
Inorganics
Kim McCabe Senior Inorganic Chemist Inorganics
Stacey Hawkins Senior Chemist - Acid Sulphate Soils Perth ASS
Environmental Division Perth
10 Hod Way Malaga WA Australia 6090
Tel. +61-8-9209 7655 Fax. +61-8-9209 7600 www.alsglobal.com

2 of 14:Page
Work Order :
:Client
EP0905867
ADVANCED ANALYTICAL AUSTRALIA
A09 3208:Project
General Comments
The analytical procedures used by the Environmental Division have been developed from established internationally recognized procedures such as those published by the USEPA, APHA, AS and NEPM. In house
developed procedures are employed in the absence of documented standards or by client request.
Where moisture determination has been performed, results are reported on a dry weight basis.
Where a reported less than (<) result is higher than the LOR, this may be due to primary sample extract/digestate dilution and/or insuffient sample for analysis.
Where the LOR of a reported result differs from standard LOR, this may be due to high moisture content, insufficient sample (reduced weight employed) or matrix interference.
When date(s) and/or time(s) are shown bracketed, these have been assumed by the laboratory for processing purposes. If the sampling time is displayed as 0:00 the information was not provided by client.
CAS Number = CAS registry number from database maintained by Chemical Abstracts Services. The Chemical Abstracts Service is a division of the American Chemical Society.
LOR = Limit of reporting
^ = This result is computed from individual analyte detections at or above the level of reporting
Key :
Analysis of samples sieved to -75um is not covered by NATA accreditation.l
Liming rate is calculated and reported on a dry weight basis assuming use of fine agricultural lime (CaCO3) and using a safety factor of 1.5 to allow for non-homogeneous mixing and
poor reactivity of lime. For conversion of Liming Rate from 'kg/t dry weight' to 'kg/m3 in-situ soil', multiply 'reported results' x 'wet bulk density of soil in t/m3'.
l
Retained Acidity not required because pH KCl greater than or equal to 4.5l

3 of 14:Page
Work Order :
:Client
EP0905867
ADVANCED ANALYTICAL AUSTRALIA
A09 3208:Project
Analytical Results
A09/3208-10A09/3208-9A09/3208-7A09/3208-5A09/3208-1Client sample IDSub-Matrix: SOIL
14-OCT-2009 12:4014-OCT-2009 12:4014-OCT-2009 12:4014-OCT-2009 12:4014-OCT-2009 12:40Client sampling date / time
EP0905867-005EP0905867-004EP0905867-003EP0905867-002EP0905867-001UnitLORCAS NumberCompound
EA029-A: pH Measurements
9.39.4 9.3 9.4 9.4pH Unit0.1----pH KCl (23A)
8.38.3 8.1 8.5 8.2pH Unit0.1----pH OX (23B)
EA029-B: Acidity Trail<2<2 <2 <2 <2mole H+ / t2----Titratable Actual Acidity (23F)
<2<2 <2 <2 <2mole H+ / t2----Titratable Peroxide Acidity (23G)
<2<2 <2 <2 <2mole H+ / t2----Titratable Sulfidic Acidity (23H)
<0.02<0.02 <0.02 <0.02 <0.02% pyrite S0.02----sulfidic - Titratable Actual Acidity (s-23F)
<0.02<0.02 <0.02 <0.02 <0.02% pyrite S0.02----sulfidic - Titratable Peroxide Acidity
(s-23G)
<0.02<0.02 <0.02 <0.02 <0.02% pyrite S0.02----sulfidic - Titratable Sulfidic Acidity (s-23H)
EA029-C: Sulfur Trail
0.140.10 0.14 0.12 0.16% S0.02----KCl Extractable Sulfur (23Ce)
0.580.38 0.66 0.53 0.62% S0.02----Peroxide Sulfur (23De)
0.450.27 0.52 0.41 0.46% S0.02----Peroxide Oxidisable Sulfur (23E)
280171 321 256 287mole H+ / t10----acidity - Peroxide Oxidisable Sulfur
(a-23E)
EA029-D: Calcium Values
0.360.29 0.32 0.29 0.32% Ca0.02----KCl Extractable Calcium (23Vh)
24.624.8 24.6 21.1 22.9% Ca0.02----Peroxide Calcium (23Wh)
24.224.5 24.3 20.8 22.6% Ca0.02----Acid Reacted Calcium (23X)
1210012200 12100 10400 11300mole H+ / t10----acidity - Acid Reacted Calcium (a-23X)
19.419.6 19.4 16.6 18.1% S0.02----sulfidic - Acid Reacted Calcium (s-23X)
EA029-E: Magnesium Values
0.140.10 0.13 0.11 0.14% Mg0.02----KCl Extractable Magnesium (23Sm)
1.190.92 1.06 0.85 1.02% Mg0.02----Peroxide Magnesium (23Tm)
1.050.81 0.93 0.74 0.88% Mg0.02----Acid Reacted Magnesium (23U)
862670 766 607 725mole H+ / t10----Acidity - Acid Reacted Magnesium (a-23U)
1.381.07 1.23 0.97 1.16% S0.02----sulfidic - Acid Reacted Magnesium
(s-23U)
EA029-F: Excess Acid Neutralising Capacity
49.254.4 49.1 50.5 50.7% CaCO30.02----Excess Acid Neutralising Capacity (23Q)
983010800 9810 10100 10100mole H+ / t10----acidity - Excess Acid Neutralising
Capacity (a-23Q)
15.717.4 15.7 16.2 16.2% S0.02----sulfidic - Excess Acid Neutralising
Capacity (s-23Q)
EA029-H: Acid Base Accounting
1.51.5 1.5 1.5 1.5-0.5----ANC Fineness Factor

4 of 14:Page
Work Order :
:Client
EP0905867
ADVANCED ANALYTICAL AUSTRALIA
A09 3208:Project
Analytical Results
A09/3208-10A09/3208-9A09/3208-7A09/3208-5A09/3208-1Client sample IDSub-Matrix: SOIL
14-OCT-2009 12:4014-OCT-2009 12:4014-OCT-2009 12:4014-OCT-2009 12:4014-OCT-2009 12:40Client sampling date / time
EP0905867-005EP0905867-004EP0905867-003EP0905867-002EP0905867-001UnitLORCAS NumberCompound
EA029-H: Acid Base Accounting - Continued
<0.02<0.02 <0.02 <0.02 <0.02% S0.02----Net Acidity (sulfur units)
<10<10 <10 <10 <10mole H+ / t10----Net Acidity (acidity units)
<1<1 <1 <1 <1kg CaCO3/t1----Liming Rate
0.450.27 0.52 0.41 0.46% S0.02----Net Acidity excluding ANC (sulfur units)
280171 321 256 287mole H+ / t10----Net Acidity excluding ANC (acidity units)
2113 24 19 22kg CaCO3/t1----Liming Rate excluding ANC
EA033-A: Actual Acidity
9.39.4 9.3 9.4 9.4pH Unit0.1----pH KCl (23A)
<2<2 <2 <2 <2mole H+ / t2----Titratable Actual Acidity (23F)
<0.02<0.02 <0.02 <0.02 <0.02% pyrite S0.02----sulfidic - Titratable Actual Acidity (s-23F)
EA033-B: Potential Acidity
0.130.13 0.11 0.21 0.22% S0.02----Chromium Reducible Sulfur (22B)
8379 68 131 138mole H+ / t10----acidity - Chromium Reducible Sulfur
(a-22B)
EA033-C: Acid Neutralising Capacity
51.555.4 51.8 59.0 53.3% CaCO30.01----Acid Neutralising Capacity (19A2)
1030011100 10300 11800 10600mole H+ / t10----acidity - Acid Neutralising Capacity
(a-19A2)
16.517.8 16.6 18.9 17.1% pyrite S0.01----sulfidic - Acid Neutralising Capacity
(s-19A2)
EA033-E: Acid Base Accounting
1.51.5 1.5 1.5 2.5-0.5----ANC Fineness Factor
<0.02<0.02 <0.02 <0.02 <0.02% S0.02----Net Acidity (sulfur units)
<10<10 <10 <10 <10mole H+ / t10----Net Acidity (acidity units)
<1<1 <1 <1 <1kg CaCO3/t1----Liming Rate
0.130.13 0.11 0.21 0.22% S0.02----Net Acidity excluding ANC (sulfur units)
8379 68 131 138mole H+ / t10----Net Acidity excluding ANC (acidity units)
66 5 10 10kg CaCO3/t1----Liming Rate excluding ANC
EA038: Acid Volatlile Sulfur
0.002<0.001 <0.001 <0.001 <0.001%0.001----Acid Volatile Sulfur
EA055: Moisture Content
42.340.4 42.5 37.5 40.3%1.0----^ Moisture Content (dried @ 103°C)

5 of 14:Page
Work Order :
:Client
EP0905867
ADVANCED ANALYTICAL AUSTRALIA
A09 3208:Project
Analytical Results
A09/3208-17A09/3208-16A09/3208-15A09/3208-13A09/3208-12Client sample IDSub-Matrix: SOIL
14-OCT-2009 12:4014-OCT-2009 12:4014-OCT-2009 12:4014-OCT-2009 12:4014-OCT-2009 12:40Client sampling date / time
EP0905867-010EP0905867-009EP0905867-008EP0905867-007EP0905867-006UnitLORCAS NumberCompound
EA029-A: pH Measurements
9.49.4 9.4 9.4 9.4pH Unit0.1----pH KCl (23A)
8.38.4 8.4 8.3 8.5pH Unit0.1----pH OX (23B)
EA029-B: Acidity Trail<2<2 <2 <2 <2mole H+ / t2----Titratable Actual Acidity (23F)
<2<2 <2 <2 <2mole H+ / t2----Titratable Peroxide Acidity (23G)
<2<2 <2 <2 <2mole H+ / t2----Titratable Sulfidic Acidity (23H)
<0.02<0.02 <0.02 <0.02 <0.02% pyrite S0.02----sulfidic - Titratable Actual Acidity (s-23F)
<0.02<0.02 <0.02 <0.02 <0.02% pyrite S0.02----sulfidic - Titratable Peroxide Acidity
(s-23G)
<0.02<0.02 <0.02 <0.02 <0.02% pyrite S0.02----sulfidic - Titratable Sulfidic Acidity (s-23H)
EA029-C: Sulfur Trail
0.100.11 0.14 0.14 0.13% S0.02----KCl Extractable Sulfur (23Ce)
0.500.58 0.63 0.52 0.49% S0.02----Peroxide Sulfur (23De)
0.400.47 0.49 0.38 0.36% S0.02----Peroxide Oxidisable Sulfur (23E)
249294 305 238 226mole H+ / t10----acidity - Peroxide Oxidisable Sulfur
(a-23E)
EA029-D: Calcium Values
0.270.28 0.30 0.29 0.28% Ca0.02----KCl Extractable Calcium (23Vh)
22.124.8 25.2 22.2 22.6% Ca0.02----Peroxide Calcium (23Wh)
21.824.5 24.9 21.9 22.4% Ca0.02----Acid Reacted Calcium (23X)
1090012200 12400 11000 11200mole H+ / t10----acidity - Acid Reacted Calcium (a-23X)
17.519.6 19.9 17.6 17.9% S0.02----sulfidic - Acid Reacted Calcium (s-23X)
EA029-E: Magnesium Values
0.120.11 0.13 0.11 0.11% Mg0.02----KCl Extractable Magnesium (23Sm)
0.881.01 1.06 0.86 0.88% Mg0.02----Peroxide Magnesium (23Tm)
0.760.90 0.92 0.75 0.78% Mg0.02----Acid Reacted Magnesium (23U)
622744 760 615 638mole H+ / t10----Acidity - Acid Reacted Magnesium (a-23U)
1.001.19 1.22 0.99 1.02% S0.02----sulfidic - Acid Reacted Magnesium
(s-23U)
EA029-F: Excess Acid Neutralising Capacity
49.250.3 50.2 48.2 52.3% CaCO30.02----Excess Acid Neutralising Capacity (23Q)
982010000 10000 9620 10400mole H+ / t10----acidity - Excess Acid Neutralising
Capacity (a-23Q)
15.716.1 16.1 15.4 16.7% S0.02----sulfidic - Excess Acid Neutralising
Capacity (s-23Q)
EA029-H: Acid Base Accounting
1.51.5 1.5 1.5 1.5-0.5----ANC Fineness Factor

6 of 14:Page
Work Order :
:Client
EP0905867
ADVANCED ANALYTICAL AUSTRALIA
A09 3208:Project
Analytical Results
A09/3208-17A09/3208-16A09/3208-15A09/3208-13A09/3208-12Client sample IDSub-Matrix: SOIL
14-OCT-2009 12:4014-OCT-2009 12:4014-OCT-2009 12:4014-OCT-2009 12:4014-OCT-2009 12:40Client sampling date / time
EP0905867-010EP0905867-009EP0905867-008EP0905867-007EP0905867-006UnitLORCAS NumberCompound
EA029-H: Acid Base Accounting - Continued
<0.02<0.02 <0.02 <0.02 <0.02% S0.02----Net Acidity (sulfur units)
<10<10 <10 <10 <10mole H+ / t10----Net Acidity (acidity units)
<1<1 <1 <1 <1kg CaCO3/t1----Liming Rate
0.400.47 0.49 0.38 0.36% S0.02----Net Acidity excluding ANC (sulfur units)
249294 305 238 226mole H+ / t10----Net Acidity excluding ANC (acidity units)
1922 23 18 17kg CaCO3/t1----Liming Rate excluding ANC
EA033-A: Actual Acidity
9.49.4 9.4 9.4 9.4pH Unit0.1----pH KCl (23A)
<2<2 <2 <2 <2mole H+ / t2----Titratable Actual Acidity (23F)
<0.02<0.02 <0.02 <0.02 <0.02% pyrite S0.02----sulfidic - Titratable Actual Acidity (s-23F)
EA033-B: Potential Acidity
0.220.23 0.14 0.19 0.14% S0.02----Chromium Reducible Sulfur (22B)
136145 90 117 86mole H+ / t10----acidity - Chromium Reducible Sulfur
(a-22B)
EA033-C: Acid Neutralising Capacity
52.653.2 53.3 52.7 53.9% CaCO30.01----Acid Neutralising Capacity (19A2)
1050010600 10600 10500 10800mole H+ / t10----acidity - Acid Neutralising Capacity
(a-19A2)
16.817.0 17.1 16.9 17.3% pyrite S0.01----sulfidic - Acid Neutralising Capacity
(s-19A2)
EA033-E: Acid Base Accounting
4.53.5 5.5 6.5 7.5-0.5----ANC Fineness Factor
<0.02<0.02 <0.02 <0.02 <0.02% S0.02----Net Acidity (sulfur units)
<10<10 <10 <10 <10mole H+ / t10----Net Acidity (acidity units)
<1<1 <1 <1 <1kg CaCO3/t1----Liming Rate
0.220.23 0.14 0.19 0.14% S0.02----Net Acidity excluding ANC (sulfur units)
136145 90 117 86mole H+ / t10----Net Acidity excluding ANC (acidity units)
1011 7 9 6kg CaCO3/t1----Liming Rate excluding ANC
EA038: Acid Volatlile Sulfur<0.001<0.001 <0.001 <0.001 <0.001%0.001----Acid Volatile Sulfur
EA055: Moisture Content
42.242.2 39.5 37.1 37.9%1.0----^ Moisture Content (dried @ 103°C)

7 of 14:Page
Work Order :
:Client
EP0905867
ADVANCED ANALYTICAL AUSTRALIA
A09 3208:Project
Analytical Results
A09/3208-25A09/3208-24A09/3208-23A09/3208-20A09/3208-18Client sample IDSub-Matrix: SOIL
14-OCT-2009 12:4014-OCT-2009 12:4014-OCT-2009 12:4014-OCT-2009 12:4014-OCT-2009 12:40Client sampling date / time
EP0905867-015EP0905867-014EP0905867-013EP0905867-012EP0905867-011UnitLORCAS NumberCompound
EA029-A: pH Measurements
9.49.4 9.4 9.4 9.3pH Unit0.1----pH KCl (23A)
8.38.4 8.5 8.5 8.3pH Unit0.1----pH OX (23B)
EA029-B: Acidity Trail<2<2 <2 <2 <2mole H+ / t2----Titratable Actual Acidity (23F)
<2<2 <2 <2 <2mole H+ / t2----Titratable Peroxide Acidity (23G)
<2<2 <2 <2 <2mole H+ / t2----Titratable Sulfidic Acidity (23H)
<0.02<0.02 <0.02 <0.02 <0.02% pyrite S0.02----sulfidic - Titratable Actual Acidity (s-23F)
<0.02<0.02 <0.02 <0.02 <0.02% pyrite S0.02----sulfidic - Titratable Peroxide Acidity
(s-23G)
<0.02<0.02 <0.02 <0.02 <0.02% pyrite S0.02----sulfidic - Titratable Sulfidic Acidity (s-23H)
EA029-C: Sulfur Trail
0.130.11 0.12 0.08 0.17% S0.02----KCl Extractable Sulfur (23Ce)
0.530.44 0.49 0.44 0.47% S0.02----Peroxide Sulfur (23De)
0.400.34 0.37 0.36 0.31% S0.02----Peroxide Oxidisable Sulfur (23E)
250210 230 226 191mole H+ / t10----acidity - Peroxide Oxidisable Sulfur
(a-23E)
EA029-D: Calcium Values
0.260.28 0.26 0.23 0.33% Ca0.02----KCl Extractable Calcium (23Vh)
21.822.3 24.1 22.0 21.1% Ca0.02----Peroxide Calcium (23Wh)
21.622.0 23.8 21.8 20.8% Ca0.02----Acid Reacted Calcium (23X)
1080011000 11900 10900 10400mole H+ / t10----acidity - Acid Reacted Calcium (a-23X)
17.217.6 19.1 17.4 16.6% S0.02----sulfidic - Acid Reacted Calcium (s-23X)
EA029-E: Magnesium Values
0.110.09 0.08 0.10 0.17% Mg0.02----KCl Extractable Magnesium (23Sm)
0.910.83 0.94 0.83 0.92% Mg0.02----Peroxide Magnesium (23Tm)
0.800.74 0.85 0.73 0.76% Mg0.02----Acid Reacted Magnesium (23U)
658611 702 599 622mole H+ / t10----Acidity - Acid Reacted Magnesium (a-23U)
1.060.98 1.12 0.96 1.00% S0.02----sulfidic - Acid Reacted Magnesium
(s-23U)
EA029-F: Excess Acid Neutralising Capacity
49.451.6 52.3 49.3 48.5% CaCO30.02----Excess Acid Neutralising Capacity (23Q)
986010300 10400 9850 9680mole H+ / t10----acidity - Excess Acid Neutralising
Capacity (a-23Q)
15.816.5 16.7 15.8 15.5% S0.02----sulfidic - Excess Acid Neutralising
Capacity (s-23Q)
EA029-H: Acid Base Accounting
1.51.5 1.5 1.5 1.5-0.5----ANC Fineness Factor

8 of 14:Page
Work Order :
:Client
EP0905867
ADVANCED ANALYTICAL AUSTRALIA
A09 3208:Project
Analytical Results
A09/3208-25A09/3208-24A09/3208-23A09/3208-20A09/3208-18Client sample IDSub-Matrix: SOIL
14-OCT-2009 12:4014-OCT-2009 12:4014-OCT-2009 12:4014-OCT-2009 12:4014-OCT-2009 12:40Client sampling date / time
EP0905867-015EP0905867-014EP0905867-013EP0905867-012EP0905867-011UnitLORCAS NumberCompound
EA029-H: Acid Base Accounting - Continued
<0.02<0.02 <0.02 <0.02 <0.02% S0.02----Net Acidity (sulfur units)
<10<10 <10 <10 <10mole H+ / t10----Net Acidity (acidity units)
<1<1 <1 <1 <1kg CaCO3/t1----Liming Rate
0.400.34 0.37 0.36 0.31% S0.02----Net Acidity excluding ANC (sulfur units)
250210 230 226 191mole H+ / t10----Net Acidity excluding ANC (acidity units)
1916 17 17 14kg CaCO3/t1----Liming Rate excluding ANC
EA033-A: Actual Acidity
9.49.4 9.4 9.4 9.3pH Unit0.1----pH KCl (23A)
<2<2 <2 <2 <2mole H+ / t2----Titratable Actual Acidity (23F)
<0.02<0.02 <0.02 <0.02 <0.02% pyrite S0.02----sulfidic - Titratable Actual Acidity (s-23F)
EA033-B: Potential Acidity
0.210.17 0.22 0.11 0.17% S0.02----Chromium Reducible Sulfur (22B)
131109 134 69 105mole H+ / t10----acidity - Chromium Reducible Sulfur
(a-22B)
EA033-C: Acid Neutralising Capacity
53.654.3 54.7 53.0 51.4% CaCO30.01----Acid Neutralising Capacity (19A2)
1070010800 10900 10600 10300mole H+ / t10----acidity - Acid Neutralising Capacity
(a-19A2)
17.217.4 17.5 17.0 16.5% pyrite S0.01----sulfidic - Acid Neutralising Capacity
(s-19A2)
EA033-E: Acid Base Accounting
10.58.5 11.5 12.5 1.5-0.5----ANC Fineness Factor
<0.02<0.02 <0.02 <0.02 <0.02% S0.02----Net Acidity (sulfur units)
<10<10 <10 <10 <10mole H+ / t10----Net Acidity (acidity units)
<1<1 <1 <1 <1kg CaCO3/t1----Liming Rate
0.210.17 0.22 0.11 0.17% S0.02----Net Acidity excluding ANC (sulfur units)
131109 134 69 105mole H+ / t10----Net Acidity excluding ANC (acidity units)
108 10 5 8kg CaCO3/t1----Liming Rate excluding ANC
EA038: Acid Volatlile Sulfur
0.0010.001 0.001 <0.001 <0.001%0.001----Acid Volatile Sulfur
EA055: Moisture Content
38.336.5 36.2 38.6 42.3%1.0----^ Moisture Content (dried @ 103°C)

9 of 14:Page
Work Order :
:Client
EP0905867
ADVANCED ANALYTICAL AUSTRALIA
A09 3208:Project
Analytical Results
A09/3208-10
-75um
A09/3208-9
-75um
A09/3208-7
-75um
A09/3208-5
-75um
A09/3208-1
-75um
Client sample IDSub-Matrix: SOIL
14-OCT-2009 12:4014-OCT-2009 12:4014-OCT-2009 12:4014-OCT-2009 12:4014-OCT-2009 12:40Client sampling date / time
EP0905867-020EP0905867-019EP0905867-018EP0905867-017EP0905867-016UnitLORCAS NumberCompound
EA029-A: pH Measurements
9.39.3 9.4 9.3 9.4pH Unit0.1----pH KCl (23A)
8.38.6 8.6 8.3 8.6pH Unit0.1----pH OX (23B)
EA029-B: Acidity Trail<2<2 <2 <2 <2mole H+ / t2----Titratable Actual Acidity (23F)
<2<2 <2 <2 <2mole H+ / t2----Titratable Peroxide Acidity (23G)
<2<2 <2 <2 <2mole H+ / t2----Titratable Sulfidic Acidity (23H)
<0.02<0.02 <0.02 <0.02 <0.02% pyrite S0.02----sulfidic - Titratable Actual Acidity (s-23F)
<0.02<0.02 <0.02 <0.02 <0.02% pyrite S0.02----sulfidic - Titratable Peroxide Acidity
(s-23G)
<0.02<0.02 <0.02 <0.02 <0.02% pyrite S0.02----sulfidic - Titratable Sulfidic Acidity (s-23H)
EA029-C: Sulfur Trail
0.120.14 0.09 0.15 0.10% S0.02----KCl Extractable Sulfur (23Ce)
0.460.44 0.32 0.56 0.57% S0.02----Peroxide Sulfur (23De)
0.340.29 0.23 0.41 0.46% S0.02----Peroxide Oxidisable Sulfur (23E)
211184 146 255 289mole H+ / t10----acidity - Peroxide Oxidisable Sulfur
(a-23E)
EA029-D: Calcium Values
0.280.28 0.29 0.31 0.27% Ca0.02----KCl Extractable Calcium (23Vh)
19.918.4 20.0 20.3 22.5% Ca0.02----Peroxide Calcium (23Wh)
19.618.1 19.6 20.0 22.2% Ca0.02----Acid Reacted Calcium (23X)
98109040 9810 9980 11100mole H+ / t10----acidity - Acid Reacted Calcium (a-23X)
15.714.5 15.7 16.0 17.8% S0.02----sulfidic - Acid Reacted Calcium (s-23X)
EA029-E: Magnesium Values
0.130.14 0.11 0.12 0.09% Mg0.02----KCl Extractable Magnesium (23Sm)
1.030.98 0.84 0.94 0.98% Mg0.02----Peroxide Magnesium (23Tm)
0.900.84 0.74 0.82 0.89% Mg0.02----Acid Reacted Magnesium (23U)
740689 606 673 735mole H+ / t10----Acidity - Acid Reacted Magnesium (a-23U)
1.191.10 0.97 1.08 1.18% S0.02----sulfidic - Acid Reacted Magnesium
(s-23U)
EA029-F: Excess Acid Neutralising Capacity
48.650.4 51.4 48.8 49.4% CaCO30.02----Excess Acid Neutralising Capacity (23Q)
970010100 10300 9750 9870mole H+ / t10----acidity - Excess Acid Neutralising
Capacity (a-23Q)
15.516.1 16.4 15.6 15.8% S0.02----sulfidic - Excess Acid Neutralising
Capacity (s-23Q)
EA029-H: Acid Base Accounting

10 of 14:Page
Work Order :
:Client
EP0905867
ADVANCED ANALYTICAL AUSTRALIA
A09 3208:Project
Analytical Results
A09/3208-10
-75um
A09/3208-9
-75um
A09/3208-7
-75um
A09/3208-5
-75um
A09/3208-1
-75um
Client sample IDSub-Matrix: SOIL
14-OCT-2009 12:4014-OCT-2009 12:4014-OCT-2009 12:4014-OCT-2009 12:4014-OCT-2009 12:40Client sampling date / time
EP0905867-020EP0905867-019EP0905867-018EP0905867-017EP0905867-016UnitLORCAS NumberCompound
EA029-H: Acid Base Accounting - Continued
1.51.5 1.5 1.5 1.5-0.5----ANC Fineness Factor
<0.02<0.02 <0.02 <0.02 <0.02% S0.02----Net Acidity (sulfur units)
<10<10 <10 <10 <10mole H+ / t10----Net Acidity (acidity units)
<1<1 <1 <1 <1kg CaCO3/t1----Liming Rate
0.340.29 0.23 0.41 0.46% S0.02----Net Acidity excluding ANC (sulfur units)
211184 146 255 289mole H+ / t10----Net Acidity excluding ANC (acidity units)
1614 11 19 22kg CaCO3/t1----Liming Rate excluding ANC

11 of 14:Page
Work Order :
:Client
EP0905867
ADVANCED ANALYTICAL AUSTRALIA
A09 3208:Project
Analytical Results
A09/3208-17
-75um
A09/3208-16
-75um
A09/3208-15
-75um
A09/3208-13
-75um
A09/3208-12
-75um
Client sample IDSub-Matrix: SOIL
14-OCT-2009 12:4014-OCT-2009 12:4014-OCT-2009 12:4014-OCT-2009 12:4014-OCT-2009 12:40Client sampling date / time
EP0905867-025EP0905867-024EP0905867-023EP0905867-022EP0905867-021UnitLORCAS NumberCompound
EA029-A: pH Measurements
9.39.3 9.3 9.3 9.4pH Unit0.1----pH KCl (23A)
8.58.2 8.0 8.5 8.6pH Unit0.1----pH OX (23B)
EA029-B: Acidity Trail<2<2 <2 <2 <2mole H+ / t2----Titratable Actual Acidity (23F)
<2<2 <2 <2 <2mole H+ / t2----Titratable Peroxide Acidity (23G)
<2<2 <2 <2 <2mole H+ / t2----Titratable Sulfidic Acidity (23H)
<0.02<0.02 <0.02 <0.02 <0.02% pyrite S0.02----sulfidic - Titratable Actual Acidity (s-23F)
<0.02<0.02 <0.02 <0.02 <0.02% pyrite S0.02----sulfidic - Titratable Peroxide Acidity
(s-23G)
<0.02<0.02 <0.02 <0.02 <0.02% pyrite S0.02----sulfidic - Titratable Sulfidic Acidity (s-23H)
EA029-C: Sulfur Trail
0.100.12 0.14 0.12 0.12% S0.02----KCl Extractable Sulfur (23Ce)
0.480.55 0.52 0.48 0.47% S0.02----Peroxide Sulfur (23De)
0.380.43 0.39 0.35 0.35% S0.02----Peroxide Oxidisable Sulfur (23E)
238269 241 220 221mole H+ / t10----acidity - Peroxide Oxidisable Sulfur
(a-23E)
EA029-D: Calcium Values
0.230.25 0.27 0.29 0.26% Ca0.02----KCl Extractable Calcium (23Vh)
20.620.3 19.1 16.9 18.8% Ca0.02----Peroxide Calcium (23Wh)
20.420.0 18.9 16.6 18.6% Ca0.02----Acid Reacted Calcium (23X)
102009990 9420 8290 9280mole H+ / t10----acidity - Acid Reacted Calcium (a-23X)
16.316.0 15.1 13.3 14.9% S0.02----sulfidic - Acid Reacted Calcium (s-23X)
EA029-E: Magnesium Values
0.090.10 0.12 0.12 0.09% Mg0.02----KCl Extractable Magnesium (23Sm)
0.810.92 0.91 0.86 0.96% Mg0.02----Peroxide Magnesium (23Tm)
0.720.81 0.79 0.75 0.87% Mg0.02----Acid Reacted Magnesium (23U)
591670 652 614 717mole H+ / t10----Acidity - Acid Reacted Magnesium (a-23U)
0.951.07 1.04 0.98 1.15% S0.02----sulfidic - Acid Reacted Magnesium
(s-23U)
EA029-F: Excess Acid Neutralising Capacity
48.049.1 49.6 48.4 49.0% CaCO30.02----Excess Acid Neutralising Capacity (23Q)
95909810 9910 9670 9790mole H+ / t10----acidity - Excess Acid Neutralising
Capacity (a-23Q)
15.415.7 15.9 15.5 15.7% S0.02----sulfidic - Excess Acid Neutralising
Capacity (s-23Q)
EA029-H: Acid Base Accounting

12 of 14:Page
Work Order :
:Client
EP0905867
ADVANCED ANALYTICAL AUSTRALIA
A09 3208:Project
Analytical Results
A09/3208-17
-75um
A09/3208-16
-75um
A09/3208-15
-75um
A09/3208-13
-75um
A09/3208-12
-75um
Client sample IDSub-Matrix: SOIL
14-OCT-2009 12:4014-OCT-2009 12:4014-OCT-2009 12:4014-OCT-2009 12:4014-OCT-2009 12:40Client sampling date / time
EP0905867-025EP0905867-024EP0905867-023EP0905867-022EP0905867-021UnitLORCAS NumberCompound
EA029-H: Acid Base Accounting - Continued
1.51.5 1.5 1.5 1.5-0.5----ANC Fineness Factor
<0.02<0.02 <0.02 <0.02 <0.02% S0.02----Net Acidity (sulfur units)
<10<10 <10 <10 <10mole H+ / t10----Net Acidity (acidity units)
<1<1 <1 <1 <1kg CaCO3/t1----Liming Rate
0.380.43 0.39 0.35 0.35% S0.02----Net Acidity excluding ANC (sulfur units)
238269 241 220 221mole H+ / t10----Net Acidity excluding ANC (acidity units)
1820 18 16 16kg CaCO3/t1----Liming Rate excluding ANC

13 of 14:Page
Work Order :
:Client
EP0905867
ADVANCED ANALYTICAL AUSTRALIA
A09 3208:Project
Analytical Results
A09/3208-25
-75um
A09/3208-24
-75um
A09/3208-23
-75um
A09/3208-20
-75um
A09/3208-18
-75um
Client sample IDSub-Matrix: SOIL
14-OCT-2009 12:4014-OCT-2009 12:4014-OCT-2009 12:4014-OCT-2009 12:4014-OCT-2009 12:40Client sampling date / time
EP0905867-030EP0905867-029EP0905867-028EP0905867-027EP0905867-026UnitLORCAS NumberCompound
EA029-A: pH Measurements
9.39.4 9.3 9.4 9.3pH Unit0.1----pH KCl (23A)
8.58.3 8.3 8.6 8.4pH Unit0.1----pH OX (23B)
EA029-B: Acidity Trail<2<2 <2 <2 <2mole H+ / t2----Titratable Actual Acidity (23F)
<2<2 <2 <2 <2mole H+ / t2----Titratable Peroxide Acidity (23G)
<2<2 <2 <2 <2mole H+ / t2----Titratable Sulfidic Acidity (23H)
<0.02<0.02 <0.02 <0.02 <0.02% pyrite S0.02----sulfidic - Titratable Actual Acidity (s-23F)
<0.02<0.02 <0.02 <0.02 <0.02% pyrite S0.02----sulfidic - Titratable Peroxide Acidity
(s-23G)
<0.02<0.02 <0.02 <0.02 <0.02% pyrite S0.02----sulfidic - Titratable Sulfidic Acidity (s-23H)
EA029-C: Sulfur Trail
0.180.15 0.18 0.14 0.11% S0.02----KCl Extractable Sulfur (23Ce)
0.570.57 0.58 0.50 0.44% S0.02----Peroxide Sulfur (23De)
0.390.43 0.40 0.35 0.33% S0.02----Peroxide Oxidisable Sulfur (23E)
246266 247 221 207mole H+ / t10----acidity - Peroxide Oxidisable Sulfur
(a-23E)
EA029-D: Calcium Values
0.300.31 0.31 0.26 0.28% Ca0.02----KCl Extractable Calcium (23Vh)
18.322.1 18.9 21.1 21.2% Ca0.02----Peroxide Calcium (23Wh)
18.021.8 18.6 20.8 21.0% Ca0.02----Acid Reacted Calcium (23X)
900010900 9270 10400 10500mole H+ / t10----acidity - Acid Reacted Calcium (a-23X)
14.417.4 14.9 16.6 16.8% S0.02----sulfidic - Acid Reacted Calcium (s-23X)
EA029-E: Magnesium Values
0.150.12 0.15 0.12 0.10% Mg0.02----KCl Extractable Magnesium (23Sm)
1.001.07 0.90 0.99 0.87% Mg0.02----Peroxide Magnesium (23Tm)
0.850.95 0.74 0.86 0.77% Mg0.02----Acid Reacted Magnesium (23U)
700784 613 712 635mole H+ / t10----Acidity - Acid Reacted Magnesium (a-23U)
1.121.26 0.98 1.14 1.02% S0.02----sulfidic - Acid Reacted Magnesium
(s-23U)
EA029-F: Excess Acid Neutralising Capacity
47.850.4 47.0 50.6 51.3% CaCO30.02----Excess Acid Neutralising Capacity (23Q)
954010100 9400 10100 10200mole H+ / t10----acidity - Excess Acid Neutralising
Capacity (a-23Q)
15.316.1 15.0 16.2 16.4% S0.02----sulfidic - Excess Acid Neutralising
Capacity (s-23Q)
EA029-H: Acid Base Accounting

14 of 14:Page
Work Order :
:Client
EP0905867
ADVANCED ANALYTICAL AUSTRALIA
A09 3208:Project
Analytical Results
A09/3208-25
-75um
A09/3208-24
-75um
A09/3208-23
-75um
A09/3208-20
-75um
A09/3208-18
-75um
Client sample IDSub-Matrix: SOIL
14-OCT-2009 12:4014-OCT-2009 12:4014-OCT-2009 12:4014-OCT-2009 12:4014-OCT-2009 12:40Client sampling date / time
EP0905867-030EP0905867-029EP0905867-028EP0905867-027EP0905867-026UnitLORCAS NumberCompound
EA029-H: Acid Base Accounting - Continued
1.51.5 1.5 1.5 1.5-0.5----ANC Fineness Factor
<0.02<0.02 <0.02 <0.02 <0.02% S0.02----Net Acidity (sulfur units)
<10<10 <10 <10 <10mole H+ / t10----Net Acidity (acidity units)
<1<1 <1 <1 <1kg CaCO3/t1----Liming Rate
0.390.43 0.40 0.35 0.33% S0.02----Net Acidity excluding ANC (sulfur units)
246266 247 221 207mole H+ / t10----Net Acidity excluding ANC (acidity units)
1820 18 16 16kg CaCO3/t1----Liming Rate excluding ANC

REPORT OF ANALYSISREPORT OF ANALYSIS
Laboratory Reference:Laboratory Reference: A09/3208-AA09/3208-A
Order No:Order No:Client:Client: WorleyParsons Services Pty LtdWorleyParsons Services Pty Ltd
Level 7, QV1 Building, 250 St Georges TceLevel 7, QV1 Building, 250 St Georges Tce Project:Project: Marine Services Facility - SedimentMarine Services Facility - Sediment
Perth WA 6000Perth WA 6000 Sample Type:Sample Type: SedimentSediment
No. of Samples:No. of Samples: 2828
Contact:Contact: Peter MellorPeter Mellor Date Received:Date Received: 13/10/0913/10/09
Date Completed:Date Completed: 4/11/20094/11/2009
Laboratory Contact Details:Laboratory Contact Details:
Client Services Manager:Client Services Manager: Jane StruthersJane Struthers
Technical Enquiries:Technical Enquiries: Andrew BradburyAndrew Bradbury
Telephone:Telephone: +61 8 9325 9799+61 8 9325 9799
Fax:Fax: +61 8 9325 4299+61 8 9325 4299
Email:Email: [email protected]@advancedanalytical.com.au
[email protected]@advancedanalytical.com.au
Attached Results Approved By:Attached Results Approved By:
Comments:Comments:
All samples tested as submitted by client. All attached results have been checked and approved for release.All samples tested as submitted by client. All attached results have been checked and approved for release.
This is the Final Report and supersedes any reports previously issued with this batch number.This is the Final Report and supersedes any reports previously issued with this batch number.
This document is issued in accordance with NATA's accreditation requirements. Accredited for complianceThis document is issued in accordance with NATA's accreditation requirements. Accredited for compliance
with ISO/IEC 17025. This document shall not be reproduced, except in full.with ISO/IEC 17025. This document shall not be reproduced, except in full.
Page 1 of 18Page 1 of 184 November 20094 November 2009Issue Date:Issue Date:
Advanced Analytical Australia Pty ltdAdvanced Analytical Australia Pty ltd Ph: + 61 2 9888 9077Ph: + 61 2 9888 9077
ABN 20 105 644 979ABN 20 105 644 979 Fax: + 61 2 9888 9577Fax: + 61 2 9888 9577
11 Julius Avenue,11 Julius Avenue, [email protected]@advancedanalytical.com.au
North Ryde NSW 2113 AustraliaNorth Ryde NSW 2113 Australia www.advancedanalytical.com.auwww.advancedanalytical.com.au

Batch Number:Batch Number: A09/3208-AA09/3208-A
Project Reference:Project Reference: Marine Services Facility - SedimentMarine Services Facility - Sediment
Laboratory Reference: - - 1 2 3 4
Client Reference: - - BP1103-0.0 BP1103-1.0 BP1108-0.0-2 BP1108-0.0-3
Date Sampled: - - 12/10/09 12/10/09 12/10/09 12/10/09
Analysis Description Method Units
Moisture Content
Moisture Content 04-004 % 28.7 27.9 29.6 29.9
Trace Elements
Silver 04-001 mg/kg <0.1 <0.1 <0.1 <0.1
Arsenic 04-001 mg/kg 14 14 14 14
Cadmium 04-001 mg/kg 0.18 0.16 0.17 0.17
Chromium 04-001 mg/kg 35 35 34 35
Copper 04-001 mg/kg 11 12 11 11
Mercury 04-002 mg/kg <0.01 <0.01 <0.01 <0.01
Nickel 04-001 mg/kg 13 13 12 13
Phosphorus 04-001 mg/kg 380 370 380 370
Lead 04-001 mg/kg 3.2 3.2 3.2 3.1
Zinc 04-001 mg/kg 16 15 15 15
Total Petroleum Hydrocarbons
TPH C6-C9 04-021 mg/kg <10 <10 <10 <10
TPH C10-14 04-020 mg/kg <10 <10 <10 <10
TPH C15-28 04-020 mg/kg <50 <50 <50 <50
TPH C29-36 04-020 mg/kg <50 <50 <50 <50
Surrogate Recovery 04-020 % 81 85 82 94
Date Extracted 04-020 - 19/10/2009 19/10/2009 19/10/2009 19/10/2009
Date Analysed 04-020 - 26/10/2009 26/10/2009 26/10/2009 26/10/2009
Poly Aromatic Hydrocarbons
Naphthalene 04-022 µg/kg <5 <5 <5 <5
1-Methylnaphthalene 04-022 µg/kg <5 <5 <5 <5
2-Methylnaphthalene 04-022 µg/kg <5 <5 <5 <5
Acenaphthylene 04-022 µg/kg <5 <5 <5 <5
Acenaphthene 04-022 µg/kg <5 <5 <5 <5
Fluorene 04-022 µg/kg <5 <5 <5 <5
Phenanthrene 04-022 µg/kg <5 <5 <5 <5
Anthracene 04-022 µg/kg <5 <5 <5 <5
Fluoranthene 04-022 µg/kg <5 <5 6 <5
Pyrene 04-022 µg/kg <5 <5 <5 <5
Benz(a)anthracene 04-022 µg/kg <5 <5 <5 <5
Page 2 of 18Page 2 of 184 November 20094 November 2009Issue Date:Issue Date:
Advanced Analytical Australia Pty ltdAdvanced Analytical Australia Pty ltd Ph: + 61 2 9888 9077Ph: + 61 2 9888 9077
ABN 20 105 644 979ABN 20 105 644 979 Fax: + 61 2 9888 9577Fax: + 61 2 9888 9577
11 Julius Avenue,11 Julius Avenue, [email protected]@advancedanalytical.com.au
North Ryde NSW 2113 AustraliaNorth Ryde NSW 2113 Australia www.advancedanalytical.com.auwww.advancedanalytical.com.au

Batch Number:Batch Number: A09/3208-AA09/3208-A
Project Reference:Project Reference: Marine Services Facility - SedimentMarine Services Facility - Sediment
Laboratory Reference: - - 1 2 3 4
Client Reference: - - BP1103-0.0 BP1103-1.0 BP1108-0.0-2 BP1108-0.0-3
Date Sampled: - - 12/10/09 12/10/09 12/10/09 12/10/09
Analysis Description Method Units
Chrysene 04-022 µg/kg <5 <5 <5 <5
Benzo(b)&(k)fluoranthene 04-022 µg/kg <10 <10 <10 <10
Benzo(a)pyrene 04-022 µg/kg <5 <5 <5 <5
Indeno(1,2,3-cd)pyrene 04-022 µg/kg <5 <5 <5 <5
Dibenz(a,h)anthracene 04-022 µg/kg <5 <5 <5 <5
Benzo(g,h,i)perylene 04-022 µg/kg <5 <5 <5 <5
Coronene 04-022 µg/kg <10 <10 <10 <10
Benzo(e)pyrene 04-022 µg/kg <5 <5 <5 <5
Total PAHs (as above) 04-022 µg/kg <100 <100 <100 <100
Surrogate 1 Recovery 04-022 % 74 76 81 85
Surrogate 2 Recovery 04-022 % 85 87 91 98
Surrogate 3 Recovery 04-022 % 97 98 101 110
Date Extracted 04-022 - 19/10/2009 19/10/2009 19/10/2009 19/10/2009
Date Analysed 04-022 - 26/10/2009 26/10/2009 26/10/2009 26/10/2009
Organotins
Monobutyl tin 04-026 µgSn/kg <0.50 <0.50 <0.50 <0.50
Dibutyl tin 04-026 µgSn/kg <0.50 <0.50 <0.50 <0.50
Tributyl tin 04-026 µgSn/kg <0.50 <0.50 <0.50 <0.50
Surrogate 1 Recovery 04-026 % 99 103 109 97
Date Extracted 04-026 - 21/10/2009 21/10/2009 21/10/2009 21/10/2009
Date Analysed 04-026 - 21/10/2009 21/10/2009 21/10/2009 21/10/2009
Subcontract Analysis
Total Organic Carbon SUB % 4.3 4.9 4.1 4.6
Nitrate as N SUB mg/kg <0.1 <0.1 <0.1 <0.1
Nitrite as N SUB mg/kg <0.1 <0.1 <0.1 <0.1
Total Kjeldahl Nitrogen SUB mg/kg 230 150 230 210
Total Ammonia as N SUB mg/kg 4.0 2.0 4.5 2.5
Total Nitrogen SUB mg/kg 230 150 230 210
SPOCAS SUB See attached
reports
See attached
reports
See attached
reports
See attached
reports
Page 3 of 18Page 3 of 184 November 20094 November 2009Issue Date:Issue Date:
Advanced Analytical Australia Pty ltdAdvanced Analytical Australia Pty ltd Ph: + 61 2 9888 9077Ph: + 61 2 9888 9077
ABN 20 105 644 979ABN 20 105 644 979 Fax: + 61 2 9888 9577Fax: + 61 2 9888 9577
11 Julius Avenue,11 Julius Avenue, [email protected]@advancedanalytical.com.au
North Ryde NSW 2113 AustraliaNorth Ryde NSW 2113 Australia www.advancedanalytical.com.auwww.advancedanalytical.com.au

Batch Number:Batch Number: A09/3208-AA09/3208-A
Project Reference:Project Reference: Marine Services Facility - SedimentMarine Services Facility - Sediment
Laboratory Reference: - - 5 6 7 8
Client Reference: - - DA1607-0.0 DA1607-1.0 DA2009-0.0 DA2009-1.0
Date Sampled: - - 12/10/09 12/10/09 12/10/09 12/10/09
Analysis Description Method Units
Moisture Content
Moisture Content 04-004 % 47.7 31.1 48.4 26.8
Trace Elements
Silver 04-001 mg/kg <0.1 <0.1 <0.1 <0.1
Arsenic 04-001 mg/kg 2.5 1.1 2.5 1.1
Cadmium 04-001 mg/kg <0.1 0.11 <0.1 <0.1
Chromium 04-001 mg/kg 26 7.8 26 2.3
Copper 04-001 mg/kg 7.3 1.6 7.3 0.76
Mercury 04-002 mg/kg <0.01 <0.01 <0.01 <0.01
Nickel 04-001 mg/kg 11 2.6 11 1.2
Phosphorus 04-001 mg/kg 310 67 310 33
Lead 04-001 mg/kg 3.9 2.8 3.9 1.4
Zinc 04-001 mg/kg 8.7 7.2 9.9 1.7
Total Petroleum Hydrocarbons
TPH C6-C9 04-021 mg/kg [NA] [NA] <10 <10
TPH C10-14 04-020 mg/kg [NA] [NA] <10 <10
TPH C15-28 04-020 mg/kg [NA] [NA] <50 <50
TPH C29-36 04-020 mg/kg [NA] [NA] <50 <50
Surrogate Recovery 04-020 % [NA] [NA] 96 89
Date Extracted 04-020 - [NA] [NA] 19/10/2009 19/10/2009
Date Analysed 04-020 - [NA] [NA] 26/10/2009 26/10/2009
Poly Aromatic Hydrocarbons
Naphthalene 04-022 µg/kg [NA] [NA] <5 <5
1-Methylnaphthalene 04-022 µg/kg [NA] [NA] <5 <5
2-Methylnaphthalene 04-022 µg/kg [NA] [NA] <5 <5
Acenaphthylene 04-022 µg/kg [NA] [NA] <5 <5
Acenaphthene 04-022 µg/kg [NA] [NA] <5 <5
Fluorene 04-022 µg/kg [NA] [NA] <5 <5
Phenanthrene 04-022 µg/kg [NA] [NA] <5 <5
Anthracene 04-022 µg/kg [NA] [NA] <5 <5
Fluoranthene 04-022 µg/kg [NA] [NA] <5 <5
Pyrene 04-022 µg/kg [NA] [NA] <5 <5
Benz(a)anthracene 04-022 µg/kg [NA] [NA] <5 <5
Page 4 of 18Page 4 of 184 November 20094 November 2009Issue Date:Issue Date:
Advanced Analytical Australia Pty ltdAdvanced Analytical Australia Pty ltd Ph: + 61 2 9888 9077Ph: + 61 2 9888 9077
ABN 20 105 644 979ABN 20 105 644 979 Fax: + 61 2 9888 9577Fax: + 61 2 9888 9577
11 Julius Avenue,11 Julius Avenue, [email protected]@advancedanalytical.com.au
North Ryde NSW 2113 AustraliaNorth Ryde NSW 2113 Australia www.advancedanalytical.com.auwww.advancedanalytical.com.au
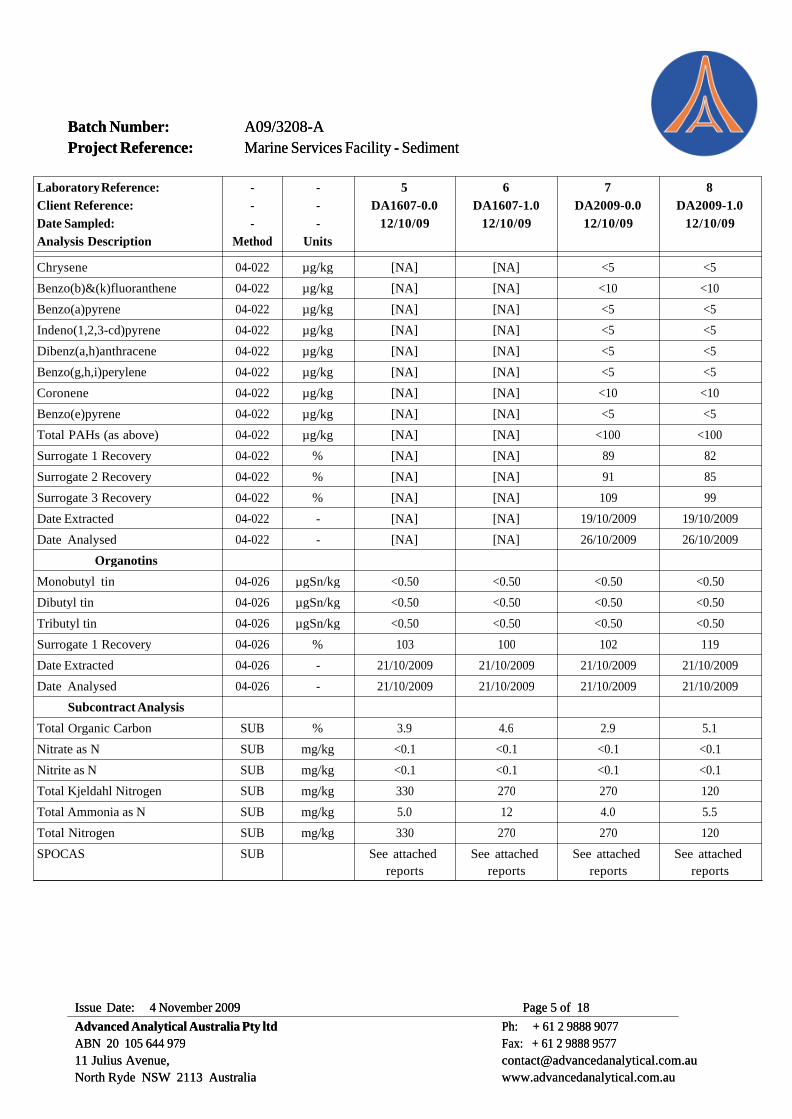
Batch Number:Batch Number: A09/3208-AA09/3208-A
Project Reference:Project Reference: Marine Services Facility - SedimentMarine Services Facility - Sediment
Laboratory Reference: - - 5 6 7 8
Client Reference: - - DA1607-0.0 DA1607-1.0 DA2009-0.0 DA2009-1.0
Date Sampled: - - 12/10/09 12/10/09 12/10/09 12/10/09
Analysis Description Method Units
Chrysene 04-022 µg/kg [NA] [NA] <5 <5
Benzo(b)&(k)fluoranthene 04-022 µg/kg [NA] [NA] <10 <10
Benzo(a)pyrene 04-022 µg/kg [NA] [NA] <5 <5
Indeno(1,2,3-cd)pyrene 04-022 µg/kg [NA] [NA] <5 <5
Dibenz(a,h)anthracene 04-022 µg/kg [NA] [NA] <5 <5
Benzo(g,h,i)perylene 04-022 µg/kg [NA] [NA] <5 <5
Coronene 04-022 µg/kg [NA] [NA] <10 <10
Benzo(e)pyrene 04-022 µg/kg [NA] [NA] <5 <5
Total PAHs (as above) 04-022 µg/kg [NA] [NA] <100 <100
Surrogate 1 Recovery 04-022 % [NA] [NA] 89 82
Surrogate 2 Recovery 04-022 % [NA] [NA] 91 85
Surrogate 3 Recovery 04-022 % [NA] [NA] 109 99
Date Extracted 04-022 - [NA] [NA] 19/10/2009 19/10/2009
Date Analysed 04-022 - [NA] [NA] 26/10/2009 26/10/2009
Organotins
Monobutyl tin 04-026 µgSn/kg <0.50 <0.50 <0.50 <0.50
Dibutyl tin 04-026 µgSn/kg <0.50 <0.50 <0.50 <0.50
Tributyl tin 04-026 µgSn/kg <0.50 <0.50 <0.50 <0.50
Surrogate 1 Recovery 04-026 % 103 100 102 119
Date Extracted 04-026 - 21/10/2009 21/10/2009 21/10/2009 21/10/2009
Date Analysed 04-026 - 21/10/2009 21/10/2009 21/10/2009 21/10/2009
Subcontract Analysis
Total Organic Carbon SUB % 3.9 4.6 2.9 5.1
Nitrate as N SUB mg/kg <0.1 <0.1 <0.1 <0.1
Nitrite as N SUB mg/kg <0.1 <0.1 <0.1 <0.1
Total Kjeldahl Nitrogen SUB mg/kg 330 270 270 120
Total Ammonia as N SUB mg/kg 5.0 12 4.0 5.5
Total Nitrogen SUB mg/kg 330 270 270 120
SPOCAS SUB See attached
reports
See attached
reports
See attached
reports
See attached
reports
Page 5 of 18Page 5 of 184 November 20094 November 2009Issue Date:Issue Date:
Advanced Analytical Australia Pty ltdAdvanced Analytical Australia Pty ltd Ph: + 61 2 9888 9077Ph: + 61 2 9888 9077
ABN 20 105 644 979ABN 20 105 644 979 Fax: + 61 2 9888 9577Fax: + 61 2 9888 9577
11 Julius Avenue,11 Julius Avenue, [email protected]@advancedanalytical.com.au
North Ryde NSW 2113 AustraliaNorth Ryde NSW 2113 Australia www.advancedanalytical.com.auwww.advancedanalytical.com.au

Batch Number:Batch Number: A09/3208-AA09/3208-A
Project Reference:Project Reference: Marine Services Facility - SedimentMarine Services Facility - Sediment
Laboratory Reference: - - 9 10 11 12
Client Reference: - - DA2204 DA2304-0.0 DA2304-1.0 DA2305
Date Sampled: - - 12/10/09 12/10/09 12/10/09 12/10/09
Analysis Description Method Units
Moisture Content
Moisture Content 04-004 % 38.1 37.3 23.4 39.8
Trace Elements
Silver 04-001 mg/kg <0.1 <0.1 <0.1 <0.1
Arsenic 04-001 mg/kg 2.9 12 21 12
Cadmium 04-001 mg/kg <0.1 0.16 0.26 0.17
Chromium 04-001 mg/kg 17 47 18 51
Copper 04-001 mg/kg 4.7 11 3.4 13
Mercury 04-002 mg/kg <0.01 <0.01 <0.01 <0.01
Nickel 04-001 mg/kg 6.8 17 4.9 18
Phosphorus 04-001 mg/kg 270 410 530 410
Lead 04-001 mg/kg 3.3 3.3 1.8 3.3
Zinc 04-001 mg/kg 5.5 14 6.7 15
Total Petroleum Hydrocarbons
Poly Aromatic Hydrocarbons
Organotins
Monobutyl tin 04-026 µgSn/kg <0.50 <0.50 <0.50 <0.50
Dibutyl tin 04-026 µgSn/kg <0.50 <0.50 <0.50 <0.50
Tributyl tin 04-026 µgSn/kg <0.50 <0.50 <0.50 <0.50
Surrogate 1 Recovery 04-026 % 105 107 119 108
Date Extracted 04-026 - 21/10/2009 21/10/2009 21/10/2009 21/10/2009
Date Analysed 04-026 - 21/10/2009 21/10/2009 21/10/2009 21/10/2009
Subcontract Analysis
Total Organic Carbon SUB % 4.2 3.2 4.6 4.2
Nitrate as N SUB mg/kg <0.1 <0.1 <0.1 <0.1
Nitrite as N SUB mg/kg <0.1 <0.1 <0.1 <0.1
Total Kjeldahl Nitrogen SUB mg/kg 120 120 140 140
Total Ammonia as N SUB mg/kg 4.0 3.5 9.5 4.0
Total Nitrogen SUB mg/kg 120 120 140 140
SPOCAS SUB See attached
reports
See attached
reports
See attached
reports
See attached
reports
Page 6 of 18Page 6 of 184 November 20094 November 2009Issue Date:Issue Date:
Advanced Analytical Australia Pty ltdAdvanced Analytical Australia Pty ltd Ph: + 61 2 9888 9077Ph: + 61 2 9888 9077
ABN 20 105 644 979ABN 20 105 644 979 Fax: + 61 2 9888 9577Fax: + 61 2 9888 9577
11 Julius Avenue,11 Julius Avenue, [email protected]@advancedanalytical.com.au
North Ryde NSW 2113 AustraliaNorth Ryde NSW 2113 Australia www.advancedanalytical.com.auwww.advancedanalytical.com.au

Batch Number:Batch Number: A09/3208-AA09/3208-A
Project Reference:Project Reference: Marine Services Facility - SedimentMarine Services Facility - Sediment
Laboratory Reference: - - 13 14 15 16
Client Reference: - - DA2306-0.0 DA2306-1.0 DA2404 DA2602
Date Sampled: - - 12/10/09 12/10/09 12/10/09 12/10/09
Analysis Description Method Units
Moisture Content
Moisture Content 04-004 % 42.1 41.5 37.1 33.8
Trace Elements
Silver 04-001 mg/kg <0.1 <0.1 <0.1 <0.1
Arsenic 04-001 mg/kg 12 14 12 13
Cadmium 04-001 mg/kg 0.16 0.17 0.17 0.17
Chromium 04-001 mg/kg 57 59 47 40
Copper 04-001 mg/kg 14 16 11 9.5
Mercury 04-002 mg/kg <0.01 <0.01 <0.01 <0.01
Nickel 04-001 mg/kg 20 21 17 14
Phosphorus 04-001 mg/kg 420 360 400 390
Lead 04-001 mg/kg 3.4 3.9 3.1 3.0
Zinc 04-001 mg/kg 17 19 14 12
Total Petroleum Hydrocarbons
Poly Aromatic Hydrocarbons
Organotins
Monobutyl tin 04-026 µgSn/kg <0.50 <0.50 <0.50 <0.50
Dibutyl tin 04-026 µgSn/kg <0.50 <0.50 <0.50 <0.50
Tributyl tin 04-026 µgSn/kg <0.50 <0.50 <0.50 <0.50
Surrogate 1 Recovery 04-026 % 100 105 120 115
Date Extracted 04-026 - 21/10/2009 21/10/2009 21/10/2009 21/10/2009
Date Analysed 04-026 - 21/10/2009 21/10/2009 21/10/2009 21/10/2009
Subcontract Analysis
Total Organic Carbon SUB % 3.3 4.4 3.4 3.9
Nitrate as N SUB mg/kg <0.1 <0.1 <0.1 <0.1
Nitrite as N SUB mg/kg <0.1 <0.1 <0.1 <0.1
Total Kjeldahl Nitrogen SUB mg/kg 210 130 140 190
Total Ammonia as N SUB mg/kg 5.0 5.5 4.0 2.5
Total Nitrogen SUB mg/kg 210 130 140 190
SPOCAS SUB See attached
reports
See attached
reports
See attached
reports
See attached
reports
Page 7 of 18Page 7 of 184 November 20094 November 2009Issue Date:Issue Date:
Advanced Analytical Australia Pty ltdAdvanced Analytical Australia Pty ltd Ph: + 61 2 9888 9077Ph: + 61 2 9888 9077
ABN 20 105 644 979ABN 20 105 644 979 Fax: + 61 2 9888 9577Fax: + 61 2 9888 9577
11 Julius Avenue,11 Julius Avenue, [email protected]@advancedanalytical.com.au
North Ryde NSW 2113 AustraliaNorth Ryde NSW 2113 Australia www.advancedanalytical.com.auwww.advancedanalytical.com.au

Batch Number:Batch Number: A09/3208-AA09/3208-A
Project Reference:Project Reference: Marine Services Facility - SedimentMarine Services Facility - Sediment
Laboratory Reference: - - 17 18 19 20
Client Reference: - - DA2604 DA2703 DA2705 DA2803
Date Sampled: - - 12/10/09 12/10/09 12/10/09 12/10/09
Analysis Description Method Units
Moisture Content
Moisture Content 04-004 % 36.5 33.8 37.7 38.5
Trace Elements
Silver 04-001 mg/kg <0.1 <0.1 <0.1 <0.1
Arsenic 04-001 mg/kg 12 12 13 12
Cadmium 04-001 mg/kg 0.16 0.17 0.17 0.16
Chromium 04-001 mg/kg 46 41 49 45
Copper 04-001 mg/kg 11 9.8 14 11
Mercury 04-002 mg/kg <0.01 <0.01 <0.01 <0.01
Nickel 04-001 mg/kg 16 15 18 16
Phosphorus 04-001 mg/kg 380 360 310 390
Lead 04-001 mg/kg 3.2 3.0 3.5 3.3
Zinc 04-001 mg/kg 13 12 16 13
Total Petroleum Hydrocarbons
TPH C6-C9 04-021 mg/kg <10 [NA] <10 [NA]
TPH C10-14 04-020 mg/kg <10 [NA] <10 [NA]
TPH C15-28 04-020 mg/kg <50 [NA] <50 [NA]
TPH C29-36 04-020 mg/kg <50 [NA] <50 [NA]
Surrogate Recovery 04-020 % 95 [NA] 95 [NA]
Date Extracted 04-020 - 19/10/2009 [NA] 19/10/2009 [NA]
Date Analysed 04-020 - 26/10/2009 [NA] 26/10/2009 [NA]
Poly Aromatic Hydrocarbons
Naphthalene 04-022 µg/kg <5 [NA] <5 [NA]
1-Methylnaphthalene 04-022 µg/kg <5 [NA] <5 [NA]
2-Methylnaphthalene 04-022 µg/kg <5 [NA] <5 [NA]
Acenaphthylene 04-022 µg/kg <5 [NA] <5 [NA]
Acenaphthene 04-022 µg/kg <5 [NA] <5 [NA]
Fluorene 04-022 µg/kg <5 [NA] <5 [NA]
Phenanthrene 04-022 µg/kg <5 [NA] <5 [NA]
Anthracene 04-022 µg/kg <5 [NA] <5 [NA]
Fluoranthene 04-022 µg/kg <5 [NA] <5 [NA]
Pyrene 04-022 µg/kg <5 [NA] <5 [NA]
Benz(a)anthracene 04-022 µg/kg <5 [NA] <5 [NA]
Page 8 of 18Page 8 of 184 November 20094 November 2009Issue Date:Issue Date:
Advanced Analytical Australia Pty ltdAdvanced Analytical Australia Pty ltd Ph: + 61 2 9888 9077Ph: + 61 2 9888 9077
ABN 20 105 644 979ABN 20 105 644 979 Fax: + 61 2 9888 9577Fax: + 61 2 9888 9577
11 Julius Avenue,11 Julius Avenue, [email protected]@advancedanalytical.com.au
North Ryde NSW 2113 AustraliaNorth Ryde NSW 2113 Australia www.advancedanalytical.com.auwww.advancedanalytical.com.au

Batch Number:Batch Number: A09/3208-AA09/3208-A
Project Reference:Project Reference: Marine Services Facility - SedimentMarine Services Facility - Sediment
Laboratory Reference: - - 17 18 19 20
Client Reference: - - DA2604 DA2703 DA2705 DA2803
Date Sampled: - - 12/10/09 12/10/09 12/10/09 12/10/09
Analysis Description Method Units
Chrysene 04-022 µg/kg <5 [NA] <5 [NA]
Benzo(b)&(k)fluoranthene 04-022 µg/kg <10 [NA] <10 [NA]
Benzo(a)pyrene 04-022 µg/kg <5 [NA] <5 [NA]
Indeno(1,2,3-cd)pyrene 04-022 µg/kg <5 [NA] <5 [NA]
Dibenz(a,h)anthracene 04-022 µg/kg <5 [NA] <5 [NA]
Benzo(g,h,i)perylene 04-022 µg/kg <5 [NA] <5 [NA]
Coronene 04-022 µg/kg <10 [NA] <10 [NA]
Benzo(e)pyrene 04-022 µg/kg <5 [NA] <5 [NA]
Total PAHs (as above) 04-022 µg/kg <100 [NA] <100 [NA]
Surrogate 1 Recovery 04-022 % 80 [NA] 79 [NA]
Surrogate 2 Recovery 04-022 % 83 [NA] 88 [NA]
Surrogate 3 Recovery 04-022 % 95 [NA] 98 [NA]
Date Extracted 04-022 - 19/10/2009 [NA] 19/10/2009 [NA]
Date Analysed 04-022 - 26/10/2009 [NA] 26/10/2009 [NA]
Organotins
Monobutyl tin 04-026 µgSn/kg <0.50 <0.50 <0.50 <0.50
Dibutyl tin 04-026 µgSn/kg <0.50 <0.50 <0.50 <0.50
Tributyl tin 04-026 µgSn/kg <0.50 <0.50 <0.50 <0.50
Surrogate 1 Recovery 04-026 % 112 113 119 111
Date Extracted 04-026 - 21/10/2009 21/10/2009 21/10/2009 21/10/2009
Date Analysed 04-026 - 21/10/2009 21/10/2009 21/10/2009 21/10/2009
Subcontract Analysis
Total Organic Carbon SUB % 3.8 3.6 4.8 4.0
Nitrate as N SUB mg/kg <0.1 <0.1 <0.1 <0.1
Nitrite as N SUB mg/kg <0.1 <0.1 <0.1 <0.1
Total Kjeldahl Nitrogen SUB mg/kg 170 120 340 270
Total Ammonia as N SUB mg/kg 4.0 3.5 4.0 4.0
Total Nitrogen SUB mg/kg 170 120 340 270
SPOCAS SUB See attached
reports
See attached
reports
See attached
reports
See attached
reports
Page 9 of 18Page 9 of 184 November 20094 November 2009Issue Date:Issue Date:
Advanced Analytical Australia Pty ltdAdvanced Analytical Australia Pty ltd Ph: + 61 2 9888 9077Ph: + 61 2 9888 9077
ABN 20 105 644 979ABN 20 105 644 979 Fax: + 61 2 9888 9577Fax: + 61 2 9888 9577
11 Julius Avenue,11 Julius Avenue, [email protected]@advancedanalytical.com.au
North Ryde NSW 2113 AustraliaNorth Ryde NSW 2113 Australia www.advancedanalytical.com.auwww.advancedanalytical.com.au

Batch Number:Batch Number: A09/3208-AA09/3208-A
Project Reference:Project Reference: Marine Services Facility - SedimentMarine Services Facility - Sediment
Laboratory Reference: - - 21 22 23 24
Client Reference: - - DA2806-0.0-2 DA2806-0.0-3 DA2902 DA3004
Date Sampled: - - 12/10/09 12/10/09 12/10/09 12/10/09
Analysis Description Method Units
Moisture Content
Moisture Content 04-004 % 43.4 46.0 30.7 36.1
Trace Elements
Silver 04-001 mg/kg <0.1 <0.1 <0.1 <0.1
Arsenic 04-001 mg/kg 12 12 12 12
Cadmium 04-001 mg/kg 0.18 0.17 0.18 0.17
Chromium 04-001 mg/kg 56 60 38 44
Copper 04-001 mg/kg 14 16 8.9 11
Mercury 04-002 mg/kg <0.01 <0.01 <0.01 <0.01
Nickel 04-001 mg/kg 20 21 14 15
Phosphorus 04-001 mg/kg 420 430 360 360
Lead 04-001 mg/kg 3.7 3.8 3.0 3.1
Zinc 04-001 mg/kg 17 18 11 13
Total Petroleum Hydrocarbons
Poly Aromatic Hydrocarbons
Organotins
Monobutyl tin 04-026 µgSn/kg <0.50 <0.50 <0.50 <0.50
Dibutyl tin 04-026 µgSn/kg <0.50 <0.50 <0.50 <0.50
Tributyl tin 04-026 µgSn/kg <0.50 <0.50 <0.50 <0.50
Surrogate 1 Recovery 04-026 % 102 111 127 108
Date Extracted 04-026 - 21/10/2009 21/10/2009 21/10/2009 21/10/2009
Date Analysed 04-026 - 21/10/2009 21/10/2009 21/10/2009 21/10/2009
Subcontract Analysis
Total Organic Carbon SUB % 2.7 4.2 3.7 3.7
Nitrate as N SUB mg/kg <0.1 <0.1 <0.1 <0.1
Nitrite as N SUB mg/kg <0.1 <0.1 <0.1 <0.1
Total Kjeldahl Nitrogen SUB mg/kg 320 290 290 210
Total Ammonia as N SUB mg/kg 5.5 5.0 3.5 4.0
Total Nitrogen SUB mg/kg 320 290 290 210
SPOCAS SUB See attached
reports
See attached
reports
See attached
reports
See attached
reports
Page 10 of 18Page 10 of 184 November 20094 November 2009Issue Date:Issue Date:
Advanced Analytical Australia Pty ltdAdvanced Analytical Australia Pty ltd Ph: + 61 2 9888 9077Ph: + 61 2 9888 9077
ABN 20 105 644 979ABN 20 105 644 979 Fax: + 61 2 9888 9577Fax: + 61 2 9888 9577
11 Julius Avenue,11 Julius Avenue, [email protected]@advancedanalytical.com.au
North Ryde NSW 2113 AustraliaNorth Ryde NSW 2113 Australia www.advancedanalytical.com.auwww.advancedanalytical.com.au

Batch Number:Batch Number: A09/3208-AA09/3208-A
Project Reference:Project Reference: Marine Services Facility - SedimentMarine Services Facility - Sediment
Laboratory Reference: - - 25 26 27 28
Client Reference: - - DA3006-0.0 DA3006-1.0 DA8006-0.0-2 DA8006-0.0-3
Date Sampled: - - 12/10/09 12/10/09 12/10/09 12/10/09
Analysis Description Method Units
Moisture Content
Moisture Content 04-004 % 42.1 38.5 42.0 42.5
Trace Elements
Silver 04-001 mg/kg <0.1 <0.1 <0.1 <0.1
Arsenic 04-001 mg/kg 13 14 12 12
Cadmium 04-001 mg/kg 0.17 0.17 0.17 0.16
Chromium 04-001 mg/kg 53 53 51 53
Copper 04-001 mg/kg 15 16 15 15
Mercury 04-002 mg/kg <0.01 <0.01 <0.01 <0.01
Nickel 04-001 mg/kg 19 19 18 19
Phosphorus 04-001 mg/kg 370 280 360 370
Lead 04-001 mg/kg 3.6 4.1 3.6 3.6
Zinc 04-001 mg/kg 18 16 17 17
Total Petroleum Hydrocarbons
TPH C6-C9 04-021 mg/kg <10 <10 <10 <10
TPH C10-14 04-020 mg/kg <10 <10 <10 <10
TPH C15-28 04-020 mg/kg <50 <50 <50 <50
TPH C29-36 04-020 mg/kg <50 <50 <50 <50
Surrogate Recovery 04-020 % 97 90 82 73
Date Extracted 04-020 - 19/10/2009 19/10/2009 19/10/2009 19/10/2009
Date Analysed 04-020 - 26/10/2009 26/10/2009 26/10/2009 26/10/2009
Poly Aromatic Hydrocarbons
Naphthalene 04-022 µg/kg <5 <5 8.0 <5
1-Methylnaphthalene 04-022 µg/kg <5 <5 <5 <5
2-Methylnaphthalene 04-022 µg/kg <5 <5 <5 <5
Acenaphthylene 04-022 µg/kg <5 <5 <5 <5
Acenaphthene 04-022 µg/kg <5 <5 <5 <5
Fluorene 04-022 µg/kg <5 <5 <5 <5
Phenanthrene 04-022 µg/kg <5 <5 <5 <5
Anthracene 04-022 µg/kg <5 <5 <5 <5
Fluoranthene 04-022 µg/kg <5 <5 6 <5
Pyrene 04-022 µg/kg <5 <5 <5 <5
Benz(a)anthracene 04-022 µg/kg <5 <5 <5 <5
Page 11 of 18Page 11 of 184 November 20094 November 2009Issue Date:Issue Date:
Advanced Analytical Australia Pty ltdAdvanced Analytical Australia Pty ltd Ph: + 61 2 9888 9077Ph: + 61 2 9888 9077
ABN 20 105 644 979ABN 20 105 644 979 Fax: + 61 2 9888 9577Fax: + 61 2 9888 9577
11 Julius Avenue,11 Julius Avenue, [email protected]@advancedanalytical.com.au
North Ryde NSW 2113 AustraliaNorth Ryde NSW 2113 Australia www.advancedanalytical.com.auwww.advancedanalytical.com.au

Batch Number:Batch Number: A09/3208-AA09/3208-A
Project Reference:Project Reference: Marine Services Facility - SedimentMarine Services Facility - Sediment
Laboratory Reference: - - 25 26 27 28
Client Reference: - - DA3006-0.0 DA3006-1.0 DA8006-0.0-2 DA8006-0.0-3
Date Sampled: - - 12/10/09 12/10/09 12/10/09 12/10/09
Analysis Description Method Units
Chrysene 04-022 µg/kg <5 <5 5 <5
Benzo(b)&(k)fluoranthene 04-022 µg/kg <10 <10 <10 <10
Benzo(a)pyrene 04-022 µg/kg <5 <5 <5 <5
Indeno(1,2,3-cd)pyrene 04-022 µg/kg <5 <5 <5 <5
Dibenz(a,h)anthracene 04-022 µg/kg <5 <5 <5 <5
Benzo(g,h,i)perylene 04-022 µg/kg <5 <5 <5 <5
Coronene 04-022 µg/kg <10 <10 <10 <10
Benzo(e)pyrene 04-022 µg/kg <5 <5 <5 <5
Total PAHs (as above) 04-022 µg/kg <100 <100 <100 <100
Surrogate 1 Recovery 04-022 % 85 84 70 75
Surrogate 2 Recovery 04-022 % 89 94 76 78
Surrogate 3 Recovery 04-022 % 103 107 81 93
Date Extracted 04-022 - 19/10/2009 19/10/2009 19/10/2009 19/10/2009
Date Analysed 04-022 - 26/10/2009 26/10/2009 26/10/2009 26/10/2009
Organotins
Monobutyl tin 04-026 µgSn/kg <0.50 <0.50 <0.50 <0.50
Dibutyl tin 04-026 µgSn/kg <0.50 <0.50 <0.50 <0.50
Tributyl tin 04-026 µgSn/kg <0.50 <0.50 <0.50 <0.50
Surrogate 1 Recovery 04-026 % 114 106 115 110
Date Extracted 04-026 - 21/10/2009 21/10/2009 21/10/2009 21/10/2009
Date Analysed 04-026 - 21/10/2009 21/10/2009 21/10/2009 21/10/2009
Subcontract Analysis
Total Organic Carbon SUB % 2.9 4.6 4.2 3.3
Nitrate as N SUB mg/kg <0.1 <0.1 <0.1 <0.1
Nitrite as N SUB mg/kg <0.1 <0.1 <0.1 <0.1
Total Kjeldahl Nitrogen SUB mg/kg 310 330 290 330
Total Ammonia as N SUB mg/kg 4.0 10 4.5 4.0
Total Nitrogen SUB mg/kg 310 330 290 330
SPOCAS SUB See attached
reports
See attached
reports
See attached
reports
See attached
reports
Page 12 of 18Page 12 of 184 November 20094 November 2009Issue Date:Issue Date:
Advanced Analytical Australia Pty ltdAdvanced Analytical Australia Pty ltd Ph: + 61 2 9888 9077Ph: + 61 2 9888 9077
ABN 20 105 644 979ABN 20 105 644 979 Fax: + 61 2 9888 9577Fax: + 61 2 9888 9577
11 Julius Avenue,11 Julius Avenue, [email protected]@advancedanalytical.com.au
North Ryde NSW 2113 AustraliaNorth Ryde NSW 2113 Australia www.advancedanalytical.com.auwww.advancedanalytical.com.au

Batch Number:Batch Number: A09/3208-AA09/3208-A
Project Reference:Project Reference: Marine Services Facility - SedimentMarine Services Facility - Sediment
Method Method Description
04-004 Moisture by gravimetric, %
04-001 Metals by ICP-OES, mg/kg
04-002 Mercury by CVAAS, mg/kg
04-021 TPH C6-9 & BTEX by P&T GCMS, mg/kg
04-020 TPH by GC-FID, mg/kg
04-022 Low level PAHs & Phenols by GCMS, µg/kg
04-026 Organotins by GCMS, µgSn/kg
SUB Subcontracted Analyses
Result CommentsResult Comments
[<][<] Less thanLess than
[INS][INS] Insufficient sample for this testInsufficient sample for this test
[NA][NA] Test not requiredTest not required
Solid sample results are reported on a dry weight basis.Solid sample results are reported on a dry weight basis.
TN, TKN, Nitrate, Nitrite, Ammonia and TOC analysis was subcontracted to Sydney Analytical Laboratories TN, TKN, Nitrate, Nitrite, Ammonia and TOC analysis was subcontracted to Sydney Analytical Laboratories
(NATA Number 1884); reference SAL report number SAL22325.(NATA Number 1884); reference SAL report number SAL22325.
SPOCAS analysis was subcontracted to Australian Laboratory Services (NATA Number 825); see attached SPOCAS analysis was subcontracted to Australian Laboratory Services (NATA Number 825); see attached
ALSE reports for work order EP0905895 (and EP0905867 reported in A09/3208-C). ALSE reports for work order EP0905895 (and EP0905867 reported in A09/3208-C).
Page 13 of 18Page 13 of 184 November 20094 November 2009Issue Date:Issue Date:
Advanced Analytical Australia Pty ltdAdvanced Analytical Australia Pty ltd Ph: + 61 2 9888 9077Ph: + 61 2 9888 9077
ABN 20 105 644 979ABN 20 105 644 979 Fax: + 61 2 9888 9577Fax: + 61 2 9888 9577
11 Julius Avenue,11 Julius Avenue, [email protected]@advancedanalytical.com.au
North Ryde NSW 2113 AustraliaNorth Ryde NSW 2113 Australia www.advancedanalytical.com.auwww.advancedanalytical.com.au
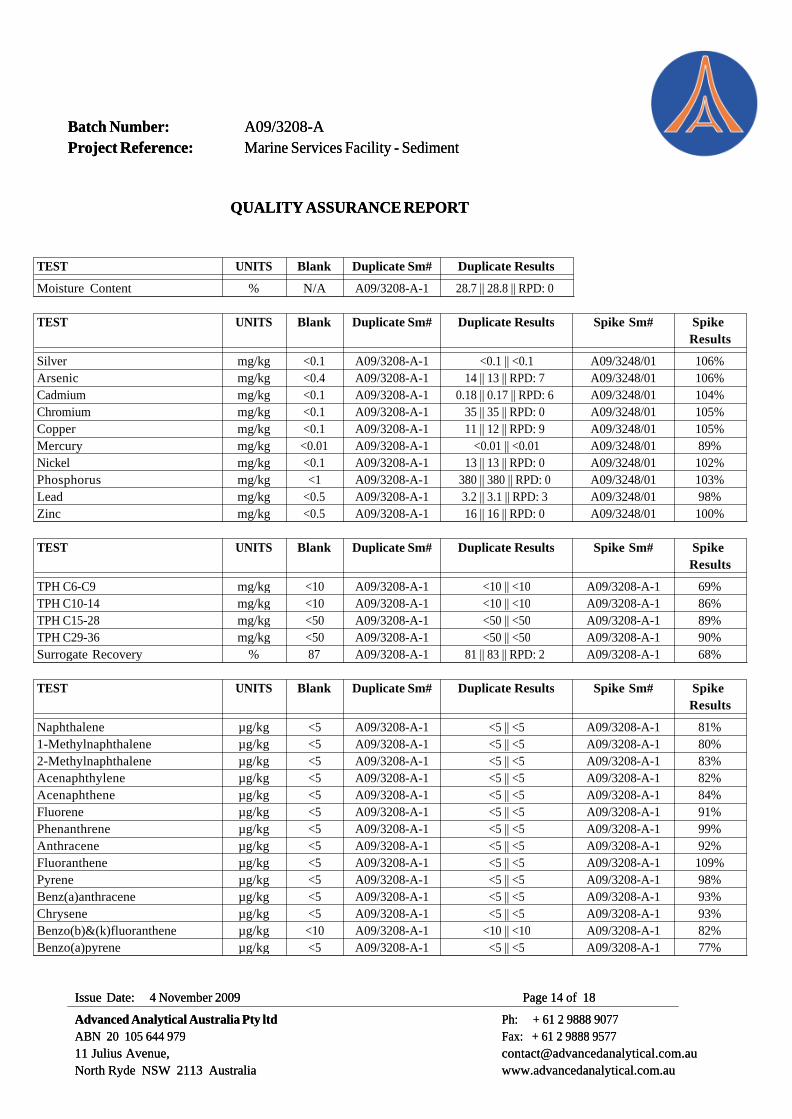
Batch Number:Batch Number: A09/3208-AA09/3208-A
Project Reference:Project Reference: Marine Services Facility - SedimentMarine Services Facility - Sediment
QUALITY ASSURANCE REPORTQUALITY ASSURANCE REPORT
TEST UNITS Blank Duplicate Sm# Duplicate Results
Moisture Content % N/A A09/3208-A-1 28.7 || 28.8 || RPD: 0
TEST UNITS Blank Duplicate Sm# Duplicate Results Spike Sm# Spike
Results
Silver mg/kg <0.1 A09/3208-A-1 <0.1 || <0.1 A09/3248/01 106%
Arsenic mg/kg <0.4 A09/3208-A-1 14 || 13 || RPD: 7 A09/3248/01 106%
Cadmium mg/kg <0.1 A09/3208-A-1 0.18 || 0.17 || RPD: 6 A09/3248/01 104%
Chromium mg/kg <0.1 A09/3208-A-1 35 || 35 || RPD: 0 A09/3248/01 105%
Copper mg/kg <0.1 A09/3208-A-1 11 || 12 || RPD: 9 A09/3248/01 105%
Mercury mg/kg <0.01 A09/3208-A-1 <0.01 || <0.01 A09/3248/01 89%
Nickel mg/kg <0.1 A09/3208-A-1 13 || 13 || RPD: 0 A09/3248/01 102%
Phosphorus mg/kg <1 A09/3208-A-1 380 || 380 || RPD: 0 A09/3248/01 103%
Lead mg/kg <0.5 A09/3208-A-1 3.2 || 3.1 || RPD: 3 A09/3248/01 98%
Zinc mg/kg <0.5 A09/3208-A-1 16 || 16 || RPD: 0 A09/3248/01 100%
TEST UNITS Blank Duplicate Sm# Duplicate Results Spike Sm# Spike
Results
TPH C6-C9 mg/kg <10 A09/3208-A-1 <10 || <10 A09/3208-A-1 69%
TPH C10-14 mg/kg <10 A09/3208-A-1 <10 || <10 A09/3208-A-1 86%
TPH C15-28 mg/kg <50 A09/3208-A-1 <50 || <50 A09/3208-A-1 89%
TPH C29-36 mg/kg <50 A09/3208-A-1 <50 || <50 A09/3208-A-1 90%
Surrogate Recovery % 87 A09/3208-A-1 81 || 83 || RPD: 2 A09/3208-A-1 68%
TEST UNITS Blank Duplicate Sm# Duplicate Results Spike Sm# Spike
Results
Naphthalene µg/kg <5 A09/3208-A-1 <5 || <5 A09/3208-A-1 81%
1-Methylnaphthalene µg/kg <5 A09/3208-A-1 <5 || <5 A09/3208-A-1 80%
2-Methylnaphthalene µg/kg <5 A09/3208-A-1 <5 || <5 A09/3208-A-1 83%
Acenaphthylene µg/kg <5 A09/3208-A-1 <5 || <5 A09/3208-A-1 82%
Acenaphthene µg/kg <5 A09/3208-A-1 <5 || <5 A09/3208-A-1 84%
Fluorene µg/kg <5 A09/3208-A-1 <5 || <5 A09/3208-A-1 91%
Phenanthrene µg/kg <5 A09/3208-A-1 <5 || <5 A09/3208-A-1 99%
Anthracene µg/kg <5 A09/3208-A-1 <5 || <5 A09/3208-A-1 92%
Fluoranthene µg/kg <5 A09/3208-A-1 <5 || <5 A09/3208-A-1 109%
Pyrene µg/kg <5 A09/3208-A-1 <5 || <5 A09/3208-A-1 98%
Benz(a)anthracene µg/kg <5 A09/3208-A-1 <5 || <5 A09/3208-A-1 93%
Chrysene µg/kg <5 A09/3208-A-1 <5 || <5 A09/3208-A-1 93%
Benzo(b)&(k)fluoranthene µg/kg <10 A09/3208-A-1 <10 || <10 A09/3208-A-1 82%
Benzo(a)pyrene µg/kg <5 A09/3208-A-1 <5 || <5 A09/3208-A-1 77%
Page 14 of 18Page 14 of 184 November 20094 November 2009Issue Date:Issue Date:
Advanced Analytical Australia Pty ltdAdvanced Analytical Australia Pty ltd Ph: + 61 2 9888 9077Ph: + 61 2 9888 9077
ABN 20 105 644 979ABN 20 105 644 979 Fax: + 61 2 9888 9577Fax: + 61 2 9888 9577
11 Julius Avenue,11 Julius Avenue, [email protected]@advancedanalytical.com.au
North Ryde NSW 2113 AustraliaNorth Ryde NSW 2113 Australia www.advancedanalytical.com.auwww.advancedanalytical.com.au

Batch Number:Batch Number: A09/3208-AA09/3208-A
Project Reference:Project Reference: Marine Services Facility - SedimentMarine Services Facility - Sediment
TEST UNITS Blank Duplicate Sm# Duplicate Results Spike Sm# Spike
Results
Indeno(1,2,3-cd)pyrene µg/kg <5 A09/3208-A-1 <5 || <5 A09/3208-A-1 97%
Dibenz(a,h)anthracene µg/kg <5 A09/3208-A-1 <5 || <5 A09/3208-A-1 98%
Benzo(g,h,i)perylene µg/kg <5 A09/3208-A-1 <5 || <5 A09/3208-A-1 91%
Coronene µg/kg <10 A09/3208-A-1 <10 || <10 A09/3208-A-1 99%
Benzo(e)pyrene µg/kg <5 A09/3208-A-1 <5 || <5 A09/3208-A-1 88%
Total PAHs (as above) µg/kg <100 A09/3208-A-1 <100 || <100 A09/3208-A-1 N/A
Surrogate 1 Recovery % 78 A09/3208-A-1 74 || 76 || RPD: 3 A09/3208-A-1 79%
Surrogate 2 Recovery % 79 A09/3208-A-1 85 || 88 || RPD: 3 A09/3208-A-1 94%
Surrogate 3 Recovery % 99 A09/3208-A-1 97 || 97 || RPD: 0 A09/3208-A-1 93%
TEST UNITS Blank Duplicate Sm# Duplicate Results Spike Sm# Spike
Results
Monobutyl tin µgSn/kg <0.50 A09/3208-A-1 <0.50 || <0.50 A09/3208-A-1 23%
Dibutyl tin µgSn/kg <0.50 A09/3208-A-1 <0.50 || <0.50 A09/3208-A-1 82%
Tributyl tin µgSn/kg <0.50 A09/3208-A-1 <0.50 || <0.50 A09/3208-A-1 88%
Surrogate 1 Recovery % 117 A09/3208-A-1 99 || 101 || RPD: 2 A09/3208-A-1 101%
TEST UNITS Blank
Total Organic Carbon % <0.01
Nitrate as N mg/kg <0.1
Nitrite as N mg/kg <0.1
Total Kjeldahl Nitrogen mg/kg <20
Total Ammonia as N mg/kg <0.5
Total Nitrogen mg/kg <20
TEST Units Blank Duplicate Sm# Duplicate Results
Moisture Content % N/A A09/3208-A-11 23.4 || 24.4 || RPD: 4
TEST Units Blank Duplicate Sm# Duplicate Results Spike Sm# Spike
Results
Silver mg/kg <0.1 [NT] [NT] A09/3197/01 107%
Arsenic mg/kg <0.4 [NT] [NT] A09/3197/01 106%
Cadmium mg/kg <0.1 [NT] [NT] A09/3197/01 105%
Chromium mg/kg <0.1 [NT] [NT] A09/3197/01 103%
Copper mg/kg <0.1 [NT] [NT] A09/3197/01 105%
Mercury mg/kg <0.01 [NT] [NT] A09/3197/01 89%
Nickel mg/kg <0.1 [NT] [NT] A09/3197/01 96%
Phosphorus mg/kg <1 [NT] [NT] A09/3197/01 104%
Lead mg/kg <0.5 [NT] [NT] A09/3197/01 95%
Zinc mg/kg <0.5 [NT] [NT] A09/3197/01 96%
Page 15 of 18Page 15 of 184 November 20094 November 2009Issue Date:Issue Date:
Advanced Analytical Australia Pty ltdAdvanced Analytical Australia Pty ltd Ph: + 61 2 9888 9077Ph: + 61 2 9888 9077
ABN 20 105 644 979ABN 20 105 644 979 Fax: + 61 2 9888 9577Fax: + 61 2 9888 9577
11 Julius Avenue,11 Julius Avenue, [email protected]@advancedanalytical.com.au
North Ryde NSW 2113 AustraliaNorth Ryde NSW 2113 Australia www.advancedanalytical.com.auwww.advancedanalytical.com.au
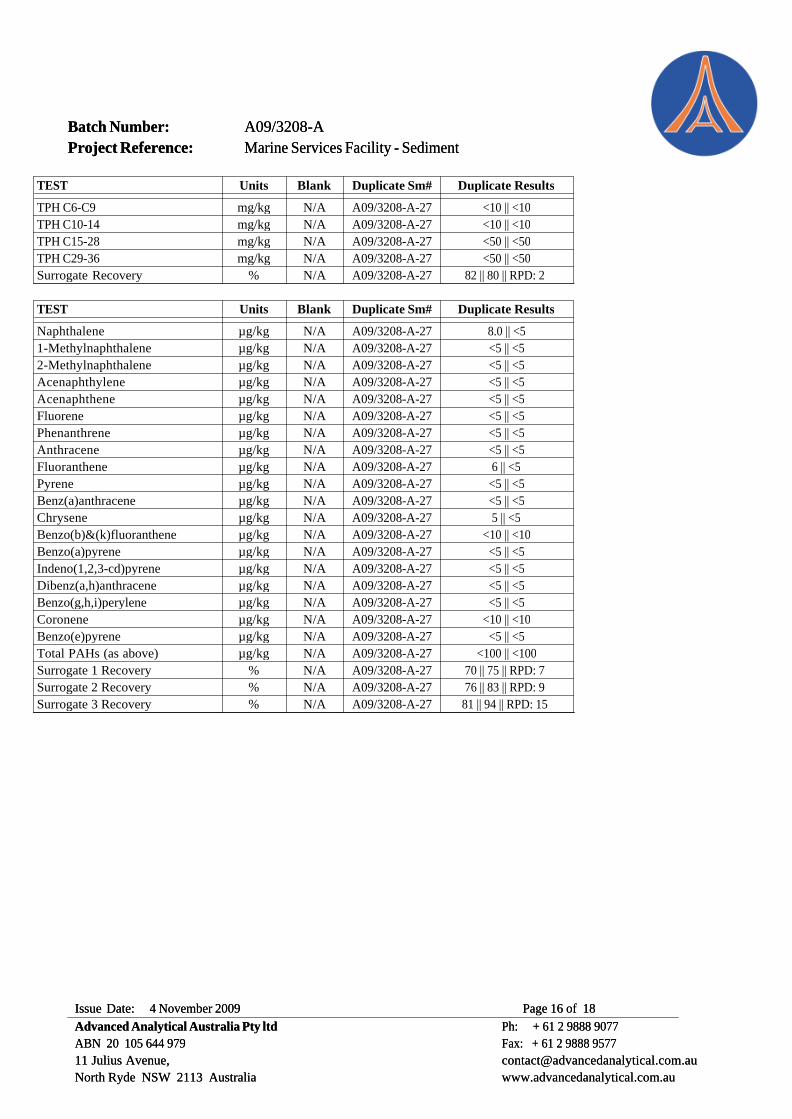
Batch Number:Batch Number: A09/3208-AA09/3208-A
Project Reference:Project Reference: Marine Services Facility - SedimentMarine Services Facility - Sediment
TEST Units Blank Duplicate Sm# Duplicate Results
TPH C6-C9 mg/kg N/A A09/3208-A-27 <10 || <10
TPH C10-14 mg/kg N/A A09/3208-A-27 <10 || <10
TPH C15-28 mg/kg N/A A09/3208-A-27 <50 || <50
TPH C29-36 mg/kg N/A A09/3208-A-27 <50 || <50
Surrogate Recovery % N/A A09/3208-A-27 82 || 80 || RPD: 2
TEST Units Blank Duplicate Sm# Duplicate Results
Naphthalene µg/kg N/A A09/3208-A-27 8.0 || <5
1-Methylnaphthalene µg/kg N/A A09/3208-A-27 <5 || <5
2-Methylnaphthalene µg/kg N/A A09/3208-A-27 <5 || <5
Acenaphthylene µg/kg N/A A09/3208-A-27 <5 || <5
Acenaphthene µg/kg N/A A09/3208-A-27 <5 || <5
Fluorene µg/kg N/A A09/3208-A-27 <5 || <5
Phenanthrene µg/kg N/A A09/3208-A-27 <5 || <5
Anthracene µg/kg N/A A09/3208-A-27 <5 || <5
Fluoranthene µg/kg N/A A09/3208-A-27 6 || <5
Pyrene µg/kg N/A A09/3208-A-27 <5 || <5
Benz(a)anthracene µg/kg N/A A09/3208-A-27 <5 || <5
Chrysene µg/kg N/A A09/3208-A-27 5 || <5
Benzo(b)&(k)fluoranthene µg/kg N/A A09/3208-A-27 <10 || <10
Benzo(a)pyrene µg/kg N/A A09/3208-A-27 <5 || <5
Indeno(1,2,3-cd)pyrene µg/kg N/A A09/3208-A-27 <5 || <5
Dibenz(a,h)anthracene µg/kg N/A A09/3208-A-27 <5 || <5
Benzo(g,h,i)perylene µg/kg N/A A09/3208-A-27 <5 || <5
Coronene µg/kg N/A A09/3208-A-27 <10 || <10
Benzo(e)pyrene µg/kg N/A A09/3208-A-27 <5 || <5
Total PAHs (as above) µg/kg N/A A09/3208-A-27 <100 || <100
Surrogate 1 Recovery % N/A A09/3208-A-27 70 || 75 || RPD: 7
Surrogate 2 Recovery % N/A A09/3208-A-27 76 || 83 || RPD: 9
Surrogate 3 Recovery % N/A A09/3208-A-27 81 || 94 || RPD: 15
Page 16 of 18Page 16 of 184 November 20094 November 2009Issue Date:Issue Date:
Advanced Analytical Australia Pty ltdAdvanced Analytical Australia Pty ltd Ph: + 61 2 9888 9077Ph: + 61 2 9888 9077
ABN 20 105 644 979ABN 20 105 644 979 Fax: + 61 2 9888 9577Fax: + 61 2 9888 9577
11 Julius Avenue,11 Julius Avenue, [email protected]@advancedanalytical.com.au
North Ryde NSW 2113 AustraliaNorth Ryde NSW 2113 Australia www.advancedanalytical.com.auwww.advancedanalytical.com.au

Batch Number:Batch Number: A09/3208-AA09/3208-A
Project Reference:Project Reference: Marine Services Facility - SedimentMarine Services Facility - Sediment
TEST Units Blank Duplicate Sm# Duplicate Results Spike Sm# Spike
Results
Monobutyl tin µgSn/kg <0.50 A09/3208-A-11 <0.50 || <0.50 A09/3208-A-21 11%
Dibutyl tin µgSn/kg <0.50 A09/3208-A-11 <0.50 || <0.50 A09/3208-A-21 80%
Tributyl tin µgSn/kg <0.50 A09/3208-A-11 <0.50 || <0.50 A09/3208-A-21 84%
Surrogate 1 Recovery % 135 A09/3208-A-11 119 || 122 || RPD: 2 A09/3208-A-21 109%
TEST Units Blank Duplicate Sm# Duplicate Results
Moisture Content % [NT] A09/3208-A-21 43.4 || 43.4 || RPD: 0
TEST Units Blank Duplicate Sm# Duplicate Results
Silver mg/kg [NT] A09/3208-A-21 <0.1 || <0.1
Arsenic mg/kg [NT] A09/3208-A-21 12 || 12 || RPD: 0
Cadmium mg/kg [NT] A09/3208-A-21 0.18 || 0.16 || RPD: 12
Chromium mg/kg [NT] A09/3208-A-21 56 || 55 || RPD: 2
Copper mg/kg [NT] A09/3208-A-21 14 || 14 || RPD: 0
Mercury mg/kg [NT] A09/3208-A-21 <0.01 || <0.01
Nickel mg/kg [NT] A09/3208-A-21 20 || 19 || RPD: 5
Phosphorus mg/kg [NT] A09/3208-A-21 420 || 410 || RPD: 2
Lead mg/kg [NT] A09/3208-A-21 3.7 || 3.5 || RPD: 6
Zinc mg/kg [NT] A09/3208-A-21 17 || 16 || RPD: 6
TEST Units Blank Duplicate Sm# Duplicate Results Spike Sm# Spike
Results
Monobutyl tin µgSn/kg [NT] A09/3208-A-21 <0.50 || <0.50 External 96%
Dibutyl tin µgSn/kg [NT] A09/3208-A-21 <0.50 || <0.50 External 102%
Tributyl tin µgSn/kg [NT] A09/3208-A-21 <0.50 || <0.50 External 110%
Surrogate 1 Recovery % [NT] A09/3208-A-21 102 || 113 || RPD: 10 External 139%
TEST Units Blank Duplicate Sm# Duplicate Results
Total Organic Carbon % [NT] A09/3208-A-20 4.0 || 3.9 || RPD: 3
Nitrate as N mg/kg [NT] A09/3208-A-20 <0.1 || <0.1
Nitrite as N mg/kg [NT] A09/3208-A-20 <0.1 || <0.1
Total Kjeldahl Nitrogen mg/kg [NT] A09/3208-A-20 270 || 250 || RPD: 8
Total Ammonia as N mg/kg [NT] A09/3208-A-20 4.0 || 4.0 || RPD: 0
Total Nitrogen mg/kg [NT] A09/3208-A-20 270 || 250 || RPD: 8
Page 17 of 18Page 17 of 184 November 20094 November 2009Issue Date:Issue Date:
Advanced Analytical Australia Pty ltdAdvanced Analytical Australia Pty ltd Ph: + 61 2 9888 9077Ph: + 61 2 9888 9077
ABN 20 105 644 979ABN 20 105 644 979 Fax: + 61 2 9888 9577Fax: + 61 2 9888 9577
11 Julius Avenue,11 Julius Avenue, [email protected]@advancedanalytical.com.au
North Ryde NSW 2113 AustraliaNorth Ryde NSW 2113 Australia www.advancedanalytical.com.auwww.advancedanalytical.com.au

Batch Number:Batch Number: A09/3208-AA09/3208-A
Project Reference:Project Reference: Marine Services Facility - SedimentMarine Services Facility - Sediment
Comments:Comments:
RPDRPD = Relative Percent Deviation= Relative Percent Deviation
[NT][NT] = Not Tested= Not Tested
[N/A][N/A] = Not Applicable= Not Applicable
'#''#' = Spike recovery data could not be calculated due to high levels of contaminants= Spike recovery data could not be calculated due to high levels of contaminants
Acceptable replicate reproducibility limit or RPD:Acceptable replicate reproducibility limit or RPD: Results < 10 times LOR: no limits.Results < 10 times LOR: no limits.
Results >10 times LOR: 0% - 50%.Results >10 times LOR: 0% - 50%.
Acceptable matrix spike & LCS recovery limits:Acceptable matrix spike & LCS recovery limits: Trace elements 70-130%Trace elements 70-130%
Organic analyses 50-150%Organic analyses 50-150%
SVOC & speciated phenols 10-140%SVOC & speciated phenols 10-140%
Surrogates 10-140%Surrogates 10-140%
When levels outside these limits are obtained, an investigation into the cause of the deviationWhen levels outside these limits are obtained, an investigation into the cause of the deviation
is performed before the batch is accepted or rejected, and results are released.is performed before the batch is accepted or rejected, and results are released.
Page 18 of 18Page 18 of 184 November 20094 November 2009Issue Date:Issue Date:
Advanced Analytical Australia Pty ltdAdvanced Analytical Australia Pty ltd Ph: + 61 2 9888 9077Ph: + 61 2 9888 9077
ABN 20 105 644 979ABN 20 105 644 979 Fax: + 61 2 9888 9577Fax: + 61 2 9888 9577
11 Julius Avenue,11 Julius Avenue, [email protected]@advancedanalytical.com.au
North Ryde NSW 2113 AustraliaNorth Ryde NSW 2113 Australia www.advancedanalytical.com.auwww.advancedanalytical.com.au
REPORT OF ANALYSISREPORT OF ANALYSIS
Laboratory Reference:Laboratory Reference: A09/3223-AA09/3223-A
Order No:Order No:Client:Client: WorleyParsons Services Pty LtdWorleyParsons Services Pty Ltd
Level 7, QV1 Building, 250 St Georges TceLevel 7, QV1 Building, 250 St Georges Tce Project:Project: Marine Services Facility - SedimentMarine Services Facility - Sediment
Perth WA 6000Perth WA 6000 Sample Type:Sample Type: sedimentsediment
No. of Samples:No. of Samples: 2424
Contact:Contact: Peter MellorPeter Mellor Date Received:Date Received: 14/10/0914/10/09
Date Completed:Date Completed: 1/11/20091/11/2009
Laboratory Contact Details:Laboratory Contact Details:
Client Services Manager:Client Services Manager: Jane StruthersJane Struthers
Technical Enquiries:Technical Enquiries: Andrew BradburyAndrew Bradbury
Telephone:Telephone: +61 8 9325 9799+61 8 9325 9799
Fax:Fax: +61 8 9325 4299+61 8 9325 4299
Email:Email: [email protected]@advancedanalytical.com.au
[email protected]@advancedanalytical.com.au
Attached Results Approved By:Attached Results Approved By:
Comments:Comments:
All samples tested as submitted by client. All attached results have been checked and approved for release.All samples tested as submitted by client. All attached results have been checked and approved for release.
This is the Final Report and supersedes any reports previously issued with this batch number.This is the Final Report and supersedes any reports previously issued with this batch number.
This document is issued in accordance with NATA's accreditation requirements. Accredited for complianceThis document is issued in accordance with NATA's accreditation requirements. Accredited for compliance
with ISO/IEC 17025. This document shall not be reproduced, except in full.with ISO/IEC 17025. This document shall not be reproduced, except in full.
Page 1 of 19Page 1 of 192 November 20092 November 2009Issue Date:Issue Date:
Advanced Analytical Australia Pty ltdAdvanced Analytical Australia Pty ltd Ph: + 61 2 9888 9077Ph: + 61 2 9888 9077
ABN 20 105 644 979ABN 20 105 644 979 Fax: + 61 2 9888 9577Fax: + 61 2 9888 9577
11 Julius Avenue,11 Julius Avenue, [email protected]@advancedanalytical.com.au
North Ryde NSW 2113 AustraliaNorth Ryde NSW 2113 Australia www.advancedanalytical.com.auwww.advancedanalytical.com.au

Batch Number:Batch Number: A09/3223-AA09/3223-A
Project Reference:Project Reference: Marine Services Facility - SedimentMarine Services Facility - Sediment
Laboratory Reference: - - 1 2 3 4
Client Reference: - - BP54 BP56 BP64 BP68-2
Date Sampled: - - 13/10/09 13/10/09 13/10/09 13/10/09
Analysis Description Method Units
Moisture Content
Moisture Content 04-004 % 33.0 37.2 27.7 25.3
Trace Elements
Silver 04-001 mg/kg <0.1 <0.1 <0.1 <0.1
Arsenic 04-001 mg/kg 16 14 15 15
Cadmium 04-001 mg/kg 0.20 0.17 0.17 0.16
Chromium 04-001 mg/kg 34 43 31 28
Copper 04-001 mg/kg 13 15 10 9.1
Mercury 04-002 mg/kg <0.01 <0.01 <0.01 <0.01
Nickel 04-001 mg/kg 12 16 11 9.9
Phosphorus 04-001 mg/kg 440 390 370 360
Lead 04-001 mg/kg 3.1 3.6 2.9 2.8
Zinc 04-001 mg/kg 16 19 15 13
Total Petroleum Hydrocarbons
TPH C6-C9 04-021 mg/kg <10 <10 <10 <10
TPH C10-14 04-020 mg/kg <10 <10 <10 <10
TPH C15-28 04-020 mg/kg <50 <50 <50 <50
TPH C29-36 04-020 mg/kg <50 <50 <50 <50
Surrogate Recovery 04-020 % 101 99 81 78
Date Extracted 04-020 - 20/10/2009 20/10/2009 20/10/2009 20/10/2009
Date Analysed 04-020 - 26/10/2009 26/10/2009 26/10/2009 26/10/2009
Poly Aromatic Hydrocarbons
Naphthalene 04-022 µg/kg <5 <5 <5 <5
1-Methylnaphthalene 04-022 µg/kg <5 <5 <5 <5
2-Methylnaphthalene 04-022 µg/kg <5 <5 <5 <5
Acenaphthylene 04-022 µg/kg <5 <5 <5 <5
Acenaphthene 04-022 µg/kg <5 <5 <5 <5
Fluorene 04-022 µg/kg <5 <5 <5 <5
Phenanthrene 04-022 µg/kg <5 <5 <5 <5
Anthracene 04-022 µg/kg <5 <5 <5 <5
Fluoranthene 04-022 µg/kg <5 6 <5 <5
Pyrene 04-022 µg/kg <5 <5 <5 <5
Benz(a)anthracene 04-022 µg/kg <5 <5 <5 <5
Page 2 of 19Page 2 of 192 November 20092 November 2009Issue Date:Issue Date:
Advanced Analytical Australia Pty ltdAdvanced Analytical Australia Pty ltd Ph: + 61 2 9888 9077Ph: + 61 2 9888 9077
ABN 20 105 644 979ABN 20 105 644 979 Fax: + 61 2 9888 9577Fax: + 61 2 9888 9577
11 Julius Avenue,11 Julius Avenue, [email protected]@advancedanalytical.com.au
North Ryde NSW 2113 AustraliaNorth Ryde NSW 2113 Australia www.advancedanalytical.com.auwww.advancedanalytical.com.au
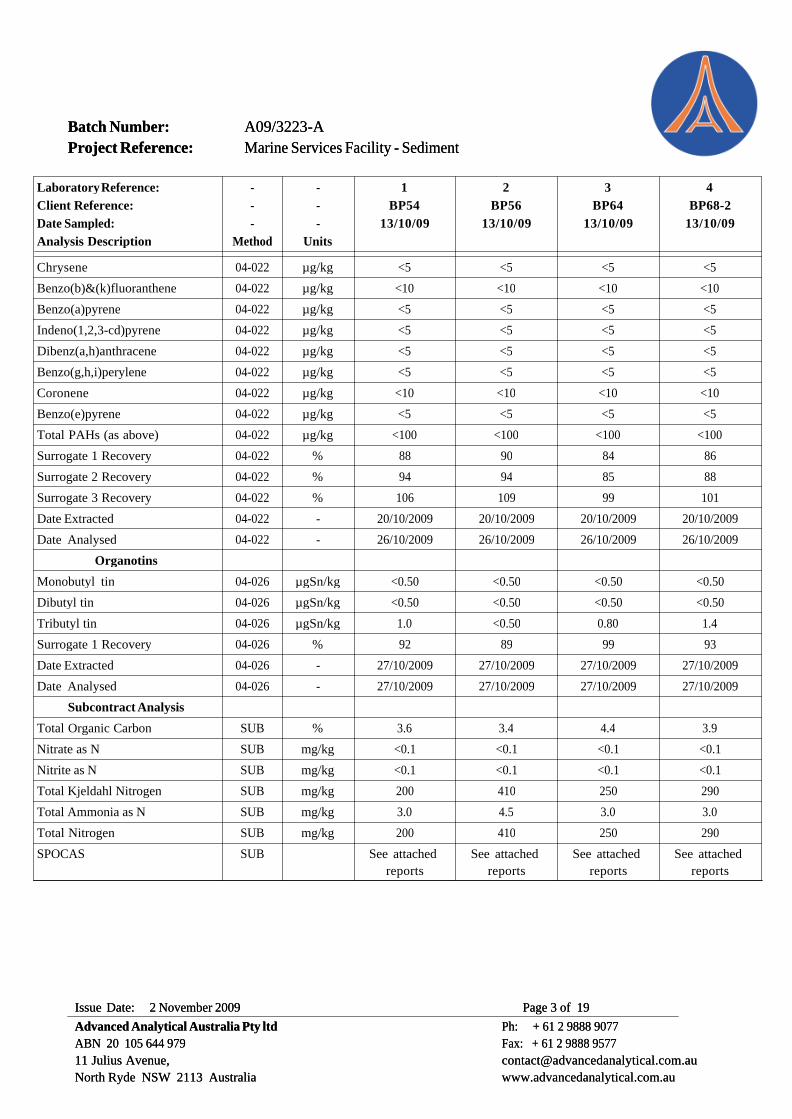
Batch Number:Batch Number: A09/3223-AA09/3223-A
Project Reference:Project Reference: Marine Services Facility - SedimentMarine Services Facility - Sediment
Laboratory Reference: - - 1 2 3 4
Client Reference: - - BP54 BP56 BP64 BP68-2
Date Sampled: - - 13/10/09 13/10/09 13/10/09 13/10/09
Analysis Description Method Units
Chrysene 04-022 µg/kg <5 <5 <5 <5
Benzo(b)&(k)fluoranthene 04-022 µg/kg <10 <10 <10 <10
Benzo(a)pyrene 04-022 µg/kg <5 <5 <5 <5
Indeno(1,2,3-cd)pyrene 04-022 µg/kg <5 <5 <5 <5
Dibenz(a,h)anthracene 04-022 µg/kg <5 <5 <5 <5
Benzo(g,h,i)perylene 04-022 µg/kg <5 <5 <5 <5
Coronene 04-022 µg/kg <10 <10 <10 <10
Benzo(e)pyrene 04-022 µg/kg <5 <5 <5 <5
Total PAHs (as above) 04-022 µg/kg <100 <100 <100 <100
Surrogate 1 Recovery 04-022 % 88 90 84 86
Surrogate 2 Recovery 04-022 % 94 94 85 88
Surrogate 3 Recovery 04-022 % 106 109 99 101
Date Extracted 04-022 - 20/10/2009 20/10/2009 20/10/2009 20/10/2009
Date Analysed 04-022 - 26/10/2009 26/10/2009 26/10/2009 26/10/2009
Organotins
Monobutyl tin 04-026 µgSn/kg <0.50 <0.50 <0.50 <0.50
Dibutyl tin 04-026 µgSn/kg <0.50 <0.50 <0.50 <0.50
Tributyl tin 04-026 µgSn/kg 1.0 <0.50 0.80 1.4
Surrogate 1 Recovery 04-026 % 92 89 99 93
Date Extracted 04-026 - 27/10/2009 27/10/2009 27/10/2009 27/10/2009
Date Analysed 04-026 - 27/10/2009 27/10/2009 27/10/2009 27/10/2009
Subcontract Analysis
Total Organic Carbon SUB % 3.6 3.4 4.4 3.9
Nitrate as N SUB mg/kg <0.1 <0.1 <0.1 <0.1
Nitrite as N SUB mg/kg <0.1 <0.1 <0.1 <0.1
Total Kjeldahl Nitrogen SUB mg/kg 200 410 250 290
Total Ammonia as N SUB mg/kg 3.0 4.5 3.0 3.0
Total Nitrogen SUB mg/kg 200 410 250 290
SPOCAS SUB See attached
reports
See attached
reports
See attached
reports
See attached
reports
Page 3 of 19Page 3 of 192 November 20092 November 2009Issue Date:Issue Date:
Advanced Analytical Australia Pty ltdAdvanced Analytical Australia Pty ltd Ph: + 61 2 9888 9077Ph: + 61 2 9888 9077
ABN 20 105 644 979ABN 20 105 644 979 Fax: + 61 2 9888 9577Fax: + 61 2 9888 9577
11 Julius Avenue,11 Julius Avenue, [email protected]@advancedanalytical.com.au
North Ryde NSW 2113 AustraliaNorth Ryde NSW 2113 Australia www.advancedanalytical.com.auwww.advancedanalytical.com.au
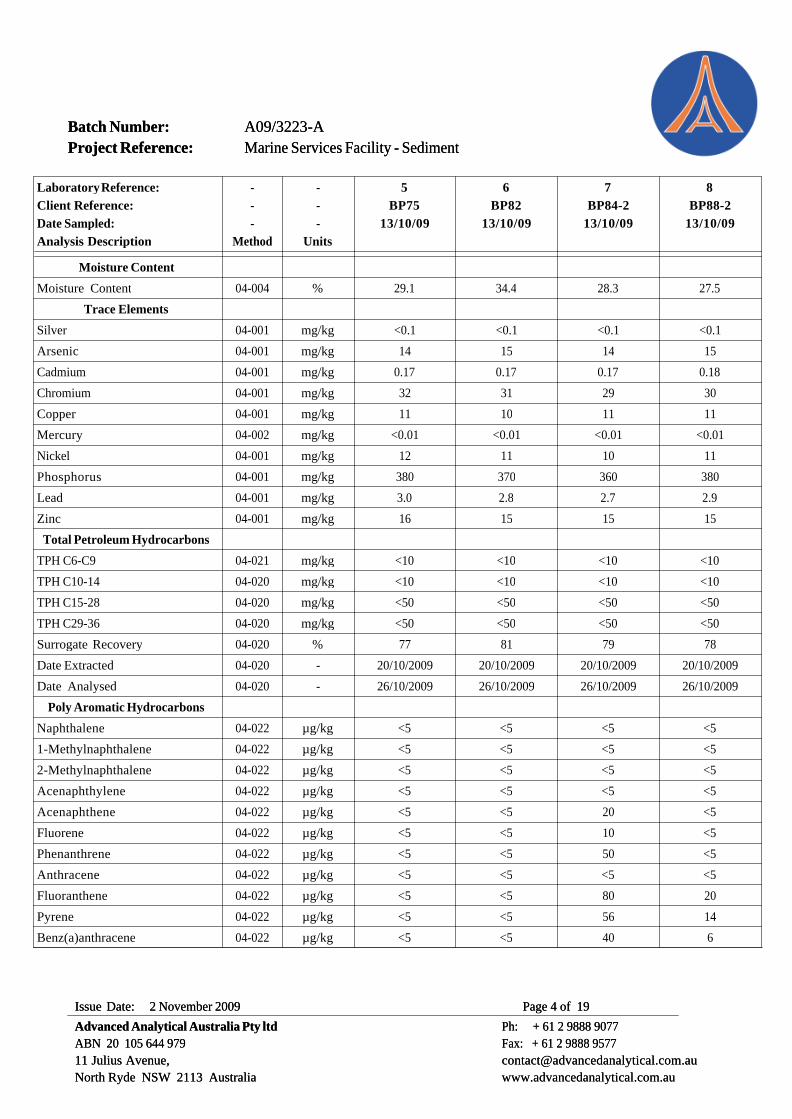
Batch Number:Batch Number: A09/3223-AA09/3223-A
Project Reference:Project Reference: Marine Services Facility - SedimentMarine Services Facility - Sediment
Laboratory Reference: - - 5 6 7 8
Client Reference: - - BP75 BP82 BP84-2 BP88-2
Date Sampled: - - 13/10/09 13/10/09 13/10/09 13/10/09
Analysis Description Method Units
Moisture Content
Moisture Content 04-004 % 29.1 34.4 28.3 27.5
Trace Elements
Silver 04-001 mg/kg <0.1 <0.1 <0.1 <0.1
Arsenic 04-001 mg/kg 14 15 14 15
Cadmium 04-001 mg/kg 0.17 0.17 0.17 0.18
Chromium 04-001 mg/kg 32 31 29 30
Copper 04-001 mg/kg 11 10 11 11
Mercury 04-002 mg/kg <0.01 <0.01 <0.01 <0.01
Nickel 04-001 mg/kg 12 11 10 11
Phosphorus 04-001 mg/kg 380 370 360 380
Lead 04-001 mg/kg 3.0 2.8 2.7 2.9
Zinc 04-001 mg/kg 16 15 15 15
Total Petroleum Hydrocarbons
TPH C6-C9 04-021 mg/kg <10 <10 <10 <10
TPH C10-14 04-020 mg/kg <10 <10 <10 <10
TPH C15-28 04-020 mg/kg <50 <50 <50 <50
TPH C29-36 04-020 mg/kg <50 <50 <50 <50
Surrogate Recovery 04-020 % 77 81 79 78
Date Extracted 04-020 - 20/10/2009 20/10/2009 20/10/2009 20/10/2009
Date Analysed 04-020 - 26/10/2009 26/10/2009 26/10/2009 26/10/2009
Poly Aromatic Hydrocarbons
Naphthalene 04-022 µg/kg <5 <5 <5 <5
1-Methylnaphthalene 04-022 µg/kg <5 <5 <5 <5
2-Methylnaphthalene 04-022 µg/kg <5 <5 <5 <5
Acenaphthylene 04-022 µg/kg <5 <5 <5 <5
Acenaphthene 04-022 µg/kg <5 <5 20 <5
Fluorene 04-022 µg/kg <5 <5 10 <5
Phenanthrene 04-022 µg/kg <5 <5 50 <5
Anthracene 04-022 µg/kg <5 <5 <5 <5
Fluoranthene 04-022 µg/kg <5 <5 80 20
Pyrene 04-022 µg/kg <5 <5 56 14
Benz(a)anthracene 04-022 µg/kg <5 <5 40 6
Page 4 of 19Page 4 of 192 November 20092 November 2009Issue Date:Issue Date:
Advanced Analytical Australia Pty ltdAdvanced Analytical Australia Pty ltd Ph: + 61 2 9888 9077Ph: + 61 2 9888 9077
ABN 20 105 644 979ABN 20 105 644 979 Fax: + 61 2 9888 9577Fax: + 61 2 9888 9577
11 Julius Avenue,11 Julius Avenue, [email protected]@advancedanalytical.com.au
North Ryde NSW 2113 AustraliaNorth Ryde NSW 2113 Australia www.advancedanalytical.com.auwww.advancedanalytical.com.au

Batch Number:Batch Number: A09/3223-AA09/3223-A
Project Reference:Project Reference: Marine Services Facility - SedimentMarine Services Facility - Sediment
Laboratory Reference: - - 5 6 7 8
Client Reference: - - BP75 BP82 BP84-2 BP88-2
Date Sampled: - - 13/10/09 13/10/09 13/10/09 13/10/09
Analysis Description Method Units
Chrysene 04-022 µg/kg <5 <5 40 8
Benzo(b)&(k)fluoranthene 04-022 µg/kg <10 <10 50 10
Benzo(a)pyrene 04-022 µg/kg <5 <5 21 <5
Indeno(1,2,3-cd)pyrene 04-022 µg/kg <5 <5 20 5
Dibenz(a,h)anthracene 04-022 µg/kg <5 <5 <5 <5
Benzo(g,h,i)perylene 04-022 µg/kg <5 <5 20 7
Coronene 04-022 µg/kg <10 <10 <10 <10
Benzo(e)pyrene 04-022 µg/kg <5 <5 18 <5
Total PAHs (as above) 04-022 µg/kg <100 <100 410 <100
Surrogate 1 Recovery 04-022 % 90 97 87 83
Surrogate 2 Recovery 04-022 % 95 96 92 82
Surrogate 3 Recovery 04-022 % 106 113 98 95
Date Extracted 04-022 - 20/10/2009 20/10/2009 20/10/2009 20/10/2009
Date Analysed 04-022 - 26/10/2009 26/10/2009 26/10/2009 26/10/2009
Organotins
Monobutyl tin 04-026 µgSn/kg <0.50 <0.50 <0.50 <0.50
Dibutyl tin 04-026 µgSn/kg <0.50 <0.50 <0.50 <0.50
Tributyl tin 04-026 µgSn/kg 2.3 <0.50 1.5 <0.50
Surrogate 1 Recovery 04-026 % 86 99 95 95
Date Extracted 04-026 - 27/10/2009 27/10/2009 27/10/2009 27/10/2009
Date Analysed 04-026 - 27/10/2009 27/10/2009 27/10/2009 27/10/2009
Subcontract Analysis
Total Organic Carbon SUB % 4.1 3.5 3.7 3.3
Nitrate as N SUB mg/kg <0.1 <0.1 0.2 0.1
Nitrite as N SUB mg/kg <0.1 <0.1 <0.1 <0.1
Total Kjeldahl Nitrogen SUB mg/kg 220 170 140 170
Total Ammonia as N SUB mg/kg 4.0 3.0 3.0 3.5
Total Nitrogen SUB mg/kg 220 170 140 170
SPOCAS SUB See attached
reports
See attached
reports
See attached
reports
See attached
reports
Page 5 of 19Page 5 of 192 November 20092 November 2009Issue Date:Issue Date:
Advanced Analytical Australia Pty ltdAdvanced Analytical Australia Pty ltd Ph: + 61 2 9888 9077Ph: + 61 2 9888 9077
ABN 20 105 644 979ABN 20 105 644 979 Fax: + 61 2 9888 9577Fax: + 61 2 9888 9577
11 Julius Avenue,11 Julius Avenue, [email protected]@advancedanalytical.com.au
North Ryde NSW 2113 AustraliaNorth Ryde NSW 2113 Australia www.advancedanalytical.com.auwww.advancedanalytical.com.au

Batch Number:Batch Number: A09/3223-AA09/3223-A
Project Reference:Project Reference: Marine Services Facility - SedimentMarine Services Facility - Sediment
Laboratory Reference: - - 9 10 11 12
Client Reference: - - BP88-3 BP95 BP104 BP107
Date Sampled: - - 13/10/09 13/10/09 13/10/09 13/10/09
Analysis Description Method Units
Moisture Content
Moisture Content 04-004 % 29.2 32.7 34.2 28.0
Trace Elements
Silver 04-001 mg/kg <0.1 <0.1 <0.1 <0.1
Arsenic 04-001 mg/kg 13 14 13 13
Cadmium 04-001 mg/kg 0.17 0.16 0.16 0.15
Chromium 04-001 mg/kg 32 38 38 28
Copper 04-001 mg/kg 11 14 13 10
Mercury 04-002 mg/kg <0.01 <0.01 <0.01 <0.01
Nickel 04-001 mg/kg 12 14 14 10
Phosphorus 04-001 mg/kg 360 370 350 340
Lead 04-001 mg/kg 3.0 3.5 3.4 2.8
Zinc 04-001 mg/kg 14 17 17 13
Total Petroleum Hydrocarbons
TPH C6-C9 04-021 mg/kg <10 <10 <10 <10
TPH C10-14 04-020 mg/kg <10 <10 <10 <10
TPH C15-28 04-020 mg/kg <50 <50 <50 <50
TPH C29-36 04-020 mg/kg <50 <50 <50 <50
Surrogate Recovery 04-020 % 89 89 83 83
Date Extracted 04-020 - 20/10/2009 20/10/2009 20/10/2009 20/10/2009
Date Analysed 04-020 - 26/10/2009 26/10/2009 26/10/2009 26/10/2009
Poly Aromatic Hydrocarbons
Naphthalene 04-022 µg/kg <5 <5 <5 <5
1-Methylnaphthalene 04-022 µg/kg <5 <5 <5 <5
2-Methylnaphthalene 04-022 µg/kg <5 <5 <5 <5
Acenaphthylene 04-022 µg/kg <5 <5 <5 <5
Acenaphthene 04-022 µg/kg <5 <5 <5 <5
Fluorene 04-022 µg/kg <5 <5 <5 <5
Phenanthrene 04-022 µg/kg <5 <5 70 <5
Anthracene 04-022 µg/kg <5 <5 <5 <5
Fluoranthene 04-022 µg/kg 6 <5 100 <5
Pyrene 04-022 µg/kg <5 <5 72 <5
Benz(a)anthracene 04-022 µg/kg <5 <5 20 <5
Page 6 of 19Page 6 of 192 November 20092 November 2009Issue Date:Issue Date:
Advanced Analytical Australia Pty ltdAdvanced Analytical Australia Pty ltd Ph: + 61 2 9888 9077Ph: + 61 2 9888 9077
ABN 20 105 644 979ABN 20 105 644 979 Fax: + 61 2 9888 9577Fax: + 61 2 9888 9577
11 Julius Avenue,11 Julius Avenue, [email protected]@advancedanalytical.com.au
North Ryde NSW 2113 AustraliaNorth Ryde NSW 2113 Australia www.advancedanalytical.com.auwww.advancedanalytical.com.au

Batch Number:Batch Number: A09/3223-AA09/3223-A
Project Reference:Project Reference: Marine Services Facility - SedimentMarine Services Facility - Sediment
Laboratory Reference: - - 9 10 11 12
Client Reference: - - BP88-3 BP95 BP104 BP107
Date Sampled: - - 13/10/09 13/10/09 13/10/09 13/10/09
Analysis Description Method Units
Chrysene 04-022 µg/kg <5 <5 40 <5
Benzo(b)&(k)fluoranthene 04-022 µg/kg <10 <10 60 <10
Benzo(a)pyrene 04-022 µg/kg <5 <5 26 <5
Indeno(1,2,3-cd)pyrene 04-022 µg/kg <5 <5 40 <5
Dibenz(a,h)anthracene 04-022 µg/kg <5 <5 <5 <5
Benzo(g,h,i)perylene 04-022 µg/kg 6 <5 30 <5
Coronene 04-022 µg/kg <10 <10 <10 <10
Benzo(e)pyrene 04-022 µg/kg <5 <5 26 <5
Total PAHs (as above) 04-022 µg/kg <100 <100 500 <100
Surrogate 1 Recovery 04-022 % 91 90 89 85
Surrogate 2 Recovery 04-022 % 95 91 74 87
Surrogate 3 Recovery 04-022 % 109 105 104 101
Date Extracted 04-022 - 20/10/2009 20/10/2009 20/10/2009 20/10/2009
Date Analysed 04-022 - 26/10/2009 26/10/2009 26/10/2009 26/10/2009
Organotins
Monobutyl tin 04-026 µgSn/kg <0.50 <0.50 <0.50 <0.50
Dibutyl tin 04-026 µgSn/kg <0.50 <0.50 <0.50 <0.50
Tributyl tin 04-026 µgSn/kg 1.8 0.60 <0.50 <0.50
Surrogate 1 Recovery 04-026 % 101 93 91 93
Date Extracted 04-026 - 27/10/2009 27/10/2009 27/10/2009 27/10/2009
Date Analysed 04-026 - 27/10/2009 27/10/2009 27/10/2009 27/10/2009
Subcontract Analysis
Total Organic Carbon SUB % 3.3 3.7 2.9 3.8
Nitrate as N SUB mg/kg <0.1 <0.1 <0.1 0.2
Nitrite as N SUB mg/kg <0.1 <0.1 <0.1 0.2
Total Kjeldahl Nitrogen SUB mg/kg 320 350 270 260
Total Ammonia as N SUB mg/kg 3.5 4.5 4.0 4.0
Total Nitrogen SUB mg/kg 320 350 270 260
SPOCAS SUB See attached
reports
See attached
reports
See attached
reports
See attached
reports
Page 7 of 19Page 7 of 192 November 20092 November 2009Issue Date:Issue Date:
Advanced Analytical Australia Pty ltdAdvanced Analytical Australia Pty ltd Ph: + 61 2 9888 9077Ph: + 61 2 9888 9077
ABN 20 105 644 979ABN 20 105 644 979 Fax: + 61 2 9888 9577Fax: + 61 2 9888 9577
11 Julius Avenue,11 Julius Avenue, [email protected]@advancedanalytical.com.au
North Ryde NSW 2113 AustraliaNorth Ryde NSW 2113 Australia www.advancedanalytical.com.auwww.advancedanalytical.com.au

Batch Number:Batch Number: A09/3223-AA09/3223-A
Project Reference:Project Reference: Marine Services Facility - SedimentMarine Services Facility - Sediment
Laboratory Reference: - - 13 14 15 16
Client Reference: - - DA1307 DA2010 DA2121 DA2212
Date Sampled: - - 13/10/09 13/10/09 13/10/09 13/10/09
Analysis Description Method Units
Moisture Content
Moisture Content 04-004 % 35.7 38.5 41.4 34.6
Trace Elements
Silver 04-001 mg/kg <0.1 <0.1 <0.1 <0.1
Arsenic 04-001 mg/kg 14 13 9.8 13
Cadmium 04-001 mg/kg 0.16 0.16 0.12 0.17
Chromium 04-001 mg/kg 49 42 39 51
Copper 04-001 mg/kg 14 11 11 14
Mercury 04-002 mg/kg <0.01 <0.01 <0.01 <0.01
Nickel 04-001 mg/kg 17 15 14 17
Phosphorus 04-001 mg/kg 320 370 230 410
Lead 04-001 mg/kg 3.7 3.2 2.9 3.4
Zinc 04-001 mg/kg 16 16 13 17
Total Petroleum Hydrocarbons
Poly Aromatic Hydrocarbons
Organotins
Monobutyl tin 04-026 µgSn/kg <0.50 <0.50 <0.50 <0.50
Dibutyl tin 04-026 µgSn/kg <0.50 <0.50 <0.50 <0.50
Tributyl tin 04-026 µgSn/kg <0.50 <0.50 <0.50 <0.50
Surrogate 1 Recovery 04-026 % 93 102 100 91
Date Extracted 04-026 - 27/10/2009 27/10/2009 27/10/2009 27/10/2009
Date Analysed 04-026 - 27/10/2009 27/10/2009 27/10/2009 27/10/2009
Subcontract Analysis
Total Organic Carbon SUB % 3.5 3.3 3.4 3.8
Nitrate as N SUB mg/kg <0.1 <0.1 <0.1 <0.1
Nitrite as N SUB mg/kg <0.1 <0.1 <0.1 <0.1
Total Kjeldahl Nitrogen SUB mg/kg 310 330 340 280
Total Ammonia as N SUB mg/kg 3.0 3.5 4.0 3.0
Total Nitrogen SUB mg/kg 310 330 340 280
SPOCAS SUB See attached
reports
See attached
reports
See attached
reports
See attached
reports
Page 8 of 19Page 8 of 192 November 20092 November 2009Issue Date:Issue Date:
Advanced Analytical Australia Pty ltdAdvanced Analytical Australia Pty ltd Ph: + 61 2 9888 9077Ph: + 61 2 9888 9077
ABN 20 105 644 979ABN 20 105 644 979 Fax: + 61 2 9888 9577Fax: + 61 2 9888 9577
11 Julius Avenue,11 Julius Avenue, [email protected]@advancedanalytical.com.au
North Ryde NSW 2113 AustraliaNorth Ryde NSW 2113 Australia www.advancedanalytical.com.auwww.advancedanalytical.com.au

Batch Number:Batch Number: A09/3223-AA09/3223-A
Project Reference:Project Reference: Marine Services Facility - SedimentMarine Services Facility - Sediment
Laboratory Reference: - - 17 18 19 20
Client Reference: - - DA2213 DA2310 DA2412 DA2506
Date Sampled: - - 13/10/09 13/10/09 13/10/09 13/10/09
Analysis Description Method Units
Moisture Content
Moisture Content 04-004 % 30.2 44.0 32.2 42.4
Trace Elements
Silver 04-001 mg/kg <0.1 <0.1 <0.1 <0.1
Arsenic 04-001 mg/kg 14 13 14 13
Cadmium 04-001 mg/kg 0.18 0.16 0.16 0.16
Chromium 04-001 mg/kg 35 59 36 49
Copper 04-001 mg/kg 9.7 16 10 14
Mercury 04-002 mg/kg <0.01 <0.01 <0.01 <0.01
Nickel 04-001 mg/kg 12 21 13 17
Phosphorus 04-001 mg/kg 410 420 340 380
Lead 04-001 mg/kg 2.9 3.7 3.1 3.6
Zinc 04-001 mg/kg 14 19 14 18
Total Petroleum Hydrocarbons
TPH C6-C9 04-021 mg/kg [NA] [NA] <10 [NA]
TPH C10-14 04-020 mg/kg [NA] [NA] <10 [NA]
TPH C15-28 04-020 mg/kg [NA] [NA] <50 [NA]
TPH C29-36 04-020 mg/kg [NA] [NA] <50 [NA]
Surrogate Recovery 04-020 % [NA] [NA] 83 [NA]
Date Extracted 04-020 - [NA] [NA] 20/10/2009 [NA]
Date Analysed 04-020 - [NA] [NA] 26/10/2009 [NA]
Poly Aromatic Hydrocarbons
Naphthalene 04-022 µg/kg [NA] [NA] <5 [NA]
1-Methylnaphthalene 04-022 µg/kg [NA] [NA] <5 [NA]
2-Methylnaphthalene 04-022 µg/kg [NA] [NA] <5 [NA]
Acenaphthylene 04-022 µg/kg [NA] [NA] <5 [NA]
Acenaphthene 04-022 µg/kg [NA] [NA] <5 [NA]
Fluorene 04-022 µg/kg [NA] [NA] <5 [NA]
Phenanthrene 04-022 µg/kg [NA] [NA] <5 [NA]
Anthracene 04-022 µg/kg [NA] [NA] <5 [NA]
Fluoranthene 04-022 µg/kg [NA] [NA] <5 [NA]
Pyrene 04-022 µg/kg [NA] [NA] <5 [NA]
Benz(a)anthracene 04-022 µg/kg [NA] [NA] <5 [NA]
Page 9 of 19Page 9 of 192 November 20092 November 2009Issue Date:Issue Date:
Advanced Analytical Australia Pty ltdAdvanced Analytical Australia Pty ltd Ph: + 61 2 9888 9077Ph: + 61 2 9888 9077
ABN 20 105 644 979ABN 20 105 644 979 Fax: + 61 2 9888 9577Fax: + 61 2 9888 9577
11 Julius Avenue,11 Julius Avenue, [email protected]@advancedanalytical.com.au
North Ryde NSW 2113 AustraliaNorth Ryde NSW 2113 Australia www.advancedanalytical.com.auwww.advancedanalytical.com.au

Batch Number:Batch Number: A09/3223-AA09/3223-A
Project Reference:Project Reference: Marine Services Facility - SedimentMarine Services Facility - Sediment
Laboratory Reference: - - 17 18 19 20
Client Reference: - - DA2213 DA2310 DA2412 DA2506
Date Sampled: - - 13/10/09 13/10/09 13/10/09 13/10/09
Analysis Description Method Units
Chrysene 04-022 µg/kg [NA] [NA] <5 [NA]
Benzo(b)&(k)fluoranthene 04-022 µg/kg [NA] [NA] <10 [NA]
Benzo(a)pyrene 04-022 µg/kg [NA] [NA] <5 [NA]
Indeno(1,2,3-cd)pyrene 04-022 µg/kg [NA] [NA] <5 [NA]
Dibenz(a,h)anthracene 04-022 µg/kg [NA] [NA] <5 [NA]
Benzo(g,h,i)perylene 04-022 µg/kg [NA] [NA] <5 [NA]
Coronene 04-022 µg/kg [NA] [NA] <10 [NA]
Benzo(e)pyrene 04-022 µg/kg [NA] [NA] <5 [NA]
Total PAHs (as above) 04-022 µg/kg [NA] [NA] <100 [NA]
Surrogate 1 Recovery 04-022 % [NA] [NA] 88 [NA]
Surrogate 2 Recovery 04-022 % [NA] [NA] 86 [NA]
Surrogate 3 Recovery 04-022 % [NA] [NA] 103 [NA]
Date Extracted 04-022 - [NA] [NA] 20/10/2009 [NA]
Date Analysed 04-022 - [NA] [NA] 26/10/2009 [NA]
Organotins
Monobutyl tin 04-026 µgSn/kg <0.50 <0.50 <0.50 <0.50
Dibutyl tin 04-026 µgSn/kg 0.70 <0.50 <0.50 <0.50
Tributyl tin 04-026 µgSn/kg 36 <0.50 <0.50 <0.50
Surrogate 1 Recovery 04-026 % 92 89 96 78
Date Extracted 04-026 - 27/10/2009 27/10/2009 27/10/2009 27/10/2009
Date Analysed 04-026 - 27/10/2009 27/10/2009 27/10/2009 27/10/2009
Subcontract Analysis
Total Organic Carbon SUB % 4.5 2.9 2.4 3.2
Nitrate as N SUB mg/kg <0.1 <0.1 <0.1 <0.1
Nitrite as N SUB mg/kg <0.1 <0.1 <0.1 <0.1
Total Kjeldahl Nitrogen SUB mg/kg 260 370 190 350
Total Ammonia as N SUB mg/kg 3.5 5.0 3.5 5.0
Total Nitrogen SUB mg/kg 260 370 190 350
SPOCAS SUB See attached
reports
See attached
reports
See attached
reports
See attached
reports
Page 10 of 19Page 10 of 192 November 20092 November 2009Issue Date:Issue Date:
Advanced Analytical Australia Pty ltdAdvanced Analytical Australia Pty ltd Ph: + 61 2 9888 9077Ph: + 61 2 9888 9077
ABN 20 105 644 979ABN 20 105 644 979 Fax: + 61 2 9888 9577Fax: + 61 2 9888 9577
11 Julius Avenue,11 Julius Avenue, [email protected]@advancedanalytical.com.au
North Ryde NSW 2113 AustraliaNorth Ryde NSW 2113 Australia www.advancedanalytical.com.auwww.advancedanalytical.com.au

Batch Number:Batch Number: A09/3223-AA09/3223-A
Project Reference:Project Reference: Marine Services Facility - SedimentMarine Services Facility - Sediment
Laboratory Reference: - - 21 22 23 24
Client Reference: - - DA2513 DA2610 DA2810 DA2910
Date Sampled: - - 13/10/09 13/10/09 13/10/09 13/10/09
Analysis Description Method Units
Moisture Content
Moisture Content 04-004 % 36.8 38.7 48.4 41.9
Trace Elements
Silver 04-001 mg/kg <0.1 <0.1 <0.1 <0.1
Arsenic 04-001 mg/kg 13 13 13 13
Cadmium 04-001 mg/kg 0.16 0.17 0.15 0.16
Chromium 04-001 mg/kg 46 43 58 51
Copper 04-001 mg/kg 14 13 16 14
Mercury 04-002 mg/kg <0.01 <0.01 <0.01 <0.01
Nickel 04-001 mg/kg 16 15 20 18
Phosphorus 04-001 mg/kg 360 340 400 370
Lead 04-001 mg/kg 3.5 3.4 3.7 3.6
Zinc 04-001 mg/kg 18 16 20 18
Total Petroleum Hydrocarbons
TPH C6-C9 04-021 mg/kg [NA] [NA] <10 <10
TPH C10-14 04-020 mg/kg [NA] [NA] <10 <10
TPH C15-28 04-020 mg/kg [NA] [NA] <50 <50
TPH C29-36 04-020 mg/kg [NA] [NA] <50 <50
Surrogate Recovery 04-020 % [NA] [NA] 93 73
Date Extracted 04-020 - [NA] [NA] 20/10/2009 20/10/2009
Date Analysed 04-020 - [NA] [NA] 26/10/2009 26/10/2009
Poly Aromatic Hydrocarbons
Naphthalene 04-022 µg/kg [NA] [NA] <5 <5
1-Methylnaphthalene 04-022 µg/kg [NA] [NA] <5 <5
2-Methylnaphthalene 04-022 µg/kg [NA] [NA] <5 <5
Acenaphthylene 04-022 µg/kg [NA] [NA] <5 <5
Acenaphthene 04-022 µg/kg [NA] [NA] <5 <5
Fluorene 04-022 µg/kg [NA] [NA] <5 <5
Phenanthrene 04-022 µg/kg [NA] [NA] <5 <5
Anthracene 04-022 µg/kg [NA] [NA] <5 <5
Fluoranthene 04-022 µg/kg [NA] [NA] <5 <5
Pyrene 04-022 µg/kg [NA] [NA] <5 <5
Benz(a)anthracene 04-022 µg/kg [NA] [NA] <5 <5
Page 11 of 19Page 11 of 192 November 20092 November 2009Issue Date:Issue Date:
Advanced Analytical Australia Pty ltdAdvanced Analytical Australia Pty ltd Ph: + 61 2 9888 9077Ph: + 61 2 9888 9077
ABN 20 105 644 979ABN 20 105 644 979 Fax: + 61 2 9888 9577Fax: + 61 2 9888 9577
11 Julius Avenue,11 Julius Avenue, [email protected]@advancedanalytical.com.au
North Ryde NSW 2113 AustraliaNorth Ryde NSW 2113 Australia www.advancedanalytical.com.auwww.advancedanalytical.com.au

Batch Number:Batch Number: A09/3223-AA09/3223-A
Project Reference:Project Reference: Marine Services Facility - SedimentMarine Services Facility - Sediment
Laboratory Reference: - - 21 22 23 24
Client Reference: - - DA2513 DA2610 DA2810 DA2910
Date Sampled: - - 13/10/09 13/10/09 13/10/09 13/10/09
Analysis Description Method Units
Chrysene 04-022 µg/kg [NA] [NA] <5 <5
Benzo(b)&(k)fluoranthene 04-022 µg/kg [NA] [NA] <10 <10
Benzo(a)pyrene 04-022 µg/kg [NA] [NA] <5 <5
Indeno(1,2,3-cd)pyrene 04-022 µg/kg [NA] [NA] <5 <5
Dibenz(a,h)anthracene 04-022 µg/kg [NA] [NA] <5 <5
Benzo(g,h,i)perylene 04-022 µg/kg [NA] [NA] <5 <5
Coronene 04-022 µg/kg [NA] [NA] <10 <10
Benzo(e)pyrene 04-022 µg/kg [NA] [NA] <5 <5
Total PAHs (as above) 04-022 µg/kg [NA] [NA] <100 <100
Surrogate 1 Recovery 04-022 % [NA] [NA] 97 98
Surrogate 2 Recovery 04-022 % [NA] [NA] 98 97
Surrogate 3 Recovery 04-022 % [NA] [NA] 115 115
Date Extracted 04-022 - [NA] [NA] 20/10/2009 20/10/2009
Date Analysed 04-022 - [NA] [NA] 26/10/2009 26/10/2009
Organotins
Monobutyl tin 04-026 µgSn/kg <0.50 <0.50 <0.50 <0.50
Dibutyl tin 04-026 µgSn/kg <0.50 <0.50 <0.50 <0.50
Tributyl tin 04-026 µgSn/kg <0.50 <0.50 <0.50 <0.50
Surrogate 1 Recovery 04-026 % 81 84 88 86
Date Extracted 04-026 - 27/10/2009 27/10/2009 27/10/2009 27/10/2009
Date Analysed 04-026 - 27/10/2009 27/10/2009 27/10/2009 27/10/2009
Subcontract Analysis
Total Organic Carbon SUB % 2.9 3.6 3.1 3.3
Nitrate as N SUB mg/kg <0.1 <0.1 <0.1 <0.1
Nitrite as N SUB mg/kg <0.1 <0.1 <0.1 <0.1
Total Kjeldahl Nitrogen SUB mg/kg 360 250 340 160
Total Ammonia as N SUB mg/kg 4.5 4.0 5.0 4.0
Total Nitrogen SUB mg/kg 360 250 340 160
SPOCAS SUB See attached
reports
See attached
reports
See attached
reports
See attached
reports
Page 12 of 19Page 12 of 192 November 20092 November 2009Issue Date:Issue Date:
Advanced Analytical Australia Pty ltdAdvanced Analytical Australia Pty ltd Ph: + 61 2 9888 9077Ph: + 61 2 9888 9077
ABN 20 105 644 979ABN 20 105 644 979 Fax: + 61 2 9888 9577Fax: + 61 2 9888 9577
11 Julius Avenue,11 Julius Avenue, [email protected]@advancedanalytical.com.au
North Ryde NSW 2113 AustraliaNorth Ryde NSW 2113 Australia www.advancedanalytical.com.auwww.advancedanalytical.com.au

Batch Number:Batch Number: A09/3223-AA09/3223-A
Project Reference:Project Reference: Marine Services Facility - SedimentMarine Services Facility - Sediment
Method Method Description
04-004 Moisture by gravimetric, %
04-001 Metals by ICP-OES, mg/kg
04-002 Mercury by CVAAS, mg/kg
04-021 TPH C6-9 & BTEX by P&T GCMS, mg/kg
04-020 TPH by GC-FID, mg/kg
04-022 Low level PAHs & Phenols by GCMS, µg/kg
04-026 Organotins by GCMS, µgSn/kg
SUB Subcontracted Analyses
Result CommentsResult Comments
[<][<] Less thanLess than
[INS][INS] Insufficient sample for this testInsufficient sample for this test
[NA][NA] Test not requiredTest not required
Results reported on an 'as received' basis.Results reported on an 'as received' basis.
Monobutyltin spike recovery biased low due to matrix effects. Monobutyltin spike recovery biased low due to matrix effects.
Duplicate reproducibility for PAH analytes for sample #11 affected by heterogeneity, confirmed by re-extraction.Duplicate reproducibility for PAH analytes for sample #11 affected by heterogeneity, confirmed by re-extraction.
TN, TKN, Nitrate, Nitrite, Ammonia and TOC was subcontracted to Sydney Analytical Laboratories (NATA Number 1884); TN, TKN, Nitrate, Nitrite, Ammonia and TOC was subcontracted to Sydney Analytical Laboratories (NATA Number 1884);
reference SAL report number SAL22325B.reference SAL report number SAL22325B.
SPOCAS analysis was subcontracted to Australian Laboratory Services (NATA Number 825); see attached ALSE reports SPOCAS analysis was subcontracted to Australian Laboratory Services (NATA Number 825); see attached ALSE reports
for work order EP0905895.for work order EP0905895.
Page 13 of 19Page 13 of 192 November 20092 November 2009Issue Date:Issue Date:
Advanced Analytical Australia Pty ltdAdvanced Analytical Australia Pty ltd Ph: + 61 2 9888 9077Ph: + 61 2 9888 9077
ABN 20 105 644 979ABN 20 105 644 979 Fax: + 61 2 9888 9577Fax: + 61 2 9888 9577
11 Julius Avenue,11 Julius Avenue, [email protected]@advancedanalytical.com.au
North Ryde NSW 2113 AustraliaNorth Ryde NSW 2113 Australia www.advancedanalytical.com.auwww.advancedanalytical.com.au

Batch Number:Batch Number: A09/3223-AA09/3223-A
Project Reference:Project Reference: Marine Services Facility - SedimentMarine Services Facility - Sediment
QUALITY ASSURANCE REPORTQUALITY ASSURANCE REPORT
TEST UNITS Blank Duplicate Sm# Duplicate Results
Moisture Content % N/T A09/3223-A-1 33.0 || 29.4 || RPD: 12
TEST UNITS Blank Duplicate Sm# Duplicate Results Spike Sm# Spike
Results
Silver mg/kg <0.1 A09/3223-A-1 <0.1 || <0.1 A09/3223-A-1 126%
Arsenic mg/kg <0.4 A09/3223-A-1 16 || 16 || RPD: 0 A09/3223-A-1 121%
Cadmium mg/kg <0.1 A09/3223-A-1 0.20 || 0.20 || RPD: 0 A09/3223-A-1 117%
Chromium mg/kg <0.1 A09/3223-A-1 34 || 35 || RPD: 3 A09/3223-A-1 94%
Copper mg/kg <0.1 A09/3223-A-1 13 || 13 || RPD: 0 A09/3223-A-1 117%
Mercury mg/kg <0.01 A09/3223-A-1 <0.01 || <0.01 A09/3223-A-1 96%
Nickel mg/kg <0.1 A09/3223-A-1 12 || 13 || RPD: 8 A09/3223-A-1 83%
Phosphorus mg/kg <1 A09/3223-A-1 440 || 430 || RPD: 2 A09/3223-A-1 106%
Lead mg/kg <0.5 A09/3223-A-1 3.1 || 3.4 || RPD: 9 A09/3223-A-1 84%
Zinc mg/kg <0.5 A09/3223-A-1 16 || 17 || RPD: 6 A09/3223-A-1 81%
TEST UNITS Blank Duplicate Sm# Duplicate Results Spike Sm# Spike
Results
TPH C6-C9 mg/kg <10 A09/3223-A-1 <10 || <10 A09/3223-A-1 67%
TPH C10-14 mg/kg <10 A09/3223-A-1 <10 || <10 A09/3223-A-1 80%
TPH C15-28 mg/kg <50 A09/3223-A-1 <50 || <50 A09/3223-A-1 89%
TPH C29-36 mg/kg <50 A09/3223-A-1 <50 || <50 A09/3223-A-1 92%
Surrogate Recovery % 95 A09/3223-A-1 101 || 112 || RPD: 10 A09/3223-A-1 87%
TEST UNITS Blank Duplicate Sm# Duplicate Results Spike Sm# Spike
Results
Naphthalene µg/kg <5 A09/3223-A-1 <5 || <5 A09/3223-A-1 86%
1-Methylnaphthalene µg/kg <5 A09/3223-A-1 <5 || <5 A09/3223-A-1 92%
2-Methylnaphthalene µg/kg <5 A09/3223-A-1 <5 || <5 A09/3223-A-1 89%
Acenaphthylene µg/kg <5 A09/3223-A-1 <5 || <5 A09/3223-A-1 94%
Acenaphthene µg/kg <5 A09/3223-A-1 <5 || <5 A09/3223-A-1 97%
Fluorene µg/kg <5 A09/3223-A-1 <5 || <5 A09/3223-A-1 109%
Phenanthrene µg/kg <5 A09/3223-A-1 <5 || <5 A09/3223-A-1 116%
Anthracene µg/kg <5 A09/3223-A-1 <5 || <5 A09/3223-A-1 106%
Fluoranthene µg/kg <5 A09/3223-A-1 <5 || 6 A09/3223-A-1 125%
Pyrene µg/kg <5 A09/3223-A-1 <5 || <5 A09/3223-A-1 113%
Benz(a)anthracene µg/kg <5 A09/3223-A-1 <5 || <5 A09/3223-A-1 107%
Chrysene µg/kg <5 A09/3223-A-1 <5 || <5 A09/3223-A-1 101%
Benzo(b)&(k)fluoranthene µg/kg <10 A09/3223-A-1 <10 || <10 A09/3223-A-1 102%
Benzo(a)pyrene µg/kg <5 A09/3223-A-1 <5 || <5 A09/3223-A-1 90%
Page 14 of 19Page 14 of 192 November 20092 November 2009Issue Date:Issue Date:
Advanced Analytical Australia Pty ltdAdvanced Analytical Australia Pty ltd Ph: + 61 2 9888 9077Ph: + 61 2 9888 9077
ABN 20 105 644 979ABN 20 105 644 979 Fax: + 61 2 9888 9577Fax: + 61 2 9888 9577
11 Julius Avenue,11 Julius Avenue, [email protected]@advancedanalytical.com.au
North Ryde NSW 2113 AustraliaNorth Ryde NSW 2113 Australia www.advancedanalytical.com.auwww.advancedanalytical.com.au

Batch Number:Batch Number: A09/3223-AA09/3223-A
Project Reference:Project Reference: Marine Services Facility - SedimentMarine Services Facility - Sediment
TEST UNITS Blank Duplicate Sm# Duplicate Results Spike Sm# Spike
Results
Indeno(1,2,3-cd)pyrene µg/kg <5 A09/3223-A-1 <5 || <5 A09/3223-A-1 116%
Dibenz(a,h)anthracene µg/kg <5 A09/3223-A-1 <5 || <5 A09/3223-A-1 116%
Benzo(g,h,i)perylene µg/kg <5 A09/3223-A-1 <5 || 6 A09/3223-A-1 105%
Coronene µg/kg <10 A09/3223-A-1 <10 || <10 A09/3223-A-1 113%
Benzo(e)pyrene µg/kg <5 A09/3223-A-1 <5 || <5 A09/3223-A-1 102%
Total PAHs (as above) µg/kg <100 A09/3223-A-1 <100 || <100 A09/3223-A-1 N/A
Surrogate 1 Recovery % 91 A09/3223-A-1 88 || 98 || RPD: 11 A09/3223-A-1 96%
Surrogate 2 Recovery % 89 A09/3223-A-1 94 || 100 || RPD: 6 A09/3223-A-1 113%
Surrogate 3 Recovery % 104 A09/3223-A-1 106 || 117 || RPD: 10 A09/3223-A-1 112%
TEST UNITS Blank Duplicate Sm# Duplicate Results Spike Sm# Spike
Results
Monobutyl tin µgSn/kg <0.50 A09/3223-A-1 <0.50 || <0.50 A09/3223-A-1 15%
Dibutyl tin µgSn/kg <0.50 A09/3223-A-1 <0.50 || <0.50 A09/3223-A-1 79%
Tributyl tin µgSn/kg <0.50 A09/3223-A-1 1.0 || 0.60 || RPD: 50 A09/3223-A-1 86%
Surrogate 1 Recovery % 100 A09/3223-A-1 92 || 94 || RPD: 2 A09/3223-A-1 99%
TEST UNITS Blank
Total Organic Carbon % <0.01
Nitrate as N mg/kg <0.1
Nitrite as N mg/kg <0.1
Total Kjeldahl Nitrogen mg/kg <20
Total Ammonia as N mg/kg <0.5
Total Nitrogen mg/kg <20
TEST Units Blank Duplicate Sm# Duplicate Results
Moisture Content % [NT] A09/3223-A-11 34.2 || 33.0 || RPD: 4
TEST Units Blank Duplicate Sm# Duplicate Results Spike Sm# Spike
Results
Silver mg/kg [NT] A09/3223-A-11 <0.1 || <0.1 A09/3223-A-21 126%
Arsenic mg/kg [NT] A09/3223-A-11 13 || 13 || RPD: 0 A09/3223-A-21 115%
Cadmium mg/kg [NT] A09/3223-A-11 0.16 || 0.15 || RPD: 6 A09/3223-A-21 114%
Chromium mg/kg [NT] A09/3223-A-11 38 || 38 || RPD: 0 A09/3223-A-21 91%
Copper mg/kg [NT] A09/3223-A-11 13 || 14 || RPD: 7 A09/3223-A-21 119%
Mercury mg/kg [NT] A09/3223-A-11 <0.01 || <0.01 A09/3223-A-21 88%
Nickel mg/kg [NT] A09/3223-A-11 14 || 14 || RPD: 0 A09/3223-A-21 81%
Phosphorus mg/kg [NT] A09/3223-A-11 350 || 350 || RPD: 0 A09/3223-A-21 107%
Lead mg/kg [NT] A09/3223-A-11 3.4 || 3.4 || RPD: 0 A09/3223-A-21 81%
Zinc mg/kg [NT] A09/3223-A-11 17 || 17 || RPD: 0 A09/3223-A-21 77%
Page 15 of 19Page 15 of 192 November 20092 November 2009Issue Date:Issue Date:
Advanced Analytical Australia Pty ltdAdvanced Analytical Australia Pty ltd Ph: + 61 2 9888 9077Ph: + 61 2 9888 9077
ABN 20 105 644 979ABN 20 105 644 979 Fax: + 61 2 9888 9577Fax: + 61 2 9888 9577
11 Julius Avenue,11 Julius Avenue, [email protected]@advancedanalytical.com.au
North Ryde NSW 2113 AustraliaNorth Ryde NSW 2113 Australia www.advancedanalytical.com.auwww.advancedanalytical.com.au

Batch Number:Batch Number: A09/3223-AA09/3223-A
Project Reference:Project Reference: Marine Services Facility - SedimentMarine Services Facility - Sediment
TEST Units Blank Duplicate Sm# Duplicate Results
TPH C6-C9 mg/kg [NT] A09/3223-A-11 <10 || <10
TPH C10-14 mg/kg [NT] A09/3223-A-11 <10 || <10
TPH C15-28 mg/kg [NT] A09/3223-A-11 <50 || <50
TPH C29-36 mg/kg [NT] A09/3223-A-11 <50 || <50
Surrogate Recovery % [NT] A09/3223-A-11 83 || 90 || RPD: 8
TEST Units Blank Duplicate Sm# Duplicate Results
Naphthalene µg/kg [NT] A09/3223-A-11 <5 || <5
1-Methylnaphthalene µg/kg [NT] A09/3223-A-11 <5 || <5
2-Methylnaphthalene µg/kg [NT] A09/3223-A-11 <5 || <5
Acenaphthylene µg/kg [NT] A09/3223-A-11 <5 || <5
Acenaphthene µg/kg [NT] A09/3223-A-11 <5 || <5
Fluorene µg/kg [NT] A09/3223-A-11 <5 || <5
Phenanthrene µg/kg [NT] A09/3223-A-11 70 || <5
Anthracene µg/kg [NT] A09/3223-A-11 <5 || <5
Fluoranthene µg/kg [NT] A09/3223-A-11 100 || <5
Pyrene µg/kg [NT] A09/3223-A-11 72 || <5
Benz(a)anthracene µg/kg [NT] A09/3223-A-11 20 || <5
Chrysene µg/kg [NT] A09/3223-A-11 40 || <5
Benzo(b)&(k)fluoranthene µg/kg [NT] A09/3223-A-11 60 || <10
Benzo(a)pyrene µg/kg [NT] A09/3223-A-11 26 || <5
Indeno(1,2,3-cd)pyrene µg/kg [NT] A09/3223-A-11 40 || <5
Dibenz(a,h)anthracene µg/kg [NT] A09/3223-A-11 <5 || <5
Benzo(g,h,i)perylene µg/kg [NT] A09/3223-A-11 30 || <5
Coronene µg/kg [NT] A09/3223-A-11 <10 || <10
Benzo(e)pyrene µg/kg [NT] A09/3223-A-11 26 || <5
Total PAHs (as above) µg/kg [NT] A09/3223-A-11 500 || <100
Surrogate 1 Recovery % [NT] A09/3223-A-11 89 || 91 || RPD: 2
Surrogate 2 Recovery % [NT] A09/3223-A-11 74 || 98 || RPD: 28
Surrogate 3 Recovery % [NT] A09/3223-A-11 104 || 112 || RPD: 7
Page 16 of 19Page 16 of 192 November 20092 November 2009Issue Date:Issue Date:
Advanced Analytical Australia Pty ltdAdvanced Analytical Australia Pty ltd Ph: + 61 2 9888 9077Ph: + 61 2 9888 9077
ABN 20 105 644 979ABN 20 105 644 979 Fax: + 61 2 9888 9577Fax: + 61 2 9888 9577
11 Julius Avenue,11 Julius Avenue, [email protected]@advancedanalytical.com.au
North Ryde NSW 2113 AustraliaNorth Ryde NSW 2113 Australia www.advancedanalytical.com.auwww.advancedanalytical.com.au

Batch Number:Batch Number: A09/3223-AA09/3223-A
Project Reference:Project Reference: Marine Services Facility - SedimentMarine Services Facility - Sediment
TEST Units Blank Duplicate Sm# Duplicate Results Spike Sm# Spike
Results
Monobutyl tin µgSn/kg [NT] A09/3223-A-11 <0.50 || <0.50 A09/3223-A-21 15%
Dibutyl tin µgSn/kg [NT] A09/3223-A-11 <0.50 || <0.50 A09/3223-A-21 76%
Tributyl tin µgSn/kg [NT] A09/3223-A-11 <0.50 || <0.50 A09/3223-A-21 83%
Surrogate 1 Recovery % [NT] A09/3223-A-11 91 || 92 || RPD: 1 A09/3223-A-21 92%
TEST Units Blank Duplicate Sm# Duplicate Results
Moisture Content % [NT] A09/3223-A-21 36.8 || 38.0 || RPD: 3
TEST Units Blank Duplicate Sm# Duplicate Results
Silver mg/kg [NT] A09/3223-A-21 <0.1 || <0.1
Arsenic mg/kg [NT] A09/3223-A-21 13 || 13 || RPD: 0
Cadmium mg/kg [NT] A09/3223-A-21 0.16 || 0.15 || RPD: 6
Chromium mg/kg [NT] A09/3223-A-21 46 || 47 || RPD: 2
Copper mg/kg [NT] A09/3223-A-21 14 || 14 || RPD: 0
Mercury mg/kg [NT] A09/3223-A-21 <0.01 || <0.01
Nickel mg/kg [NT] A09/3223-A-21 16 || 17 || RPD: 6
Phosphorus mg/kg [NT] A09/3223-A-21 360 || 360 || RPD: 0
Lead mg/kg [NT] A09/3223-A-21 3.5 || 3.6 || RPD: 3
Zinc mg/kg [NT] A09/3223-A-21 18 || 18 || RPD: 0
TEST Units Blank Duplicate Sm# Duplicate Results Spike Sm# Spike
Results
Monobutyl tin µgSn/kg [NT] A09/3223-A-21 <0.50 || <0.50 External 96%
Dibutyl tin µgSn/kg [NT] A09/3223-A-21 <0.50 || <0.50 External 91%
Tributyl tin µgSn/kg [NT] A09/3223-A-21 <0.50 || <0.50 External 98%
Surrogate 1 Recovery % [NT] A09/3223-A-21 81 || 79 || RPD: 2 External 107%
TEST Units Blank Duplicate Sm# Duplicate Results
Naphthalene µg/kg [NT] A09/3223-A-11 <5 || <5
1-Methylnaphthalene µg/kg [NT] A09/3223-A-11 <5 || <5
2-Methylnaphthalene µg/kg [NT] A09/3223-A-11 <5 || <5
Acenaphthylene µg/kg [NT] A09/3223-A-11 <5 || <5
Acenaphthene µg/kg [NT] A09/3223-A-11 <5 || <5
Fluorene µg/kg [NT] A09/3223-A-11 <5 || <5
Phenanthrene µg/kg [NT] A09/3223-A-11 70 || <5
Anthracene µg/kg [NT] A09/3223-A-11 <5 || <5
Fluoranthene µg/kg [NT] A09/3223-A-11 100 || <5
Pyrene µg/kg [NT] A09/3223-A-11 72 || <5
Benz(a)anthracene µg/kg [NT] A09/3223-A-11 20 || <5
Chrysene µg/kg [NT] A09/3223-A-11 40 || <5
Benzo(b)&(k)fluoranthene µg/kg [NT] A09/3223-A-11 60 || <10
Benzo(a)pyrene µg/kg [NT] A09/3223-A-11 26 || <5
Indeno(1,2,3-cd)pyrene µg/kg [NT] A09/3223-A-11 40 || <5
Page 17 of 19Page 17 of 192 November 20092 November 2009Issue Date:Issue Date:
Advanced Analytical Australia Pty ltdAdvanced Analytical Australia Pty ltd Ph: + 61 2 9888 9077Ph: + 61 2 9888 9077
ABN 20 105 644 979ABN 20 105 644 979 Fax: + 61 2 9888 9577Fax: + 61 2 9888 9577
11 Julius Avenue,11 Julius Avenue, [email protected]@advancedanalytical.com.au
North Ryde NSW 2113 AustraliaNorth Ryde NSW 2113 Australia www.advancedanalytical.com.auwww.advancedanalytical.com.au

Batch Number:Batch Number: A09/3223-AA09/3223-A
Project Reference:Project Reference: Marine Services Facility - SedimentMarine Services Facility - Sediment
TEST Units Blank Duplicate Sm# Duplicate Results
Dibenz(a,h)anthracene µg/kg [NT] A09/3223-A-11 <5 || <5
Benzo(g,h,i)perylene µg/kg [NT] A09/3223-A-11 30 || <5
Coronene µg/kg [NT] A09/3223-A-11 <10 || <10
Benzo(e)pyrene µg/kg [NT] A09/3223-A-11 26 || <5
Total PAHs (as above) µg/kg [NT] A09/3223-A-11 500 || <100
Surrogate 1 Recovery % [NT] A09/3223-A-11 89 || 91 || RPD: 2
Surrogate 2 Recovery % [NT] A09/3223-A-11 74 || 98 || RPD: 28
Surrogate 3 Recovery % [NT] A09/3223-A-11 104 || 112 || RPD: 7
Page 18 of 19Page 18 of 192 November 20092 November 2009Issue Date:Issue Date:
Advanced Analytical Australia Pty ltdAdvanced Analytical Australia Pty ltd Ph: + 61 2 9888 9077Ph: + 61 2 9888 9077
ABN 20 105 644 979ABN 20 105 644 979 Fax: + 61 2 9888 9577Fax: + 61 2 9888 9577
11 Julius Avenue,11 Julius Avenue, [email protected]@advancedanalytical.com.au
North Ryde NSW 2113 AustraliaNorth Ryde NSW 2113 Australia www.advancedanalytical.com.auwww.advancedanalytical.com.au

Batch Number:Batch Number: A09/3223-AA09/3223-A
Project Reference:Project Reference: Marine Services Facility - SedimentMarine Services Facility - Sediment
Comments:Comments:
RPDRPD = Relative Percent Deviation= Relative Percent Deviation
[NT][NT] = Not Tested= Not Tested
[N/A][N/A] = Not Applicable= Not Applicable
'#''#' = Spike recovery data could not be calculated due to high levels of contaminants= Spike recovery data could not be calculated due to high levels of contaminants
Acceptable replicate reproducibility limit or RPD:Acceptable replicate reproducibility limit or RPD: Results < 10 times LOR: no limits.Results < 10 times LOR: no limits.
Results >10 times LOR: 0% - 50%.Results >10 times LOR: 0% - 50%.
Acceptable matrix spike & LCS recovery limits:Acceptable matrix spike & LCS recovery limits: Trace elements 70-130%Trace elements 70-130%
Organic analyses 50-150%Organic analyses 50-150%
SVOC & speciated phenols 10-140%SVOC & speciated phenols 10-140%
Surrogates 10-140%Surrogates 10-140%
When levels outside these limits are obtained, an investigation into the cause of the deviationWhen levels outside these limits are obtained, an investigation into the cause of the deviation
is performed before the batch is accepted or rejected, and results are released.is performed before the batch is accepted or rejected, and results are released.
Page 19 of 19Page 19 of 192 November 20092 November 2009Issue Date:Issue Date:
Advanced Analytical Australia Pty ltdAdvanced Analytical Australia Pty ltd Ph: + 61 2 9888 9077Ph: + 61 2 9888 9077
ABN 20 105 644 979ABN 20 105 644 979 Fax: + 61 2 9888 9577Fax: + 61 2 9888 9577
11 Julius Avenue,11 Julius Avenue, [email protected]@advancedanalytical.com.au
North Ryde NSW 2113 AustraliaNorth Ryde NSW 2113 Australia www.advancedanalytical.com.auwww.advancedanalytical.com.au

REPORT OF ANALYSISREPORT OF ANALYSIS
Laboratory Reference:Laboratory Reference: A09/3208-DA09/3208-D
Order No:Order No:Client:Client: WorleyParsons Services Pty LtdWorleyParsons Services Pty Ltd
Level 7, QV1 Building, 250 St Georges TceLevel 7, QV1 Building, 250 St Georges Tce Project:Project: Marine Services Facility - ElutriateMarine Services Facility - Elutriate
Perth WA 6000Perth WA 6000 Sample Type:Sample Type: Sediment - ElutriateSediment - Elutriate
No. of Samples:No. of Samples: 2929
Contact:Contact: Peter MellorPeter Mellor Date Received:Date Received: 13/10/0913/10/09
Date Completed:Date Completed: 30/10/200930/10/2009
Laboratory Contact Details:Laboratory Contact Details:
Client Services Manager:Client Services Manager: Jane StruthersJane Struthers
Technical Enquiries:Technical Enquiries: Andrew BradburyAndrew Bradbury
Telephone:Telephone: +61 8 9325 9799+61 8 9325 9799
Fax:Fax: +61 8 9325 4299+61 8 9325 4299
Email:Email: [email protected]@advancedanalytical.com.au
[email protected]@advancedanalytical.com.au
Attached Results Approved By:Attached Results Approved By:
Comments:Comments:
All samples tested as submitted by client. All attached results have been checked and approved for release.All samples tested as submitted by client. All attached results have been checked and approved for release.
This is the Final Report and supersedes any reports previously issued with this batch number.This is the Final Report and supersedes any reports previously issued with this batch number.
This document is issued in accordance with NATA's accreditation requirements. Accredited for complianceThis document is issued in accordance with NATA's accreditation requirements. Accredited for compliance
with ISO/IEC 17025. This document shall not be reproduced, except in full.with ISO/IEC 17025. This document shall not be reproduced, except in full.
Page 1 of 5Page 1 of 530 October 200930 October 2009Issue Date:Issue Date:
Advanced Analytical Australia Pty ltdAdvanced Analytical Australia Pty ltd Ph: + 61 2 9888 9077Ph: + 61 2 9888 9077
ABN 20 105 644 979ABN 20 105 644 979 Fax: + 61 2 9888 9577Fax: + 61 2 9888 9577
11 Julius Avenue,11 Julius Avenue, [email protected]@advancedanalytical.com.au
North Ryde NSW 2113 AustraliaNorth Ryde NSW 2113 Australia www.advancedanalytical.com.auwww.advancedanalytical.com.au

Batch Number:Batch Number: A09/3208-DA09/3208-D
Project Reference:Project Reference: Marine Services Facility - ElutriateMarine Services Facility - Elutriate
Laboratory Reference: - - 1 5 7 9
Client Reference: - - BP1103-0.0 DA1607-0.0 DA2009-0.0 DA2204
Date Sampled: - - 12/10/09 12/10/09 12/10/09 12/10/09
Analysis Description Method Units
Subcontract Analysis
*COD on Sediment Elutriate SUB mg/L 6 4 8 3
*BOD on Sediment Elutriate SUB mg/L 5 <2 5 <2
Laboratory Reference: - - 10 12 13 15
Client Reference: - - DA2304-0.0 DA2305 DA2306-0.0 DA2404
Date Sampled: - - 12/10/09 12/10/09 12/10/09 12/10/09
Analysis Description Method Units
Subcontract Analysis
*COD on Sediment Elutriate SUB mg/L 4 <2 4 6
*BOD on Sediment Elutriate SUB mg/L 3 <2 <2 <2
Laboratory Reference: - - 16 17 18 20
Client Reference: - - DA2602 DA2604 DA2703 DA2803
Date Sampled: - - 12/10/09 12/10/09 12/10/09 12/10/09
Analysis Description Method Units
Subcontract Analysis
*COD on Sediment Elutriate SUB mg/L 5 5 9 4
*BOD on Sediment Elutriate SUB mg/L <2 <2 9 2
Page 2 of 5Page 2 of 530 October 200930 October 2009Issue Date:Issue Date:
Advanced Analytical Australia Pty ltdAdvanced Analytical Australia Pty ltd Ph: + 61 2 9888 9077Ph: + 61 2 9888 9077
ABN 20 105 644 979ABN 20 105 644 979 Fax: + 61 2 9888 9577Fax: + 61 2 9888 9577
11 Julius Avenue,11 Julius Avenue, [email protected]@advancedanalytical.com.au
North Ryde NSW 2113 AustraliaNorth Ryde NSW 2113 Australia www.advancedanalytical.com.auwww.advancedanalytical.com.au
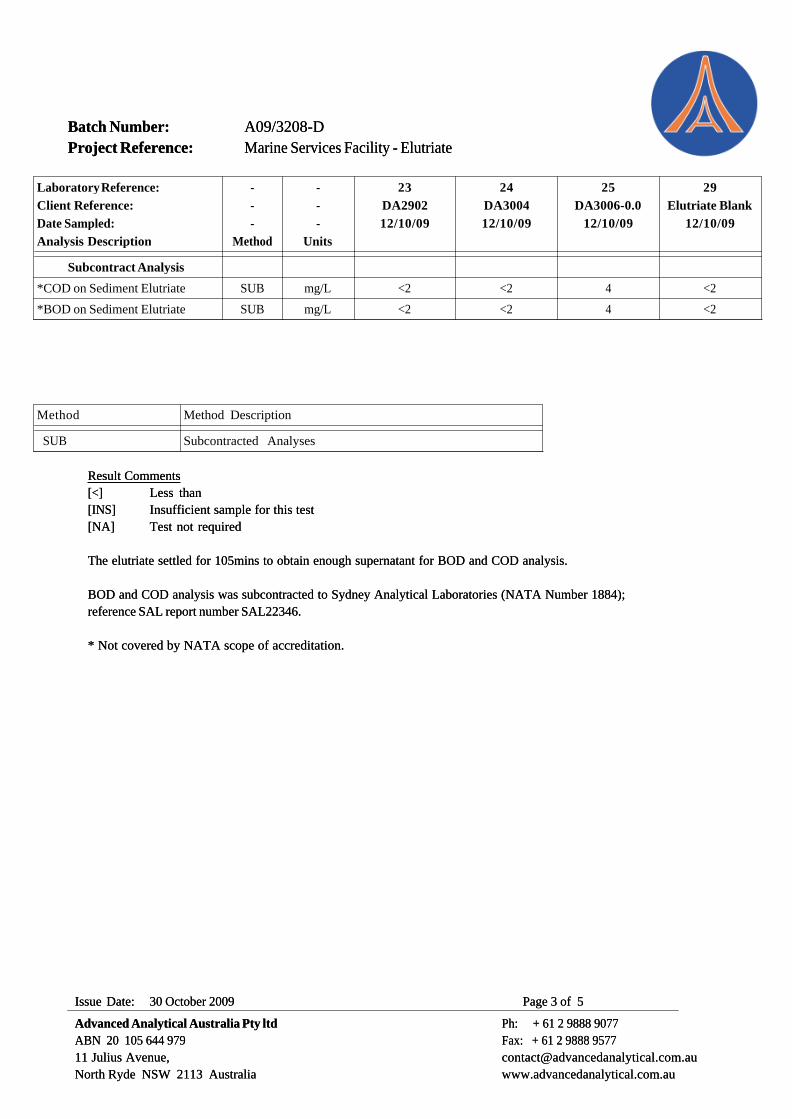
Batch Number:Batch Number: A09/3208-DA09/3208-D
Project Reference:Project Reference: Marine Services Facility - ElutriateMarine Services Facility - Elutriate
Laboratory Reference: - - 23 24 25 29
Client Reference: - - DA2902 DA3004 DA3006-0.0 Elutriate Blank
Date Sampled: - - 12/10/09 12/10/09 12/10/09 12/10/09
Analysis Description Method Units
Subcontract Analysis
*COD on Sediment Elutriate SUB mg/L <2 <2 4 <2
*BOD on Sediment Elutriate SUB mg/L <2 <2 4 <2
Method Method Description
SUB Subcontracted Analyses
Result CommentsResult Comments
[<][<] Less thanLess than
[INS][INS] Insufficient sample for this testInsufficient sample for this test
[NA][NA] Test not requiredTest not required
The elutriate settled for 105mins to obtain enough supernatant for BOD and COD analysis.The elutriate settled for 105mins to obtain enough supernatant for BOD and COD analysis.
BOD and COD analysis was subcontracted to Sydney Analytical Laboratories (NATA Number 1884); BOD and COD analysis was subcontracted to Sydney Analytical Laboratories (NATA Number 1884);
reference SAL report number SAL22346.reference SAL report number SAL22346.
* Not covered by NATA scope of accreditation.* Not covered by NATA scope of accreditation.
Page 3 of 5Page 3 of 530 October 200930 October 2009Issue Date:Issue Date:
Advanced Analytical Australia Pty ltdAdvanced Analytical Australia Pty ltd Ph: + 61 2 9888 9077Ph: + 61 2 9888 9077
ABN 20 105 644 979ABN 20 105 644 979 Fax: + 61 2 9888 9577Fax: + 61 2 9888 9577
11 Julius Avenue,11 Julius Avenue, [email protected]@advancedanalytical.com.au
North Ryde NSW 2113 AustraliaNorth Ryde NSW 2113 Australia www.advancedanalytical.com.auwww.advancedanalytical.com.au

Batch Number:Batch Number: A09/3208-DA09/3208-D
Project Reference:Project Reference: Marine Services Facility - ElutriateMarine Services Facility - Elutriate
QUALITY ASSURANCE REPORTQUALITY ASSURANCE REPORT
Page 4 of 5Page 4 of 530 October 200930 October 2009Issue Date:Issue Date:
Advanced Analytical Australia Pty ltdAdvanced Analytical Australia Pty ltd Ph: + 61 2 9888 9077Ph: + 61 2 9888 9077
ABN 20 105 644 979ABN 20 105 644 979 Fax: + 61 2 9888 9577Fax: + 61 2 9888 9577
11 Julius Avenue,11 Julius Avenue, [email protected]@advancedanalytical.com.au
North Ryde NSW 2113 AustraliaNorth Ryde NSW 2113 Australia www.advancedanalytical.com.auwww.advancedanalytical.com.au

Batch Number:Batch Number: A09/3208-DA09/3208-D
Project Reference:Project Reference: Marine Services Facility - ElutriateMarine Services Facility - Elutriate
Comments:Comments:
RPDRPD = Relative Percent Deviation= Relative Percent Deviation
[NT][NT] = Not Tested= Not Tested
[N/A][N/A] = Not Applicable= Not Applicable
'#''#' = Spike recovery data could not be calculated due to high levels of contaminants= Spike recovery data could not be calculated due to high levels of contaminants
Acceptable replicate reproducibility limit or RPD:Acceptable replicate reproducibility limit or RPD: Results < 10 times LOR: no limits.Results < 10 times LOR: no limits.
Results >10 times LOR: 0% - 50%.Results >10 times LOR: 0% - 50%.
Acceptable matrix spike & LCS recovery limits:Acceptable matrix spike & LCS recovery limits: Trace elements 70-130%Trace elements 70-130%
Organic analyses 50-150%Organic analyses 50-150%
SVOC & speciated phenols 10-140%SVOC & speciated phenols 10-140%
Surrogates 10-140%Surrogates 10-140%
When levels outside these limits are obtained, an investigation into the cause of the deviationWhen levels outside these limits are obtained, an investigation into the cause of the deviation
is performed before the batch is accepted or rejected, and results are released.is performed before the batch is accepted or rejected, and results are released.
Page 5 of 5Page 5 of 530 October 200930 October 2009Issue Date:Issue Date:
Advanced Analytical Australia Pty ltdAdvanced Analytical Australia Pty ltd Ph: + 61 2 9888 9077Ph: + 61 2 9888 9077
ABN 20 105 644 979ABN 20 105 644 979 Fax: + 61 2 9888 9577Fax: + 61 2 9888 9577
11 Julius Avenue,11 Julius Avenue, [email protected]@advancedanalytical.com.au
North Ryde NSW 2113 AustraliaNorth Ryde NSW 2113 Australia www.advancedanalytical.com.auwww.advancedanalytical.com.au

REPORT OF ANALYSISREPORT OF ANALYSIS
Laboratory Reference:Laboratory Reference: A09/3208-CA09/3208-C
Order No:Order No:Client:Client: WorleyParsons Services Pty LtdWorleyParsons Services Pty Ltd
Level 7, QV1 Building, 250 St Georges TceLevel 7, QV1 Building, 250 St Georges Tce Project:Project: Marine Services Facility - Sediment ASSMarine Services Facility - Sediment ASS
Perth WA 6000Perth WA 6000 Sample Type:Sample Type: SedimentSediment
No. of Samples:No. of Samples: 2828
Contact:Contact: Peter MellorPeter Mellor Date Received:Date Received: 13/10/0913/10/09
Date Completed:Date Completed: 30/10/200930/10/2009
Laboratory Contact Details:Laboratory Contact Details:
Client Services Manager:Client Services Manager: Jane StruthersJane Struthers
Technical Enquiries:Technical Enquiries: Andrew BradburyAndrew Bradbury
Telephone:Telephone: +61 8 9325 9799+61 8 9325 9799
Fax:Fax: +61 8 9325 4299+61 8 9325 4299
Email:Email: [email protected]@advancedanalytical.com.au
[email protected]@advancedanalytical.com.au
Attached Results Approved By:Attached Results Approved By:
Comments:Comments:
All samples tested as submitted by client. All attached results have been checked and approved for release.All samples tested as submitted by client. All attached results have been checked and approved for release.
This is the Final Report and supersedes any reports previously issued with this batch number.This is the Final Report and supersedes any reports previously issued with this batch number.
This document is issued in accordance with NATA's accreditation requirements. Accredited for complianceThis document is issued in accordance with NATA's accreditation requirements. Accredited for compliance
with ISO/IEC 17025. This document shall not be reproduced, except in full.with ISO/IEC 17025. This document shall not be reproduced, except in full.
Page 1 of 5Page 1 of 530 October 200930 October 2009Issue Date:Issue Date:
Advanced Analytical Australia Pty ltdAdvanced Analytical Australia Pty ltd Ph: + 61 2 9888 9077Ph: + 61 2 9888 9077
ABN 20 105 644 979ABN 20 105 644 979 Fax: + 61 2 9888 9577Fax: + 61 2 9888 9577
11 Julius Avenue,11 Julius Avenue, [email protected]@advancedanalytical.com.au
North Ryde NSW 2113 AustraliaNorth Ryde NSW 2113 Australia www.advancedanalytical.com.auwww.advancedanalytical.com.au

Batch Number:Batch Number: A09/3208-CA09/3208-C
Project Reference:Project Reference: Marine Services Facility - Sediment ASSMarine Services Facility - Sediment ASS
Laboratory Reference: - - 1 5 7 9
Client Reference: - - BP1103-0.0 DA1607-0.0 DA2009-0.0 DA2204
Date Sampled: - - 12/10/09 12/10/09 12/10/09 12/10/09
Analysis Description Method Units
Subcontract Analysis
Acid Volatile Sulfur (AVS) SUB See attached
reports
See attached
reports
See attached
reports
See attached
reports
SPOCAS SUB See attached
reports
See attached
reports
See attached
reports
See attached
reports
*SPOCAS on -75µm fraction SUB See attached
reports
See attached
reports
See attached
reports
See attached
reports
Chromium Reducible Suite SUB See attached
reports
See attached
reports
See attached
reports
See attached
reports
Laboratory Reference: - - 10 12 13 15
Client Reference: - - DA2304-0.0 DA2305 DA2306-0.0 DA2404
Date Sampled: - - 12/10/09 12/10/09 12/10/09 12/10/09
Analysis Description Method Units
Subcontract Analysis
Acid Volatile Sulfur (AVS) SUB See attached
reports
See attached
reports
See attached
reports
See attached
reports
SPOCAS SUB See attached
reports
See attached
reports
See attached
reports
See attached
reports
*SPOCAS on -75µm fraction SUB See attached
reports
See attached
reports
See attached
reports
See attached
reports
Chromium Reducible Suite SUB See attached
reports
See attached
reports
See attached
reports
See attached
reports
Page 2 of 5Page 2 of 530 October 200930 October 2009Issue Date:Issue Date:
Advanced Analytical Australia Pty ltdAdvanced Analytical Australia Pty ltd Ph: + 61 2 9888 9077Ph: + 61 2 9888 9077
ABN 20 105 644 979ABN 20 105 644 979 Fax: + 61 2 9888 9577Fax: + 61 2 9888 9577
11 Julius Avenue,11 Julius Avenue, [email protected]@advancedanalytical.com.au
North Ryde NSW 2113 AustraliaNorth Ryde NSW 2113 Australia www.advancedanalytical.com.auwww.advancedanalytical.com.au

Batch Number:Batch Number: A09/3208-CA09/3208-C
Project Reference:Project Reference: Marine Services Facility - Sediment ASSMarine Services Facility - Sediment ASS
Laboratory Reference: - - 16 17 18 20
Client Reference: - - DA2602 DA2604 DA2703 DA2803
Date Sampled: - - 12/10/09 12/10/09 12/10/09 12/10/09
Analysis Description Method Units
Subcontract Analysis
Acid Volatile Sulfur (AVS) SUB See attached
reports
See attached
reports
See attached
reports
See attached
reports
SPOCAS SUB See attached
reports
See attached
reports
See attached
reports
See attached
reports
*SPOCAS on -75µm fraction SUB See attached
reports
See attached
reports
See attached
reports
See attached
reports
Chromium Reducible Suite SUB See attached
reports
See attached
reports
See attached
reports
See attached
reports
Laboratory Reference: - - 23 24 25
Client Reference: - - DA2902 DA3004 DA3006-0.0
Date Sampled: - - 12/10/09 12/10/09 12/10/09
Analysis Description Method Units
Subcontract Analysis
Acid Volatile Sulfur (AVS) SUB See attached
reports
See attached
reports
See attached
reports
SPOCAS SUB See attached
reports
See attached
reports
See attached
reports
*SPOCAS on -75µm fraction SUB See attached
reports
See attached
reports
See attached
reports
Chromium Reducible Suite SUB See attached
reports
See attached
reports
See attached
reports
Method Method Description
SUB Subcontracted Analyses
Result CommentsResult Comments
[<][<] Less thanLess than
[INS][INS] Insufficient sample for this testInsufficient sample for this test
[NA][NA] Test not requiredTest not required
Analysis of samples sieved to -75µm is not covered by NATA scope of accreditation.Analysis of samples sieved to -75µm is not covered by NATA scope of accreditation.
AVS, SPOCAS, SPOCAS on -75µm fraction and Chromium Reducible Suite was subcontracted to Australian LaboratoryAVS, SPOCAS, SPOCAS on -75µm fraction and Chromium Reducible Suite was subcontracted to Australian Laboratory
Services (NATA Number 825); see attached ALSE reports for work order EP0905867.Services (NATA Number 825); see attached ALSE reports for work order EP0905867.
Page 3 of 5Page 3 of 530 October 200930 October 2009Issue Date:Issue Date:
Advanced Analytical Australia Pty ltdAdvanced Analytical Australia Pty ltd Ph: + 61 2 9888 9077Ph: + 61 2 9888 9077
ABN 20 105 644 979ABN 20 105 644 979 Fax: + 61 2 9888 9577Fax: + 61 2 9888 9577
11 Julius Avenue,11 Julius Avenue, [email protected]@advancedanalytical.com.au
North Ryde NSW 2113 AustraliaNorth Ryde NSW 2113 Australia www.advancedanalytical.com.auwww.advancedanalytical.com.au

Batch Number:Batch Number: A09/3208-CA09/3208-C
Project Reference:Project Reference: Marine Services Facility - Sediment ASSMarine Services Facility - Sediment ASS
QUALITY ASSURANCE REPORTQUALITY ASSURANCE REPORT
Page 4 of 5Page 4 of 530 October 200930 October 2009Issue Date:Issue Date:
Advanced Analytical Australia Pty ltdAdvanced Analytical Australia Pty ltd Ph: + 61 2 9888 9077Ph: + 61 2 9888 9077
ABN 20 105 644 979ABN 20 105 644 979 Fax: + 61 2 9888 9577Fax: + 61 2 9888 9577
11 Julius Avenue,11 Julius Avenue, [email protected]@advancedanalytical.com.au
North Ryde NSW 2113 AustraliaNorth Ryde NSW 2113 Australia www.advancedanalytical.com.auwww.advancedanalytical.com.au

Batch Number:Batch Number: A09/3208-CA09/3208-C
Project Reference:Project Reference: Marine Services Facility - Sediment ASSMarine Services Facility - Sediment ASS
Comments:Comments:
RPDRPD = Relative Percent Deviation= Relative Percent Deviation
[NT][NT] = Not Tested= Not Tested
[N/A][N/A] = Not Applicable= Not Applicable
'#''#' = Spike recovery data could not be calculated due to high levels of contaminants= Spike recovery data could not be calculated due to high levels of contaminants
Acceptable replicate reproducibility limit or RPD:Acceptable replicate reproducibility limit or RPD: Results < 10 times LOR: no limits.Results < 10 times LOR: no limits.
Results >10 times LOR: 0% - 50%.Results >10 times LOR: 0% - 50%.
Acceptable matrix spike & LCS recovery limits:Acceptable matrix spike & LCS recovery limits: Trace elements 70-130%Trace elements 70-130%
Organic analyses 50-150%Organic analyses 50-150%
SVOC & speciated phenols 10-140%SVOC & speciated phenols 10-140%
Surrogates 10-140%Surrogates 10-140%
When levels outside these limits are obtained, an investigation into the cause of the deviationWhen levels outside these limits are obtained, an investigation into the cause of the deviation
is performed before the batch is accepted or rejected, and results are released.is performed before the batch is accepted or rejected, and results are released.
Page 5 of 5Page 5 of 530 October 200930 October 2009Issue Date:Issue Date:
Advanced Analytical Australia Pty ltdAdvanced Analytical Australia Pty ltd Ph: + 61 2 9888 9077Ph: + 61 2 9888 9077
ABN 20 105 644 979ABN 20 105 644 979 Fax: + 61 2 9888 9577Fax: + 61 2 9888 9577
11 Julius Avenue,11 Julius Avenue, [email protected]@advancedanalytical.com.au
North Ryde NSW 2113 AustraliaNorth Ryde NSW 2113 Australia www.advancedanalytical.com.auwww.advancedanalytical.com.au

REPORT OF ANALYSISREPORT OF ANALYSIS
Laboratory Reference:Laboratory Reference: A09/3208-BA09/3208-B
Order No:Order No:Client:Client: WorleyParsons Services Pty LtdWorleyParsons Services Pty Ltd
Level 7, QV1 Building, 250 St Georges TceLevel 7, QV1 Building, 250 St Georges Tce Project:Project: Marine Services Facility - Sediment PSDMarine Services Facility - Sediment PSD
Perth WA 6000Perth WA 6000 Sample Type:Sample Type: sedimentsediment
No. of Samples:No. of Samples: 2828
Contact:Contact: Peter MellorPeter Mellor Date Received:Date Received: 13/10/0913/10/09
Date Completed:Date Completed: 2/11/20092/11/2009
Laboratory Contact Details:Laboratory Contact Details:
Client Services Manager:Client Services Manager: Jane StruthersJane Struthers
Technical Enquiries:Technical Enquiries: Andrew BradburyAndrew Bradbury
Telephone:Telephone: +61 8 9325 9799+61 8 9325 9799
Fax:Fax: +61 8 9325 4299+61 8 9325 4299
Email:Email: [email protected]@advancedanalytical.com.au
[email protected]@advancedanalytical.com.au
Attached Results Approved By:Attached Results Approved By:
Comments:Comments:
All samples tested as submitted by client. All attached results have been checked and approved for release.All samples tested as submitted by client. All attached results have been checked and approved for release.
This is the Final Report and supersedes any reports previously issued with this batch number.This is the Final Report and supersedes any reports previously issued with this batch number.
This document is issued in accordance with NATA's accreditation requirements. Accredited for complianceThis document is issued in accordance with NATA's accreditation requirements. Accredited for compliance
with ISO/IEC 17025. This document shall not be reproduced, except in full.with ISO/IEC 17025. This document shall not be reproduced, except in full.
Page 1 of 6Page 1 of 62 November 2009 {Interim Report Date}2 November 2009 {Interim Report Date}Issue Date:Issue Date:
Advanced Analytical Australia Pty ltdAdvanced Analytical Australia Pty ltd Ph: + 61 2 9888 9077Ph: + 61 2 9888 9077
ABN 20 105 644 979ABN 20 105 644 979 Fax: + 61 2 9888 9577Fax: + 61 2 9888 9577
11 Julius Avenue,11 Julius Avenue, [email protected]@advancedanalytical.com.au
North Ryde NSW 2113 AustraliaNorth Ryde NSW 2113 Australia www.advancedanalytical.com.auwww.advancedanalytical.com.au

Batch Number:Batch Number: A09/3208-BA09/3208-B
Project Reference:Project Reference: Marine Services Facility - Sediment PSDMarine Services Facility - Sediment PSD
Laboratory Reference: - - 1 2 3 4
Client Reference: - - BP1103-0.0 BP1103-1.0 BP1108-0.0-2 BP1108-0.0-3
Date Sampled: - - 12/10/09 12/10/09 12/10/09 12/10/09
Analysis Description Method Units
Subcontract Analysis
Particle Size Distribution SUB See attached
reports
See attached
reports
See attached
reports
See attached
reports
Laboratory Reference: - - 5 6 7 8
Client Reference: - - DA1607-0.0 DA1607-1.0 DA2009-0.0 DA2009-1.0
Date Sampled: - - 12/10/09 12/10/09 12/10/09 12/10/09
Analysis Description Method Units
Subcontract Analysis
Particle Size Distribution SUB See attached
reports
See attached
reports
See attached
reports
See attached
reports
Laboratory Reference: - - 9 10 11 12
Client Reference: - - DA2204 DA2304-0.0 DA2304-1.0 DA2305
Date Sampled: - - 12/10/09 12/10/09 12/10/09 12/10/09
Analysis Description Method Units
Subcontract Analysis
Particle Size Distribution SUB See attached
reports
See attached
reports
See attached
reports
See attached
reports
Page 2 of 6Page 2 of 62 November 2009 {Interim Report Date}2 November 2009 {Interim Report Date}Issue Date:Issue Date:
Advanced Analytical Australia Pty ltdAdvanced Analytical Australia Pty ltd Ph: + 61 2 9888 9077Ph: + 61 2 9888 9077
ABN 20 105 644 979ABN 20 105 644 979 Fax: + 61 2 9888 9577Fax: + 61 2 9888 9577
11 Julius Avenue,11 Julius Avenue, [email protected]@advancedanalytical.com.au
North Ryde NSW 2113 AustraliaNorth Ryde NSW 2113 Australia www.advancedanalytical.com.auwww.advancedanalytical.com.au

Batch Number:Batch Number: A09/3208-BA09/3208-B
Project Reference:Project Reference: Marine Services Facility - Sediment PSDMarine Services Facility - Sediment PSD
Laboratory Reference: - - 13 14 15 16
Client Reference: - - DA2306-0.0 DA2306-1.0 DA2404 DA2602
Date Sampled: - - 12/10/09 12/10/09 12/10/09 12/10/09
Analysis Description Method Units
Subcontract Analysis
Particle Size Distribution SUB See attached
reports
See attached
reports
See attached
reports
See attached
reports
Laboratory Reference: - - 17 18 19 20
Client Reference: - - DA2604 DA2703 DA2705 DA2803
Date Sampled: - - 12/10/09 12/10/09 12/10/09 12/10/09
Analysis Description Method Units
Subcontract Analysis
Particle Size Distribution SUB See attached
reports
See attached
reports
See attached
reports
See attached
reports
Laboratory Reference: - - 21 22 23 24
Client Reference: - - DA2806-0.0-2 DA2806-0.0-3 DA2902 DA3004
Date Sampled: - - 12/10/09 12/10/09 12/10/09 12/10/09
Analysis Description Method Units
Subcontract Analysis
Particle Size Distribution SUB See attached
reports
See attached
reports
See attached
reports
See attached
reports
Page 3 of 6Page 3 of 62 November 2009 {Interim Report Date}2 November 2009 {Interim Report Date}Issue Date:Issue Date:
Advanced Analytical Australia Pty ltdAdvanced Analytical Australia Pty ltd Ph: + 61 2 9888 9077Ph: + 61 2 9888 9077
ABN 20 105 644 979ABN 20 105 644 979 Fax: + 61 2 9888 9577Fax: + 61 2 9888 9577
11 Julius Avenue,11 Julius Avenue, [email protected]@advancedanalytical.com.au
North Ryde NSW 2113 AustraliaNorth Ryde NSW 2113 Australia www.advancedanalytical.com.auwww.advancedanalytical.com.au

Batch Number:Batch Number: A09/3208-BA09/3208-B
Project Reference:Project Reference: Marine Services Facility - Sediment PSDMarine Services Facility - Sediment PSD
Laboratory Reference: - - 25 26 27 28
Client Reference: - - DA3006-0.0 DA3006-1.0 DA8006-0.0-2 DA8006-0.0-3
Date Sampled: - - 12/10/09 12/10/09 12/10/09 12/10/09
Analysis Description Method Units
Subcontract Analysis
Particle Size Distribution SUB See attached
reports
See attached
reports
See attached
reports
See attached
reports
Method Method Description
SUB Subcontracted Analyses
Result CommentsResult Comments
[<][<] Less thanLess than
[INS][INS] Insufficient sample for this testInsufficient sample for this test
[NA][NA] Test not requiredTest not required
PSD analysis (by Sieve and Hydrometer) was subcontracted to Golder Associates (NATA Number 1446); PSD analysis (by Sieve and Hydrometer) was subcontracted to Golder Associates (NATA Number 1446);
see attached Golder report number 097634002/40.see attached Golder report number 097634002/40.
Page 4 of 6Page 4 of 62 November 2009 {Interim Report Date}2 November 2009 {Interim Report Date}Issue Date:Issue Date:
Advanced Analytical Australia Pty ltdAdvanced Analytical Australia Pty ltd Ph: + 61 2 9888 9077Ph: + 61 2 9888 9077
ABN 20 105 644 979ABN 20 105 644 979 Fax: + 61 2 9888 9577Fax: + 61 2 9888 9577
11 Julius Avenue,11 Julius Avenue, [email protected]@advancedanalytical.com.au
North Ryde NSW 2113 AustraliaNorth Ryde NSW 2113 Australia www.advancedanalytical.com.auwww.advancedanalytical.com.au

Batch Number:Batch Number: A09/3208-BA09/3208-B
Project Reference:Project Reference: Marine Services Facility - Sediment PSDMarine Services Facility - Sediment PSD
QUALITY ASSURANCE REPORTQUALITY ASSURANCE REPORT
Page 5 of 6Page 5 of 62 November 2009 {Interim Report Date}2 November 2009 {Interim Report Date}Issue Date:Issue Date:
Advanced Analytical Australia Pty ltdAdvanced Analytical Australia Pty ltd Ph: + 61 2 9888 9077Ph: + 61 2 9888 9077
ABN 20 105 644 979ABN 20 105 644 979 Fax: + 61 2 9888 9577Fax: + 61 2 9888 9577
11 Julius Avenue,11 Julius Avenue, [email protected]@advancedanalytical.com.au
North Ryde NSW 2113 AustraliaNorth Ryde NSW 2113 Australia www.advancedanalytical.com.auwww.advancedanalytical.com.au

Batch Number:Batch Number: A09/3208-BA09/3208-B
Project Reference:Project Reference: Marine Services Facility - Sediment PSDMarine Services Facility - Sediment PSD
Comments:Comments:
RPDRPD = Relative Percent Deviation= Relative Percent Deviation
[NT][NT] = Not Tested= Not Tested
[N/A][N/A] = Not Applicable= Not Applicable
'#''#' = Spike recovery data could not be calculated due to high levels of contaminants= Spike recovery data could not be calculated due to high levels of contaminants
Acceptable replicate reproducibility limit or RPD:Acceptable replicate reproducibility limit or RPD: Results < 10 times LOR: no limits.Results < 10 times LOR: no limits.
Results >10 times LOR: 0% - 50%.Results >10 times LOR: 0% - 50%.
Acceptable matrix spike & LCS recovery limits:Acceptable matrix spike & LCS recovery limits: Trace elements 70-130%Trace elements 70-130%
Organic analyses 50-150%Organic analyses 50-150%
SVOC & speciated phenols 10-140%SVOC & speciated phenols 10-140%
Surrogates 10-140%Surrogates 10-140%
When levels outside these limits are obtained, an investigation into the cause of the deviationWhen levels outside these limits are obtained, an investigation into the cause of the deviation
is performed before the batch is accepted or rejected, and results are released.is performed before the batch is accepted or rejected, and results are released.
Page 6 of 6Page 6 of 62 November 2009 {Interim Report Date}2 November 2009 {Interim Report Date}Issue Date:Issue Date:
Advanced Analytical Australia Pty ltdAdvanced Analytical Australia Pty ltd Ph: + 61 2 9888 9077Ph: + 61 2 9888 9077
ABN 20 105 644 979ABN 20 105 644 979 Fax: + 61 2 9888 9577Fax: + 61 2 9888 9577
11 Julius Avenue,11 Julius Avenue, [email protected]@advancedanalytical.com.au
North Ryde NSW 2113 AustraliaNorth Ryde NSW 2113 Australia www.advancedanalytical.com.auwww.advancedanalytical.com.au

REPORT OF ANALYSISREPORT OF ANALYSIS
Laboratory Reference:Laboratory Reference: A09/3223-BA09/3223-B
Order No:Order No:Client:Client: WorleyParsons Services Pty LtdWorleyParsons Services Pty Ltd
Level 7, QV1 Building, 250 St Georges TceLevel 7, QV1 Building, 250 St Georges Tce Project:Project: Marine Services Facility - Sediment PSDMarine Services Facility - Sediment PSD
Perth WA 6000Perth WA 6000 Sample Type:Sample Type: sedimentsediment
No. of Samples:No. of Samples: 2424
Contact:Contact: Peter MellorPeter Mellor Date Received:Date Received: 14/10/0914/10/09
Date Completed:Date Completed: 3/11/20093/11/2009
Laboratory Contact Details:Laboratory Contact Details:
Client Services Manager:Client Services Manager: Jane StruthersJane Struthers
Technical Enquiries:Technical Enquiries: Andrew BradburyAndrew Bradbury
Telephone:Telephone: +61 8 9325 9799+61 8 9325 9799
Fax:Fax: +61 8 9325 4299+61 8 9325 4299
Email:Email: [email protected]@advancedanalytical.com.au
[email protected]@advancedanalytical.com.au
Attached Results Approved By:Attached Results Approved By:
Comments:Comments:
All samples tested as submitted by client. All attached results have been checked and approved for release.All samples tested as submitted by client. All attached results have been checked and approved for release.
This is the Final Report and supersedes any reports previously issued with this batch number.This is the Final Report and supersedes any reports previously issued with this batch number.
This document is issued in accordance with NATA's accreditation requirements. Accredited for complianceThis document is issued in accordance with NATA's accreditation requirements. Accredited for compliance
with ISO/IEC 17025. This document shall not be reproduced, except in full.with ISO/IEC 17025. This document shall not be reproduced, except in full.
Page 1 of 5Page 1 of 53 November 2009 {Interim Report Date}3 November 2009 {Interim Report Date}Issue Date:Issue Date:
Advanced Analytical Australia Pty ltdAdvanced Analytical Australia Pty ltd Ph: + 61 2 9888 9077Ph: + 61 2 9888 9077
ABN 20 105 644 979ABN 20 105 644 979 Fax: + 61 2 9888 9577Fax: + 61 2 9888 9577
11 Julius Avenue,11 Julius Avenue, [email protected]@advancedanalytical.com.au
North Ryde NSW 2113 AustraliaNorth Ryde NSW 2113 Australia www.advancedanalytical.com.auwww.advancedanalytical.com.au

Batch Number:Batch Number: A09/3223-BA09/3223-B
Project Reference:Project Reference: Marine Services Facility - Sediment PSDMarine Services Facility - Sediment PSD
Laboratory Reference: - - 1 2 3 4
Client Reference: - - BP54 BP56 BP64 BP68-2
Date Sampled: - - 13/10/09 13/10/09 13/10/09 13/10/09
Analysis Description Method Units
Subcontract Analysis
Particle Size Distribution SUB See attached
report
See attached
report
See attached
report
See attached
report
Laboratory Reference: - - 5 6 7 8
Client Reference: - - BP75 BP82 BP84-2 BP88-2
Date Sampled: - - 13/10/09 13/10/09 13/10/09 13/10/09
Analysis Description Method Units
Subcontract Analysis
Particle Size Distribution SUB See attached
report
See attached
report
See attached
report
See attached
report
Laboratory Reference: - - 9 10 11 12
Client Reference: - - BP88-3 BP95 BP104 BP107
Date Sampled: - - 13/10/09 13/10/09 13/10/09 13/10/09
Analysis Description Method Units
Subcontract Analysis
Particle Size Distribution SUB See attached
report
See attached
report
See attached
report
See attached
report
Page 2 of 5Page 2 of 53 November 2009 {Interim Report Date}3 November 2009 {Interim Report Date}Issue Date:Issue Date:
Advanced Analytical Australia Pty ltdAdvanced Analytical Australia Pty ltd Ph: + 61 2 9888 9077Ph: + 61 2 9888 9077
ABN 20 105 644 979ABN 20 105 644 979 Fax: + 61 2 9888 9577Fax: + 61 2 9888 9577
11 Julius Avenue,11 Julius Avenue, [email protected]@advancedanalytical.com.au
North Ryde NSW 2113 AustraliaNorth Ryde NSW 2113 Australia www.advancedanalytical.com.auwww.advancedanalytical.com.au

Batch Number:Batch Number: A09/3223-BA09/3223-B
Project Reference:Project Reference: Marine Services Facility - Sediment PSDMarine Services Facility - Sediment PSD
Laboratory Reference: - - 13 14 15 16
Client Reference: - - DA1307 DA2010 DA2121 DA2212
Date Sampled: - - 13/10/09 13/10/09 13/10/09 13/10/09
Analysis Description Method Units
Subcontract Analysis
Particle Size Distribution SUB See attached
report
See attached
report
See attached
report
See attached
report
Laboratory Reference: - - 17 18 19 20
Client Reference: - - DA2213 DA2310 DA2412 DA2506
Date Sampled: - - 13/10/09 13/10/09 13/10/09 13/10/09
Analysis Description Method Units
Subcontract Analysis
Particle Size Distribution SUB See attached
report
See attached
report
See attached
report
See attached
report
Laboratory Reference: - - 21 22 23 24
Client Reference: - - DA2513 DA2610 DA2810 DA2910
Date Sampled: - - 13/10/09 13/10/09 13/10/09 13/10/09
Analysis Description Method Units
Subcontract Analysis
Particle Size Distribution SUB See attached
report
See attached
report
See attached
report
See attached
report
Method Method Description
SUB Subcontracted Analyses
Result CommentsResult Comments
[<][<] Less thanLess than
[INS][INS] Insufficient sample for this testInsufficient sample for this test
[NA][NA] Test not requiredTest not required
PSD (Sieve and Hydrometer) analysis was subcontracted to Golder Associates (NATA Number 1446); PSD (Sieve and Hydrometer) analysis was subcontracted to Golder Associates (NATA Number 1446);
see attached Golder report number 097634002/40.see attached Golder report number 097634002/40.
Page 3 of 5Page 3 of 53 November 2009 {Interim Report Date}3 November 2009 {Interim Report Date}Issue Date:Issue Date:
Advanced Analytical Australia Pty ltdAdvanced Analytical Australia Pty ltd Ph: + 61 2 9888 9077Ph: + 61 2 9888 9077
ABN 20 105 644 979ABN 20 105 644 979 Fax: + 61 2 9888 9577Fax: + 61 2 9888 9577
11 Julius Avenue,11 Julius Avenue, [email protected]@advancedanalytical.com.au
North Ryde NSW 2113 AustraliaNorth Ryde NSW 2113 Australia www.advancedanalytical.com.auwww.advancedanalytical.com.au

Batch Number:Batch Number: A09/3223-BA09/3223-B
Project Reference:Project Reference: Marine Services Facility - Sediment PSDMarine Services Facility - Sediment PSD
QUALITY ASSURANCE REPORTQUALITY ASSURANCE REPORT
Page 4 of 5Page 4 of 53 November 2009 {Interim Report Date}3 November 2009 {Interim Report Date}Issue Date:Issue Date:
Advanced Analytical Australia Pty ltdAdvanced Analytical Australia Pty ltd Ph: + 61 2 9888 9077Ph: + 61 2 9888 9077
ABN 20 105 644 979ABN 20 105 644 979 Fax: + 61 2 9888 9577Fax: + 61 2 9888 9577
11 Julius Avenue,11 Julius Avenue, [email protected]@advancedanalytical.com.au
North Ryde NSW 2113 AustraliaNorth Ryde NSW 2113 Australia www.advancedanalytical.com.auwww.advancedanalytical.com.au
Batch Number:Batch Number: A09/3223-BA09/3223-B
Project Reference:Project Reference: Marine Services Facility - Sediment PSDMarine Services Facility - Sediment PSD
Comments:Comments:
RPDRPD = Relative Percent Deviation= Relative Percent Deviation
[NT][NT] = Not Tested= Not Tested
[N/A][N/A] = Not Applicable= Not Applicable
'#''#' = Spike recovery data could not be calculated due to high levels of contaminants= Spike recovery data could not be calculated due to high levels of contaminants
Acceptable replicate reproducibility limit or RPD:Acceptable replicate reproducibility limit or RPD: Results < 10 times LOR: no limits.Results < 10 times LOR: no limits.
Results >10 times LOR: 0% - 50%.Results >10 times LOR: 0% - 50%.
Acceptable matrix spike & LCS recovery limits:Acceptable matrix spike & LCS recovery limits: Trace elements 70-130%Trace elements 70-130%
Organic analyses 50-150%Organic analyses 50-150%
SVOC & speciated phenols 10-140%SVOC & speciated phenols 10-140%
Surrogates 10-140%Surrogates 10-140%
When levels outside these limits are obtained, an investigation into the cause of the deviationWhen levels outside these limits are obtained, an investigation into the cause of the deviation
is performed before the batch is accepted or rejected, and results are released.is performed before the batch is accepted or rejected, and results are released.
Page 5 of 5Page 5 of 53 November 2009 {Interim Report Date}3 November 2009 {Interim Report Date}Issue Date:Issue Date:
Advanced Analytical Australia Pty ltdAdvanced Analytical Australia Pty ltd Ph: + 61 2 9888 9077Ph: + 61 2 9888 9077
ABN 20 105 644 979ABN 20 105 644 979 Fax: + 61 2 9888 9577Fax: + 61 2 9888 9577
11 Julius Avenue,11 Julius Avenue, [email protected]@advancedanalytical.com.au
North Ryde NSW 2113 AustraliaNorth Ryde NSW 2113 Australia www.advancedanalytical.com.auwww.advancedanalytical.com.au

DAMPIER PORT AUTHORITY DAMPIER MARINE SERVICES FACILITY PRELIMINARY SITE INVESTIGATION SAMPLING AND ANALYSIS PLAN IMPLEMENTATION REPORT
i:\projects\i01121 dampier marine services facility project\2.0 reports\ari\appendices\9 - acid sulfate soils assessment\psi -sap-ir 23-12-09.doc Page 59 301012-01121 : Rev 0 : 3-Dec-09
Appendix C– TOC QA Analysis

REPORT OF ANALYSISREPORT OF ANALYSIS
Laboratory Reference:Laboratory Reference: A09/3928A09/3928
Order No:Order No:Client:Client: WorleyParsons Services Pty LtdWorleyParsons Services Pty Ltd
Level 7, QV1 Building, 250 St Georges TceLevel 7, QV1 Building, 250 St Georges Tce Project:Project: SedimentSediment
Perth WA 6000Perth WA 6000 Sample Type:Sample Type: sedimentsediment
No. of Samples:No. of Samples: 33
Contact:Contact: Peter MellorPeter Mellor Date Received:Date Received: 11/12/0911/12/09
Date Completed:Date Completed: 18/12/200918/12/2009
Laboratory Contact Details:Laboratory Contact Details:
Client Services Manager:Client Services Manager: Jane StruthersJane Struthers
Technical Enquiries:Technical Enquiries: Andrew BradburyAndrew Bradbury
Telephone:Telephone: +61 8 9325 9799+61 8 9325 9799
Fax:Fax: +61 8 9325 4299+61 8 9325 4299
Email:Email: [email protected]@advancedanalytical.com.au
[email protected]@advancedanalytical.com.au
Attached Results Approved By:Attached Results Approved By:
Comments:Comments:
All samples tested as submitted by client. All attached results have been checked and approved for release.All samples tested as submitted by client. All attached results have been checked and approved for release.
This is the Final Report and supersedes any reports previously issued with this batch number.This is the Final Report and supersedes any reports previously issued with this batch number.
This document is issued in accordance with NATA's accreditation requirements. Accredited for complianceThis document is issued in accordance with NATA's accreditation requirements. Accredited for compliance
with ISO/IEC 17025. This document shall not be reproduced, except in full.with ISO/IEC 17025. This document shall not be reproduced, except in full.
Page 1 of 4Page 1 of 422 December 200922 December 2009Issue Date:Issue Date:
Advanced Analytical Australia Pty ltdAdvanced Analytical Australia Pty ltd Ph: + 61 2 9888 9077Ph: + 61 2 9888 9077
ABN 20 105 644 979ABN 20 105 644 979 Fax: + 61 2 9888 9577Fax: + 61 2 9888 9577
11 Julius Avenue,11 Julius Avenue, [email protected]@advancedanalytical.com.au
North Ryde NSW 2113 AustraliaNorth Ryde NSW 2113 Australia www.advancedanalytical.com.auwww.advancedanalytical.com.au

Batch Number:Batch Number: A09/3928A09/3928
Project Reference:Project Reference: SedimentSediment
Laboratory Reference: - - 1 2 3
Client Reference: - - A09/3223 - 3 A09/3223 - 5 A09/3223 - 17
Date Sampled: - - 13/10/09 13/10/09 13/10/09
Analysis Description Method Units
Subcontract Analysis
Total Organic Carbon SUB % 0.31 0.29 0.36
Method Method Description
SUB Subcontracted Analyses
Result CommentsResult Comments
[<][<] Less thanLess than
[INS][INS] Insufficient sample for this testInsufficient sample for this test
[NA][NA] Test not requiredTest not required
External laboratory accreditation number 198, reference number: RN771829 External laboratory accreditation number 198, reference number: RN771829
Page 2 of 4Page 2 of 422 December 200922 December 2009Issue Date:Issue Date:
Advanced Analytical Australia Pty ltdAdvanced Analytical Australia Pty ltd Ph: + 61 2 9888 9077Ph: + 61 2 9888 9077
ABN 20 105 644 979ABN 20 105 644 979 Fax: + 61 2 9888 9577Fax: + 61 2 9888 9577
11 Julius Avenue,11 Julius Avenue, [email protected]@advancedanalytical.com.au
North Ryde NSW 2113 AustraliaNorth Ryde NSW 2113 Australia www.advancedanalytical.com.auwww.advancedanalytical.com.au

Batch Number:Batch Number: A09/3928A09/3928
Project Reference:Project Reference: SedimentSediment
QUALITY ASSURANCE REPORTQUALITY ASSURANCE REPORT
Page 3 of 4Page 3 of 422 December 200922 December 2009Issue Date:Issue Date:
Advanced Analytical Australia Pty ltdAdvanced Analytical Australia Pty ltd Ph: + 61 2 9888 9077Ph: + 61 2 9888 9077
ABN 20 105 644 979ABN 20 105 644 979 Fax: + 61 2 9888 9577Fax: + 61 2 9888 9577
11 Julius Avenue,11 Julius Avenue, [email protected]@advancedanalytical.com.au
North Ryde NSW 2113 AustraliaNorth Ryde NSW 2113 Australia www.advancedanalytical.com.auwww.advancedanalytical.com.au

Batch Number:Batch Number: A09/3928A09/3928
Project Reference:Project Reference: SedimentSediment
Comments:Comments:
RPDRPD = Relative Percent Deviation= Relative Percent Deviation
[NT][NT] = Not Tested= Not Tested
[N/A][N/A] = Not Applicable= Not Applicable
'#''#' = Spike recovery data could not be calculated due to high levels of contaminants= Spike recovery data could not be calculated due to high levels of contaminants
Acceptable replicate reproducibility limit or RPD:Acceptable replicate reproducibility limit or RPD: Results < 10 times LOR: no limits.Results < 10 times LOR: no limits.
Results >10 times LOR: 0% - 50%.Results >10 times LOR: 0% - 50%.
Acceptable matrix spike & LCS recovery limits:Acceptable matrix spike & LCS recovery limits: Trace elements 70-130%Trace elements 70-130%
Organic analyses 50-150%Organic analyses 50-150%
SVOC & speciated phenols 10-140%SVOC & speciated phenols 10-140%
Surrogates 10-140%Surrogates 10-140%
When levels outside these limits are obtained, an investigation into the cause of the deviationWhen levels outside these limits are obtained, an investigation into the cause of the deviation
is performed before the batch is accepted or rejected, and results are released.is performed before the batch is accepted or rejected, and results are released.
Page 4 of 4Page 4 of 422 December 200922 December 2009Issue Date:Issue Date:
Advanced Analytical Australia Pty ltdAdvanced Analytical Australia Pty ltd Ph: + 61 2 9888 9077Ph: + 61 2 9888 9077
ABN 20 105 644 979ABN 20 105 644 979 Fax: + 61 2 9888 9577Fax: + 61 2 9888 9577
11 Julius Avenue,11 Julius Avenue, [email protected]@advancedanalytical.com.au
North Ryde NSW 2113 AustraliaNorth Ryde NSW 2113 Australia www.advancedanalytical.com.auwww.advancedanalytical.com.au