damage potential and vulnerability functions of strategic
TRANSCRIPT
KSCE Journal of Civil Engineering (2014) 18(6):1726-1734
Copyright ⓒ2014 Korean Society of Civil Engineers
DOI 10.1007/s12205-014-0184-0
− 1726 −
pISSN 1226-7988, eISSN 1976-3808
www.springer.com/12205
Structural Engineering
Damage Potential and Vulnerability Functions of Strategic buildings
in the City of Algiers
Mustapha Remki* and Djillali Benouar**
Received April 10, 2012/Accepted September 15, 2013/Published Online June 20, 2014
··································································································································································································································
Abstract
The estimation of losses resulting from an earthquake requires that for each building class, the relationship between the intensity ofground shaking and damage degree must be known or developed. Potential earthquake damage to structures, human beings andpersonal property have been the scope of numerous studies. Different approaches have been employed so far to estimate earthquakecasualties and damage. This paper describe the basic concept for development of analytical vulnerability functions based essentiallyon so called damage model which was performed from probabilistic studies on seismic capacity of existing buildings in the city ofAlgiers (Algeria). Regarding the developed model for assessing the seismic damage, vulnerability functions of specific losses(potential losses for a specific urban area in terms of meter square area of building slabs which may involve causalities) weredeveloped in order to predict the expected seismic risk for a given ground motion scenario.
Keywords: vulnerability curves, risk analysis, building damage, loss assessment
··································································································································································································································
1. Introduction
It is very important to evaluate the seismic risk of existing
buildings in a prone area, in order to reduce the expected damages
when a severe earthquake takes place (Murao and Yamazaki,
1999; Benedetti et al., 1988). For specific needs of evaluation
and reduction of the seismic risk in the urban zones (Fajfar and
Kreslin, 2010), the present study introduces a complete procedure
for seismic vulnerability evaluation and prediction of the
damage/loss ratio of existing buildings based on analytical
vulnerability functions versus ground motion intensity (Kaplan
and Sen, 2008). The concept suggested for the development of
vulnerability functions of existing buildings, is based primarily
on an analytical evaluation method of the seismic damage of this
kind of buildings (Esteva et al., 2010; Parodi et al., 2008),
introducing a nonlinear model for a given structure by using
preliminary existing results. An application of this concept for
strategic buildings in the city of Algiers (Fig. 1) has been done,
in order to define an acceptable level of seismic risk by developing
vulnerability functions for various classes of buildings (represented
by various blocks in Figs. 2-5), chosen based on the typological
classification according to the basic parameters such as the
number of stories, the structural type etc.
Those various functions allowed the development of the
specific functions of losses in terms of losses per square meter of
slabs area necessary for the quantification of the level of risk
which has occurred at the time of an earthquake by using two
levels of expected seismic actions. The first level corresponding
to moderate earthquakes that are expected to happen many times
during the life of the building, with a return period of 100 years,
the behaviour of the structures should remain in the elastic range,
without any damage and the building can be used immediately.
The second one, corresponding to major earthquakes that are
expected once during the life of the building; with a return period
of 500 years; the structure may behave in the non linear range,
with a controlled level of damage. No heavy damage or collapse
is allowed, and the building should be reused after inspection and
slight repairs.
2. Prediction and Estimation of Earthquake Losses
2.1 Methodological Approach and Model Output
Uncontrolled development and urbanization of seismic prone
regions increase rapidly their vulnerability and seismic risk if no
appropriate measures are undertaken for protecting human lives
and material properties. Therefore, the process of pre-disaster
seismic risk mitigation, reduction and management should start
at the level of physical and urban planning and should be
constantly implemented at all stages of development (ASCE 31-
03 (FEMA310), 2003).
For the planning of new developments or post-earthquake
reconstruction, earthquake preparedness and properties insurance
TECHNICAL NOTE
*Senior Researcher, National Earthquake Engineering Research Centre, C.G.S, Rue Kaddour RAHIM, BP 252 Hussein Dey, Alger, Algeria (Corresponding
Author, E-mail: [email protected])
**Professor, University of Sciences and Technology Houari Boumediene, BP 32 El-Alia, Bab Ezzouar, Algiers, Algeria (E-mail: [email protected])

Damage Potential and Vulnerability Functions of Strategic buildings in the City of Algiers
Vol. 18, No. 6 / September 2014 − 1727 −
as well as for decision-making, the quantitative seismic risk
assessment tools are needed for different building classes and
locations. Recently, efforts have been made in the development
of quantitative loss prediction procedures.
Loss evaluation is presently made with various degrees of
rigor. However, all proposed theoretically or empirically based
models for predicting seismic losses of an urban area share the
common necessity of performing a series of complex procedures
requiring extensive computations and proper acquisition and
manipulation of the building data. A systematic approach is
indispensable and the problem of prediction and estimation
should, therefore, be assessed through the following basic steps
(see Fig. 6.):
• Zonation of the region and classification with inventory of
material property (elements at risk)
• Identification of the effects of local site-soil conditions in
modifying the severity of the event at a given location.
• Prediction of the ground motion parameters, in this particu-
Fig. 1. Algiers Map – CGS Source (Algeria)
Fig. 2. Bloc I, Algiers Hospital “Mustapha Pacha” – Google Map-CGS Source (37 Buildings)
Fig. 3. Bloc II, Department of Telecommunications - Google Map-CGS Source (12 Buildings)

Mustapha Remki and Djillali Benouar
− 1728 − KSCE Journal of Civil Engineering
lar case, affecting the earthquake damage potential for each
zone
• Prediction of losses to any individual element at risk for
each zone as well as prediction of cumulative losses for all
considered elements at risk in the entire region/city.
The different stages necessary in the prediction of the seismic
losses and the collection of the various structures which can be
exposed to a severe ground motion in an urban area, take into
account several types of structures sensitive to various modes of
rupture and levels of vulnerability. Generally, most of structures
are masonry buildings which will be damage during an expected
earthquake.
In order to predict and estimate the losses associated with each
structure, a classification in type of buildings must be established
according to their physical and mechanical characteristics, to the
type of construction material, age of the building etc
2.2 Overview of Building Damage in Algiers City due to
Boumerdes Earthquake
On May 21st, 2003, at 19:45 local time, a strong earthquake
with a magnitude of 6.8 hit the northern-center part of Algeria,
where the epicenter was located in the Mediterranean Sea, seven
kilometers north of Zemmouri city, and 60 kilometers east of the
capital Algiers. The main shock was followed by severe tremors
with high magnitudes. The main shock and aftershocks induced
a lot of damages and disturbed and/or disrupted the health services,
school buildings, some roads, water supply lines, electricity, and
telecommunications in the region. The worst-affected prefectures
are Boumerdes in the first position and then come Algiers in the
second position (Ousalem and Bechtoula, 2005; Benouar, 2008).
The most damaged cities include Bourmedes, Zemmouri, Thenia,
Bordj-menail, Belouizdad, Bordj-el-bahri, Rouiba, and Reghaia.
Other neighbouring regions to Algiers and Boumerdes, like the
prefectures of Tizi-ouzou, Bouira, Blida, Tipaza and Chlef were
also affected by the enormity of the earthquake, however, the
catastrophe and damage level were far below those of Algiers
and Boumerdes.
Officially, 2,278 persons died 11,450 human casualties, more
than 180,000 homeless, 10,280 collapsed constructions and US$5
billions as a direct total loss.
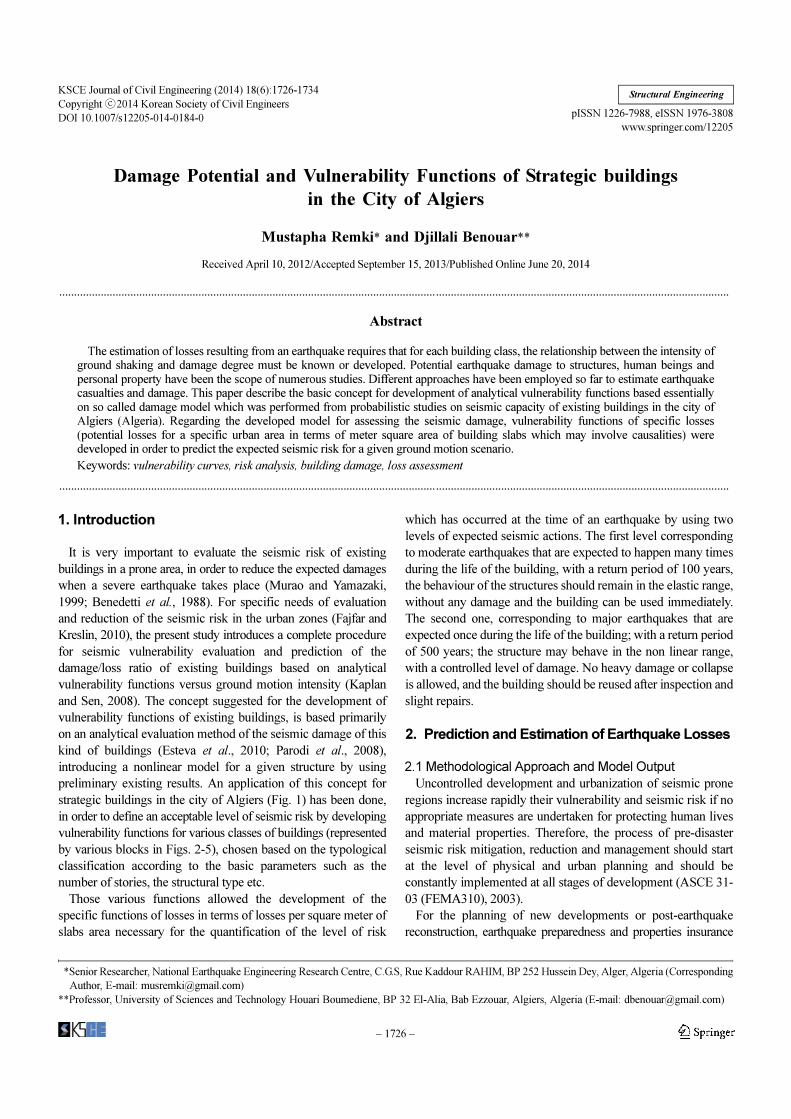
In Algiers prefecture, the most affected areas were also the
nearest to the epicenter, as shown in Fig. 7 and Fig. 8 to 11,
where the number of damaged buildings in the sub-prefectures of
Dar el-beida and Rouiba was very high compared to other
Fig. 4. Bloc III, Algiers City Hall Department - Google Map-CGS source (04 Buildings)
Fig. 5. Bloc IV, Fire Fighters Department - Google Map (17 Buildings)
Fig. 6. Inventory Methodology for a City or Region
Damage Potential and Vulnerability Functions of Strategic buildings in the City of Algiers
Vol. 18, No. 6 / September 2014 − 1729 −
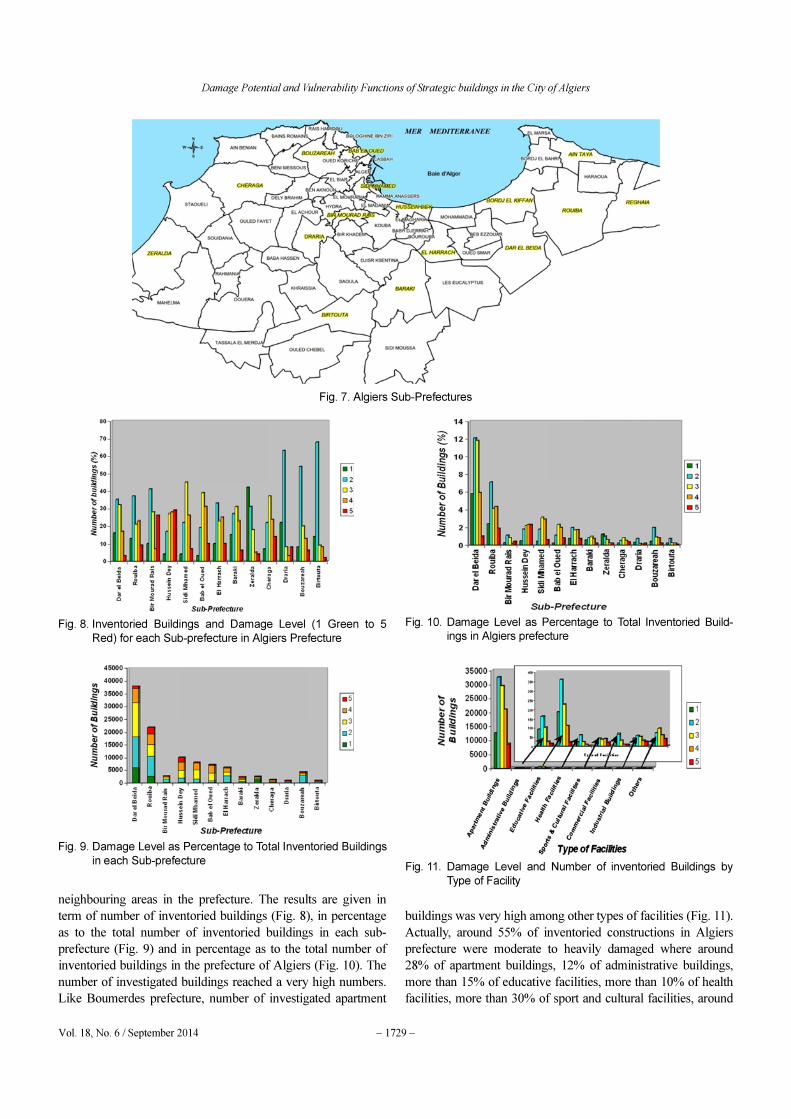
neighbouring areas in the prefecture. The results are given in
term of number of inventoried buildings (Fig. 8), in percentage
as to the total number of inventoried buildings in each sub-
prefecture (Fig. 9) and in percentage as to the total number of
inventoried buildings in the prefecture of Algiers (Fig. 10). The
number of investigated buildings reached a very high numbers.
Like Boumerdes prefecture, number of investigated apartment
buildings was very high among other types of facilities (Fig. 11).
Actually, around 55% of inventoried constructions in Algiers
prefecture were moderate to heavily damaged where around
28% of apartment buildings, 12% of administrative buildings,
more than 15% of educative facilities, more than 10% of health
facilities, more than 30% of sport and cultural facilities, around
Fig. 7. Algiers Sub-Prefectures
Fig. 8. Inventoried Buildings and Damage Level (1 Green to 5
Red) for each Sub-prefecture in Algiers Prefecture
Fig. 9. Damage Level as Percentage to Total Inventoried Buildings
in each Sub-prefecture
Fig. 10. Damage Level as Percentage to Total Inventoried Build-
ings in Algiers prefecture
Fig. 11. Damage Level and Number of inventoried Buildings by
Type of Facility

Mustapha Remki and Djillali Benouar
− 1730 − KSCE Journal of Civil Engineering
12% of commercial buildings and more than 25% of industrial
buildings were heavily to very heavily damaged.
2.3 Damage Model
The experience from passed earthquakes showed that certain
levels of damage are inevitable. Building designed against
earthquakes should allow in some stages a certain level of
damage. The model of damage proposed, limits explicitly the
structural damage to a tolerable level. The structural damage is
expressed quantitatively in terms of damage index, as a linear
combination of the maximum deformation and energy dissipated
during a cyclic loading whereas the acceptable index of damage
was defined on the basis of calibration with the data of the
damage observed at the time of an earthquake (Park et al., 1987).
However, an empirical relation has been developed in order to
estimate the nonlinear seismic responses of the building. The
damage index of the structural elements under a seismic loading
is generally caused by the combination of the effect of the
maximum deformation and dissipated energy, given as follow:
(1)
Where:
Qu = Ultimate shear force
Um = Maximum deformation
Uf = Deformation at failure
= Cumulative hysterical energy
ε = Constant (also called parameter of the damage
index = 0.075)
Equation (1) causes a linear damage surface; a random vibration
method using a nonlinear hysteretic restoring force model to
describe the load-deformation behavior is adopted to evaluate
the response statistics required for damage assessment. The
proposed damage model is calibrated using the damages of number
of buildings damaged during past earthquakes. In accordance with
the behavior of structures during past earthquakes, and the
analyses of collected data from the damaged structures; Park et
al. (1987) deduced that the seismic damage of structures is due
mainly to some characteristics parameters such as, the peak
ground acceleration, the structural period, the duration of the
strong motion and so on.
Hence, the damage of structures is evaluated in terms of ratio
of the seismic load (L) to the structural strength (R). The seismic
force is defined by effective acceleration, the duration of the
strong motion and the predominant period of the ground motion,
whereas the structural strength is defined by the capacity in
ultimate shearing strength at the base, by the ratio of the
maximum deformation under the seismic load and the ultimate
deformation of the structure and by the cumulated dissipated
energy, whose general expression is given by the following
equation:
(2)
Where:
PGA = Peak ground acceleration
td = Duration of strong motion
T = Structural period
Tg = Predominant period of ground motion
Un = Ultimate displacement
From a regression analysis Ang et al. (1985) proposes the
following relationships:
and (3)
Where β1 and β2 are constants; is function of the ratio
and α1, α2, α3 and α4 are exponents to be determined.
(4)
This method of assessment of the damage index to a single
degree of freedom can be generalized to the case of several degree
of freedom systems, assuming only that the previous relationships
applied to the sum of the indices of damaged floors SD gives:
(5)
In which, a constant and the ultimate equivalent
displacement; expressed as being the sum of ultimate displacements
of stories, each one weighted by the component of the corresponding
vector of distribution, i.e,
(6)
According to the study of the variation of the SD of several
buildings, the following formulas (Park et al., 1987) were selected
for the values of the exponents:
and
(7)
N = Stories number
For different structural systems, Tg varies from 0.2 second for a
firm soil to 0.8 second for a soft soil.
Once the sum of damage indices SD and the damage distribution
vector RD are known, the damage of the ith floor will therefore be:
(8)
2.4 Development of Vulnerability Functions
The estimation of losses resulting from an earthquake requires
that for each building class the relationships (vulnerability
functions) between the intensity of ground shaking and damage
degree should be known or developed. Potential earthquake
damage to structures, human beings and personal property has
DUm
Uf
------- ε
Qu Uf⋅--------------- Ed∫⋅+=
Ed∫
DL PGA td T Tg⁄, ,( )
R T Uu,( )---------------------------------------=
L β1 hTg
Ea( )α1 td( )α2⋅ ⋅ ⋅= R β2 T( )α3 Uu( )α4⋅ ⋅=
hTg
T Tg⁄
hTg
1.0 :T Tg⁄ 0.70≤
1
0.80 T Tg⁄( ) 0.44+( )---------------------------------------------- :T T⁄ g 0.70>
⎩⎪⎨⎪⎧
=
SD Di
i 1=
N
∑ γN hTg
Ea( )α1 td( )α2⋅
T( )α3 Uue( )α4⋅--------------------------------⋅ ⋅= =
γN Uue
Uue Ui RDi⋅i 1=
N
∑=
α1 α4
α2 α3–
2----------------; α2 0.35; α3 3.40– 0.10.N+= = = =
γN 0.057.N0.2–
=
Di RDi SD⋅ RDi γN hTg
Ea( )α1 td( )α2⋅
T( )α3 Uue( )α4⋅--------------------------------⋅ ⋅ ⋅= =

Damage Potential and Vulnerability Functions of Strategic buildings in the City of Algiers
Vol. 18, No. 6 / September 2014 − 1731 −
been the scope of numerous studies (Kumitani et al., 2008; Rota
et al., 2010; Oropeza et al., 2010). Different approaches have
been employed so far to estimate earthquake casualties and
damages. These approaches have combined in various ways the
important input or determinant factors, including data from
relevant historical and recent damaging earthquake, different
steps have been used to estimate the seismic vulnerability of
existing buildings mainly based on:
• Data on damages suffered by individual buildings in a con-
sidered region during recent earthquakes
• The damage state is expressed on a standard scale
• Buildings are classified according to structural type and
material used
• Vulnerability functions, relating damage degree to the inten-
sity of ground motion, are derived for each building class.
The methodological approach used in this study for the
development of vulnerability functions (See Fig. 12), is based
primarily on the quantification of the seismic damage of a
building according to what is called “damage index for various
types of buildings constituting in a dominant way the urban
nuclei of Algiers city (see Fig. 1), mostly represented by some of
its strategic buildings as shown in Figs. 2-4 and 5.
A building is considered strategic by its function and by the
equipments that it contains. This damage index was formulated
on the basis of nonlinear analytical model.
As shown on Fig. 12, several acceleration time histories taken
from a worldwide earthquake data base have been used, based on
their peak ground acceleration values. Three (03) computer
programs have been used for the non linear dynamic response
analysis, SDUAMB (Bozinovski and Gavrilovic, 1993a); UARCS
(Bozinovski and Gavrilovic, 1993b) and DRABS (Bozinovski and
Gavrilovic, 1993c). Buildings used in this study were designed
using the computer programs mentioned above, either for
masonry buildings or RC structures in which the maximum
displacement Um, the displacement at failure Uf and the ultimate
shear force Qu are obtained. For the non linear dynamic response
analysis, the PGA of the selected records was normalized to
different excitation level from 0.1 g to 1.0 g having 10 excitation
levels with equal intervals. The damage index D will be then
estimated. Finally, the obtained damage index and the corresponding
ground motion are combined to develop the analytical fragility
curves for different structural systems used in this study.
Results in terms of the structural type, number of stories, total
surface of floors as well as the number of buildings to carry out
this study well are represented in Tables 1 and 2. These various
data made it possible to make a typological classification of the
various buildings represented in the blocs I, II, III and IV, while
being based on certain characteristic parameters which influence
the seismic behaviour.
The analytical vulnerability functions are developed while
being based on more than 65 nonlinear dynamic analyses made
for the various following structural types:
Fig. 12. Steps used to Construct Vulnerability Functions
Table 1. Predicted Specific Loss for a PGA of 0.15 g
BlocNbre of buildings
URM System R.C Frame System Dual System R.C Walls System Total Damage Area.
Total area (m2)
Damage(%)
Total area (m2)
Damage(%)
Total area (m2)
Damage(%)
Total area (m2)
Damage(%)
Total area (m2)
Damage(%)
I 37 4762 27.5 15164 11.25 8483.5 24.16 / / 28409 17.8
II 12 / / 19929 / / 3972 5.41 23901 10.3
III 04 14900 27.5 5750 / / / / / 20650 22.9
IV 17 / / 8217.5 / / / / / 8217.5 11.3
Total 70 19662 27.5 49060 11.25 8483.5 24.16 3972 5.41 81178 15.6
Table 2. Predicted Specific Loss for a PGA of 0.25 g
BlocNbre of buildings
URM System R.C Frame System Dual System R.C Walls System Total Damage Area.
Total area (m2)
Damage(%)
Total area (m2)
Damage(%)
Total area (m2)
Damage(%)
Total area (m2)
Damage(%)
Total area (m2)
Damage(%)
I 37 4762 45.8 15164 20 8483.5 38.7 / / 28409 29.9
II 12 / / 19929 / / 3972 10.4 23901 18.4
III 04 14900 45.8 5750 / / / / / 20650 38.6
IV 17 / / 8217.5 / / / / / 8217.5 20
Total 70 19662 45.8 49060 20 8483.5 38.7 3972 10.4 81178 20.7

Mustapha Remki and Djillali Benouar
− 1732 − KSCE Journal of Civil Engineering
• URM system: By considering unreinforced masonry build-
ings of more than 03 stories (standard BM) existing in a
dominant way in the city of Algiers.
• Reinforced concrete frame system: By considering the
buildings whose superstructure is composed of beam-col-
umn frames of more than 03 stories (standard BP).
• Dual system Buildings: By considering buildings made up
of two types of bearing elements, reinforced concrete struc-
tures and unreinforced masonry bearing walls of more than
02 stories (standard BX).
• RC wall system: By considering buildings with RC walls as
bearing elements of more than 03 stories of class D (stan-
dard BV).
Based on the collected data, regression analyses for the
considered buildings according to their structural type were
carried out. This phase was done by implementing the lognormal
distribution that links the degree of damage D to the intensity of
the ground motion represented by the peak ground acceleration
PGA implementing the lognormal analysis using the mean and
the standard deviation.
For a specific value of PGA, the cumulative probability P
(PGA) of the occurrence of a certain damage equal or higher
than rank D is assumed to follow a lognormal distribution given
by:
P (PGA) = Ψ ((ln PGA − a)/b) (9)
In which Ψ is the standard normal distribution and, a and b are
the mean and the standard deviation of ln PGA. The two
parameters of the distributions, a and b, have been determined by
the least square method on lognormal probability state. Fig. 13
shows the fragility curves, for each structural system.
3. Results Interpretation
Although the characteristics of the soil and the number of
stories have a certain influence on seismic vulnerability, the
results showed that the type of construction plays a significant
contribution in the quantification of the vulnerability. In fact,
masonry buildings which exist in dominant way in the north of
Algeria (specially in the city of Algiers with 70% URM system)
have been designed without any regulations or seismic codes,
this kind of structural system exhibits brittle behaviour, that is
why, the most significant vulnerability is allotted to masonry
buildings of BM type which present a much degraded state (see
Figs. 14 and 15), and decreases for the other types of buildings.
Fig. 13. Fragility Curves for Different Structural Systems using Regression Analysis: (a) Vulnerablility Curve for URM Buildings, (b) Vulner-
ability Curve for Dual System Buildings, (c) Vulnerability Curve for RC System, (d) Vulnerability Curve for RC Wall Buildings
Damage Potential and Vulnerability Functions of Strategic buildings in the City of Algiers
Vol. 18, No. 6 / September 2014 − 1733 −
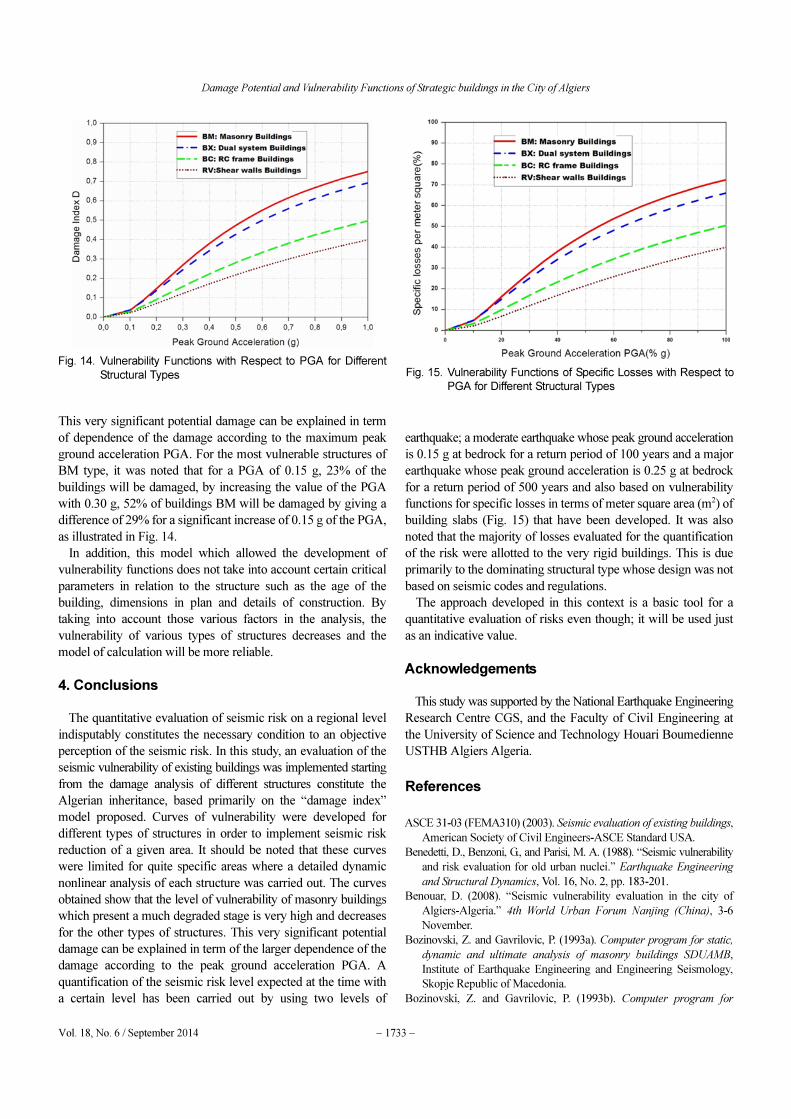
This very significant potential damage can be explained in term
of dependence of the damage according to the maximum peak
ground acceleration PGA. For the most vulnerable structures of
BM type, it was noted that for a PGA of 0.15 g, 23% of the
buildings will be damaged, by increasing the value of the PGA
with 0.30 g, 52% of buildings BM will be damaged by giving a
difference of 29% for a significant increase of 0.15 g of the PGA,
as illustrated in Fig. 14.
In addition, this model which allowed the development of
vulnerability functions does not take into account certain critical
parameters in relation to the structure such as the age of the
building, dimensions in plan and details of construction. By
taking into account those various factors in the analysis, the
vulnerability of various types of structures decreases and the
model of calculation will be more reliable.
4. Conclusions
The quantitative evaluation of seismic risk on a regional level
indisputably constitutes the necessary condition to an objective
perception of the seismic risk. In this study, an evaluation of the
seismic vulnerability of existing buildings was implemented starting
from the damage analysis of different structures constitute the
Algerian inheritance, based primarily on the “damage index”
model proposed. Curves of vulnerability were developed for
different types of structures in order to implement seismic risk
reduction of a given area. It should be noted that these curves
were limited for quite specific areas where a detailed dynamic
nonlinear analysis of each structure was carried out. The curves
obtained show that the level of vulnerability of masonry buildings
which present a much degraded stage is very high and decreases
for the other types of structures. This very significant potential
damage can be explained in term of the larger dependence of the
damage according to the peak ground acceleration PGA. A
quantification of the seismic risk level expected at the time with
a certain level has been carried out by using two levels of
earthquake; a moderate earthquake whose peak ground acceleration
is 0.15 g at bedrock for a return period of 100 years and a major
earthquake whose peak ground acceleration is 0.25 g at bedrock
for a return period of 500 years and also based on vulnerability
functions for specific losses in terms of meter square area (m2) of
building slabs (Fig. 15) that have been developed. It was also
noted that the majority of losses evaluated for the quantification
of the risk were allotted to the very rigid buildings. This is due
primarily to the dominating structural type whose design was not
based on seismic codes and regulations.
The approach developed in this context is a basic tool for a
quantitative evaluation of risks even though; it will be used just
as an indicative value.
Acknowledgements
This study was supported by the National Earthquake Engineering
Research Centre CGS, and the Faculty of Civil Engineering at
the University of Science and Technology Houari Boumedienne
USTHB Algiers Algeria.
References
ASCE 31-03 (FEMA310) (2003). Seismic evaluation of existing buildings,
American Society of Civil Engineers-ASCE Standard USA.
Benedetti, D., Benzoni, G., and Parisi, M. A. (1988). “Seismic vulnerability
and risk evaluation for old urban nuclei.” Earthquake Engineering
and Structural Dynamics, Vol. 16, No. 2, pp. 183-201.
Benouar, D. (2008). “Seismic vulnerability evaluation in the city of
Algiers-Algeria.” 4th World Urban Forum Nanjing (China), 3-6
November.
Bozinovski, Z. and Gavrilovic, P. (1993a). Computer program for static,
dynamic and ultimate analysis of masonry buildings SDUAMB,
Institute of Earthquake Engineering and Engineering Seismology,
Skopje Republic of Macedonia.
Bozinovski, Z. and Gavrilovic, P. (1993b). Computer program for
Fig. 14. Vulnerability Functions with Respect to PGA for Different
Structural Types Fig. 15. Vulnerability Functions of Specific Losses with Respect to
PGA for Different Structural Types
Mustapha Remki and Djillali Benouar
− 1734 − KSCE Journal of Civil Engineering
analysis of ultimate state of reinforced concrete systems UARCS,
Institute of Earthquake Engineering and Engineering Seismology,
Skopje Republic of Macedonia.
Bozinovski, Z. and Gavrilovic, P. (1993c). Computer program for
dynamic response analysis of buildings structures DRABS, Institute of
Earthquake Engineering and Engineering Seismology, Skopje Republic
of Macedonia.
Esteva, L., Diaz-Lopez, O., and Hernandez, E. I. (2010). “Seismic
vulnerability functions of multi-storey buildings: Estimation and
applications.” Structure & Infrastructure Engineering: Maintenance,
Management, Life-Cycle Design & Performance Vol. 6, Issue 1, pp.
3-16.
Fajfar, P. and Kreslin, M. (2010). “Seismic evaluation of an existing
complex RC building.” Bulletin of Earthquake Engineering, Vol. 8,
No. 2, pp. 363-385.
Kaplan, E., Yilmaz, E. Akyol, and Sen, G. (2008). “A new rapid seismic
vulnerability assessment method for Turkey.” The 14th World Conference
on Earthquake Engineering, October 12-17, Beijing, China.
Kumitani, S. and Takada, T. (2008). “Probability assessment of buildings
damage considering aftershocks of earthquakes.” The 14th World
Conference on Earthquake Engineering, October 12-17, Beijing,
China.
Kwok, Y. H. and Ang, H. S. (1985). Seismic damage analysis and design
of unreinforced masonry buildings, Technical Report of Research
Supported by the National Science Foundation, University of Illinois.
Murao, O. and Yamazaki, F. (1999). “Development of fragility curves
for buildings based on damage data due to the hyogoken-nanbu
earthquake.” Proceedings of APSSR and Its Applications, pp. 259-
269.
Oropeza, M., Michel, C., and Lestuzzi, P. (2010). “Fragility functions
for seismic risk in regions with moderate seismicity.” Proceedings of
the Ninth US National and Tenth Canadian Conference on Earthquake
Engineering, Toronto, Canada, July 25-29.
Ousalem, H. and Bechtoula, H. (2005). “Inventory survey of the 2003
zemmouri (Algeria) earthquake: Case study of dergana city.” Journal
of Advanced Concrete Technology, Vol. 3, No. 1, pp. 175-183.
Park, Y. J., Ang, A. H.-S., Eeri, M. and Wen, Y. K. (1987). “Damage-
limiting aseismic design of buildings.” Earthquake Spectra EERI,
Vol. 3, No. 1, pp. 1-26.
Parodi, S., Milano, L., Martinelli, A., Manella, A., Lagomasirno, S., and
Bernardini, A. (2008). “Vulnerability and damage assessment of current
buildings in Italy: Application to Sulmona town.” The 14th World
Conference on Earthquake Engineering, October 12-17, Beijing,
China.
Rota, M., Penna, A., and Magenes, G. (2010). “A methodology for deriving
analytical fragility curves for masonry buildings based on stochastic
nonlinear analyses.” Engineering Structures, Vol. 32, Issue 5, pp.
1312-1323.