damage index sensor for smart structures - keio … · damage index sensor for smart structures ......
TRANSCRIPT
Structural Engineering and Mechanics, Vol. 17, No. 3-4, (2004)
1
Damage Index Sensor for Smart Structures
Akira Mita† and Shinpei Takahira‡
Department of System Design Engineering, Keio University
3-14-1 Hiyoshi, Kohoku-ku, Yokohama 223-8522, Japan
Abstract. A new sensor system is proposed for measuring damage indexes. The damage
index is a physical value that is well correlated to a critical damage in a device or a structure.
The mechanism proposed here utilizes elastic buckling of a thin wire and does not require any
external power supply for memorizing the index. The mechanisms to detect peak strain,
peak displacement, peak acceleration and cumulative deformation as examples of damage
indexes are presented. Furthermore, passive and active wireless data retrieval mechanisms
using electromagnetic induction are proposed. The passive wireless system is achieved by
forming a closed LC circuit to oscillate at its natural frequency. The active wireless sensor
can transmit the data much further than the passive system at the sacrifice of slightly
complicated electric circuit for the sensor. For wireless data retrieval, no wire is needed for
the sensor to supply electrical power. For the active system, electrical power is supplied to
the sensor by radio waves emitted from the retrieval system. Thus, external power supply is
only needed for the retrieval system when the retrieval becomes necessary. Theoretical and
experimental studies to show excellent performance of the proposed sensor are presented.
Finally, a prototype damage index sensor installed into a 7 storey base-isolated building is
explained.
Key words: damage index, structural health monitoring, mechanical memory, wireless
†Associate Professor ‡Graduate Student
Structural Engineering and Mechanics, Vol. 17, No. 3-4, (2004)
2
1. Introduction
Structural health monitoring (SHM) systems are getting strong attention for maintaining
proper performance of building structures against natural hazards such as large earthquakes as
reviewed by Mita (1999). However, simple addition of an SHM system to an existing
building is not a smart strategy as the conventional building has many possible damage
scenarios. This fact is mainly due to the structural system employed by conventional
buildings using the beam-column joints as energy absorbers. The seismic energy is absorbed
by the beam-column joints but allowing them plastic deformation. However, the plastic
deformation involves sever damage and significant change of load resistant mechanism.
Therefore, detecting all possible damage scenarios by an SHM system is by no means
feasible.
Instead, we recommend the use of SHM systems for smart structures. The smart structure is
defined by the structure consisting of gravity resistant structural components and the
structural control devices. The gravity load, i.e. vertical dead load, is supported by the
gravity resistant structural components. The harmful destructive energy due to an
earthquake or a strong wind is taken care of by the structural control devices. This structural
system is completely different from the conventional structural systems. In conventional
systems, many structural components such as moment resisting joints should resist gravity as
well as earthquakes. Though the concept of providing independent elements for each
structural role has been inherently employed by many structural engineers, clarification of the
mechanism had not been conducted until recently. Connor et al.(1997) clarified the concept
considering simple shear structures. They called the system damage-controlled building.
Although they only considered the passive control devices, active and semi-active control
devices have recently become available (e.g. Casciati (Editor) (2003), Conner (2002)).
Smart structures perform much better during large earthquakes and strong winds. More
importantly, they have simpler and fewer damage scenarios. Therefore, detecting damages
by an SHM system consisting of reasonable number of sensors may be possible. As the
most destructive energy due to an earthquake is taken care of by structural control devices, the
most important role for the SHM system is to monitor the integrity of structural control
devices.
Structural Engineering and Mechanics, Vol. 17, No. 3-4, (2004)
3
The most popular passive smart structure is the base-isolated building. The system has been
employed for hospitals, residential buildings, data centers, office buildings, school buildings,
and so on. In the base-isolated building, all structural control devices are installed in the
isolation layer. Buildings with passive dampers as structural control devices have become
also very common in Japan and the U. S. for tall steel buildings. However, the number of
dampers installed in a tall steel building may easily exceed several hundreds. Validation of
health for those devices after a destructive event is extremely difficult. As a realistic and
economical means, attaching a sensor that can detect and memorize a damage index to each
damper device may be attractive if the cost for each sensor is not expensive. A damage
index is defined as a physical value that is well correlated to a critical damage in a device or a
structure. Typical damage indexes are peak strain, peak displacement, peak acceleration,
story drift, absorbed energy, cumulative deformation, and so on. In addition, if the sensor
does not require power supply for detecting the damage index and can memorize the value,
the maintenance costs for the sensors will be further reduced. Therefore, the purpose of the
research presented here is to develop a damage index sensor that can detect and memorize a
damage index without any power supply. In addition, realizing the wireless data retrieval
capability is also our important purpose to penetrate the fire-protection materials or cosmetic
walls covering dampers. If such a sensor is realized, SHM systems will become very
attractive and realistic.
Several peak strain sensors have been proposed recently. The peak strain sensor is one of the
most promising damage index sensors. The use of TRIP (TRansformation Induced
Plasticity) steel was proposed by Westermo and Thompson (1994) for memorizing the peak
strain as the TRIP steel is magnetized when large strain is applied. However, the TRIP
sensor is not reusable once the sensor experiences a large strain. In addition, a detector for
magnetization level is not simple. Muto et al. (1992) studied the relationship between the
electric resistance change and the peak strain for CFGFRP (Carbon Fiber Glass Fiber
Reinforced Plastics). It was concluded that the change of the electric resistance in the
CFGFRP material would be well correlated to the peak strain. This feature is unique as the
material itself can function as a sensor. Unfortunately, however, the electric resistance of the
CFGFRP is correlated not only to the peak strain but also to the residual strain so that
isolation of the peak strain is difficult. Okuhara et al. (2001) proposed a better system by
replacing carbon fibers by carbon powder. Matsubara et al. (2001) reported a possibility to
Structural Engineering and Mechanics, Vol. 17, No. 3-4, (2004)
4
install it into a concrete structure. However, their system still has strong correlation with the
residual strain. Kakizawa and Ohno (1996) proposed the use of the electric resistance of
SMA (Shape Memory Alloys) in the hope of using it as a peak strain sensor. However,
careful design is required to design the sensor to confine the working range in the region of
super-elasticity.
In this paper, a new concept is proposed to memorize damage indexes. The mechanism
utilizes elastic buckling of a thin wire. Furthermore, passive and active wireless retrieval
mechanisms are proposed. The proposed sensors do not require any power supply for
memorizing the damage indexes. Small external power supply is only needed for the data
retrieval system when the data become necessary.
2. Mechanism of damage index sensor
2.1 Mechanical memory for peak values using elastic buckling
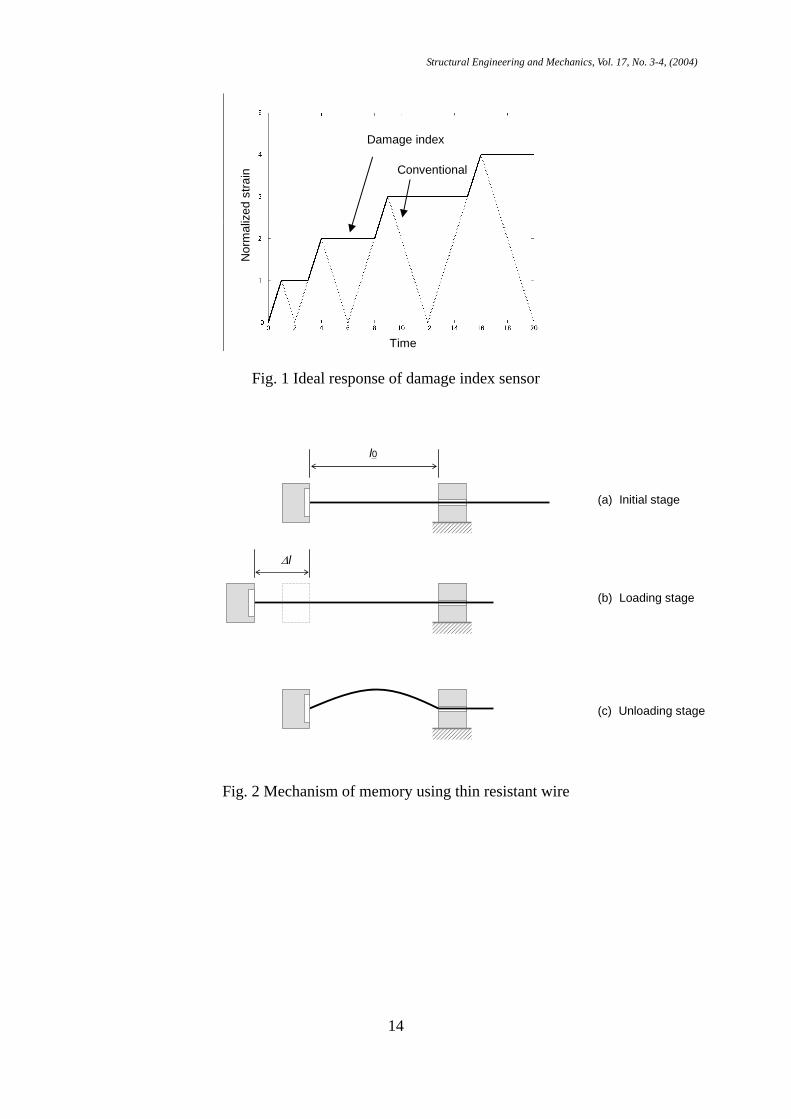
The ideal sensor response of a damage index sensor that can memorize a peak value as a
damage index is plotted compared with a conventional sensor in Fig. 1. In this case, the
maximum strain was taken as an example of the damage index. The ideal sensor retains the
peak value even when the physical value in the object material is released. This feature can
be realized by using a material that has pure plastic response against applied force for a sensor
element. To realize such plastic response, we propose the use of elastic buckling of a thin
wire as a mechanical memory as shown in Figs. 2 and 3. The mechanism of the proposed
sensor is explained in the following.
For the mechanism presented in Fig. 2, the left-hand end of a thin wire is attached to a
conductive block. The right-hand end of the wire is sandwiched by a conductive block
resulting in a certain level of friction force. At the initial phase, no tension is applied to the
wire. When the left-hand block is pulled to the left direction, the wire is stretched. Under
the condition that the tension force in the wire reaches beyond the static friction force, the
wire is pulled out from the right-hand conductive block. When the tension force is removed,
the wire may retain the extended length provided that the static friction force is larger than the
elastic buckling force for the extended wire. Thus the peak value is mechanically
memorized in the form of the length of the thin wire. If the thin wire is electrically resistive,
its length is easily obtained by measuring the electrical resistance of the wire.
Structural Engineering and Mechanics, Vol. 17, No. 3-4, (2004)
5
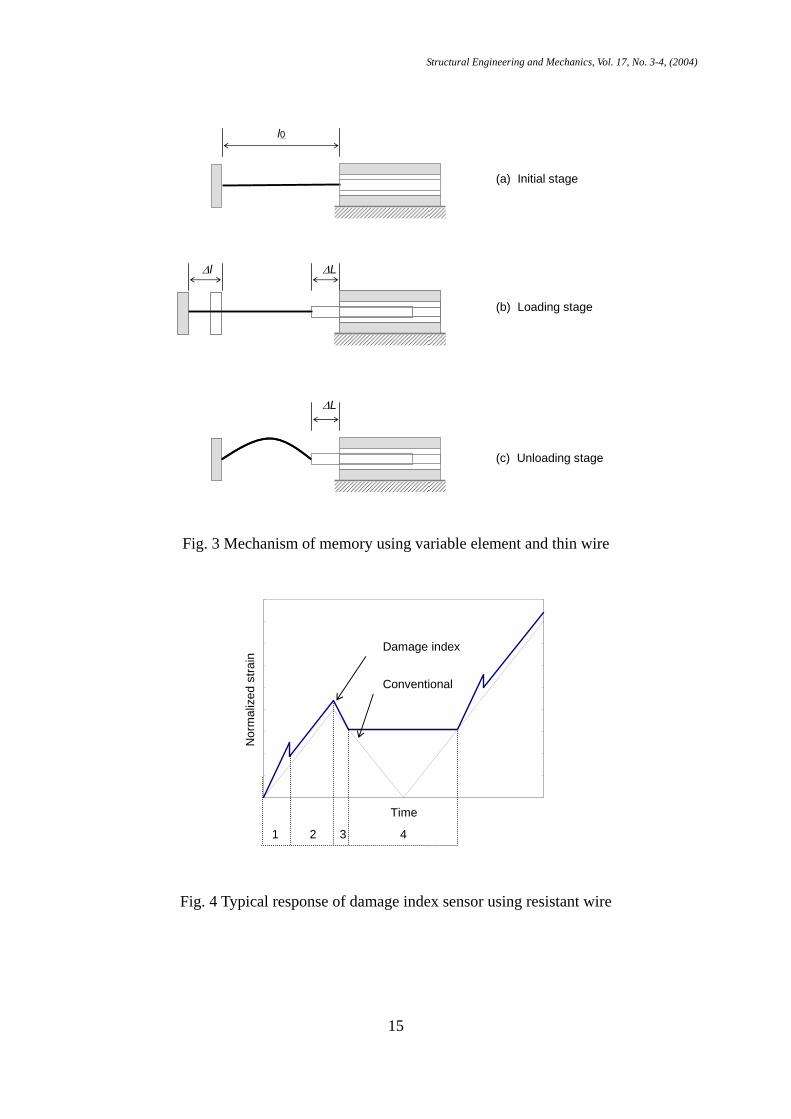
A slightly different mechanism is shown in Fig. 3. In this case, a variable element such as a
variable capacitor, a variable inductor or a variable resistance is used as a mechanical memory.
The length of the thin wire in this case is kept the same all the time except the elastic
elongation. The peak strain is memorized in the variable element with the help of inherent
friction force. The sensor is sensitive in only one direction. In the opposite direction, the
sensor is made insensitive by the buckling of the thin wire. In both systems, accuracy of the
sensor is highly dependent on the trade-off relation between tensile rigidity and the buckling
force. In both cases, the static friction force should be larger than the buckling force.
For the mechanism depicted in Fig. 2, the change of resistance ∆R from the initial resistance
R0 is given by
000
2ll
ll
RR e∆
+∆
=∆ ν (1)
where ν is Poisson’s ratio. The initial length of the resistant wire is assumed to be l0. The
increment of the length ∆l consists of two components.
pe lll ∆+∆=∆ (2)
The superscript e represents elastic elongation. The superscript p indicates the component
associated with the plastic or permanent elongation. The typical but exaggerated response of
the sensor is shown in Fig. 4. In this case, the dynamic friction coefficient was assumed to
be half of the static friction coefficient. The buckling stress was assumed to be negligibly
small. In the segment 1, only elastic elongation occurs until the stress in the thin wire
exceeds the static friction force. In the segment 2, the friction is reduced to the dynamic
friction. The increase of the resistance is due to the plastic elongation. In the segment 3,
the elastic elongation is reduced to zero. In the segment 4, the thin wire is buckled so that
the same output is retained.
For the mechanism using a variable capacitor and a thin wire depicted in Fig. 3, the expected
response is slightly different from the resistant wire based sensor. The response is typically
given by in the form of capacitance change ∆C as
Structural Engineering and Mechanics, Vol. 17, No. 3-4, (2004)
6
00 ll
CC p∆
=∆ (3)
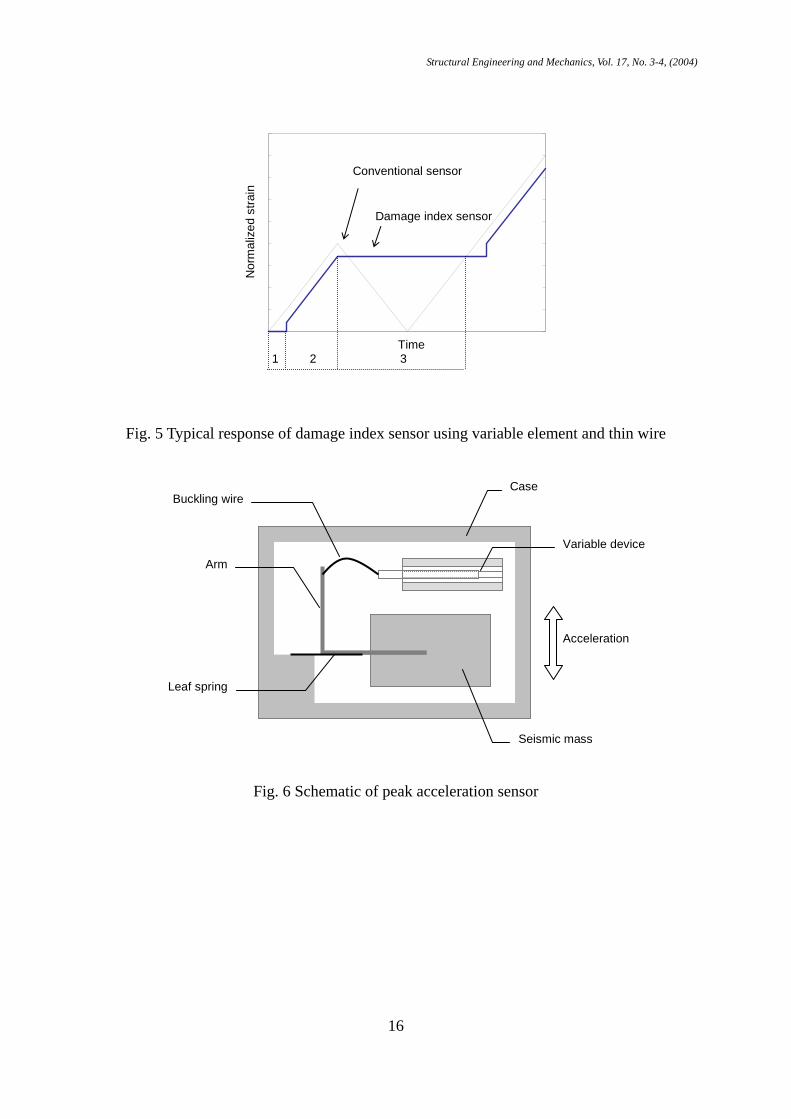
where C0 is the initial capacitance. From Eq. (3), it is clearly understood that the response of
this sensor is only due to the plastic deformation and not due to the elastic deformation of the
thin wire. A simulated response of the sensor consisting of a thin wire and a capacitor is
depicted in Fig. 5. In the segment 1, due to the static friction force, the sensor will not give
any output before exceeding a certain strain where the resulting stress becomes larger than the
static friction. In the segment 2, the tension force is larger than the dynamic friction force so
that the variable capacitor will change its capacitance. In the segment 3, the tension force is
removed from the thin wire so that the capacitance is kept at the maximum value of the
segment 3. The mechanism explained here can be used for peak strain of displacement
sensor. By combining the accelerometer, the mechanism can be modified to memorize the
peak acceleration. The schematic of the peak acceleration sensor is depicted in Fig. 6. The
response curves depicted in Figs. 4 and 5 are rather exaggerated ones. In reality, the resolution
of the damage index sensor can be controlled to be in the same resolution range of the
conventional strain gauge.
The output will be varied due to temperature variation. The compensation of the temperature
effects may be possible for the mechanism using a resistant wire by the same mechanism
employed for conventional strain gauges based on bridge circuits. For other mechanisms,
mechanical temperature compensations may be applicable. One of the mechanical systems is
now under study at our laboratory. The resolution of the sensor is dependent on many
parameters such as static friction forces, dynamic friction forces, the length ratio of the
moving part and the sensing part, and so on. After careful tuning of the parameters, the
resolution of 1µstrain may be achievable for the sensors using thin wires and variable
elements. In terms of cost and size, the simplest mechanism using a thin wire for buckling and
as a variable element is most appropriate but with less resolution compared with mechanisms
using thin wires and separate variable elements. The measurement range is equally flexible
and wide for all mechanisms proposed here.
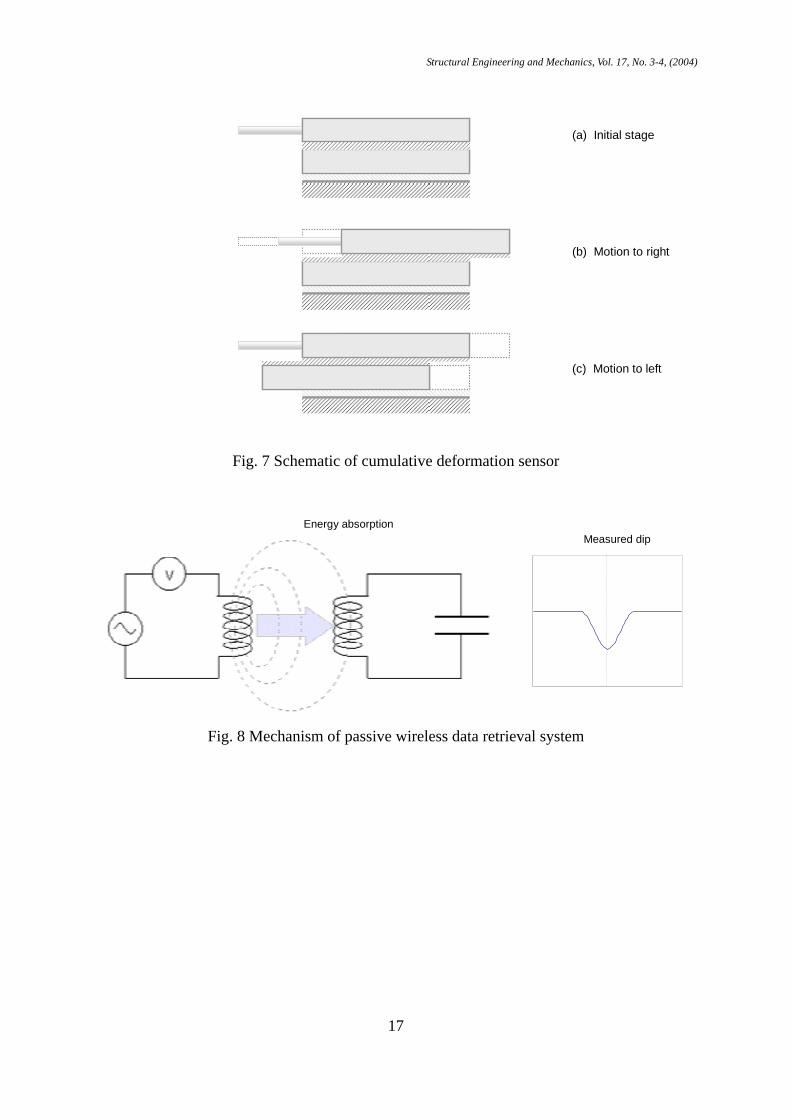
2.2 Mechanical memory for cumulative deformation using napped fiber
The cumulative deformation is an important damage index for estimating the level of damage
and the remaining fatigue life of a structural component. The mechanism we propose is
Structural Engineering and Mechanics, Vol. 17, No. 3-4, (2004)
7
explained in Fig. 7. The sensor consists of two blocks. On the surface of each block,
napped fibers are densely bonded. The cumulative deformation is memorized in the form of
position of the bottom block. The bonded fibers are napped into leftward direction for the
top block. While, those for the bottom block are napped into the rightward direction.
Therefore, the top block can move smoothly into rightward against the bottom block. But
the motion into leftward direction against the bottom block is resisted by napped fibers.
When the force is applied to the rightward direction for the top block, the friction between
two blocks is negligibly small so that no motion is induced in the bottom block. When the
top block is moved to the left, the napped fibers cause large friction force larger than the static
friction force between the bottom block and the base material. By repeating this process,
only the leftward deformation is accumulated and memorized in the bottom block. By
detecting the position of the bottom block using a variable element, the cumulative
deformation can be easily memorized.
2.3 Wireless data retrieval
Although the simplest configuration for memorizing the peak value would be using a resistant
wire as shown in Fig. 2, the use of a variable capacitor or a variable inductor has an additional
benefit, that is, wireless retrieval capability. When a variable capacitor or a variable inductor
is used, the sensor can be easily modified to form a closed LC circuit by adding an inductor or
a capacitor. For a closed LC circuit consisting of a capacitor C and an inductor L, the natural
frequency of the circuit is given by
LC
fπ2
1= (4)
This frequency can be detected without touching the wire. The simplest way to measure the
frequency is to use a dip meter as explained in Fig. 8. A dip meter generates radio waves at
an arbitrary frequency. If the frequency of the sending radio wave approaches to the natural
frequency of the closed LC circuit of the sensor (the right circuit), certain amount of the
energy is absorbed by the LC circuit. The frequency at which the energy is absorbed is
considered to be the natural frequency of the sensor. Thus, the desired value memorized in
the sensor can be retrieved wirelessly in the form of natural frequency change using the dip
meter. This feature is extremely useful, when the sensor is covered by a fire-protection
material or a cosmetic wall. However, in order to identify the dipped frequency the power of
the dip meter should be below a certain level as the capacity of the closed LC circuit is limited.
Structural Engineering and Mechanics, Vol. 17, No. 3-4, (2004)
8
That implies that the passive wireless system using the dip meter is applicable only up to a
few cm for our application.
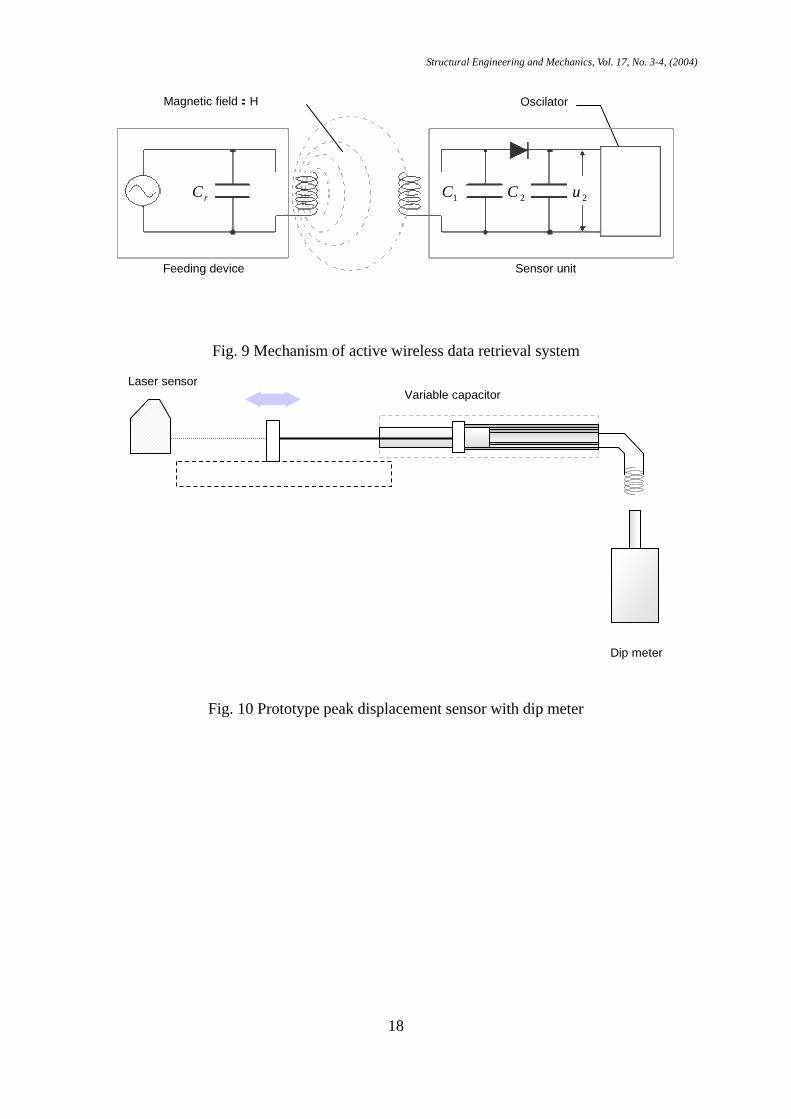
For expanding the reachable distance, an active system is proposed as schematically shown in
Fig. 9. The power needed to oscillate the closed LC circuit is supplied by using
electromagnetic induction as shown in Fig. 9. This power supply system is frequently used
to activate the RFID (Radio Frequency Identification) tags (e.g. Finkenzeller, K. (2000)).
The radio wave to supply the electric power is generated by the left-hand oscillator depicted
in Fig. 9. The radio wave is received by the circuit of the same oscillation frequency with
the power supply radio wave embedded in the sensor. The radio wave is converted into a
direct current using a rectifier. The generated direct current is then used to oscillate the
variable LC circuit of the sensor. Selecting the frequency of the power supply radio wave
different from the frequency to transmit the value of the damage index, the memorized
damage index can be retrieved wirelessly. The distance to retrieve the data is much larger
than the passive wireless system using a dip meter.
Structural Engineering and Mechanics, Vol. 17, No. 3-4, (2004)
9
3. Prototype sensors
3.1 Peak displacement sensor using variable capacitor
A prototype sensor consisting of a thin wire and a variable capacitor was fabricated for
verification as shown in Fig. 10. The variable capacitor consists of two aluminum cylinders
that are separated by a non-conductive material. The capacitance of the variable capacitor
can be varied by changing the overlapping length of two aluminum cylinders. The initial
capacitance was measured to be 217 pF. An inductor added to the variable capacitor to form
a closed LC circuit was 25 µH. Therefore, the natural frequency of the prototype sensor at
its initial condition should be 2.16 MHz. The buckling wire was made of a fluorocarbon line
to assure high Young’s modulus. The diameter of the wire is 0.22 mm. The output from
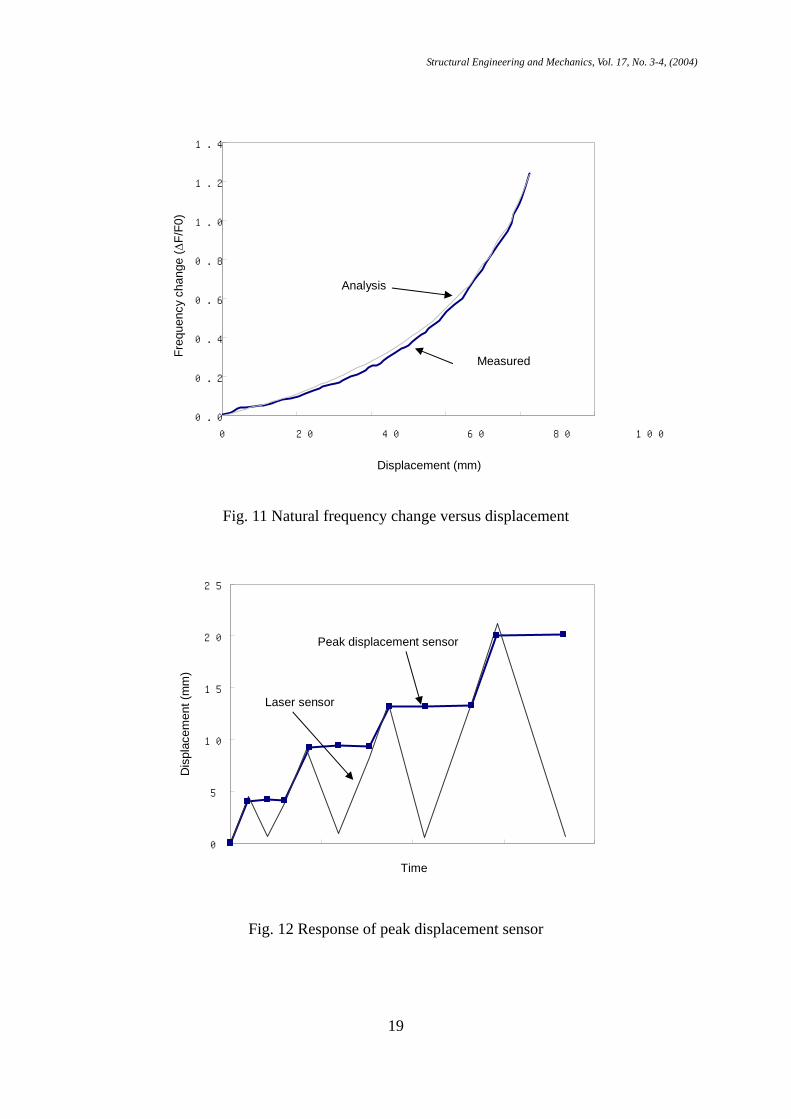
the prototype sensor was compared with the data taken by the laser sensor. The data were
retrieved in the form of natural frequency change of the LC circuit. The relation between the
frequency change and the displacement induced to the variable capacitor is plotted in Fig. 11.
The frequency change was measured by a dip meter. Although the small fluctuation from
the analysis result is observed, the measured relation well fits to the analysis. The small
fluctuation may result from incompleteness of the variable capacitor.
The measured peak displacement is plotted versus the output from the laser sensor in Fig. 12.
It is clearly shown that the peak response is indeed memorized. The friction force was tuned
slightly larger that the buckling force. Both forces were found small enough to result in
excellent performance. The displacement response was caliculated from the change of
natural frequency measured by a dip meter. For example, the initial position corresponded to
2.164 MHz. The largest value of the peak displacement sensor in Fig. 12, 21.1 mm,
corresponded to 2.412 MHz. If this sensor is bonded to a material with the initial sensor
length of 400 mm to measure the strain, the range tested here corresponds to 0 µ strain to
52,750 µ strain. As the mechanism employed here is very simple, the measurement range
can be easily narrowed or widened by changing the length of variable capacitor and wire.
The size of the sensor can be as small as a conventional strain gauge and as large as the
largest displacement sensor. The mechanism employed here to memorize the peak
displacement value can be extended to memorize other physical values such as force, stress,
acceleration, velocity, accumulated plastic deformation and so on.
Structural Engineering and Mechanics, Vol. 17, No. 3-4, (2004)
10
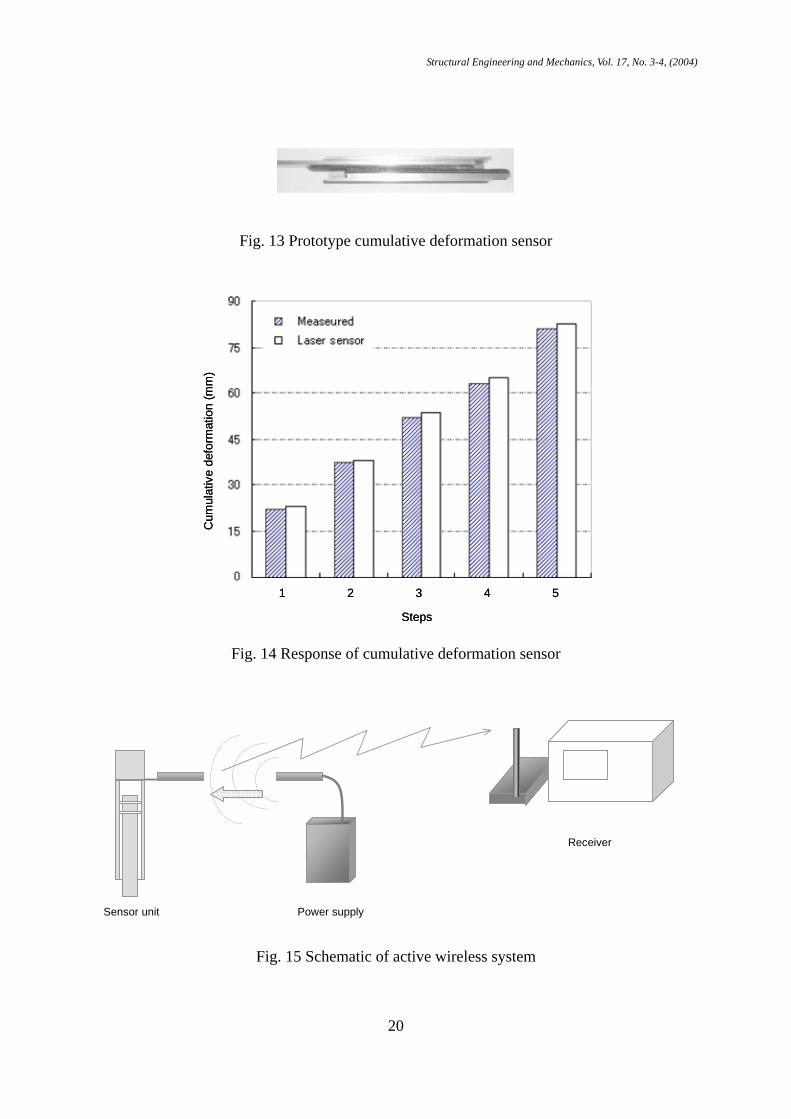
3.2 Cumulative deformation sensor using napped fiber
A prototype of cumulative displacement sensor was made using napped fiber sheets and
aluminum plates as shown in Fig. 13. The plates were 100mm in length, 20mm in width and
2mm in depth. On the bottom surface of the top aluminum plate, a sheet with napped fibers
was bonded. Similarly on the top surface of the bottom aluminum plate, the same sheet with
fibers napped to the opposite direction with the top aluminum plate was bonded. As shown
in Fig. 7, the bottom aluminum plate will move only to the leftward direction. The motion
of the top aluminum plate was measured by a laser displacement sensor. In Fig. 14, the
response of this sensor is plotted versus the cumulative deformation calculated using the
measured displacement by the laser sensor. The response of the cumulative sensor well
matches to the calculated values. However, the cumulative sensor always indicates slightly
smaller response than the calculated ones. This phenomenon is due to the small backlash of
the napped fibers.
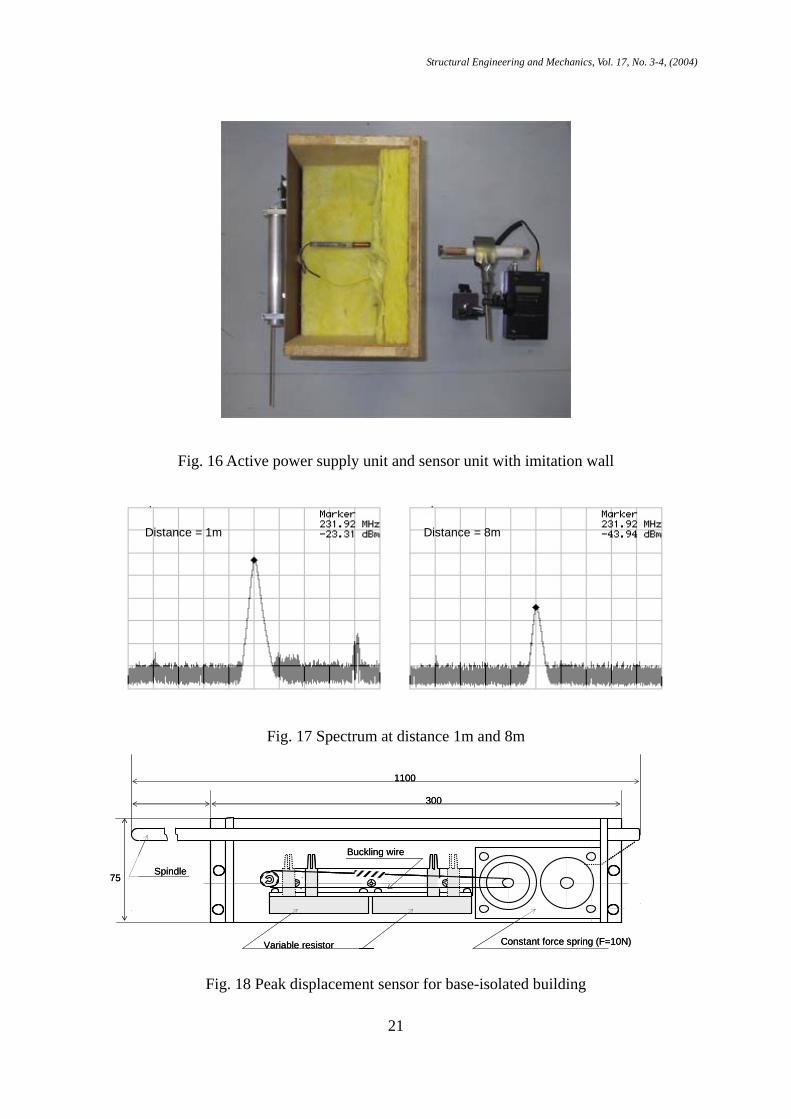
3.3 Active wireless system
The schematic of active wireless system is presented in Fig. 15. The frequency used for the
power supply unit is 130KHz. The oscillating radio wave is supplied to the sensor unit to
generate the direct electric current. Using this generated electricity, the LC circuit including
a variable capacitor is excited. The emitted frequency is detected by an oscilloscope and an
analog amplifier. The frequency emitted from the sensor unit is around 230MHz that is far
away from the frequency used for power supply. The photo of the power supply unit and the
sensor unit is shown in Fig. 16. The wooden box was used to imitate a cosmetic wall in a
building.
The maximum distance between the power supply unit and the sensor unit to ensure enough
power was about 13cm. The amplitude of the power spectrum a dBm was measured for
several distances. The approximate relation between the distance and the amplitude was
obtained from the measured data. The equation is given by
( ) ( )fda log20log206.147 −−= (5)
Using the oscilloscope and the analog amplifier, the peak oscillation frequency was readable
beyond 10m. The spectrum shapes at the distance of 1m and 8m are plotted in Fig. 17.
Structural Engineering and Mechanics, Vol. 17, No. 3-4, (2004)
11
The frequency of the spectrum peak indicates the damage index. We can verify if the height
of the spectrum peak follows the relation expressed in Eq. (5) or not from Fig. 17.
3.4 Peak displacement sensor for base-isolated building
The performance of a base-isolated building fully relies on the health of isolation devices that
are typically made of elastomeric material. As was indicated by Naeim and Kelly (1999), it
is crucial to limit the extreme displacement of the devices within their capacities for keeping
their health. Hence, installing damage index sensors to a base-isolated building to measure
peak deformation of a device is a rational strategy to ensure the safety of the building.
For damage detection of a base-isolated building, a variable resistor based sensor as shown in
Fig. 18 was developed. The sensor consists of two precision potentiometers (used as
variable resistors), thin wires, pulleys, a spindle and a spring. First, the straight-line motion
of the spindle is converted into rotary motion by the right pulley. A spring is attached to this
pulley to introduce a constant resistant force for the motion of the spindle. The rotary
motion induced in the right pulley is converted into straight-line motion by a thin wire
connecting left and right pulleys. One end of a buckling wire is connected to this thin wire.
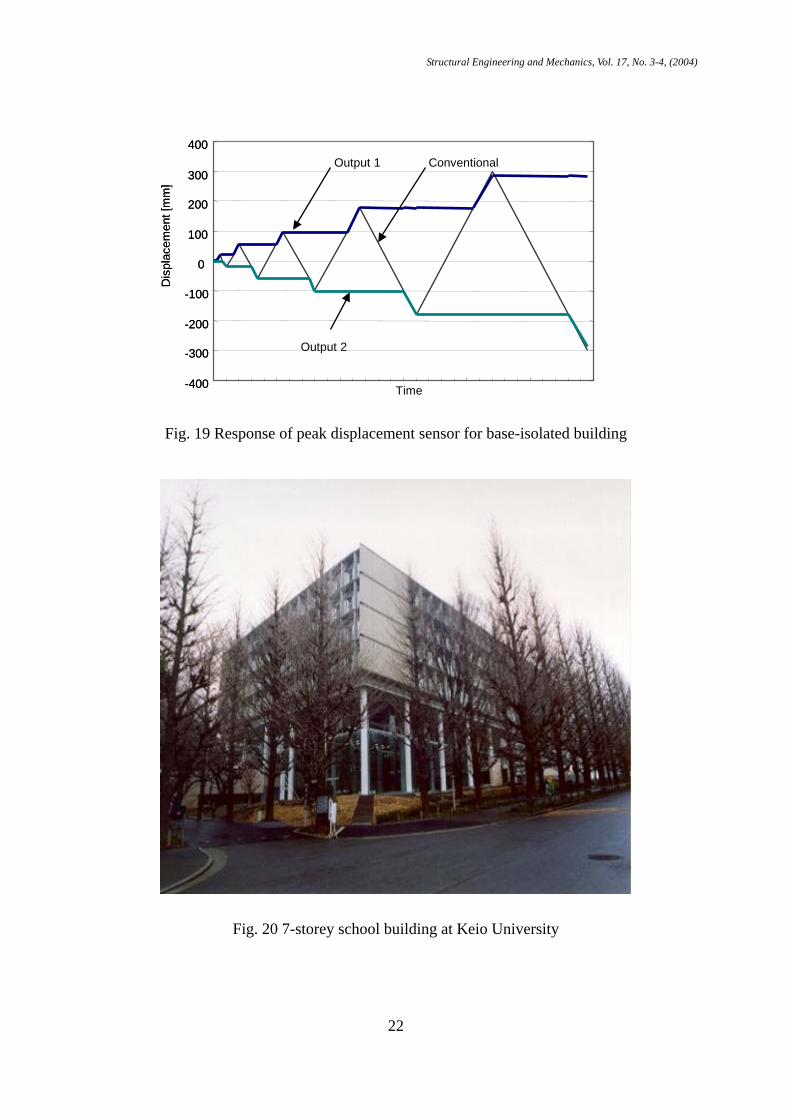
The other end of the buckling wire is connected to a potentiometer. The maximum response
is determined from a set of two outputs from the potentiometers; one output indicates peak
displacement into leftward direction, the other output indicates peak displacement into
rightward direction. The sensor has a 300 mm range in each direction. The resistance
change of the potentiometers may be measured by a conventional tester. The measured
response of this prototype sensor is shown in Fig. 19. It is clearly understood that the
performance of this sensor is excellent.
The developed sensor was installed into a school building at Keio University (see Fig. 20).
The building is a 7-storey seismic isolated building with the gross floor area of 18,606m2. The
height is 31m above ground level. It utilizes high-damping rubber bearings of 750mm and
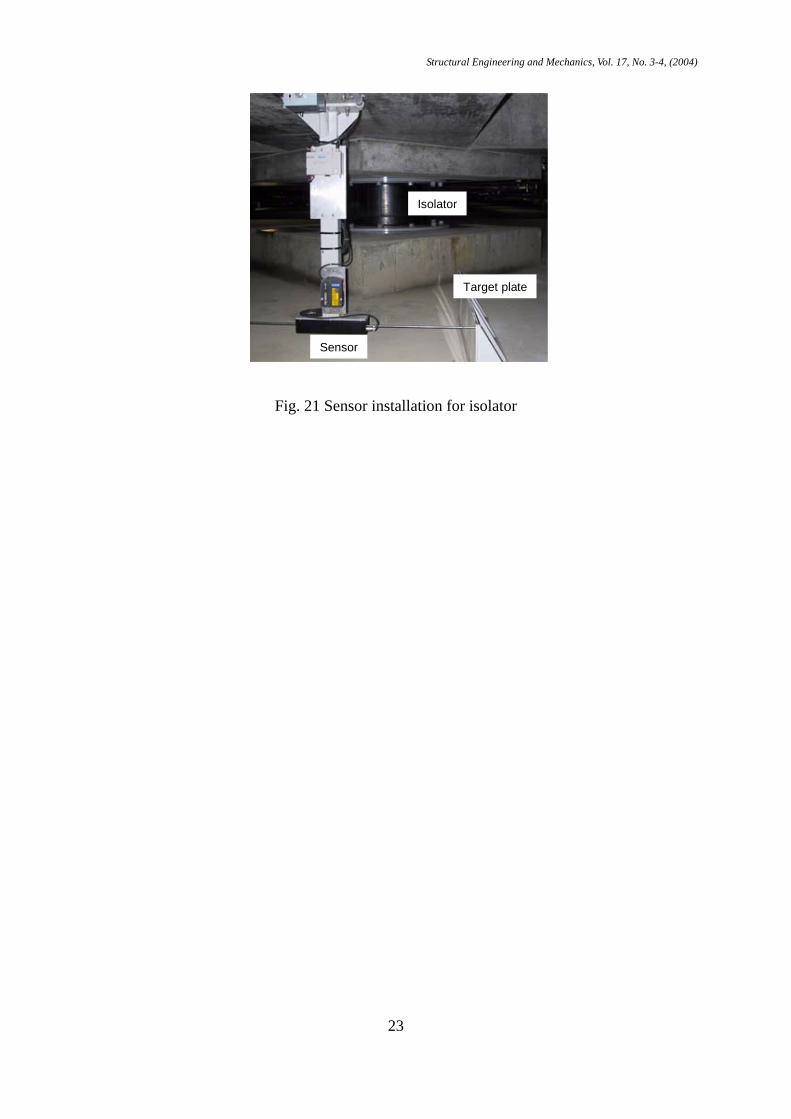
900mm diameter as the isolation devices between the base and the 1st floor. The peak
displacement sensor was installed into one of the isolators as shown in Fig. 21. A smooth
Teflon coated plate was used as a reference for the base. The Teflon coated plate was also
used as a target for a laser displacement sensor so that the performance in the practical
environment can be verified.
Structural Engineering and Mechanics, Vol. 17, No. 3-4, (2004)
12
4. Concluding remarks
A new sensor system was proposed for measuring damage indexes and memorizing the data
using a mechanical memory. The damage index is a physical value that is well correlated to
a critical damage in a device or a structure. The mechanism proposed here as a mechanical
memory utilizes elastic buckling of a thin wire without any external power supply. The
external power supply is needed only for the data retrieval system when the data is required.
Furthermore, passive and active wireless data retrieval mechanisms using electromagnetic
induction were proposed. The passive wireless system was achieved by forming a closed
LC circuit to oscillate at a certain frequency using a dip meter. The active wireless system
could transmit the damage index wirelessly much further than the passive system at the
sacrifice of slightly complicated electric circuit for the sensor device. Theoretical and
experimental studies exhibited excellent performance of the proposed sensor. A prototype
damage index sensor has been already installed into a 7 storey base-isolated building for field
verification.
The resolution of the proposed damage index sensors may be further improved by introducing
two different frictions so that the friction force in a tensile direction is kept negligible and the
friction in a compression direction remains much greater than the buckling force of the wire.
This concept is similar to the sensing mechanism using the napped fiber.
Acknowledgement
The authors are grateful to reviewers for their penetrating comments. The last sentence of
concluding remarks was added according to a comment by one of reviewers.
References
Casciati (Editor) 2003, Proceedings of the Third World Conference on Structural Control,
John Wiley & Sons.
Conner, J. 2002, Introduction to Structural Motion Control, Prentice Hall.
Connor J J, Wada A, Iwata M, and Huang Y H 1997 Damage-Controlled Structures. I:
Preliminary Design Methodology for Seismically Active Regions”, J. of Struct. Eng.
123, No. 4 423-431.
Structural Engineering and Mechanics, Vol. 17, No. 3-4, (2004)
13
Finkenzeller, K. 2000, RFID Handbook : Radio-Frequency Identification Fundamentals and
Applications, John Wiley & Sons, Inc.
Kakizawa, T. and S. Ohno 1996, “Utilization of Shape Memory Alloy as a Sensing Material
for Smart Structures,” Proc. Advanced Composite Materials in Bridges and Structures,
67-74.
Matsubara, H., S.-G. Shin, Y. Okuhara, H. Nomura and H. Yanagida 2001, “Application of the
self-diagnosis composite into concrete structure”, Proc. SPIE Vol. 4234, p. 36-43.
Mita, A. 1999, "Emerging Needs in Japan for Health Monitoring Technologies in Civil and
Building Structures" Proc. Second International Workshop on Structural Health
Monitoring, Stanford University, pp. 56-67.
Muto, N., H. Yanagida, T. Nakatsuji, M. Sugita, Y. Ohtsuka and Y. Arai 1992, “Design of
Intelligent Materials with Self-Diagnosing Function for Preventing Fatal Fracture,”
Smart Materials and Structures, Vol.1, 324-329
Naeim, F. and J. M. Kelly 1999, Design of Seismic Isolated Structures from Theory to
Practice, John Wiley & Sons, Inc.
Okuhara, Y., S.-G. Shin, H. Matsubara, H. Yanagida and N. Takeda 2001, “Development of
conductive FRP containing carbon phase for self-diagnosis structures”, Proc. SPIE Vol.
4328, p. 314-322.
Westermo, B.D. and L. Thompson 1994, “Smart Structural Monitoring: A New Technology,”
International Journal of Sensors, 15-18.
Structural Engineering and Mechanics, Vol. 17, No. 3-4, (2004)
14
Nor
mal
ized
stra
in
Time
Damage index
Conventional
Nor
mal
ized
stra
in
Time
Damage index
Conventional
l0
∆l
(a) Initial stage
(b) Loading stage
(c) Unloading stage
Fig. 1 Ideal response of damage index sensor
Fig. 2 Mechanism of memory using thin resistant wire
Structural Engineering and Mechanics, Vol. 17, No. 3-4, (2004)
15
Nor
mal
ized
stra
in
Time
Damage index
Conventional
1 2 3 4
∆l ∆L
∆L
l0
(a) Initial stage
(b) Loading stage
(c) Unloading stage
Fig. 3 Mechanism of memory using variable element and thin wire
Fig. 4 Typical response of damage index sensor using resistant wire
Structural Engineering and Mechanics, Vol. 17, No. 3-4, (2004)
16
Case
Seismic mass
Arm
Buckling wire
Variable device
Leaf spring
Acceleration
Nor
mal
ized
stra
in
Time
Conventional sensor
Damage index sensor
1 2 3
Fig. 5 Typical response of damage index sensor using variable element and thin wire
Fig. 6 Schematic of peak acceleration sensor
Structural Engineering and Mechanics, Vol. 17, No. 3-4, (2004)
17
(a) Initial stage
(b) Motion to right
(c) Motion to left
Energy absorptionMeasured dip
Fig. 7 Schematic of cumulative deformation sensor
Fig. 8 Mechanism of passive wireless data retrieval system
Structural Engineering and Mechanics, Vol. 17, No. 3-4, (2004)
18
Sensor unitFeeding device
2u
Magnetic field:H
rC 1C 2C
Oscilator
Variable capacitorLaser sensor
Dip meter
Fig. 9 Mechanism of active wireless data retrieval system
Fig. 10 Prototype peak displacement sensor with dip meter
Structural Engineering and Mechanics, Vol. 17, No. 3-4, (2004)
19
0.0
0.2
0.4
0.6
0.8
1.0
1.2
1.4
0 20 40 60 80 100
Displacement (mm)
Freq
uenc
y ch
ange
(∆F/
F0)
Measured
Analysis
0
5
10
15
20
25
Time
Dis
plac
emen
t (m
m)
Peak displacement sensor
Laser sensor
Fig. 11 Natural frequency change versus displacement
Fig. 12 Response of peak displacement sensor
Structural Engineering and Mechanics, Vol. 17, No. 3-4, (2004)
20
Cum
ulat
ive
defo
rmat
ion
(mm
)
Steps
1 3 542
Cum
ulat
ive
defo
rmat
ion
(mm
)
Steps
1 3 542
Fig. 13 Prototype cumulative deformation sensor
Fig. 14 Response of cumulative deformation sensor
Fig. 15 Schematic of active wireless system
Power supplySensor unit
Receiver
Structural Engineering and Mechanics, Vol. 17, No. 3-4, (2004)
21
Distance = 1m Distance = 8mDistance = 1m Distance = 8m
1100
300
Constant force spring (F=10N)
75
Variable resistor
Buckling wire
Spindle
1100
300
Constant force spring (F=10N)
75
Variable resistor
Buckling wire
Spindle
Fig. 16 Active power supply unit and sensor unit with imitation wall
Fig. 17 Spectrum at distance 1m and 8m
Fig. 18 Peak displacement sensor for base-isolated building
Structural Engineering and Mechanics, Vol. 17, No. 3-4, (2004)
22
-400
-300
-200
-100
0
100
200
300
400
Dis
plac
emen
t [m
m]
Time
Output 1
Output 2
Conventional
-400
-300
-200
-100
0
100
200
300
400
-400
-300
-200
-100
0
100
200
300
400
Dis
plac
emen
t [m
m]
Time
Output 1
Output 2
Conventional
Fig. 19 Response of peak displacement sensor for base-isolated building
Fig. 20 7-storey school building at Keio University
Structural Engineering and Mechanics, Vol. 17, No. 3-4, (2004)
23
Isolator
Sensor
Target plate
Fig. 21 Sensor installation for isolator