damage evolution in braided composite tubes under torsion
TRANSCRIPT

Damage Evolution in Braided Composite
Tubes Under Torsion Studied by In-situ
X-ray Computed Tomography
A thesis submitted to The University of Manchester for the degree of
Doctor of Philosophy
in the Faculty of Science and Engineering
2020
Yuan Chai
Department of Materials

2
Contents
Contents ........................................................................................................................... 2
List of figures ................................................................................................................... 5
List of tables ................................................................................................................... 11
Abstract .......................................................................................................................... 12
Declaration ..................................................................................................................... 13
Copyright ....................................................................................................................... 14
Scientific contributions ................................................................................................. 15
Acknowledgements ........................................................................................................ 16
1. Introduction ............................................................................................................... 18
1.1 Background ........................................................................................................... 18
1.2 Aims and objectives .............................................................................................. 19
1.3 Thesis layout ......................................................................................................... 20
2. Literature review on braided composites and their mechanical behaviour ........ 22
2.1 Braided composites ............................................................................................... 22
2.1.1 Fibre reinforced composites ........................................................................... 22
2.1.2 Braiding and braided performs ...................................................................... 23
2.1.3 Manufacturing of braided composites ............................................................ 27
2.1.4 Applications of braided composites ............................................................... 30
2.2 Mechanical performance of braided composites ................................................... 32
2.2.1 Effect of tow crimp/waviness ........................................................................ 32
2.2.2 Effect of braid architecture ............................................................................ 33
2.2.3 Effect of open-hole ......................................................................................... 37
2.2.4 Damage modes in braided composites ........................................................... 38
2.3 Chapter summary .................................................................................................. 43
3. Literature review on microstructural and damage characterisation of textile
composites .................................................................................................................. 44
3.1 Destructive characterisation techniques ................................................................ 44
3.2 Non-destructive characterisation techniques ......................................................... 46
3.3 X-ray computed tomography (CT) ........................................................................ 51
3.3.1 Basic principles of X-ray CT ......................................................................... 51
3.3.2 Time-lapse X-ray CT ..................................................................................... 56
3.3.3 Challenges of X-ray CT in characterising composites................................... 58
3.4 Application of X-ray CT to fibre reinforced polymers ......................................... 62
3.4.1 Microstructure characterisation ...................................................................... 62
3.4.2 Damage characterisation ................................................................................ 66
3.4.3 Image-based modelling .................................................................................. 72

3
3.5 Chapter summary .................................................................................................. 75
4. Materials and experimental methods ...................................................................... 76
4.1 Materials and sample preparation ......................................................................... 76
4.2 Torsion testing of braided composite tubes .......................................................... 78
4.2.1 Torsion testing................................................................................................ 78
4.2.2 In-situ torsion testing ..................................................................................... 78
4.3 X-ray CT image acquisition and reconstruction ................................................... 79
4.4 X-ray CT image analysis ....................................................................................... 81
4.5 Chapter summary .................................................................................................. 85
5. Damage evolution in braided composite tubes under torsion studied by in-situ
X-ray computed tomography (Article 1) ................................................................ 86
5.1 Introduction ........................................................................................................... 88
5.2 Materials and methods .......................................................................................... 90
5.2.1 Preparation of CFRP tube samples ................................................................ 90
5.2.2 Torsional testing ............................................................................................. 90
5.2.3 Time-lapse synchrotron radiation X-ray CT .................................................. 93
5.3 Results ................................................................................................................... 93
5.4 Discussion ............................................................................................................. 98
5.5 Conclusions ......................................................................................................... 102
6. Effect of open-holes on the torsional performance of braided CFRP tubes
(Article 2) ................................................................................................................. 104
6.1 Introduction ......................................................................................................... 106
6.2 Materials and Methods ........................................................................................ 108
6.2.1 Sample preparation ...................................................................................... 108
6.2.2 Torsion testing and stereo DIC .................................................................... 109
6.2.3 In-situ synchrotron X-ray CT ....................................................................... 110
6.3 Results and discussion ......................................................................................... 111
6.3.1 Shear stress-strain mechanical behaviour .................................................... 111
6.3.2 Evolution of the strain field with low levels of shear strain ........................ 113
6.3.3 Overall damage development ....................................................................... 116
6.3.4 Damage evolution distant from the hole ...................................................... 118
6.3.5 Damage initiation and propagation local to the hole ................................... 119
6.4 Conclusions ......................................................................................................... 122
7. Following the effect of braid architecture on performance and damage of carbon
fibre/epoxy composite tubes during torsional straining (Article 3) .................. 124
7.1 Introduction ......................................................................................................... 126
7.2 Materials and methods ........................................................................................ 128
7.2.1 CFRP tube manufacture ............................................................................... 128
7.2.2 Torsion testing.............................................................................................. 129
7.2.3 In-situ torsion test......................................................................................... 130

4
7.2.4 X-ray CT image processing ......................................................................... 131
7.3 Microstructure and mechanical performance of braided CFRP tubes ................ 133
7.3.1 Microstructure of the braided tubes ............................................................. 133
7.3.2 Torsional performance of braided CFRP tubes ............................................ 134
7.4 Damage mechanisms in braided CFRP tubes ..................................................... 136
7.4.1 Damage initiation and propagation .............................................................. 136
7.4.2 Overall damage distribution ......................................................................... 141
7.5 Effect of braid pattern on torsional damage evolution ........................................ 142
7.6 Conclusions ......................................................................................................... 146
8. Conclusions and future work ................................................................................. 149
8.1 Conclusions ......................................................................................................... 149
8.2 Future Work ........................................................................................................ 152
References .................................................................................................................... 154
Word Count: 47300

5
List of figures
Figure 2.1 Constituent materials of commercial aircraft Boeing 787 18. ........................ 22
Figure 2.2 Typical 2D braid patterns. ............................................................................. 24
Figure 2.3 Schematics of biaxial and triaxial braids. ...................................................... 24
Figure 2.4 A 48-carrier braiding machine at The University of Manchester (Herzog
GmbH & Co. KG). .......................................................................................................... 25
Figure 2.5 Schematic diagram showing the carrier moving route for (a) tubular 2D braids
(b) flat 2D braids. ............................................................................................................ 26
Figure 2.6 Schematic diagram illustrating the measurement of the crimp angle (Φc). ... 27
Figure 2.7 Two typical manufacturing routes of braided composites. ............................ 28
Figure 2.8 (a) Jet engine overview (left) and 2D triaxial carbon fibre braided composite
fan case fabricated by A&P Technology 1, 39. (b) Braided composite trailing arm of a
helicopter 40. (c) Drone frame by Dji 41........................................................................... 31
Figure 2.9 Applications of braided composites, (a) A-pillar frame of BMW 7-Series, (b)
wheels of motorbike 46 and (c) bicycle frame by BlackBraid 47. .................................... 32
Figure 2.10 Compressive strength of four-layer 1/1 braided glass fibre/epoxy composite
plates as a function of braid angle in comparison to that of the equivalent laminates 53.
......................................................................................................................................... 33
Figure 2.11 Video images of neck propagation in a single-layer 2/2 braided glass
fibre/epoxy composite tube with a braid angle of 55° under tension 55. .......................... 34
Figure 2.12 Photographs of single-layer 2/2 braided glass fibre/epoxy composite tubes
failed under compression, showig (a) a tube with a braid angle of 23° failed by fibre micro-
buckling and (b) a tube with a braid angle of 40° failed by diamond shaped buckling 56.
......................................................................................................................................... 34
Figure 2.13 (a) Tensile moduli and (b) tensile strength of single-layer 1/1 and 2/2 braided
Kevlar fibre/epoxy composite tubes with braid angles of 35°, 45° and 55° 54. ................ 36
Figure 2.14 (a) Shear moduli and (b) shear strength of single-layer 1/1 and 2/2 braided
Kevlar fibre/epoxy composite tubes with braid angles of 35°, 45° and 55° 54. ................ 36
Figure 2.15 The propagation of whitening (damaged) area of an open-hole flat braided
1/1-30° GFRP specimen (w = 22 mm and d = 6 mm) observed by an optical microscope
during the tensile test 61. .................................................................................................. 37
Figure 2.16 Micro-damage in the form of matrix crack developed from the edge of an
open-hole flat braided 1/1-30° GFRP specimen subjected to axial tension 60. ............... 38
Figure 2.17 Schematic showing the typical micro-damage modes in braided composites
(adapted from 6)............................................................................................................... 39
Figure 2.18 2D X-ray CT images showing the damage evolution in a four-layer 2/2-60°
braided CFRP plate under tension, where feature 1 corresponds to a manufacturing defect,
feature 2 and feature 3 intra-tow cracks, feature 4 inter-tow debonding and feature 5
fibre/tow fracture 62. ........................................................................................................ 40

6
Figure 2.19 A SEM image showing inter-tow debonding and intra-tow crack in a triaxial
1/1 [0/±45°] braided CFRP plate under tension (adapted from 10). ................................. 40
Figure 2.20 Magnified SEM images of the fracture surface of an open-hole 1/1-12°
braided carbon fibre/epoxy composite plate failed under axial compression 58. ............ 41
Figure 2.21 Schematic diagram showing fibre micro-buckling (middle) and kink-band
(right) development from initially misaligned fibres (left) 63. ........................................ 42
Figure 2.22 A 2D X-ray CT image showing delamination damage in a two-layer 2/2-25°
braided CFRP plate after low-velocity impact testing at the energy of 3J. The sample was
impacted at the centre of top surface with a 10 mm–diameter flat headed impactor 65. . 42
Figure 3.1 A typical optical micrograph for measuring the crimp angle of braided tows 11.
......................................................................................................................................... 45
Figure 3.2 An optical micrograph showing matrix cracking on a section normal to the 0°
direction in a four-ply triaxial [0/±60°] braided carbon fibre/epoxy composite plate
subjected to axial tension 7. ............................................................................................. 45
Figure 3.3 The number of publications using various NDE techniques to study composite
materials in the past 30 years 70....................................................................................... 46
Figure 3.4 Schematic for a typical stereo DIC setup and workflow. .............................. 48
Figure 3.5 DIC measured and numerical model simulated axial strain distribution along
the warp direction (x) of a single-layer plain-woven CFRP plate loaded under axial
tension to 1% and 1.9% applied strain, alongside the DIC axial strain map at 1.9% applied
strain 83. ........................................................................................................................... 50
Figure 3.6 (a) The axial strain fields at maximum tensile stress and (b) the shear strain
fields at maximum shear stress of 2D biaxial braided CFRP tubes of different braid
architectures (braid pattern: 1/1 and 2/2; braid angle: 35°, 45° and 55°), showing localised
strain concentrations following the braid pattern 54. ....................................................... 50
Figure 3.7 Schematic illustration of X-ray CT acquisition and reconstruction process. 52
Figure 3.8 Common artefacts for a cylindrical sample with three circular and one square
hole: (a) without artefact, (b) beam hardening, (c) ring artefact and (d) motion effect 94.
......................................................................................................................................... 55
Figure 3.9 Different modes of time-lapse X-ray CT 91. .................................................. 57
Figure 3.10 2D cross-section of a fatigued 3D woven GFRP imaged in (a) pure absorption
mode and (b) with modest phase contrast using a lab-CT system 103. ............................ 60
Figure 3.11 2D X-ray CT cross-section of a plain woven CFRP, where a fibre tow has
been coated with gold before preforming 116. ................................................................. 61
Figure 3.12 Magnified 2D X-ray CT views of a fatigued non-crimp GFRP (a) under the
unloaded state and (b) strained by 0.17% 118. ................................................................. 61
Figure 3.13 (a) Schematic of a loading fixture for in-situ compression of multiple layers
of plain-woven glass fabrics, (b) the measured average layer thickness as a function of
pressure and the number of layers and (c) the typical 2D X-ray CT cross-sections of weft
cross-sections of a single layer, six and ten layers, showing nesting phenomenon in multi-
layer fabric stacks. 129 ...................................................................................................... 63

7
Figure 3.14 Bar chart comparing the tow dimensions and arrangement measured on the
surface, from cross-sectional optical micrographs and using X-ray CT, showing the
consistency across different approaches. The measured parameters include the yarn
thickness (d1), yarn width (d2) and yarn spacing (a) of warp, weft and binder tows in four
different types of 3D fabrics 123. ..................................................................................... 63
Figure 3.15 (a) X-ray CT 3D volume rendering of 2D 1/1-40° braided Kevlar/epoxy tube
(inner diameter 11.1 mm) and (b) the extracted centre lines of individual braid 15. ....... 64
Figure 3.16 Orthogonal 2D X-ray CT cross-sections of a 3D orthogonal woven CFRP
sample, showing the shape and distribution of voids 133. ................................................ 65
Figure 3.17 (a) A 2D X-ray CT cross-section of a partially impregnated glass fibre tow,
having dry and wet regions. 3D X-ray CT volume rendering of the glass fibre tow (b)
before resin infusion, (c) partially impregnated and (d) fully impregnated. (e) Schematic
diagram illustrating the syrup flow at the tow/fibre level during vacuum infusion 136. .. 66
Figure 3.18 Photographs and X-ray CT images showing the damage morphology in 3D
braided CFRP tubes having braid angles of 15°, 30° and 45° (inner diameter 20.5 mm and
wall thickness are 1.75mm, 2.20mm and 2.65mm) 9. ..................................................... 68
Figure 3.19 3D X-ray CT volume renderings to compare the distribution and evolution of
cracks for “2 × 2 UC” (left, dimensions 10.8×10.8×2.7 mm) and “1 UC” (right,
dimensions 5.7×5×2.7 mm) samples after (a) and (b) 200, (c) and (d) 800, (e) and (f) 1400
thermal cycles 133............................................................................................................. 69
Figure 3.20 (a) 3D X-ray CT volume rendering of the woven structure before fatigue and
damage within a unit cell at different stages of the fatigue life, showing progressive
damage evolution in a 3D woven glass fibre composite. (b) The number of transverse
cracks and the fraction of debonded weft/binder interface as a function of fatigue life
quantified based on X-ray CT images 141. ....................................................................... 70
Figure 3.21 (a) Schematic of the specimen geometry (dimensions 20×39×8 mm) and the
region of interest. (b-d) X-ray CT images and extracted damage (blue), showing the
evolution of damage with increasing load (2.5, 4 and 4.3 kN, respectively). (e) A
magnified 2D X-ray CT image showing the debonding crack at the state of (d) 13. ....... 71
Figure 3.22 Plots of comparing the compaction stress versus fibre volume fraction
behaviour between simulated results from models generated from X-ray CT images and
TexGen software, and experimental results 147. .............................................................. 73
Figure 3.23 (a) X-ray CT image analysis to extract braid tows in a 3D braided CFRP plate,
(b) image-based model, (c) idealised model and (d) one typical axial tow in the image-
based model 149. ............................................................................................................... 74
Figure 3.24 3D volume rendering of fibre tows (a) directly extracted from X-ray CT
image and (b) smoothed via kriging in a multi-layer 2D woven glass fibre composite 150.
......................................................................................................................................... 74
Figure 3.25 X-ray CT sections showing a highlighted weft yarn (left, side view) and the
corresponding key sections used to select the contours of this weft yarn (right, front view) 151. .................................................................................................................................... 75
Figure 4.1 Photograph (left) and schematic (right) of composite tube specimens for
torsion testing on Instron testing frames. ........................................................................ 77

8
Figure 4.2 Photograph of in-situ experiment set-up on synchrotron beamline I13-2,
Diamond Light Source, UK ............................................................................................ 79
Figure 4.3 Schematics of synchrotron X-ray CT image acquisition strategies, a)
conventional scan with 180° rotation. b) off-centred scan with 360° rotation................. 80
Figure 4.4 A typical X-ray CT 2D cross-section of the braided tube (1/1 - diamond
structure, braid angle 45°), (a) raw image of a magnified region, (b) ‘non-local mean’
filtered image and (c) filtered image with segmented features highlighted in different
colours. ............................................................................................................................ 82
Figure 4.5 Visualisation of X-ray CT images of 1/1-45° braided composite tube. a) a
conventional horizontal slice image, b) 3D volume rendering of the composite tube, c)
3D volume rendering with a horizontal slice image. d) 3D volume rendering with an
angled slice image along a -45° braid tow (highlighted in green, and a +45° braid tow is
highlighted in yellow). .................................................................................................... 83
Figure 4.6 The X-ray CT 3D volume rendering of segmented constituents of a 2/2-45°
braided composite tube, (a) epoxy resin and carbon fibre tows and (b) typical individual
braid tows. ....................................................................................................................... 84
Figure 4.7 X-ray CT 3D volume rendering of the 1/1-45 braided composite tube before
and after unwrapping....................................................................................................... 85
Figure 5.1 Photograph of the experimental set-up on the I13-2 beamline at Diamond Light
Source, showing the in-situ torsional loading of the composite by the open frame rig
positioned on the sample table, the rotating grips can be seen in the magnified insert. . 91
Figure 5.2 Torsional shear stress – strain plot of the braided CFRP reported here, showing
black points at which the test was interrupted, the load relaxed (marked in black) and the
X-ray CT scans were undertaken. The levels of inter-tow debonding (blue) and intra-tow
cracking (red) damage were quantified as a function of shear strain. The torsional shear
stress-strain curves of the samples with the same geometry obtained from an Instron test
(green) and a repeating in-situ test (orange) were also plotted here. .............................. 92
Figure 5.3 X-ray CT images of the CFRP tube at 𝛾 = 3.2% (S6). 3D volume rendering
illustrating the positions of the (a) XY and (e) XZ sections. (b-d) Virtual (hoop) XY
sections and (f-h), virtual XZ (longitudinal) sections with +45° tows shaded in yellow and
-45° in green, showing the interlacing tow arrangement and typical damage modes
observed. ......................................................................................................................... 94
Figure 5.4 X-ray CT virtual slices parallel to (a) +45° and (b) -45° tows with increasing
shear strain from 0 to 4.9% (S0-S8), showing the damage sequence. ............................ 95
Figure 5.5 3D volume rendering showing initiation a propagation of inter-tow debonding
(blue) and intra-tow cracking (red) as the shear strain is increased from 0 to 3.2%. ...... 97
Figure 5.6 Evolution of inter-tow debonding with increasing shear strains measured from
the segmented X-ray CT images. .................................................................................... 97
Figure 5.7 Schematic diagrams highlighting the different types of damage corresponding
to Figure 5.4(a-b) – parallel to (a) +45° and (b) -45° tows with increasing shear strain from
0 to 4.9% (S0-S8). ........................................................................................................... 99
Figure 5.8 3D volume rendering of the damage at 𝛾 = 3.2% showing the relative spatial
distribution of inter-tow debonding as well as different types of intra-tow cracks. ..... 100

9
Figure 5.9. Magnified views of a virtual section along -45° tows with increasing shear
strain, showing the formation a kink band caused by axial compression and intra-tow
cracking in the +45 tows caused by transverse compression. ....................................... 101
Figure 6.1 (a) Photograph of a typical open-hole 1/1-45° braided CFRP tube test-piece
with the tube axis parallel to the z axis. (b) Photograph showing the stereo DIC set-up and
a magnified view of the paint speckled tube surface (inset). ........................................ 109
Figure 6.2 Photograph of the set-up for the in-situ experiment on the I13-2 beamline,
Diamond Light Source, UK. The grips on the open frame rig rotate in synchrony so that
X-ray imaging could be performed while the torsional load was applied to the braided
composite tube. ............................................................................................................. 111
Figure 6.3 Shear stress-strain curves of the un-notched tube (denoted reference), the four
open-hole 1/1-45° braided CFRP tubes (samples OH_1 - OH_4) tested on Instron and the
interrupted X-ray CT test (OH_in-situ)......................................................................... 112
Figure 6.4 Surface transverse strain, axial strain and shear strain fields for samples (a)
OH_1 and (b) OH_3 at applied mean shear strains of 0, 0.3, 0.6 and 0.9% as mapped by
DIC. ............................................................................................................................... 115
Figure 6.5 Schematic of the surface braid patterns of samples OH_1 and OH_3. +45° AT
tows are coloured yellow and -45° AC tows are coloured green. The position of the drilled
hole is marked by the red circle. ................................................................................... 116
Figure 6.6 3D surface shear strain fields measured by stereo DIC for sample OH_3 at
applied shear strain levels of 0, 1, 2, 3, 4 and 5% , illustrating the evolution of shear strain
concentrations. .............................................................................................................. 117
Figure 6.7 X-ray CT 3D volume rendering of sample OH_in-situ at stages (a) S0 (𝛾 =
0%) and (b) S4 (𝛾 = 1.5%), showing the overall damage distribution (rendered red). The
bright particles on the tube surface were used as fiducial markers to register X-ray CT
datasets. ......................................................................................................................... 118
Figure 6.8 Time-lapse sequence for X-ray CT virtual slices cut (a) parallel to a +45° AT
tow (tinted yellow) and (b) parallel to a -45° AC tow (tinted green) of sample OH_in-situ
with increasing shear strain from 0 to 1.5%, showing the early stages of damage
accumulation. ................................................................................................................ 119
Figure 6.9 Time-lapse sequence for the inner and outer views of the 3D volume rendered
X-ray CT image around the hole, showing damage development from the hole. The blue
arrows indicate the direction of out-of-plane (radial) fibre micro-buckling, and the red
arrows indicate the direction of in-plane (circumferential) fibre micro-buckling. ....... 120
Figure 6.10 Time-lapse sequence for X-ray CT virtual slices showing (a) in-plane fibre
micro-buckling close to the hole and (b) out-of-plane fibre micro-buckling (yellow (AT)
and green (AC) tinting added to black and white sections for clarity). ........................ 121
Figure 7.1 (a) Photograph showing the braiding process. (b) Schematic of the composite
manufactured by the VARI system, with 1/1-45° and 2/2-45° braid patterns extracted from
the X-ray CT images inset............................................................................................. 129
Figure 7.2 In-situ loading and synchrotron X-ray CT imaging set-up on the I13-2
beamline, Diamond Light Source, UK. ......................................................................... 131
Figure 7.3 (a) 3D rendering of the X-ray CT scan showing the alternately biased fibre
tows in the 2/2-45° braided tube illustrating the image unwrapping process. (b) A

10
schematic of the X-ray CT section along A-A in (a) illustrating the calculation of the
crimp angle. ................................................................................................................... 133
Figure 7.4 (a) Typical shear stress-strain curves of the 1/1 (in black) and 2/2 (in blue)
braided CFRP tubes with different braiding angles tested on an Instron 8802. (b) Shear
stress-strain curves for the 2/2-45° braided tubes tested on an Instron 8802 (1-3) and
recorded by the in-situ load rig during the CT scanning where the load drops and the red
circles indicate the CT scan periods recorded at constant displacement. ..................... 135
Figure 7.5 Plots of (a) measured and (b) normalised (Vf = 45%) shear moduli (blue) and
shear strengths (amber) of CFRP tubes with different braid architectures, the error bars
represent the variation across three tests. ...................................................................... 136
Figure 7.6 (a) Schematic illustration of circumferential (top) and radial (bottom) inter-
tow debonding damage modes. (b) X-ray CT 3D volume rendering of AC (green) and AT
(yellow) tows highlighting the inter-tow debonding damage mode between adjacent AC
tows which is the first damage mode to initiate for the 2/2 braid and (c) post-mortem
photograph of the 2/2-45° braided CFRP specimen tested in-situ. ............................... 137
Figure 7.7 Time lapse sequence of a virtual X-ray CT slice cut parallel to an AT tow of
the 2/2-45° braided CFRP tube with increasing shear strain from 0 to 5.4%, showing the
evolution of damage (yellow (AT tow) and green (AC tow) tinting added to black and
white sections for clarity). ............................................................................................. 138
Figure 7.8 A time-lapse sequence for an X-ray CT virtual slice cut parallel to an AC tow
of the 2/2-45° braided CFRP tube with increasing shear strain from 0 to 5.4%, showing
the evolution of damage (yellow (AT tow) and green (AC tow) tinting added to black and
white sections for clarity). ............................................................................................. 139
Figure 7.9 (a) Schematic of a typical section along the AC tow (the blue shading indicates
where AC tow lies outside AT tows, while the pink shading indicates where the AC tow
lies inside the AT tows). (b-d) Regions of interest taken from X-ray CT sections (parallel
to AC (green) tows) for the 2/2-45° braided tube under 6% shear strain and the
corresponding schematics illustrating different types of fibre micro-buckling and fibre
kink-band formation (red lines) caused by the shear-induced axial compression. ....... 141
Figure 7.10 Semi translucent X-ray CT 3D volume renderings showing the propagation
of damage in 2/2-45° braided tube with increasing shear strain, where the lighter regions
indicate the presence of damage. .................................................................................. 142
Figure 7.11 Stress-strain curves for 2/2 -45 and 1/1-45 braided tubes alongside stills taken
from live video imaging (see supplementary info) showing surface damage accumulation
in the 2/2-45° (at stages a1-a4) and 1/1-45° (at stages b1-b4) samples with increasing shear
strain. ............................................................................................................................. 144
Figure 7.12 Unwrapped and projected circumferential inter-tow debonding damage (blue)
obtained from segmented X-ray CT images, showing the distribution of this damage
mode between biased tows for 1/1-45° (top) and 2/2-45° (bottom) braided CFRP tubes at
a shear strain of ~2.0%, overlaid on top of the braid pattern of AC (green) and AT (yellow)
tows. .............................................................................................................................. 145

11
List of tables
Table 3.1 Comparison of the main characteristics between synchrotron and laboratory X-
ray imaging, adapted from 90. .......................................................................................... 54
Table 4.1 The four types of braids studied in this project. .............................................. 76
Table 6.1 Summary of shear stiffness and shear strength values for the unnotched and the
open-hole 1/1-45° braided CFRP tubes. ........................................................................ 113
Table 7.1. Microstructural parameters of the braided composite tubes measured by X-ray
CT. ................................................................................................................................. 134

12
Abstract Damage evolution in braided composite tubes under torsion
studied by in-situ X-ray computed tomography
Yuan Chai
The University of Manchester
Doctor of Philosophy
2020 Torsion is an important loading mode of tubular shaped composites in engineering
applications (e.g. drive shafts). In this respect, a good understanding of the underlying damage mechanisms is crucial for failure prediction and structure optimisation. Until now, limited work has been reported that helps elucidate the real-time damage accumulation mechanisms in three dimensions during the torsional failure process. In this project, the first in-situ time-lapse X-ray computed tomography (CT) study of single-layer braided carbon fibre reinforced polymer (CFRP) tubes (fibre volume fraction ~40-45%) loaded progressively under torsion has been reported, aiming to establish the relations between damage mechanisms and braid architecture. Four braid architectures (braid pattern – diamond (1/1) and regular (2/2); braid angle – 35° and 45°) have been studied.
In general, the 2/2 braided CFRP tubes exhibited ~15%-20% higher shear strength and ~25%-30% higher shear modulus than 1/1 braids. With regards to the effect of braid angle; for a given braid pattern, the 45° braided CFRPs have slightly higher shear moduli and a lower shear strength than the 35° braids. Under the applied torque (shear stress), one set of the braid tows is approximately in a state of axial tension (AT) and transverse compression, whereas the other set in axial compression (AC) and transverse tension. X-ray CT results show that for the 1/1-45° braided CFRP tubes, damage initiates in the form of intra-tow cracks in the -45° AC tows and circumferential inter-tow debonding between ±45° braid tows, followed by out-of-plane fibre micro-buckling and kink-band formation in the -45° AC tows at crimped tow cross-over points. By contrast, for the 2/2-45° braided CFRP tube, damage initiates from the radial inter-tow debonds between adjacent -45° AC tows. Nevertheless, the subsequent damage sequence resembles that for the 1/1-45° braided CFRP tube. However, it is noteworthy that the shear strength for the 2/2 braided CFRP tubes drops much more significantly beyond the peak stress than the 1/1 braids. This is related to the buckling of -45° AC tows together with the sudden propagation of circumferential inter-tow debonding along vertical zones. This gives rise to a lower remnant strength than that of 1/1 braids once damage has initiated and also highlights the importance of tow cross-overs in constraining large-scale inter-tow debonding.
Moreover, the effect of a pair of open-holes (having a diameter one fifth of the inner diameter of the tube) diametrically opposite one another on the torsional behaviour has been assessed for the 1/1-45° braided tubes. The shear stiffness and the shear strength have been degraded by ~11% and 17%, respectively. The variation of strain distribution has been monitored by stereo digital image correlation, but also the local damage evolution around the holes has been tracked by X-ray CT. Compared with the unnotched structure, new damage modes, in-plane fibre micro-buckling in the -45° AC tows and radial inter-tow debonding between ±45° braid tows, have occurred local to the hole.
In summary, the tow cross-over density and the level of tow crimp are important factors to consider for the design of torsion resistant braid structures. For applications that require high shear strength and/or high shear stiffness, 2/2 (regular) braided CFRP tubes are well suited; whereas for applications that require high structural integrity once damage has started to develop, 1/1 (diamond) structures are a better option because the immediate loss of strength is less marked. When introducing holes into such tubes, the tow cross-over regions of the braid structure should ideally be avoided to minimise damage during torsional loading.

13
Declaration
No portion of the work referred to in this thesis has been submitted in support of an
application for another degree or qualification of this or any other university or other
institute of learning.

14
Copyright
i. The author of this thesis (including any appendices and/or schedules to this thesis) owns
certain copyright or related rights in it (the "Copyright") and s/he has given The
University of Manchester certain rights to use such Copyright, including for
administrative purposes.
ii. Copies of this thesis, either in full or in extracts and whether in hard or electronic copy,
may be made only in accordance with the Copyright, Designs and Patents Act 1988 (as
amended) and regulations issued under it or, where appropriate, in accordance with
licensing agreements which the University has from time to time. This page must form
part of any such copies made.
iii. The ownership of certain Copyright, patents, designs, trade marks and other
intellectual property (the "Intellectual Property") and any reproductions of copyright
works in the thesis, for example graphs and tables ("Reproductions"), which may be
described in this thesis, may not be owned by the author and may be owned by third
parties. Such Intellectual Property and Reproductions cannot and must not be made
available for use without the prior written permission of the owner(s) of the relevant
Intellectual Property and/or Reproductions.
iv. Further information on the conditions under which disclosure, publication and
commercialisation of this thesis, the Copyright and any Intellectual Property and/or
Reproductions described in it may take place is available in the University IP Policy (see
http://documents.manchester.ac.uk/display.aspx?DocID=24420), in any relevant Thesis
restriction declarations deposited in the University Library, The University Library’s
regulations (see https://www.library.manchester.ac.uk/about/regulations/) and in The
University’s policy on presentation of Theses.

15
Scientific contributions
The main findings from this project have been prepared into manuscripts for publication
in peer-review journals. To date, Chapter 5 and Chapter 7 have been published in
Composites Science and Technology; Chapter 6 is ready for submission. In addition,
outputs from some collaborative projects and attended conferences during this PhD study
are also listed below.
1. Chai, Y., Wang, Y., Yousaf, Z., Vo, N. T., Lowe, T., Potluri, P., & Withers, P. J. (2020).
Damage evolution in braided composite tubes under torsion studied by in-situ X-ray computed
tomography. Composites Science and Technology, 188, 107976.
2. Chai, Y., Wang, Y., Yousaf, Z., Storm, Z., Vo, N. T., Wanelik, Kaz., Burnett, T. L., Potluri,
P., & Withers, P. J. (2020). Following the effect of braid architecture on performance and
damage of carbon fibre/epoxy composite tubes during torsional straining. Composites Science
and Technology, 200, 108451.
3. Chai, Y., Wang, Y., Yousaf, Z., Wang, Y., Potluri, P., & Withers, P. J. (2020). Effect of open-
holes on the torsional performance of braided CFRP tubes. Composites Part B: Engineering
(In preparation).
4. Chai, Y., Wang, Y., Potluri, P. & Withers, P.J., 4D Imaging Revealing the Secrets Behind
Failure of Composites (poster). STEM for BRITAIN, March. 3, 2020, London, UK.
5. Wang, Y., Chai, Y., Soutis, C., & Withers, P. J. (2019). Evolution of kink bands in a notched
unidirectional carbon fibre-epoxy composite under four-point bending. Composites Science
and Technology, 172, 143-152.
6. Chai, Y., Wang, Y., Yousaf, Z., Potluri, P., & Withers, P. J., Damage Mechanisms in Braided
Composite Tubes Under Torsion, ‘Silk Road’ University Alliance – Aerospace Education
Forum, July. 24-25, 2019, Manchester, UK
7. Godinho, J. R., Ma, L., Chai, Y., Storm, M., & Burnett, T. L. (2019). Mineral Precipitation
in Fractures and Nanopores within Shale Imaged Using Time-Lapse X-ray Tomography.
Minerals, 9(8), 480.
8. Min, S., Chai, Y., Chu, Y., & Chen, X. (2019). Effect of Panel Construction on the Ballistic
Performance of Multiply 3D through-the-Thickness Angle-Interlock Fabric Reinforced
Composites. Polymers, 11(2), 198.
9. Chai, Y., Wang, Y., Yousaf, Z., Vo, N.T., Lowe, T., Potluri, P. & Withers, P.J., Damage
Evolution in CFRP Tubes Under Torsion Studied by in-situ X-ray Computed Tomography,
18th European Conference on Composite Materials, June. 24-28, 2018, Athens, Greece.
10. Wang, Y., Burnett, T. L., Chai, Y., Soutis, C., Hogg, P. J., & Withers, P. J. (2017). X-ray
computed tomography study of kink bands in unidirectional composites. Composite
Structures, 160, 917-924.

16
Acknowledgements
My PhD journey has had many ups and downs and a page doesn’t seem like enough to
recognise everyone who has supported and encouraged me. I have already begun to miss
you even though I have not left yet. I would like to express my special gratitude to the
following people who are the ‘Giants’ that allow me to see further, not only for scientific
exploring, but also for life experiences.
Prof. Philip J. Withers, a dreamlike supervisor to me, thank you for your enthusiastic
encouragement, patience and endless support. Thanks for guiding me to be a qualified
researcher – I am truly grateful for those scientific writing comments and presentation
strategies. I have gained hugely from our discussions at 7 am and 6 pm.
I would also like to thank my co-supervisor, Prof. Prasad Potluri for your kind help and
teaching throughout my PhD study. Your professional knowledge and complete attention
definitely guided my project to the next level.
I would like to give thanks to the staff and colleagues in the Northwest Composites Centre
who provided huge support throughout the project – Prof. Costas Soutis, Zeshan Yousaf,
Stuart Morse, Chrisopher Cowan, Gary, Mark and Tianyao Liu.
I am so fortunate to have all my friends, tutors and colleagues at the Henry Moseley X-
ray Imaging Facility – Julia Behnsen, Timothy Burnett, Chakri Gudla, Parmesh Gajjar,
Tristan Lowe, Sam Mcdonald, Dan Sykes, Anuj Prajapati and Wen Zhang. Thank you for
sharing your invaluable knowledge and amusing anecdotes with me.
Many thanks to my synchrotron beamtime experiment ‘comrades’ – Luke Rollings, Yi
Zhou, Malte Storm, Kaz Wanelik, Nghia Vo, Ed Williamson-Brown and David Beales –
who spent many days and nights working hard until my experiments succeeded.
The last and deepest appreciation goes to my wife and my parents. Your selfless support,
patience, encouragement and love protected me from getting lost in the ‘dark’ times. I am
extremely lucky to have you all in my life.

17
“Once you know what failure feels like, determination chases success.”
In memory of Kobe Bryant

Chapter 1 Introduction
18
1. Introduction
1.1 Background
Braiding is an ancient textile process to produce preforms/fabrics that have been used for
centuries in appliances such as hoses, ropes, and cable external shells 1. This distinctive
preforming technique has been used to manufacture the fibre reinforcement for fibre
reinforced polymers (FRPs) for decades 2. In recent years, the braiding technique has been
developed significantly from manual to automatic, from two dimensions (2D) to three
dimensions (3D), and from simple to complex structures. Applications of braided
composites can be increasingly seen in many industries, such as sport (e.g. golf clubs),
transport (e.g. battery separators), aerospace (e.g. rocket nozzles) and medicine (e.g.
prosthetic joints) 3.
The braiding technique is ideal for the manufacturing of tubular/hollow shaped
composites, due to the inherent fibre continuity at the edges and the interlaced fibre
architecture 4. These advantages have broadened the application of braided composites
from accessory or decorative uses to load-bearing structures, such as helicopter rotor spars,
driving shafts and artificial limbs. Owing to this, the demands for reliable mechanical
performance have become higher than ever. Therefore, a comprehensive understanding
of the relationship between the braid structure and the mechanical behaviour of braided
composite tubes is critical. A number of studies 5 have been reported the performance of
braided composites under different loading conditions, such as tension 6, 7, compression
5, shear and impact 8, 9. In general, the braid angle, crimp value and braid pattern are
recognised as the dominating parameters controlling the mechanical performance of
braided composite tubes. However, very little is known about the torsional damage
mechanisms of braided composite tubes.
Damage characterisation of composite materials has always been challenging due to the
complexity of the microstructure. In previous experimental studies to investigate the
damage mechanisms of braided composites, mostly 2D techniques were employed, such
as optical or electron microscopy or X-ray radiography 7, 10, 11. In the past decades, many
advanced techniques have been developed, such as focused ion beam scanning electron
microscopy, stereo digital image correlation (DIC), and X-ray computed tomography
(CT), which can all help to perform failure analysis in 3D.

Chapter 1 Introduction
19
X-ray CT has proven to be an excellent non-destructive tool that has attracted great
attention in the field of composites science, making progress in 3D qualitative and
quantitative analysis 12. Furthermore, with the aid of in-situ loading equipment, four
dimensional (4D - 3D + time) time-lapse visualisation becomes feasible, which allows us
to monitor the material degradation while the loading is applied. Beyond doubt, time-
lapse X-ray CT will push our understanding of the degradation of composite materials to
the next level. In recent years, the in-situ time-lapse X-ray CT characterisation approach
has been successfully used to study in textile composites under tension 13 and compression
14. For braided composites, X-ray CT has been successfully applied to assess the braid
structure and manufacturing defects in composite tubes 15. However, correlating the braid
structure with damage mechanisms using time-lapse X-ray CT is still unprecedented,
partly due to the complexity of loading condition and partly due to the complexity of the
damage modes.
1.2 Aims and objectives
This PhD project aims to bridge the gap of knowledge between the overall mechanical
performance and the micro-damage mechanisms of braided carbon fibre reinforced
polymer (CFRP) tubes subjected to torsional loading, especially to further the
understanding of damage evolution mechanisms in 4D. Furthermore, the observed
damage mechanisms are correlated with the braid structures to understand the controlling
factors in damage development under torsion. The outputs are expected to guide the future
design of torsional resistant braided composites and to serve as an experimental reference
for relevant modelling work.
To achieve this, the specific objectives are defined as follows,
To characterise the mechanical performance of braided CFRP tubes under pure
torsion;
To develop an in-situ experimental testing and analysis strategy for the real-time
monitoring of damage evolution in braided CFRP tubes under pure torsion;

Chapter 1 Introduction
20
To identify the damage modes associated with the torsional failure of braided
CFRP tubes, and to understand the damage initiation and propagation mechanisms
by time-lapse synchrotron X-ray CT;
To investigate the effect of braid architecture (braid angle and braid pattern) on
the torsional performance and damage development in braided CFRP tubes;
To investigate the effect of circular notch (open-hole) on the torsional behaviour
of braided CFRP tubes.
1.3 Thesis layout
The contents of this thesis are arranged as follows:
Chapter 2 presents a literature survey of various aspects of braided composites, including
the braid fibre architecture, the mechanical performance and the associated damage
mechanisms.
Chapter 3 reviews the commonly used destructive and non-destructive techniques for
damage characterisation of textile composites, with a special focus on X-ray CT. The
basic principles, different modes of time-lapse X-ray imaging approaches and the
advantages and challenges of X-ray CT in the application to textile composites have been
discussed.
The materials and experimental methods used in this project are summarised in Chapter
4, which cover the design of samples, mechanical testing, X-ray CT imaging strategy,
image processing and image-based quantitative analysis.
Chapter 5-7 present three paper manuscripts as follows:
Chapter 5 presents the in-situ X-ray CT study of 45° diamond (namely 1/1-45°) braided
CFRP tubes under torsion. The damage mechanisms of 1/1-45° braided composite tubes
under torsion have been proposed based on the time-sequence of X-ray CT images.
In Chapter 6, the effect of open-holes on the torsional performance of 1/1-45° braided
CFRP tubes has been investigated by stereo digital image correlation and in-situ X-ray
CT. The mechanical properties and damage mechanisms have been compared with
previous ones on un-notched samples presented in Chapter 5.

Chapter 1 Introduction
21
Chapter 7 shows a study on the damage evolution of braided CFRP tubes having different
braid architectures, including diamond (1/1-35° and 1/1-45°) and regular pattern (2/2-35°
and 2/2-45°), under torsion. The effect of braid architecture on the mechanical behaviour
and damage mechanisms under torsion was investigated by in-situ X-ray CT and
correlated with photographs of the specimen surfaces.
Chapter 8 summarises the main conclusions of this project, together with potential topics
for future work.

Chapter 2 Literature review on braided composites and their mechanical behaviour
22
2. Literature review on braided composites
and their mechanical behaviour
In this chapter, the previous literature relating to the topic studied in this project are
reviewed, mainly covering 1) the background and development of braided composites
especially for tubular shaped structures, 2) the mechanical performance and damage
mechanisms of braided composites, and 3) the conventional and novel damage
characterisation techniques used to study textile composites.
2.1 Braided composites
2.1.1 Fibre reinforced composites
Fibre reinforced polymers (FRPs) are termed as a type of material with reinforcing fibres
(either short fibres or continuous long fibres) dispersed in a polymeric matrix material 16.
They utilise the merits of both components: the reinforcing fibres carry most of the load,
while the softer polymer matrix keeps the fibres in place, distributes the load into the
fibres, and protects the fibres against environmental effects. Note that the topic of this
thesis is focused on continuous fibre reinforced polymeric composites, which will be
referred to as FRPs in the rest of the thesis. FRPs feature high specific strength, high
specific stiffness, significant structural weight reduction and corrosion resistance. In the
past few decades, FRPs have rapidly evolved and are increasingly replacing conventional
materials across various industrial sectors, including aeronautics and astronautics
engineering (for instance, see Figure 2.1), automotive engineering, civil engineering and
sports 17.
Figure 2.1 Constituent materials of commercial aircraft Boeing 787 18.

Chapter 2 Literature review on braided composites and their mechanical behaviour
23
Many properties of FRPs are strongly dependent on the fibre architecture, which is
controlled by a series of parameters including the volume fraction, alignment and packing
arrangement of fibres 16. In general, the reinforcing fibres can take the form of either a
stack of unidirectional plies of different orientations or a textile fabric/preform prepared
via textile processes, such as weaving, braiding, knitting or stitching. These two
categories are referred to as unidirectional (UD) laminate composites and textile
composites, respectively.
In textile composites, the undulating of fibre tows/yarns above and under each other is
called crimp. Both the crimp of tows and the resin-pockets at tow cross-over points
contribute to the lower stiffness compared to conventional UD laminate composites.
However, the interlaced structure of textile composite enhances the through-the-thickness
properties and damage tolerance of composites, which are of critical importance for load-
bearing components. Moreover, in industrial practice, the reduction of manufacturing
time and the optimisation of cost-efficiency are always priorities. In this case, textile
composites stand out as the development of textile machinery over centuries has
automated the process in many ways, making textile performing techniques time- and
cost-efficient in producing large volumes of composite components 19 of adequate
mechanical properties.
2.1.2 Braiding and braided performs
Braiding is an ancient textile technique, by which three or more fibre tows are intertwined
diagonally about one axis to produce an integrated structure. Having developed
dramatically from a traditional manual process, modern braiding has evolved into a
readily industrialised process with highly automated machinery to manufacture near net
shape continuous FRPs at a high deposition rate. The first braiding machine patent was
issued in 1748 in Manchester, UK 1.
Braids or braided composites can be generally categorised, according to their geometry,
into two-dimensional (2D) and three-dimensional (3D) braids/braided composites. For
2D braids, the tow interlacement is within a certain plane; while 3D braids are
characterised by through-the-thickness or inter-ply tow interlacement. Although 3D
braids are advantageous over 2D braids for thick composites due to the enhanced through-
the-thickness reinforcement, the expensive 3D braiding machinery makes 2D braids

Chapter 2 Literature review on braided composites and their mechanical behaviour
24
competitive candidates, even better candidates in certain cases, for many industrial
applications employing relatively thin braided structures 20. As reported by Jackson 21,
the cost is reduced by 10% when replacing the 3D braided components with 2D braided
components.
Braids or braided composites are characterised by their repeating pattern and the smallest
repeating element of the pattern is often called the repeating unit cell (RUC). As shown
in Figure 2.2, 2D braids have three commonly used patterns, including 1) the diamond
braid, in which the tows are interlaced one-over-one (1/1); 2) the regular braid, in which
the tows are interlaced two-over-two (2/2); and 3) the Hercules braid that has the three-
over-three (3/3) interlacement pattern. In addition to the two sets of braid tows which are
diagonally interlaced, namely bias tows, fibre tows that are aligned with the principle axis
(the take-up axis) of the braid, namely axial tows, can also form part of the braid patterns
(see Figure 2.3). The 2D braids that have only bias tows are named biaxial 2D braids,
whereas those that also have axial tows are named triaxial 2D braids.
Figure 2.2 Typical 2D braid patterns.
Figure 2.3 Schematics of biaxial and triaxial braids.

Chapter 2 Literature review on braided composites and their mechanical behaviour
25
2D braided preforms can be either flat or tubular. For tubular 2D braids, a mandrel is
often required for the deposition of the tows. Tubular 2D braids can have various shapes
of cross-sections (e.g. circular, elliptical and rectangular), depending on the application
requirement and the shape of the mandrel. Figure 2.4 shows a classic braiding machine
for the fabrication of 2D braids. During the manufacture of a tubular biaxial 2D braid, the
fibre tows traverse each other in opposite directions around the take-up axis (along the
direction of mandrel movement and the principle axis of the braid), with half of the bobbin
carriers moving in the clockwise direction and the rest moving in the anti-clockwise
direction. Meanwhile, a mandrel moves along the take-up axis at a pre-set speed.
Moreover, different types of 2D braids can be made by imposing some modifications on
the braiding system. For example, stationary tows can be introduced along the mandrel
take-up direction to form triaxial 2D braids that provide more support in the axial
direction. Also, if an unclosed carrier movement track has been arranged (the track is
always closed for tubular braids, see Figure 2.5), the bobbin carriers will reverse into the
opposite direction at the end of the track, thus giving rise to a flat 2D braid. For practical
applications, multi-layer braids are quite popular in order to meet the geometric (thickness)
and mechanical requirements of the final parts. This can be achieved by moving the
mandrel back and forth during the braiding process or repeating the one-direction
movement multiple times.
Figure 2.4 A 48-carrier braiding machine at The University of Manchester (Herzog
GmbH & Co. KG).

Chapter 2 Literature review on braided composites and their mechanical behaviour
26
Figure 2.5 Schematic diagram showing the carrier moving route for (a) tubular 2D braids
(b) flat 2D braids.
In the braiding process, two main processing parameters control the fibre architecture of
the manufactured braided preforms: the overall rotation speed of the braiding platform
(ring) and the translation speed of the mandrel 22. Other parameters, such as the size and
number of the fibre tows and the size of the mandrel, are also of importance. The braided
preforms are often assessed by the following three geometrical parameters:
1) Braid angle (θ) - the angle of the bias braid tows relative to the principal axis of the
braid (along the take-up direction), see Figure 2.3. This parameter highlights the principal
difference between a braid and a woven structure, in that the bias braid tows are at an
angle to the fabric production direction, whereas the warp/weft woven tows are
parallel/perpendicular to the fabric production direction 23. Essentially, the braid angle
can range between 5° to 85° 24. However, insufficient locking occurs when θ < 20° and
excessive fibre damage occurs when θ > 70° 25. It is a critical factor of braids or braided
composites that predominantly influences their mechanical behaviour 25. This will be
further discussed in Section 2.2.2.
2) Crimp angle (Φc) - representing the extent of fibre tow undulation (waviness) over the
thickness of the braid preform. The crimp angle is measured in sections parallel to the
braid tows as shown in Figure 2.6. Crimp angle is one of the key factors for textile
composites, as crimp is inevitable due to the interlaced structure of textile preforms. For
braids, higher crimp represents improved fabric stability and higher resistance to
shearing/distortion 24, 26. However, higher crimp means larger tow waviness, resulting in
stiffness degradation and susceptibility to compressive failure 27, 28.

Chapter 2 Literature review on braided composites and their mechanical behaviour
27
Figure 2.6 Schematic diagram illustrating the measurement of the crimp angle (Φc).
3) Cover factor (CF) - also known as the tightness of a braid, describes the ratio of the
area covered by braid tows to the total area of the mandrel surface 1. For a braid, a larger
cover factor means lower permeability during resin impregnation 29. In general, the
mechanical properties decrease with decreasing cover factor 30. For instance, a reduction
of 7% in cover factor (from 100% to 93%) leads to 6-8% reduction in the Young’s
modulus of 2/2-45° biaxial braided CFRP plates.
2.1.3 Manufacturing of braided composites
Similar to other textile composites (i.e. woven), there are a variety of manufacturing
methods for braided composites depending on the approach to impregnate the
reinforcement (braid preform/fabric) with the matrix system (resin). A number of
constituent materials can be used depending on the needs of the final parts, such as the
desired mechanical properties, the recyclability and the working environment. Carbon,
glass, aramid and ceramic fibres are commonly used to fabricate the reinforcement. Both
thermoplastic and thermosetting resin can be employed as the matrix. Nevertheless, for
braided composites thermosets are often preferable due to their low viscosity, which
allows easier fibre impregnation. In this project, a carbon fibre/epoxy resin (thermoset)
composite system is chosen as the material to study.
2.1.3.1 Manufacturing of braided composite tubes
The most commonly used manufacturing method for braided composite tubes is to
prepare the dry tubular braid preform first, followed by a conventional resin impregnation
process, such as resin transfer moulding (RTM) or vacuum assisted resin infusion
(VARI). The simplified workflow is illustrated by the route following the green arrows
in Figure 2.7. The dry preform is braided over a designated mandrel that has been treated
with release agent. Then the preform-covered mandrel is removed from the braiding
machine and moved into a sealed mould for resin impregnation. In some cases, vacuum
or high-temperature environment during the resin impregnation is necessary in order to

Chapter 2 Literature review on braided composites and their mechanical behaviour
28
obtain high-quality parts. Afterwards, the final parts can be removed from the mould and
the mandrel after the consolidation (curing) process. This method is employed for
manufacturing the composite tubes used in this project and the details will be presented
in latter sections.
Figure 2.7 Two typical manufacturing routes of braided composites.
Compared with resin impregnation after the braids are preformed, a more convenient
approach involves the use of pre-impregnated fibre tows (pre-pregs). In this approach, the
fibre tows have been impregnated with partially cured resin before the braiding process,
which usually enables better impregnation (see the route following blue arrows in Figure
2.7). However, in practice, the machine settings need to be carefully adjusted to adapt to
the increased surface tackiness 24.
Using the braiding technique to produce tubular composites has advantages including
automated processing, high productivity, low material waste and improved damage
tolerance of the composite 20. However, there are still several limitations, such as the
limited component size, which is restricted by the braiding machine, and the limited ratio
between maximum and minimum diameter of the component that the braid structure can
accommodate 25.
2.1.3.2 Competing techniques for the manufacture of composite tubes
Apart from braiding, there are several competing methods to manufacture tubular or
hollow-shaped FRPs, which includes, but is not limited to, filament winding, ‘roll
wrapping’ and pultrusion.
Filament winding is one of the major techniques for the manufacture of composite tubes.
It is an automated process and its products are widely used in many applications such as
pressure tanks, bicycle frames, etc. Wet (impregnated) fibre tows are commonly used for
the winding process, achieved either by setting up a resin bath before the winding sector

Chapter 2 Literature review on braided composites and their mechanical behaviour
29
or using tow pre-pregs. In the winding process, the tensioned fibre tows are wound onto
a rotating mandrel while being translated back and forth parallel to the rotating axis of
mandrel. Filament winding is not only a cost-optimal method, but also it is very flexible
in terms of tailoring the fibre orientation, e.g. axial winding, hoop winding, helical
winding and multi-circuit winding 31. Compared with braided composite tubes, the
filament-wound composite tubes have better performance along the hoop direction, but
they are poor in toughness and fatigue performance due to the absence of tow
interlacement that could act to arrest damage propagation and constrain damage locally.
Cracks tend to propagate easily along the fibres in the filament-wound tubes 22. Moreover,
filament winding is not appropriate to fabricate asymmetric components since it is very
challenging to ensure the tensioned fibre tows follow the geodesic path 32.
Roll wrapping (also known as tube rolling ) is another common method to produce
composite cylinder tubes such as golf clubs 31. Similar to filament winding, the tubular
composites are fabricated by wrapping fibres around the mandrel, but the fibres are often
in the form of dry or wet fabrics instead of fibre tows. Fabrics of different fibre
orientations are firstly cut into designated dimensions, depending on the circumference
of the mandrel and the number of layers, followed by being sequentially wrapped onto
the mandrel along the hoop direction to obtain a pre-determined lay-up sequence. Roll-
wrapping is essentially manufacturing laminate composites on a curved mould, which
does not require advanced textile machinery and makes it more accessible. However, the
obvious drawback lies in the discontinuity in fibre reinforcement and potential defects
such as gaps or overlaps.
Another cost-efficient and high-production approach in industry to produce composite
tubes with constant cross-section is known as pultrusion 33. Compared with the
aforementioned methods that often employ separated/independent/off-line curing
processes, the advantage of pultrusion is that the resin curing cycle starts immediately
after the wet fibres have been pulled into a tubular shape within an inline heated die. The
combined shaping and curing process shortens the production time, but also provokes
issues such as inconsistent resin impregnation/sag of fibre tows if the tension condition is
not well controlled 34. This also gives rise to the fact that low-viscosity resins are
predominantly used in pultrusion, especially polyester resin (vinyl-ester and epoxy resin
are also used in some occasions). With regards to the mechanical performance, the

Chapter 2 Literature review on braided composites and their mechanical behaviour
30
composite tubes made by pultrusion are usually UD (along the tube longer axis), which
means they are strong in the axial direction but weak in the transverse direction 16.
2.1.4 Applications of braided composites
Braided composites are extensively used in many fields, not only because they have all
the advantages of FRPs, such as corrosion resistance, high specific strength and stiffness,
but also because that they can be made near-net shape with fibre continuity at edges (or
even around holes) 4. Using the braiding technique to manufacture composites can be
dated back to the 1960s, when high-temperature metallic alloys were successfully
replaced by carbon-carbon braided composites to manufacture rocket nozzles, which led
to a 30-50% weight saving 35.
Tubular rotor spars of helicopters were an early application of FRPs manufactured by a
braiding approach developed by the US Army and Kaman Aerospace Corporation 36. The
Kevlar fibres were braided onto a tubular (aluminium) mandrel with a regular pattern
(2/2), followed by impregnation with epoxy resin and autoclave curing process. The
braided composite spars prove to be able to not only constrain more ballistic damage than
filament wound structures because of their interlaced structure, but also give rise to a third
reduction in cost. Similar design is also in use today; braided composite spars are
considered good candidates for the winglet design of aircrafts by AIRBUS 37. Moreover,
braided composites have seen wide interest in the aero-engineering sectors as described
in various development plans of astronautic materials, such as the NASA Advanced
Composites Technology (ACT) program 2 and the Boeing Advanced Technology
Composite Aircraft Structures (ATCAS) 38. Apart from the aforementioned rotor spars
and winglet, braided composites are being explored for a variety of complex components
(see Figure 2.8) like fan blade containment cases, wings, fuselage, trailing arms, etc., for
which the manufacturing period and cost can both be reduced by the braiding technique,
alongside the improvement in mechanical properties. For example, a braided fan blade
containment case (see Figure 2.8(a)) was developed by NASA Glenn centre and A&P
technology in the 1990s 39. The carbon fibre T-700/epoxy fan case was manufactured
using a triaxial braided structure in order to withstand the impact from failed fan blades.
The impact-resistance and structural integrity were validated and nearly 40% weight
saving was achieved. Moreover, braided composite tubes have been recently used in the

Chapter 2 Literature review on braided composites and their mechanical behaviour
31
frames of drones to further reduce the weight and increase the flying distance, as shown
in Figure 2.8(c).
Figure 2.8 (a) Jet engine overview (left) and 2D triaxial carbon fibre braided composite
fan case fabricated by A&P Technology 1, 39. (b) Braided composite trailing arm of a
helicopter 40. (c) Drone frame by Dji 41.
In addition to aero-engineering applications, braided composites have also been widely
used in many other fields such as medical, sporting, marine and transporting industries 1.
The interlaced structure of braided composite provides high resistance to micro-crack
propagation and delamination 42, and therefore makes it suitable for parts that require
fatigue resistance and damage tolerance. Common applications include pressure vessels
(for natural gas and hydrogen storage ) 43, 44, artificial limbs 3, hockey sticks 45 and wheels
for motorcycles 46. In the automotive industry, braided composites are gaining popularity
to replace traditional materials in the manufacture of drive shaft, rockers, window frames,
A pillars (see Figure 2.9(a)) and wheels (see Figure 2.9(b)). Similar frame design in
automotives has also been applied to light-weight bicycles. Figure 2.9(c) shows a carbon
fibre braided body frame of a bicycle made in Germany. It is worthy to note that
significant weight reduction of the whole bicycle down to 5 kg has been achieved
alongside remarkable structural integrity 47.

Chapter 2 Literature review on braided composites and their mechanical behaviour
32
Figure 2.9 Applications of braided composites, (a) A-pillar frame of BMW 7-Series, (b)
wheels of motorbike 46 and (c) bicycle frame by BlackBraid 47.
2.2 Mechanical performance of braided composites
2.2.1 Effect of tow crimp/waviness
During the 1990s, many experimental studies were published concerning the mechanical
performance of braided composites compared with that of the equivalent conventional
laminated composites (having the same reinforcing directions as the braid) 48-52, in order
to assess the effect of tow crimp/waviness on the mechanical properties of composites. In
general, crimp introduces a knockdown effect on the tensile properties of braided
composites. For instance, when comparing the Young’s modulus of five-ply 2/2-30°
biaxial braided carbon fibre/epoxy plates to that of the equivalenet laminated composite
plates, it was found that the stiffness is reduced by ~20%, owing to the crimp of the
braided fibre tows 5.
The knockdown effect of tow crimp on the compressive properties is even more severe,
due to the sensitivity of compressive failure of FRPs to fibre/tow waviness 27, 28. As shown

Chapter 2 Literature review on braided composites and their mechanical behaviour
33
in Figure 2.10, Charlebois et al. 53 reported that the compressive strength of four-layer 1/1
braided glass fibre/epoxy composite plates can be as low as 44% of that of the equivalent
laminates. The larger difference in compressive strength between braided plates and
equivalent laminates at the braid angle of 35°, could be because the stress concentrations
induced by the crimp may be more important along the fibre direction.
Figure 2.10 Compressive strength of four-layer 1/1 braided glass fibre/epoxy composite
plates as a function of braid angle in comparison to that of the equivalent laminates 53.
2.2.2 Effect of braid architecture
Braid angle
The braid angle is critical to the mechanical performance of biaxial braided composites.
Cichosz et al. 5 reported that for five-layer 2/2-30° biaxial braided CFRP plates, a
deviation of 1.5° in braid angle gives rise to a scatter of 20% in the Young’s modulus and
15% in the tensile strength. In general, the tensile properties of braided composites tend
to decrease as the braid angle increases. Melenka and Carey 54 reported that the tensile
strength and Young’s modulus decrease with increasing braid angle for both single-layer
1/1 and 2/2 braided Kevlar fibre/epoxy composite tubes with braid angles of 35°, 45° and
55°. The same trend has also been reported by Harte and Fleck 55 for 2/2 braided glass
fibre/epoxy composite tubes, having braid angles of 23°, 40°, 45° and 55°. The dominant
failure modes were fibre fracture and neck propogation (see Figure 2.11).

Chapter 2 Literature review on braided composites and their mechanical behaviour
34
Figure 2.11 Video images of neck propagation in a single-layer 2/2 braided glass
fibre/epoxy composite tube with a braid angle of 55° under tension 55.
Harte and Fleck 56 also found that, for compression, the compressive strength tends to
decrease as the braid angle increases, same as that under tension. The controlling damage
mechanisms were fibre micro-buckling and diamond-shaped buckling. Figure 2.12
illustrates the typical failures of the two modes. However, Charlebois et al. 53 found that
the compressive strength of four-layer 1/1 braided glass fibre/epoxy composite plates was
nearly constant despite changing the braid angle (35°, 45° and 50°) (see Figure 2.10).
Figure 2.12 Photographs of single-layer 2/2 braided glass fibre/epoxy composite tubes
failed under compression, showig (a) a tube with a braid angle of 23° failed by fibre micro-
buckling and (b) a tube with a braid angle of 40° failed by diamond shaped buckling 56.

Chapter 2 Literature review on braided composites and their mechanical behaviour
35
With regards to the torsional/shear properties, the effect of braid angle is more complex.
Potluri et al. 57 performed a series of torsion tests on single-layer 1/1 braided glass
fibre/epoxy composite tubes with braid angles of 31°, 45° and 60°. It was found that the
shear modulus and shear strength of the braided composites decrease with increasing
braid angle, which was attributed to the difference in fibre volume fraction and the
sensitivity to tube diameter variation in the used testing configuration. In contrast to that
in 1/1 braids, Harte and Fleck 56 reported that the shear strength of braided composites
increase with increasing braid angle in single-layer 2/2 braided glass fibre/epoxy
composite tubes, with braid angles of 23°, 40° and 55°, subjected to torsion. Moreover,
Melenka and Carey 54 reported that there is no distinct trend for the effect of braid angle
on the torsional/shear properties across different single-layer braided Kevlar fibre/epoxy
composite tubes (braid pattern – 1/1 and 2/2; braid angle – 35°, 45° and 55°). With regards
to braided CFRP tubes, the torsional/shear properties of CFRP tubes of different braid
architectures haven’t yet been reported in literature and neither the damage mechanisms.
Braid pattern
Compared to the effect of braid angle, perhaps surprisingly, very little is known about the
effect of braid pattern on the mechancial properties of biaxial braided composites. As
mentioned above, Melenka and Carey 54 performed a series of tension and torsion tests of
single-layer 1/1 and 2/2 braided Kevlar fibre/epoxy composite tubes with braid angles of
35°, 45° and 55°. Figure 2.13 and Figure 2.14 summarise the tensile and shear properties
of the tested braided tubes. It can be seen that, in general, for a given braid angle, 2/2
structures have higher stiffness and strength than 1/1 structures.

Chapter 2 Literature review on braided composites and their mechanical behaviour
36
Figure 2.13 (a) Tensile moduli and (b) tensile strength of single-layer 1/1 and 2/2 braided
Kevlar fibre/epoxy composite tubes with braid angles of 35°, 45° and 55° 54.
Figure 2.14 (a) Shear moduli and (b) shear strength of single-layer 1/1 and 2/2 braided
Kevlar fibre/epoxy composite tubes with braid angles of 35°, 45° and 55° 54.

Chapter 2 Literature review on braided composites and their mechanical behaviour
37
2.2.3 Effect of open-hole
Compared with laminated composites, textile composites are considered to be better
candidates to accommodate holes or cut-outs, as they exhibit higher resistance to large-
scale matrix cracking, debonding and delamination due to the cross-over (interlacement)
of fibre tows that act to arrest crack propagation, thus giving rise to less reduction in
strength. For instance, Liang et al. 58 reported that drilling a hole degrades the tensile
strength of the 3D braided CFRPs of a braid angle of ±12° by 21-26%, whereas for a
CRRP laminate of similar un-notched tensile strength as the un-notched 3D braided CFRP,
the notch induced strength degradation can be as much as 42%.
The majority of the investigations 59-61 are focused on the effect of open-hole on the tensile
performance of braided panels. Hwan et al. 59 studied the open-hole tensile behaviour of
four-layer 2/2 braided carbon fibre/epoxy composite panels for three braid angles (16.5°,
18.5° and 23.4° ) and with a variety of hole dimensions (the ratio between the width of the
coupon (w) and the diameter of the hole (d), w/d, ranged from 3 to 9). In general, the
open-hole tensile strength of these 2/2 braided CFRP panels is degraded by 18-56% of
their un-notched tensile strength. It was found that the open-hole tensile strength increases
with increasing w/d and increasing braid angle for the tested range of braid angles. Nakai
et al. 60 and Ohki et al. 61 reported that a drilled hole results in a 35% reduction in the
tensile strength of flat braided glass fibre/epoxy composite panels with a braid angle of
30°. Debonding and fibre fractures were observed as the whitening area developed from
the hole by an optical microscope as shown in Figure 2.15. It was concluded that under
open-hole tension, damage depends on the properties of the interface between braided
fibre tows, as damage tends to initiate with matrix crack from the rim of the hole and
develops into debonding (see Figure 2.16).
Figure 2.15 The propagation of whitening (damaged) area of an open-hole flat braided
1/1-30° GFRP specimen (w = 22 mm and d = 6 mm) observed by an optical microscope
during the tensile test 61.

Chapter 2 Literature review on braided composites and their mechanical behaviour
38
Figure 2.16 Micro-damage in the form of matrix crack developed from the edge of an
open-hole flat braided 1/1-30° GFRP specimen subjected to axial tension 60.
2.2.4 Damage modes in braided composites
For FRPs, damage can be generally categorised into matrix cracking, interfacial failure
and fibre failure. They can occur in different conformations, controlled by the
microstructural features associated with the fibre architecture. The typical micro-damage
modes associated with the failure of braided composites reported in literature are briefly
summarised in this section and are illustrated schematically in Figure 2.17.

Chapter 2 Literature review on braided composites and their mechanical behaviour
39
Figure 2.17 Schematic showing the typical micro-damage modes in braided composites
(adapted from 6).
Intra-tow cracks
Intra-tow cracks are often found to be the incipient damage mode in braided composites
7, 10, 62. Vinot et al. 62 studied the damage accumulation process during the axial tensile
testing of a four-layer 2/2-60° braided carbon fibre/epoxy composite plate by X-ray CT.
As shown in Figure 2.18, damage initiated with intra-tow cracks that lie parallel to the
braided fibre direction in a number of braid tows. This is followed by inter-tow debonding
and eventually fibre/tow fracture that leads to the final failure. In general, the intra-tow
cracks can either take the form of matrix cracking in resin-rich regions or debonding
between individual fibres and the surrounding matrix, which is often not distinguishable
with the resolution of X-ray CT.
Inter-tow debonding
Feature 4 in Figure 2.18 displays inter-tow debonding damage between braid tows. The
inter-tow debonding damage is easier to characterise in the planes lying along braid tows.
As shown in Figure 2.19, an electron micrograph displays the intra-tow crack and inter-
tow debonding in a triaxial 1/1 [0/±45°] braided carbon fibre/epoxy composite plate under
tensile loading.

Chapter 2 Literature review on braided composites and their mechanical behaviour
40
Figure 2.18 2D X-ray CT images showing the damage evolution in a four-layer 2/2-60°
braided CFRP plate under tension, where feature 1 corresponds to a manufacturing defect,
feature 2 and feature 3 intra-tow cracks, feature 4 inter-tow debonding and feature 5
fibre/tow fracture 62.
Figure 2.19 A SEM image showing inter-tow debonding and intra-tow crack in a triaxial
1/1 [0/±45°] braided CFRP plate under tension (adapted from 10).

Chapter 2 Literature review on braided composites and their mechanical behaviour
41
Fibre/tow fracture
Fibre/tow fracture is often associated with the final failure of braided composites. Feature
5 in Figure 2.18 illustrates the fibre/tow fracture in braided composites under tensile
stress. For braided composites, due to the fibre/tow waviness caused by tow cross-overs,
the compressive fracture of fibre/tow is also commonly associated with kink-band
formation. Figure 2.20 shows the SEM images of the fracture surface of an open-hole
1/1-12° braided carbon fibre/epoxy composite plate failed under axial compression 58. It
is evident that the fracture surface shows distinct features of fibre kink bands, in which
the band-boundaries are defined by fibre fractures.
Figure 2.20 Magnified SEM images of the fracture surface of an open-hole 1/1-12°
braided carbon fibre/epoxy composite plate failed under axial compression 58.
Fibre micro-buckling
As reported by Harte and Fleck 56, biaxial braided glass fibre/epoxy composite tubes tend
to fail by fibre micro-buckling under compression or torsion. Fibre micro-buckling is a
dominant damage mode in FRPs, especially UD FRPs, due to compression and shear
induced instability 28, prior to the formation of fibre kink bands. Fibre micro-buckling is
sensitive to initial fibre/tow misalignment or waviness (see Figure 2.21) 63. In braided
composites, the tow crimp is inevitable because of the interlacing structure, which makes
fibre micro-buckling an important damage mode to consider in damage characterisation
of this type of composite.

Chapter 2 Literature review on braided composites and their mechanical behaviour
42
Figure 2.21 Schematic diagram showing fibre micro-buckling (middle) and kink-band
(right) development from initially misaligned fibres (left) 63.
Delamination
Delamination in the context of braided composites refers to the inter-layer delamination
in presence of multiple layers of braided preforms in the composite structure. It is a
common damage mode in multi-layer braided composites subjected to a variety of loading
scenarios, including tension 7, 64, compression 5 , impact 65 and fatigue 66. For instance,
Figure 2.22 displays the delamination damage in a two-layer 2/2-25° braided carbon
fibre/epoxy composite plate after impact testing at the energy of 3J 65. It was found that
the area of delamination increases with the impact energy. Delamination, together with
matrix cracks and inter-tow debonding, acts as a critical energy dissipation mechanism in
braided composites under low-velocity impact.
Figure 2.22 A 2D X-ray CT image showing delamination damage in a two-layer 2/2-25°
braided CFRP plate after low-velocity impact testing at the energy of 3J. The sample was
impacted at the centre of top surface with a 10 mm–diameter flat headed impactor 65.

Chapter 2 Literature review on braided composites and their mechanical behaviour
43
2.3 Chapter summary
This chapter has reviewed the manufacturing, characteristics, performance and
application of braided composites. Braided composites have been considered as
promising candidates for tubular shaped structures and the advantages and disadvantages
of competing tube manufacturing techniques have been discussed.
In addition, an overview of the mechanical behaviour and damage mechanisms of braided
composites (particularly braided composite tubes) has been made. The effects of
geometric parameters of the braid architecture and the notch sensitivity of braided
composites have been discussed. Furthermore, typical damage modes associated with the
failure of braided composites have been introduced, including intra-tow cracks, inter-tow
debonding, fibre/tow fracture, fibre micro-buckling and delamination. As can be seen
from the literature survey, many of the studies on damage mechanisms have been based
on post-mortem or 2D analysis. Moreover, perhaps surprisingly, to date there have been
no reports on the accumulation of damage leading to the torsional failure of braided
composite tubes. Therefore, direct observation of damage accumulation under torsion is
still needed in order to understand the underlying mechanisms, which will ultimately
guide the design of torsion resistant braid structures.

Chapter 3 Literature review on microstructural and damage characterisation of textile composites
44
3. Literature review on microstructural and
damage characterisation of textile composites
Structure-property relationship always plays a key role in the design and optimisation of
materials. This is especially important for fibre reinforced polymers (FRPs) owing to their
inherent complexity as multi-phase materials. There have been continuing efforts on
unravelling the relation between macro/micro-structure and failure behaviour (damage
mechanisms) via both experimental and simulation study. In the last few decades, the
advancement in characterisation techniques has brought the scale of structure/damage
examination from millimetre (mm) to micrometre (μm) level, from two dimensions (2D)
to three dimensions (3D), and from post-mortem to in-situ.
This chapter presents a general review of various characterisation approaches of textile
composites both destructively and non-destructively, with emphasis placed on the latter.
X-ray computed tomography (CT) is detailed as the main characterisation technique
employed for this project.
3.1 Destructive characterisation techniques
The conventional methods to investigate the microstructure and damage of textile
composites often involve sectioning (maybe at several locations) the composite followed
by 2D imaging using optical microscopy (OM) or scanning electron microscopy (SEM),
in order to account for the complex and inhomogeneous microstructure of textile
composites. For example, the crimp angle of braided composites is often measured by
sectioning the braided composite along the planes parallel to the braid tows (see Figure
3.1) and quantifying the off-axis angle of the tows under OM 11. Other applications
include identifying manufacturing defects and measuring the fibre volume fraction 1.
However, the destructive sample preparation process can introduce unexpected
defects/damage.

Chapter 3 Literature review on microstructural and damage characterisation of textile composites
45
Figure 3.1 A typical optical micrograph for measuring the crimp angle of braided tows 11.
In addition to microstructural characterisation, fractography can be performed
destructively, such as the study of damage initiation and development between and within
braided tows 7. Figure 3.2 shows a post-mortem optical micrograph normal to the axial
tows of a four-ply triaxial [0/±60°] braided carbon fibre/epoxy composite plate subjected
to axial tension, where a number of intra-tow matrix cracks have developed in braid tows.
These destructive methods are still very popular today, often used either in
damage/fractography studies or to verify the results obtained from non-destructive
evaluation (NDE). However, there are some intrinsic limitations, such as the subjectivity
in determining the sectioning position and the possibility of introducing more damage
during the sectioning process. Serial-sectioning at multiple locations could provide a
more statistical and comprehensive understanding but is very time-consuming.
Figure 3.2 An optical micrograph showing matrix cracking on a section normal to the 0°
direction in a four-ply triaxial [0/±60°] braided carbon fibre/epoxy composite plate
subjected to axial tension 7.

Chapter 3 Literature review on microstructural and damage characterisation of textile composites
46
3.2 Non-destructive characterisation techniques
NDE is known as a category of evaluation techniques that can examine or test materials
without causing extra damage, and thus facilitates real-time/in-situ studies. It has been
widely used in industrial and scientific fields 67, 68. In the past few decades, with the
development of NDE techniques, more specialised methods have been developed, from
2D to 3D characterisation techniques, and from off-line to on-line testing systems. In
general, the use of NDE in the composite field usually can serve in following areas:
manufacture quality control, health monitoring, damage detection or tracking and so on.
Figure 3.3 summarises the trend for the usage of NDE techniques in composites.
Choosing the appropriate technique from the range is very important from either a time
or cost saving point of view. Factors, such as not only the materials category, properties,
and dimensions, but also equipment compatibility in tough environment, and over a long
period, should be considered. In most cases, one NDE technique could fulfil the purpose,
but two or more techniques could be employed cooperatively to provide more information
69. In this section, two NDE techniques, that are commonly used for strain and damage
monitoring in textile composites 10, will be reviewed briefly. The main NDE imaging
technique used in this thesis, X-ray CT, and its application in textile composites will be
reviewed in Sections 3.3 and 3.4.
Figure 3.3 The number of publications using various NDE techniques to study composite
materials in the past 30 years 70.

Chapter 3 Literature review on microstructural and damage characterisation of textile composites
47
Acoustic emission
Acoustic emission (AE) is one of the classic NDE techniques to study damage modes, as
it can monitor the damage initiation and propagation in-situ under environmental
conditions or external loads. This technique, which was first reported in 1950s and named
as ‘Kaiser-Effect’ after the first person to study it, Joseph Kaiser, measures the acoustic
waves with a pendulum tensile machine, amplifier and oscilloscope 71. His work
identified that acoustic waves can be generated by any irreversible changes of
microstructure. AE can essentially monitor various damage modes such as delamination,
matrix cracks and fibre fractures even before observable damage propagation.
Throughout the damaging process, the acoustic wave is transformed to electric signal
when being received by the AE system. The significant change in the signal diagram can
be correlated with the development of different damage modes. In spite of the works that
verified the feasibility of AE on mechanical study 72-75, scholars realised that better results
can be obtained if AE is accompanied with other NDE techniques at the same time. This
is because it is not straightforward to correlate AE signal with specific damage modes
due to the lack of standardised definition of boundaries. Carvelli 76 used a combination of
NDE techniques to study the damage of textile composite. AE sensors were set for
tracking and recording the acoustic emission during the tensile loading, and digital image
correlation (DIC) equipment was used for monitoring the strain changes accompanied by
a digital camera for local imaging. Results from multiple techniques prove to be more
reliable. A similar study has been done by Lomov et al. 10, in which addition to the on-
line monitoring by AE, X-ray CT and SEM were performed for post-failure study.
In general, AE is a practical real-time technique to evaluate the overall quality of
composite materials. It is advantageous in that defects/damage could be monitored
globally while in-service or during mechanical testing without interrupting the
service/testing condition. However, it has the drawback that it cannot detect damage that
is not propagating. Moreover, the acoustic wave is sensitive to external environmental
change that could cause noise and thus making it challenging to quantify the extent of
damage.

Chapter 3 Literature review on microstructural and damage characterisation of textile composites
48
Digital image correlation
Digital image correlation (DIC) is essentially an image acquisition and analysis approach
to map the surface displacement and strain of an object by analysing an image sequence
of the object surface acquired before and during loading 77. DIC can be used in a 2D
configuration (2D DIC) to measure deformation in-plane, which requires one camera, or
in a stereoscopic configuration (stereo DIC) for full 3D surface deformation
measurement. Figure 3.4 displays the schematic of a typical stereo DIC setup 78, 79. For
stereo DIC, the two cameras are set up to monitor the same field-of-view (FoV) and the
system is calibrated using a known model object so as to be able to also map the out-of-
plane deformation. Stereo DIC is particularly useful for testing 3D shaped specimen, such
as tubular shaped or irregular shaped specimens 80. During image acquisition, factors,
such as camera focal length, working distance, sample illumination and FoV, are critical
in order to obtain reliable results 81.
Figure 3.4 Schematic for a typical stereo DIC setup and workflow.
The image correlation process involves comparing a certain image under load with either
the initial unloaded image or the previous image to identify the movement of distinctive
features/pattern on the surface of the object. The distinctive features can either be
naturally occurred texture or artificially applied pattern. For textile composites, often
black and white speckles are painted/sprayed on the composite surface to obtain a random
yet unique pattern for easy and high-accuracy recognition in computational analysis 10.
Adequate adhesion between the speckled pattern and the object surface enables mapping
the full-field displacement and strain of the object via tracking the pattern. Figure 3.4

Chapter 3 Literature review on microstructural and damage characterisation of textile composites
49
illustrates the image correlation workflow. The images are divided into subset windows
of a certain size (an overlapping ratio between subsets can be defined), which contain a
unique distribution of pixel intensity that make them distinguishable from each other. The
positions of deformed subsets are located computationally by performing cross-
correlation to search for the maximum of the correlation array, thus giving rise to the
displacement field and thereafter the strain field. In the correlation process, factors, such
as the sub-set dimensions and the level of overlap, can affect the resolution and the
accuracy of the measurement 81.
Conventional methods to measure strains (i.e. using strain gauges) either focus on a
localised region or measure an averaged overall strain 26, 82; whereas DIC allows
identifying surface strain concentrations which could be correlated with microstructural
variation and damage development 7. Moreover, DIC is ideal for cases where it is not
feasible to attach strain gauges owing to the incompatible dimensions or the complex
surface topography. However, the accuracy of DIC measurements is closely dependent
on the stability of lighting intensity and camera position, which provokes some challenges
in actual use. DIC has been increasingly used to characterise the strain development in
textile composites, as the inhomogeneous and periodic microstructure of textile
composites tend to give rise to local variation in the strain field 7, 54, 83. Lomov et al. 83
explored the use of DIC measurement to validate the numerical modelling of the tensile
performance of textile composites (e.g. plain-woven and triaxial braided). The periodicity
of the strain field provides direct experimental evidence to be correlated with numerical
results. Moreover, the threshold load level for damage initiation can also be inferred from
the time-resolved strain fields (See Figure 3.5).
Melenka and Carey 54 employed stereo DIC to study the strain development under axial
tension and torsion of biaxial 2D braided CFRP tubes. A variety of braid architectures
were studied braid pattern of 1/1 and 2/2 and braid angle of 35°, 45° and 55°. Figure 3.6
shows the axial strain distribution at maximum tensile stress and the shear strain
distribution at maximum shear stress of samples with different braid architectures. Under
both loading conditions, it is found that the strain behaviour is not uniform and strain
concentrations tend to occur at the tow cross-over points, thus giving rise to periodic strain
patterns in correspondence with the braid pattern. This highlights the importance of tow
cross-overs on strain localisation in braided composites.

Chapter 3 Literature review on microstructural and damage characterisation of textile composites
50
Figure 3.5 DIC measured and numerical model simulated axial strain distribution along
the warp direction (x) of a single-layer plain-woven CFRP plate loaded under axial
tension to 1% and 1.9% applied strain, alongside the DIC axial strain map at 1.9% applied
strain 83.
Figure 3.6 (a) The axial strain fields at maximum tensile stress and (b) the shear strain
fields at maximum shear stress of 2D biaxial braided CFRP tubes of different braid
architectures (braid pattern: 1/1 and 2/2; braid angle: 35°, 45° and 55°), showing localised
strain concentrations following the braid pattern 54.

Chapter 3 Literature review on microstructural and damage characterisation of textile composites
51
3.3 X-ray computed tomography (CT)
X-ray CT is a computer-assisted image based 3D NDE technique developed from X-ray
radiography. It started to be explored as a clinical diagnostic method in the medical field
in the 1970s (Nobel Prize for Physiology or Medicine awarded to Sir Godfrey Newbold
Hounsfield and Allan McLeod Cormack in 1979). The use of this technique in non-
medical research study has appeared since the 1980s 84. The essential mechanism of how
CT works is similar to X-ray radiography, which images the object by utilising the
difference in X-ray attenuation capability of different materials; but the advantage of CT
lies in that 3D information can be obtained by computerised processing of multiple 2D
radiographs of the object from different angles. It is a big step forward on the development
in characterisation techniques, which has allowed people to understand natural or
engineered structures from a new perspective (from 2D to 3D).
Using X-ray CT as a characterisation tool in materials science has gained popularity since
the 21st century, owing to the rapid advancement in image resolution and analysis
efficiency (reconstruction and processing time) 12. Compared with conventional
techniques, X-ray CT provides deep insights into the physics and chemistry of materials
in 3D (structure, defects, degradation and etc.) via qualitative and quantitative analysis,
more importantly without disassembling or damaging the material. To date, the spatial
resolution of X-ray CT can reach sub-30 nm from the nascent 2 mm 85-87, e.g. soft X-ray
CT can achieve ~10 nm 88, 89 and hard X-ray CT ~30 nm. Due to its 3D capability that is
particularly useful for inhomogeneous materials, it has gained significant popularity in
the field of composite materials to characterise the fibre architecture, defects and damage
in textile composites 90, 91.
3.3.1 Basic principles of X-ray CT
The general procedure of conducting X-ray CT is illustrated in Figure 3.7. The object
under investigation is located on a rotating stage. When a penetrating X-ray beam passes
through an object, a projection of the transmitted beam is obtained on the detector. A
series of radiographs/projections will be taken of the object when it is rotated over either
180º or 360º. After being processed mathematically with a reconstruction algorithm, the
2D projections can be reconstructed into a 3D image volume composed of 2D cross-
sections/slice images of the object, and different grey-scale level in the images represents
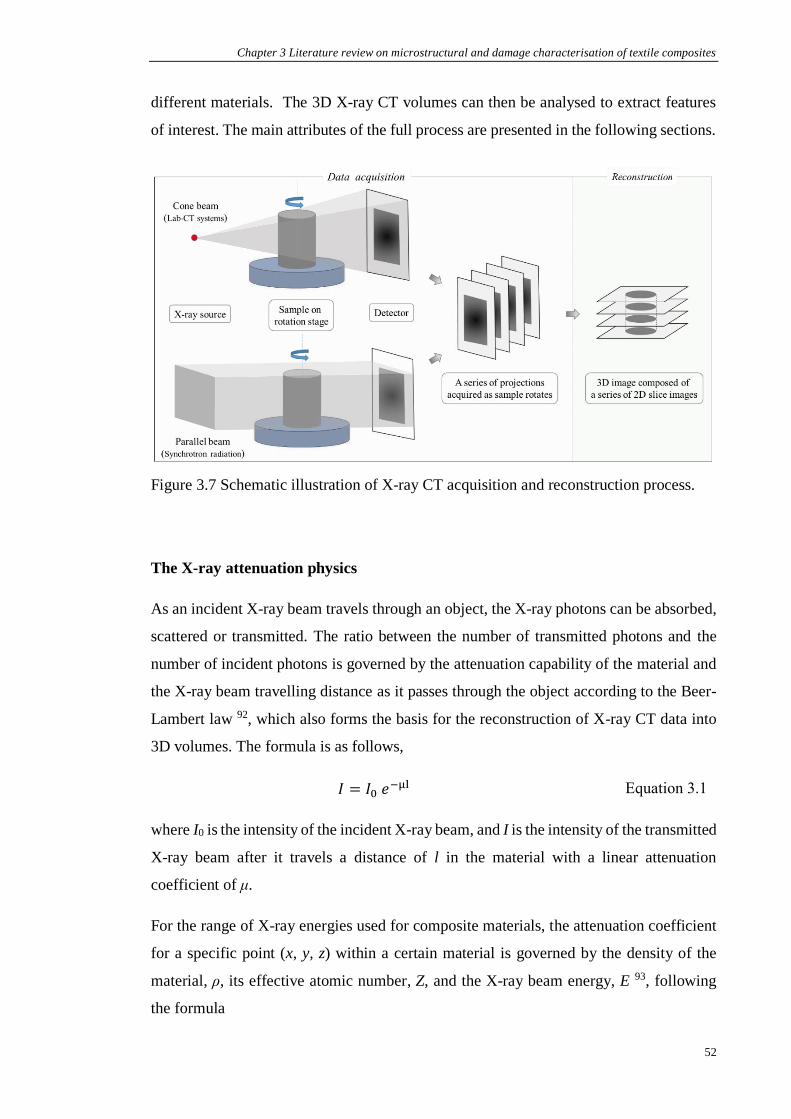
Chapter 3 Literature review on microstructural and damage characterisation of textile composites
52
different materials. The 3D X-ray CT volumes can then be analysed to extract features
of interest. The main attributes of the full process are presented in the following sections.
Figure 3.7 Schematic illustration of X-ray CT acquisition and reconstruction process.
The X-ray attenuation physics
As an incident X-ray beam travels through an object, the X-ray photons can be absorbed,
scattered or transmitted. The ratio between the number of transmitted photons and the
number of incident photons is governed by the attenuation capability of the material and
the X-ray beam travelling distance as it passes through the object according to the Beer-
Lambert law 92, which also forms the basis for the reconstruction of X-ray CT data into
3D volumes. The formula is as follows,
𝐼 = 𝐼0 𝑒−μl Equation 3.1
where I0 is the intensity of the incident X-ray beam, and I is the intensity of the transmitted
X-ray beam after it travels a distance of l in the material with a linear attenuation
coefficient of μ.
For the range of X-ray energies used for composite materials, the attenuation coefficient
for a specific point (x, y, z) within a certain material is governed by the density of the
material, ρ, its effective atomic number, Z, and the X-ray beam energy, E 93, following
the formula

Chapter 3 Literature review on microstructural and damage characterisation of textile composites
53
𝜇(𝑥, 𝑦, 𝑧) = 𝐾𝜌𝑍4
𝐸3 Equation 3.2
where K is a constant. According to the above equation, it can be seen that for CFRPs,
owing to the fact that ρ and Z are similar for carbon fibre and polymers, the attenuation
coefficients of these two constituents are similar. Therefore, the contrast between carbon
fibre and epoxy resin in X-ray CT images is low, which makes it relatively challenging
to distinguish between them. For defects and cracks, they have a much lower attenuation
coefficient than the bulk composite, which makes X- ray CT a promising technique to
examine defects and damage in CFRPs. The challenges in the X-ray imaging of CFRPs
will be further discussed in Section 3.3.3.
Data acquisition
Generally, X-ray CT is either carried out on lab-CT systems or at synchrotron radiation
beamlines. Both approaches have its own advantages and drawbacks and the choice of
usage needs to be determined according to specific requirements. The imaging principles
are the same overall; however, the X-ray sources are very different. As shown in Figure
3.7, lab-CT systems are usually equipped with polychromatic and cone-shaped X-ray
beam, whereas synchrotron X-ray beam is usually monochromatic, parallel and brighter.
These factors will affect the acquisition time and also the image quality (controlled by
resolution, contrast, noise, artefacts, etc.) 94, 95. Table 3.1 compares the main
characteristics of Lab-CT and synchrotron radiation CT. In general, lab-CT systems can
now achieve spatial resolution on the same order of magnitude of synchrotron X-ray CT
12. Also, they are easier to access than synchrotron beamlines and the cone beam geometry
allows for the imaging of large objects. With regards to in-situ experiments, the resolution
on lab systems will be degraded by the relatively large sample-to-source distance in the
presence of the rig, as in the cone beam configuration which relies on geometric
magnification; while using synchrotron X-ray CT the resolution is not affected because
its resolution is independent of the sample-to-source distance. Also, the high flux of
synchrotron beam makes acquisition much faster, which makes it well suited for in-situ
experiments that require fast acquisition as in the case of abrupt failure of composites.
While ex-situ X-ray CT experiments, in which acquisition speed is not an issue, could be
carried out on both systems. The attributes of in-situ and ex-situ X-ray CT experiments
will be detailed in Section 3.3.2.

Chapter 3 Literature review on microstructural and damage characterisation of textile composites
54
Table 3.1 Comparison of the main characteristics between synchrotron and laboratory X-
ray imaging, adapted from 90.
Synchrotron X-ray CT Laboratory X-ray CT
Resolutions form 20 μm to 30 nm. Often small areas illuminated. Sample sizes from 50 mm to 20 μm
Resolutions form 100 μm to 50 nm. Easier to image samples of different sizes. Sample sizes from 300 mm to 50 μm
High flux, high brightness enabling up to 20 tomograms per second – perfect for fast experiments
Acquisitions from minutes to many hours
– well suited to longer timescale
experiments such as progressive failure
over high cycle fatigue Excellent phase contrast, no beam hardening, high signal to noise – ideally suited to low contrast systems, such as carbon fibre composites
Few machines capable of phase contrast. Well suited to glass-fibre composites
Typically appropriate for in-situ experiment. Large source to sample and sample to detector working distances. Sample size limited by the size of parallel beam
The sample needs to be very close to the source to achieve high resolutions making the accommodation of rigs or large objects difficult (ill-suited to in-situ stages)
Image reconstruction
As illustrated in Figure 3.7, once a series of radiographs/projections are acquired, the next
step is to reconstruct a 3D map of X-ray attenuation at each voxel (a pixel in 3D) in the
volume using proper reconstruction algorithms (developed based on the Beer-Lambert
law). The radiographs can be reconstructed using the following classical methods,
depending on the beam geometry: for parallel beams, filtered back projection algorithm
96 and algebraic reconstruction technique 97; for cone beam systems, the Feldkamp-Davis-
Kress algorithm 98. There has been continuous advancement in the reconstruction process,
to reduce the computational cost, to shorten the processing time and to obtain similar
results with fewer projections, with the ultimate goal of simultaneous 3D reconstruction
alongside acquisition.
After reconstruction, the 3D volume will be presented as a stack of 2D cross-sectional
slice grey-scale images or a single 3D volume. In these reconstructed images, typically
the greyscale level at each voxel represents the effective linear attenuation coefficient of
the material at each voxelated position in the scanned volume. Therefore, different
materials/constituents can be differentiated based on the grey-scale levels to some extent.
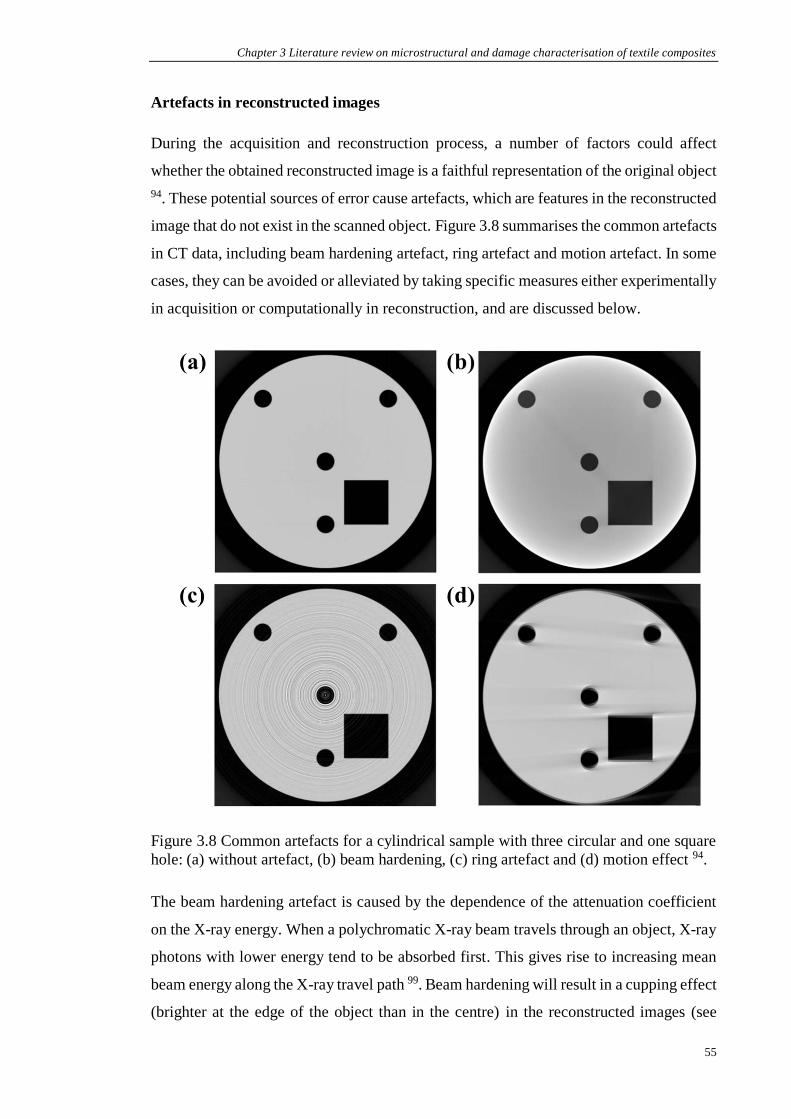
Chapter 3 Literature review on microstructural and damage characterisation of textile composites
55
Artefacts in reconstructed images
During the acquisition and reconstruction process, a number of factors could affect
whether the obtained reconstructed image is a faithful representation of the original object
94. These potential sources of error cause artefacts, which are features in the reconstructed
image that do not exist in the scanned object. Figure 3.8 summarises the common artefacts
in CT data, including beam hardening artefact, ring artefact and motion artefact. In some
cases, they can be avoided or alleviated by taking specific measures either experimentally
in acquisition or computationally in reconstruction, and are discussed below.
Figure 3.8 Common artefacts for a cylindrical sample with three circular and one square
hole: (a) without artefact, (b) beam hardening, (c) ring artefact and (d) motion effect 94.
The beam hardening artefact is caused by the dependence of the attenuation coefficient
on the X-ray energy. When a polychromatic X-ray beam travels through an object, X-ray
photons with lower energy tend to be absorbed first. This gives rise to increasing mean
beam energy along the X-ray travel path 99. Beam hardening will result in a cupping effect
(brighter at the edge of the object than in the centre) in the reconstructed images (see

Chapter 3 Literature review on microstructural and damage characterisation of textile composites
56
Figure 3.8(b)). Beam hardening artefacts can be reduced by filtering the incident beam or
post-processing by specific algorithms.
The ring artefact is caused by the presence of mis-calibrated or defective pixels in the
detector. As the object rotates during the scan, the greyscale deviation owing to those
‘bad’ pixels traces a ring. Therefore, as shown in Figure 3.8(c), ring artefacts are generally
shaped as concentric circles in the reconstructed images and the centre of the circles is
the rotation axis 100. Ring artefacts can be alleviated by carefully re-calibrating the
detector before scanning, or moving the object with small and known movements during
the scan, or post-processing by specific algorithms 101.
The motion artefacts are caused by movements that have occurred during the acquisition.
This causes blurring of the features, such as double edges and streaks, as shown in Figure
3.8(d). This is often a problem in the in-situ X-ray CT experiments of FRPs, as the damage
propagation in composite materials is usually sudden and catastrophic. Motion artefacts
can be alleviated by reducing the acquisition time, through using higher-flux X-ray source
12 or using advanced reconstruction algorithms that require fewer projections for each
scan 102.
The presence of artefacts can degrade the overall image quality, introduce misleading
information and cause errors in quantitative analysis. Recognising artefacts in X-ray CT
images is important, as it helps us to distinguish artefacts from the features of interest and
it also motivates the optimising of scanning and processing parameters to reduce artefacts
from the X-ray CT images.
3.3.2 Time-lapse X-ray CT
Conventionally, X-ray CT is often used for the 3D characterisation of damage after a
mechanical/thermal testing, namely post-mortem X-ray CT. For the investigation of the
damage mechanisms of materials, it is often helpful to be able to follow the evolution and
interaction of various damage modes as a function of time, load and/or environment (i.e.
temperature)). This can be achieved by non-destructively acquiring a time series of 3D
X-ray CT images 91. Figure 3.9 illustrates different modes of time-lapse X-ray CT. Time-
lapse X-ray CT can be broadly categorised into ex-situ and in-situ imaging 90. In an in-
situ experiment the sample is scanned under load/heat in a designated rig on the X-ray
CT system, while for the ex-situ experiment the sample is removed from the

Chapter 3 Literature review on microstructural and damage characterisation of textile composites
57
loading/heating environment before imaging. In both cases, the same sample is imaged
repeatedly at different stages along the timescale. Thus it allows tracking the evolution of
the microstructure through its manufacturing process or failure process. This time-lapse
method is especially helpful to understand the mechanisms of composite materials
because the composite performance can scatter significantly between individuals and
monitoring individual specimens can explain the real affecting factors. Generally, in-situ
imaging is a better choice, because it reveals the real structure of the composite under
load/heat and also because it avoids the difficulty of imaging cracks that are closed when
unloaded 103. On the other hand, ex-situ imaging can be the best option in cases where
complex testing condition is required or where a long testing time is required (e.g. resin
infusion, impact, long-term fatigue).
Figure 3.9 Different modes of time-lapse X-ray CT 91.
In-situ imaging can be further categorised based on whether the applied load/heat is
interrupted for image acquisition. Un-interrupted testing is advantageous, as interrupting
the testing conditions could introduce unknown changes to the phenomenon under
investigation and it could lead to material relaxation. However, it requires fast acquisition
(from 1/208 s to 1 min per scan) 104 that can match the time-scale of the microstructural
changes that are occurring. For composite materials, damage evolution is often sudden

Chapter 3 Literature review on microstructural and damage characterisation of textile composites
58
and catastrophic. Due to the limit in temporal resolution (and to avoid severe motion
artefacts), in many cases, the testing conditions are interrupted before acquiring each scan
105.
Nowadays, a wide range of in-situ tests can be performed including tension, compression,
bending and even short-term fatigue with the available rigs. Generally, these rigs are
composed of low-attenuating chambers (often made of polymers) that allow uninterrupted
viewing over 360°. However, if the material under investigation is itself low-attenuating,
such as polymer composites, the image contrast can be degraded. Recently, framed rigs
107 have been developed, in which the grips on the sample rotate in synchrony such that
the frame of the rig does not rotate which would otherwise obscure the beam. This design
leaves a free path of X-rays along the source-sample-detector axis, preserving the original
image quality, which now makes it feasible to obtain sufficient contrast for testing
polymer composites.
3.3.3 Challenges of X-ray CT in characterising composites
Balancing between spatial resolution and sample size
There are two important parameters of an X-ray CT experiment – the spatial resolution
and the field-of-view (FoV). The spatial resolution determines the minimum size of
features that can be detected and it is normally 2-3 times the voxel size 12. The FoV is
determined by multiplying the voxel/pixel size with the number of pixels on the detector
(often 2000-4000 pixels wide). Conventional reconstruction algorithms require that the
object stays fully within the FoV during the scan. Therefore, the sample size is often
limited by the desired spatial resolution.
For composite samples used in X-ray CT experiments, the spatial resolution and the
sample size needs to be balanced considering two main factors – the size of the features
to detect and whether the observed composite behaviour is representative and
reproducible. If the target is to image individual fibres (the diameter of carbon fibres is
generally 5-7 µm) or fine matrix cracks, higher spatial resolution (at the µm scale) is
desirable, which generally means smaller samples (at the mm scale). Therefore, for X-ray
CT experiments to investigate damage micro-mechanisms or to provide detailed fibre
architecture for setting up and validating models, the composite samples used are often
miniaturised samples that do not fully follow mechanical testing standards (i.e. ASTM
standards). As the composite behaviour tends to change with sample size 108, the spatial

Chapter 3 Literature review on microstructural and damage characterisation of textile composites
59
resolution needs to be compromised to some extent. This is particularly true for textile
composites that have relatively repeating patterns that extend over a large area, in which
the representative unit cell may be too large to be imaged at adequate resolution for
detecting fine damage.
There are several imaging strategies that can be employed to overcome this restriction,
such as image stitching 109 and region-of-interest (RoI) imaging 110. The image stitching
method requires acquiring multiple images and stitching them together to obtain an
extended FoV at the desired resolution. RoI imaging, that performs high-resolution
imaging within a certain region in the bulk sample, can be achieved with improved
reconstruction algorithms. However, using these approaches provokes challenges to the
processing algorithms and artefacts tend to occur.
Enhancing contrast
In conventional absorption-mode X-ray CT, the contrast between phases relies on the
difference in the linear attenuation coefficients, as illustrated by Equation 3.2. Therefore,
for its application in low-attenuating materials, such as bio-materials and CFRPs, the
obtained contrast between phases is often low. This limits the detectability of thin matrix
cracks in FRPs, even if the spatial resolution is sufficiently high. A variety of measures
can be taken to enhance the contrast and thus the detectability of features in FRPs 91, 111,
including phase-contrast imaging, staining and applying in-situ load. These approaches
are discussed below together with cases detailing the use of them in FRPs.
Phase contrast imaging
As an X-ray beam passes through an object, the phase of the beam is shifted due to the
interaction with the electrons in the material 93. For FRPs over the range of X-ray energies
generally used (~15-20 keV), the phase shift is often more significant than the difference
in attenuation coefficients 91. Therefore, imaging modes that exploit phase contrast can
give rise to higher feature detectability than solely relying on absorption contrast. There
are different approaches to obtain phase contrast 112, 113. Propagation-based phase contrast
imaging is often employed on synchrotron radiation beamlines and certain lab-CT
systems, in which phase contrast is enhanced by increasing the sample-to-detector
distance towards the Fresnel regime, giving rise to bright and dark fringes around
discontinuities. This technique is particularly useful for detecting fine cracks in FRPs,
such as matrix cracks 103 and individual fibre fractures 114. Figure 3.10 shows the same

Chapter 3 Literature review on microstructural and damage characterisation of textile composites
60
cross-section of a fatigued 3D woven GFRP composite imaged by absorption and phase
contrast enhanced modes using lab-CT system. It can be seen that the matrix crack
becomes more evident in the in the presence of moderate phase contrast.
Figure 3.10 2D cross-section of a fatigued 3D woven GFRP imaged in (a) pure absorption
mode and (b) with modest phase contrast using a lab-CT system 103.
Staining
An alternative way to enhance contrast is to use contrast agents with elements of high
atomic number (e.g. zinc iodide) to stain features so as to improve the absorption contrast.
Schilling et al. 115 reported that cracks as thin as 5% of the voxel size can be detected in
CFRPs with the help of staining. Djukic et al. 116 used coatings made of higher density
materials, such as gold or copper, to stain fibre tows before weaving into textile preforms
and the manufacture of composite, to facilitate better visualisation of textile architecture
in CFRPs. Figure 3.11 displays a gold-coated tow within the plain-woven CFRP, where
the tow dimensions could be more easily measured. However, there are a number of issues
with staining. For the visualisation of damage, effective staining requires feature
connectivity and only cracks connected to the outer surface could be stained. Also,
staining could influence the material behaviour. Spearing and Beaumont 117 found that
the use of zinc iodide as penetrant dye influenced the matrix crack growth along the
loading direction (0-degree ply splits) under tensile fatigue.

Chapter 3 Literature review on microstructural and damage characterisation of textile composites
61
Figure 3.11 2D X-ray CT cross-section of a plain woven CFRP, where a fibre tow has
been coated with gold before preforming 116.
Applying in-situ load
The detectability of cracks can also be enhanced by applying load (not necessarily the
same amount as in the mechanical testing) during imaging so as to hold cracks open.
Figure 3.12 shows typical cross-sections in a tension-tension fatigued non-crimp GFRP
specimen after 67,000 cycles in the unloaded state and 0.17% strained (about one fifth of
the maximum strain during fatigue) 118. It can be seen that the applied load enhanced the
detectability of both off-axis matrix cracks and fibre fractures by opening the cracks. It is
worth noting that the effect of loading is more pronounced in opening fibre fractures than
off-axis cracks.
Figure 3.12 Magnified 2D X-ray CT views of a fatigued non-crimp GFRP (a) under the
unloaded state and (b) strained by 0.17% 118.

Chapter 3 Literature review on microstructural and damage characterisation of textile composites
62
3.4 Application of X-ray CT to fibre reinforced polymers
This section illustrates the capability of X-ray CT by reviewing recent studies on its
application to FRPs, with a particular focus on textile composites.
3.4.1 Microstructure characterisation
Fibre/textile architecture
It is inevitable that fibre/textile architecture deforms locally during textile preforming,
resin impregnation and consolidation 119. These microstructure changes need to be well
understood and considered as the performance and properties of the composite materials
are largely dependent on the fibre architecture. As discussed in Section 3.1, the internal
textile architecture used to be determined experimentally by destructive serial sectioning
120. Recently, X-ray CT has been employed to characterise the 3D fibre/textile
architecture in non-crimp, woven and braided composites from the yarn scale down to the
fibre scale 116, 121, 122. It proves to be a reliable approach to characterise the structure of
textile fabrics 123 and most of the works have focused on fibre yarn geometry of flat
textiles 116, 124-128.
Potluri et al. 129 studied the compression of multiple layers of plain-woven glass fabrics
using in-situ X-ray CT and reported that the average layer thickness reduces with
increased number of layers (see Figure 3.13). It was found that the nesting effect
influenced the tow waviness/crimp, the size of resin channels and the layer-thickness in
multi-layer textile fabrics. In addition, the geometrical variation in 3D textile fabrics has
been reported by Desplentere et al. 123. They compared the measurements of yarn
thickness, width and spacing in four types of 3D woven glass fibre fabrics obtained from
X-ray CT, cross-sectional optical micrographs and surface photos. They found that a non-
negligible variety exists in the textile architecture, exhibited by the scatter in the yarn
dimensions (standard deviation of 16%) and yarn spacing (standard deviation of 6%),
which manifests the importance to characterise the real textile architecture. Across
different measurement methods, results show a statistically insignificant difference (see
Figure 3.14) and thus validated the potential of using X-ray CT to provide textile
parameters as input to generate real 3D textile models for the use of image-based
modelling (see Section 3.4.3).

Chapter 3 Literature review on microstructural and damage characterisation of textile composites
63
Figure 3.13 (a) Schematic of a loading fixture for in-situ compression of multiple layers
of plain-woven glass fabrics, (b) the measured average layer thickness as a function of
pressure and the number of layers and (c) the typical 2D X-ray CT cross-sections of weft
cross-sections of a single layer, six and ten layers, showing nesting phenomenon in multi-
layer fabric stacks. 129
Figure 3.14 Bar chart comparing the tow dimensions and arrangement measured on the
surface, from cross-sectional optical micrographs and using X-ray CT, showing the
consistency across different approaches. The measured parameters include the yarn
thickness (d1), yarn width (d2) and yarn spacing (a) of warp, weft and binder tows in four
different types of 3D fabrics 123.
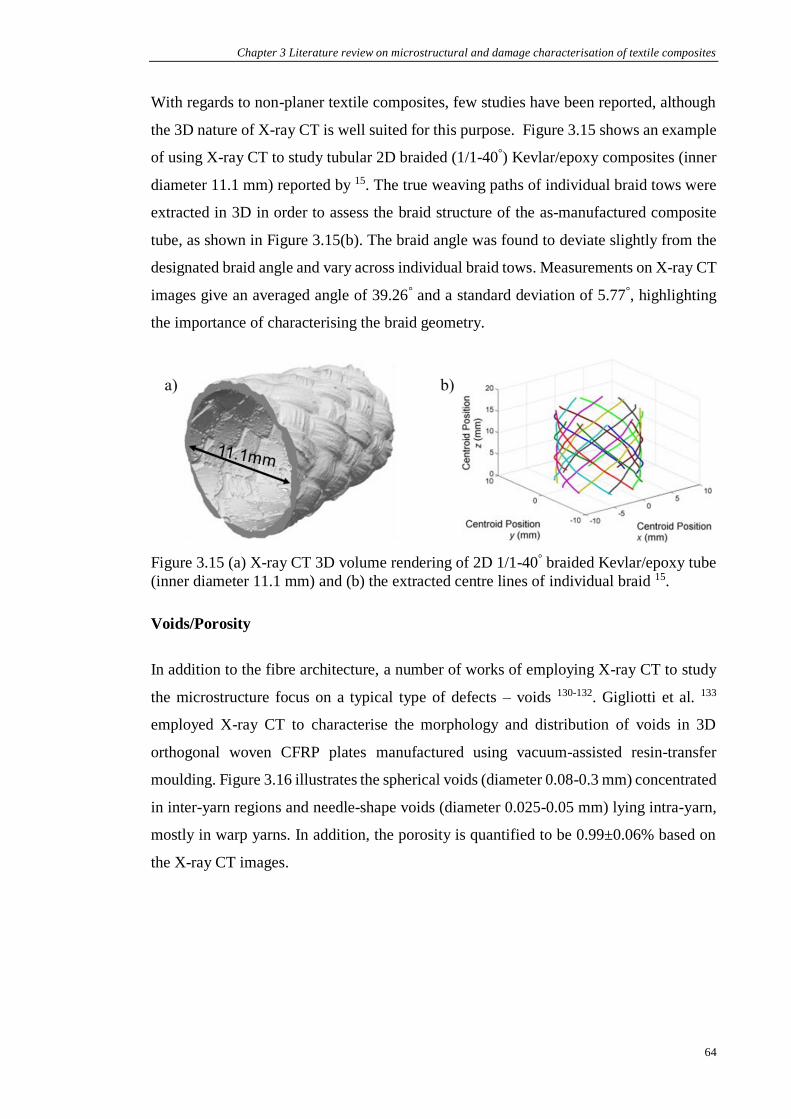
Chapter 3 Literature review on microstructural and damage characterisation of textile composites
64
With regards to non-planer textile composites, few studies have been reported, although
the 3D nature of X-ray CT is well suited for this purpose. Figure 3.15 shows an example
of using X-ray CT to study tubular 2D braided (1/1-40°) Kevlar/epoxy composites (inner
diameter 11.1 mm) reported by 15. The true weaving paths of individual braid tows were
extracted in 3D in order to assess the braid structure of the as-manufactured composite
tube, as shown in Figure 3.15(b). The braid angle was found to deviate slightly from the
designated braid angle and vary across individual braid tows. Measurements on X-ray CT
images give an averaged angle of 39.26° and a standard deviation of 5.77°, highlighting
the importance of characterising the braid geometry.
Figure 3.15 (a) X-ray CT 3D volume rendering of 2D 1/1-40° braided Kevlar/epoxy tube
(inner diameter 11.1 mm) and (b) the extracted centre lines of individual braid 15.
Voids/Porosity
In addition to the fibre architecture, a number of works of employing X-ray CT to study
the microstructure focus on a typical type of defects – voids 130-132. Gigliotti et al. 133
employed X-ray CT to characterise the morphology and distribution of voids in 3D
orthogonal woven CFRP plates manufactured using vacuum-assisted resin-transfer
moulding. Figure 3.16 illustrates the spherical voids (diameter 0.08-0.3 mm) concentrated
in inter-yarn regions and needle-shape voids (diameter 0.025-0.05 mm) lying intra-yarn,
mostly in warp yarns. In addition, the porosity is quantified to be 0.99±0.06% based on
the X-ray CT images.

Chapter 3 Literature review on microstructural and damage characterisation of textile composites
65
Figure 3.16 Orthogonal 2D X-ray CT cross-sections of a 3D orthogonal woven CFRP
sample, showing the shape and distribution of voids 133.
A step forward, the formation of voids can also be monitored with the aid of time-lapse
X-ray CT 134-136. An interesting study has been reported by Vila et al. 136 on in-situ fibre
tow impregnation by the VARI method. A glass fibre tow (2K) was extracted from a
plain-woven fabric and a syrup/water blend was used as the infusion fluid. The in-situ
impregnation was performed in a designated fixture mounted on the synchrotron
beamline accompanied by time-lapse imaging. As shown in Figure 3.17, the dry and wet
glass fibres, and voids can be visualised in the X-ray CT images. Therefore, the flow front
and the transport of voids can be monitored throughout the impregnation process. It was
found that small voids were transported along the fibre direction between individual fibres
and they tend to be trapped between crossing or closely packed fibres due to the capillary
effect, giving rise to a large number of small voids after impregnation. In contrast, the
migration of elongated large voids between fibres is easier under the vacuum pressure
gradient. For textile composites, due to the sample size limit for in-situ infusion
experiment, time-lapse studies focus on following the evolution of porosity in the
consolidation process of composites prepared from woven pre-pregs 134, 135.

Chapter 3 Literature review on microstructural and damage characterisation of textile composites
66
Figure 3.17 (a) A 2D X-ray CT cross-section of a partially impregnated glass fibre tow,
having dry and wet regions. 3D X-ray CT volume rendering of the glass fibre tow (b)
before resin infusion, (c) partially impregnated and (d) fully impregnated. (e) Schematic
diagram illustrating the syrup flow at the tow/fibre level during vacuum infusion 136.
3.4.2 Damage characterisation
Apart from the use of X-ray CT to assess the fibre/textile architecture and defects, it
significantly aids the investigation into the correlation between structure, property and
damage in FRPs. For unidirectional composites and laminated composites, due to the
relatively simple structure and straightforwardness in downsizing samples to obtain high
resolution, a great number of works have been reported using X-ray CT to understand the
damage mechanisms under various loading scenarios 105, 118, 137. Relevant works have
been thoroughly reviewed by Garcea et al. 91 and Wang et al 90. However, there have been
much fewer studies on textile composites. Therefore, this section will focus on the
literatures reporting X-ray imaging of damage in textile composites.

Chapter 3 Literature review on microstructural and damage characterisation of textile composites
67
Damage morphology
Damage in textile composites tends to take a variety of forms (i.e matrix cracking, fibre
fracture and interfacial failure) due to their intrinsic complex microstructure. X-ray CT is
a powerful technique to investigate the morphology and distribution of various damage
modes in textile composites in 3D 91. Xu et al. 138 employed post-mortem X-ray CT to
compare the damage morphology in open-hole 2D woven and 3D orthogonal woven glass
fibre composites under three-point bending. The observed damage morphology reveals
that compared with the 2D woven structure, the higher open-hole flexural strength of the
3D woven structure could be attributed to the lack of delamination constrained by the
binder yarns. Post-mortem X-ray CT has also been used to understand the impact damage
mechanisms in braided composites. Zhou et al. 9 studied the damage in 3D braided CRRP
tubes (inner diameter 20.5 mm and wall thickness 1.75-2.75 mm) subjected to transverse
impact using X-ray CT. The effects of impact velocity (7, 12 and 17 m/s), braid angle
(15°, 30° and 45°) and the number of layers (2, 3 and 4 layers) on the extent of impact
damage have been thoroughly assessed. Under impact at 7 m/s, damage predominately
takes the forms of inter-tow debonding and matrix cracking, whereas as the impact
velocity increases, tow splitting and fibre breakage can also occur. Moreover, it was found
that the resistance to impact damage increases with increasing braid angle and increasing
number of layers. Figure 3.18 illustrates the damage morphology and distribution in the
3D braided three-layer tubes having braid angles of 15°, 30° and 45° under impact at a
velocity of 17 m/s. It was suggested that the braid structure and tow cross-overs become
tighter as the braid angle increases, which gives rise to increased resistance to impact
damage development.

Chapter 3 Literature review on microstructural and damage characterisation of textile composites
68
Figure 3.18 Photographs and X-ray CT images showing the damage morphology in 3D
braided CFRP tubes having braid angles of 15°, 30° and 45° (inner diameter 20.5 mm and
wall thickness are 1.75mm, 2.20mm and 2.65mm) 9.
Damage evolution
As discussed in Section 2.3.3.2, time-lapse X-ray CT is beneficial in understanding the
damage evolution mechanisms owing to the direct experimental observation, rather than
postulating based on post-failure observations. The application of time-lapse X-ray CT to
study damage mechanisms of textile composites has seen continuing increase in the past
decade 13, 105, 137.
The ex-situ X-ray CT has been increasingly used to reveal the fatigue damage evolution
in textile composites 133, 139-141. An ex-situ thermal fatigue study was performed by
Gigliotti et al. 133 on the 3D orthogonal woven CFRPs having voids (see Figure 3.16 in
Section 3.4.1). Two samples, one with the size of one unit cell (1 UC) and the other with

Chapter 3 Literature review on microstructural and damage characterisation of textile composites
69
2×2 unit cells (2×2 UC), were subjected to triangular thermal cycles (+50 °C/−50 °C), and
X-ray CT scans were acquired at different stages. Figure 3.19 shows the evolution of
damage (blue) in the two samples segmented from X-ray CT images. It was found that
irrespective of the difference in dimensions, the damage morphology in the two samples
is very similar, thereby manifesting the reliability to analyse damage mechanisms within
a unit cell for textile composites. Generally, cracks tended to concentrate near the critical
zones – curved binder yarns, which could be attributed to the difference in the thermal
expansion coefficients of adjacent orthogonal yarns. Moreover, the presence of voids was
found to facilitate the propagation of cracks if the voids were located near the crack path.
Figure 3.19 3D X-ray CT volume renderings to compare the distribution and evolution of
cracks for “2 × 2 UC” (left, dimensions 10.8×10.8×2.7 mm) and “1 UC” (right,
dimensions 5.7×5×2.7 mm) samples after (a) and (b) 200, (c) and (d) 800, (e) and (f) 1400
thermal cycles 133.

Chapter 3 Literature review on microstructural and damage characterisation of textile composites
70
More studies have been reported on mechanical cyclic loading of textile composites. For
example, Yu et al. 141 followed the evolution of tension-tension fatigue damage in a
modified layer-to-layer 3D woven glass fibre/epoxy composite by ex-situ X-ray CT. The
fatigue test was performed on an Instron testing frame and the test was interrupted at
several stages to remove the sample for X-ray CT imaging. Staining (see Section 3.3.3)
was employed to enhance matrix crack detection. Figure 3.20(a) shows the development
of various damage modes within a unit cell extracted/segmented from the time-series of
X-ray CT images. In addition to the qualitative visualisation of damage, the segmented
info also allows quantifying the growth of different damage modes as a function of fatigue
cycles (see Figure 3.20(b)). It was found that although damage (i.e. transverse cracks) can
occur very early during fatigue (which can be attributed to the crimp), damage tends to
occur gradually and be evenly distributed across the structure (which can be attributed to
efficient stress redistribution via the through-the-thickness constraint), thereby giving rise
to high damage tolerance.
Figure 3.20 (a) 3D X-ray CT volume rendering of the woven structure before fatigue and
damage within a unit cell at different stages of the fatigue life, showing progressive
damage evolution in a 3D woven glass fibre composite. (b) The number of transverse
cracks and the fraction of debonded weft/binder interface as a function of fatigue life
quantified based on X-ray CT images 141.

Chapter 3 Literature review on microstructural and damage characterisation of textile composites
71
Recently, in-situ X-ray CT has been used to follow damage development in textile
composites under static loading conditions 13, 14, 142. Li et al. 13 reported an in-situ X-ray
CT study of 3D layer-to-layer woven CFRPs. A designated double-notch specimen
geometry was employed for tensile loading to study the damage mechanisms under shear
stress (see Figure 3.21(a)). As shown in Figure 3.21, it was found that debonding along
the binder yarns is the critical damage mode and the crimp angle of the binder yarns is an
important factor to tailor.
Figure 3.21 (a) Schematic of the specimen geometry (dimensions 20×39×8 mm) and the
region of interest. (b-d) X-ray CT images and extracted damage (blue), showing the
evolution of damage with increasing load (2.5, 4 and 4.3 kN, respectively). (e) A
magnified 2D X-ray CT image showing the debonding crack at the state of (d) 13.
To the best of the author’s knowledge, in-situ studies revealing the damage mechanisms
of braided FRPs have not been reported in literature. There are generally two main
challenges associated with the in-situ testing of textile composites. The first is the sample

Chapter 3 Literature review on microstructural and damage characterisation of textile composites
72
design. In order to obtain sufficient resolution to resolve micro-scale damage, recent in-
situ studies of woven composite samples all employ miniaturised and designated
specimen geometries that fit the specific purpose 91. Therefore, an appropriate design is
essential to allow detecting the true damage mechanisms where edge effect and size effect
are minimised. In addition, the currently available loading scenarios are limited to tension
or compression loading. In-situ experiment of more complex loading conditions (i.e.
torsion and fatigue) is still challenging.
3.4.3 Image-based modelling
As discussed above, X-ray CT proves to be a powerful technique for experiment-based
characterisation of FRPs, Moreover, it has also gained popularity to assist the finite
element (FE) modelling of composite materials. On the one hand, the modelling
predictions/outputs can be validated by direct observation from X-ray CT experiments
124, especially after the time-lapse X-ray CT becomes more accessible and reliable. On
the other hand, the detailed 3D microstructural information obtained non-destructively
from X-ray CT images is regarded as a promising route for establishing models of textile
composites, namely image-based modelling. This is because compared with idealised
models that are commonly used in model set-up, the local variation of fibre/textile
architecture 128 and defects 143 can be taken into consideration via image-based modelling.
This gives rise to a model that can be a more realistic representation of the material and
thereby improving the reliability of modelling outputs.
Very recently, alongside the improvement in X-ray imaging resolution, an increasing
number of imaged-based modelling have been performed on the fibre level, to account
for the influence of fibre misalignment and spatial distribution of individual fibres in
unidirectional or laminated composites 144-146. Nevertheless, for textile composites,
image-based modelling has been focused on the tow level, due to the tow-scale structural
variation imposed by the interlaced tows.
Naouar 147, 148 acquired X-ray CT images of a twill (2/2) weave carbon fabric and a non-
crimp 3D orthogonal woven glass fabric. Individual yarns were extracted from the CT
images by segmentation, followed by mesh generation. It should be noted that each
element of the mesh needs to be oriented based on the local yarn direction measured from
the X-ray CT images in order to perform FE calculation. It was found that for transverse
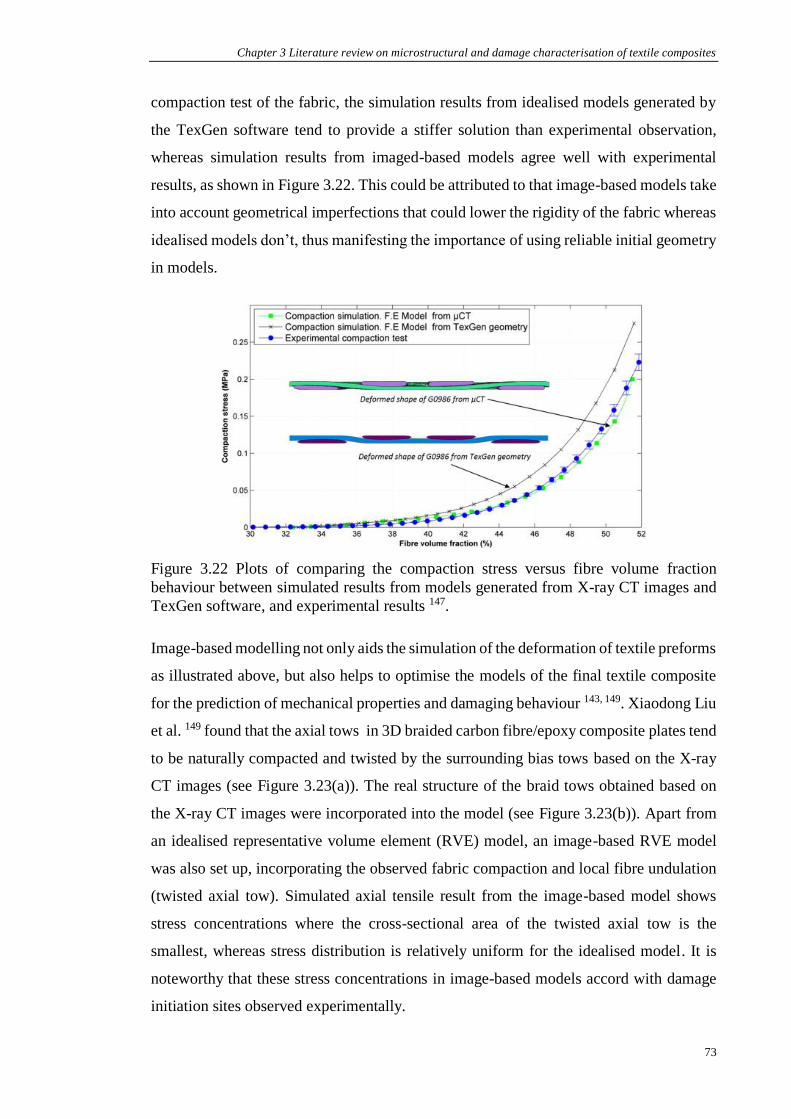
Chapter 3 Literature review on microstructural and damage characterisation of textile composites
73
compaction test of the fabric, the simulation results from idealised models generated by
the TexGen software tend to provide a stiffer solution than experimental observation,
whereas simulation results from imaged-based models agree well with experimental
results, as shown in Figure 3.22. This could be attributed to that image-based models take
into account geometrical imperfections that could lower the rigidity of the fabric whereas
idealised models don’t, thus manifesting the importance of using reliable initial geometry
in models.
Figure 3.22 Plots of comparing the compaction stress versus fibre volume fraction
behaviour between simulated results from models generated from X-ray CT images and
TexGen software, and experimental results 147.
Image-based modelling not only aids the simulation of the deformation of textile preforms
as illustrated above, but also helps to optimise the models of the final textile composite
for the prediction of mechanical properties and damaging behaviour 143, 149. Xiaodong Liu
et al. 149 found that the axial tows in 3D braided carbon fibre/epoxy composite plates tend
to be naturally compacted and twisted by the surrounding bias tows based on the X-ray
CT images (see Figure 3.23(a)). The real structure of the braid tows obtained based on
the X-ray CT images were incorporated into the model (see Figure 3.23(b)). Apart from
an idealised representative volume element (RVE) model, an image-based RVE model
was also set up, incorporating the observed fabric compaction and local fibre undulation
(twisted axial tow). Simulated axial tensile result from the image-based model shows
stress concentrations where the cross-sectional area of the twisted axial tow is the
smallest, whereas stress distribution is relatively uniform for the idealised model. It is
noteworthy that these stress concentrations in image-based models accord with damage
initiation sites observed experimentally.

Chapter 3 Literature review on microstructural and damage characterisation of textile composites
74
Figure 3.23 (a) X-ray CT image analysis to extract braid tows in a 3D braided CFRP plate,
(b) image-based model, (c) idealised model and (d) one typical axial tow in the image-
based model 149.
As discussed above, imaged-based modelling is advantageous over conventional
modelling (based on idealised structures) for composite modelling, as incorporating the
various structural details revealed by X-ray CT proves to improve the reliability of
predictions. However, sometimes, the amount of detail can cause issues, such as
dramatically increasing the computational cost. Therefore, it is critical to compromise
between the level of detail and computational load in practical applications. In many
image-based models of textile composites, the fibre tows are directly segmented and
extracted from the X-ray CT images. This is often followed by smoothing and simplifying
the tow geometries as illustrated in 150.
Figure 3.24 3D volume rendering of fibre tows (a) directly extracted from X-ray CT
image and (b) smoothed via kriging in a multi-layer 2D woven glass fibre composite 150.
Another approach is to obtain characteristic sections of the fibre tows from X-ray CT
images and generate the full model based on the periodicity of textile structure 151, 152.

Chapter 3 Literature review on microstructural and damage characterisation of textile composites
75
Huang et al. 151 reported that to build a weft yarn in a plain woven glass fabric, the
contours of at least 12 ‘key sections’ within one waviness period of the yarn need to be
extracted from the X-ray CT images in order to be representative of the actual tow
geometry, as illustrated in Figure 3.25. The number of key sections can be larger to obtain
a more precise model or if the tows undergo significant deformation. In addition to the
difficulties caused by the level of details, other challenges associated with extracting fibre
tow structure from X-ray CT images include the intrinsic low contrast in CFRPs and
difficulty to automatically define the boundary between fibre tows 153, which hinders the
wide use of image-based modelling as a routine.
Figure 3.25 X-ray CT sections showing a highlighted weft yarn (left, side view) and the
corresponding key sections used to select the contours of this weft yarn (right, front view) 151.
3.5 Chapter summary
In this chapter, the common destructive and non-destructive damage characterisation
approaches for textile composites have been reviewed, with a particular focus on X-ray
CT. The background and characteristics of X-ray CT and the time-lapse X-ray CT
strategy have been introduced. In addition, the application of X-ray CT in characterising
the microstructure and damage in textile composites has been well surveyed, and the on-
going challenges have been identified. It can be seen that in-situ time-lapse X-ray CT is
considered as a promising characterisation method to monitor the composite degradation
process in real time. Till now, most of the time-lapse studies are focused on the tension
and compression behaviour of composites, very limited has been done to understand the
torsional failure, which could be better informed by the current study. Furthermore, the
obtained CT images could be potentially employed as input for image-based modelling
to replace idealised models and as experimental evidence to validate modelling results.

Chapter 4 Materials and experimental methods
76
4. Materials and experimental methods
In this project, the torsional behaviour of braided composite has been investigated
experimentally. Both conventional torsion testing and novel in-situ torsion testing
accompanied by X-ray computed tomography (CT) have been performed on braided
composite tube samples. The samples have been prepared either following or adapted
from testing standards to facilitate image-oriented characterisation. This chapter details
the experimental methods involved, including the sample preparation, mechanical testing,
X-ray image acquisition and post processing.
4.1 Materials and sample preparation
The raw braided composite tubes were supplied by Robotics and Textile Composites
Group at The University of Manchester. The single-layer 2D braided carbon fibre sleeves
were fabricated using a maypole braiding machine (Cobra Braiding Machinery Ltd). In
order to study the effect of braid architecture on the torsional performance, braids with
different braid pattern (diamond 1/1 and regular 2/2) and braid angle (35° and 45°) were
manufactured as summarised in Table 4.1. T700SC-12K-60E carbon fibre tows were
braided onto a 10 mm-diameter steel mandrel (pre-treated with release agent to aid
demoulding). The composite tubes were manufactured by infusing IN2/AT30 (Easy
Composites Ltd) epoxy resin into the braids by vacuum assisted resin infusion, followed
by curing at 100 °C for 3 hours. To control the surface finish and wall thickness of the
composite tube, an outer mould was applied during the resin infusion. The manufactured
braided composite tubes have an inner diameter of 10 mm and a wall thickness of ~1.3
mm and are ~20 mm in length. The specimen geometry was determined taking into
account the manufacturing quality and X-ray imaging resolution and quality.
Table 4.1 The four types of braids studied in this project.
Braid pattern Braid angle
1/1 (diamond) 35° 45°
2/2 (regular) 35° 45°

Chapter 4 Materials and experimental methods
77
Prior to the torsion testing, the composite tubes were cut into 55 mm long pieces and
prepared into testing samples (see Figure 4.1). The gauge length of the samples was ~15
mm, with the final 20 mm at the ends of each specimen glued into steel end-tabbing
fixtures, comprising an insert and an outer shell (adapted from ASTM standard
D5448/D5448M 154), by epoxy adhesive (3M™ Scotch-Weld™ EC-9323 B/A). Note that
the geometry of the outer shells varies between samples tested on the Instron testing frame
and the in-situ rig in order to apply pure torsion using the grips of different loading
machines. The sample dimensions were determined such that the X-ray imaging
resolution can be sufficiently high to resolve fine damage and cracks, while the gauge
length can accommodate at least 1-2 repeating units of the braids.
In order to assess the effect of directly opposing open-holes on the torsional performance
of braided composite tubes, open-hole 1/1-45° tube samples were prepared to compare
with unnotched 1/1-45° tube samples. For the open-hole samples, at the mid-length of the
tube specimens, a hole of 2 mm diameter (tow width is ~2.2 mm for the 1/1-45° structure)
was drilled along the diameter of the tube cross-section through the walls, giving rise to
an inner tube diameter to hole diameter ratio of 5.
Figure 4.1 Photograph (left) and schematic (right) of composite tube specimens for
torsion testing on Instron testing frames.

Chapter 4 Materials and experimental methods
78
4.2 Torsion testing of braided composite tubes
4.2.1 Torsion testing
Torsion tests (zero axial load) on the braided CFRP tubes were carried out on an Instron
8802 machine to investigate the torsional behaviour and also to confirm the repeatability
of the observed behaviour from in-situ testing. At least three specimens were tested for
each braid architecture. During the test, 100 bar gripping pressure was applied to hold the
samples and loading was performed at 2°/min 154. High-resolution videos of the samples
throughout the loading process were recorded using LaVision Imager E-lite camera (105
mm lens), to track the damage on the sample surface at a frame rate of 5 Hz.
4.2.2 In-situ torsion testing
To monitor the progressive damage evolution under torsional failure, the braided
composite tubes were also studied by in-situ synchrotron radiation X-ray CT. It is worthy
to note that to the best of the author’s knowledge, this is the first in-situ X-ray study of
composites under torsion. To achieve this, the in-situ tests were performed on an in-house
built Deben-Manchester Open Frame (tension-torsion) Rig (OFR) having a torque
capacity of 100 Nm and an axial load capacity of ±10 kN. It was mounted on the I13-2
Diamond-Manchester beamline, Diamond Light Source, UK (see Figure 4.2). The
advantage of the rig is that the two grips can be rotated independently to apply torsion, or
in concert, so as to rotate the sample for X-ray scanning without having to rotate the whole
rig. This means that the support arms remain stationary and so do not interrupt the X-ray
beam during the rotation, which is crucial to achieve high image quality for in-situ CT
experiments. The pure torsional load was applied by rotating the top grip relative to the
bottom one while maintaining zero axial load. The progressive evolution of damage was
monitored in real-time by interrupting the test at different stages throughout the elastic
and plastic deformation processes for synchrotron X-ray CT scans. The interrupted steps
of interest (paused for X-ray imaging) were determined according to the mechanical
testing results on Instron and were therefore slightly different across samples depending
on the torsional behaviour of each braid structure. The details for each sample will be
given in latter chapters.

Chapter 4 Materials and experimental methods
79
Figure 4.2 Photograph of in-situ experiment set-up on synchrotron beamline I13-2,
Diamond Light Source, UK
4.3 X-ray CT image acquisition and reconstruction
Image acquisition
As mentioned in Section 3.3, compared with lab-based X-ray CT, synchrotron based X-
ray is advantageous for in-situ imaging, owning to its higher resolution and brighter beam,
which can significantly reduce the duration of image acquisition 155. These advantages
make it feasible to understand the materials degradation process throughout the loading
process. In this project, synchrotron X-ray CT was performed at the I13-2 beamline at the
Diamond Light Source (DLS), UK to monitor the damage evolution of braided composite
tubes along torsional straining.
Conventionally, during X-ray CT image acquisition, 180° rotation is employed to collect
the transmitted information through the sample at different angles on a parallel-beam
system (synchrotron radiation), if the sample fully stays within the field-of-view (FoV)
during the scan, as shown in Figure 4.3(a). In other words, to achieve this, the FoV needs
to be larger than the sample, which gives rise to a relatively large voxel size and hence a
relatively low spatial resolution. In this project, a novel imaging strategy, using a detector

Chapter 4 Materials and experimental methods
80
which has an effective imaging width smaller than the diameter of the tube, is successfully
employed to image the full sample at a relatively high resolution. Note that the pixels at
the edges of the detector tend to have defocusing issues and hence the full FoV of the
detector needs to be cropped to an effective FoV for image acquisition, as shown in Figure
4.3(a). To achieve this, instead of positioning the sample with its central axis aligned with
the central axis of the detector, the sample is positioned off-centred and projections are
acquired throughout 360° rotation during each scan. In this manner, the projections from
the second half of the scan can be flipped and stitched to the corresponding projections
from the first half, and thus give rise to an enlarged FoV that covers the full tube 109.
Figure 4.3 Schematics of synchrotron X-ray CT image acquisition strategies, a)
conventional scan with 180° rotation. b) off-centred scan with 360° rotation.
Reconstruction
As discussed in Section 3.3.1, reconstruction is the process to obtain X-ray CT images
from a series of radiographic projections. Here, due to the non-conventional imaging
approach, the reconstruction process is more complex and was performed using a pipeline
of python codes developed at DLS 156, 157. As mentioned above, the corresponding
projections were first stitched to convert the 360° acquisition into a conventional 180°

Chapter 4 Materials and experimental methods
81
data, which is followed by elements to remove or alleviate artefacts. For instance, the
simultaneous loading and rotating the sample via the pair of grips on the rig inevitably
causes some alignment and stability issues. These issues could introduce motion artefacts,
which appear as blurriness, distortion or streaking in the reconstructed CT images. Then
the Gridrec algorithm 158, a direct Fourier-based method that is similar to the conventional
filtered back projection approach, was used for reconstruction into a stack of 32-bit grey-
scale CT slice images. In general, each reconstructed CT data is ~440 GB in size. For
each in-situ study, the loading process was interrupted at five to nine stages to acquire X-
ray CT data, which gives rise to 5-7 CT datasets per sample. In order to accelerate the
image analysis process, and also owing to the limit in hardware specifications of
computational workstations, the reconstructed 32-bit data are converted into 8-bit, which
downsizes the data size by a factor of four (each 8-bit data is ~110 GB).
4.4 X-ray CT image analysis
In this project, the CT data were visualised and analysed using the Avizo® software
(Thermo Fisher Scientific). The CT data can either be visualised slice by slice in 2D or
as a whole three-dimensional (3D) volume in the Avizo software.
Spatial filtering
To reduce the noise and enhance the boundary between different phases, the X-ray CT
images were first smoothed by spatial filtering. There are several filters that are
commonly used and are developed based on different algorithms, which include, but are
not limited to: Gaussian 159, Medial 160, Bilateral 161 and ‘Non-local means’ filters 162.
After a series of trials comparing the image quality after applying the above mentioned
filters (each filter has a number of parameters to tailor), the ‘Non-local means’ filter was
used for all the X-ray CT data in this thesis, which provides the best image quality for
further analysis. Figure 4.4 shows a typical slice image before and after the filter was
applied. It can be seen that the noise was largely alleviated by filtering, which would help
further image analysis.

Chapter 4 Materials and experimental methods
82
Figure 4.4 A typical X-ray CT 2D cross-section of the braided tube (diamond structure
1/1, braid angle 45°), (a) raw image of a magnified region, (b) ‘non-local mean’ filtered
image and (c) filtered image with segmented features highlighted in different colours.
Visualisation and segmentation
As shown in Figure 4.4, different phases, such as epoxy resin, braided carbon fibre tows
and different types of damage, in the braided composite tube can be visualised in 2D
sections based on the difference in grey-scale value. The structure of the composite tube
can also be visualised in 3D by volume rendering of the stack of 2D sections as shown in
Figure 4.5(a). Conventionally, people tend to examine the vertical or horizontal cross-
sections, but X-ray CT offers the advantage of visualising sections in any desired
orientation non-destructively by virtually sectioning at the desired angle through the 3D
data (see Figure 4.5). This is significantly helpful in this project such that the bias braided
tows in the tubular shaped structure can be visualised parallel or normal to the fibre/tow
directions. Therefore, the damage morphology can be correlated with the local fibre
architecture (for FRPs, damage mechanisms are usually discussed along or transverse to
the fibre direction). This approach was used extensively to study the correlation between
different damage modes and the braided fibre tows in later chapters.

Chapter 4 Materials and experimental methods
83
Figure 4.5 Visualisation of X-ray CT images of 1/1-45° braided composite tube. a) a
conventional horizontal slice image, b) 3D volume rendering of the composite tube, c)
3D volume rendering with a horizontal slice image. d) 3D volume rendering with an
angled slice image along a -45° braid tow (highlighted in green, and a +45° braid tow is
highlighted in yellow).
In addition to direct visualisation of grey-scale X-ray CT images, image segmentation is
essential in some cases, such as to understand the spatial morphology of the braid
structure, and the spatial relationship between damage and the braid structure. Image
segmentation is the procedure to distinguish and extract the voxels that represent different
constituents of the sample into different groups based on the grey scale. This facilitates
the qualitative 3D volume rendering and quantification of each individual
group/constituent of interest. For this study, the carbon fibre tows, epoxy resin and
different types of damage were segmented (as shown in Figure 4.4(c)), to aid the
understanding of the spatial relationship between various constituents. For instance,
Figure 4.6 shows that epoxy resin and carbon fibre tows can be separately visualised after
segmentation. Moreover, the braid fibre tows in the two bias directions can be segmented
and volume rendered in two colours to visualise the braid architecture in 3D. As shown
in Figure 4.6(c), the local undulation/crimp of individual braid tows can also be analysed
based on the segmented result and be further correlated with damage development. In
addition, potentially the segmented images can be used to generate image-based models
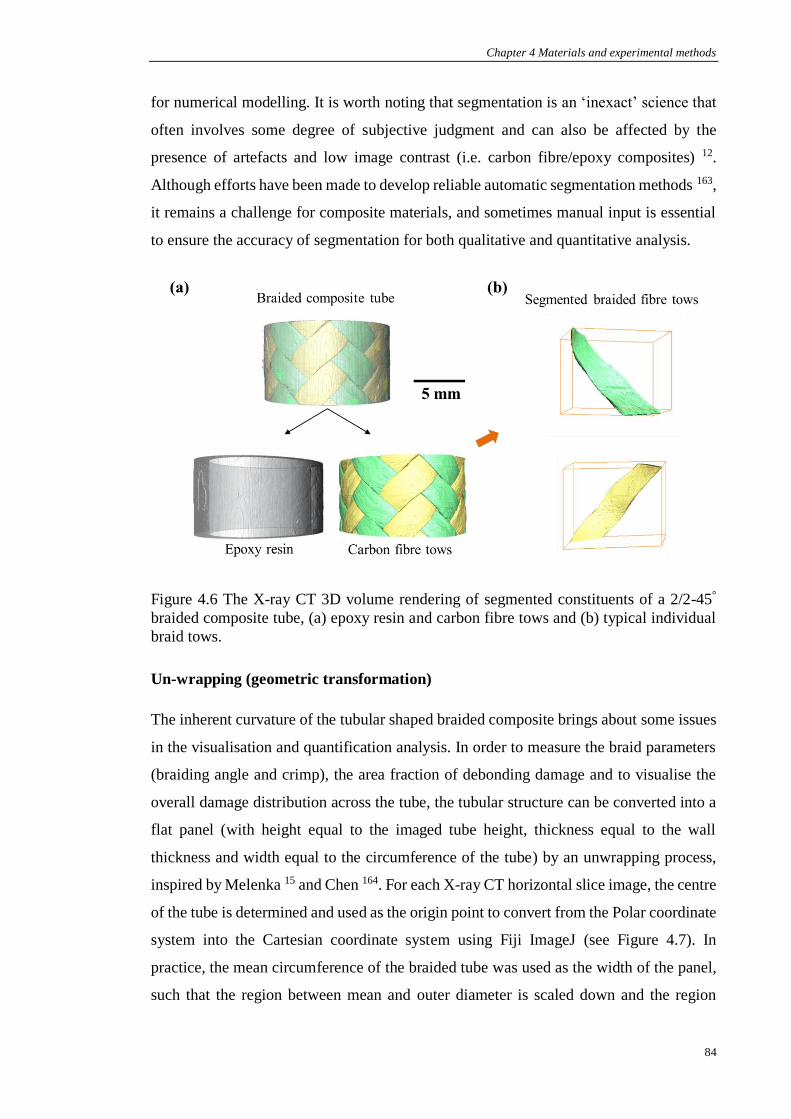
Chapter 4 Materials and experimental methods
84
for numerical modelling. It is worth noting that segmentation is an ‘inexact’ science that
often involves some degree of subjective judgment and can also be affected by the
presence of artefacts and low image contrast (i.e. carbon fibre/epoxy composites) 12.
Although efforts have been made to develop reliable automatic segmentation methods 163,
it remains a challenge for composite materials, and sometimes manual input is essential
to ensure the accuracy of segmentation for both qualitative and quantitative analysis.
Figure 4.6 The X-ray CT 3D volume rendering of segmented constituents of a 2/2-45°
braided composite tube, (a) epoxy resin and carbon fibre tows and (b) typical individual
braid tows.
Un-wrapping (geometric transformation)
The inherent curvature of the tubular shaped braided composite brings about some issues
in the visualisation and quantification analysis. In order to measure the braid parameters
(braiding angle and crimp), the area fraction of debonding damage and to visualise the
overall damage distribution across the tube, the tubular structure can be converted into a
flat panel (with height equal to the imaged tube height, thickness equal to the wall
thickness and width equal to the circumference of the tube) by an unwrapping process,
inspired by Melenka 15 and Chen 164. For each X-ray CT horizontal slice image, the centre
of the tube is determined and used as the origin point to convert from the Polar coordinate
system into the Cartesian coordinate system using Fiji ImageJ (see Figure 4.7). In
practice, the mean circumference of the braided tube was used as the width of the panel,
such that the region between mean and outer diameter is scaled down and the region

Chapter 4 Materials and experimental methods
85
between inner and mean diameter is scaled up to match the width, which inevitably yields
some degree of distortion during the unwrapping process. However, due to the fact that
the wall thickness of the tested composite tube is small, the distortion is in an acceptable
range.
Figure 4.7 X-ray CT 3D volume rendering of the 1/1-45 braided composite tube before
and after unwrapping.
4.5 Chapter summary
In this chapter, the details of the materials and experimental methods used in this project
have been briefly introduced which includes the sample preparation, mechanical testing,
in-situ X-ray image acquisition and post-processing image analysis approaches.
Conventional mechanical testing has been used to evaluate the overall torsional behaviour
of braided composite tubes, while in-situ testing has been used to investigate the damage
mechanisms involved. Owing to its 3D non-destructive capability, X-ray CT aids to better
understand the spatial correlation between damage and the braid structure by virtually
sectioning the sample at any desired angle and via 3D volume rendering. The main
findings of this project are presented and discussed in the following three chapters
(Chapter 5-7).

Chapter 5 Damage evolution in braided composite tubes under torsion
86
5. Damage evolution in braided composite
tubes under torsion studied by in-situ X-ray
computed tomography (Article 1)
Author contribution statement:
Yuan Chai – main investigator of this research who conceived the detailed idea, designed
the experiments, submitted the beam time proposal, undertook the experiments, data
analysis, data interpretation and wrote up the manuscript draft.
Ying Wang – supported in the beamtime experiment, suggested on data analysis and
provided comments on data interpretation.
Zeshan Yousaf – prepared the samples for mechanical testing and supported in the
beamtime experiment.
Tristan Lowe – supported in the beamtime experiment.
Nghia T. Vo – supported in image reconstruction.
Prasad Potluri – suggested on experiment design and provided comments on data
interpretation and manuscript draft.
Philip J. Withers – conceived the overall project ideas, advised on data analysis and
provided comments on data interpretation and manuscript draft.
Note: a version of this chapter has been published in Composites Science and Technology,
Chai et al. (2020). Damage evolution in braided composite tubes under torsion studied by in-situ
X-ray computed tomography. Composites Science and Technology, 188, 107976.
https://doi.org/10.1016/j.compscitech.2019.107976

Chapter 5 Damage evolution in braided composite tubes under torsion
87
Damage evolution in braided composite tubes under
torsion studied by in-situ X-ray computed tomography
Yuan Chaia, b, Ying Wanga, Zeshan Yousafb, Nghia T. Voc, Tristan Lowea, Prasad
Potlurib, Philip J. Withersa
a Henry Royce Institute for Advanced Materials, Department of Materials, School of
Natural Sciences, The University of Manchester, Manchester, UK, M13 9PL
b Northwest Composites Centre, Department of Materials, School of Natural Sciences,
The University of Manchester, Manchester, UK, M13 9PL
c Diamond Light Source, Harwell Science and Innovation Campus, Oxfordshire, UK,
OX11 0DE
Abstract
Here we present the first real time three dimensions (3D) observations of damage
evolution in a composite tube under torsion. An in-situ torsion test of 1/1 45° (diamond)
braided carbon fibre-epoxy circular composite tube was performed on a tension-torsion
rig and the damage process characterised by synchrotron X-ray computed tomography
(CT). A number of damage modes and their damage sequence has been identified and
monitored globally and in more detail within a representative region of interest. In
particular, intra-tow cracks and inter-tow debonding have been found to occur almost
simultaneously at a shear strain of �̅� = 1.5%. Inter-tow debonding propagates uniformly
and dominates the failure under increasing shear strain. It is noteworthy that inter-tow
debonding was initially trapped/limited within repeated braid units before propagating
and connecting with other damage modes in 3D. The area fraction of inter-tow debonds
was quantified at different stages and it was found to dramatically increase with
increasing shear strain beyond �̅� ≥ 1.5%. The total volume fraction of the observed intra-
tow cracks of various forms was seen to grow rapidly beyond �̅� ≥ 2.0 %. Beyond the peak
shear stress (at 𝛾 ̅≈ 2.5 %), fibre micro-buckling and kink bands occur in the tows
subjected to axial compression at crimped regions close to tow crossovers. Tow
crossovers control many aspects of damage propagation under torsion, positively by
localising inter-tow debonds and negatively by initiating fibre micro-buckling.
Keywords: Textile composites; Damage mechanics; Non-destructive testing; Time-
lapse; Filament winding

Chapter 5 Damage evolution in braided composite tubes under torsion
88
5.1 Introduction
Braided composite tubes, owing to their superior specific strength, high corrosion
resistance and high design flexibility, are becoming increasingly used in industrial
applications to replace traditional metal or polymer tubes in both functional and structural
components, such as drive shafts, drone frames, jet engine fan cases and even hockey
sticks 26. A traditional bi-axial braid preform consists of bias fibre tows interlaced at a
braid angle of ±θ˚ with reference to the axial direction. The interlacement between bias
tows in a braid is similar to that in woven fabrics however the difference lies in that the
fibre/tow path in a braid is continuous in a helix. This together with the capability of
braiding to be fabricated directly into complex net-shape composite component gives rise
to reinforcement continuity at component edges and around branches 20. Moreover, there
is considerable scope for tailoring braid structure to suit specific service requirements.
This flexibility also challenges the design and manufacturing process of braided
composites. The tow geometry and fibre volume fraction have a complex relationship
with parameters such as braid angle, mandrel geometry and take-up tensions 64.
In general, the tensile and compressive strengths of braided composites are generally
lower than those of the equivalent laminates 6. This can be explained partly by the
fibre/tow undulation (crimp), which gives rise to local off-axis stress, and partly by
defective fibres resulted from the braiding process. However, compared with
conventional laminated or filament-wound composites, the inter-lacing of the fibre tows
in the through-thickness direction in braided composites increases the splitting toughness
and largely avoids gross delamination 52, which is a detrimental damage mode to
composites. This advantage has enabled braided composites to be suitable for applications
that require high shear and torsional strength and damage tolerance 34. Many load-bearing
components, such as automotive steering columns and drive shafts, are subjected to
torsional loads in operation, thus it is important to understand the performance of braided
composites under torsion. Potluri et al. 57 performed a series of torsion tests on bi-axial
and tri-axial (reinforced with bias and 0˚ tows) braided carbon fibre/epoxy composite
tubes with braid angles of 31°, 45° and 60°, and found that the difference in shear modulus
is marginal between bi-axial and tri-axial braided composites. The shear modulus and
shear strength of the braided composites was observed to decrease with increasing braid
angle, which was suggested to be attributed to the difference in fibre volume fraction and

Chapter 5 Damage evolution in braided composite tubes under torsion
89
the sensitivity to tube diameter variation in the used testing configuration. Harte and Fleck
56 tested bi-axial braided glass fibre/epoxy composite tubes with braid angles of 23°, 40°
and 55°, where the shear strength was found to increase with increasing braid angle, in
contrast to the trend observed in carbon fibre reinforced polymers (CFRP). They also
identified micro-buckling as the dominating torsional failure mode of braided glass
fibre/epoxy composite tube based on visual inspection. Perhaps surprisingly, to date there
have been no reports on the accumulation of damage leading to the torsional failure of
braided composite tubes. This is partly because that damage evolution in fibre reinforced
composites is a complex process containing competing damage modes and mechanisms
in the fibres, matrix and at the interface 91, and partly because of limitations in advanced
characterisation techniques to assess complex shaped structures like braided composite
tubes.
Conventional non-destructive characterisation techniques, such as X-ray radiography 165,
acoustic emission 165, infrared thermography 166, 167 and digital image correlation (DIC)
168, 169 can provide insights into composite damage but each is limited in the level of three
dimensional (3D) information. X-ray computed tomography (CT) can provide detailed
information on the internal microstructure of braided composites. Melenka et al. 15 used
X-ray CT to assess the 3D braid structure and defects in as-manufactured braided Kevlar
fibre/epoxy composite tube, where the actual weaving paths of individual braid tows were
extracted in 3D. Potentially, the measured tow trajectories can replace the idealised braid
geometries used in numerical models to predict the mechanical properties of braided
composites 170. Moreover, time-lapse X-ray CT imaging can track microstructural
changes in 3D as a function of time/load/environment through the use of in-situ loading
rigs 90. With regards to the application of time-lapse X-ray CT on braided composites, to
date, it has been used to monitor the tensile failure of braided SiC/SiC ceramic matrix
composite tube 164. The accumulation of circumferential and in-plane cracks was
monitored and damage initiation was found to be preferentially close to macro-pores at
the tow interface. However, studies on the damage evolution mechanisms of braided fibre
reinforced polymer composites under in-situ loading have not been reported before.
In this paper, 1/1 (diamond pattern) 45° braided carbon fibre/epoxy composite tubes were
prepared for torsion testing. Time-lapse synchrotron X-ray CT imaging was performed
during a torsion test to assess the extent of damage as a function of torsional strain. The
sequence of events leading to failure under increasing twist angle/shear strain was tracked

Chapter 5 Damage evolution in braided composite tubes under torsion
90
through the time-lapse sequence. This project aims to bridge the gap in knowledge
between the macro-mechanical behaviour and the micro-mechanical damage mechanisms
so as to correlate the braid structure with the damage mechanisms.
5.2 Materials and methods
5.2.1 Preparation of CFRP tube samples
The CFRP tubes studied in this paper were manufactured from preforms braided on a 48
carrier maypole braiding machine (Cobra braiding machinery Ltd). T700SC-12K-60E
carbon fibre tows were braided onto a 10 mm-diameter steel mandrel (pre-treated with
release agent to aid demoulding) at a braid angle of 45° in the diamond pattern. The crimp
value of this braid structure measured from the CT images is 6.3±0.5 %. The composite
tubes were manufactured by infusing IN2/AT30 epoxy resin into the braid by vacuum
assisted resin infusion, followed by curing at 100 °C for 3 hours. The resulting single-
layer braid CFRP tube had an inner diameter, 𝑑𝐼𝐷, of 10 mm and a wall thickness of ~1.3
mm (𝑟𝑂𝐷 = 6.3 𝑚𝑚). The fibre volume fraction measured from the X-ray CT images is
about 40.6% (the relatively low fibre volume fraction is because of the resin rich areas at
the outer circumference of the tube, which is there in order to obtain a uniform wall
thickness). The composite tubes were cut into test pieces with a diamond cutter and end
tabs were applied by gluing the tube ends with epoxy adhesive (3M™ Scotch-Weld™ EC-
9323 B/A) between a steel insert and outer sleeve. With this arrangement the gauge
length, L, was 15 mm and the total length of the samples was 55 mm including the end
tabs.
5.2.2 Torsional testing
The in-situ tests were performed on the Deben-Manchester Open Frame (tension-torsion)
Rig (OFR) having a torque capacity of 100 Nm and an axial load capacity of ±10kN.
Before the in-situ experiment, torsion tests of the braided composite tubes were
performed on Instron 8802 to confirm the repeatability of the observed behaviour and a
typical Instron tested shear stress-strain curve is shown in Figure 5.2 (green line). The
OFR is noteworthy in that the two grips can be rotated independently to apply torsion, or
in concert, so as to rotate the sample for X-ray scanning without having to rotate the whole
rig. This means that the support arms remain stationary and so do not interrupt the X-ray

Chapter 5 Damage evolution in braided composite tubes under torsion
91
beam during the rotation. Figure 5.1 shows the experimental set-up mounted on the
synchrotron beamline. The tabbed sample was fixed in the grips by four M4 bolts, and
the whole fixture then bolted on the OFR. The sample was loaded under torsion by
rotating the top grip relative to the bottom grip while maintaining zero axial load under
load control. The torsion test was interrupted at eight stages to perform X-ray CT imaging
(see Figure 5.2). The composite mean shear stress, 𝜏̅, and shear strain, �̅�, were inferred
from the torque, T, and the rotation angle of the top grip relative to the bottom, 𝜑𝑟𝑎𝑑 using
Equations 5.2 and 5.3. Equation 5.2 is calculated from Equation 5.1, where the sum
moment caused by the mean shear stress equals the torque applied on the specimen. In
Equation 5.1, r is the radius of the annular element on the cross-section of the specimen,
dA is the area of the annular element, dr and dθ are the thickness and angle of the annular
element, respectively.
𝑇 = ∬ 𝑟𝜏̅d𝐴 = ∫ ∫ 𝜏̅𝑟2d𝑟d𝜃𝑟𝑂𝐷
𝑟𝐼𝐷
2𝜋
0𝐴
Equation 5.1
𝜏̅ =3𝑇
2𝜋(𝑟𝑂𝐷3 − 𝑟𝐼𝐷
3 ) Equation 5.2
�̅� =�̅� × 𝜑rad
𝐿 Equation 5.3
Figure 5.1 Photograph of the experimental set-up on the I13-2 beamline at Diamond Light
Source, showing the in-situ torsional loading of the composite by the open frame rig
positioned on the sample table, the rotating grips can be seen in the magnified insert.

Chapter 5 Damage evolution in braided composite tubes under torsion
92
Here, the torque is applied to the CFRP tube via the steel end tabs. As a result, the rotation
recorded by the grips is likely to be an overestimate of that applied to the gauge length.
Moreover, the small diameter and short gauge length of the specimen geometry make it
not feasible to use attachable strain gauges to measure the strain accurately. Since the
primary aim of this study is not to precisely measure the torsional or shear stress-strain
response, but rather to study the damage sequence thus incurred, the shear stress-strain
response was corrected based on our ex-situ testing results obtained on an Instron 8802
testing frame so as to be indicative of the actual stress/strain experienced by the gauge
section of the braided composite tube*.
Figure 5.2 Torsional shear stress – strain plot of the braided CFRP reported here, showing
black points at which the test was interrupted, the load relaxed (marked in black) and the
X-ray CT scans were undertaken. The levels of inter-tow debonding (blue) and intra-tow
cracking (red) damage were quantified as a function of shear strain. The torsional shear
stress-strain curves of the samples with the same geometry obtained from an Instron test
(green) and a repeating in-situ test (orange) were also plotted here.
* Mechanical testing machines have inherent compliance which can lead to larger calculated shear strains
than actual values. This effect was taken into account for the next two articles (Chapters 6 and 7) by
accounting for the system compliance in the calculation, after the current article was published. The shear
strain levels before and after compliance correction for the in-situ sample in this article are listed as below:
In-situ steps S0 S1 S2 S3 S4 S5 S6 S7 S8
Shear strain (%) Before correction 0 0.5 1.0 1.5 2.0 2.5 3.2 3.9 4.9
After correction 0 0.4 0.7 1.1 1.6 2.0 2.8 3.5 4.5

Chapter 5 Damage evolution in braided composite tubes under torsion
93
5.2.3 Time-lapse synchrotron radiation X-ray CT
Time-lapse X-ray CT was performed on the Diamond-Manchester Imaging Beamline
I13-2 at the Diamond Light Source (DLS). A parallel polychromatic ‘pink’ (20-24 keV)
beam was used for imaging. The centre-of-rotation axis was deliberately located off-
centre to double the lateral field-of-view 109. As a result the whole width of the composite
tube could be imaged at the designated pixel size (2.3 µm). In each CT scan, 9000
projections were taken at an exposure time of 0.1 s over 360° rotation in fly-scan mode.
The acquired projections were reconstructed into 2D slices using a python code 157. The
pre-processing pipeline incorporated the following elements 156: 1) distortion correction;
2) converting 0-360° sinograms to 0-180° sinograms; 3) zinger removal; 4) blob removal;
5) ring removal. Then the GRIDEC algorithm was used for reconstruction 158. 3D image
analysis, including Image filtering, segmentation and 3D visualisation of the
reconstructed volumes was performed using Avizo 9.5 software. The sample was
scanned in the unstrained (S0) state and at 8 levels of torsional strain (S1-S8) as
represented in Figure 5.2. To further validate the representativeness of the scanned in-situ
sample, a repeating sample has also been tested on the OFR rig, as shown in Figure 5.2
(purple line). The observed mechanical performance and damage behaviour of the
repeating sample is resembles that of the sample presented in this paper.
5.3 Results
The sequence (S0-S8) of high-resolution X-ray CT volumes enables the changes in
microstructure and the accumulation of damage in the braided CFRP tube to be visualised
under torsion in 3D non-destructively. Figure 5.3 shows typical virtual XY (hoop) and
XZ (longitudinal) cross-sections for the CFRP tube at �̅� = 3.2% (S6). For clarity the ±45°
braided tows are falsely colour-coded with the +45° tows rendered in yellow and the -45°
tows in green. The interlaced +45° and -45° tows give rise to the three characteristic
sections in the hoop and longitudinal orientations with the +45° tows lying towards the
exterior, the -45° tows towards the exterior and a section where both tows weave from
exterior to interior as shown in Figure 5.3 (b-d) and (f-h). Under torsional load, it is
observed that the braided tube wall deforms into a wavy profile, and this waviness is more
severe in the hoop sections than in the longitudinal sections. In the X-ray CT scans cracks
appear as dark regions because of the low X-ray attenuation through air. Typical damage

Chapter 5 Damage evolution in braided composite tubes under torsion
94
modes, including intra-tow cracking, inter-tow debonding and fibre micro-buckling are
evident at this loading stage.
Figure 5.3 X-ray CT images of the CFRP tube at �̅� = 3.2% (S6). 3D volume rendering
illustrating the positions of the (a) XY and (e) XZ sections. (b-d) Virtual (hoop) XY
sections and (f-h), virtual XZ (longitudinal) sections with +45° tows shaded in yellow and
-45° in green, showing the interlacing tow arrangement and typical damage modes
observed.
Of course both the +45° and -45° tows intersect the hoop and longitudinal sections at
approximately 45° and so these sections may therefore not be the best slices to view the
behaviour of the fibres. X-ray CT provides the benefit of enabling virtually slices to be
viewed ‘cut’ at any desired angle non-destructively. This enables us to select and view
virtual sections that run parallel and perpendicular to the +45° and -45° tows. Figure 5.4(a)
shows the evolution of a slice parallel to a +45° (yellow, tow 1) tow and perpendicular to
three -45° (green) tows with increasing levels of torsional strain, while Fig. 4(b) shows
the evolution of a slice parallel to a -45° (green, tow 2) tow and perpendicular to four +45°
(yellow) tows. Due to the applied torsion/shear, the former plane is also approximately in
a state of in-plane tension and out-of-plane compression, whereas the latter is in in-plane
compression and out-of-plane tension (shown schematically in Figure 5.4(a) with red and
blue arrows). While these two sections cannot fully express the 3D nature of the damage
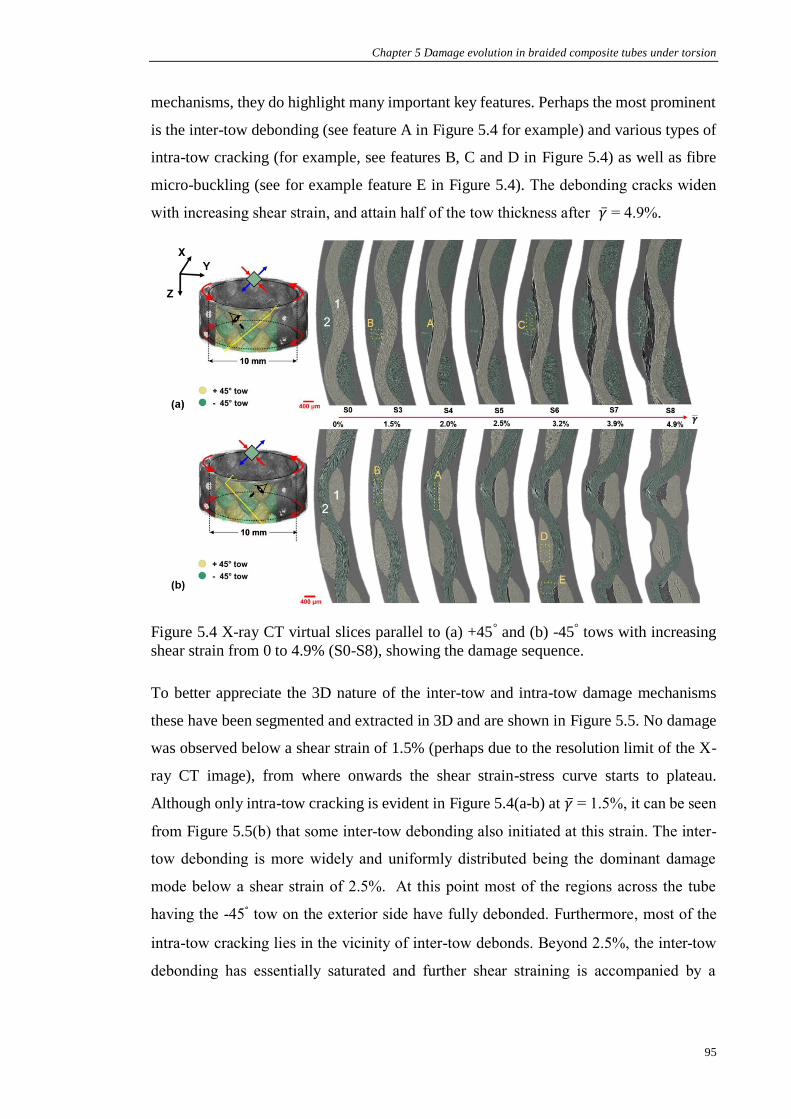
Chapter 5 Damage evolution in braided composite tubes under torsion
95
mechanisms, they do highlight many important key features. Perhaps the most prominent
is the inter-tow debonding (see feature A in Figure 5.4 for example) and various types of
intra-tow cracking (for example, see features B, C and D in Figure 5.4) as well as fibre
micro-buckling (see for example feature E in Figure 5.4). The debonding cracks widen
with increasing shear strain, and attain half of the tow thickness after �̅� = 4.9%.
Figure 5.4 X-ray CT virtual slices parallel to (a) +45° and (b) -45° tows with increasing
shear strain from 0 to 4.9% (S0-S8), showing the damage sequence.
To better appreciate the 3D nature of the inter-tow and intra-tow damage mechanisms
these have been segmented and extracted in 3D and are shown in Figure 5.5. No damage
was observed below a shear strain of 1.5% (perhaps due to the resolution limit of the X-
ray CT image), from where onwards the shear strain-stress curve starts to plateau.
Although only intra-tow cracking is evident in Figure 5.4(a-b) at �̅� = 1.5%, it can be seen
from Figure 5.5(b) that some inter-tow debonding also initiated at this strain. The inter-
tow debonding is more widely and uniformly distributed being the dominant damage
mode below a shear strain of 2.5%. At this point most of the regions across the tube
having the -45° tow on the exterior side have fully debonded. Furthermore, most of the
intra-tow cracking lies in the vicinity of inter-tow debonds. Beyond 2.5%, the inter-tow
debonding has essentially saturated and further shear straining is accompanied by a

Chapter 5 Damage evolution in braided composite tubes under torsion
96
further opening of these cracks as the -45° tows pop/buckle outwards and this gives rise
to extensive intra-tow cracking, as shown in Figure 5.5(e).
The evolution of these two damage modes has been quantified based on the segmented
X-ray CT images at different stages, as presented in Figure 5.2. As inter-tow debonding
only occurs at the interfacial area between ±45° tows, the fraction of inter-tow debonding
area with respect to the total interfacial area has been used to examine the severity of this
damage mode. This is calculated by unwrapping the tube to a flat panel (with height equal
to the imaged tube height, thickness equal to the wall thickness and width equal to the
mean circumference of the tube) in Fiji ImageJ, followed by projecting the segmented
inter-tow debonding damage throughout the wall thickness onto one image as shown in
Figure 5.6. For damage within tows, cracks were seen to occur both transverse and along
the tube radius, thus making area fraction not a suitable parameter here. In this case, the
fraction of the intra-tow cracking damage volume with respect to the total volume of fibre
tows at the onset of the test was measured to assess the evolution of this damage mode.
In addition, to better appreciate the distribution of intra-tow cracking across the tube, the
number of damaged (with intra-tow cracking) repeating units has also been counted. In
total, the imaged FoV captured 19 repeating units and the number of damaged repeating
units at different steps was measured to be 0 up to 𝛾 ̅=1.5%, 1 at 𝛾 ̅=1.5%, 4 at 𝛾 ̅=2.0%,
10 at 𝛾 ̅=2.5% and 15 at 𝛾 ̅=3.2%. All the above values were measured up to shear strain
of 3.2%, because beyond this strain level the -45° tows deformed severely and interfacial
regions contracted transversely, as can be seen in Figure 5.4(b). At the shear strain of
3.2%, the area fraction of inter-tow debonding was measured to be 29.1% and the volume
fraction of intra-tow cracking 2.8%.
Overall the extent of damage shows a distinct periodicity according to the repeating unit
of the braided architecture. The inter-tow debonding cracks are arrested by the tow cross-
over points while the local constraint at these crimps initiates fibre micro-buckling
105under the increasing compressive stress in the -45° tows. Slight irregularities in the
progress of the cracking around the ring may be due to slight differences in composite
architecture around the tube introduced during manufacturing 57 or due to some degree of
unintentional axial loading/bending.

Chapter 5 Damage evolution in braided composite tubes under torsion
97
Figure 5.5 3D volume rendering showing initiation a propagation of inter-tow debonding
(blue) and intra-tow cracking (red) as the shear strain is increased from 0 to 3.2%.
Figure 5.6 Evolution of inter-tow debonding with increasing shear strains measured from
the segmented X-ray CT images.

Chapter 5 Damage evolution in braided composite tubes under torsion
98
5.4 Discussion
The sequence and morphology of cracking are shown schematically Figure 5.7 for the X-
ray CT sections in Figure 5.4 and in 3D in the rendered segmented image of Figure 5.8
for a region of interest.
Inter-tow debonding: It is evident in Figure 5.4(a) and Figure 5.3(b) and (d) that inter-
tow debonding (feature A in Figure 5.4(a) and Figure 5.7(a)) tends to initiate in regions
where the -45° tows lie outside the +45° tows and is in agreement with the photograph of
a torsion tested composite tube in 171. This is not surprising, because were the -45° tows
not constrained by the +45° tows they would increase their coil radius under the imposed
shear (which also gives rise to compressive stress parallel to the tow – see Figure 5.7(a)
the +45° tows on the other hand would have a tendency to decrease their coil radius under
the imposed shear (which also gives rise to a tensile stress parallel to the tow – see Figure
5.7(b) were it not for the -45° tows. Consequently, the compressed -45° tow tends to pop
outwards where it they are located on the outside (see Figure 5.4(d)), while the tensile
tows tend to straighten and move inwards when they are located on the inside. It is evident
that the debonding cracks are constrained to the (approximately square) patches where
the -45° (green) tows lie on the outside (blue patch in Figure 5.8). Generally, these cracks
are widest at the centre of these patches and decrease towards the boundary where they
weave under the +45° (yellow) tows.

Chapter 5 Damage evolution in braided composite tubes under torsion
99
Figure 5.7 Schematic diagrams highlighting the different types of damage corresponding
to Figure 5.4(a-b) – parallel to (a) +45° and (b) -45° tows with increasing shear strain from
0 to 4.9% (S0-S8).
The area fraction of inter-tow debonding was quantified and plotted with respect to the
shear strain level in Figure 5.2. The debonded area fraction reached 1.0% at �̅� = 1.5%,
when this damage mode was firstly observed in this sample. As can be seen in Figure 5.2,
this value dramatically increases to 29.1% after �̅� attains 3.2%. At this stage, the
debonding damage mode propagated across almost every interfacial region where the
compressed -45° tows are on the exterior side. It is noteworthy that in principle the
maximum debonding area fraction could be 50%, as inter-tow debonding only occurred
at the interfaces where -45° tows are on the exterior side, which accounts for 50% of the
total interfacial area between tows. Considering the tow cross-over points, this value
should be less than 50%.
Intra-tow cracks: Radial intra-tow cracks tend to initiate in the -45° (green) tows in the
exterior locations due to transverse tension (feature B in Figure 5.4(a) and Figure 5.7(a)).
These are analogous to transverse ply cracks in traditional cross-ply laminate tests 172.
Their geometry in 3D is shown by the darker purple cracks in Figure 5.8. Upon further
torsional strain in-plane intra-tow cracks form in the -45° tows induced by shear stress
(feature C in Figure 5.4 and Figure 5.7. They tend to initiate under the shear imposed by

Chapter 5 Damage evolution in braided composite tubes under torsion
100
the neighbouring +45° tows and do not penetrate as far as the centre of the tow (see the
lighter purple crack in Figure 5.8). In addition in-plane cracks also form in the +45° tows
(feature D in Figure 5.4 and Figure 5.7) and their 3D morphology can be seen in Figure
5.8 (salmon coloured). These cracks form at the later stage of the torsion test, and are
caused by the transverse compression imposed by the largely deformed neighbouring -
45° tows. It can also be seen that intra-tow cracks tend to preferably form in the -45°
(green) tows at early stages; while intra-tow cracks in +45° (yellow) tows dominate the
significant increase in intra-tow crack density at later stages. This also resulted in the
increase in the volume fraction of all intra-tow cracking after shear strain attained 2.5%
as shown in Figure 5.2, but still the damaged volume fraction is relatively small.
Nevertheless, 15 out of 19 repeating units were observed to have been damaged with
intra-tow cracking when shear strain approached 3.2% indicates that this damage mode
is well distributed across the tube instead of being localised.
Figure 5.8 3D volume rendering of the damage at �̅� = 3.2% showing the relative spatial
distribution of inter-tow debonding as well as different types of intra-tow cracks.

Chapter 5 Damage evolution in braided composite tubes under torsion
101
Figure 5.9. Magnified views of a virtual section along -45° tows with increasing shear
strain, showing the formation a kink band caused by axial compression and intra-tow
cracking in the +45 tows caused by transverse compression.
Fibre micro-buckling/kinking: During the later stages of the torsion testing the
straightening (de-crimping) of the tensile strained +45° (yellow) tows and the increased
crimping of the compressively strained -45° (green) tows causes fibre micro-buckling of
the -45° tows in the vicinity of the tow cross-over regions as well as multiple splitting
(intra-tow crack coloured gold in Figure 5.8) along the fibres of the -45° tows. As
discussed above, the intra-tow cracks in +45° tows caused by transverse compression
imposed from the -45° tows widen with increased torsional strain. Moreover, the highly
micro-buckled -45° fibres start to fracture resulting in the formation of kink bands (see
Figure 5.9). As reported in studies of the axial compressive failure of unidirectional
composites, the formation of kink bands means the full loss of strength of the kinked
fibres 27, 173. Micro-buckling was also identified as the torsional failure mode of glass
fibre/epoxy braided composite tubes of various braid angles 56.
Damage sequence under torsion: The following damage sequence is identified based
on the observations in the tested 1/1 45° braided composite tube. Damage initiates in the
form of intra-tow cracks in -45° tows and inter-tow debonding between the bias tows. The

Chapter 5 Damage evolution in braided composite tubes under torsion
102
two damage modes occurred almost simultaneously at the early stage (�̅� = 1.5%). Due to
the resolution limit in time of the current interrupted in-situ study (each X-ray CT scan
takes ~1 hour), the sequence between the above two damage modes was not captured.
Inter-tow debonding propagates across the braided tube and saturates (below a shear
strain of 2.5%) before the extensive occurrence of intra-tow cracks in both ±45° tows.
This is followed by fibre micro-buckling and kink-band formation of -45° fibres close to
tow cross-over points due to compression parallel to the fibres.
5.5 Conclusions
With the aid of time-lapse synchrotron X-ray CT and in-situ loading, the real-time
damage evolution in braided CFRP under torsion has been reported for the first time. The
3D damage morphology and distribution within a representative region of interest and
also across the 1/1(diamond) 45° braided composite tube have been assessed based on a
time-series of 2D and 3D images. The various damage modes together with the damage
sequence have been analysed in relation to the braid structure. With the applied torque,
the resulting shear stress gives rise to tensile stress parallel to the fibres in +45° tows,
whereas compressive stress is induced along the fibres in -45° tows. We found that the
progressive damage evolution under torsion initiates in the form of inter-tow debonding
and intra-tow matrix cracking, followed by fibre micro-buckling and kink-band formation
at tow cross-over points. The evolution of inter-tow debonding and intra-tow cracking
have been quantitatively investigated based on X-ray CT results. After shear strain
reached 1.5%, the area fraction of inter-tow debonds was found to increase significantly.
At shear strain of 3.2%, the debonded area fraction attained 29.1%. For intra-tow cracks,
although the volume fraction of this damage mode was relatively small (2.8%), it was
found to be well distributed across the composite tube. Overall the extent of damage
shows a distinct periodicity according to the repeating unit of the braided architecture.
The interlacing structure of braided composite is beneficial in that inter-tow debonding
damage zones tend to be arrested between the tow cross-over points, which helps to avoid
large-scale damage propagation and potentially delays the detrimental failure. However,
under further torsional loads, the crimp at tow cross-over points acts as a weak point for
the occurrence of fibre micro-buckling due the compressive stress along fibres in -45°

Chapter 5 Damage evolution in braided composite tubes under torsion
103
tows. Therefore, tow cross-over is identified as a key structural feature under torsion that
could on one hand delay gross debonding propagation, while on the other hand initiate
fibre micro-buckling damage mode that will cause significant structural degradation in
the set of -45° tows in the braided tube. The current work focused on diamond 45°braided
composite. The influence of different braid architectures on torsional damage evolution
will be reported in a future paper.
Acknowledgments
We would like to acknowledge Diamond Light Source for the beamtime granted via the
Diamond-Manchester Collaboration. We are grateful to the support from staff at I13-2
DLS, especially Shashidhara Marathe, Malta Storm, and Kaz Wanelik, and Ed
Williamson-Brown and David Beales from Deben UK Ltd. We acknowledge the
Engineering and Physical Science Research Council (EPSRC) for funding the Henry
Moseley X-ray Imaging Facility through grants (EP/F007906/1, EP/F001452/1,
EP/I02249X, EP/M010619/1, EP/F028431/1, and EP/M022498/1) which is part of the
Henry Royce Institute for Advanced Materials funded by EP/R00661X. PJW
acknowledges support from the European Research Council grant No. 695638 CORREL-
CT.

Chapter 6 Effect of open-holes on the torsional performance of braided CFRP tubes
104
6. Effect of open-holes on the torsional
performance of braided CFRP tubes (Article
2)
Author contribution statement:
Yuan Chai – main investigator of this research who conceived the detailed idea, designed
the experiments, submitted the beam time proposal, undertook the experiments, data
analysis, data interpretation and wrote up the manuscript draft.
Ying Wang – supported in the beamtime experiment, suggested on data analysis and
provided comments on data interpretation.
Zeshan Yousaf – prepared the samples for mechanical testing and supported in the
beamtime experiment.
Prasad Potluri – suggested on experiment design and provided comments on data
interpretation and manuscript draft.
Philip J. Withers – conceived the overall project ideas, advised on data analysis and
provided comments on data interpretation and manuscript draft.
Note: a version of this chapter will be submitted to Composites Parts B: Engineering:
Chai et al. (2021). Effect of open-holes on the torsional performance of braided CFRP tubes.

Chapter 6 Effect of open-holes on the torsional performance of braided CFRP tubes
105
Effect of open-holes on the torsional performance of
braided CFRP tubes
Yuan Chaia, b, Ying Wanga, Zeshan Yousafb, Prasad Potlurib and Philip J. Withersa
a Henry Mosley X-ray Imaging Facility, Henry Royce Institute, Department of
Materials, The University of Manchester, Manchester, UK M13 9PL b Northwest Composites Centre, Department of Materials, The University of
Manchester, Manchester, UK M13 9PL
Abstract
The torsional behaviour of open-hole braided carbon fibre reinforced polymer (CFRP)
tubes have been investigated using stereo digital image correlation (DIC) and in-situ
synchrotron X-ray computed tomography (CT). The presence of the open-hole degrades
the shear stiffness and the shear strength of 1/1-45° braided CFRP tubes, in our case by
~11% and ~17%, respectively. In addition, some dependency on the hole location with
respect to the braid pattern has been observed with the shear strength decrement being
slightly more significant if the tow cross-over is more severely damaged when
introducing the hole. Moreover, with increasing straining the distribution of shear strain
concentration measured by stereo DIC correlates well with the damage distribution
observed by X-ray CT. It is found that damage initiates as early as at a mean shear strain
of 0.38% for the open-hole specimen. This damage initiates from the rim of the hole and
occurs by simultaneous in-plane fibre micro-buckling accompanied by radial (through-
the-thickness) inter-tow debonding, and out-of-plane fibre micro-buckling accompanied
by circumferential inter-tow debonding. In this context, the open-hole not only causes
strain concentration around the hole, but also reduces the lateral constraint thus promoting
the early onset of fibre micro-buckling in fibres (-45°) under shear induced axial
compression. Our study shows that from a design viewpoint, the tow cross-over regions
of the braid pattern should ideally be avoided when introducing holes into braided
composite structures, and lateral constraint to the fibres at the rim of the hole should be
enhanced to delay the onset of fibre micro-buckling.
Keywords
Textile composites; Notch sensitivity; Stress concentrations; Non-destructive testing; X-
ray computed tomography

Chapter 6 Effect of open-holes on the torsional performance of braided CFRP tubes
106
6.1 Introduction
The performance of open-hole (circular) structures are of interest both because they are
critical to fastening systems 174, 175, but also a means of understanding the damage
tolerance and notch sensitivity of composite materials more generally 176. Introducing a
drilled hole reduces the load-bearing capacity of fibre reinforced polymers (FRPs)
directly by introducing site of structural discontinuity and stress concentration 177.
Compared with nominally isotropic materials, such as metals, the effect of stress
concentration caused by an open hole in FRPs is more complex due to the varying fabric
architecture, stacking sequence and interfaces 178. Furthermore hole drilling can introduce
microstructural damage by causing defects in reinforcing fibres, matrix cracking and
debonding/delamination around the hole, all of which are critical damage modes for FRPs
179. The combination and interaction of these defects could make the composite more
susceptible to damage initiation and propagation 176, 180. Therefore, understanding and
quantifying the effect of an open-hole on the mechanical properties and the damage
development mechanisms in composite performance is of critical importance for safe and
reliable composite design.
In the last few decades, the effect of a circular notch on the mechanical behaviour and
failure mechanisms of laminated FRPs under tension and compression has been well
established through both experimental 181-183 and numerical 184-186 studies. The efforts
have been focused on comprehensively understanding the effects of various factors
including the fibre type 187, 188, the stacking sequence 187, 189, the hole dimension (the ratio
between sample width (w) and the diameter of the hole (d), w/d) 182, 188 and the size effects
179, 183, 190. In general, the tensile strength of an open-hole laminate can be reduced by 15-
65% of its unnotched tensile strength for quasi-isotropic and cross-ply carbon fibre
reinforced polymer (CFRP) laminates of various lay-up sequences 187, 188, and by 25-70%
of its unnotched compressive strength 191. Under tension, damage tends to initiate with
matrix cracking from the hole, followed by delamination and then fibre fractures 192, 193.
Under compression, damage nucleates with fibre micro-buckling at the 0° layers at the
sides of the hole, which is accompanied by matrix cracking in off-axis plies and
delamination between plies 191, 194.
Compared with laminated composites, textile composites are considered to be better
candidates to accommodate holes or cut-outs, as they exhibit higher resistance to large-

Chapter 6 Effect of open-holes on the torsional performance of braided CFRP tubes
107
scale matrix cracking, debonding and delamination due to the cross-over (interlacement)
of fibre tows that acts to arrest crack propagation, thus giving rise to less reduction in
strength. For instance, Liang et al. 58 reported that drilling a hole degrades the tensile
strength of the three dimensional (3D) braided CFRPs of a braid angle of ±12° by 21-
26%, whereas for a CRRP laminate of similar un-notched tensile strength as the
unnotched 3D braided CFRP, the notch induced strength degradation can be as much as
42%. However, the majority of the investigation is focused on the effect of open-hole on
the tensile performance of braided panels. Hwan et al. 59 studied the open-hole tensile
behaviour of 2/2 braided CFRP panels for three braid angles (16.5°, 18.5° and 23.4°) and
with a variety of hole dimensions (w/d ranged from 3 to 9). In general, the open-hole
tensile strength of these 2/2 braided CFRP panels is degraded by 18-56% of their
unnotched tensile strength. It was found that the open-hole tensile strength decreases with
increasing w/d, and increases with increasing braid angle. Nakai et al. 60 and Ohki et al.
61 reported that a drilled hole results in a 35% reduction in the tensile strength of flat
braided glass fibre composite panels with a braiding angle of 30°. It was found that
damage depends on properties of the interface between braided fibre tows, as damage
tends to initiate with matrix crack from the rim of the hole and develops into debonding.
A variety of non-destructive inspection techniques, such as C-scan 192, acoustic emission
190, 195, 196, edge microscopy 189, digital image correlation (DIC) 188, 189, 193, 195-200, X-ray
radiography 182, 191, 201 and X-ray computed tomography (CT) 193, 199, 202, 203, have been
employed to monitor damage events around the hole in notched FRP panels. Among
these, X-ray CT has significant advantage for the study of composite structures in that
high-resolution damage morphology can be directly observed in 3D, especially with the
aid of in-situ loading rigs, tracking the damage evolution along the time-scale becomes
feasible 107.
Braided composites are often used for non-planar structures (e.g. tubes) rather than flat
panels due to the inherent advantage of near net shape preforming of the braiding
technique 57. However, very little work has been undertaken to date to study the effect of
open-holes on the damage development of tubular shaped braided composite 204, partly
owing to the challenge in non-destructive damage characterisation of notched 3D
structures.
Recent work has been reported on the evolution of damage under torsional loading of
unnotched tubes using in-situ time-lapse synchrotron X-ray CT 107. The aim of this study

Chapter 6 Effect of open-holes on the torsional performance of braided CFRP tubes
108
is to extend this to the study of the torsional properties and damage mechanisms of open-
holes 1/1-45° braided CFRP tubes. Alongside time-lapse synchrotron X-ray CT, stereo-
DIC has been used to map the surface strain concentrations induced by the introduction
of a hole onto the braid pattern. These results are compared with previous ones on un-
notched samples 107 so as to better understand the effects of the open hole and to guide
the design of damage tolerant braided composite tubes.
6.2 Materials and Methods
6.2.1 Sample preparation
The braided CFRP composite tubes were made from Toray T700-12K carbon fibres and
IN2/AT30 epoxy resin. Firstly, a single layer two dimensions (2D) braided carbon fibre
sleeve was fabricated into the diamond (1/1) pattern with a braid angle of 45° (see Figure
6.1(a)) using a maypole braiding machine (Cobra Braiding Machinery Ltd). The braided
sleeve was then infused with epoxy resin using the vacuum assisted resin infusion (VARI)
method, followed by consolidation at 100 °C for 3 hours. The manufactured CFRP tubes,
having a 10 mm inner diameter and a wall thickness of ~1.3 mm (containing ~0.15 mm
thick resin-rich area), were cut into 55 mm long test-pieces. At the mid-length of the tube
specimens, a hole of 2 mm diameter (tow width is ~2.2 mm) was drilled along the
diameter of the tube cross-section through the walls, giving rise to an inner tube diameter
to hole diameter ratio of 5. Lengths of 20 mm at each end of the specimen were glued
into a tabbing fixture, comprising an insert and an outer shell (adapted from ASTM
standard D5448/D5448M 154), by epoxy adhesive (3M™ Scotch-Weld™ EC-9323 B/A),
giving rise to a gauge length (L) of 15 mm. Figure 6.1 (a) shows a photograph of an open-
hole test-piece.

Chapter 6 Effect of open-holes on the torsional performance of braided CFRP tubes
109
Figure 6.1 (a) Photograph of a typical open-hole 1/1-45° braided CFRP tube test-piece
with the tube axis parallel to the z axis. (b) Photograph showing the stereo DIC set-up and
a magnified view of the paint speckled tube surface (inset).
6.2.2 Torsion testing and stereo DIC
Four open-hole 1/1-45° braided CFRP tubes (OH_1, OH_2, OH_3 and OH_4) were tested
on an Instron 8802 system under pure torsion (zero axial load) at 2°/min to investigate
their torsional behaviour. The mechanical behaviour observed from Instron testing was
also used assess the repeatability of the behaviour and the representativeness of the single
in-situ time-lapse CT experiment (see Section 6.2.3). The development strain field around
the hole was mapped throughout the loading process for samples OH_1-OH_3 using a
stereo DIC system as shown in Figure 6.1(b). Prior to torsion testing, these samples
(OH_1-OH_3) were surface polished and metal paint sprayed in order to create the
speckle contrast for the DIC. The black paint was applied first as the background layer,
followed by low level coverage with white spray paint, see Figure 6.1(b). High-resolution
images of the sample surface were collected at a frame rate of 2 Hz from two LaVision
Imager E-lite cameras. The DIC analysis was performed in Davis 10.1 software (LaVision

Chapter 6 Effect of open-holes on the torsional performance of braided CFRP tubes
110
GmbH). The engineering strain was analysed based on correlating the movement of the
white speckle pattern relative to the first frame computed using a patch size of 37×37
pixels and a step size of 12 pixels. In addition, surface video was also recorded during the
loading of sample OH_4 which was neither polished nor painted, to observe the
deformation of the braid pattern on the tube surface directly (video in supplementary
materials).
In addition to measuring the strain field by stereo DIC, the overall (averaged) composite
shear stress-strain behaviour can also be inferred from the machine crosshead readings.
The mean shear stress, 𝜏̅, and shear strain, �̅�, were calculated from the torque, T, and the
rotation angle between top and bottom grips, φrad, the outer radius, rOD, the inner radius,
rID, and the mean radius, �̅�, of the tube using Equations 6.1 and 6.2 (refer to 107 for details).
Note that the twist angle was corrected by accounting for the system compliance
(estimated using a rigid steel bar of known properties) from the machine crosshead
readings.
𝜏̅ =3𝑇
2𝜋(𝑟𝑂𝐷3 − 𝑟𝐼𝐷
3 ) Equation 6.1
�̅� =�̅� × 𝜑𝑟𝑎𝑑
𝐿 Equation 6.2
6.2.3 In-situ synchrotron X-ray CT
The in-situ time-lapse X-ray imaging of the open-hole braided composite tube (OH_in-
situ) under torsion was performed at the I13-2 Diamond-Manchester beamline, Diamond
Light Source, UK. Figure 6.2 shows the experimental in-situ imaging set-up. The sample
was loaded in torsion using the Mark I Deben-Manchester Open Frame Rig (refer to 107
for details) placed along the X-ray beam path. The progressive evolution of damage was
monitored in real-time by interrupting the torsion test at five stages (stages S0-S4
highlighted as black triangles on Figure 6.3) to acquire X-ray CT scans using a parallel
polychromatic ‘pink’ (20-24 keV) beam. The centre-of-rotation axis was deliberately
located off-centre to double the lateral field-of-view (FoV) 109. As a result, the whole
width of the composite tube could be imaged at the designated pixel size (2.3 μm). For

Chapter 6 Effect of open-holes on the torsional performance of braided CFRP tubes
111
each CT scan, 9000 projections were taken at an exposure time of 0.1 s over 360° rotation
in fly-scan mode. The acquired projections (radiographs) were pre-processed using a
python code 205, then reconstructed into 32-bit float data using the GRIDEC algorithm
158. 3D image analysis was performed in Avizo 2019.2 software. The CT images were
first transformed into 8-bit (from 32-bit), followed by the application of a ‘non-local
means’ filter to remove noise.
Figure 6.2 Photograph of the set-up for the in-situ experiment on the I13-2 beamline,
Diamond Light Source, UK. The grips on the open frame rig rotate in synchrony so that
X-ray imaging could be performed while the torsional load was applied to the braided
composite tube.
6.3 Results and discussion
6.3.1 Shear stress-strain mechanical behaviour
The mechanical performance of the open-hole braided CFRP tubes has been assessed in
terms of their averaged shear stress-strain performance during torsional loading. Figure
6.3 plots the mean shear stress-strain curves of six 1/1-45° braided CFRP tubes, including
the four open-hole samples tested on the Instron (samples OH_1 - OH_4), one open-hole

Chapter 6 Effect of open-holes on the torsional performance of braided CFRP tubes
112
specimen tested incrementally during the in-situ time-lapse X-ray CT experiment (sample
OH_in-situ) and one un-notched braided tube sample.
It can be seen that the four open-hole samples exhibit high consistency before �̅� attains
1.5%, after which the shear stress trend differs. Under increasing straining, for samples
OH_1 and OH_2, the shear stress gets to the peak (ultimate shear strength) at �̅� ≈ 1.5%,
whereas the peak of samples OH_3 and OH_4 has been postponed until �̅� ≈ 2.0% with
slightly higher ultimate shear strength (3.7 MPa/4.2% higher). Furthermore, the stress
degradation of samples OH_3 and OH_4 after the peak is more gradual and smoother;
while for samples OH_1 and OH_2 the shear stress degrades in discrete small steps before
getting into the same degradation rate as samples OH_3 and OH_4. In addition, it can be
seen that the shear stress-strain behaviour of OH_in-situ (tested up to �̅� = 1.5%)
resembles that of other open-hole samples tested on Instron testing frame, thus proving
the reliability and representativeness of the observed damage initiation and early-stage
propagation mechanisms from the OH_in-situ sample.
Figure 6.3 Shear stress-strain curves of the un-notched tube (denoted reference), the four
open-hole 1/1-45° braided CFRP tubes (samples OH_1 - OH_4) tested on Instron and the
interrupted X-ray CT test (OH_in-situ).

Chapter 6 Effect of open-holes on the torsional performance of braided CFRP tubes
113
Compared with the unnotched tube sample (denoted reference), it is found that
unsurprisingly the open-hole braided tubes have lower shear stiffness and lower shear
strength. Table 6.1 summarises the shear stiffness and shear strength values of 1/1-45°
braided CFRP tubes with and without drilled holes. It can be seen that drilling holes
generally degrades the shear stiffness and the shear strength of 1/1-45° braided CFRP
tubes by 11% and 17%, respectively.
Table 6.1 Summary of shear stiffness and shear strength values for the unnotched and the
open-hole 1/1-45° braided CFRP tubes.
Braided 1/1-45° Shear Stiffness (GPa) Shear Strength (MPa)
Unnotched 9.9±0.5 106.8±2.8
Open-hole 8.8±0.3 89.1±1.9
6.3.2 Evolution of the strain field with low levels of shear strain
The strain fields for the open-hole tubes have been monitored by stereo-DIC. These have
been validated in the elastic region by comparing the strains far from the holes with the
overall strains measured by test-machine and were found to be in good agreement (�̅� is
at around the upper limit of the range). Here, the focus is on the local strain fields around
the holes.
Figure 6.4 displays the superimposed surface transverse (εxx), axial (εzz) and shear strain
(γxz) fields around the hole for samples OH_1 and OH_3 (OH_1 and OH_2 exhibit similar
surface strain fields) for the loading stages up to the applied shear strain of 0.9%, in order
to compare strain fields prior to and upon the onset of damage for the two characteristic
shear stress-strain behaviours seen in Figure 6.3. With regards to the shear strain, it is
found that OH_1 and OH_3 exhibit similar patterns of shear strain concentration at low
strains (�̅� = 0.3%), with peak values located at the top and bottom and two sides at the
periphery of the hole, as indicated by the white arrows. However, for the axial and
transverse strain components, it is interesting to note that strain concentrations distribute
as equally spaced bands across the tube rather than around the hole at �̅� = 0.3%. With
increased straining, the strain concentration around the hole becomes evident, giving rise
to locally distorted bands. It can be seen that the axial strain has similar pattern with
respect to the hole location in both samples. However, the transverse strain distributions
differ with respect to the hole position between the two samples. In OH_1 the hole is

Chapter 6 Effect of open-holes on the torsional performance of braided CFRP tubes
114
located in a column of positive transverse strain, whereas in OH_3 it sits in a negative
column.
It is interesting to note that sharp regions of strain concentration develop distant from the
hole inclined at -45° (highlighted by the ellipse in Figure 6.4(b)) for OH_3 at �̅� = 0.9%,
which lie along the same direction as the –45° braid fibre tow. Following the same
approach reported in Chai et al. 107, under the applied torque, the -45° braid tows of the
1/1-45° are under shear induced axial compression (AC) and transverse tension (TT) and
are termed as the ‘AC’ tows (marked green in Figure 6.1(a) and Figure 6.5), whereas the
+45° braid tows are under shear induced axial tension (AT) and transverse compression
(TC) and termed as ‘AT’ tows (marked yellow in Figure 6.1(a) and Figure 6.5).
The damage sequence for unnotched 1/1-45° braided CFRP tube under torsion has been
established previously 107. By comparison with that study it can be inferred that these
high-strain features correspond either to 1) intra-tow cracks in –45° AC tows caused by
transverse tension or 2) the edge of the circumferential debonding cracks between outer
–45° AC tows and inner +45° AT tows caused by the buckling of the outer –45° AC tow
under axial compression. In both cases, the location of these line-shaped strain
concentrations indicates the position of an outer -45° AC tow. As shown by the boxes on
Figure 6.4(b), it is found that these features lie in the bands of positive transverse strain
and positive axial strain. Therefore, the position of outer -45° AC tows in the braid can be
located by the repeated pattern of positive axial/transverse strain bands.
The location of the hole relative to the braid pattern was determined from the strain maps
for samples OH_1 and OH_3 and is schematically shown in Figure 6.5. For sample OH_1,
the hole is located at the cross-over point of ±45° tows, whereas for sample OH_3, it is
essentially constrained within one braid patch (outer +45° tow underlaid by inner -45°
tow). It is worth noting that the periodic braid structure with even number of tows will
give rise to the two holes (through both walls of the tube) to be located at anti-symmetric
positions. This means that if the hole is located in an outer +45° patch (yellow) on one
side, the hole will be located in an outer -45° patch (green) on the opposite side. As
reported by Mariatti et al. 206, the tensile strength of a single-ply unnotched woven CFRP
composite is degraded more by a hole located at the cross-over of warp and weft yarns
(16%) than when located within a weft/warp yarn (8%). Therefore, compared with
samples OH_3 and OH_4, the slightly lower shear strength for samples OH_1 and OH_2

Chapter 6 Effect of open-holes on the torsional performance of braided CFRP tubes
115
can be attributed to the more severely damaged tow cross-overs, highlighting the
importance of selecting the optimal hole position with respect to the braid architecture.
Figure 6.4 Surface transverse strain, axial strain and shear strain fields for samples (a)
OH_1 and (b) OH_3 at applied mean shear strains of 0, 0.3, 0.6 and 0.9% as mapped by
DIC.

Chapter 6 Effect of open-holes on the torsional performance of braided CFRP tubes
116
Figure 6.5 Schematic of the surface braid patterns of samples OH_1 and OH_3. +45° AT
tows are coloured yellow and -45° AC tows are coloured green. The position of the drilled
hole is marked by the red circle.
6.3.3 Overall damage development
In the following sections, the damage evolution mechanisms of open-hole braided tubes
are discussed generally compared with un-notched tubes of the same braid pattern.
The overall damage distribution can be inferred from the strain maps in terms of the
severe strain concentration localisation. As discussed above, sharp regions of strain
concentration have been observed in OH_3, which indicate the onset of intra-tow cracking
in -45° AC tows or at the edge of circumferential inter-tow debonding between ±45° tows.
In order to investigate damage development in more detail, the evolution of the 3D surface
shear strain field of OH_3 under increasing applied shear strain of up to 5.0% is presented
in Figure 6.6. It can be seen that after �̅� attains 2.0%, alongside that the strain
concentrations around the hole intensify, multiple sites of high strain concentration have
developed in a regular pattern. These patterned areas, as highlighted by the boxes in
Figure 6.6, can be correlated with the braid pattern. Under increasing torsional loading,
damage (indicated by high strain concentration) distributes across the tube following the
repeated pattern of the braid architecture. The highly strained regions correspond to the
cross-overs of interlacing ±45° braid tows that have opened due to the debonding of the
outer -45° tow from the inner +45° tow 107, highlighting the importance of tow cross-overs.

Chapter 6 Effect of open-holes on the torsional performance of braided CFRP tubes
117
Figure 6.6 3D surface shear strain fields measured by stereo DIC for sample OH_3 at
applied shear strain levels of 0, 1, 2, 3, 4 and 5% , illustrating the evolution of shear strain
concentrations.
The damage modes corresponding to the observed shear strain concentrations have been
further elucidated by time-lapse 3D X-ray CT images of sample OH_in-situ under load.
It can be seen in Figure 6.7 that under increasing torsional loading, the hole starts to
deform into an ellipse shape with its longer axis orienting along +45° with respect to the
axial direction due to the twisting effect, which has also been seen in the strain map in
Figure 6.6. The overall damage distribution across the tube exhibits a similar repeating
pattern to that for the shear strain concentrations observed in Figure 6.6, which is also in
accordance with the damage distribution observed in un-notched 1/1-45° braided CFRP
tube 107. However, damage seems to be more severe around the hole, especially at the
edges lying along the elongated axis of the deformed hole, where shear strain concentrates
as shown in Figure 6.6. The development of damage around the hole will be discussed in
detail in Section 6.3.5.

Chapter 6 Effect of open-holes on the torsional performance of braided CFRP tubes
118
Figure 6.7 X-ray CT 3D volume rendering of sample OH_in-situ at stages (a) S0 (�̅� =
0%) and (b) S4 (�̅� = 1.5%), showing the overall damage distribution (rendered red). The
bright particles on the tube surface were used as fiducial markers to register X-ray CT
datasets.
6.3.4 Damage evolution distant from the hole
Figure 6.8 displays the time-lapse sequence of a virtual 2D X-ray CT section oriented
parallel to the tow (fibre) directions in regions not in direct contact with the hole. It can
be seen that damage initiates by intra-tow cracks in -45° AC tows (Feature A) and
circumferential inter-tow debonding between the outermost -45° tow and inner +45° tow
(Feature B), which are followed by out-of-plane (radial) fibre micro-buckling of the fibres
in the -45° AC tows (Feature C). The damage sequence in this region is in accordance
with that for the unnotched reference 1/1-45° braided CFRP tube. However, damage has
occurred at lower shear strain levels, especially with respect to fibre micro-buckling. For
the unnotched reference tube, out-of-plane fibre micro-buckling of -45° fibres due to the
increasing crimp under the axial compressive stress was not observed until the shear strain
reached 2.0% (adapted from 107), whereas for the open-hole structure it occurs earlier, at
1.5% strain. It can be seen that the -45° tow, in which early out-of-plane fibre micro-
buckling has occurred, lies next to the hole, supporting the conclusion that this is caused
by the strain concentration and load redistribution from notched tows into adjacent tows
resulting from the hole. However, at these low strains (�̅� = 1.5%), the micro-buckled
fibres have not yet fractured and to form distinct kink bands .

Chapter 6 Effect of open-holes on the torsional performance of braided CFRP tubes
119
Figure 6.8 Time-lapse sequence for X-ray CT virtual slices cut (a) parallel to a +45° AT
tow (tinted yellow) and (b) parallel to a -45° AC tow (tinted green) of sample OH_in-situ
with increasing shear strain from 0 to 1.5%, showing the early stages of damage
accumulation.
6.3.5 Damage initiation and propagation local to the hole
Given that shear strain concentrates around the hole (as discussed in Sections 6.3.2 and
6.3.3), it is worthwhile to focus on the development of damage around the rim of the hole.
Figure 6.9 shows magnified views of the hole region under increasing applied shear strain.
It is evident from the 3D rendering that the hole was drilled mostly on the overlapped
±45° tows but also slightly covering the tow cross-overs. As shown in Figure 6.9, fibre
micro-buckling has occurred in the -45° AC tow, that was notched by introducing the
open-hole, as early as �̅� = 0.38% (S1). In this segment of the -45° tow at the edge of the
hole, the fibre micro-buckling damage has both in-plane and out-of-plane components,

Chapter 6 Effect of open-holes on the torsional performance of braided CFRP tubes
120
similar to that reported in notched unidirectional CFRP loaded under bending 105. The
simultaneous in-plane and out-of-plane fibre micro-buckling is caused by the reduced
lateral constraint local to the hole/notch surface and the side/inner surface. It can be seen
that in-plane (circumferential) fibre micro-buckling has initiated near the hole surface and
the fibres have buckled into the centre of the hole (highlighted by the red arrows). It
should be noted that in-plane fibre micro-buckling was not observed for un-notched 1/1-
45° braided CFRP tube. In this same region, out-of-plane (radial) fibre micro-buckling
has also developed from the inner surface of the tube at the notch edge into the tube central
axis (highlighted by the blue arrows). As mentioned above, this out-of-plane fibre micro-
buckling damage mode also occurs in the unnotched regions of the open-hole sample and
in the unnotched reference sample although at much higher shear strains. However, in the
absence of the notch, the out-of-plane fibre micro-buckling tends to develop close to tow
cross-overs because of the local higher crimp. This suggests that the reduced lateral
support imposed by the hole plays a more important role in triggering the onset of fibre
micro-buckling than the level of crimp.
Figure 6.9 Time-lapse sequence for the inner and outer views of the 3D volume rendered
X-ray CT image around the hole, showing damage development from the hole. The blue
arrows indicate the direction of out-of-plane (radial) fibre micro-buckling, and the red
arrows indicate the direction of in-plane (circumferential) fibre micro-buckling.

Chapter 6 Effect of open-holes on the torsional performance of braided CFRP tubes
121
Figure 6.10 Time-lapse sequence for X-ray CT virtual slices showing (a) in-plane fibre
micro-buckling close to the hole and (b) out-of-plane fibre micro-buckling (yellow (AT)
and green (AC) tinting added to black and white sections for clarity).
The detailed morphology and evolution of in-plane and out-of-plane fibre micro-buckling
from the rim of the hole is displayed in the time sequence of virtual sections in Figure
6.10. In the absence of the hole, the inter-tow debonding cracks are typically
circumferential and occur where the −45° AC tows lie on the outside of the tube. This is
because that the outer -45° AC tow tends to pop/buckle outwards under axial compression
and the inner +45° AT tow tends to move inwards as they become straightened under axial
tension. At the rim of the hole, it is found that two new modes of inter-tow debonding
cracks have occurred at S1 (�̅� = 0.38%) alongside the onset of fibre micro-buckling,
namely 1) radial (through-the-thickness) inter-tow debonding between adjacent ±45° tows
that accompanies the in-plane fibre micro-buckling (see Figure 6.10(a)), and 2)
Chapter 6 Effect of open-holes on the torsional performance of braided CFRP tubes
122
circumferential inter-tow debonding between the outer +45° tow and the inner -45° tow
that accompanies the out-of-plane fibre micro-buckling (see Figure 6.10(b)). It is found
that both the in-plane and out-of-plane fibre micro-buckling observed here are analogous
to the type 2 (chevron (V-shaped)) fibre micro-buckling observed in unidirectional
CFRPs under axial compression 105. The early onset of fibre micro-buckling highlights
the importance of the resistance to axial compressive failure of AC tows in the braid
structure in controlling the onset of open-hole torsional failure. Under increased applied
shear strain, the micro-buckled fibres tend to fracture at the maximum bending point.
However, it is not certain whether kink bands have formed due to the 3D nature of the
deformation and the limit in image resolution.
6.4 Conclusions
In this study, we have investigated the torsional behaviour of open-hole 1/1-45° braided
CFRP tubes by time-lapse X-ray CT during torsional testing to evaluate the effect of the
open-hole on the mechanical properties and the damage initiation and propagation
mechanisms. The key findings can be summarised as follows,
1. It is found that the presence of the open-hole generally degrades the shear stiffness
and the shear strength of 1/1-45° braided CFRP tubes, in our case by ~11% and 17%,
respectively. In addition, different drilling positions of the hole with respect to the
braid pattern affect the propagation of damage and lead to a scatter in the shear
strength. If the tow cross-over is more severely damaged during notching, the shear
strength decrement is greater.
2. The strain concentration around the hole has been revealed by stereo digital image
correlation (DIC). As one might expect, shear strain concentrates around the hole
from the onset of loading, whereas for axial and transverse strains, it is interesting to
note that strain concentrations firstly localise in equally spaced bands across the tube
prior to the formation of high-strain regions around the hole. Moreover, the regularly
patterned distribution of axial and transverse strain is found to be influenced by the
braid pattern.
3. The damage mechanisms and their sequence have been revealed by time-lapse X-ray
CT. The main damage modes in the open-hole tube include in-plane and out-of-plane

Chapter 6 Effect of open-holes on the torsional performance of braided CFRP tubes
123
fibre micro-buckling, radial and circumferential inter-tow debonding, and intra-tow
cracking. It is noteworthy that the open-hole not only causes strain concentration
around the hole, but also reduces the lateral constraint thus promoting the early onset
(at a mean shear strain of 0.38%) of fibre micro-buckling in fibres (-45° AC tow)
under shear induced axial compression, which could contribute to the reduction in
shear strength.
The above key findings provide insights into the design of open-hole braided components.
The location of holes with respect to the braid pattern is critical. For better torsional
performance, holes should ideally be positioned such that they are constrained within one
braid patch, avoiding the tow cross-over regions of the braid structure. In addition, it is
found in the current study that the lack of lateral constraint of the AC tows is critical in
terms of damage initiation local to the hole in the form of fibre micro-buckling. This
highlights the importance to tailor the structural design around the rim of the hole to delay
the onset of fibre micro-buckling.
Acknowledgement
We acknowledge Diamond Light Source (DLS) for time on the Diamond Manchester
beamline I3-2 under proposals MT13704 and MT18197 granted via the Diamond-
Manchester Collaboration. We are grateful to the support from staff at DLS, especially
Nghia Vo, Shashidhara Marathe, Malte Storm, and Kaz Wanelik, and Ed Williamson-
Brown and David Beales from Deben UK Ltd. We acknowledge the Engineering and
Physical Science Research Council (EPSRC) for funding the Henry Moseley X-ray
Imaging Facility through grants (EP/F007906/1, EP/F001452/1, EP/I02249X,
EP/M010619/1, EP/F028431/1, and EP/M022498/1) which is part of the Henry Royce
Institute for Advanced Materials funded by EP/R00661X. PJW acknowledges support
from the European Research Council grant No. 695638 CORREL-CT.

Chapter 7 Following the effect of braid architecture on performance and damage of CFRP tubes
124
7. Following the effect of braid architecture on
performance and damage of carbon
fibre/epoxy composite tubes during torsional
straining (Article 3)
Author contribution statement:
Yuan Chai – main investigator of this research who conceived the detailed idea, designed
the experiments, submitted the beam time proposal, undertook the experiments, data
analysis, data interpretation and wrote up the manuscript draft.
Ying Wang – supported in the beamtime experiment, suggested on data analysis and provided comments on data interpretation.
Zeshan Yousaf – prepared the samples for mechanical testing.
Malte Storm – supported in the beamtime experiment.
Nghia T. Vo – supported in image reconstruction.
Kaz Wanelik – supported in the beamtime experiment.
Timothy L. Burnett – supported in the beamtime experiment.
Prasad Potluri – suggested on experiment design and provided comments on data
interpretation and manuscript draft.
Philip J. Withers – conceived the overall project ideas, advised on data analysis and
provided comments on data interpretation and manuscript draft.
Note: a version of this chapter has been published in Composites Science and Technology,
Chai et al. (2020). Following the effect of braid architecture on performance and damage of
carbon fibre/epoxy composite tubes during torsional straining. Composites Science and
Technology, 200, 108451. https://doi.org/10.1016/j.compscitech.2020.108451

Chapter 7 Following the effect of braid architecture on performance and damage of CFRP tubes
125
Following the effect of braid architecture on
performance and damage of carbon fibre/epoxy
composite tubes during torsional straining
Yuan Chaia,b, Ying Wanga, Zeshan Yousafb, Malte Stormc, Nghia T. Voc, Kaz Wanelikc,
Timothy L. Burnetta, Prasad Potlurib and Philip J. Withersa
a Henry Moseley X-ray Imaging Facility, Henry Royce Institute, Department of
Materials, The University of Manchester, Manchester, M13 9PL, UK
b Robotics and Textile Composites Group, Northwest Composites Centre, Department
of Materials, The University of Manchester, Manchester, M13 9PL, UK
c Diamond Light Source, Harwell Science and Innovation Campus, Didcot, OX11 0DE,
UK
Abstract
The torsional performance of bi-axially braided carbon fibre reinforced polymer (CFRP)
tubes as a function of braid architecture is investigated. It is found that for a given braid
pattern, the 45° braided CFRP tubes have higher shear moduli and lower shear strength
than the 35° braids. In general, 2/2 (regular) braided CFRP tubes exhibit both higher shear
strength and higher shear modulus than 1/1 (diamond) braids. However, beyond the peak
load, the shear strength of 2/2 braided CFRPs exhibits sudden, steep drops, resulting in a
lower remnant shear strength than 1/1 structures after the shear strain exceeds
4.5%. Moreover, the damage evolution is monitored in-situ by synchrotron X-
ray computed tomography during torsional straining. It showed that for a 2/2 structure,
inter-tow debonded regions are vertically interconnected allowing rapid crack
propagation and strength drops, whereas for the 1/1 braid they are distributed in a chequer
board causing more gradual loss of strength. The fibre/matrix interfacial strength and tow
cross-over density play key roles in the torsional failure of 1/1 and 2/2 braided CFRP
tubes, as the former controls damage initiation and the latter controls damage
propagation.
Keywords
Textile composites; Debonding; Damage mechanics; X-ray computed tomography;
Braiding

Chapter 7 Following the effect of braid architecture on performance and damage of CFRP tubes
126
7.1 Introduction
In the drive to reduce carbon emission and improve energy efficiency in industries such
as aerospace and automotive, employing light-weight materials is an attractive approach
207. Carbon fibre reinforced polymers (CFRPs) exhibit higher strength-to-weight and
stiffness-to-weight ratios than metals and alloys, as well as offereing other advantages
including high corrossion resistance attractive to the oil and gas industry for example 208.
Thus, CFRP structures are increasingly being considered as candidates to replace metal
components. For example, in the Airbus A350 XWB and Boeing 787 aircraft more than
50% (by weight) of the components are made of CFRPs 17. Moreover, the application of
CFRPs has expanded their consideration from secondary structures to load-bearing
structures. Composite structures also offer a wide range of gometries and archetectures,
from laminated panels to complex three-dimensional (3D) woven/braided architectures.
Among these, tubular structures are widely used in industrial applications, such as the
drive shafts in hybrid/electric automobiles, drive shafts for aircraft control surfaces, the
body frame of drones, the casing of aero-engines and pipelines in the oil and gas industry.
For the safe and reliable application of tubular CFRPs, there is a need to further our
understanding of the dependence of the mechanical performance on the fibre architecture
for this materials class.
Braided and filament wound architectures are well suited to tubular structures. Filament
wound structures are much more susceptible to large-scale delamination than braided
ones 22. Two-dimensional (2D) bi-axial braiding is a highly automated technique and is
thus commonly used 209. It involves interlacing fibre tows oriented at a braiding angle of
±θ with respect to the long axis of the tube continuously in a helix. A number of studies
have reported the failure mechanisms of braided composite laminates under tension 6, 7,
compression 5, shear and impact 8, 9. Perhaps surprisingly, there have been limited studies
on the mechanical performance of braided composite of tube structures, especially under
torsion, which is a common loading scenario in industrial applications. Melenka and
Carey 54 studied the tensile and torsional performance of both 1/1 and 2/2 braided Kevlar
fibre/epoxy composite tubes with braid angles of 35°, 45° and 55°. They found that tensile
strength and Young’s modulus decrease with increasing braid angle for both 1/1 and 2/2

Chapter 7 Following the effect of braid architecture on performance and damage of CFRP tubes
127
braid patterns; however, there is no distinct trend for the torsional/shear properties across
different braid archetectures. Potluri et al. 57 found that the shear modulus and shear
strength of the braided composites decrease with increasing braid angle in 1/1 braided
glass fibre/epoxy composite tubes with braid angles of 31°, 45° and 60°, which was
attributed to the difference in fibre volume fraction (Vf) and the sensitivity to tube
diameter variation in the used testing configuration. Harte and Fleck 56 reported that the
shear strength of braided composites increase with increasing braid angle in 2/2 braided
glass fibre/epoxy composite tubes with braid angles of 23°, 40° and 55°, in contrast to that
in 1/1 braids. With regards to braided CFRP tubes, the torsional/shear properties of CFRP
tubes of different braid architectures haven’t yet been reported in literature.
Apart from the lack of macro-mechanical studies, little is known about the damage
mechanisms that give rise to the difference in torsional properties across composite tubes
having different braid structures. Lomov et al. 10 summarised a variety of non-destructive
techniques to study damage evolution in textile composites, including digital image
correlation 7, 210, acoustic emission 211, X-ray radiography 165 and X-ray comupted
tomography (CT). Although acoustic emission could identify the damage modes
including matrix cracking, debonding between fibre tow and matrix, and fibre fracture, in
the torsional failure of 3D braided CFRP tubes, the 3D distribution of the various damage
modes cannot be mapped. X-ray CT is a promising technique to assess microstructure
and damage in braided tubes owing to its 3D non-destructive nature. Time-lapse X-ray
CT under in-situ loading has been used increasingly to obtain insights into the damage
mechanisms in unidirectional 137, 173 and woven 13 CFRPs as reviewed by Garcea et al. 91
and Wang et al. 90. With regards to braided composites, Melenka et al. 15 reported the first
use of X-ray CT to assess the 3D braid structure and defects in 2D 1/1 braided Kevlar
fibre/epoxy composite tubes, where the actual interlacing paths of individual braid Kevlar
fibre tows were extracted in 3D. Zhou et al. 9 used post-mortem X-ray CT to assess the
impact damage in 3D braided CFRP tubes of different braid angles, in which they found
that impact damage is more severe with decreasing braid angle because of their looser
structure. Due to the intrinsic complexity associated with the in-situ mechanical testing
of tubular shaped structures, time-lapse X-ray imaging of the damage evolution in braided
composite tubes under load has not been realised until recently. We recently reported the

Chapter 7 Following the effect of braid architecture on performance and damage of CFRP tubes
128
first real time 3D imaging of damage development under torsion 107. The damage in 2D
1/1-45° braided CFRP tube was mapped in 3D during torsional straining and the damage
sequence was observed to initiate through radial intra-tow cracking and circumferential
inter-tow debonding, followed by fibre micro-buckling and ultimately kink-band
formation 107.
This paper aims to compare and contrast the damage behaviour for braided CFRP tubes
having different braid interlacement topologies in order to extend our understanding of
the effect of braid architecture on the mechanical performance of braided CFRPs under
torsion. The torsional/shear properties of 1/1 and 2/2 braided CFRPs tubes having
braiding angles of 35° and 45° are compared and time-lapse synchrotron X-ray CT used
to provide insights into the key damage mechanisms involved in failure. The findings
reported here provide important information for the design of braided composite tubes
bearing torsional loads.
7.2 Materials and methods
7.2.1 CFRP tube manufacture
Toray T700-12K carbon fibre and IN2/AT30 epoxy resin were used to manufacture all
the braided composite tubes in this study. The single layer 2D braided sleeves were
fabricated into two patterns –diamond (1/1) and regular (2/2) onto a 10mm-diameter steel
mandrel (pre-treated with release agent to aid demoulding) using a maypole braiding
machine (Cobra Braiding Machinery Ltd) as shown in Figure 7.1(a). Braids with two
braiding angles (35° and 45°) were prepared for each braid pattern, thus providing four
braid structures (1/1-35°, 1/1-45°, 2/2-35° and 2/2-45°). The braided sleeves (on the
mandrels) were then infused with IN2/AT30 epoxy resin using the vacuum assisted resin
infusion (VARI) method, followed by consolidation at 100 °C for 3 hours. The
manufactured tubes have a 10 mm inner diameter and were cut into 55 mm lengths (15
mm gauge length). The final 20 mm at the ends of each specimen was glued into end-
tabbing fixtures, comprising an insert and an outer shell (adapted from ASTM standard
D5448/D5448M 154), by epoxy adhesive (3M™ Scotch-Weld™ EC-9323 B/A).

Chapter 7 Following the effect of braid architecture on performance and damage of CFRP tubes
129
Figure 7.1 (a) Photograph showing the braiding process. (b) Schematic of the composite
manufactured by the VARI system, with 1/1-45° and 2/2-45° braid patterns extracted from
the X-ray CT images inset.
In order to reduce defects (such as wrinkles, voids and uneven wall thickness) induced by
the resin infusion process, the moulds for the VARI system were modified as shown in
Figure 7.1(b). An extra outer-shell mould was added outside the braid. The resulting tubes
had a smooth surface finish and a wall thickness of ~1.3mm, which contains about 0.3-
0.4 mm thick resin-rich area (considering both inner and outer surfaces). The fibre volume
fractions of the braided tubes were calculated based on segmented CT images, excluding
the resin-rich skins caused by the mould.
7.2.2 Torsion testing
Torsion tests (zero axial load) on the braided CFRP tubes were carried out on an Instron
8802 machine to investigate the torsional behaviour and also to validate the in-situ tests.
Three specimens were tested for each of the four braid architectures. During each test,
100 bar gripping pressure was applied to hold the samples and loading was performed at
2°/min. High-resolution videos of the samples throughout the loading process were
recorded using LaVision Imager E-lite (105 mm lens), to track the damage on the sample
surface at a frame rate of 5 Hz.
The composite mean shear stress , 𝜏̅ , was inferred from the torque, T, according to
Equations 7.1 and 7.2, which are obtained by assuming that the sum moment caused by
the mean shear stress equals the torque applied on the specimen. The mean shear strain,
�̅�, was inferred from the torsion angle (φrad) according to Equation 7.3. Considering the

Chapter 7 Following the effect of braid architecture on performance and damage of CFRP tubes
130
difficulties in installing strain gauges on small-diameter tubes with a short gauge length
(L), φrad has been computed from the crosshead rotation angle after applying appropriate
compliance correction (crosshead compliance has been estimated using a steel bar of
known properties). In the following equations, r is the radius of the annular element on
the cross-section of the specimen, dA is the area of the annular element, dr and dθ are the
thickness and angle of the annular element, respectively, 𝑟𝑂𝐷 , 𝑟𝐼𝐷 and �̅� are the outer,
inner and mean radius of the tube, respectively. Note that the shear strain values of 1/1-
45° samples here have been corrected based on the values reported in 107 by accounting
for the system compliance.
𝑇 = ∬ 𝑟𝜏̅d𝐴 = ∫ ∫ 𝜏̅𝑟2d𝑟d𝜃𝑟𝑂𝐷
𝑟𝐼𝐷
2𝜋
0𝐴
Equation 7.1
𝜏̅ =3𝑇
2𝜋(𝑟𝑂𝐷3 − 𝑟𝐼𝐷
3 ) Equation 7.2
�̅� =�̅� × 𝜑rad
𝐿 Equation 7.3
7.2.3 In-situ torsion test
The in-situ torsion tests were performed on the Deben-Manchester Open Frame Rig
(Mark II) which exploits a pair of independently controllable rotating grips. It was
mounted on the I13-2 Diamond-Manchester beamline, Diamond Light Source, UK. The
in-situ test specimens have the same gauge length as those for Instron 8802 tests, but
metal tabs were specially designed with two parallel side surfaces for gripping to apply
the torque (see Figure 7.2). The torsional load was applied by rotating the top grip relative
to the bottom one while maintaining zero axial load.

Chapter 7 Following the effect of braid architecture on performance and damage of CFRP tubes
131
Figure 7.2 In-situ loading and synchrotron X-ray CT imaging set-up on the I13-2
beamline, Diamond Light Source, UK.
The progressive evolution of damage was monitored in real-time by interrupting the test
at different stages for synchrotron X-ray CT imaging. A parallel polychromatic ‘pink’
(20-24 keV) beam was used for CT imaging with the radiographs recorded on a PCO.4000
camera providing a cropped field of view (FoV) of 10.8 mm × 7.2 mm at a voxel size of
(3.6 μm). In each CT scan, the two opposing grips were rotated in synchrony such that
4500 radiographs/projections were acquired at an exposure time of 0.12 s over 360°
rotation using an off-centred imaging approach 212. The acquisition time for each
tomogram was about 30 minutes. To facilitate the CT scan, the control of the rig was
switched from load control (for torsional straining) to position control (for imaging with
minimal sample movement). The load was stabilised for 20 minutes at each load step
prior to starting the CT scan.
7.2.4 X-ray CT image processing
The acquired projections were reconstructed into 32-bit float CT data using in-house
python codes. The pre-processing pipeline incorporated the following elements: 1) Flat-
field correction; 2) distortion correction 156; 3) converting 0-360° sinograms to 0-180°
sinograms 213; 4) zinger removal; 5) blob removal 157; 6) ring removal 157. Then the

Chapter 7 Following the effect of braid architecture on performance and damage of CFRP tubes
132
GRIDEC algorithm was used for reconstruction 158, 214. 3D image analysis was performed
in Avizo 2019.1 software. The CT images were firstly transformed into 8-bit (from 32-
bit), in order to reduce the data size thus accelerate the following image analysis
processes. The non-local means filter was applied to remove noise. With the help of the
image segmentation toolbox in Avizo, the bias fibre tows and the damage types can be
segmented semi-automatically based on their different greyscale levels. Thus, the
topology of the braided structure can be extracted and visualised in 3D as shown in Figure
7.3. Moreover, the volumes of the braid tows (including intra-tow resin) and the
composite were obtained from the CT images based on the segmentation results to
facilitate the measurement of Vf, which was calculated by the volume of fibres divided by
the volume of the composite. The volume of fibres equals the volume of tows multiplied
by the intra-tow fibre volume fraction. The intra-tow fibre volume fraction was calculated
by the area of carbon fibres (obtained from known parameters – the fibre diameter and
the number of fibres in each tow) divided by the area of the tows (obtained from CT image
sections) 215.
The level of crimp is a crucial factor for textile composites as it directly influences the
mechanical behaviour of the composite 216. The crimp angle (Φc) was measured by
unwrapping CT slices from the tubular shape to form a virtual flat panel using the Polar
Transformer plugin in Fiji ImageJ 15, 217. The unwrapped flat panel has a height equal to
the imaged tube height, a thickness equal to the wall thickness and a width equal to the
mean circumference of the tube. In addition, the damage area fraction in the tubular
specimen was calculated based on the unwrapped data, as will be discussed in Section
7.5.
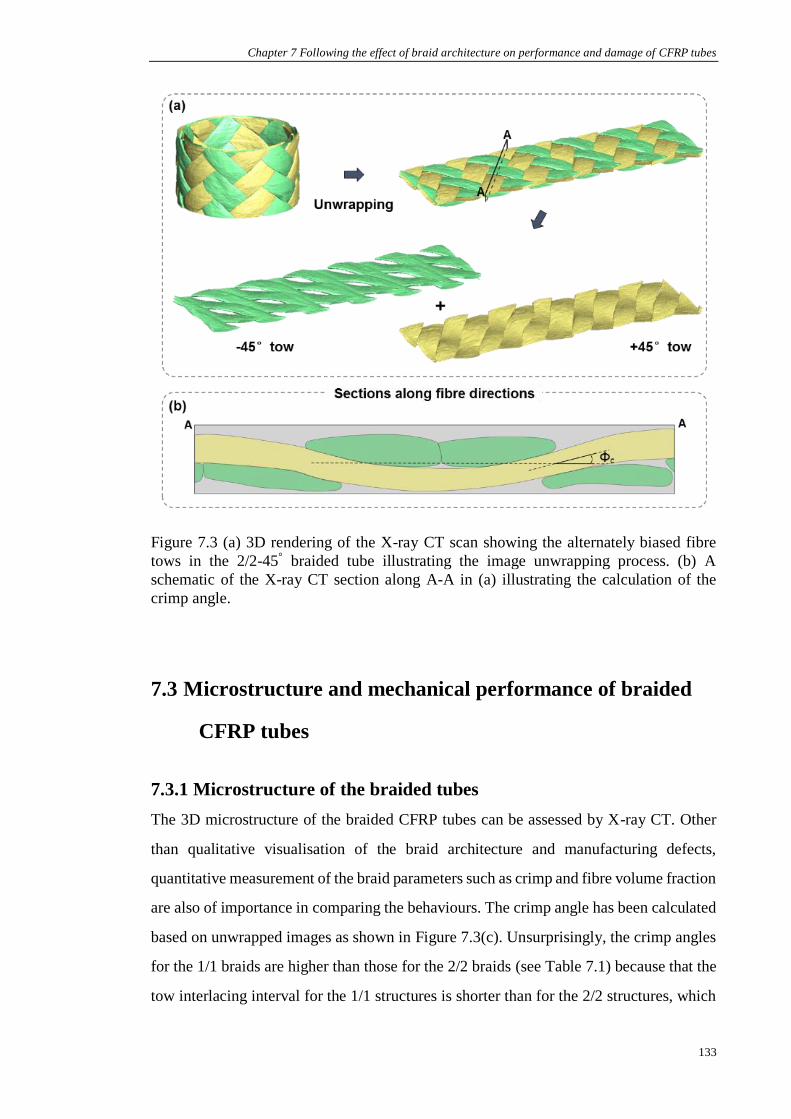
Chapter 7 Following the effect of braid architecture on performance and damage of CFRP tubes
133
Figure 7.3 (a) 3D rendering of the X-ray CT scan showing the alternately biased fibre
tows in the 2/2-45° braided tube illustrating the image unwrapping process. (b) A
schematic of the X-ray CT section along A-A in (a) illustrating the calculation of the
crimp angle.
7.3 Microstructure and mechanical performance of braided
CFRP tubes
7.3.1 Microstructure of the braided tubes
The 3D microstructure of the braided CFRP tubes can be assessed by X-ray CT. Other
than qualitative visualisation of the braid architecture and manufacturing defects,
quantitative measurement of the braid parameters such as crimp and fibre volume fraction
are also of importance in comparing the behaviours. The crimp angle has been calculated
based on unwrapped images as shown in Figure 7.3(c). Unsurprisingly, the crimp angles
for the 1/1 braids are higher than those for the 2/2 braids (see Table 7.1) because that the
tow interlacing interval for the 1/1 structures is shorter than for the 2/2 structures, which

Chapter 7 Following the effect of braid architecture on performance and damage of CFRP tubes
134
results in larger waviness at tow cross-overs. For a specific braid pattern, the crimp angle
for 45° structures are relatively higher than that for the 35° structures. Table 7.1 also shows
the fibre volume fractions of the composites having the different braid structures
measured following the approach reported in Chai et al. 107.
Table 7.1. Microstructural parameters of the braided composite tubes measured by X-ray
CT.
Braiding pattern Braiding angle (°) Crimp angle (°) Fibre volume
fraction (%)
1/1
diamond
35 16.5±2.3 41.1
45 20.1±2.0 42.1
2/2
regular
35 11.7±1.0 44.5
45 13.2±0.8 45.7
7.3.2 Torsional performance of braided CFRP tubes
The shear stress-strain behaviours of the test-pieces were calculated from the applied
torque and twisting angle according to Equations 7.1 and 7.2. Typical curves for the four
braid structures are plotted in Figure 7.4(a). It is noteworthy that for 1/1 braided tubes the
stress-strain curve is rather stable after the peak stress (indicating stable damage
accumulation); whereas the shear stress response for the 2/2 braided tubes typically
exhibits several steep drops upon exceeding the ultimate shear strength (peak load),
suggestive of bursts of rapid damage accumulation. This also results in a lower remnant
shear strength for the 2/2 braided structures than 1/1 at large shear strains (>4.5%).
Moreover, the torsional performance is observed to be broadly repeatable from sample to
sample. Figure 7.4(b) shows the shear stress-strain curves for all three 2/2-45° specimens
tested on the Instron 8802 alongside the 2/2-45° specimen tested in-situ. It is also
reassuring that the in-situ tested specimen behaves similarly to the off-line tested
specimens, which means that the damage evolution observed in-situ by X-ray CT is likely
to be representative of the general behaviour of this braid structure.

Chapter 7 Following the effect of braid architecture on performance and damage of CFRP tubes
135
Figure 7.4 (a) Typical shear stress-strain curves of the 1/1 (in black) and 2/2 (in blue)
braided CFRP tubes with different braiding angles tested on an Instron 8802. (b) Shear
stress-strain curves for the 2/2-45° braided tubes tested on an Instron 8802 (1-3) and
recorded by the in-situ load rig during the CT scanning where the load drops and the red
circles indicate the CT scan periods recorded at constant displacement.
The shear moduli and shear strengths of various braiding architectures are summarised in
Figure 7.5, including measured and normalised (to a Vf of 45%) values for comparison
across different structures. Overall, the 2/2 braided CFRP tubes exhibit higher shear
strength (maximum shear stress) and higher shear modulus than 1/1 braids. For a given
braiding angle, the 2/2 structures exhibit ~15-20% higher shear moduli and ~25-30%
higher shear strength than the corresponding 1/1 structures. For a given braid pattern, the
45° braided CFRPs have higher shear moduli and lower shear strength than the 35° braids.
Overall, the 2/2-45° braided CFRP exhibits the highest shear modulus and the 2/2-35°
braided CFRP the highest shear strength among the four braid architectures studied.
Comparing the trends in shear strengths and crimp angles of these braid structures, it is
noteworthy that the composite shear strength decreases as the crimp angle increases.

Chapter 7 Following the effect of braid architecture on performance and damage of CFRP tubes
136
Figure 7.5 Plots of (a) measured and (b) normalised (Vf = 45%) shear moduli (blue) and
shear strengths (amber) of CFRP tubes with different braid architectures, the error bars
represent the variation across three tests.
7.4 Damage mechanisms in braided CFRP tubes
The damage evolution in the 1/1-45° braided CFRP tube has been reported previously 107.
In that case we found that torsional damage tends to initiate from axial
compression/transverse tension induced radial intra-tow cracking, followed by
circumferential inter-tow debonding between oppositely biased tows (where the
compressive tows are on the outside and the tensile ones the inside) followed by fibre
micro-buckling in the axially compressed tows. In this section, the distribution and
evolution of torsional damage in the 2/2-45° braided CFRP tube is explored from the time-
lapse X-ray CT images. Under the applied torque (shear stress), the +45° tows are
approximately in a state of axial tension and transverse compression, whereas the -45°
tows are under axial compression and transverse tension. For clarity in the following
discussions, the +45° tows which are loaded in axial tension are termed AT tows (color-
coded yellow in Figure 7.3), and the -45° tows which are being axially compressed are
termed AC tows (color-coded green in Figure 7.3).
7.4.1 Damage initiation and propagation
The mechanism by which damage first initiates in 2/2 regular braided CFRP tube is
different from that in the 1/1-45° braided architecture 107. The first cracks to appear at a
torsional strain of around 1.2% are the result of a new damage mode - radial inter-tow

Chapter 7 Following the effect of braid architecture on performance and damage of CFRP tubes
137
debonding (see Figure 7.6(a) bottom), which occurs between the paired AC tow (see
Figure 7.6 (b)). This mode is not available for the 1/1 braids; by contrast the first damage
to appear in the 1/1-45° braid is circumferential inter-tow debonding between ±45° tows
(see the schematic in Figure 7.6 (a) top) and intra-tow cracking. Although adjacent AC
tows tend to buckle under the shear-induced axial compression, the locations of the two
buckles are shifted by the width of an AT tow, thereby generating a shear stress between
the two adjacent AC tows and resulting in the radial inter-tow debonding between them.
This damage mode is also clearly visible on the surface of the specimen as shown in
Figure 7.6(b).
Figure 7.6 (a) Schematic illustration of circumferential (top) and radial (bottom) inter-
tow debonding damage modes. (b) X-ray CT 3D volume rendering of AC (green) and AT
(yellow) tows highlighting the inter-tow debonding damage mode between adjacent AC
tows which is the first damage mode to initiate for the 2/2 braid and (c) post-mortem
photograph of the 2/2-45° braided CFRP specimen tested in-situ.
The sequence of damage development in the 2/2-45° structure can be established from the
time-lapse sequence of the virtual 2D X-ray CT section oriented parallel to the tow (fibre)
directions (see Figure 7.7) and compared with that for the 1/1-45 case reported previously
107. As discussed above, damage initiates through radial inter-tow debonding between
adjacent AC tows in locations where they lie on the outside of the tube at a shear strain
of 1.2% (see Feature A in Figure 7.7). It is worth noting that subsequently this radial inter-
tow debonding is also observed towards the interior of the tube (i.e. between two AC tows
lying inside the AT tow) after a shear strain of 2.0% (see Feature B). The fact that damage

Chapter 7 Following the effect of braid architecture on performance and damage of CFRP tubes
138
tends to initiate from the outer surface of the tube, rather than the inner surface, can be
attributed to the stress gradient along the tube radius observed in non-thin-walled tubes
218. In the meantime, circumferential inter-tow debonding (Feature C) induced by the
shear stress (similar to that observed in the 1/1-45° structure 107 has occurred along the
interface between the oppositely biased tows by 2.0% strain, where AC tows lie outside
AT tows. We can see that it tends to extend as far as the width of the AC tows on this
section. By 2.9% strain (S4), intra-tow cracks (Feature D and F) start to appear and
develop in AC tows. It is also worth noting that debonding between AC tows and the
matrix (Feature E) is observed at the interior of the CFRP tube at this stage, accompanied
by wavy deformation of the tube inner surface.
Figure 7.7 Time lapse sequence of a virtual X-ray CT slice cut parallel to an AT tow of
the 2/2-45° braided CFRP tube with increasing shear strain from 0 to 5.4%, showing the
evolution of damage (yellow (AT tow) and green (AC tow) tinting added to black and
white sections for clarity).
Based on the observations above, we can conclude that damage occurs predominantly
along interfaces (between adjacent AC tows and between outer AC tows and inner AT
tows) and within the AC tows. Figure 7.8 shows a time series for a virtual section parallel
to an AC (green) tow with increasing strain. It can be seen that the length of the
circumferential inter-tow debonding along the AC tow is shorter than that along the AT
tow (see Feature C in Figure 7.7 and Figure 7.8). Here, the debond extends to about two-

Chapter 7 Following the effect of braid architecture on performance and damage of CFRP tubes
139
thirds the width of two AT tows, as the AC tow is constrained in the through-the-thickness
direction by the AT tows at the tow cross-over points. Moreover, the inner and outer
surfaces of the tube both take up an increasingly wavy conformation with increasing shear
strain due to tendency for the AC tows to protrude radially and the AT tows to intrude.
As the shear strain reaches 5.4%, the axial compression along the AC tow, together with
the shear stress concentration at the tow cross-over points, promotes fibre micro-buckling
and fibre kinking, see Figure 7.8. Moreover, as shown in Figure 7.7 and Figure 7.8, it is
evident that under increasing shear strain, the AT tows become straighter (lower crimp)
under shear induced axial tension, while the AC tows become wavier (higher crimp)
under shear induced axial compression.
Figure 7.8 A time-lapse sequence for an X-ray CT virtual slice cut parallel to an AC tow
of the 2/2-45° braided CFRP tube with increasing shear strain from 0 to 5.4%, showing
the evolution of damage (yellow (AT tow) and green (AC tow) tinting added to black and
white sections for clarity).
As illustrated in Figure 7.9(a), the 2/2 pattern gives rise to waviness (crimp) in the fibre
tows with a half-wavelength of about two times the tow-width. Given that fibre
misalignment and waviness can significantly degrade the compressive strength of
unidirectional CFRP 219, the intrinsic waviness in the braid structure makes the braided
CFRP susceptible to shear (torque) induced axial compressive stress along the AC tows.

Chapter 7 Following the effect of braid architecture on performance and damage of CFRP tubes
140
Various conformations of fibre micro-buckling and fibre kinking have been observed in
the 2/2-45° specimen (see Figure 7.9(b)-(d)). Fibre micro-buckling and fibre kinking tend
to occur within the AC tow segments lying outside the AT tows (Figure 7.9(b)-(c)),
accompanied by circumferential inter-tow debonding, similar to that developed from a
notched region under four-point bending reported in Wang et al 105, due to the lower
through-the-thickness constraint near surface. Two typical positions for fibre kink bands
to develop have been observed, either close to one tow cross-over point (see Figure
7.9(b)) or in the middle between the two cross-over points (see Figure 7.9(c)), depending
on the local stress distribution. In addition, fibre micro-buckling/kinking can also be
found in the AC tow segments lying inside the two AT tows (see Figure 7.9(d)), which
initiated from the point between the two AT tows and developed towards the inner surface
of the tube. The matrix deformations on the inner and outer surfaces of the tube are
indicative of large shear stresses in this local band. The three typical cases presented in
Figure 7.9(b)-(d) resemble the type 1 (shear) fibre micro-buckling defined by Wang et al.
105, where lateral displacement either side of the kink band is pronounced.

Chapter 7 Following the effect of braid architecture on performance and damage of CFRP tubes
141
Figure 7.9 (a) Schematic of a typical section along the AC tow (the blue shading indicates
where AC tow lies outside AT tows, while the pink shading indicates where the AC tow
lies inside the AT tows). (b-d) Regions of interest taken from X-ray CT sections (parallel
to AC (green) tows) for the 2/2-45° braided tube under 6% shear strain and the
corresponding schematics illustrating different types of fibre micro-buckling and fibre
kink-band formation (red lines) caused by the shear-induced axial compression.
7.4.2 Overall damage distribution
Apart from the detailed examination of various damage modes within a region-of-interest
as discussed above, the overall damage distribution in the 2/2-45° structure under torsion
can also be assessed by 3D volume rendering of the X-ray CT images. Figure 7.10 shows
the 3D rendered volume of the 2/2-45° CFRP tube under increasing shear strain, where
the damaged regions appear lighter than the undamaged ones. It is evident that the damage
is localised into vertically interconnected bands (columns) parallel to the tube axis. This
damage has occurred in regions where the AC tows lie outside the AT tows (i.e. the green
columns in the colourized rendering in Figure 7.10). In these locations the AC tows have
buckled outwards under the shear (torque) induced axial compression and the interface
between the outer AC tow and the inner AT tow have debonded. Overall, the damage in
the 2/2-45° structure has propagated by almost simultaneous circumferential debonding

Chapter 7 Following the effect of braid architecture on performance and damage of CFRP tubes
142
for all the (green) patches down a vertical column, and then sequentially (green) column
by (green) column thereby causing the sequential load drops with increasing shear strain,
as highlighted by the dashed boxes in the loading sequence shown in Figure 7.10.
Figure 7.10 Semi translucent X-ray CT 3D volume renderings showing the propagation
of damage in 2/2-45° braided tube with increasing shear strain, where the lighter regions
indicate the presence of damage.
7.5 Effect of braid pattern on torsional damage evolution
Comparing the damage evolution of 1/1-45° CFRP reported by Chai et al 107 with that of
the 2/2-45° CFRP reported here, we can explore the effect of braid pattern, diamond (1/1)
or regular (2/2), on the damage mechanisms under torsion. Figure 7.11 shows typical
shear stress-strain curves alongside photographs of the specimen surfaces for the 2/2-45°
specimen (a1-a4) and the 1/1-45° specimen (b1-b4) at the corresponding stages of the
torsional straining. From these photographs we can see that damage propagates quite

Chapter 7 Following the effect of braid architecture on performance and damage of CFRP tubes
143
differently for the two structures. As discussed above for the 2/2 structure from the 3D
CT renderings in Figure 7.10, the vertical bands of damage (highlighted by ellipses in
Figure 7.11) are evident on the specimen surface. For the 1/1-45° braided structure, intra-
tow cracking damage (marked by the small ellipses) is evident on the specimen surface.
These damage features are localised and are evenly distributed almost uniformly across
the tube. By correlating the video sequence with the stress-strain response it is evident
that each steep drop in the shear strength of the 2/2-45° specimen corresponds to the
occurrence of a new ‘damaged column’ caused by the deformation of AC tows together
with the circumferential ‘popping’ of interface between the outer AC tows and the inner
AT tows. In the 2/2 structure, failure (buckling and debonding) of a single tow leads to a
dynamic transfer of load to the adjacent tow: this stimulates failure of the adjacent tow,
whereas for the 1/1 structure this local load-transfer effect is not evident.
For the 1/1-45° specimen, damage initiates in the form of radial intra-tow cracks in the
AC tows along with circumferential inter-tow debonding between the bias tows in regions
where the AC tows are outermost (the green patches (see Figure 7.1(b))). whereas in the
2/2-45° specimen, damage initiates from radial inter-tow debonding followed by
circumferential inter-tow debonding. The radial intra-tow cracks in AC tows observed in
1/1-45° specimen are similar to the longitudinal splitting in unidirectional CFRP
developed under axial compression, which is likely to occur along the fibre/matrix
interface. Thus, in both braid patterns interfacial performance is critical during the early
stages of torsional damage. As damage propagates, circumferential inter-tow debonding
becomes the dominant mechanism of strain relief in both structures.

Chapter 7 Following the effect of braid architecture on performance and damage of CFRP tubes
144
Figure 7.11 Stress-strain curves for 2/2 -45 and 1/1-45 braided tubes alongside stills taken
from live video imaging (see supplementary info) showing surface damage accumulation
in the 2/2-45° (at stages a1-a4) and 1/1-45° (at stages b1-b4) samples with increasing shear
strain.
In order to understand the difference in the propagation of circumferential inter-tow
debonding between the 1/1 and 2/2 braids, the inter-tow debonding damage was extracted
from the X-ray CT images of the 1/1-45° and 2/2-45° specimens at �̅� = 2.0% (just after
the peak in shear stress). The unwrapped segmented circumferential inter-tow debonding
damage is projected throughout the wall thickness onto one image (see Figure 7.12). The
area fraction of the debonding damage was calculated at �̅� = 2.0% from Figure 7.12. The
debonded area fraction in the 2/2-45° specimen (18%) is slightly larger than that of the
1/1-45° specimen (15%). More importantly, each debonded ‘patch’ is much larger than
that for the 1/1-45° specimen. This is because the tow interlacing distance is doubled in
the 2/2-45° structure, which gives rise to a larger individual interfacial area between bias
tows. The denser array of tow cross-over points in the 1/1-45° braid structure helps to
constrain the extent of circumferential inter-tow debonding. Further, the fact that the
regions where the AC tows are outermost are connected as vertical bands in the 2/2 case,

Chapter 7 Following the effect of braid architecture on performance and damage of CFRP tubes
145
but distributed into a chequer board pattern for the 1/1 braid means that the strain relief
and hence strength drop caused by the buckling of AC tows and the propagation of the
circumferential cracks means that the degradation in strength for the 2/2 stress strain curve
is less gradual than for the 1/1 braid once the peak strength has been exceeded.
Figure 7.12 Unwrapped and projected circumferential inter-tow debonding damage (blue)
obtained from segmented X-ray CT images, showing the distribution of this damage
mode between biased tows for 1/1-45° (top) and 2/2-45° (bottom) braided CFRP tubes at
a shear strain of ~2.0%, overlaid on top of the braid pattern of AC (green) and AT (yellow)
tows.
During the latter stages of torsional failure, fibre micro-buckling and kink-band formation
(along with fibre fracture) in the AC tows are the key damage modes in both 1/1-45° and
2/2-45° structures. In the 1/1-45° structure, fibre micro-buckling and kink bands tend to
develop close to tow cross-over points 107, while in the 2/2-45° structure, the mid-point
between two tow cross-overs is also susceptible to fibre kinking (see Figure 7.9(c)). This
might be due to the fact that the tow interlacing distance is almost doubled in the 2/2
structure compared with the 1/1 structure, which imposes less through-the-thickness
constraint thereby promoting fibre micro-buckling/kinking. For the 1/1 braid, kink bands
were only observed where the AC tow segments lie at the outer surface of the tube,
whereas for the 2/2 braid, fibre kink bands were also observed where the AC tow
segments lie at the inner diameter of the tube (see Figure 7.9(d)). It is also noteworthy
that under the excessive buckling of the AC tows in the 1/1-45° structure intra-tow

Chapter 7 Following the effect of braid architecture on performance and damage of CFRP tubes
146
cracking occurred rapidly in AT tows, while in the 2/2-45° structure the AT tows were
barely damaged even at γ̅ = 6%.
7.6 Conclusions
In this study, we have investigated the torsional behaviour of T700 carbon fibre/epoxy
resin braided composite tubes with various braid architectures. The key findings can be
summarised as follows,
1. In general, 2/2 braided CFRPs exhibit both higher shear strength and higher shear
modulus than 1/1 braided CFRPs. This is related to the lower crimp (crimp angle)
associated with the 2/2 braids. However, the shear strength for the 2/2 braided
CFRP drops significantly beyond the peak stress showing significant and sudden
load drops. By contrast the 1/1 braids show very modest falls in strength after the
peak stress and the degradation in strength is gradual, thus exhibiting a degree of
‘ductility’ under torsion. As a consequence, the 1/1 has a higher remnant strength
at torsional strains in excess of 4.5%.
2. While 45° is the optimum angle for a filament-wound tube under torsion, for
braided tubes, the braid angle has a complex relation with the shear modulus and
strength. For a given braid pattern, the 45° braided CFRPs have higher shear
moduli and a lower shear strength than the 35° braids. It appears that the torsional
strength of a braided tube is highly sensitive to the crimp angle, which could be
attributed to the susceptibility of crimped tows to axial compression.
3. Through time-lapse synchrotron X-ray CT monitoring of the stress-strain
behaviour the damage sequences have been captured. For the 2/2-45° braided
CFRP tube, damage initiates from radial inter-tow debonds between adjacent AC
(i.e. under shear (torque) induced axial compression) tows, followed by
circumferential inter-tow debonding between ±45° biased tows in locations where
the AC tows are outermost. At higher strains intra-tow cracking, fibre micro-
buckling and kink-band formation (fibre fracture) are also observed in AC tows.
The significant drops in shear strength recorded for the 2/2 braids have been

Chapter 7 Following the effect of braid architecture on performance and damage of CFRP tubes
147
shown to be related to the occurrence of the buckling of AC tows together with
the propagation of circumferential debonding of the AC tows from the AT tows
down vertical zones. The chequer board nature of the tows for the 1/1 structures
prevents the formation of such interconnected damage zones.
4. The fibre/matrix interfacial strength is important, as it controls damage initiation
under torsion. Tow cross-over density is a key factor in controlling damage
propagation under torsion. Tow cross-overs can arrest circumferential inter-tow
debonding, thus gives rise to smaller debonding area in the 1/1 structure than 2/2
structure. However, the crimp caused by the tow cross-overs contributes to the
occurrence of fibre micro-buckling. It is found that the fewer tow cross-overs in
2/2 structure gives rise to larger tow interlacing distance which imposes less
through-the-thickness constraint that could promote fibre micro-buckling.
The above key findings provide key insights into the design of braid architecture for
torsionally loaded components. For applications requiring high shear strength and/or high
shear modulus, 2/2 braided CFRP tubes are advantageous over 1/1 braided CFRP tubes.
However, for applications that require higher structural integrity once damage has started
to develop, 1/1 braided CFRP tubes could be a better option since 2/2 structures suffer
from significant drops in shear strength once damage starts to propagate.
In the current study the lack of radial constraint of the AC tows is critical in terms of
damage propagation in the form of debonding and fibre micro-buckling. This suggests
that the additional through-the-thickness constraint offered by through-the-thickness
binders, hoop-winding or multiple layers may improve torsional strength. Future research
could focus on developing novel braided structures with low crimp angle (for strength)
but increased number of cross-over points (for damage tolerance).
Acknowledgements
We acknowledge Diamond Light Source for time on I3-2 under proposals MT13704 and
MT18197 granted via the Diamond-Manchester Collaboration. We are grateful for the
support from Luke Rollings and Yi Zhou at the University of Manchester during the
beamtime experiments, and support from Ed Williamson-Brown and David Beales at

Chapter 7 Following the effect of braid architecture on performance and damage of CFRP tubes
148
Deben UK Ltd. We acknowledge the Engineering and Physical Science Research Council
(EPSRC) for funding the Henry Moseley X-ray Imaging Facility through grants
(EP/F007906/1, EP/F001452/1, EP/I02249X, EP/M010619/1, EP/F028431/1, and
EP/M022498/1) which is part of the Henry Royce Institute for Advanced Materials
funded by EP/R00661X. PP acknowledges support from the EPSRC Future Composites
Manufacturing Hub (EP/P006701/1). PJW acknowledges support from the European
Research Council grant No. 695638 CORREL-CT.

Chapter 8 Conclusions and future work
149
8. Conclusions and future work
8.1 Conclusions
The goal of the presented work in this thesis was to bridge the gap of knowledge between
the overall mechanical performance and the micro-damage mechanisms of braided carbon
fibre reinforced polymer (CFRP) composite tubes subjected to torsional loading, and
more importantly, to reveal the damage mechanisms in a 4D (3D + time) manner
unprecedentedly. Moreover, the effect of open-holes and the effect of braid architecture
(braid pattern – diamond (1/1) and regular (2/2); braid angle – 35° and 45°) on the torsional
damaging behaviour have been investigated experimentally.
In this project, an innovative in-situ torsional loading system has been customised and
employed to achieve time-lapse X-ray computed tomography (CT) imaging at sufficient
resolution to resolve the microstructure and damage in braided CFRP tubes. Notably, the
first real time 3D observation of damage development in composites under progressive
torsional straining has been realised in a systematic manner. Note that under the applied
torque (shear stress), one set of the braid tows is approximately in a state of axial tension
(termed AT tows) and transverse compression, whereas the other set in axial compression
(termed AC tows) and transverse tension. The main findings can be summarised from the
following three aspects:
1. The experimental and methodology has been firstly validated through the study of
braided 1/1-45° CFRP braided tubes under torsion and it is found that:
The key damage modes (inter-tow debonding, intra-tow matrix cracking, fibre
micro-buckling and kink bands) have been identified and their morphology has
been visualised in 3D. Overall the extent of damage shows a distinct periodicity
according to the repeating pattern of the braid architecture.
The damage sequence has been proposed as follows. Intra-tow cracks in the −45°
AC tows (that are under shear induced axial compression and transverse tension)
and inter-tow debonding ±45° braid tows have been found to occur almost
simultaneously at a shear strain of 1.1% (system compliance corrected). This is
followed by fibre micro-buckling and kink-band formation in the −45° AC tows
close to tow cross-over points, occurring beyond the peak shear stress.

Chapter 8 Conclusions and future work
150
The extent of inter-tow debonding and intra-tow cracking has been quantified as
a function of the shear strain. It is found that inter-tow debonding is constrained
to braid patches where the −45° AC tows lie on the outside, and the area fraction
of inter-tow debonding is found to increase significantly with increasing shear
strain after this damage mode first appeared at a shear strain of 1.1%. In addition,
intra-tow cracking is found to distribute uniformly across the tube, with a rapid
growth in its volume fraction after 1.6% shear strain.
It is found that tow crossovers control damage propagation under torsion,
positively by localising inter-tow debonds and negatively by promoting fibre
micro-buckling.
2. The effect of the open-hole on the mechanical properties and damage evolution
mechanisms of braided CFRP tubes subjected to torsional loads has been investigated
and it is found that:
The presence of the open-hole generally degrades the shear stiffness and the shear
strength of 1/1-45° braided CFRP tubes, in our case by ~11% and 17%,
respectively.
Compared with the unnotched structure, the open-hole not only causes strain
concentration around the hole revealed by stereo DIC, but also reduces the lateral
constraint thus promoting the early onset (at an average shear strain of 0.38%) of
damage in the form of fibre micro-buckling in the −45° AC tows.
For the open-hole tube sample, damage sequence in regions distant from the open-
hole is in accordance with that for the unnotched 1/1-45° braided CFRP tube.
However, local to the hole, new damage modes – in-plane fibre micro-buckling
in the −45° AC tows and radial inter-tow debonding between ±45° braid tows,
have occurred that are absent in the failure of the unnotched structure.
It is found the position of the hole with respect to the braid pattern can affect
damage development and lead to a scatter in the shear strength. If the tow cross-
over is more severely damaged during notching, the shear strength decrement is
more pronounced.

Chapter 8 Conclusions and future work
151
3. The effect of the braid architecture (the braid angle (35° and 45°) and the braid pattern
(1/1 and 2/2)) on the torsional performance and damage development in braided
CFRP tubes has been investigated and it is found that:
With regards to the effect of the braid pattern, 2/2 (regular) braided CFRP tubes
generally exhibit both higher shear strength and higher shear modulus than 1/1
(diamond) braided CFRPs. This is related to the lower crimp (crimp angle)
associated with the 2/2 braids. However, the shear strength for the 2/2 braided
CFRP tubes drops much more significantly beyond the peak stress than the 1/1
braids, which gives rise to a lower remnant strength than that of 1/1 braids.
The braid angle has a complex relation with the shear modulus and strength. For
a given braid pattern, the 45° braided CFRP tubes have higher shear moduli and a
lower shear strength than the 35° braids.
Compared with the 1/1-45° braided CFRP tube, damage initiates differently for
the 2/2-45° braided CFRP tube – damage initiates from a new mode of radial inter-
tow debonding between adjacent parallel -45° AC braid tows. Nevertheless, the
subsequent damage sequence is generally in accordance with that for the 1/1-45°
braided CFRP tube. The significant drops in shear strength recorded for the 2/2
braids have been shown to be related to the buckling of -45° AC tows together
with the sudden propagation of circumferential inter-tow debonding down vertical
zones.
Prior to the present study, the understanding on torsional damage mechanisms of braided
composite tube was fairly limited. The results here have shown that the braid tows that
are under shear induced axial compression (-45° AC tows) are more susceptible to damage
under torsional loading, whereas the braid tows under shear induced axial tension (+45°
AT tows) are much less damaged in all the tested braided tubes. This indicates the
potential to specifically strengthen the AC braid tows in the braid structures to constrain
the damage development.
The fibre/matrix interfacial strength is important, as it controls damage initiation in the
form of intra-tow cracks and inter-tow debonding. It also affects the amount of lateral
constraint to the fibres from the tendency to micro-buckle/kink. Improving the interfacial
strength could be beneficial in terms of delaying the damage onset.

Chapter 8 Conclusions and future work
152
Tow cross-over density is also a key factor in controlling damage propagation under
torsion. Tow cross-overs can arrest circumferential inter-tow debonding, thus gives rise
to smaller debonding area, as observed in the 1/1 and 2/2 structures. However, the crimp
caused by the tow cross-overs contributes to the reduction in shear strength and the
occurrence of fibre micro-buckling. Thus, the tow cross-over density should be
determined based on specific requirements in practical applications. For applications that
require higher shear strength, 2/2 (regular) braided CFRP tubes are better candidates.
While for applications that require higher structural integrity once damage has started to
develop, 1/1 (diamond) braided CFRP tubes could be a better option.
8.2 Future Work
In this project, the feasibility of tracking torsional damage evolution by in-situ X-ray CT
has been proven. Therefore, potential future research can be conducted using this
approach to deepen the understanding on the torsional failure behaviour of braided
composites, and several example topics worth further investigation are discussed below.
Damage mechanisms in multi-layer braided composite tubes
In this project, the single-layer braided structure has been investigated, which provides
fundamental understanding on its torsional behaviour and damage mechanisms. In
practical engineering applications, it is difficult to meet the strength and toughness
requirement using single-layer braids, where a multi-layer braided structure is
advantageous. As discussed in Chapter 7, although 2/2 braided composite tubes generally
exhibit higher shear strength than 1/1 braids, the sudden drops in stress are potentially
problematic. We found that the large-scale inter-tow debonding and buckling of the tows
are critical damage modes associated with these drops. In this case, the multi-layer
structure could potentially be beneficial and is worth further investigation, as the
constraint along the through-the-thickness direction can be enhanced to some extent, and
thus will suppress the development of inter-tow debonding and sudden drops in stress.
Moreover, multi-layer structure might also constrain the tendency for out-of-plane fibre
micro-buckling and postpone the occurrence of fibre fractures. However, challenges

Chapter 8 Conclusions and future work
153
remain that the delamination between layers might become another competitive damage
mode to promote large-scale damage propagation and degrade the torsional performance.
Image-based modelling of braided composite tubes
As discussed in Section 3.4.3, the X-ray CT image-based modelling has gained popularity
to assist the finite element modelling of composite materials in recent years. This
definitely will improve the reliability and efficiency of models. In this project, the
individual braid tows and various damage modes have been segmented based on the X-
ray CT images. On the one hand, the extracted actual braid architecture can be used to set
up models that incorporate various defects. On the other hand, the 3D damage
morphology at different stages can be used to validate the results from models, and thus
to help optimise the models. Moreover, based on the image-based model, the open-holes
can be introduced at various desired positions across the sample to study the effect of the
position of open-holes on the torsional behaviour.
Effects of the hole size and the braided hole on the torsional performance
For open-hole composite structures, the size of the hole is an important factor that can
affect the failure strength and the critical damage mechanisms causing failure 183. A
systematic study of the hole size effect will provide guidance to the design of open-hole
braided composites for practical applications. Moreover, instead of machining the hole,
directly braiding the hole is also of interest. Although composites with braided hole
exhibit higher tensile strength due to fibre continuity 60, it is unknown whether the
potentially severe undulation around the rim of the braided hole will affect their torsional
behaviour.
Damage mechanisms under combined loading
The in-service environment is often more complex than single-axis loading. The
combined axial loading and torsional loading are common in practical applications,
therefore it is of interest to investigate the damage mechanisms in braided composite tubes
under combined loading. In addition, as we found that the braid tows that are under
torsion/shear induced axial compression are prone to damage under pure torsion, it would
be interesting to investigate whether adding pre-tension to the structure will delay the
onset of damage in these tows.

References
154
References
1. S. Rana and R. Fangueiro (Eds.). (2015). Braided structures and composites :
production, properties, mechanics, and technical applications. CRC Press.
2. M.B. Dow and H. Benson Dexter, Development of Stitched, Braided and Woven
Composite Structures in the ACT Program and at Langley Research Center. 1997,
NASA Report TP-97-206234.
3. S.M. Lee (Ed.), (1992). Handbook of Composite Reinforcements. John Wiley &
Sons.
4. S. Lomov, I. Verpoest and F. Robitaille. (2006). Manufacturing and internal
geometry of textiles, In A.C. Long (Ed.), Design and Manufacture of Textile
Composites. CRC Press. 1-61.
5. J. Cichosz, T. Wehrkamp-Richter, H. Koerber, R. Hinterhölzl and P.P. Camanho.
(2016). Failure and damage characterization of (±30°) biaxial braided composites
under multiaxial stress states. Composites Part A: Applied Science and
Manufacturing, 90, 748-759.
6. B.N. Cox and G. Flanagan, Handbook of analytical methods for textile
composites. 1997, NASA Contractor Report 4750.
7. T. Wehrkamp-Richter, R. Hinterhölzl and S.T. Pinho. (2017). Damage and failure
of triaxial braided composites under multi-axial stress states. Composites Science
and Technology, 150, 32-44.
8. R.K. Goldberg, G.D. Roberts, B.J. Blinzler, L.W. Kohlman and W.K. Binienda.
2012. Characterization and analysis of triaxially braided polymer composites
under static and impact loads. In Thirteenth ASCE Aerospace Division Conference
on Engineering, Science, Construction, and Operations in Challenging
Environments, and the 5th NASA/ASCE Workshop On Granular Materials in
Space Exploration. Pasadena, US.
9. H. Zhou, C. Li, L. Zhang, B. Crawford, A.S. Milani and F.K. Ko. (2018). Micro-
XCT analysis of damage mechanisms in 3D circular braided composite tubes
under transverse impact. Composites Science and Technology, 155, 91-99.
10. S.V. Lomov, D.S. Ivanov, T.C. Truong, I. Verpoest, F. Baudry, K. Vanden Bosche
and H. Xie. (2008). Experimental methodology of study of damage initiation and
development in textile composites in uniaxial tensile test. Composites Science and
Technology, 68(12), 2340-2349.
11. T. Saito, H. Ashida, M. Hirose, T. Uozumi, A. Ohtani and A. Nakai. (2016). Effect
of braided structure on mechanical properties of CFRP pipes. Transactions of the
JSME, 82(837), 32-32.
12. E. Maire and P.J. Withers. (2014). Quantitative X-ray tomography. International
Materials Reviews, 59(1), 1-43.
13. Z. Li, L. Guo, L. Zhang and Q. Wang. (2018). In situ experimental investigation
on the out-plane damage evolution of 3D woven carbon-fiber reinforced
composites. Composites Science and Technology, 162, 101-109.

References
155
14. W. Hufenbach, R. Böhm, M. Gude, M. Berthel, A. Hornig, S. Ručevskis and M.
Andrich. (2012). A test device for damage characterisation of composites based
on in situ computed tomography. Composites Science and Technology, 72(12),
1361-1367.
15. G.W. Melenka, E. Lepp, B.K.O. Cheung and J.P. Carey. (2015). Micro-computed
tomography analysis of tubular braided composites. Composite Structures, 131,
384-396.
16. T.W. Clyne and D. Hull. (2019). An Introduction to Composite Materials. 3rd ed.:
Cambridge University Press.
17. C. Soutis. (2005). Fibre reinforced composites in aircraft construction. Progress
in Aerospace Sciences, 41(2), 143-151.
18. Boeing Commercial Airplanes. Available from:
https://www.boeing.com/commercial/aeromagazine/articles/qtr_4_06/index.html
19. A.C. Long (Ed.), (2005). Design and manufacture of textile composites.
Woodhead.
20. C. Ayranci and J.P. Carey. (2008). 2D braided composites: A review for stiffness
critical applications. Composite Structures, 85(1), 43-58.
21. A.C. Jackson. Development of textile composite preforms for aircraft primary
structures. In 35th Structures, Structural Dynamics, and Materials Conference.
SC, USA: AIAA.
22. P. Potluri and S. Nawaz. (2011). Developments in braided fabrics, In G.H. Gong
(Ed.), Specialist Yarn and Fabric Structures: Developments and Applications.
Elsevier. 333-353.
23. T.W. Chou (Ed.), (1989). Textile Structural Composites. Composite Materials, ed.
T.W. Chou. Elsevier.
24. I. Verpoest. (2000). Composite Preforming Techniques, In A. Kelly and C.
Zweben (Eds.), Polymer Matrix Composites - Comprehensive Composite
Materials Book. Elsevier: Oxford, UK. 623-669.
25. G.W. Melenka, A.J. Hunt, J.H. van Ravenhorst, R. Akkerman, C.M. Pastore, F.K.
Ko, M. Munro and J.P. Carey. (2017). Manufacturing processes for braided
composite materials, In J.P. Carey (Ed.), Handbook of Advances in Braided
Composite Materials. Woodhead Publishing. 47-153.
26. J.P. Carey, G.W. Melenka, A. Hunt, B. Cheung, M. Ivey and C. Ayranci. (2016).
Braided composites in aerospace engineering, In S. Rana and R. Fangueiro (Eds.),
Braided composites in aerospace engineering. Elsevier. 175-212.
27. B. Budiansky and N.A. Fleck. (1993). Compressive failure of fibre composites.
Journal of the Mechanics and Physics of Solids, 41(1), 183-211.
28. P. Berbinau, C. Soutis and I.A. Guz. (1999). Compressive failure of 0°
unidirectional carbon-fibre-reinforced plastic (CFRP) laminates by fibre
microbuckling. Composites Science and Technology, 59(9), 1451-1455.
29. L. Hunter. (2009). Durability of fabrics and garments, In J. Fan and L. Hunter
(Eds.), Engineering Apparel Fabrics and Garments. Elsevier. 161-200.

References
156
30. F. Heieck, F. Hermann, P. Middendorf and K. Schladitz. (2017). Influence of the
cover factor of 2D biaxial and triaxial braided carbon composites on their in-plane
mechanical properties. Composite Structures, 163, 114-122.
31. A.B. Strong. (2008). Fundamentals of composites manufacturing : materials,
methods and applications. Society of Manufacturing Engineers.
32. J.P. Carey. (2017). Introduction to braided composites, In J.P. Carey (Ed.),
Handbook of Advances in Braided Composite Materials. Elsevier Inc. 1-21.
33. S.C. Joshi. (2012). The pultrusion process for polymer matrix composites, In S.G.
Advani and K.-T. Hsiao (Eds.), Manufacturing Techniques for Polymer Matrix
Composites (PMCs). Woodhead Publishing. 381-413.
34. A.P. Mouritz, M.K. Bannister, P.J. Falzon and K.H. Leong. (1999). Review of
applications for advanced three-dimensional fibre textile composites. Composites
Part A: Applied Science and Manufacturing, 30(12), 1445-1461.
35. E.R. Stover, W.C. Mark, I. Marfowitz and W. Muelle, Preparation of an
omniweave reinforced carbon-carbon cylinder as a candidate for evaluation in
the advanced heat shield screening program. 1971, US Air Force AFML-TR-
70283.
36. M.L. White, Development of Manufacturing Technology for Fabrication of a
Composite Helicopter Main Rotor Spar by Tubular Braiding. 1981, Kaman
Aerospace Corporation TR 81-F-9.
37. T. Fong and T. Axford, Braided Composite Spar. 2018: United States.
38. M.J. Fedro and K. Willden. (1991). Characterization and manufacture of braided
composites for large commercial aircraft structures. NASA CP 3154 - 2nd
Advanced Technology Conference.
39. G.D. Roberts, J.M. Pereira, W.A. Arnold, J.D. Dorer and W.R. Watson, Design
and Testing of Braided Composite Fan Case Materials and Components. 2009,
NASA Report TM-2009-215811.
40. H.G.S.J. Thuis. 2004. The development of composite landing gear components
for aerospace applications. In Society of Allied Weight Engineers International
Conference. Newport Beach.
41. Drone frame by Dji. Available from: https://www.dji.com/uk/inspire-2.
42. S.L. Ogin and P. Potluri. (2016). Textile-reinforced composite materials, In A.R.
Horrocks and S.C. Anand (Eds.), Handbook of Technical Textiles. Elsevier. 1-26.
43. M. Lengersdorf, J. Multhoff and T. Gries. 2015. Evaluation of Braiding as a
Method for the Manufacturing of Composite Pressure vessels. In 20th
International Conference on Composite Materials. Copenhagen.
44. G. Liu, H. Gao, G. Wei and Y. Ma. (2019). A novel structure design of braided
composite pressure vessel and its mechanical analysis. The Journal of The Textile
Institute, 110(1), 124-133.
45. Hockey sticks by P. Techonology. Available from:
https://www.braider.com/Case-Studies/High-Tech-Hockey-Stick.aspx.

References
157
46. Carbon wheels by Thyssenkrupp Carbon Components Available from:
https://www.thyssenkrupp-carbon-components.com/en/products/motorcycle/.
47. Bicycles by BlackBraid. Available from: https://newatlas.com/pg-blackbraid-11-
pound-bike/26525/.
48. M.S. Dadkhah, J.G. Flintoff, T. Kniveton and B.N. Cox. (1995). Simple models
for triaxially braided composites. Composites, 26(8), 561-577.
49. J.E. Masters, R.L. Foye, C.M. Pastore and Y.A. Gowayed. (1993). Mechanical
properties of triaxially braided composites: Experimental and analytical results.
Journal of Composites Technology and Research, 15(2), 112-122.
50. R.A. Naik, P.G. Ifju and J.E. Masters. (1994). Effect of Fiber Architecture
Parameters on Deformation Fields and Elastic Moduli of 2-D Braided
Composites. Journal of Composite Materials, 28(7), 656-681.
51. L.V. Smith and S.R. Swanson. (1994). Failure of Braided Carbon/Epoxy
Composites under Biaxial Compression. Journal of Composite Materials, 28(12),
1158-1178.
52. J.E. Masters and P.G. Ifju. (1996). A phenomenological study of triaxially braided
textile composites loaded in tension. Composites Science and Technology, 56(3),
347-358.
53. K.M. Charlebois, R. Boukhili, O. Zebdi, F. Trochu and A. Gasmi. (2005).
Evaluation of the Physical and Mechanical Properties of Braided Fabrics and their
Composites. Journal of Reinforced Plastics and Composites, 24(14), 1539-1554.
54. G.W. Melenka and J.P. Carey. (2017). Experimental analysis of diamond and
regular tubular braided composites using three-dimensional digital image
correlation. Journal of Composite Materials, 51(28), 3887-3907.
55. A.M. Harte and N.A. Fleck. (2000). On the mechanics of braided composites in
tension. European Journal of Mechanics, A/Solids, 19(2), 259-275.
56. A.M. Harte and N.A. Fleck. (2000). Deformation and failure mechanisms of
braided composite tubes in compression and torsion. Acta Materialia, 48(6),
1259-1271.
57. P. Potluri, A. Manan, M. Francke and R.J. Day. (2006). Flexural and torsional
behaviour of biaxial and triaxial braided composite structures. Composite
Structures, 75(1-4), 377-386.
58. S. Liang, Q. Zhou, G. Chen and K. Frank. (2020). Open hole tension and
compression behavior of 3D braided composites. Polymer Composites, 41(6),
2455-2465.
59. C.L. Hwan, K.H. Tsai, W.L. Chen, C.H. Chiu and C.M. Wu. (2011). Strength
prediction of braided composite plates with a center hole. Journal of Composite
Materials, 45(19), 1991-2002.
60. A. Nakai, T. Ohki, N. Takeda and H. Hamada. (2001). Mechanical properties and
micro-fracture behaviors of flat braided composites with a circular hole.
Composite Structures, 52(3-4), 315-322.

References
158
61. T. Ohki, S. Ikegaki, K. Kurasiki, H. Hamada and M. Iwamoto. (2000). Mechanical
properties of flat braided composites with a circular hole. Journal of Engineering
Materials and Technology, Transactions of the ASME, 122(4), 420-424.
62. M. Vinot, M. Holzapfel and R. Jemmali. 2015. Numerical Investigation of Carbon
Braided Composites at the Mesoscale: using Computer Tomography as a
Validation Tool. In 10th European LS-DYNA Conference. Wurzburg, Germany.
63. A. Jumahat, C. Soutis, F.R. Jones and A. Hodzic. (2010). Fracture mechanisms
and failure analysis of carbon fibre/toughened epoxy composites subjected to
compressive loading. Composite Structures, 92(2), 295-305.
64. A.K. Pickett and M.R.C. Fouinneteau. (2006). Material characterisation and
calibration of a meso-mechanical damage model for braid reinforced composites.
Composites Part A: Applied Science and Manufacturing, 37(2), 368-377.
65. C. Wang, A. Roy, Z. Chen and V.V. Silberschmidt. (2017). Braided textile
composites for sports protection: Energy absorption and delamination in impact
modelling. Materials and Design, 136, 258-269.
66. J.S. Tate, A.D. Kelkar and J.D. Whitcomb. (2006). Effect of braid angle on fatigue
performance of biaxial braided composites. International Journal of Fatigue,
28(10 SPEC. ISS.), 1239-1247.
67. A. Baker, A.J. Gunnion and J. Wang. (2015). On the Certification of Bonded
Repairs to Primary Composite Aircraft Components. The Journal of Adhesion,
91(1-2), 4-38.
68. V.M. Karbhari (Ed.), (2013). Non-Destructive Evaluation (NDE) of Polymer
Matrix Composites, ed. V.M. Karbhari. Elsevier.
69. J.R. Dickens and D.E. Bray. (1994). Human performance considerations in
nondestructive testing. Materials evaluation, 52(9), 1033-1041.
70. B. Wang, S. Zhong, T.-L. Lee, K.S. Fancey and J. Mi. (2020). Non-destructive
testing and evaluation of composite materials/structures: A state-of-the-art
review. Advances in Mechanical Engineering, 12(4), 1-28.
71. H.M. Tensi. (2004). The Kaiser-effect and its scientific background. Journal of
Acoustic Emission, 22, S1-S16.
72. F. Breede, D. Koch, E. Maillet and G.N. Morscher. (2015). Modal acoustic
emission of damage accumulation in C/C–SiC composites with different fiber
architectures. Ceramics International, 41(9), 12087-12098.
73. N. Chandarana, D. Martinez-Sanchez, C. Soutis and M. Gresil. (2017). Early
Damage Detection in Composites by Distributed Strain and Acoustic Event
Monitoring. Procedia Engineering, 188, 88-95.
74. A. Refahi Oskouei, A. Zucchelli, M. Ahmadi and G. Minak. (2011). An integrated
approach based on acoustic emission and mechanical information to evaluate the
delamination fracture toughness at mode I in composite laminate. Materials and
Design, 32(3), 1444-1455.

References
159
75. I. Silversides, A. Maslouhi and G. LaPlante. (2013). Acoustic emission
monitoring of interlaminar delamination onset in carbon fibre composites.
Structural Health Monitoring: An International Journal, 12(2), 126-140.
76. V. Carvelli, A. D'Ettorre and S.V. Lomov. (2017). Acoustic emission and damage
mode correlation in textile reinforced PPS composites. Composite Structures, 163,
399-409.
77. M. Sutton, W. Wolters, W. Peters, W. Ranson and S. McNeill. (1983).
Determination of displacements using an improved digital correlation method.
Image and vision computing, 1(3), 133-139.
78. D. Garcia, J.J. Orteu and L. Penazzi. (2002). A combined temporal tracking and
stereo-correlation technique for accurate measurement of 3D displacements:
Application to sheet metal forming. Journal of Materials Processing Technology,
125-126, 736-742.
79. B. Pan, D. Wu and L. Yu. (2012). Optimization of a three-dimensional digital
image correlation system for deformation measurements in extreme
environments. Applied Optics, 51(19), 4409-4419.
80. C.K. Leung, G.W. Melenka, D.S. Nobes and J.P. Carey. (2013). The effect on
elastic modulus of rigid-matrix tubular composite braid radius and braid angle
change under tensile loading. Composite Structures, 100, 135-143.
81. J.P. Carey, G.W. Melenka, A.J. Hunt and C. Ayranci. (2017). Handbook of
Advances in Braided Composite Materials, Chapter 5 – Introduction to braided
composite material behavior. Elsevier Ltd.
82. E.J. Lang and T.W. Chou. (1998). The effect of strain gage size on measurement
errors in textile composite materials. Composites Science and Technology, 58(3-
4), 539-548.
83. S.V. Lomov, D.S. Ivanov, I. Verpoest, M. Zako, T. Kurashiki, H. Nakai, J.
Molimard and A. Vautrin. (2008). Full-field strain measurements for validation
of meso-FE analysis of textile composites. Composites Part A: Applied Science
and Manufacturing, 39(8), 1218-1231.
84. R.D. Hanna and R.A. Ketcham. (2017). X-ray computed tomography of planetary
materials: A primer and review of recent studies. Geochemistry, 77(4), 547-572.
85. S.D. Rawson, J. Maksimcuka, P.J. Withers and S.H. Cartmell. (2020). X-ray
computed tomography in life sciences. BMC Biology, 18(21).
86. W. Swindell and H.H. Barrett. (1977). Computerized tomography: taking
sectional x rays. Physics Today, 30(12), 32-41.
87. P.J. Withers. (2007). X-ray nanotomography. Materials today, 10(12), 26-34.
88. W. Chao, B.D. Harteneck, J.A. Liddle, E.H. Anderson and D.T. Attwood. (2005).
Soft X-ray microscopy at a spatial resolution better than 15 nm. Nature,
435(7046), 1210-1213.
89. M. Holler, A. Diaz, M. Guizar-Sicairos, P. Karvinen, E. Färm, E. Härkönen, M.
Ritala, A. Menzel, J. Raabe and O. Bunk. (2014). X-ray ptychographic computed
tomography at 16 nm isotropic 3D resolution. Scientific Reports, 4(1), 1-5.

References
160
90. Y. Wang, S.C. Garcea and P.J. Withers. (2018). Computed Tomography of
Compisites, In C.H. Zweben and P. Beaumont (Eds.), Comprehensive Composite
Materials II. Elsevier. 101-118.
91. S.C. Garcea, Y. Wang and P.J. Withers. (2018). X-ray computed tomography of
polymer composites. Composites Science and Technology, 156, 305-319.
92. S.R. Stock. (1999). X-ray microtomography of materials. International Materials
Reviews, 44, 141-164.
93. J. Baruchel, J.Y. Buffière, E. Maire, P. Merle and G. Peix. (2000). X-ray
tomography in material science. Hermes Science Publications.
94. G.R. Davis and J.C. Elliott. (2006). Artefacts in X-ray microtomography of
materials. Materials Science and Technology, 22(9), 1011-1018.
95. J. Hsieh. (2015). Computed Tomography: Principles, Design, Artifacts, and
Recent Advances. Wiley Interscience.
96. G.T. Herman (Ed.), (1979). Image Reconstruction from Projections:
Implementation and Applications, ed. G.T. Herman. Springer.
97. X. Pan, E.Y. Sidky and M. Vannier. (2009). Why do commercial CT scanners still
employ traditional, filtered back-projection for image reconstruction? Inverse
Problems, 25(12), 123009.
98. L.A. Feldkamp, L.C. Davis and J.W. Kress. (1984). Practical cone-beam
algorithm. Journal of the Optical Society of America A, 1(6), 612-612.
99. R.A. Brooks and G.D. Chiro. (1976). Statistical limitations in x ray reconstructive
tomography. Medical Physics, 3(4), 237-240.
100. L.A. Shepp and J.A. Stein. (1977). Simulated reconstruction artifacts in
computerized X-ray tomography, In M.M. Ter-Pogossian (Ed.), Reconstruction
Tomography in Diagnostic Radiology and Nuclear Medicine. University Park
Press: Baltimore. 33-48.
101. V. Titarenko. (2016). Analytical formula for two-dimensional ring artefact
suppression. Journal of Synchrotron Radiation, 23(6), 1447-1461.
102. E.Y. Sidky, C.M. Kao and X. Pan. (2006). Accurate image reconstruction from
few-views and limited-angle data in divergent-beam CT. Journal of X-Ray
Science and Technology, 14(2), 119-139.
103. B. Yu, R.S. Bradley, C. Soutis and P.J. Withers. (2016). A comparison of different
approaches for imaging cracks in composites by X-ray microtomography.
Philosophical Transactions of the Royal Society A: Mathematical, Physical and
Engineering Sciences, 374(2071), 20160037.
104. F. García-Moreno, P.H. Kamm, T.R. Neu, F. Bülk, R. Mokso, C.M. Schlepütz,
M. Stampanoni and J. Banhart. (2019). Using X-ray tomoscopy to explore the
dynamics of foaming metal. Nature Communications, 10(1), 1-9.
105. Y. Wang, Y. Chai, C. Soutis and P.J. Withers. (2019). Evolution of kink bands in
a notched unidirectional carbon fibre-epoxy composite under four-point bending.
Composites Science and Technology, 172, 143-152.

References
161
106. J.Y. Buffiere, E. Maire, J. Adrien, J.P. Masse and E. Boller. (2010). In situ
experiments with X ray tomography: An attractive tool for experimental
mechanics. Experimental Mechanics, 50(3), 289-305.
107. Y. Chai, Y. Wang, Z. Yousaf, N.T. Vo, T. Lowe, P. Potluri and P.J. Withers.
(2020). Damage evolution in braided composite tubes under torsion studied by in-
situ X-ray computed tomography. Composites Science and Technology, 188,
107976.
108. M.R. Wisnom. (1999). Size effects in the testing of fibre-composite materials.
Composites Science and Technology, 59(13), 1937-1957.
109. A. Kyrieleis, M. Ibison, V. Titarenko and P.J. Withers. (2009). Image stitching
strategies for tomographic imaging of large objects at high resolution at
synchrotron sources. Nuclear Instruments and Methods in Physics Research,
Section A: Accelerators, Spectrometers, Detectors and Associated Equipment,
607(3), 677-684.
110. A. Kyrieleis, V. Titarenko, M. Ibison, T. Connolley and P.J. Withers. (2011).
Region-of-interest tomography using filtered backprojection: Assessing the
practical limits. Journal of Microscopy, 241(1), 69-82.
111. S.C. Wu, T.Q. Xiao and P.J. Withers. (2017). The imaging of failure in structural
materials by synchrotron radiation X-ray microtomography. Engineering
Fracture Mechanics, 182, 127-156.
112. S.C. Mayo, A.W. Stevenson and S.W. Wilkins. (2012). In-Line Phase-Contrast
X-ray Imaging and Tomography for Materials Science. Materials, 5(12), 937-965.
113. A. Snigirev, I. Snigireva, V. Kohn, S. Kuznetsov and I. Schelokov. (1995). On the
possibilities of x-ray phase contrast microimaging by coherent high-energy
synchrotron radiation. Review of Scientific Instruments, 66(12), 5486-5492.
114. S.C. Garcea, I. Sinclair and S.M. Spearing. (2015). In situ synchrotron
tomographic evaluation of the effect of toughening strategies on fatigue
micromechanisms in carbon fibre reinforced polymers. Composites Science and
Technology, 109, 32-39.
115. P.J. Schilling, B.P.R. Karedla, A.K. Tatiparthi, M.A. Verges and P.D. Herrington.
(2005). X-ray computed microtomography of internal damage in fiber reinforced
polymer matrix composites. Composites Science and Technology, 65(14), 2071-
2078.
116. L.P. Djukic, I. Herszberg, W.R. Walsh, G.A. Schoeppner and B. Gangadhara
Prusty. (2009). Contrast enhancement in visualisation of woven composite
architecture using a MicroCT Scanner. Part 2: Tow and preform coatings.
Composites Part A: Applied Science and Manufacturing, 40(12), 1870-1879.
117. S.M. Spearing and P.W.R. Beaumont. (1992). Fatigue damage mechanics of
composite materials. I: Experimental measurement of damage and post-fatigue
properties. Composites Science and Technology, 44(2), 159-168.
118. K.M. Jespersen and L.P. Mikkelsen. (2016). Fatigue damage observed non-
destructively in fibre composite coupon test specimens by X-ray CT. IOP
Conference Series.: Material Science and Engineering, 139(1), 12-14.

References
162
119. R.A. Saunders, C. Lekakou and M.G. Bader. (1998). Compression and
microstructure of fibre plain woven cloths in the processing of polymer
composites. Composites Part A: Applied Science and Manufacturing, 29(4), 443-
454.
120. M. Bannister, I. Herszberg, A. Nicolaidis, F. Coman and K.H. Leong. (1998). The
manufacture of glass/epoxy composites with multilayer woven architectures.
Composites Part A: Applied Science and Manufacturing, 29(3), 293-300.
121. M.J. Emerson, Y. Wang, P.J. Withers, K. Conradsen, A.B. Dahl and V.A. Dahl.
(2018). Quantifying fibre reorientation during axial compression of a composite
through time-lapse X-ray imaging and individual fibre tracking. Composites
Science and Technology, 168, 47-54.
122. G. Requena, G. Fiedler, B. Seiser, P. Degischer, M. Di Michiel and T. Buslaps.
(2009). 3D-Quantification of the distribution of continuous fibres in
unidirectionally reinforced composites. Composites Part A: Applied Science and
Manufacturing, 40(2), 152-163.
123. F. Desplentere, S.V. Lomov, D.L. Woerdeman, I. Verpoest, M. Wevers and A.
Bogdanovich. (2005). Micro-CT characterization of variability in 3D textile
architecture. Composites Science and Technology, 65(13), 1920-1930.
124. P. Badel, E. Vidal-Sallé, E. Maire and P. Boisse. (2008). Simulation and
tomography analysis of textile composite reinforcement deformation at the
mesoscopic scale. Composites Science and Technology, 68(12), 2433-2440.
125. L.P. Djukic, I. Herszberg, W.R. Walsh, G.A. Schoeppner, B. Gangadhara Prusty
and D.W. Kelly. (2009). Contrast enhancement in visualisation of woven
composite tow architecture using a MicroCT Scanner. Part 1: Fabric coating and
resin additives. Composites Part A: Applied Science and Manufacturing, 40(5),
553-565.
126. M. Kosek and P. Sejak. (2009). Visualization of voids in actual C/C woven
composite structure. Composites science and technology, 69(9), 1465-1469.
127. J.S.U. Schell, M. Renggli, G.H. van Lenthe, R. Müller and P. Ermanni. (2006).
Micro-computed tomography determination of glass fibre reinforced polymer
meso-structure. Composites Science and Technology, 66(13), 2016-2022.
128. Z. Yousaf, P. Potluri, P.J. Withers, D. Mollenhauer, E. Zhou and S. Duning.
(2018). Digital element simulation of aligned tows during compaction validated
by computed tomography (CT). International Journal of Solids and Structures,
154, 78-87.
129. P. Potluri, Z. Yousaf, F. Leonard and P.J. Withers. 2013. Meso-scale analysis of
2D glass woven preform under compaction. In International Conference on
Composite Materials-ICCM 19. Montreal, Canada.
130. J. Kastner, B. Plank, D. Salaberger and J. Sekelja. 2010. Defect and Porosity
Determination of Fibre Reinforced Polymers by X-ray Computed Tomography.
In 2nd International Symposium on NDT in Aerospace. Hamburg, Germany.
131. J.E. Little, X. Yuan and M.I. Jones. (2012). Characterisation of voids in fibre
reinforced composite materials. NDT and E International, 46(1), 122-127.

References
163
132. A. Reh, B. Plank, J. Kastner, E. Gröller and C. Heinzl. (2012). Porosity Maps -
Interactive Exploration and Visual Analysis of Porosity in Carbon Fiber
Reinforced Polymers. Computer Graphics Forum, 31(3pt3), 1185-1194.
133. M. Gigliotti, Y. Pannier, R.A. Gonzalez, M.C. Lafarie-Frenot and S.V. Lomov.
(2018). X-ray micro-computed-tomography characterization of cracks induced by
thermal cycling in non-crimp 3D orthogonal woven composite materials with
porosity. Composites Part A: Applied Science and Manufacturing, 112, 100-110.
134. T. Centea and P. Hubert. (2011). Measuring the impregnation of an out-of-
autoclave prepreg by micro-CT. Composites Science and Technology, 71(5), 593-
599.
135. B. de Parscau du Plessix, P. Lefébure, N. Boyard, S.L. Corre, N. Lefèvre, F.
Jacquemin, V. Sobotka and S. Rolland du Roscoat. (2019). In situ real-time 3D
observation of porosity growth during composite part curing by ultra-fast
synchrotron X-ray microtomography. Journal of Composite Materials, 53(28-30),
4105-4116.
136. J. Vilà, F. Sket, F. Wilde, G. Requena, C. González and J. Llorca. (2015). An in
situ investigation of microscopic infusion and void transport during vacuum-
assisted infiltration by means of X-ray computed tomography. Composites
Science and Technology, 119, 12-19.
137. S.C. Garcea, I. Sinclair, S.M. Spearing and P.J. Withers. (2017). Mapping fibre
failure in situ in carbon fibre reinforced polymers by fast synchrotron X-ray
computed tomography. Composites Science and Technology, 149, 81-89.
138. F. Xu, L. Sun, L. Zhu, S. Yang, D. Hui and Y. Qiu. (2018). X-ray 3D microscopy
analysis of fracture mechanisms for 3D orthogonal woven E-glass/epoxy
composites with drilled and moulded-in holes. Composites Part B: Engineering,
133, 193-202.
139. R. Barbière, F. Touchard, L. Chocinski-Arnault and D. Mellier. (2020). Influence
of moisture and drying on fatigue damage mechanisms in a woven hemp/epoxy
composite: Acoustic emission and micro-CT analysis. International Journal of
Fatigue, 136, 105593-105593.
140. Y. Pannier, F. Foti and M. Gigliotti. (2020). High temperature fatigue of
carbon/polyimide 8-harness satin woven composites. Part I: Digital Image
Correlation and Micro-Computed Tomography damage characterization.
Composite Structures, 244, 112255.
141. B. Yu, R. Blanc, C. Soutis and P.J. Withers. (2016). Evolution of damage during
the fatigue of 3D woven glass-fibre reinforced composites subjected to tension-
tension loading observed by time-lapse X-ray tomography. Composites Part A:
Applied Science and Manufacturing, 82, 279-290.
142. Q. Zeng, L. Sun, J. Ge, W. Wu, J. Liang and D. Fang. (2020). Damage
characterization and numerical simulation of shear experiment of plain woven
glass-fiber reinforced composites based on 3D geometric reconstruction.
Composite Structures, 233, 111746.
143. Y. Sinchuk, Y. Pannier, R. Antoranz-Gonzalez and M. Gigliotti. (2019). Analysis
of moisture diffusion induced stress in carbon/epoxy 3D textile composite

References
164
materials with voids by µ-CT based Finite Element Models. Composite
Structures, 212, 561-570.
144. K. Iizuka, M. Ueda, T. Takahashi, A. Yoshimura and M. Nakayama. (2019).
Development of a three-dimensional finite element model for a unidirectional
carbon fiber reinforced plastic based on X-ray computed tomography images and
the numerical simulation on compression. Advanced Composite Materials, 28(1),
73-85.
145. R.M. Sencu, Z. Yang, Y.C. Wang, P.J. Withers and C. Soutis. (2020). Multiscale
image-based modelling of damage and fracture in carbon fibre reinforced polymer
composites. Composites Science and Technology, 108243.
146. T. Takahashi, M. Ueda, K. Iizuka, A. Yoshimura and T. Yokozeki. (2019).
Simulation on kink-band formation during axial compression of a unidirectional
carbon fiber-reinforced plastic constructed by X-ray computed tomography
images. Advanced Composite Materials, 28(4), 347-363.
147. N. Naouar, E. Vidal-Sallé, J. Schneider, E. Maire and P. Boisse. (2014). Meso-
scale FE analyses of textile composite reinforcement deformation based on X-ray
computed tomography. Composite Structures, 116(1), 165-176.
148. N. Naouar, E. Vidal-Salle, J. Schneider, E. Maire and P. Boisse. (2015). 3D
composite reinforcement meso F.E. analyses based on X-ray computed
tomography. Composite Structures, 132, 1094-1104.
149. X. Liu, D. Zhang, J. Sun, S. Yu, Y. Dai, Z. Zhang, J. Sun, G. Li and K. Qian.
(2020). Refine reconstruction and verification of meso-scale modeling of three-
dimensional five-directional braided composites from X-ray computed
tomography data. Composite Structures, 245, 112347.
150. A. Madra, P. Breitkopf, A. Rassineux and F. Trochu. (2017). Image-based model
reconstruction and meshing of woven reinforcements in composites. International
Journal for Numerical Methods in Engineering, 112(9), 1235-1252.
151. W. Huang, P. Causse, V. Brailovski, H. Hu and F. Trochu. (2019). Reconstruction
of mesostructural material twin models of engineering textiles based on Micro-
CT Aided Geometric Modeling. Composites Part A: Applied Science and
Manufacturing, 124, 105481-105481.
152. R.D.B. Sevenois, D. Garoz, F.A. Gilabert, S.W.F. Spronk, S. Fonteyn, M.
Heyndrickx, L. Pyl, D. Van Hemelrijck, J. Degrieck and W. Van Paepegem.
(2016). Avoiding interpenetrations and the importance of nesting in analytic
geometry construction for Representative Unit Cells of woven composite
laminates. Composites Science and Technology, 136, 119-132.
153. Y. Sinchuk, P. Kibleur, J. Aelterman, M.N. Boone and W.V. Paepegem. (2020).
Variational and deep learning segmentation of very-low-contrast X-ray Computed
tomography images of carbon/epoxy woven composites. Materials, 13(4), 936-
936.
154. ASTM D5448 / D5448M: Standard Test Method for Inplane Shear Properties of
Hoop Wound Polymer Matrix Composite Cylinders. 2016.

References
165
155. O. Brunke, K. Brockdorf, S. Drews, B. Müller, T. Donath, J. Herzen and F.
Beckmann. 2008. Comparison between x-ray tube-based and synchrotron
radiation-based μCT. In Proc. SPIE 7078, Developments in X-Ray Tomography
VI. San Diego, US.
156. N.T. Vo, R.C. Atwood and M. Drakopoulos. (2015). Radial lens distortion
correction with sub-pixel accuracy for X-ray micro-tomography. Optics Express,
23(25), 32859-32868.
157. N.T. Vo, R.C. Atwood and M. Drakopoulos. (2018). Superior techniques for
eliminating ring artifacts in X-ray micro-tomography. Optics Express, 26(22),
28396-28412.
158. D. Gürsoy, F. De Carlo, X. Xiao and C. Jacobsen. (2014). TomoPy: A framework
for the analysis of synchrotron tomographic data. Journal of Synchrotron
Radiation, 21(5), 1188-1193.
159. R.A. Haddad and A.N. Akansu. (1991). A Class of Fast Gaussian Binomial Filters
for Speech and Image Processing. IEEE Transactions on Signal Processing,
39(3), 723-727.
160. T.S. Huang. (1981). Transform and Median Filters, In T.S. Huang (Ed.), Two-
Dimensional Digital Signal Processing II. Springer-Verlag.
161. C. Tomasi and R. Manduchi. 1998. Bilateral filtering for gray and color images.
In Sixth International Conference on Computer Vision. Bombay, India: IEEE.
162. A. Buades, B. Coll and J.M. Morel. 2005. A non-local algorithm for image
denoising. In IEEE Computer Society Conference on Computer Vision and
Pattern Recognition. San Diego, USA: IEEE Computer Society.
163. P. Iassonov, T. Gebrenegus and M. Tuller. (2009). Segmentation of X-ray
computed tomography images of porous materials: A crucial step for
characterization and quantitative analysis of pore structures. Water Resources
Research, 45(9), W09415.
164. Y. Chen, L. Gélébart, C. Chateau, M. Bornert, C. Sauder and A. King. (2019).
Analysis of the damage initiation in a SiC/SiC composite tube from a direct
comparison between large-scale numerical simulation and synchrotron X-ray
micro-computed tomography. International Journal of Solids and Structures, 161,
111-126.
165. D.S. Ivanov, F. Baudry, B. Van Den Broucke, S.V. Lomov, H. Xie and I.
Verpoest. (2009). Failure analysis of triaxial braided composite. Composites
Science and Technology, 69(9), 1372-1380.
166. J.P. Johnston, J.M. Pereira, C.R. Ruggeri and G.D. Roberts. (2018). High-speed
infrared thermal imaging during ballistic impact of triaxially braided composites.
Journal of Composite Materials, 52(25), 3549-3562.
167. J. Montesano, H. Bougherara and Z. Fawaz. (2014). Application of infrared
thermography for the characterization of damage in braided carbon fiber
reinforced polymer matrix composites. Composites Part B: Engineering, 60, 137-
143.

References
166
168. M. Fouinneteau and A.K. Pickett. (2006). Failure characterisation of heavy tow
braided composites using Digital Image Correlation (DIC). Applied Mechanics
and Materials, 5-6, 399-406.
169. G.W. Melenka, D.S. Nobes and J.P. Carey. 2013. 3D DIC Measurement of
Tubular Braided. In 19th International Conference on Composite Materials.
Montreal, Quebec, Canada.
170. I.O. Agwubilo, Manufacture, modelling and characterisation of novel composite
tubes. 2015, The University of Manchester.
171. M.E. Taşdelen, M.H. Keleştemur and E. Şevkat. (2016). Torsional behaviour and
finite element analysis of the hybrid laminated composite shafts: comparison of
VARTM with vacuum bagging manufacturing method. Advances in Materials
Science and Engineering, 2016, 1-8.
172. M. Jalalvand, M.R. Wisnom, H. Hosseini-Toudeshky and B. Mohammadi.
(2014). Experimental and numerical study of oblique transverse cracking in cross-
ply laminates under tension. Composites Part A: Applied Science and
Manufacturing, 67, 140-148.
173. Y. Wang, T.L. Burnett, Y. Chai, C. Soutis, P.J. Hogg and P.J. Withers. (2017). X-
ray computed tomography study of kink bands in unidirectional composites.
Composite Structures, 160, 917-924.
174. D. Duthinh, Connections of Fiber-Reinforced Polymer (FRP) Structural
Members: A Review of the State of The Art. 2000, NIST Interagency/Internal
Report (NISTIR)-6532.
175. F. Gamdani, R. Boukhili and A. Vadean. (2015). Tensile strength of open-hole,
pin-loaded and multi-bolted single-lap joints in woven composite plates.
Materials and Design, 88, 702-712.
176. D. Geng, Y. Liu, Z. Shao, Z. Lu, J. Cai, X. Li, X. Jiang and D. Zhang. (2019).
Delamination formation, evaluation and suppression during drilling of composite
laminates: A review. Composite Structures, 216, 168-186.
177. J. Awerbuch and M.S. Madhukar. (1985). Notched Strength of Composite
Laminates: Predictions and Experiments—A Review. Journal of Reinforced
Plastics and Composites, 4(1), 3-159.
178. S.R. Hallett, B.G. Green, W.G. Jiang and M.R. Wisnom. (2009). An experimental
and numerical investigation into the damage mechanisms in notched composites.
Composites Part A: Applied Science and Manufacturing, 40(5), 613-624.
179. B.G. Green, M.R. Wisnom and S.R. Hallett. (2007). An experimental
investigation into the tensile strength scaling of notched composites. Composites
Part A: Applied Science and Manufacturing, 38(3), 867-878.
180. K.K. Panchagnula and K. Palaniyandi. (2018). Drilling on fiber reinforced
polymer/nanopolymer composite laminates: A review. journal of materials
research and technology, 7(2), 180-189.
181. A.P.K. Joseph, W. Ji, E.J. Pineda, S. Liguore, S. Wanthal and S. Wanthal. 2015.
Progressive damage and failure prediction of open hole tension and open hole
compression specimens. In 56th AIAA/ASCE/AHS/ASC Structures, Structural

References
167
Dynamics, and Materials Conference. Kissimmee, US: American Institute of
Aeronautics and Astronautics Inc.
182. C. Soutis and N.A. Fleck. (1990). Static Compression Failure of Carbon Fibre
T800/924C Composite Plate with a Single Hole. Journal of Composite Materials,
24(5), 536-558.
183. M.R. Wisnom and S.R. Hallett. (2009). The role of delamination in strength,
failure mechanism and hole size effect in open hole tensile tests on quasi-isotropic
laminates. Composites Part A: Applied Science and Manufacturing, 40(4), 335-
342.
184. H. Bao and G. Liu. (2016). Progressive failure analysis on scaled open-hole tensile
composite laminates. Composite Structures, 150, 173-180.
185. B.Y. Chen, T.E. Tay, P.M. Baiz and S.T. Pinho. (2013). Numerical analysis of
size effects on open-hole tensile composite laminates. Composites Part A: Applied
Science and Manufacturing, 47(1), 52-62.
186. S. Zhou, J. Zhang, Y. Sun and K. Tian. (2019). Experimental and numerical
investigation of open hole carbon fiber composite laminates under compression
with three different stacking sequences. Journal of Materials Research and
Technology, 8(3), 2957-2968.
187. R.M. O'Higgins, M.A. McCarthy and C.T. McCarthy. (2008). Comparison of
open hole tension characteristics of high strength glass and carbon fibre-
reinforced composite materials. Composites Science and Technology, 68(13),
2770-2778.
188. G. Sun, L. Wang, D. Chen and Q. Luo. (2020). Tensile performance of basalt fiber
composites with open circular holes and straight notches. International Journal of
Mechanical Sciences, 105517.
189. F.E. Oz, M. Mehdikhani, N. Ersoy and S.V. Lomov. (2020). In-situ imaging of
inter- and intra-laminar damage in open-hole tension tests of carbon fibre-
reinforced composites. Composite Structures, 244, 112302.
190. P.P. Camanho, P. Maimí and C.G. Dávila. (2007). Prediction of size effects in
notched laminates using continuum damage mechanics. Composites Science and
Technology, 67(13), 2715-2727.
191. C. Soutis. (1994). Damage tolerance of open-hole CFRP laminates loaded in
compression. Composites Engineering, 4(3), 317-327.
192. J. März, C. Hah and W. Neise. 2001. An experimental and numerical investigation
into the mechanisms of rotating instability. In ASME Turbo Expo 2001: Power for
Land, Sea, and Air. New Orleans, Louisiana, USA: Elsevier.
193. F. Sket, A. Enfedaque, C. Díaz López, C. González, J. Molina-Aldareguía and J.
Llorca. (2016). X-ray computed tomography analysis of damage evolution in open
hole carbon fiber-reinforced laminates subjected to in-plane shear. Composites
Science and Technology, 133, 40-50.
194. H. Suemasu, H. Takahashi and T. Ishikawa. (2006). On failure mechanisms of
composite laminates with an open hole subjected to compressive load. Composites
Science and Technology, 66(5), 634-641.

References
168
195. M. Habibi and L. Laperrière. (2020). Digital image correlation and acoustic
emission for damage analysis during tensile loading of open-hole flax laminates.
Engineering Fracture Mechanics, 228, 106921.
196. F. Laurin, C. Julien and P. Paulmier. 2016. Damage and strength analysis of open-
hole laminated plates under tensile, compressive and bending loadings. In 17th
European Conference on Composite Materials. Munich, Germany.
197. J.H.S. Almeida, L. Bittrich and A. Spickenheuer. (2020). Improving the open-hole
tension characteristics with variable-axial composite laminates: Optimization,
progressive damage modeling and experimental observations. Composites
Science and Technology, 185, 107889.
198. P.R. Cunningham and S. Dai. 2015. The characterisation of notched 3D woven
composites using thermos-elastic stress analysis and digital image correlation. In
20th International Conference on Composite Materials. Copenhagen, Denmark.
199. M.N. Saleh, Y. Wang, A. Yudhanto, A. Joesbury, P. Potluri, G. Lubineau and C.
Soutis. (2017). Investigating the Potential of Using Off-Axis 3D Woven
Composites in Composite Joints’ Applications. Applied Composite Materials,
24(2), 377-396.
200. G. Seon, A. Makeev, J.D. Schaefer and B. Justusson. (2019). Measurement of
Interlaminar Tensile Strength and Elastic Properties of Composites Using Open-
Hole Compression Testing and Digital Image Correlation. Applied Sciences,
9(13), 2647.
201. W. Li, H. Cai, C. Li, K. Wang and L. Fang. (2014). Progressive failure of
laminated composites with a hole under compressive loading based on micro-
mechanics. Advanced Composite Materials, 23(10), 477-490.
202. O.J. Nixon-Pearson, S.R. Hallett, P.J. Withers and J. Rouse. (2013). Damage
development in open-hole composite specimens in fatigue. Part 1: Experimental
investigation. Composite Structures, 106, 882-889.
203. P. Wright, X. Fu, I. Sinclair and S.M. Spearing. (2008). Ultra High Resolution
Computed Tomography of Damage in Notched Carbon Fiber—Epoxy
Composites. Journal of Composite Materials, 42(19), 1993-2002.
204. D.S. Brookstein. (1986). Joining methods for advanced braided composites.
Composite Structures, 6(1-3), 87-94.
205. N.T. Vo, R.C. Atwood and M. Drakopoulos. 2019. Preprocessing techniques for
removing artifacts in synchrotron-based tomographic images. In SPIE Optical
Engineering + Applications. San Diego, US: International Society for Optics and
Photonics.
206. M. Mariatti, M. Nasir and H. Ismail. (2001). Effects of hole locations and hole
sizes on damaged behaviour of woven thermoplastic composites. Polymer
Testing, 20(2), 179-189.
207. C. Soutis. (2014). Introduction: Engineering requirements for aerospace
composite materials, In P.E. Irving and C. Soutis (Eds.), Polymer Composites in
the Aerospace Industry. Woodhead. 1-18.

References
169
208. S.S. Yao, F.L. Jin, K.Y. Rhee, D. Hui and S.J. Park. (2018). Recent advances in
carbon-fiber-reinforced thermoplastic composites: A review. Composites Part B:
Engineering, 142, 241-250.
209. J.P. Carey, G.W. Melenka, A.J. Hunt and C. Ayranci. (2017). Introduction to
braided composite material behavior, In J.P. Carey (Ed.), Handbook of Advances
in Braided Composite Materials: Theory, Production, Testing and Applications.
Woodhead Publishing. 207-237.
210. D. Ivanov, S. Ivanov, S. Lomov and I. Verpoest. (2009). Strain mapping analysis
of textile composites. Optics and Lasers in Engineering, 47(3-4), 360-370.
211. G. Zhao, L. Zhang, C. Tang, W. Hao and Y. Luo. (2019). Clustering of AE signals
collected during torsional tests of 3D braiding composite shafts using PCA and
FCM. Composites Part B: Engineering, 161, 547-554.
212. P.S. Cho, R.H. Johnson and T.W. Griffin. (1995). Cone-beam CT for
Radiotherapy Applications. Physics in Medicine and Biology, 40(11), 1863-1883.
213. S.R. Stock. (2008). Recent advances in X-ray microtomography applied to
materials. International Materials Reviews, 53(3), 129-181.
214. J.D. O'Sullivan. (1985). A Fast Sinc Function Gridding Algorithm for Fourier
Inversion in Computer Tomography. IEEE Transactions on Medical Imaging,
4(4), 200-207.
215. X.-W. Yu, H. Wang and Z.-W. Wang. (2019). Analysis of yarn fiber volume
fraction in textile composites using scanning electron microscopy and X-ray
micro-computed tomography. Journal of Reinforced Plastics and Composites,
38(5), 199-210.
216. A.C. West and D.O. Adams. (1999). Axial yarn crimping effects in braided
composite materials. Journal of Composite Materials, 33(5), 402-419.
217. F.M. Edwin Donnelly. Polar Transformer. 2013; Available from:
https://imagej.nih.gov/ij/plugins/polar-transformer.html.
218. G. Yu, X. Gao and Y. Song. (2017). Experimental investigation of the tension-
torsion coupling behavior on needled unidirectional C/SiC composites. Materials
Science and Engineering A, 696(February), 190-197.
219. N.A. Fleck. (1997). Compressive failure of fiber composites, In J.W. Hutchinson
and T.Y. Wu (Eds.), Advances in Applied Mechanics. Academic Press Inc. 43-
117.