damage detection in beam structures using a combined...
TRANSCRIPT

1
Abstract In this paper, a combined genetic algorithm and non-linear optimisation system is designed and used in the identification of structural damage of a cantilever isotropic beam regarding its location and severity. The vibration-based features, both natural frequencies (i.e. eigenvalues) and displacement mode shapes (i.e. eigenvectors) of the structure in the first two out-of-plane-bending modes, are selected as damage features for various types of damage comprising saw-cut and impact. For this purpose, the commercial finite element modelling and analysis software MSC Patran/Nastran® is used to obtain the aforementioned features from intact and damaged structures. These features are arranged to construct residual equations of the structure and to identify damage location and severity, the residual vectors are minimised using a combined genetic algorithm and non-linear optimisation system. The prediction of the damage type compares the objective function values of different simulations which are associated with damage types. Keywords: damage detection, genetic algorithm, non-linear optimisation, finite element analysis, residual force vector method, beam structures. 1 Introduction Four levels of damage identification as represented by Rytter [1], as follows:
• Level 1: Determination that damage is present in the structure • Level 2: Determination of the geometric location of the damage • Level 3: Quantification of the severity of the damage • Level 4: Prediction of the remaining service life of the structure
Vibration-based damage identification methods indicate only the Level 1 and Level 2 damage identification. If the structural model is included in vibration-based analysis, then Level 3 damage identification can be obtained. Level 4 prediction is
Paper 84 Damage Detection in Beam Structures using a Combined Genetic Algorithm and Nonlinear Optimisation System S. Aktasoglu and M. Sahin Department of Aerospace Engineering Middle East Technical University, Ankara, Turkey
©Civil-Comp Press, 2012 Proceedings of the Eleventh International Conference on Computational Structures Technology, B.H.V. Topping, (Editor), Civil-Comp Press, Stirlingshire, Scotland

2
generally associated with the fields of fracture mechanics, structural design assessment and fatigue-life analysis. In order to have Level 3 type damage identification method, structures can be modelled analytically or via finite element methods. The finite element methods are receiving an attention in recent years due to providing an opportunity of analysing even complex structures accurately and economically [2]. Most of the damage identification methods in literature use FEM extractions [3] or directly FEM updating for matrix updating methods [4]. Using FEM can also be divided into two main groups; researchers using their own in-house FE codes [5] and the researchers using commercial FEM tools [6]. If FEM updating is associated with researchers who are using their own codes, then it can be said that those codes are more applicable on multi damage cases [7] although they are limited with the shape of the structure, i.e. FE codes written on the basis of beam elements can only be applicable to 1-D beam-like structures.
The difficulty on damage detection is due to the fact that it is a non-unique and inverse problem as different damage types at various locations and with different severities may lead same changes on the dynamic behaviour of the structure [8]. Therefore, type sensitive algorithms may results better in location and severity predictions but the assumption of detecting the correct type of damage holds true. Different type of damage creates different physical properties on the host structure. Due to the fact that modal parameters are functions of physical properties of the structure, changes on physical properties affects also modal parameters. For example, any deficiency due to an impact on structure can be modelled as percentage reduction in stiffness of the elements that are exposed on FE [5]. Furthermore, saw-cut on a structure can be modelled as a percentage reduction in thickness [9] and/or cross-section [10] of the model.
These difficulties in damage identification generally increase gradient based optimisation algorithm's probability to get stuck into a local minimum rather than finding a global optimum. Both its ability to explore whole solution space and being non-gradient while searching makes Genetic Algorithm (GA) to be a candidate for this optimisation problem. However, genetic algorithm is inherently slow especially in convergence step of the optimisation. Therefore it is decided to combine GA power of finding promising regions for the solution space with a speed of “local optimiser” and constrained nonlinear multivariable function of Matlab [11] (so-called FMINCON) is chosen as the hybrid optimiser. 2 Finite Element Modelling and Analysis The isotropic cantilevered beam structure (1000mm × 50mm × 25mm) is used during the analysis and modelled in MSC Patran® [12] via QUAD4 element type as 15×1 elements to correlate with benchmark article [5]. Figure 1 (a) shows the cantilever beam FEM isometric view with beam elements Figure 1 (b), on the other hand, shows the element numbering of FE and top view of the model. Cantilever boundary condition is obtained by fixing six degrees of freedom of the related root nodes.

3
Figure 1: Cantilever beam with QUAD4 element model (a) Isometric view
(b) Top view with element numbering
Different mesh densities are studied in order to select the optimum one, i.e. providing of minimum computational source with reasonable accuracy. The criterion for the accuracy is provided in the form of percentage difference from the analytical data and it is given in Equation (1). 15x1 QUAD4 elements (Table 1, representing the natural frequencies of the healthy structure) are selected due to providing results with reasonable degree of accuracy and to correlate with number of elements with the study [5] which is chosen as a benchmark.
· 100 (1)
Mode Number
Theoretical [13] FEA [5] FEM (QUAD4 15x1)
% Difference % Difference 1 20.72 21.00 1.34 20.75 0.17% 2 129.84 131.30 1.11 129.19 -0.50%
Table 1: Comparison of natural frequencies of FEA [5] and 15x1-element FEM results to theoretical one

4
To apply damage conditions on individual elements, element properties in FEM are assigned separately. As mentioned before, impact and saw-cut type damages are examined in this paper. While, impact type damage is modelled as percentage reduction of elastic modulus of an individual element in FEM, saw-cut type damage is modelled as percentage reduction of thickness of an individual element on FEM. In order to test the damage detection algorithm; single damage modelling procedure is followed for all elements with various damage severities. Damage severities are covered from 10% reduction of predefined properties as minimum to 70% reduction as maximum by an increment of 10%. Therefore, seven different damage severities on number of elements (i.e. 15 different elements along the span of the beam) provide 105 different damage scenarios in total to check the damage detection system for each damage type. However, for multi damage cases, a random damage creation routine is written in order to create damage scenarios which are twice the number of elements and every individual element involves scenarios with two different damage severity cases. Table 2 shows single damage scenarios and the damaged natural frequency ( ) results of the FE analysis. Table 3, on the other hand, shows the multi damage scenarios and corresponding normal mode dynamic analysis results.
Damage Type Impact Type Damage Saw-cut Type Damage
Damage Location(s) Single Single
12th element 3rd element
Damage Severity 20% 40%
Mode Number % Difference % Difference
1 20.75 0.03 16.71 19.48
2 128.54 0.50 127.23 1.52
Table 2: Comparison of natural frequencies of Single Damage FEM Model to Intact FEM Model
3 Damage Identification Algorithm 3.1 Damage Sensitive Features The presence of damage changes structural properties of the structure. These changes can be directly observed on natural frequencies and mode shapes, or can be analysed post processed versions of those as such, curvature mode shape, modal strain energy, etc. Due to the fact that, having more than one feature is beneficial to identify damage which is a non-unique and inverse problem, both natural frequency and mode shape information are used with Residual Force Vector (RFV) technique [14] for the damage identification method developed in this study.

5
Damage Type Impact Type Damage Saw-cut Type Damage
Damage
Location(s)
Both on Both on
3rd Element 12th Element 3rd Element 12th Element
Damage
Severity 40% 20% 40% 20%
Mode Number % Difference % Difference
1 19.75 4.83 16.91 18.51
2 127.93 0.98 124.90 3.32
Table 3: Comparison of natural frequencies of Multi Damage FEM Model to Intact FEM Model
Commercial program MSC Patran/Nastran® is used for both modelling and extracting the necessary information for RFV method. The necessary information, namely the damaged eigenvalues, corresponding eigenvectors and the intact structure’s elemental mass and stiffness matrices, are obtained by means of a special coding so-called Direct Matrix Abstraction Programming (DMAP) of MSC Nastran®. DMAP enables extracting structural properties of a model in a file(s) and gives opportunity to analyse it/them elsewhere, such as Matlab, which is used in this particular research study. By means of these analysis, the effects of the damaged models comprising impact type damage (i.e. percentage reduction in elastic modulus) and/or saw-cut type damage (i.e. percentage reduction in thickness) on the obtained mass and stiffness matrices are represented in the form of sensitivity matrices. Then, these damage sensitivity matrices are embedded into RFV equation and it becomes;
, . . . , . . (2)
where represents the jth mass normalised eigenvector, and are the ith
element of stiffness and mass matrices, respectively. Additionally, and stand for mass and stiffness sensitivity matrices, respectively. If impact type damage is in question then is a measure of elastic moduli change, however, if saw-cut type damage is the one in question then both and are measure of thickness change simultaneously. That means, the sensitivity analyses are performed for impact type damage with the assumption of having no change in the mass of the structure by means of an impact and therefore, matrix is not taken into account. Sensitivity

6
analyses are conducted by 10% deviations of the property of interest starting from 10% to 100% of the individual element. In Equation 2, variable provides results between 0 and 1, which are representing complete loss of an element of a structure and undamaged element, respectively.
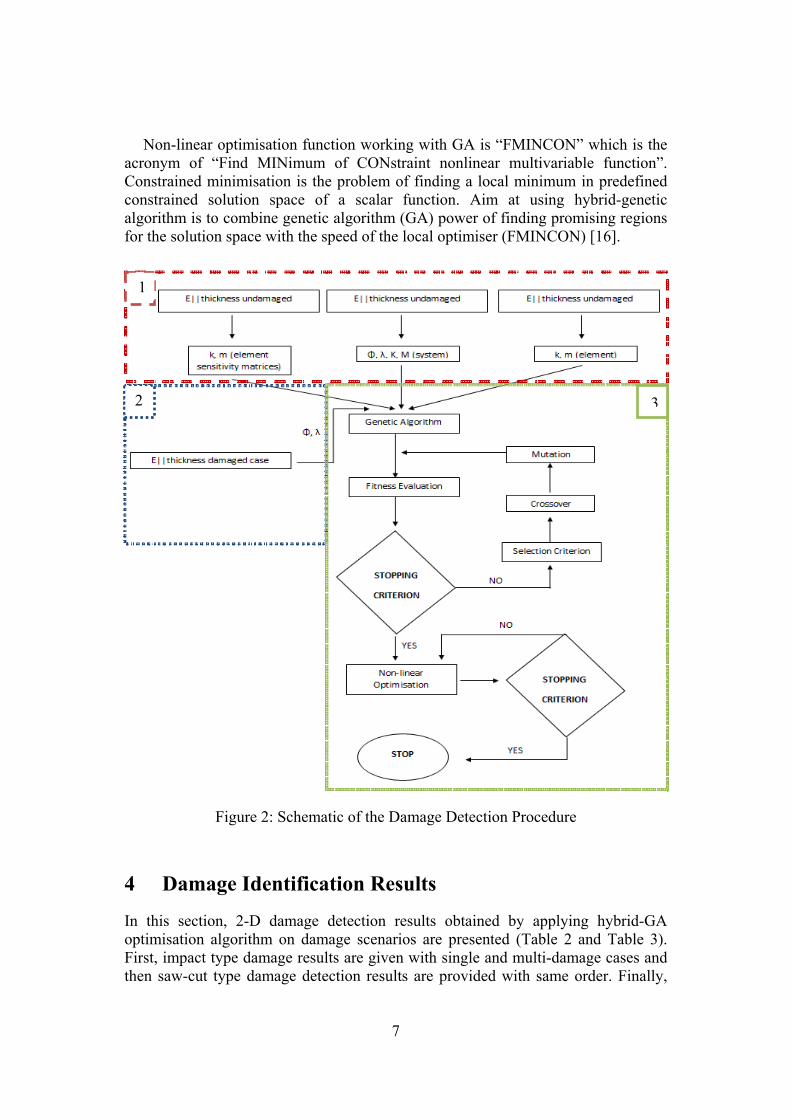
3.2 Optimisation Problem The schematic of the detection procedure given in Figure 2 actually sums up how the optimisation routine works. As it is seen from the figure, the first part is for the preparation of the damage detection system. For this purpose, Matlab and Msc.Nastran work simultaneously on intact FEM model. The second part, on the other hand, is responsible from getting information of the damaged structure which is in fact the external input to the system. This can also be done either by providing experimental analysis results of the damaged structure or by creating hypothetical damage scenarios via FE modelling and analysis results. Damaged models generated on FEMs are preferred in this research study in order to check damage detection system performance and to avoid costly experimental tests and analyses. The third part is the optimization part of the system which is handled by means of both Genetic Algorithm (GA) and non-linear optimization hybrid system which belong to the optimization toolbox of the Matlab [15]. In the optimisation algorithms, in order to reach a solution, boundary conditions are set to values between 0.3 and 1.0 by providing a correlation with the severities simulating various damage scenarios.
In this study, GA, which is a solver of Matlab optimisation toolbox, is applied on structural damage identification in order to minimise the objective function which is given in the following equation;
norm , . . . , . . (3)
where is the jth mode shape of the damaged structure and “n” is the number of mode shapes that are used to be optimised. The optimisation is performed over RFV by making it approach to zero after certain number of iterations and/or generations. Norm of a vector, which corresponds to any value of Eqn. 3, is calculated via Matlab as in Equation 4.
(4)
where l is the total number of elements of the vector and is the kth element of the vector. This equation enables to minimise the total distance to 0 of the objective function.
7
Non-linear optimisation function working with GA is “FMINCON” which is the acronym of “Find MINimum of CONstraint nonlinear multivariable function”. Constrained minimisation is the problem of finding a local minimum in predefined constrained solution space of a scalar function. Aim at using hybrid-genetic algorithm is to combine genetic algorithm (GA) power of finding promising regions for the solution space with the speed of the local optimiser (FMINCON) [16].
Figure 2: Schematic of the Damage Detection Procedure
4 Damage Identification Results
In this section, 2-D damage detection results obtained by applying hybrid-GA optimisation algorithm on damage scenarios are presented (Table 2 and Table 3). First, impact type damage results are given with single and multi-damage cases and then saw-cut type damage detection results are provided with same order. Finally,
2 3
1
2 3

8
damage type decision mechanism is explained under the investigation of damage type section.
4.1 Impact Type Damage As a sample damage case, the below results correspond to the impact type damage on the 12th element with 20% severity (Table 2). GA narrows down the solution space of the optimisation problem within 250 iterations, which is shown in Figure 3 and then pass the problem to non-linear optimisation for further iterations. Italic and bold style written numbers in this study, as in Figure 3(c), indicates damage locations and corresponding intactness levels of the elements. Non-linear optimisation (i.e. FMINCON) works as a part of the hybrid optimisation routine and the starting point for the optimisation problem (i.e. investigation for the damage) is given on Figure 3(c).
Figure 3: GA results for 20% damage on the 12th element (a) History of Convergence (b) Identified damage location and severity
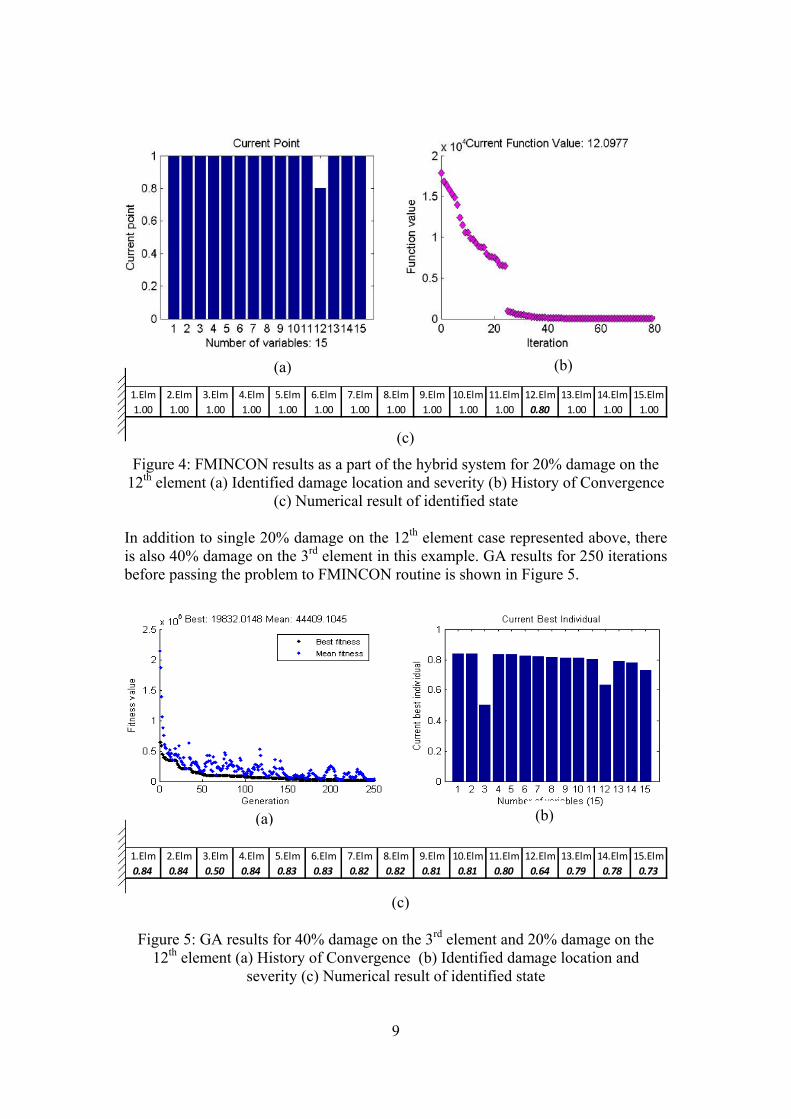
(c) Numerical result of identified state After FMINCON deals with the optimisation problem, it stops with objective function value of 12.10 (Figure 4(b)), which is close the intended one (i.e. zero) by finding the exact damage locations and severities (Figure 4(c)). Damage locations are indicated with italic and bold font at FMINCON part as well.
1.Elm 2.Elm 3.Elm 4.Elm 5.Elm 6.Elm 7.Elm 8.Elm 9.Elm 10.Elm 11.Elm 12.Elm 13.Elm 14.Elm 15.Elm0.88 0.88 0.88 0.88 0.88 0.88 0.87 0.87 0.86 0.86 0.85 0.67 0.83 0.84 0.91
(a) (b)
(c)
9
Figure 4: FMINCON results as a part of the hybrid system for 20% damage on the 12th element (a) Identified damage location and severity (b) History of Convergence
(c) Numerical result of identified state In addition to single 20% damage on the 12th element case represented above, there is also 40% damage on the 3rd element in this example. GA results for 250 iterations before passing the problem to FMINCON routine is shown in Figure 5.
Figure 5: GA results for 40% damage on the 3rd element and 20% damage on the 12th element (a) History of Convergence (b) Identified damage location and
severity (c) Numerical result of identified state
1.Elm 2.Elm 3.Elm 4.Elm 5.Elm 6.Elm 7.Elm 8.Elm 9.Elm 10.Elm 11.Elm 12.Elm 13.Elm 14.Elm 15.Elm1.00 1.00 1.00 1.00 1.00 1.00 1.00 1.00 1.00 1.00 1.00 0.80 1.00 1.00 1.00
1.Elm 2.Elm 3.Elm 4.Elm 5.Elm 6.Elm 7.Elm 8.Elm 9.Elm 10.Elm 11.Elm 12.Elm 13.Elm 14.Elm 15.Elm0.84 0.84 0.50 0.84 0.83 0.83 0.82 0.82 0.81 0.81 0.80 0.64 0.79 0.78 0.73
(a) (b)
(c)
(a) (b)
(c)
10
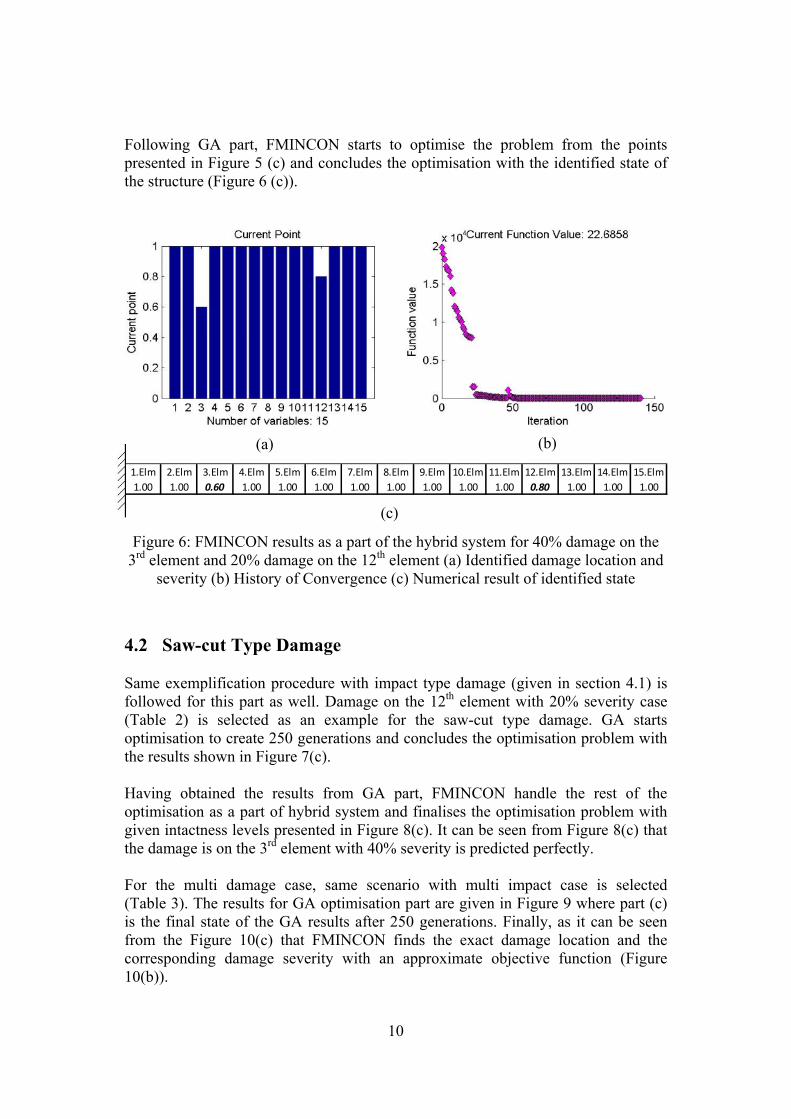
Following GA part, FMINCON starts to optimise the problem from the points presented in Figure 5 (c) and concludes the optimisation with the identified state of the structure (Figure 6 (c)).
Figure 6: FMINCON results as a part of the hybrid system for 40% damage on the 3rd element and 20% damage on the 12th element (a) Identified damage location and
severity (b) History of Convergence (c) Numerical result of identified state
4.2 Saw-cut Type Damage Same exemplification procedure with impact type damage (given in section 4.1) is followed for this part as well. Damage on the 12th element with 20% severity case (Table 2) is selected as an example for the saw-cut type damage. GA starts optimisation to create 250 generations and concludes the optimisation problem with the results shown in Figure 7(c). Having obtained the results from GA part, FMINCON handle the rest of the optimisation as a part of hybrid system and finalises the optimisation problem with given intactness levels presented in Figure 8(c). It can be seen from Figure 8(c) that the damage is on the 3rd element with 40% severity is predicted perfectly. For the multi damage case, same scenario with multi impact case is selected (Table 3). The results for GA optimisation part are given in Figure 9 where part (c) is the final state of the GA results after 250 generations. Finally, as it can be seen from the Figure 10(c) that FMINCON finds the exact damage location and the corresponding damage severity with an approximate objective function (Figure 10(b)).
1.Elm 2.Elm 3.Elm 4.Elm 5.Elm 6.Elm 7.Elm 8.Elm 9.Elm 10.Elm 11.Elm 12.Elm 13.Elm 14.Elm 15.Elm1.00 1.00 0.60 1.00 1.00 1.00 1.00 1.00 1.00 1.00 1.00 0.80 1.00 1.00 1.00
(a) (b)
(c)

11
Figure 7: GA results for 40% damage on the 3rd element (a) History of Convergence (b) Identified damage location and severity
(c) Numerical result of identified state
Figure 8: FMINCON results as a part of the hybrid system for 40% damage on the 3rd element (a) Identified damage location and severity (b) History of Convergence
(c) Numerical result of identified state
1.Elm 2.Elm 3.Elm 4.Elm 5.Elm 6.Elm 7.Elm 8.Elm 9.Elm 10.Elm 11.Elm 12.Elm 13.Elm 14.Elm 15.Elm0.93 0.92 0.55 0.92 0.91 0.91 0.90 0.89 0.88 0.87 0.86 0.84 0.84 0.83 0.77
1.Elm 2.Elm 3.Elm 4.Elm 5.Elm 6.Elm 7.Elm 8.Elm 9.Elm 10.Elm 11.Elm 12.Elm 13.Elm 14.Elm 15.Elm1.00 1.00 0.60 1.00 1.00 1.00 1.00 1.00 1.00 1.00 1.00 1.00 1.00 1.00 1.00
(a) (b)
(c)
(a) (b)
(c)

12
Figure 9: GA results for 40% damage on the 3rd element and 20% damage on the 12th element (a) History of Convergence (b) Identified damage location and severity
(c) Numerical result of identified state
Figure 10: FMINCON results as a part of the hybrid system for 40% damage on the 3rd element and 20% damage on the 12th element (a) Identified damage location and
severity (b) History of Convergence (c) Numerical result of identified state 4.3 Investigation of Damage Type Damage detection mechanism shown in Figure 2 in part 2 is repeated twice in order to select which damage type fits more on the given state of the damaged structure.
1.Elm 2.Elm 3.Elm 4.Elm 5.Elm 6.Elm 7.Elm 8.Elm 9.Elm 10.Elm 11.Elm 12.Elm 13.Elm 14.Elm 15.Elm0.94 0.94 0.56 0.93 0.93 0.93 0.93 0.93 0.93 0.92 0.92 0.74 0.92 0.90 0.87
1.Elm 2.Elm 3.Elm 4.Elm 5.Elm 6.Elm 7.Elm 8.Elm 9.Elm 10.Elm 11.Elm 12.Elm 13.Elm 14.Elm 15.Elm1.00 1.00 0.60 1.00 1.00 1.00 1.00 1.00 1.00 1.00 1.00 0.80 1.00 1.00 1.00
(a) (b)
(c)
(a) (b)
(c)
13
Fittest one is decided by comparing their convergence levels (i.e. the lowest objective function value is being the fittest).
Damage Type Impact Type Damage
Damage Location(s) Single
7th element
Damage Severity 30%
Mode Number % Difference
1 20.55 0.99% 2 126.36 2.19%
Table 4: Comparison of natural frequencies of Single Damage FEM Model to Intact FEM Model
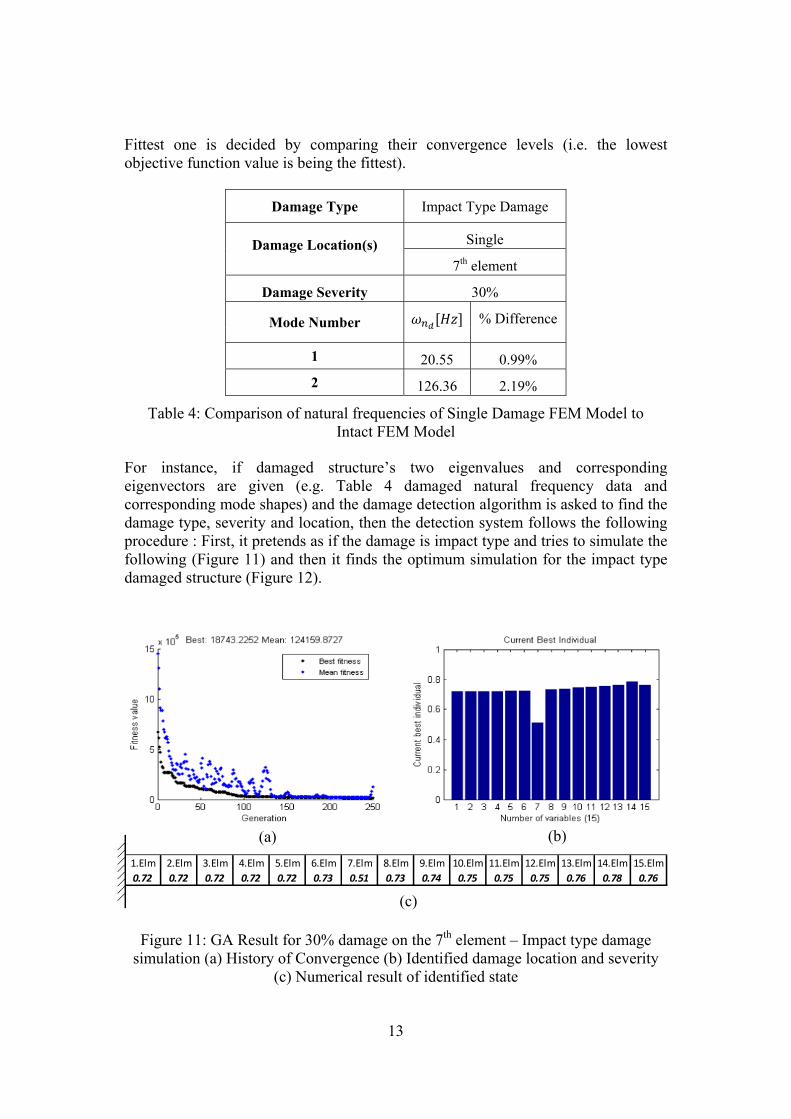
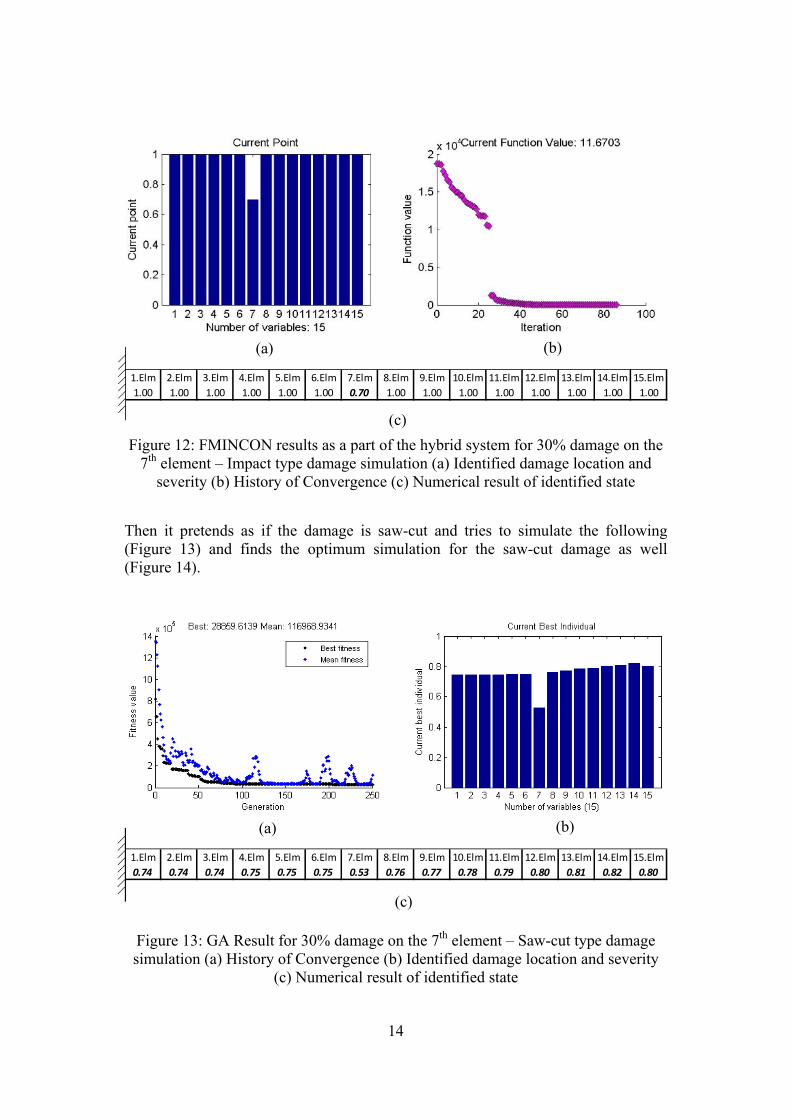
For instance, if damaged structure’s two eigenvalues and corresponding eigenvectors are given (e.g. Table 4 damaged natural frequency data and corresponding mode shapes) and the damage detection algorithm is asked to find the damage type, severity and location, then the detection system follows the following procedure : First, it pretends as if the damage is impact type and tries to simulate the following (Figure 11) and then it finds the optimum simulation for the impact type damaged structure (Figure 12).
Figure 11: GA Result for 30% damage on the 7th element – Impact type damage simulation (a) History of Convergence (b) Identified damage location and severity
(c) Numerical result of identified state
1.Elm 2.Elm 3.Elm 4.Elm 5.Elm 6.Elm 7.Elm 8.Elm 9.Elm 10.Elm 11.Elm 12.Elm 13.Elm 14.Elm 15.Elm0.72 0.72 0.72 0.72 0.72 0.73 0.51 0.73 0.74 0.75 0.75 0.75 0.76 0.78 0.76
(a) (b)
(c)
14
Figure 12: FMINCON results as a part of the hybrid system for 30% damage on the 7th element – Impact type damage simulation (a) Identified damage location and
severity (b) History of Convergence (c) Numerical result of identified state
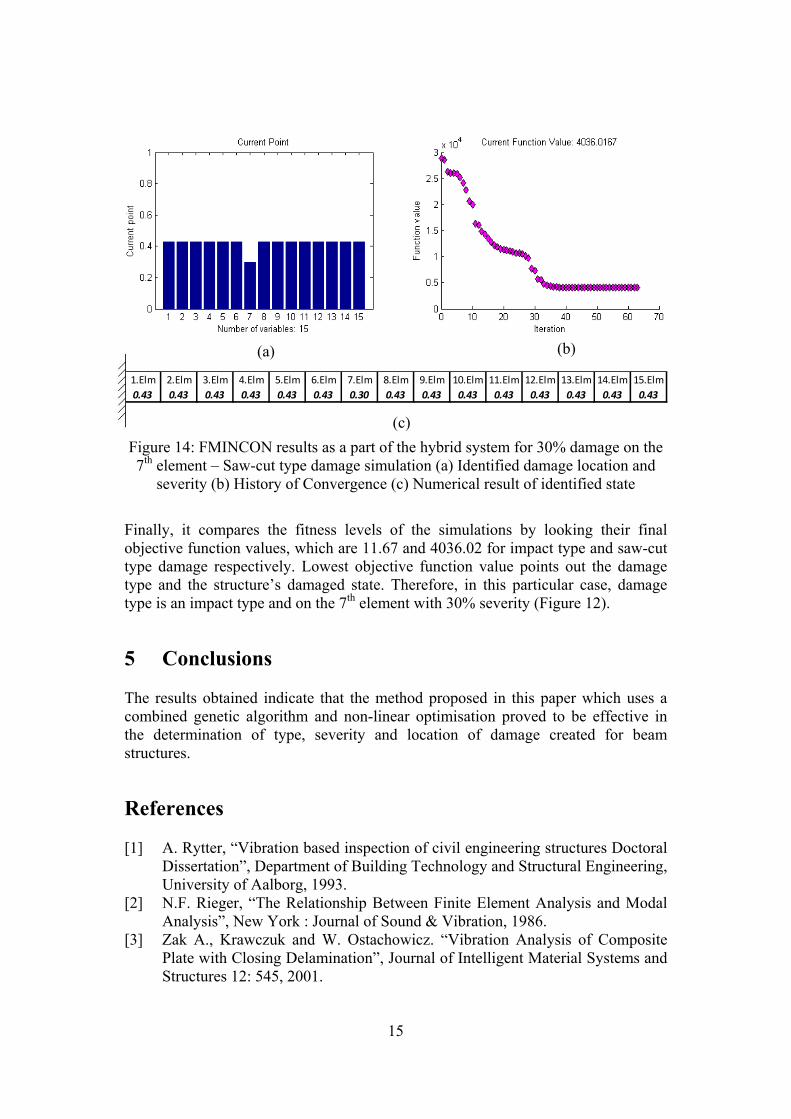
Then it pretends as if the damage is saw-cut and tries to simulate the following (Figure 13) and finds the optimum simulation for the saw-cut damage as well (Figure 14).
Figure 13: GA Result for 30% damage on the 7th element – Saw-cut type damage simulation (a) History of Convergence (b) Identified damage location and severity
(c) Numerical result of identified state
1.Elm 2.Elm 3.Elm 4.Elm 5.Elm 6.Elm 7.Elm 8.Elm 9.Elm 10.Elm 11.Elm 12.Elm 13.Elm 14.Elm 15.Elm1.00 1.00 1.00 1.00 1.00 1.00 0.70 1.00 1.00 1.00 1.00 1.00 1.00 1.00 1.00
1.Elm 2.Elm 3.Elm 4.Elm 5.Elm 6.Elm 7.Elm 8.Elm 9.Elm 10.Elm 11.Elm 12.Elm 13.Elm 14.Elm 15.Elm0.74 0.74 0.74 0.75 0.75 0.75 0.53 0.76 0.77 0.78 0.79 0.80 0.81 0.82 0.80
(a) (b)
(c)
(a) (b)
(c)
15
Figure 14: FMINCON results as a part of the hybrid system for 30% damage on the 7th element – Saw-cut type damage simulation (a) Identified damage location and
severity (b) History of Convergence (c) Numerical result of identified state Finally, it compares the fitness levels of the simulations by looking their final objective function values, which are 11.67 and 4036.02 for impact type and saw-cut type damage respectively. Lowest objective function value points out the damage type and the structure’s damaged state. Therefore, in this particular case, damage type is an impact type and on the 7th element with 30% severity (Figure 12).
5 Conclusions The results obtained indicate that the method proposed in this paper which uses a combined genetic algorithm and non-linear optimisation proved to be effective in the determination of type, severity and location of damage created for beam structures.
References [1] A. Rytter, “Vibration based inspection of civil engineering structures Doctoral
Dissertation”, Department of Building Technology and Structural Engineering, University of Aalborg, 1993.
[2] N.F. Rieger, “The Relationship Between Finite Element Analysis and Modal Analysis”, New York : Journal of Sound & Vibration, 1986.
[3] Zak A., Krawczuk and W. Ostachowicz. “Vibration Analysis of Composite Plate with Closing Delamination”, Journal of Intelligent Material Systems and Structures 12: 545, 2001.
1.Elm 2.Elm 3.Elm 4.Elm 5.Elm 6.Elm 7.Elm 8.Elm 9.Elm 10.Elm 11.Elm 12.Elm 13.Elm 14.Elm 15.Elm0.43 0.43 0.43 0.43 0.43 0.43 0.30 0.43 0.43 0.43 0.43 0.43 0.43 0.43 0.43
(a) (b)
(c)

16
[4] C. Mares, and C. Surace, “An Application of Genetic Algorithms to Identify Damage in Elastic Structure”, Journal of Sound and Vibration; 195(2):195-215, 1996.
[5] M.I. Friswell, J.E.T. Penny and S.D. Garvey, “A combined genetic Eigensensivity Algorithm for the Location”, Computers & Structures; 69: 547-56., 1998
[6] J.T. Kim et al. “Damage Identification in Beam-Type Structures: Frequency-Based Method vs. Mode-Shape-Based Method”, Engineering Structures, 25, 57-67, 2003.
[7] E.P. Carden and P. Fanning, “Vibration Based Condition Monitoring: A Review”, Structural Health Monitoring 355, 2004.
[8] M. Sahin, “Damage Identification in Beam-like Structures by Vibration-based Analysis and Artificial Neural Networks”, University of Southampton, March 2004.
[9] Jialai Wang and P. Qiao, . “Improved Damage Detection for Beam-type Structures using a Uniform Load Surface”, Structural Health Monitoring 6:99, 2007.
[10] H. Hao, M. Asce, and Y. Xia,. “Vibration-based Damage Detection of Structres by Genetic Algorithm”, Journal of Computing in Civil Engineering Vol. 16, No. 3, pp. 222–229, 2002.
[11] MATLAB. [Online] MathWorks. [Cited: 24 January 2012.] http://www.mathworks.com/.
[12] MSC®/PATRAN v2007 r1b (2007), “Reference Manual”, MSC.Software. [13] R.D. Blevins, “Formulas for Natural Frequency and Mode Shape”, Krieger
Publishing Company, Melbourne, Florida., 1995 [14] M.A. Rao, J. Srinivas and B.S.N. Murthy, “Damage Detection in Vibrating
Bodies Using Genetic Algorithms”, Computers & Structures; 82(11-12):963-8, 2004.
[15] Optimization Toolbox. [Online] MathWorks. [Cited: 24 January 2012.] http://www.mathworks.com/products/optimization/.
[16] V. Meruane and W. Heylen, Damage Detection by a Real-Parameter Hybrid Genetic Algorithm. Poland : Proceedings of the Fourth European Workshop on Structural Health Monitoring, 1073-1080, July 2008.