dam foundation erosion - bureau of reclamation · hdr engineering inc. (hdr), operating from 26...
TRANSCRIPT

I JA F- WIA 3
BUREAU OF RECLAMATION ■ COLORADO STATE UNIVERSITY ■ HDR ENGINEERING
C DAM FOUNDATION EROSION
PRE-TEST REPORT
r BY
R. WITTLER, B. MEFFORD, G. ANNANDALE, S. ABT, J. RUFF
MIN
Zca~ <'
1 Hydraulic Investigations and Laboratory Services
Official File Copy

l
The formal presentation of this Pre-Test Report was at the seminar "Dam Safety: Overtopping Dam Foundation Erosion and Embankment Dam Breaching Parameters" in San Francisco on October 28, 1993.
Cooperative Agreements The Department of the Interior Bureau of Reclamation and Pacific Gas & Electric Company (PG&E) signed a Cooperative Research and Development Master Agreement (Z-19-2-186-91) in December 1991. This agreement is under the authority of the Technology Transfer Act of 1986 (Public Law 99-502). The purpose of the CRDA is to perform cooperative research under the Reclamation Water Technology and Environmental Research (WATER) program.
To date there are two Task Agreements between PG&E and Reclamation under the Master Agreement related to Erosion Characteristics of Dam Foundations. The first, completed, is for a Survey of , Literature. The second, in progress, is for a Pre-Test Report and Design of Laboratory and prototype physical models.

About the Authors Professor Steven Abt, Hydraulic Laboratory Director & Hydraulics Program Coordinator, Colorado State University, is Team Leader for the Scaled Model phase of the Dam Foundation Erosion project.
Dr. George Annandale, Manager: Water Resources, HDR Engineering, is Team Leader for the Numerical Modeling phase of the Dam Foundation Erosion project.
Mr. Brent Mefford, Head, Hydraulic Structures Section, Bureau of Reclamation, is Team Leader for the contracts and administration parts of the Dam Foundation Erosion project.
Dr. James Ruff, Professor of Civil Engineering, Colorado State University, is Team Leader for the Prototype Model phase of the Dam Foundation Erosion project.
Mr. Rodney Wittler, Research Hydraulic Engineer, Bureau of Reclamation, is Project Manager and Principal Investigator for the Dam Foundation Erosion project.
Acknowledgments Mr. Jerry Fitzwater, Reclamation Civil Engineering Technician, prepared the drawings for this report and Mr. Julio Kuroiwa, Colorado State University Hydraulics Program, contributed to the Literature Survey section.
P,
e
I D

I Collaborating Organizations The mission of the Bureau of Reclamation (Reclamation) is to manage, develop and protect water and related resources in an environmentally and economically sound manner in the interest of the American Public. Reclamation is responding to the challenge to help develop the West by providing sustained economic growth, improving the environment, and enhancing quality of life. In the future, ` Reclamation will be meeting increasingly complex water demands and resource management needs of the West.
The Electric Power Research Institute (EPRI) conducts a far-reaching program of collaborative research and development on behalf of the nation's electric power industry. Today some 350 EPRI scientists and engineers manage nearly 1600 research projects related to the efficient generation, delivery, and use of electricity, with special attention paid to cost-effectiveness and environmental acceptability. Roughly 700 electric utilities fund EPRI research through membership payments and project investments. Research and development, in the form of products, services, and information, apply directly to the benefit of EPRI members and their customers.
Pacific Gas & Electric Company (PG&E) is a privately owned public utility company providing electric and natural gas service to 6.5 million customers in Northern and Central California. PG&E electric power sources include Hydro, geothermal, fossil, and nuclear generation. PG&E's current Hydro electric capability is 3,874 MW from 67 plants. Most sites for these plants are on the western slope of the Sierra Nevada. More than 130 impounding and diversion structures ranging in size from the 335-foot high Salt Springs Dam to small canal diversion structures make up the Hydro sources. The company has a strong research and development program to address dam safety and other Hydro issues.
HDR Engineering Inc. (HDR), operating from 26 offices, employs more than 1,500 people nationwide and is active in three business classes: water engineering, transportation, and solid waste. Water engineering is a prominent activity at HDR expanding to water resources, hydroelectric n engineering, water/waste water engineering, and hydraulics and hydrology over the past 75 years. u HDR Engineering specializes in earth erodibility and engineered earth materials applying the specialty to dam safety projects.
Colorado State University (CSU), founded in 1870, is the land grant university in Colorado. The Civil Engineering Department enrolls roughly 350 undergraduate and 200 graduate students. Recent n research by Civil Engineering faculty includes river mechanics, bank stabilization technology, f environmental methods in stream rehabilitation, drop structures, stream monitoring, and embankment YYY
overtopping. The Hydraulics Laboratory, Hydromachinery Laboratory, and Outdoor laboratories at (~ the Engineering Research Center are part of the unique research facilities at Colorado State University.
0 III
iv

0
TABLE OF CONTENTS
Cooperative Agreements .............................................................................................................. ii
Aboutthe Authors ...................................................................................................................... iii
Acknowledgments....................................................................................................................... iii
Collaborating Organizations ....................................................................................................... iv
INTRODUCTION 1
Dam Foundation Erosion: Pre-Test Report ......................:............................................................1
OVERVIEW OF PHYSICAL PROCESSES 2
Hydrology................................................................................................................................... 2
TheDam as a Weir ......................................................................................................................2
JetCharacteristics .......................................................................................................................2
PlungePool Hydraulics ................................................................................................................2
Erosion & the Geomechanical Index ............................................................................................. 3
Displacement............................................................................................................................... 3
OVERVIEW OF NEW TECHNOLOGY 4
Erodibility Threshold - Fundamentals ...........................................................................................4
General Description of Erosion Process ........................................................................................4
Capacity of Material to Resist Erosion .........................................................................................5
ErosivePower of Water ............................................................................................................... 7
ErodibilityThreshold ................................................................................................................... 8
NewTechnology Algorithm ......................................................................................................... 9
Summary..................................................................................................................................... 9
OVERVIEW OF INVESTIGATIONS 10
Phase I - Hydraulic Investigations ..............................................................................................10
Phase H - Material Investigations ...............................................................................................10
LaboratoryInvestigations .......................................................................................................... 10 FieldInvestigations ................................................................................................................... 11
LITERATURE SURVEY 12
Techniques For Predicting the Erodibility of Earth Materials .................................................... 12 Techniques For Estimating the Extents of Erosion .................................................................... 12 Techniques For Estimating the Progressive Extents of Erosion ................................................. 13
v

Stateof the Art ..........................................................................................................................13 13 Maximum Scour or Erosion Depth ............................................................................................
AirEntrainment ....................................................................................................................... 13 Erosion Extents and Progressivity ............................................................................................. 14
CulvertScour .........................................................................14 Plunge Pool Scour ....................................................................16
Angleof Inclination .................................................................................................................. 16 Conclusions...............................................................................................................................17
HYDRAULIC INVESTIGATIONS 18
PrototypeOrifice Design ............................................................................................................18
Instrumentation Design ..................................................... .............18
Jet Characteristics, Aeration Investigations ................................................................................18
FacilityOperation ......................................................................................................................19
Hydraulics.................................................................................................................................19
Summary of Hydraulic Investigations ......................................................................................... 20
MATERIAL INVESTIGATIONS 21
Erosion extents investigation ......................................................................................................21 n
MaterialVariability ................................................................................................................... 21
The Geomechamcal System: Calculating the Erodibility Index .................................................... 21
ErodibihtyIndex Tables ............................................................................................................. 22
NUMERICAL MODEL 27
Graphical Basis & Programming ............................................................................................... 27
Segmented Process Simulation ...................................................................................................27
Hydrology................................................................................................................................. 27 Hydraulics................................................................................................................................ 27 PlungingJet ....................................................................................... SupportedJet ............................................................................................................................ 27 Jet/Tailwater Interaction ........................................................................................................... 27 Erodibility................................................................................................................................ 28 Foundation Material/Jet Interaction .......................................................................................... 28 Masswasting ............................................................................................................................ 28 Displacement............................................................................................................................ 29 Mounding................................................................................................................................. 29 Tailwater.................................................................................................................................. 29
RefinementProcess .................................................................................................................... 29
FACILITY DESIGNS 30 ;1 ~4
PrototypeModel ........................................................................................................................30
Scale.........................................................................................................................................30 vi

Capacities................................................................................................................................. 30 SizingCalculations ................................................................................................................... 30
OrificeSizing Calculation ........................................................... 30 Trajectory Calculation ............................................................... 31
Jet Characteristics and Maximum Scour Depth ......................................................................... 31 Jet Plunging Through The Atmosphere ........................................... 31 Jet Plunging Into Plunge Pool ...................................................... 36 Determination of Material Requirements ......................................... 40
Plans........................................................................................................................................ 41 ScaledModel ..............................................................................................................................43
Scale......................................................................................................................................... 43 Capacities................................................................................................................................. 43 SizingCalculations ................................................................................................................... 43
SCHEDULE 44
REPORTS & MEETINGS 45
Meetings................................................................................................................................... 45
Reports..................................................................................................................................... 45
REFERENCES Q
vii

I a
m
R
0
0
m
I I

INTRODUCTION
Allowing a concrete dam to overtop during extreme flood events is one method of complying with State and Federal Dam Safety Regulations. Designing for dam overtopping requires an analysis of the potential for erosion of the dam foundation and abutments. Current methods of evaluating erosion extents have limited applicability. Existing erosion prediction formulas do not track erosion as a function of time, and have limited application in hard-rock or cohesive foundation materials.
Spurr (27) in a discussion of a paper by Mason (20) summarizes the problems with current foundation erosion prediction schemes:
"Thus the discusser contends that time must be considered together with the unique hydraulic and geological processes existing at each site, the amount of surplus energy contained by a given jet at impact over and above the threshold resistance of the bedrock to scour, the shape of the sides of the scour hole, and the size of the downstream bar in order to determine the plunge pool's maturity before any meaningful comparison can be made. This is specifically true when predicting scour in any plunge pool which does not respond as though its bed material were essentially non-cohesive. "
Mason (2 1) in response to Spurr writes, "The quantification ofplunge pool scour rates, in conjunction with varying rock types
is an area where much useful research remains to be done. "
Dam Foundation Erosion: Pre-Test Report PG&E, EPRI, Reclamation, Colorado State University, and HDR Engineering are collaborating on improving technology for estimating the progressive extents of dam foundation erosion due to overtopping. The objective of this pre-test report is to review current technology and explain the basis for the development of new technology. This report presents the collaborators plan for developing a new approach to estimate the extents of erosion coupling hydraulics and a geomechanical index system.
The collaborators propose an investigation of erosion of dam foundations due to overtopping. The primary objective of the investigation is to develop a scheme for estimating the progressive extents of erosion. The investigation involves researching existing methods and data, conducting a systematic series of physical model tests, and developing a computer model for simulating the progressive extents of erosion. A numerical model with properly formulated boundary conditions, simulating physical processes rather than parametric empirical correlation, will provide a useful tool for estimating progressive extents of dam foundation erosion.
Predicting flow patterns, velocity distribution, and other factors of impinging jets in prototype situations is largely beyond the capability of conventional physical and numerical modeling techniques. Numerous physical model studies described in the literature have limited application due to the uncertainty of scale effects associated with jet turbulence, jet coherence, jet air entrainment, and foundation material properties. Similar limitations are characteristic of existing numerical modeling techniques that omit the inherent complexities of both impinging jets and earth materials. The development of new technology to predict dam foundation erosion therefore requires application of specialized physical modeling and numerical analysis techniques.
The collaborators intend to conduct investigations in two physical models. The indoor laboratory scale is 1:3 following Froude criteria. The outdoor laboratory model is prototype scale. The 1:3 scale model provides an economy of scale, accurately modeling some hydraulics, yet ignoring material properties and aeration effects. Accurate simulation of air-water and water-material interaction without scale effects requires a prototype scale model.
Dam Foundation Erosion Introduction • 1

11
OVERVIEW OF PHYSICAL PROCESSES
The physical processes governing erosion and overtopping jets are complex and strongly interdependent. Each process may drive the succeeding process and in turn be part of a feedback loop to previous processes. This investigation is adopting a downstream approach to classifying the physical processes. Hydrology and watershed hydraulics are the primary inputs. Reservoir routing follows producing an outflow design flood. The reservoir dam acts as a weir, the overtopping flow creating a jet as it passes the dam. The jet, with unique characteristics, impinges into a pool in the foundation area of , the dam. The material, widely varying between cohesive, non-cohesive, and hard rock material, erodes as a function of the hydraulic characteristics of the impinging jet. Finally, the tailwater level acts as a feedback to the impinging jet, while controlling the rate of material displacement from the scour zone. This section presents simple explanations of each process.
Hydrology A hydrologic analysis of a watershed, upstream of a reservoir, yields estimates for flood events ranging to the Probable Maximum Flood (PMF). On the basis of regulatory standards, a precipitation event of certain recurrence interval routed into the reservoir, produces an Inflow Design Flood (IDF). Depending upon the capacity, current level, and operation of the reservoir, the IDF translates into an Outflow Design Flood (ODF). The dam overtops when some combination of "worst case" conditions produces an ODF that exceeds the present spillway and outlet works capacity.
The Dam as a Weir ]~ Dam overtopping occurs in two distinctly different situations. The first is water overtopping the dam and forming a free trajectory jet impinging at the foundation. The second is water flowing over the downstream face of the dam. A free trajectory jet is typical of steep faced concrete dams, while a supported jet on the downstream face is typical of gravity and embankment dams.
Jet Characteristics A jet is a coherent stream of fluid matter with externally induced momentum. A free trajectory jet follows the kinematic trajectory path, while a suppressed jet follows a suppressed trajectory. The suppression is a result of sub atmospheric pressure beneath the jet. If the jet does not detach from the break point, or does not detach from the abutments, then air flow beneath the jet is restricted, pressure falls, suppressing the jet. The term describing the mechanism of jet detachment from the abutments is contraction. The vena contracts occurs near the break point of the jet and has the characteristic of hydrostatic, atmospheric pressure distribution across the jet.
Components of plunging jets include core and aerated zones. The aerated zones develop due to the entrainment of air as the jet plunges through the atmosphere. This causes a reduction in the dimensions of the inner core of the jet. The significance of the dimensional reduction of the central core is dependent on the plunging distance. Excessive plunging distances will result in complete diffusion of the jet with very small erosive power. However, if the core remains intact when plunging into the plunge pool it will progressively diffuse below the water surface as it is being transformed to fully developed two-phase flow.
a Plunge Pool Hydraulics Flow in a developing scour hole is either partially or fully developed two-phase flow. The extent to which two-phase flow develops is a function of jet dynamics and the entrainment of air. The flow patterns in the plunge pool are dynamic and transitory. Dynamic implies multifrequency turbulent fluctuations and energy dissipation. Transitory implies that large flow patterns change direction and
Dam Foundation Erosion Overview of Physical Processes • 2

magnitude as the scour hole geometry changes. The depth of water, indicated by the tailwater depth, is another factor in the jet dissipation.
Erosion & the Geomechanical Index Erosion is the process of dislodging a particle from a place of rest or from within a matrix. The variety of materials and material properties present in dam foundation materials indicates the need for an encompassing index. The index should represent the relative ability of a variety of materials to resist the erosive power of moving water. Such an index, the Erodibility Index, is a recent development. Kirsten, Moore, and Annandale (17) derived the Erodibility Index with geomechanical indices from the surface mining industry as the basis. This index is a product of factors representing mass strength, block size, interparticle strength and relative orientation. The erodibility threshold is a relationship between the stream power of water and the Erodibiilty Index. An analysis of more than 100 field and laboratory observations (3) pertaining to the erodibility of a wide variety of earth materials including jointed and fractured rock, weathered rock, detritus, cohesive and cohesionless materials led to the establishment of this relationship.
Displacement Displacement occurs after dislodgement and continues until redeposition. It is characteristic of plunge pool and culvert scour holes to have a mound of eroded material downstream from the holes. Displacement is a function of the transport capacity of the flow in the scour hole, the material size, and the turbulent intensity of the prevailing currents. The tailwater depth is the downstream boundary condition, controlling to some degree the extent of mounding, displacement, and jet diffusion.
Dam Foundation Erosion Overview of Physical Processes • 3

OVERVIEW OF NEW TECHNOLOGY
A single equation cannot adequately represent changing field conditions, and is therefore ineffective for calculating the extents of erosion. The analysis of scour problems in rock and other earth materials, such as detritus and cohesive soils, is complex. The reason for this is that succinct representation of the variables which determines the resistance of such materials to erosion is difficult, as is the calculation of the erosive power of water. A new technology, based on the analysis of more than 100 field observations from the SCS data base on the erodibility of emergency spillways, is proposed by Annandale (3) , Kirsten (18), Annandale and Kirsten (17) and Moore (24). The technology is based on a relationship between a geomechanical index and the erosive power of water. The geomechanical index summarizes the most important variables into a single number, known as the erodibility index, and the erosive power of water is expressed in terms of the rate at which energy is dissipated by discharging water at the point of interest.
Erodibility Threshold - Fundamentals Modem thinking pertaining to the scour of earth materials separate the concepts of hydraulic erodibility and extent of erosion. Hydraulic erodibility is a threshold condition which can be expressed in terms of a graphical relationship or an equation. At the erodibility threshold the agitating agent and the capacity of the material to offer resistance to erosion are related in the following functional manner:
P = f(K„) (1)
where P = the magnitude of the agitating agent f(K„) = the capacity of the material to resist erosion.
The agitating agent in the case of the hydraulic erodibility of earth material is the erosive power of water discharging incident to or over the material. The capacity of the material to resist erosion can be described by means of an index which accounts for the relative contribution of the important elements determining the strength of the material. If P > f(K„) the erodibility threshold has been exceeded and the material will erode. Conversely, if P < f(K„) the erodibility threshold is not exceeded, and erosion will not occur. fl
General Description of Erosion Process Erosion is initiated by a process of progressive dislodgment, consisting of three components:
• Jacking • Dislodgement • Displacement
Figure 1 illustrates fractured rock material with a dip against the direction of flow for processes of jacking, dislodgement and displacement. The jacking effect is caused by pressure fluctuations in the water. These fluctuations originate from turbulence which is generated as water discharges over or incident to a boundary. The higher the turbulence intensity, the greater the fluctuation in pressure. Research has shown that the pressure fluctuations largely affect the pressures at the upper surface of the boundary. Pressures at the boundary surface can be as low as vapor pressure, while, at the same time, the pressures within the cracks and crevices of the material are still at hydrostatic pressure. These large pressure differentials essentially result in fluctuating net forces which cause the material to progressively move out of its position of rest. Once the material is at the threshold of stability, it is dislodged by the power of the discharging water and finally displaced in a downstream direction. The process of erosion for other earth material types can be described in the same generic manner.
Dam Foundation Erosion Overview of New Technology • 4

7
JACKLNG DISLODGFMFM
Figure 1. Processes of erosion.
Capacity of Material to Resist Erosion The capacity of earth material to resist erosion is a function of its strength. The strength of earth material is determined by its mass strength, particlelblock size, interparticle bond strength, relative shape and orientation. A rigorous method to represent the strength of earth material is through the use of a geomechanical index. [Kirsten(17)]. An index which represent the relative ability of earth material to resist erosion, known as the Erodibility Index, is expressed as:
K,=K.•Kb - Kd•K. (2) where K,, = Erodibility Index Km = Mass strength factor Kb = Particle/Block size factor Kd = Interparticle bond strength factor Ks = Relative shape and orientation factor
The mass strength of the material is the basic component determining the material's ability to resist agitating agents. The factor representing mass strength is directly related to the Unconfined Compressive Strength (UCS) of a material. The other factors essentially adjust this basic ability of the material to resist dislodgement by the erosive power of water.
Large particle/block sizes will provide more resistance to erosive power than would small sizes, Figure 2, whereas the impact of interparticle bonding is illustrated in Figure 3. The latter figure shows rock formations with tight joints are less erodible than formations with open joints. Similarly, the gouge type in the joints will also affect the material's capacity for resistance; e.g. clay gouges will provide a different resistance than gouge consisting of rock flour. The resistance provided by the combined effect of cohesion and interparticle friction in clays will in turn be greater than the interparticle friction of cohesionless material.
Dam Foundation Erosion Overview of New Technology • 5

1 11 MIN
111
Figure 2. Particle - Block size impact.
The effect of relative shape and relative orientation are combined in the factor Ks. Figure 4 illustrates the impact of relative shape of rock formations on the material's capacity to resist erosion. Formations with large side ratios will provide more resistance than equisided formations. The orientation of the material, Figure 5, relative to the direction of flow also impacts its capacity to resist dislodgement. If material is dipped in the opposite direction to flow it will be more difficult to dislodge than when the material is dipped in the direction of flow.
TIGHT JOINTS OPEN JOINTS CLAY COHESIONLESS
Figure 3. Interparticle Strength.
Dam Foundation Erosion Overview of New Technology 9 6

V 37
j
Figure 4. Relative Shape.
Figure 5. Orientation.
Erosive Power of Water
Exact modeling of turbulence intensity, the cause of pressure fluctuations which initiate and maintain the erosive process, is currently out of the realm of practical engineering. A need therefore exists to define a parameter which adequately represents the essence of the hydraulic process of erosion. This parameter should be a measure of the magnitude of the pressure fluctuations resulting from the turbulence in the flowing water. Turbulence is essentially the major cause of energy losses in turbulent, discharging water; and the higher the turbulence intensity, the larger the rate at which energy is dissipated and the larger the fluctuation in pressure. Stream power, defined as the rate at which energy is dissipated, is a measure of the erosive power of discharging water. The higher the stream power, the greater the magnitude in pressure fluctuations in the water, and the greater the erosive impact.
Stream power is given by the following relationship. Stream Power = yQAE (3)
In a single dimension, stream power reduces to Stream Power = ygAE (3a.)
z z
AE = v2
— vi
(3b.) 2g 2g
where
Dam Foundation Erosion Overview of New Technology • 7

y= Unit weight of water Q=Discharge AE=Energy dissipation q=Unit discharge
The basic stream power equation was used to derive a suite of equations which can be used to calculate the erosive power of water of plunging jets, in head cutting situations, at slope changes (e.g. over topping embankments), hydraulic jumps and in channels [Annandale and Kirsten(2)]. These equations were used to analyze the SCS field data.
Erodibility Threshold
The erodibility threshold was determined by relating the erodibility index, Kn, and the calculated stream power for each of the more than 100 field data values which were obtained from the SCS data base. The data which were analyzed included flood events over vegetated soils, cohesive loam, weathered rock, and jointed and fractured rock. The erodibility index system can classify the relative ability of all these materials to resist erosion. This index is a product of factors representing the mass strength, block or particle size, interparticle strength and relative orientation of earth materials [Kirsten, Moore and Annandale (17)]. Figure 6 illustrates the relationship between the rate of energy dissipation and the Erodibility Index for events where erosion did and did not occur. The events where erosion did occur are indicated with solid symbols, whereas the events where erosion did not occur are shown with open symbols. The figure shows a separation region between these two event types. This region, indicated by a line, represents the erodibility threshold.
A single equation cannot adequately represent changing field conditions, and is therefore ineffective for calculating the extents of erosion. Calculation of erosion extents requires a procedure that takes account of changes in hydraulic flow conditions and changes in the ability of material to resist dislodgement. The numerical model algorithm is based upon segmenting the physical processes into finite processes, modeling the process, then coupling the input and output from each process. The algorithm follows.
1E+6
1E+5
_ 1E+4
1E+3
1 E+2
E 1E+1
45 1E+0
1 E-1
1co,
Erosion No Erosion Threshold --------------------------------------f--------------------------- ■ ° ---- .... ._ .............. ......... ------- -- -------- - -------------
- -------
-------------------------------------=-------------------------------................ -- ... .... • ---- -- ...........----- -- ---
■ ■ O ■
■ ■
■ ■ O, O
■ ■ ■ ■ ~.-~® O O O ■ O ■
9. o
-............-------= ......................................
-- --- ----..
4 (6 °00~ 8 0 ° '°
O - 0.1 1 10 100 1,000 10,000
Erodibility Index (Kn)
Figure 6. Stream Power versus Erodibility Index showing the erosion threshold.
Dam Foundation Erosion Overview of New Technology 9 8

New Technology Algorithm 1. Express geomechanical properties in the form of an erodibility index. Determine the erodibility
index via field and laboratory investigations. Combine the index into a material database. 2. Fit a three-dimensional (3-D) grid to known geology and topography. A 3-D grid creates a
computational grid that is cubic in nature. 3. Assign a radial vector to each face of each cube, where the vector magnitude and direction
represents the erodibility index on that face for all directions of flow impingement. 4. Create an accounting system for fluid and material continuity. 5. Create a global timer. 6. Correlate hydraulic agitation to dislodgement, or the threshold of dislodgement characterized by
the erodibility index. Figure 6 represents the threshold relationship for a variety of earth materials, including jointed and fractured rock, weathered rock, detritus, cohesionless granular material, and cohesive material. Kirsten, Annandale and Moore (17) developed the relationship by analyzing field observations pertaining to the erodibility of emergency spillways. The erosive power of water is represented by the rate of energy dissipation, and the relative ability of earth material to resist erosion is represented by the Erodibility Index. The rate of energy dissipation was found to be a good measure of turbulence intensity, with turbulence intensity in turn being a good measure of the relative magnitude of pressure fluctuations [Annandale and Kirsten (3)].
7. Correlate displacement and hydraulic agitation. In most formulae, displacement is a function of particle size and hydraulic agitation. Many procedures that correlate displacement and hydraulic agitation already exist.
8. Start the global timer 9. Calculate boundary conditions such as the ODF (Outflow Design Flood) and tailwater. 10. Predict the flow patterns. 11. Determine hydraulic agitation based upon flow patterns. 12. Predict dislodgement. 13. Predict displacement. Dislodgement and displacement multiplied by the time step gives the volume
of material removed per time step. 14. Calculate the remaining geometry. 15. Treat structural causes of erosion separately. Weaker materials may erode and undermine zones of
highly resistive materials. Mass wasting is a different phenomenon than dislodgement. The treatment of cases involving mass wasting necessitates a different methodology than that for dislodgement.
16. Optimize dislodgement predictors for varying geology. Identify the optimum or appropriate method of quantifying hydraulic agitation for material categories and matrix configuration.
17. Combine dislodgement prediction techniques by applying to the geology exposed during scouring. Apply the optimum dislodgement predictor to the appropriate face of each cubic element.
18. Use the resulting topography as feedback to hydraulic agitation and erodibility. The new geometry is the input into the analysis of the flow patterns. The flow patterns determine the direction and magnitude of the hydraulic agitation at every point in the computational and physical grid. This updated flow field is input into reevaluating the erodibility of the newly exposed faces.
19. Increment the global timer and return to step 9.
Summary The key aspects influencing the accuracy and precision of this algorithm are the performance of the Stream power -- Erodibility Index correlation and the displacement function. Other factors influencing the outcome of the algorithm include the resolution and celerity of the computational grid, the sensitivity of the erodibility index to the accuracy of flow pattern predictions, inertial effects, and mass wasting. The design of the investigations planned in the scaled and prototype facilities will yield direct information on these factors. As the investigations continue and information becomes available, the process simulations will become more complex, more accurate, more precise, and more dependable.
Dam Foundation Erosion Overview of New Technology • 9
OVERVIEW OF INVESTIGATIONS
There are three parts to this project: Hydraulic Investigations, Material Investigations, and a Numerical Model. This Pre-Test report presents plans for the project. The investigations divide into two types: Materials and Hydraulics. Each type of investigation will occur in both the scaled facility and prototype facility. The scaled facility offers economy, testing many scenarios rapidly, but with scale effects. The prototype facility offers an unprecedented opportunity for incorporating the effects of aeration and material properties into erosion technology.
The Hydraulic investigations include measuring flow variables such as aeration, velocity, discharge, pressure, head, stream power, turbulence intensity, angle of incidence, and others. The Material investigations include measuring material variables such as mass strength, particle size, relative orientation and interparticle strength. The material variables are functions of fundamental geotechnical and geomechanical properties.
Phase I - Hydraulic Investigations There are three facets to the hydraulic investigations. First is the design of the prototype facility, second is measurement of the requisite hydraulic parameters such as velocity, aeration, discharge, etc., and third is testing of selected material configurations. The greatest part of the investigations will occur in the scaled facility because of the economy of operating that facility. Investigations that simulate the physical processes most accurately will occur in the prototype facility.
A rectangular sharp-edged orifice at the terminus of a delivery pipe will simulate the overtopping phenomenon. Placing an orifice near the terminus of a pipe, issuing through the side wall, presents a complex design problem. A jet issuing from the orifice must be coherent and uniform and the jet must issue perpendicular from the pipe. Achieving these design goals requires model study to produce precise design specifications. The scaled facility provides the apparatus to study the orifice specifications.
Measurement of hydraulic factors requires complex instrumentation and measurement schemes. Technicians will develop various measurement instruments and schemes in the scaled facility. Variables requiring measurement include discharge, head, tailwater depth, velocity profiles and pressure distributions along numerous non orthogonal axes and at many sections, and other factors. Automation will speed much of the data collection.
An undefined area of jet mechanics is interaction of the impinging jet with varying fixed geometries. As a jet impinges upon a boundary it may split into two or more directions as well as stagnate at the point of contact. This mechanism requires study and the scaled facility is the appropriate and economical facility for this investigation series.
Lastly, the scaled facility will be useful for identifying inertial effects of the erosion process. A series of tests in the scaled facility will serve to quantify the effects that time dependence, or inertia, have upon the extents of erosion.
Phase II - Material Investigations U Laboratory Investigations There are two facets to the material investigations. First are screening tests in the scaled facility and second, primary testing in the prototype facility. Fractured rock, slabs of rock, and mixed materials with widely varying size fractions, are not specifically treated by formulas by Mason or Veronese. Therefore it is difficult to anticipate the erosion characteristics of materials and configurations such as
Dam Foundation Erosion Overview of Investigations • 10
in
D
n
n,

these. Preliminary testing in the scaled facility will provide a frame of reference for the behavior of non homogeneous, non heterogeneous material. This series of testing will be the first with materials since construction of the prototype facility will lag one season behind the scaled facility. The intent is to screen a significant number of material configurations in the scaled facility, discounting the scale effects. The screening provides a basis for evaluating materials and material configurations for testing in the prototype facility. Since resources limit the number of tests in the prototype facility, insight from tests in the scaled facility will assure optimum value of data from the prototype facility.
The number, type, and combination of materials constituting the foundation of a dam are very numerous. It is imperative that limiting assumptions aimed at reducing the number of permutations of combinations be logical. This project is adopting a geomechanical index system for describing the type, number, combination, orientation, and other properties of foundation materials. The Erodibility index, Kn, consists of four factors quantifying fundamental properties of earthen materials. The four factors are the Mass Strength Number, Km, Relative Ground Structure Number, Ks, Block Size Number, Kb, and the Interparticle Strength Number, Kd. Scaled or not, most materials of interest to this project have relatively similar mass strength. Therefore for the purpose of this project the mass strength number is constant. Similarly, interparticle strength does not appear to be a major factor in the primary focus area of this project. Therefore for the purpose of this study the interparticle strength number is constant. The particle block size and the relative orientation are the primary material variables for this project.
Preliminary calculations (See the Facilities section) indicate that the prototype facility has the capacity to erode two inch to ten inch material to a depth of roughly ten feet. Therefore, Kb will vary in three increments between roughly two and ten inches. The relative orientation will vary from dipping into the flow, vertical with respect to the flow, and dipping away from the flow. This combination results in data for nine values of Kn. Measurement of the erosion extents, length, depth, width, during full scale testing will test the erodibility index and stream power correlation, displacement function, and other assumptions.
Field Investigations On October 29, 1993, the team leaders will tour sites selected by PG&E for their potential for foundation erosion during overtopping events. PG&E is supplying the project with hydraulic, geotechnical, and geomechanical information from these and other sites. PG&E, as a technical partner in the project, is responsible for review of technical documents, coordination of contracts and cooperative agreements, attendance at meetings, and contributing to the direction of the project as it progresses.
Dam Foundation Erosion Overview of Investigations 9 11

LITERATURE SURVEY 0 A body of literature exists providing information about many facets of erosion due to plunging jets. This report includes a summary of the Dam Foundation Erosion Survey of Literature (10). The summary provides background on overtopping, plunge pool scour, and culvert scour. Since overtopping erosion is similar to erosion in a plunge pool, or scour below a culvert, the subjects combine to provide a wide variety of prediction formulae and techniques.
The literature focuses on factors such as erosion, jet aeration, angle of impingement, and erosion extents. Erosion is dependent upon geotechnical and geomechanical properties of the foundation materials. The literature contains many formulas for estimating the ultimate depth of erosion. The majority of the formulas neglect the progressive nature of the erosion and instead concentrate upon ultimate scour depth. Most formulas also ignore aeration of the jet and the jet impingement angle.
The best formulas for estimating plunging jet scour, probably the formulas by Mason, have very lu narrow application. Mason acknowledges that accuracy greater than 70% is not readily attainable. Case studies show wide variances in the accuracy of the predicted and actual depths of scour. The reasons for the lack of accuracy are model specific formulas, site specific application, fragmented results from multiple studies, and the factors of geology and cohesive material properties. Current formulas have only a rudimentary capability of predicting progressive erosion. Improvements in this capability is crucial for accurately predicting cumulative erosion from multiple overtopping events.
The Survey of Literature (10) documents three techniques for evaluating scour due to an impinging jet: • Techniques that predict the erodibility of earth material • Techniques that estimate the depth of erosion, and • Techniques that attempt to relate space and time in estimating erosion.
Techniques For Predicting the Erodibility of Earth Materials Methods by Cameron (7), van Schalkwyk (30) Barton (5) and Kirsten, Moore and Annandale (17) result in estimates of the erodibility of earth material. Earth material erodes when the erosive power of the impinging water exceeds the ability of the material to resist erosion. Erodibility is therefore a threshold condition.
Techniques For Estimating the Extents of Erosion Mason and Arumugam (20) list 31 methods of calculating scour depth, and divide these into five groups. The first group, 17 equations, relates scour depth to discharge, head drop and characteristic particle size. The second group, 2 equations, adds the impact of tailwater depth. The third group, three equations, is empirical in nature, and relates estimated scour depth to jet dimensions and characteristics. The fourth group, eight equations, developed by six Russian authors, relate scour depth to drop height, particle diameter, tailwater depth and the angle with which the falling stream enters the downstream area. The fifth group, one equation, is for equations that include a time parameter. Mason (22) also treats the impact of air entrainment on plunge pool scour. The equations and associated coefficients of Mason and Arumugam (20) and Mason (22) are generally considered state of the art.
The primary differentiation between culvert scour and plunge pool scour is the energy level and the angle of the flow at the point of impingement. Jets generally impinge in plunge pools at a near vertical angle, while flow from culverts generally impinges at an angle close to horizontal. Similar developments of parameters and scour prediction methods are available for culvert scour. Much of the work addressing erosion of cohesive materials and the importance of material properties is found in the culvert scour literature. Culvert scour researchers advance the most comprehensive set of formulae for
Dam Foundation Erosion Literature Survey • 12
ifi

predicting the extents of erosion as a function of time. A decaying exponential model is the primary model for correlating erosion extents to time.
Techniques For Estimating the Progressive Extents of Erosion The fifth group of equations recorded in the paper of Mason and Arumugam (20), one equation, is for analyses that include a time parameter, relating the depth of scour to time. The few attempts, made with the use of an explicit equation, to account for the progression of erosion as a function of time have not been very successful. However, many authors postulate the importance of erosion progression and case histories of Kariba dam (1), Tarbela dam (19)(29)(8), Guri dam (13), and Seven Mile dams (28) support the postulation.
State of the Art
This section presents the state of the art in four areas: Maximum scour depth, erosion extents and progressive or time based models, air entrainment, and angle of inclination. Where appropriate there are explanations of the perceived shortcomings of the formulae and or methodologies.
Maximum Scour or Erosion Depth Veronese (3 1) and Mason (20) developed the most prominent scour equations. Equation 4 is the Veronese equation. The Veronese formula is endorsed by Reclamation in Design of Small Dams (12).
Y. = 1.32H0.zug0.sa (4)
Ys = depth of scour below tailwater (in feet). H = effective head (in feet). q = unit discharge (in ft3/s-ft).
The Veronese equation is unbounded, does not consider tailwater and neglects material properties. Equation 5 shows the equation by Mason. Note that Masons equation is dimensionally homogeneous.
3.27g0.60H0.05h0.15 D — 90.30d0.10 ls)
D=depth of erosion/scour H = effective head h = tailwater depth q = unit discharge d = d90 of foundation material g = acceleration of gravity
The Mason equation is also unbounded, and while it does include a material factor, d, it is unlikely that this factor adequately represents the wide variety of materials and material properties. The reasons for endorsing the Mason formulas are the thoroughness of the research, the comprehensive nature of the data, including scale model studies and prototype case studies, and the dimensional analysis and dimensional homogeneity of the formulas.
Air Entrainment Mason modified his equation to account for air entrainment. The modified equation, Equation 6, is perceived to be state of the art considering air entrainment. The expression for -P, the volumetric air to water ratio, is from Ervine (14), and is shown in Equation 7.
D= 3.3980.60(1+A0.30h0.16
6 90.30do.60 ( )
Dam Foundation Erosion Literature Survey • 13

X13= 0.13(1—V, / v)(H /t)0-446
R = Volumetric air to water ratio H =jet fall height t = jet thickness v =jet impact velocity Ve = minimum jet velocity required to entrain air
Erosion Extents and Progressivity Erosion extents and progressivity fall into two groups. The first derives from research on culvert scour and applies to low head, near horizontal jets. The second group derives from plunge pool research.
Culvert Scour The prevailing model for progressivity by culvert scour researchers is a decaying exponential. The decaying exponential model may be appropriate as a first implementation of a progressive model. In homogeneous, heterogeneous, non isotropic material such as sand or clay, the model may produce accurate and precise results. In non ideal material conditions, the model may be too simple, degrading the accuracy and precision of the first order attempt to model progressivity.
Mendoza-Cabrales (23) studied scour cavities produced by different discharges of varying duration through circular culverts onto a horizontal sand bed (d50=1.86 mm, a=1.33). He developed expressions describing depth, length, and volume of the scour hole as a function of time and of the discharge intensity, DI = Qg-03D-2S, that followed the decaying exponential model.
s =1— a-at (8)
d
where: ds = depth of the scour cavity below the elevation of the initial ground level, dsm = maximum scour depth a = constant, t= time from initiation of scour.
Kloberdanz (26) carried out a series of tests, and using data previously taken by Ruff, Abt, and other researchers derived empirical relations for calculating scour in culverts produced in noncohesive material. He considered, like Mendoza (23), characteristics of the particles such as size, and depth, length, and volume of the scour hole, as a decaying exponential time relationship.
Da = 1— e-(0.01st+0.96) (9)
D. (0.016t+1.88) =1—e - (10)
W.
L, =1 _ e-(0.015t+0.47) (11)
VS = 1 — e-(0.015t+0.47) (12) V.
Dam Foundation Erosion Literature Survey • 14
PI 0
D
f11

= 7.79 Ds
(13)
D. 0.41
= 0.28(D3
(1 4)
0.42
—2.23( 2.23(D3 (15)
= 6.99(D3 (16)
D' = 1.25(D.I.)o.s~
(17) D
" = 9.75(D.I.)o.s' (18) D
L' = 13.49(D.I.)o..
(19) D
V3 = 36.16(D.I.)
z.os (20)
D
)
0.2 o.s~
D`g°.a =3.35 D..I ~ (21)
Where:
D = culvert diameter DS = depth of scour hole
D. = maximum depth of scour hole dsp = median grain size diameter g = acceleration of gravity Ls = length of scour hole
L. = maximum length of scour Q =discharge t = time Vs = volume of scour hole
V,. = maximum volume of scour hole WS = width of the scour hole Wsn = maximum width of scour hole g = geometry standard deviation of grain size = (d84/d16) o.s d84 = particle diameter of a material for which 84 percent of material is finer by weight d!6 = particle diameter of a material for which 16 percent of material is finer by weight
These formulae by Kloberdanz and others summarize a vast amount of data, most from prototype scale model studies. The limits of the formulae extend to the types of material in the studies. Material in the investigations by Abt, Shaikh, Doehring, Ruff, Mendoza, and others are almost exclusively homogeneous, heterogeneous sands or clays. The formulas do not apply beyond these limits.
Dam Foundation Erosion Literature Survey • 15

Plunge Pool Scour Chee and Padiyar (9) made model studies to determine scour depths resulting from 30° flip buckets, using uniform granular plunge pool materials. An additional, and potentially more useful part of their study was the development of a generalized scour hole geometry, as the report by Harza (25) notes.
"The shape of the hole in plan is symmetrical about the longitudinal axis with the deepest point located downstream of the geometrical center. To define the horizontal and vertical dimensions of the hole, the deepest point is taken as the origin with radius vectors originating from it. The reference axis is the zero degree radius vector point in the upstream direction.
The scour depth at any position measured from the surface water level along any radius vector is related to Dm and the ratio r1k By curve fitting, the following equation was derived (units in ft):
D D _
D. 092 (22A) (1+r l R)
where:
D = scour depth at any point along a radius vector Dm = maximum scour depth as given by Equation* (1) (ref. 8) r = distance at any point along a radius vector R = length of the radius vector (measured to the rim of the hole)
Equation 22A is applicable to any radius vector and fixes the vertical dimensions of the hole.
To determine the horizontal coordinate, the length of the radius vector (R) is required. Many groupings of the significant variables have been attempted. The most successful correlation is given by Equation 22B (units in ft):
RB =C[(D,„—h)lh]"[(H/d)]'° (2213) B
where Rg = length of radius vector at the angle 0 measured to the rim of the hole , B = width of spillway flip bucket Dm = maximum scour depth as given by Equation* (1) (ref. 8) h = downstream surface water depth referred to the original bed level H = head drop from water level upstream of spillway to water level at scour hole d = mean bed material size (~
Equation (22A) and (22B) will determine the coordinates of the scour hole from which the contours can be drawn. "
f Angle of Inclination ! Bormann and Julien (6) derived an equilibrium scour equation based on jet diffusion, particle stability in scour holes, as well as jet trajectory. Equation 23 calculates the equilibrium scour depth Ds.
o.s D — rsin~ C,d2Yo.6U ➢.6 S
n e — D (23) ' Sin( + a)Ard - r)g d
so.a r
Dam Foundation Erosion Literature Survey • 16

Where: ds = sediment size g = gravitational acceleration Q = coefficient of friction relationship Cd = jet diffusion coefficient Dp = drop height of structure DS = equilibrium scour depth Uo = jet velocity entering tailwater Yo = jet thickness entering tailwater r = specific weight of water rs = specific weight of sediment a = embankment angle Q' = jet angle near bed <P = submerged angle of repose of the granular material
Bormann's formula is unbounded. It compares favorably with the culvert scour formulas over it's narrow development range. Being unbounded, it tends to predict erosion depths greater than the available head for fine materials.
Conclusions The Veronese and Mason formulas do not offer sufficient treatment of aspects such as tailwater depth, material properties, angle of inclination, and others. The decaying exponential model is adequate for homogeneous, heterogeneous materials. However, to some extent the decaying exponential, and in all cases the power models are unbounded, that is they do not indicate an asymptotic approach to realistic equilibrium extents. Inclusion of aeration by Mason is a parametric empirical correlation. These shortcomings indicate the need to improve the technology of predicting erosion extents.
Dam Foundation Erosion Literature Survey 9 17

HYDRAULIC INVESTIGATIONS
The first purpose of Hydraulic investigations is to develop technology for predicting the primary flow patterns in an eroding scour hole. The turbulent fluctuations and variable geometry produce an extremely complex flow field. The second purpose is to screen a significant number of material configurations in the scaled facility, narrowing the number and range of the variables in the prototype facility. The third purpose is to design the orifice and instrumentation for the prototype facility. A rectangular sharp edged orifice at the terminus of a pipe is a technically challenging task. Instrumentation includes velocity meters, air concentration probes, pitot tubes, low frequency sonar (for actively tracking the erosion extents), video and photography equipment, pressure transducers, and piezometer tubes.
Prototype Orifice Design A rectangular sharp edged orifice issuing from the side wall of an elevated pipe will simulate an overtopping jet. For similitude, the jet must be coherent and uniform. The calculations in the Facility Designs section indicate an orifice height of 4.8 inches, based upon 100 ft 3Is, 30 feet of head, and an orifice width of 10 feet. A 36 inch pipe terminus houses the orifice, that issues perpendicular to the axis of the pipe through the side wall. The velocity head just upstream of the orifice is roughly 3.1 feet, over 10% of the total head. The momentum of the flow in the pipe needs to change direction by 90°, and there is less than three feet in which to maneuver, while at the same time converting momentum into head. The complexity of the terminus orifice requires model study to achieve the design goals. n
Possible configurations include but are not limited to the following: 1. 2.
Rectangular orifice Trapezoidal orifice
3. Secondary manifold 4. Yanes h S. Diminishing pipe cross section t 6. Forebox 7. Nozzle 8. Nose deflector 9. In pipe stall deflector, tripper
Instrumentation Design Measurement of hydraulic properties requires complex instrumentation and measurement schemes. Technicians will develop various measurement instruments and schemes in the scaled facility. Variables requiring measurement include discharge, head, tailwater depth, velocity profiles, pressure distributions, and other factors along numerous non orthogonal axes and at many sections.
Standard flow and pressure instrumentation will produce data in non aerated portions of the flow field. Special devices, a back-flushing pitot tube and air concentration probe, developed by Reclamation, will also be utilized in the investigations. Automated PC data acquisition will speed data collection and ensure uniformity of data quality. A series of tests will show the best strategy for producing the necessary data for quantifying the flow field, and calculating stream power in the eroding scour hole.
Jet Characteristics, Aeration Investigations The Reclamation stepped spillway overtopping protection research program met challenging data gathering opportunities in a near-prototype size flume facility. In particular, high-velocity flow develops in the 50-ft-high facility with the step roughness also producing aerated flow. Velocity
Dam Foundation Erosion Hydraulic Investigations 9 18

measurements are necessary to determine the effects of the step roughness on the energy dissipation. Air concentration measurements are necessary to determine the model/prototype relationships for extrapolation of laboratory results.
Highly aerated, high-velocity (12-15 m/s) flow increases the difficulty of velocity measurements with "off the shelf" instruments. Although air concentration measurement devices exist, they are not generally available for purchase. As a result, Reclamation developed instruments for this environment.
The air probe acts as an air bubble detector. The air concentration measurement operates on the difference in electrical resistivity between air and water. The air probe consists of two conductors, a tip of a small insulated platinum wire encased in a stainless steel sleeve. An air bubble (0.2 mm or less) passing across the probe tip breaks the current between the two conductors and increases the resistance lowering the voltage across the probe. Integrating the resulting signal over a period of time yields the probability of encountering air in the air/water mixture.
A velocity probe requires a simple and stout instrument. Reclamation developed a pitot-static tube (originally designed for mounting on the fuselage of an airplane) with constant back flushing flow to keep air out of the system. A differential pressure cell measures the total head difference created by the flowing water passing the static and dynamic ports and displacing the back flow.
Both probes require laboratory calibration to establish relationships to known values or baseline information and reliability. Technicians balanced the air probe in non aerated water and then calibrated with a pipe system with known volumes of air and water. Velocity profiles determined with a laser Doppler anemometer in a flume calibrated the velocity probe. This investigation will employ both instruments to establish velocity and aeration profiles in the scour hole. Early results from the Reclamation study confirm the accuracy and precision of the probes.
Facility Operation
There will be a series of tests for learning operating characteristics of the facility, regulating flow, manipulating jet characteristics, and collecting data.
Hydraulics
An undefined area of jet mechanics is interaction of the impinging jet with varying fixed geometry. As a jet impinges through the water surface it diverges and may split into two or more directions as well as stagnate at the point of contact with a boundary. This mechanism requires study and the scaled facility is the appropriate and economical facility for this investigation. A series of tests with fixed geometry will show how an impinging jet splits when encountering positive, horizontal, and adverse slopes, as well as a concave shape, similar to the bottom of a scour hole.
The scaled facility will be useful for identifying inertial effects of the erosion process. We will test the thesis of numerous investigators who assert that the majority of erosion occurs in a relatively short time period, and that the progressive nature of erosion is marginal or too complicated to precisely model. A series of tests in the scaled facility will serve to quantify the effects that time dependence, or inertia, have upon the extents of erosion. The following table details this series of tests. Note that the first two columns shows successive tests, stepping the discharge up and then down, without leveling the basin material. The effects of each preceding time step may influence the succeeding time step. The third and fourth columns show tests that also step the discharge up, but after each test, the material is relevelled, negating any influence of preceding tests. The intent is to compare the extents produced by each series of tests and discern the inertial effects of progressive erosion. This series of tests will utilize a homogeneous, heterogeneous, noncohesive sand material.
Dam Foundation Erosion Hydraulic Investigations • 19

Tnhla 1 Tnuactiantinn ceriac fnr irlentifuina inertial effects of erncinn_
No Ik eling Leveling
Discha a Test Duration Discha a Test Duration
25 ft3/s Equilibrium 25 ft 3/s Equilibrium, relevel
50 ft 3 s Equilibrium 50 ft 3 s Equilibrium, relevel
75 ft 3/s Equilibrium 75 ft 3/s Equilibrium, relevel
100 ft 3/s Equilibrium 100 ft 3/s Equilibrium, relevel
75 ft' /s Equilibrium
50 ft' /S Equilibrium
25 ft 3 s Equilibrium
Summary of Hydraulic Investigations There are plans for 6 series of tests in the scaled facility: 1.) facility operation, 2.) prototype orifice design, 3.) instrumentation and hydraulic investigations, 4.) inertial effects, 5.) material screening. The sixth series is not programmed at this time. This series is open to test particular configurations and materials as the investigations progress.
There are two series of tests planned in the prototype facility. The first is full scale test of aeration, flow distribution patterns, and hydraulic investigations to contrast or match those in the scaled facility. The second is a series of test on various types of materials. For more detail on this series of tests, see the Material Investigations section.
a A 19 Cl [IM [a
0 0
0
R1 IM 19 CIl
Dam Foundation Erosion Hydraulic Investigations • 20 0 41
MATERIAL INVESTIGATIONS
The Veronese equation ignores material properties while the Mason equation only considers particle diameter. These equations ignore important material factors such as interparticle strength, mass strength, shape, and relative orientation. These factors are typical of fractured rock, slabs of rock, and mixed materials with widely varying size fractions. It is difficult to anticipate the erosion characteristics of materials and configurations such as these. The purpose of the material investigations is to study these factors. Preliminary testing in the scaled facility will provide a frame of reference for the behavior of non homogeneous material. This series of testing will be the first with materials, since construction of the prototype facility will lag one season behind the scaled facility. One goal of the scaled facility tests is to develop a database useful for screening the types and numbers of tests in the prototype facility.
Erosion extents investigation The primary erosion extents investigation will occur in the prototype facility. Erosion extents include width, depth, and length of the scour hole as a function of time, w(t), d(t), 1(t). Passive and active means will monitor the progression of these factors as a test progresses. Passive measurement includes subsurface pressure transducers, sacrificial indicators, and physical measurements by survey after flow ceases. These devices will also monitor interstitial pressure fluctuations and effective stress. Active measurement involves low frequency sonar or radar. It is not certain that active measures will be successful in the complex, aerated flow fields. Therefore, the plan includes a series of tests evaluating active measurement technology.
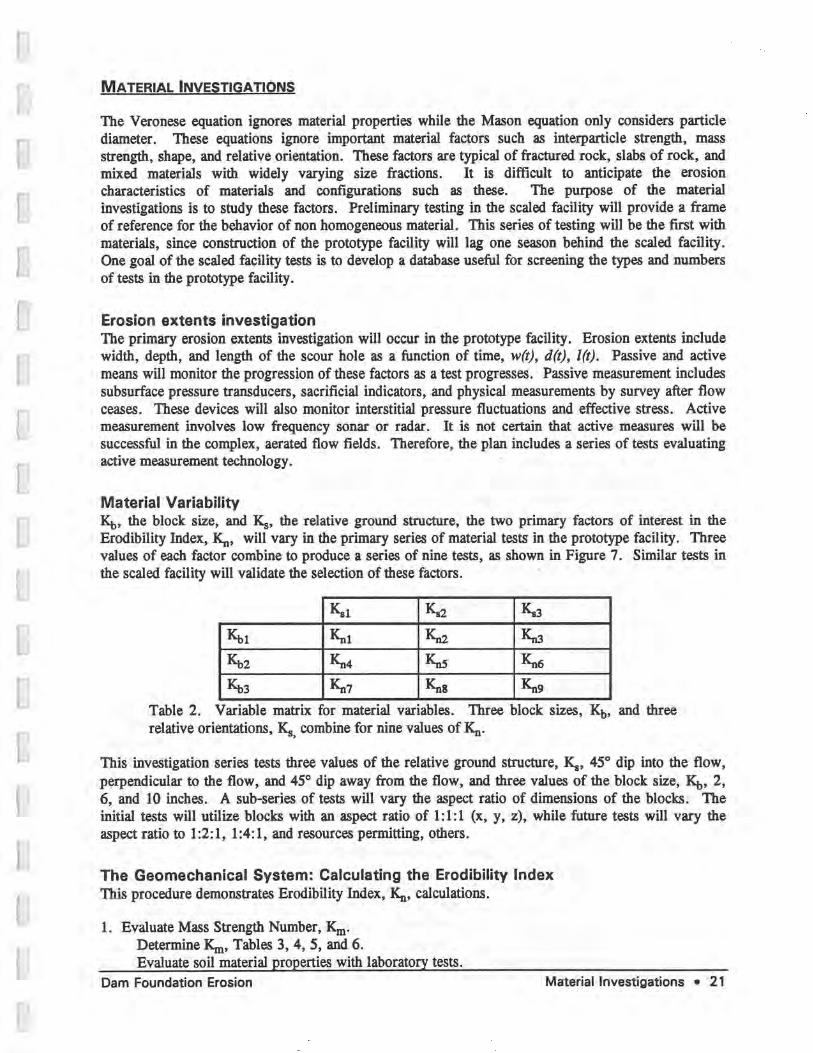
Material Variability Kb, the block size, and KS, the relative ground structure, the two primary factors of interest in the Erodibility Index, Kn, will vary in the primary series of material tests in the prototype facility. Three values of each factor combine to produce a series of nine tests, as shown in Figure 7. Similar tests in the scaled facility will validate the selection of these factors.
Ksl Ka2 Ka3
Kb1 Knl Kn2 Kn3
Kb2 Kn4 Kn5 Kn6
Kb3 Kn7 Kn8 Kn9
Table 2. Variable matrix for material variables. Three block sizes, Kb, and three relative orientations, Ks, combine for nine values of Kn.
This investigation series tests three values of the relative ground structure, K8, 45° dip into the flow, perpendicular to the flow, and 45° dip away from the flow, and three values of the block size, Kb, 2, 6, and 10 inches. A sub-series of tests will vary the aspect ratio of dimensions of the blocks. The initial tests will utilize blocks with an aspect ratio of 1:1:1 (x, y, z), while future tests will vary the aspect ratio to 1:2:1, 1:4:1, and resources permitting, others.
The Geomechanical System: Calculating the Erodibility Index This procedure demonstrates Erodibility Index, Kn, calculations.
1. Evaluate Mass Strength Number, Km. Determine Km, Tables 3, 4, 5, and 6. Evaluate soil material properties with laboratory tests.
Dam Foundation Erosion Material Investigations • 21

2. Evaluate Particle for Block Size Number, Kb. Determine average particle size, D50, of granular soil material. Determine Kb using the following equations:
Kb = RQD
, where 5:5 RQD <--100 (23 a.) ~, J„
Kb —
(115-3.3J,,) (23b)
J.
Kb =1000D3 (23 c.)
0.33
105— 10 " ]
J) AJ= Kb =
J (23 d.)
„
where RQD = Rock Quality Designation, Deere (11). Jn = Joint Set Number, Table 7 J,r, Jy, Jz, = average joint set number in the three mutually perpendicular directions, x, y, z D = mean particle diameter
3. Evaluate Discontinuity/Inter-Particle Bond Strength Number, Kd. For rock: Categorize aperture width. Obtain descriptor of weathering condition of joint face material. Determine joint roughness number, Jr from table 8. Determine joint alteration number, Ja, from table 9. Kd = J.IJ. For Soil: Kd x J,IJQ z tan 0 where 0 z equivalent residual friction angle.
4. Evaluate Relative Ground Structure Number, KS. Determine effective dip of earth material. Determine KS from table 10.
5. Calculate Erodibility Index, Kn. K. = K,„KbKdK,
Erodibility Index Tables TABLE 3_ MASS STRENGTH NUMBER FOR GRANULAR SOTL (K_l
SPT Mass Consistency Identification in Prorile Blow Strength
Count Number
Very loose Crumbles very easily when scraped with geological pick 0-4 0.02 Loose Small resistance to penetration by sharp end of geological 4-10 0.04
pick Medium dense Considerable resistance to penetration by sharp end of 10-30 0.09
geological pick Dense Very high resistance to penetration of sharp end of 30-50 0.19
eolo icalpick-needs many blows of pick for excavation Very dense High resistance to repeated blows of geological pick - 50-80 0.41
requires power tools for excavation Note: Granular materials in which the SPT blow count exceeds 80 to be taken as rock.
Dam Foundation Erosion Material Investigations 9 22
WE
W1J
r~

TABLE 4. MASS STRENGTH NUMBER FOR COHESIVE SOIL (K...) Vane Mass
Consistency Identification Shear Strength Strength Number
(kPa) ) Very soft Pick head can easily be pushed in up to the shaft of 0-80 0.02
handle. Easily molded by fingers. Soft Easily penetrated by thumb; sharp end of pick can be 80-140 0.04
pushed in 30 mm - 40 mm; molded by fingers with some pressure.
Firm Indented by thumb with effort; sharp end of pick can be 140-210 0.09 pushed in up to 10 mm; very difficult to mold with fingers. Can just be penetrated with an ordinary hand spade.
Stiff Penetrated by thumbnail; slight indentation produced 210-350 0.19 by pushing pick point into soil; cannot be molded by fingers. Requires hand pick for excavation.
Very stiff Indented by thumbnail with difficulty; slight 350-750 0.41 indentation produced by blow of pick point. Requires power tools for excavation.
Note: Cohesive materials of which the vane shear strength exceeds 750 kPa to be taken as rock.
TABLE 5. MASS STRENGTH NUMBER FOR ROCK (K_) Unconfined Mass
Hardness Identification in Profile Compressive Strength Strength Number (MPa)
Very soft rock Material crumbles under firm (moderate) Less than 1.7 0.87 blows with sharp end of geological pick and 1.7-3.3 1.86 can be peeled off with a knife; is too hard to cut triaxial sample by hand.
Soft rock Can be scraped and peeled with a knife; 3.3-6.6 3.95 indentations 1 mm to 3 mm show in the 6.6-13.2 8.39 specimen with firm blows of the pick point.
Hard rock Cannot be scraped or peeled with a knife; 13.2-26.4 17.70 hand-held specimen can be broken with hammer end of geological pick with a single firm moderate blow.
Very hard rock Hand-held specimen breaks with hammer end 26.4-53.0 35.0 of pick under more than one blow. 53.0-106.0 70.0
Extremely hard Specimen requires many blows with geological Larger than 280.0 rock pick to break through intact material. 212.0
Dam Foundation Erosion Material Investigations • 23

19 v
a
u
0
TARLF F_ MASS STRENGTH NUMBER FOR DETRITITS (K _)
In Situ Mass Consistency Identification in Profile Deformation Strength
Modulus Number (MPa)
Very loose Particles very loosely packed. High 0-4 0.02 percentage voids and very easily dislodged by hand. Matrix crumbles very easily when scraped with geological pick. Revealing often occurs in excavated faces.
Loose Particles loosely packed. Some resistance to 4-10 0.05 being dislodged by hand. Large number of voids. Matrix shows small resistance to penetration by sharp end of geological pick.
Medium dense Particles closely packed. Difficult to dislodge 10-30 0.10 individual particles by hand. Voids less apparent. Matrix has considerable resistance to penetration by sharp end of geological pick.
Dense Particles very closely packed and occasionally 30-80 0.21 very weakly cemented. Cannot dislodge individual particles by hand. The mass has a very high resistance to penetration by sharp end of geological pick - requires many blows to dislodge particles.
Very dense Particles very densely packed and usually 80-200 0.44 cemented together. The mass has a high resistance to repeated blows of geological pick - requires power tools for excavation.
Note: Determined by plate bearing test of diameter 760 mm.
TABLE 7. JOINT SET NUMBER (J_)
Number of Joint Sets Joint Set Number J
Intact no or few joints/fissures 1.00 One joint/fissure set 1.22 One joint/fissure set plus random 1.50 Two joint/fissure sets 1.83 Two joint/fissure sets plus random 2.24 Three joint/fissure sets 2.73 Three joint/fissure sets plus random 3.34 Four joint/fissure sets 4.09 Multiple joint/fissure sets 5.00
0 0
Dam Foundation Erosion Material Investigations • 24
r,

TABLE 8. JOINT ROUGHNESS NUMBER (J.) Joint Separation Condition of Joint Joint Roughness Number Joints/fissures tight or Discontinuous joints/fissures 4.0 closing during excavation Rough or irregular, undulating 3.0
Smooth undulating 2.0 Slickensided undulating 1.5 Rough or irregular, planar 1.5 Smooth planar 1.0 Slickensided planar 0.5
Joints/fissures open and Joints/fissures open or containing 1.0 remain open during relatively soft gouge of sufficient excavation thickness to prevent joint/fissure
wall contact upon excavation. Shattered or micro-shattered clays 1 1.0
TABLE 9. JOINT ALTERATION NUMBER (J.) Joint Alteration Number
Description of Gouge (JJ for Joint Separation mm)
1.01 1.0-54 5.03 Tightly healed hard non-softening impermeable fillin 0.75 - - Unaltered joint walls surface staining only 1.0 - - Slightly altered, non-softening, non-cohesive rock 2.0 2.0 4.0 mineral or crushed rock filling Non-softening,slightly clayey non-cohesive filling 3.0 6.0* 10.0* Non-softening, strongly over-consolidated clay mineral 3.0* 6.0** 10.0 filling,with or without crushed rock Softening or low friction clay mineral coatings and small 4.0 8.0* 13.0* quantities of swelling clays Softening moderately over-consolidated clay mineral 4.0* 8.0** 13.0 filling,with or without crushed rock Shattered or micro-shattered (swelling) clay gouge, with 5.0* 10.0** 18.0 or without crushed rock Notes: 1. Joint walls effectively in contact. 2. Joint walls come into contact after approximately 100 mm shear. 3. Joint walls do not come into contact at all upon shear. 4. * Values added to Barton et al's data. 5. ** Also applies when crushed occurs in clay gauge without rock wall contact.
Dam Foundation Erosion Material Investigations 9 25

TARLF 10_ RF.T.ATTVF nmoiwn STRUCTURF NTTMRFR (K) Dip Direction of Closer Dip Angle of Closer Spaced Joint Set Spaced Joint Set Ratio of Joint Spacing. r
0 0
1 2 3 4 180.0 90 1.14 1.20 1.24 1.26
In direction of stream flow 89 0.78 0.71 0.65 0.61 85 0.73 0.66 0.61 0.57 80 0.67 0.60 0.55 0.52 70 0.56 0.50 0.46 0.43 60 0.50 0.46 0.42 0.40 50 0.49 0.46 0.43 0.41 40 0.53 0.49 0.46 0.45 30 0.63 0.59 0.55 0.53 20 0.84 0.77 0.71 0.67 10 1.25 1.10 0.98 0.90 5 1.39 1.23 1.09 1.01 1 1.50 1.33 1.19 1.10
0/180 0 1.14 1.09 1.05 1.02 Against direction of stream -1 0.78 0.85 0.90 0.94 flow -5 0.73 0.79 0.84 0.88
-10 0.67 0.72 0.78 0.81 -20 0.56 0.62 0.66 0.69 -30 0.50 0.55 0.58 0.60 -40 0.49 0.52 0.55 0.57 -50 0.53 0.56 0.59 0.61 -60 0.63 0.68 0.71 0.73 -70 0.84 0.91 0.97 1.01 -80 1.26 1.41 1.53 1.61 -85 1.39 1.55 1.69 1.77 -89 1 1.50 1 1.68 1 1.82 1.91
180 -90 1.14 1.20 1.24 1.26 Notes: 1. For intact material take K. = 1.0 2. For values of r greater than 8 take as for r = 8
r n
11
11 ~
a
I U
Dam Foundation Erosion Material Investigations • 26
0

NUMERICAL MODEL
Graphical Basis & Programming The computer program will operate in a Microsoft WindowsTH 3.1 environment. Visual Basic or similar product will provide the tools for creating the graphical portion, the interface and menuing. The interface will call one or more Dynamic Link Libraries ( DLL) that the MicrosoftTK Fortran 5.1 compiler creates. The DLL's will be modular, each containing the code for a segment of the physical process simulation. The graphical interface will also communicate with other pre- and post-processing software such as Exce1TM and AutoCADTM.
Segmented Process Simulation The numerical model will consist of a collection of procedures. Each procedure will represent a specific component of the process or act as a global facilitating procedure such as time keeping and continuity. Procedures include input hydrology, hydraulics of free trajectory or supported jets, jet suppression or contraction, jet/tailwater interaction, erodibility characteristics of the bed material, and waterbed material interaction. The manner in which procedures are coupled during program execution will depend on the problem formulation.
Hydrology The program will require a hydrograph representing the Outflow Design Flood (ODF) as input. This information can be obtained by making use of independent software, such as HEC-1.
Hydraulics The numerical model will simulate discharge of water as it flows through critical depth at the spillway section and forms either a plunging or suppressed jet. The user will supply information regarding the jet formation. Jet suppression or contraction, analysis determining the trajectory, free or supported, may require additional independent model studies by the user prior to usage of the numerical model. The model will have the ability to model any jet, from the vena contracta downstream.
Plunging Jet The characteristics of a jet as it plunges through the atmosphere will be modeled. These characteristics include the entrainment of air and the subsequent separation of the jet into a central core and an outer zone. The central core contains no entrained air, whereas the entrained air in the outer zone decreases the density of this part of the jet. The decrease in density of the outer zone reduces the erosive power of the jet. In addition, the computer program will have a facility to determine whether the central core of the jet will be diffused completely, or whether it will remain intact as it discharges into the plunge pool. This determination is important as it significantly affects the erosive power of the jet. The erosive power of a diffuse jet is lower than the erosive power of a jet with an intact core. An example of typical calculations that will be performed by the computer program are included in this report as part of the design calculations in the Facility Design section.
Supported Jet The model will have the ability to simulate discharge and entrainment of air within the boundary layer as water discharges down a spillway chute.
Jet/Tailwater Interaction The characteristics of the jet/tailwater interaction depends on the jet type. The numerical computer model will have the ability to simulate the interaction for both plunging and suppressed jets.
Dam Foundation Erosion Numerical Model • 27

Two-phase flow develops when a plunging jet dives through the surface of a plunge pool or tailwater. The region below the water surface may consist of either one or two zones, a transition zone or a fully developed two-phase flow zone. A transition zone exists when the central core of the jet is still intact when the jet impacts the water surface. The diffusion of the central core of a jet takes place when water and air are entrained from the surrounding environment below the water surface, giving rise to the transition zone. The fully developed two-phase flow zone commences at the point where the central core of the plunging jet is completely diffused. The modeling of turbulence intensity in both the transition and fully developed two-phase flow zone is important because it is used to quantify the magnitude of the erosive power of water. The computer model will be able to determine the relative turbulence intensity as a function of depth in both the transition and fully developed two-phase flow zones. This will be done by utilizing further development of theory and empirical observations pertaining to plunging jets [Ervine and Falvey (15)], and by making use of measurements and observations from the small and prototype model studies.
The interaction of the suppressed jet and the tailwater is likely to occur as a hydraulic jump. The extensive literature on the behavior of hydraulic jumps will be used to model this interaction (see literature survey pertaining to this investigation). The computer model will identify the type of jump, simulate the hydraulics and determine the relative magnitude of the associated turbulence intensity. This will be done by calculating the rate of energy dissipation in the vicinity of the hydraulic jump.
Erodibility The computer program will determine the erodibility of earth material by making use of a threshold relationship between the erosive power of water and the relative ability of earth material to resist the same. Figure 6 represents the threshold relationship which was determined for a variety of earth materials (including jointed and fractured rock, weathered rock, detritus, cohesionless granular material, and cohesive material) by analyzing field observations pertaining to the erodibility of emergency spillways [Kirsten, Moore and Annandale(17)]. The erosive power of water is represented by the rate of energy dissipation, and the relative ability of earth material to resist erosion is represented by the Erodibility Index. The rate of energy dissipation was found to be a good measure of turbulence intensity, with turbulence intensity in turn being a good measure of the relative magnitude of pressure fluctuations. The Erodibility Index represents the relative ability of earth material to resist the erosive power of water. This index is a product of factors representing the mass strength, block or particle size, interparticle strength and relative orientation of earth materials [Kirsten, Moore and Annandale (17)].
Foundation Material/Jet Interaction The bed material/water interaction will be simulated in the computer program by comparing the erosive power of plunging or suppressed jets with the relative ability of earth material to resist erosion during each time step. The computer program will displace the erodible material when the comparison indicates that the material will erode. Displacement of bed material requires recalculation of the Erodibility Index and the erosive power of the jet for use in the next time step. The value of the Erodibility Index is a function of bed geometry relative to flow direction and should therefore be recalculated whenever the bed geometry changes. The need to recalculate the erosive power of the jet is also based on the dependence of this variable on the geometry of the plunge pool or tailwater environment.
Mass wasting Mass wasting occurs when saturation of the earth material downstream of the dam increases effective stress, resulting in slope instability and mass failure. The first approximation of this process involves a stable angle of repose, 0, and a critical mass wasting angle, X. The computer program will interrogate these values each time step. If the repose angle in the scour hole exceeds x, then the
Dam Foundation Erosion Numerical Model • 28
D Cl
I I
n
I f It u
Ll

material will be laid back to the angle 0 in one time step. The material between x and 0 becomes part of the mass continuity procedure ending up as input into the displacement procedure.
Displacement Displacement occurs after dislodgement. Initially, there are two options for this procedure. The first is to use a sediment transport algorithm, the second is to treat the scour hole as a reverse action settling basin. Sediment transport is a function of stream power, a quantity that the program computes each time step. The ability of the water to displace the dislodged material will be determined by computing the available power of the discharging water with the displacement requirements of the dislodged material. The power that dislodged material requires for displacement is proportional to the product of the material weight and the settling velocity. If the available power of the discharging water is equal to or greater than the power requirement for displacement, the material will displace. Otherwise the material will remain stationary. A settling basin operates on the concept of fall velocity. If the prevailing current exceeds the fall velocity of the particles, the net displacement is along the current path, otherwise the particle settles.
Mounding Mounding occurs in the zone downstream of the scour hole where mined material is deposited when the transport capacity of the flow diminishes.
Tailwa ter Tailwater is a boundary condition. The computer model HEC-2 or other backwater analysis programs calculate values for the tailwater elevation.
Refinement Process
As data, information, and analysis of the model investigations accumulates, these procedures modeling the physical processes will be refined and upgraded. The simplified procedures that make up the initial computer model will evolve as the new technology develops. The modular design of the computer program facilitates changes to single procedures.
Dam Foundation Erosion Numerical Model 9 29

FACILITY DESIGNS
Prototype Model The location of the prototype facility is the Outdoor Laboratory of the Engineering Research Center, Colorado State University, Fort Collins, Colorado.
Scale The prototype model has a scale of 1:1. During application, the data may be extrapolated for analytical purposes. Dimensions of the facility ensure aeration and the relative magnitude of material and hydraulic forces similar to overtopping a 35 foot high concrete or embankment dam.
Capacities A total of one hundred cubic feet per second of discharge is available at a head of roughly thirty five feet from Horsetooth reservoir. A thirty six inch butterfly valve will regulate the discharge in the thirty six inch delivery pipe.
Sizing Calculations The Horsetooth Reservoir supply line terminates at the prototype facility. A section of the pipe, near the terminus will be opened up in the form of a slot, creating an orifice. The orifice, centered on the 30 foot wide by 40 foot long by 15 foot deep basin, will issue a jet simulating overtopping of a dam. The orifice will be a rectangular, sharp-edged orifice. The following calculations show that the height of the orifice assuming a ten foot breadth will be close to five inches. Trajectory calculations indicate the jet, issuing 301 below horizontal, centered fifteen feet above the pool level, will impact roughly 18.5 feet downstream of the orifice.
Orifice Sizing Calculation
I In
Assumptions:
Q = Cd CA Aa 2g2 ~
where
Q = Discharge Cd = Coefficient of Discharge C„ = Coefficient of Velocity
Ao = Orifice Area, A,, = bcw
b, = Orifice Breadth w = OrificeHeight
W= Q CdC„b, 2geh
Q =100 ft3 ls
b,=10f? Cd = 0.61
C,, = 0.95
g = 32.2 ftIs2
..w=0.4ft
Dam Foundation Erosion Facility Designs • 30
r ",, , r

Trajectory Calculation The jet will begin at an angle 0 of 300 below horizontal for these calculations.
z
Y — Yo = g2 + vyt
yo =15 ft (26a)
15>y>0
where y is the vertical coordinate, positive in the downward direction, yo is the distance from the centerline of the orifice to the pool below, g is the acceleration of gravity, positive in the downward direction, t is the time coordinate, and vy is the velocity component in the downward direction.
vy =va sm0
0= —30°
v — Q (27b) wbCCC
C, = 0.6
The actual velocity, va is the calculated velocity divided by the contraction coefficient, Cc. The jet impacts at a point xo feet downstream from the issuance point.
xo = vxt = vat cos 0 '(28c)
.•. xo =18.45 ft
Summarizing, a ten foot wide rectangular sharp edged jet, fifteen feet above the pool, issuing one-hundred cubic feet per second under thirty feet of head and thirty degrees below horizontal, requires a 4.8 inch tall opening and impacts 18.45 feet downstream.
Jet Characteristics and Maximum Scour Depth Estimates of the erosive power of a vertically plunging jet are made by utilizing information in the paper by Ervine and Falvey (15). Their publication summarizes the knowledge pertaining to plunging jets by combining theory and empirical observation.
The characteristics of a jet which plunges through the atmosphere will first be determined, followed by estimates of its characteristic as it plunges below the water surface and entrains water and air. These estimates are required for the design of the prototype scale facility. The objective is to determine the erosive power of a plunging jet and utilize this information to determine the strength of the material which will be used in the material investigations.
Jet Plunging Through The Atmosphere The information published by Ervine and Falvey (15) defines parameters which can be used to postulate the geometry of a jet which plunges through the atmosphere. A jet which plunges through the atmosphere can be near "laminar," smooth turbulent and rough turbulent. Rough turbulent jets entrain air, whereas smooth turbulent and near-"laminar" jets do not.
Free surface aeration is determined by the root mean square value of the axial component of the turbulent velocity (u) and the axial velocity of the jet (U). These criteria are:
udurbulent = 0.275 m/ sec
U = 0.275/T
where (29)
T = ut,rb„le,t/U
With the axial jet velocity U = 42 ft/s, i.e.,
Dam Foundation Erosion Facility Designs 9 31

U =12.8 In (30) sec
The required turbulence intensity for aeration to occur is:
0.275 m T = sec 31)
U
T. T = 0.021
In order to estimate whether this turbulence intensity is possible for the anticipated jet, it is necessary to calculate the Reynolds number of the jet. This can be done by assuming the following values for the kinematic viscosity and width of the jet.
M2
sec (32)
do = 0.122m
The Reynolds number is: _ Udo
R. v (33)
R, =1.562.106
Experimental results reported by Ervine and Falvey show that very little aeration occurs with a Reynolds number of 400,000 and a jet velocity of 5 m/s, whereas significant aeration occurred when the Reynolds number was 2,000,000 and the jet velocity was 25 m/s. They conclude that both Reynolds number and jet velocity are important factors in determining whether significant aeration will occur. The conclusion is that the proposed jet, with a Reynolds number of 1,562,000 and a jet velocity of 12.8 m/s could spontaneously experience aeration, but "tripping" of the event might be n required. 0
Whether aeration occurs spontaneously or requires tripping, it is reasonable to assume that the turbulence intensity T. for this event is likely to be of the order of 2.1 percent (see previous calculation). The value of the turbulence intensity can be used to describe the geometry of an aerated jet. The lateral spread of the aerated portion of the jet can be estimated by making use of a relationship between turbulence intensity and lateral spread which was reported by Ervine and Falvey [Figure 5, Ervine and Falvey(15)]. This relationship indicates that the lateral spread of the outer boundary of the jet is likely to be 0.8 percent when T. is 2.1 percent, i.e.,
82 = 0.008 (34)
The lateral spread of the jet is caused by the entrainment of air. This entrainment causes the jet to divide into two regions, an outer aerated zone and an inner solid core. The inner solid core contracts at a rate of 15 percent to 20 percent of the value of the expansion rate of the outer zone. When this proportion is applied to 0.8 percent, it is estimated that the inner core contracts at a rate of 0.16 percent. Ervine and Falvey point out that this rate does not account for the effects of gravity. If (~ the effect of gravity is determined (a separate calculation), it can be shown that the contraction of the jet which occurs solely due to the effect of gravity is 0.5 percent. Ervine and Falvey observed that the rate of contraction of the inner core is usually between 0.5 percent and 1 percent. In order to account (1 for the effect of gravity in addition to accounting for the impact of aeration, it is assumed that the rate ~( at which the inner core contracts will be 1 percent. Therefore:
81 = 0.005 (35)
Ervine and Falvey further report that the probability of encountering water outside the inner solid core of the jet is given by a Gaussian probability distribution. The average air concentration in the outer
Dam Foundation Erosion Facility Designs a 32

LI
zone can therefore be shown to be 50 percent. This value together with the assumed geometry of the jet can be used to estimate the division of discharge between the solid inner core and the outer aerated zone. Figure 8 represents a vertical, plunging jet with a solid inner core and an outer aerated zone. The density of the fluid in the solid inner core is 1000 kg/cubic meter, whereas the average density of the aerated fluid in the outer zone is 500 kg/cubic meter.
p=1000 kg m
p,=500 k in 3
qo, uo, do
ul q2 qi Pu2 2
Figure 8. - Free body sketch of aerated, plunging jet.
Figure 8 illustrates that the orifice discharge is qo with velocity uo, width do and the out flowing discharges are ql (the outer zone) and q2 (the solid inner core).
The value of uo was previously calculated: u,=U
u, =12.8 in (37)
sec
similarly: d, = 0.122m (38)
Therefore: qo = u,d,
q,= 1.562m Z 39
sec
By making the assumption that the velocities of the solid inner core and the aerated outer core are roughly equal, it is possible to determine the magnitudes of ql and 42. In order to perform the calculation, the magnitude of dl and d2 must be known. These values can be calculated from known values of rates of change of the width of the solid inner core and the outer zone.
For a plunging distance of LI =4.572m (40)
Dam Foundation Erosion Facility Designs • 33

the value of dl can be calculated as: d, =do -2L,a, (41)
d, = 0.076m
and the value of d2 can be calculated as: 1
d2 = I' (S'+ d2 ) (42)
d2 = 0.059m
The total width at the base of the jet, just before plunging into the plunge pool is therefore dit, = d, + 2d2
(43) dwta =0.195m
This implies that the base width of the jet is almost double the initiating width. The relative magnitudes of the discharges of the solid inner core and the aerated outer zone can now be solved by means of the following equations: Guess:
u2 =11.506 in sec
Given
qop= u22d2Pa +u2d,p
Find u2 =11.506 in sec
Check:
__ qap 2d2p, +d,p
u2 =11.506 in sec
therefore: q, = u22(d2.0.5)
q, = 0.684 m2
sec
q2 = u2di
q2 = 0.878 M2
sec
Check 2
q, +q2 =1.205n (49) sec
The initial energy flux of the jet, just outside the orifice where the pressure head is assumed to be zero, assuming that the jet plunges through 15 feet before it reaches the surface of the plunge pool,. is:
H=Om & zo = 4.572m (50)
then t[ 2
El =pggo 2g +H+zo (51)
E, =1.979 • W mass • length • time_3
Dam Foundation Erosion Facility Designs • 34
(44)
(45)
(46)
(47)
(48)

and the energy flux at the lower end of the plunging jet is: z
Ez =Pg 2g (q, +qz) (52)
Ez =1.034 • W mass • length • time-3
the energy loss is therefore: AE, =E,—Ez
AE, = 9.457.104 mass • length • time-3 (53)
Percentage loss:
_ DE, ~'~ E, (54)
AE,x = 47.8%
Check the sensitivity of the assumption pertaining to the velocity. By defining the ratio between the velocities ul and ua (the velocity of the central core and the average velocity of outer zone, respectively) by the variable C, with C varying between 0.80 and 1.00, i.e.,
for
Guessing
then, given
C = 0.8 (55)
u, =12.611 m & ua =10.089 m (56) sec sec
U. = Cu,
q.p = u, 2d2p, + u,d,p
Find
u, =10.089 In sec (57)
u, =12.611 In sec
Check: q, = ua 2(0.5dz )
q, = 0.6 mz sec
qz = u,dl (58)
qz = 0.962 mz sec
z
q, + qz =1.562 'n sec
The energy flux at the base of the plunging jet for this scenario is: U z u,
z E3 = PqlY 2g +Pgzg 2g
(59)
E3 =1.07.105 mass • length • time-3
The energy flux loss is therefore: Dam Foundation Erosion Facility Designs 9 35

AE2 = E, — E3 -3 0 (60)
AE2 = 9.093.104 • mass • length • time
Percentage loss: AE2
e
AEZX = 45.937% r
The difference in energy flux loss for the two options investigated is: Ed, ff = AEI- — AE2
E~; ff = 3.637.103 •mass •length •time-3 (62) n
D
The percentage difference in energy loss for the two options is: AEI- - AE2
= Edffx AE 0
(63) Ed,ff% = 3.846% n
Conclusion: The energy loss for the latter scenario (i.e., the inequality between the velocities of the inner core and the outer zone) is smaller than that of the assumption of a uniform jet velocity at the lower end of the impinging jet. However, the percentage difference is not significant. The decision is to use the scenario which will provide the greatest erosive power below the water surface in the plunge pool. The jet with the greater energy flux at the lower end of the plunging jet will therefore be used.
The contribution of the outer zone and solid inner core of the plunging jet to the pressure fluctuations below the water surface will differ. The lower average density of the aerated water in the outer zone combined with its lower discharge rate will have lower power than that which will be produced by the higher density and higher discharge rate of the solid inner core. Generally, in extreme cases the contribution of the outer zone may be ignored, but in the case under consideration (i.e., the near-prototype model study) it is considered prudent to include the input power of the outer zone. The reason for this is that the outer zone has a high velocity and discharge rate and is expected to have a significant contribution to the erosive power of the jet below the water surface.
The input power of the jet, just before it plunges into the pool, is calculated below. By making use of the most conservative scenario, i.e., the assumption that the average velocity of the outer zone is approximately equal to 80 percent of the velocity of the solid inner core, it follows that:
2 2
PIprr =Pg 4t Zg
+q2 U8 (64)
P„p„t =1.07.105 watt M
As this jet plunges beneath the water surface of the plunge pool, it will cause turbulence and pressure fluctuations which can initiate and maintain scour. A measure to estimate the relative magnitude of these pressure fluctuations is derived in the next section.
Jet Plunging Into Plunge Pool A description of the flow geometry once a jet has plunged through the surface of a plunge pool is provided by Ervine and Falvey. The description is not repeated here, but the important aspects of their explanation are used to derive an equation for estimating the relationship between rate of energy dissipation and depth below the water surface of a plunge pool.
Dam Foundation Erosion Facility Designs • 36
I n
u

The rate of energy dissipation has been found to be a good measure of the turbulence intensity and pressure fluctuations in discharging fluids. In order to derive the required equation for calculating the rate of energy dissipation as a jet plunges below the water surface in a plunge pool, one of the initial requirements is to estimate the depth of flow establishment. The depth of flow establishment is the depth which is required for full development of two-phase flow. From the paper of Ervine and Falvey, it is estimated that the flow establishment depth (yd is approximately:
y,, = 4d, y,7 = 0.305m
(65)
It is reasonable to expect that the pressure fluctuations which initiate and maintain scour will be determined by the flow characteristics of the two-phase flow zone. The two-phase flow zone develops as water and air are entrained by the plunging action of the jet. If the plunge pool is in a confined space, it can be shown theoretically (and was apparently observed empirically by Ervine and Falvey) that the discharge rate of the entrained water and air is approximately equal to the discharge rate of the water plunging into the pool. The discharge rate of the two-phase fluid within the fully established two-phase flow zone is therefore equal to approximately twice the discharge rate of the incoming flow. As both water and air are entrained the mass density of the two-phase fluid in the fully established two-phase flow zone will be different from the mass density of water. The density of the two-phase fluid will also change as a function of depth below the water surface of the plunge pool. The boundaries of the zone within which the two-phase flow will exist is defined by the water surface of the plunge pool and the maximum air bubble penetration depth (VP).
If the velocity at which a bubble rises (ub) is assumed to be 0.25 m/s, then the ratio between this velocity and the plunging velocity of the jet at the surface of the plunge pool is
_ ul ub-•ano —
ub (66) ub-„no = 50.444
This ratio can be used in Figure 12 of Ervine and Falvey to determine the ratio between the jet width and the bubble penetration, i.e.,
yp-,ono = 60 (67)
therefore, yp = yp-rono(dl + 2d2 )
(68) yp =11.709m
A reasonable interpretation of this result is that it closely approximates the maximum sphere of influence of the plunging jet below the water surface of the pool. Therefore, a conservative assumption is that the maximum scour depth cannot exceed 11.7 m below the water surface of the plunge pool.
The relationship between the air/water ratio and the depth below the water surface in the two-phase flow zone is dependent on the initial air/water ratio and the depth below the water surface.
A coefficient K relates the initial air/water ratio to the ratio between the plunging distance through the atmosphere and the width of the jet, i.e.,
K= 0.2 (69)
Dam Foundation Erosion Facility Designs • 37

for a wide rectangular, rough turbulent jet. The initial air/water ratio can then be calculated as: o.s
LI ) ~i = d
o (70)
A =1.224
The progression of the air/water ratio as a function of water depth for water depths (y) of yo =0
yp =11.709m (71)
y; =yi-1 +1, i=1...11
A = 3.12Q, 1- y` (71a.) yp
4 3.5
3
2.5
n- 2 1.5
1 0.5
0
0 2 4 6 8 10
Depth, m The concentration of air in the water is related to the air/water ratio by, the equation:
Qt
0.8
0.7
0.6
0.5
0.4
0.3
0.2
0.1
0
0 2 4 6 8 10 12
Depth, m
With the total discharge rate of the two-phase fluid equal to twice the discharge -rate of the jet, set qt.-phM, = 3.124
(73) di,t = 0.195
By assuming that the two-phase flow zone expands with an angle a2, the average vertical downward flow velocity at a depth y below the water surface can be expressed as:
Dam Foundation Erosion Facility Designs • 38
12
(72)

az =14' X rad 1800
Vi _ 4r.-rte...
d j,, + 2y, tan az
(74)
18
16
14
12
10
8
6
4
2
0
0 2 4 6 8 10 12
Depth, m
The propelling power of the jet (the power which is available to propel the jet below the water surface in the plunge pool) is given by the equation:
p =1000 kg
g=9.801 m In, s
z (75) 4t.n-rte 1
Prord = (1— ci )pg4~-a,,,,, d . + 2 tan a 2 dj r y; z g
90000
80000
70000
60000
¢, 50000 0 0-40000
30000
20000
10000
0
0 2 4 6 8 10 12
Depth, m The reduction in the input power of the jet (calculated above) is the rate of energy dissipation (the reduction is caused by turbulence leading to energy loss). The rate of energy dissipation at any depth y can be expressed as:
P = (1— c;)pgtan azy, 4q,--,h—' 2g(dj,, + 2y, tan az )3
(76 )
Dam Foundation Erosion Facility Designs 9 39

12000
10000
8000
4 6000
4000
2000
0 2 4 6 8 10 12
Depth, m
Comparison of the propelling power of the jet at the water surface and the previous calculation of the power of the jet just before it contacts the water surface shows an inconsistency. The estimated power of the jet just before it hits the water surface is 29.46 kW/m whereas the estimated propelling power of the jet at the water surface (second calculation) is 51.61 kW/m. The inconsistency is attributed to the assumptions pertaining to the dissipation of the jet and the entrainment of air and water. The latter is overestimated at the surface. The assumption that the discharge rate of entrained air and water is equal to the discharge rate of the jet will not be fully realized at or close to the surface of the water in the plunge pool. This inconsistency will therefore, for purposes of this particular calculation (i.e., design of the model), be ignored. However, the rate of energy dissipation should be determined during the research project to correct this inconsistency.
Determination of Material Requirements Assume that the allowance for scour in the plunge pool is not to exceed, say, 2 m to 3 m. The rate of energy dissipation at these depths below the water surface varies between 1.3 and 2.3 kW/m. By making use of the graph which represents the erodibility threshold for earth and engineered earth materials (which was compiled as a result of the analysis of the SCS emergency spillway scour data), it can be concluded that material with an erodibility index (kn) which varies between 3 and 4 will be on the threshold of scour at between these water depths. Then
K,, = 4 (77)
If three of the individual components of the index have the following values: K,„=0.87 0 Kd =tan1 35
180 ( 78 ) 0.7
0Kd = K, = 0.5
Then the required value of the factor Kb (contribution of the particle size to resist scour) is: 0 K„ Kb
= K,„KdK, (79) 0 Kb =13.132
The diameter associated with this value of Kb is calculated as:
0 Dam Foundation Erosion Facility Designs 40
I
n
F!,
m
D
0
D7
0
D
J'I
I

Kb 0.3333
D_1000 (80)
D = 0.254 m
If the strength of the material is higher, say hard rock, then the following calculations show the required diameter of rock to withstand scour at a depth of roughly 3 m.
K.=100r
Kd =tang 35180) (81)
Kd = 0.71
Ks = 0.5
Then the required value of the parameter Kb (representing the contribution of the particle size to resist scour) can be calculated as:
Kb K.
= K -KdKs
Kb = 0.114
The diameter associated with this value of Kb is calculated as: Kb 0.3333
D__1000 (83)
D = 0.052 m
A plunge pool depth of 3 m appears to be acceptable. Depending on the hardness of the rock, the diameter that will just be scoured at a depth of 3 m ranges between 0.254 m and 0.052 m (0.83 ft and 0.17 ft, or between 10 in and 2 in.).
Plans
30
0
P Head Box
Tail Box k==--= Overtopping Facility
Extended Tail Box Foundation
Erosion L\ 4
New 3' Did Pipeline Facility
3o' Figure 9. Plan of existing Overtopping facility and planned prototype facility.
(82)
Dam Foundation Erosion Facility Designs • 41

D 0 0
B B
Overtopping Facility I
10, 40' I~ Orifice
70' T
Figure 10• Preliminary plan of orifice configuration at the prototype facility.
Overtopping Facility
10'
15
Section A—A Figure 11 • Side view of the proposed prototype facility and a front view of the existing overtopping facility. Note that the Dam Foundation Erosion facility will be five feet higher than the Overtopping facility tailbox.
Section B—B Figure 12. Front view of the DFE facility in relation to a side view of the overtopping facility.
Dam Foundation Erosion Facility Designs • 42
m
1]
I I
0
I L
L~
a

Scaled Model The location of the scaled model is the Hydraulics Laboratory of the Engineering Research Center, Colorado State University, Fort Collins, Colorado.
Scale The scale of the model will be 1:3. The scaling is geometric, based upon Froude law relationships ensuring dynamic similitude. The Froude number indicates that hydraulic performance of the model and prototype structures are primarily dependent on gravitational and inertial forces. The Froude number is:
F= VLg (84)
The "m" subscript refers to the model while the "p" subscript refers to the prototype or full size structure. Ratios, X, are prototype to model. The 1:3 scale model has the following scaling relations
F.=FP Froude Constraint F (85)
F~F = =1.0 F.
Length ratio: AL = 3 (86)
Velocity ratio: AV = AL 1/2 = 31/2 =1.732 (87)
Discharge ratio: AQ = A
Ls/z = 35/2 = 15.59 (88)
Unit Discharge ratio: s/2
,1 = Q = L _ 3/z = 33~z = 5.196 q - L (89) AL AL
Time ratio: AT = AL'/2 = 31/2 = 1.732 (90)
Use these ratios by dividing the prototype value by the appropriate ratio to obtain the model value. For example, a prototype unit discharge of 10 ft 3 ls/ ft scales to a 1:3 model discharge of
10 ft 3lSl t = 1.925 ft 3ISI ft 33/2
Capacities The ten foot prototype orifice width scales to 3.33 ft. Total discharge is this width times the scaled unit discharge, 1.925 ft3/s/ft, or 6.42 ft3/s. The centerline of the orifice will be 5 feet above the pool.
Sizing Calculations The orifice dimensions and trajectory calculation scale according to the Froude ratios in equations 86 through 90.
Dam Foundation Erosion Facility Designs 9 43

SCHEDULE
The investigations begin January 1, 1994, and continue thirty-six months to December 1996. The indoor laboratory scale model is in design and construction will be under way soon. Initial facility operation will be prior to 1994. Testing operations will begin after January 1, 1994. Plans for the prototype facility are in progress. Initial excavation may occur in 1993 if weather permits. Otherwise construction will begin in Spring 1994. The schedule calls for initial facility operation Fall, 1994. Testing operations will begin Spring 1995.
After outlining the numerical model, coding for the Alpha, or first operating, version of the numerical model will commence. The target date for the Alpha version, Version 0.01, is June 1, 1994. Simplified process simulation modules are first on the schedule. Each module will be successively upgraded as information from the physical models becomes available. Performance of Versions 0.01 through 0.99 will help dictate testing parameters in latter parts of the investigations. A Beta, or pre-release version of the code will be available to selected parties for testing in the second, third and fourth quarters of 1996. The release candidates will be numbered 0.99a, 0.99b, etc., until quality control goals are met.
A draft final report will be available for review in the fourth quarter of 1996. After peer review and acceptance by all collaborators, the report will be published as an "REC" report by Reclamation. There are also plans for additional articles and professional papers deriving from the final report. Figure 13 is a Gantt chart showing the project schedule.
Quarter 1993 1994 1995 1996 1997
Task 3 4 1 2 3 4 1 2 3 4 1 2 3 4 1 DFEScaledModel DFE Prototype Model
■ MENEM
IN
DFE Pre-Test Report Report
DFE Numeric al M o del
Figure 13. Gantt chart showing the general schedule of major project parts.
C
I
I I ~ L
I L
n
Dam Foundation Erosion Schedule • 44

REPORTS & MEETINGS
This project will span a time of roughly three years. Documentation and communication are essential to the success of the project. This section details the plan for creating strong communication between the project collaborators, funding partners, and outside interests. This section also presents the plan for documenting the project incrementally and summarily.
Meetings Resource limitations dictate a minimum number of face to face meetings. We recommend two meetings per year. One meeting between the project collaborators should be held during the summer testing period in Fort Collins, Colorado, facilitating witnessing prototype and scaled facility tests in progress. The task manager and key personnel will be in attendance at the Colorado meetings. Invitations to the Colorado meetings will be open to all interested parties since these meeting will coincide with testing in the two facilities.
The second meeting should be held in San Francisco at PG&E Headquarters for presentation of milestone reports and decision documents. The project manager and key personnel will be in attendance at the California meetings.
Reports The project manager will forward financial reports to the respective funding agencies as set forth in the agreements for this project.
Team leaders will produce letter reports for submittal to the project manager upon completion of project milestones and on a monthly basis. The project manager will forward a digest of the reports to EPRI , Reclamation Dam Safety, and PG&E, as well as the team leaders, on a quarterly basis.
As the project nears completion, the team leaders and project manager will prepare a final report. The final report will summarize all activity during the project, present the major accomplishments, tabulate all data, and publish the numerical model.
Dam Foundation Erosion Reports & Meetings 9 45

v
REFERENCES (~
1. Akhmedov, T. Kh., "Calculation of the Depth of Scour in Rock Downstream of a Spillway," Water Power and Dam Construction, December 1988.
8 2. Annandale G.W. and Kirste H.A.D.(1993), Determination of the Erodibility of Natural and Engineered Earth: Hydraulics, submitted for publication.
a 3. Annandale, G.W., Analysis of Complex Scour Problems in Rock and other Earth Materials, Northwest Hydroelectric Conference, Portland, Oregon, 1993.
a 'Engineering 4. Barton, N., Lien, R., Lunde, J., Classification of Rock Masses for the Design of Tunnel Support," RockMechanics 6, 189-236 (1974) by Springer-Verlag, 1974.
"Rock 5. Barton, N., Mass Classification and Tunnel Reinforcement Selection Using the Q-System," Rock Classification Systems for Engineering Purposes, ASTM STP 984, Louis Kirkaldie, Ed., American Society for Testing and Materials, Philadelphia, PA, pp. 59-88, 1988. a
6. Bormann, N., Julien, P.Y., Scour Downstream of Grade Control Structures, Journal of Hydraulic Engineering, ASCE, Vol. 117, No. 5, May 1991, pp. 579-594.
7. Cameron, C.P., Cato, K.D., McAneny, C.C., May, J.H., Geotechnical Aspects of Rock Erosion in Emergency Spillway Channels - Analysis of Field Data and Laboratory Data, Technical Report, vol. 2, U.S. Army Corps of Engineers, Washington, 1988.
a
8. Chao, P.C., "Tarbela Dam-Problems Solved by Novel Concretes", Civil Engineering, ASCE, vol. 50, No. 12, pp. 58-64, December 1980.
8 9. Chee, S.P., Padiyar, P.V., 'Erosion at the Base of Flip Buckets," Engineering Journal, Canada, vol. 52, No. 11, pp. 22-24, November 1969.
10. Dam Foundation Erosion Survey of Literature, USBR Hydraulics Branch, Dept. of Civil Engineering, Colorado State University, Water Resource Section, HDR Engineering, Inc., August, 1993.
11. Deere, D.U., Deere, D.W., "The Rock Quality Designation (RQD) Index in Practice," Rock Classification Systems for Engineering Purposes, ASTM STP 984, Louis Kirkaldie, Ed., American Society for Testing and Materials, Philadelphia, PA, pp. 91-101, 1988.
12. Design of Small Dams, United States Department of the Interior, Bureau of Reclamation, third edition, 1987. Denver, Colorado. P.O. Box 25007, D-822A.
13. EDELCA Report, "Guri Final Stage Spillway Buckets," 1978.
14. Ervine, D.A., "The Entrainment of Air in Water." Int. Water Power and Dam Constr., 28(12), 27-30. 1976.
15. Ervine, D.A., Falvey, H.T., "Behavior of Turbulent Water Jets in the Atmosphere and in Plunge Pools," Proc. Instn Clv. Engrs., Part 2, pp. 295-314, 83, March 1987.
16. Kirsten, H.A.D., A Classification System for Excavation of Natural Materials, The Civil Engineers in South Africa, South Africa Institution of Civil Engineers, July, 1982.
n !J
Dam Foundation Erosion References a 46
a

17. Kirsten, H.A.D., Moore, J. S., Annandale, G. W., 'Empirical Classification for Hydraulic Erodibility of Natural and Engineered Earth" (In preparation) 1993.
18. Kirsten, H.A.D., "Case Histories of Groundmass Characterization for Excavatability," Rock Classification Systems for Engineering Purposes, ASTM STP 984, Louis Kirkaldie, Ed., American Society for Testing and Materials, Philadelphia, PA, pp. 102-120, 1988.
19. Lowe, J., et al., "Tarbela Service Spillway Plunge Pool Development," International Water Power and Dam Construction, vol. 31, No. 11, pp. 85-90, England, November 1979.
20. Mason, P.J., Arumugam, K., "Free Jet Scour Below Dams and Flip Buckets," Journal of Hydraulic Engineering, vol. 111, No. 2, ASCE, February 1985.
21. Mason, P.J., Arumugam, K., Closure to "Free Jet Scour Below Dams and Flip Buckets," Journal of Hydraulic Engineering, vol. 111, No. 2, ASCE, February 1985.
22. Mason, P.J., 'Effects of Air Entrainment on Plunge Pool Scour," Journal of Hydraulic Engineering, vol. 115, No. 3, ASCE, March 1989.
23. Mendoza-Cabrales C., "Headwall Influence on Scour at Pipe Outlets," Thesis, Colorado State University, April 1980.
24. Moore, J.S. (1993), Standard field procedures for evaluating the geological parameters controlling hydraulic erosion, submitted for publication.
25. Plunge Pool Performance Study; Project Data Review/Literature Search: Theodore Roosevelt Dam, Lower Colorado Region, Salt River Project, Arizona. Harza Engineering Co., March 1993.
26. Ruff, J.F., Abt, S.R., Mendoza, C., Shaikh A., Kloberdanz, R., "Scour at Culvert Outlets in Mixed Bed Materials," Federal Highway Administration, September 1982.
27. Spurr, K.J.W., Discussion of "Free Jet Scour Below Dams and Flip Buckets," Journal of Hydraulic Engineering, vol. 111, No. 2, ASCE, February 1985, by Mason and Arumugam, Journal of Hydraulic Engineering, ASCE, Vol. 111, No. 7, July, 1985.
28. Spurr, K.J.W., "Energy Approach to Estimating Scour Downstream of a Large Dam, Water Power and Dam Construction, July 1985.
29. Tarbela Spillway Pool Erosion Prompts 100 Million Dollar Repair Job, Engineering News Record, vol. 202, No. 1, p. 10, January 4, 1979.
30. van Schalkwyk, A., "The Erodibility of Different Rock Formations in Unlined Dam Spillways," Report to the WRC on Pilot Investigation, August 1989, unpublished.
31. Veronese, A., "Erosion de Fondo a Valle di uno Scarico," Annali dei Lavori Publicci, vol. 75, No. 9, pp. 717-726, Italy, September 1937.
Dam Foundation Erosion References • 47