daktronics inc. first quarter fiscal 2017 investor
TRANSCRIPT

DAKTRONICS INC.
FIRST QUARTER FISCAL 2017
INVESTOR PRESENTATION
NASDAQ: DAKT

SAFE HARBOR STATEMENT
In addition to statements of fact, this presentation contains forward-looking withinthe meaning of the Private Securities Litigation Reform Act of 1995 and is intendedto enjoy the protection of that Act.
These forward looking statements reflect the company’s expectations or beliefsconcerning future events. The company cautions that these and similar statementsinvolve risk and uncertainties which could cause actual results to differ materiallyfrom its expectations, including, but not limited to, including changes in economicand market conditions, management of growth, timing and magnitude of futurecontracts, and other risks noted in the company’s SEC filings including its AnnualReport on Form 10-K for its 2016 fiscal year.
Forward-looking statements are made in the context of information available as ofthe date stated. The company undertakes no obligation to update or revise suchstatements to reflect new circumstances or unanticipated events as they occur.

DAKTRONICS VISION
Our Vision
To be the world leader at informing and
entertaining audiences through dynamic
audio-visual communications systems.

DAKTRONICS MISSION
Deliver industry leading value to our customers, by engaging:
• our employees through challenging and rewarding opportunities;
• developing strategic partnerships with our suppliers;
• leveraging our strengths in:
product innovation, manufacturing, and service;
• while contributing to the betterment of our communities; and
• generating an attractive return for our investors.

DAKTRONICS AS A
WORLD LEADER
47+ Year Track Record
Customer Solutions
Engineering & Creative talent
Global and local focus of customer
support
Lean Manufacturing
Financially strong

FINANCIAL SUMMARY

10 YEAR HISTORY SALES & OPERATING INCOME %

July July Percent
2016 2015 Change
Orders 175,168$ 165,072$ 6.1%
Net sales 157,145 150,221 4.6%
Gross profit 38,913 35,501
Gross margin 24.8% 23.6%
Operating income 7,982 6,099
Operating margin 5.1% 4.1%
Net income 5,697$ 3,776$ 50.9%
% of sales 3.6% 2.5%
Earnings per share (diluted) 0.13$ 0.09$
Three Months Ended
FY2017 FIRST QUARTER RESULTS
*($ in thousands, except per share data)

FY2016 AND FY2015 YTD RESULTS
April April Percent
2016 2015 Change
Orders 560,786$ 631,573$ -11.2%
Net sales 570,168 615,942 -7.4%
Gross profit 121,019 144,579
Gross margin 21.2% 23.5%
Operating income 2,495 31,285
Operating margin 0.4% 5.1%
Net income 2,061$ 20,882$
% of sales 0.4% 3.4%
Earnings per share (diluted) 0.05$ 0.47$
Twelve Months Ended**
*($ in thousands, except per share data)
**FY2016 52 weeks vs FY2015 53 weeks
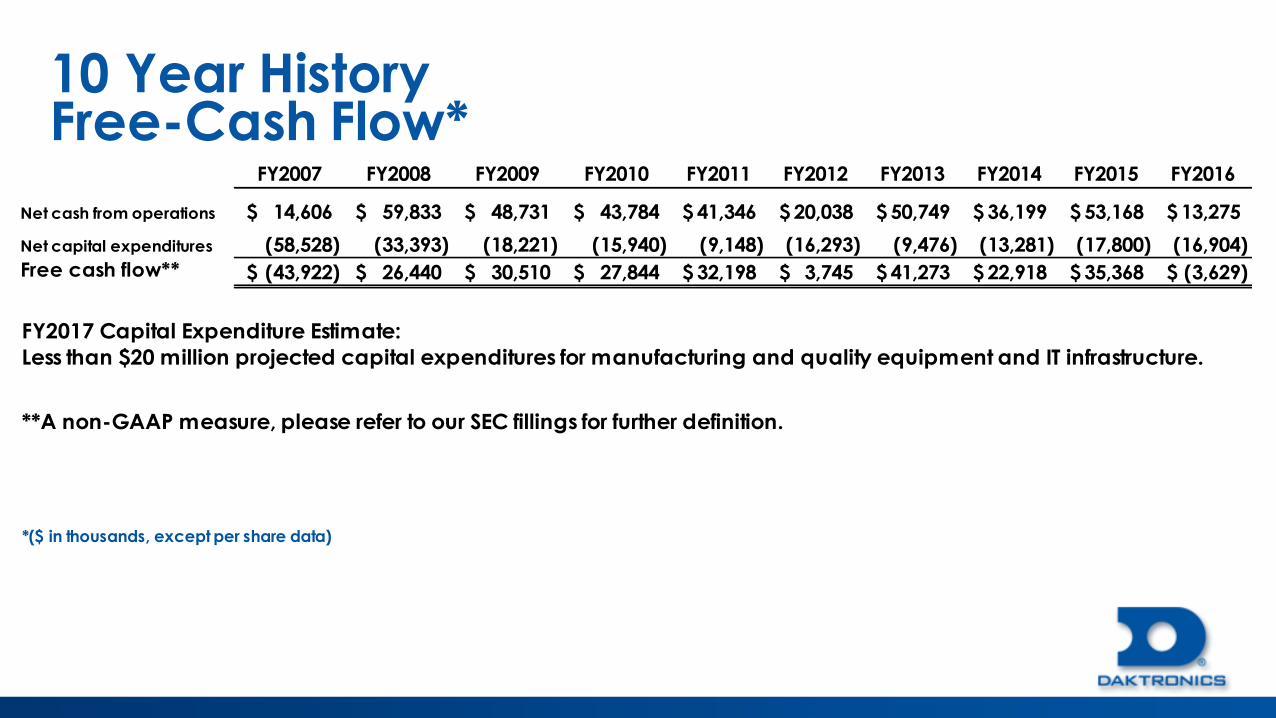
10 Year History Free-Cash Flow*
FY2007 FY2008 FY2009 FY2010 FY2011 FY2012 FY2013 FY2014 FY2015 FY2016
Net cash from operations 14,606$ 59,833$ 48,731$ 43,784$ 41,346$ 20,038$ 50,749$ 36,199$ 53,168$ 13,275$
Net capital expenditures (58,528) (33,393) (18,221) (15,940) (9,148) (16,293) (9,476) (13,281) (17,800) (16,904)
Free cash flow** (43,922)$ 26,440$ 30,510$ 27,844$ 32,198$ 3,745$ 41,273$ 22,918$ 35,368$ (3,629)$
**A non-GAAP measure, please refer to our SEC fillings for further definition.
FY2017 Capital Expenditure Estimate:
Less than $20 million projected capital expenditures for manufacturing and quality equipment and IT infrastructure.
*($ in thousands, except per share data)
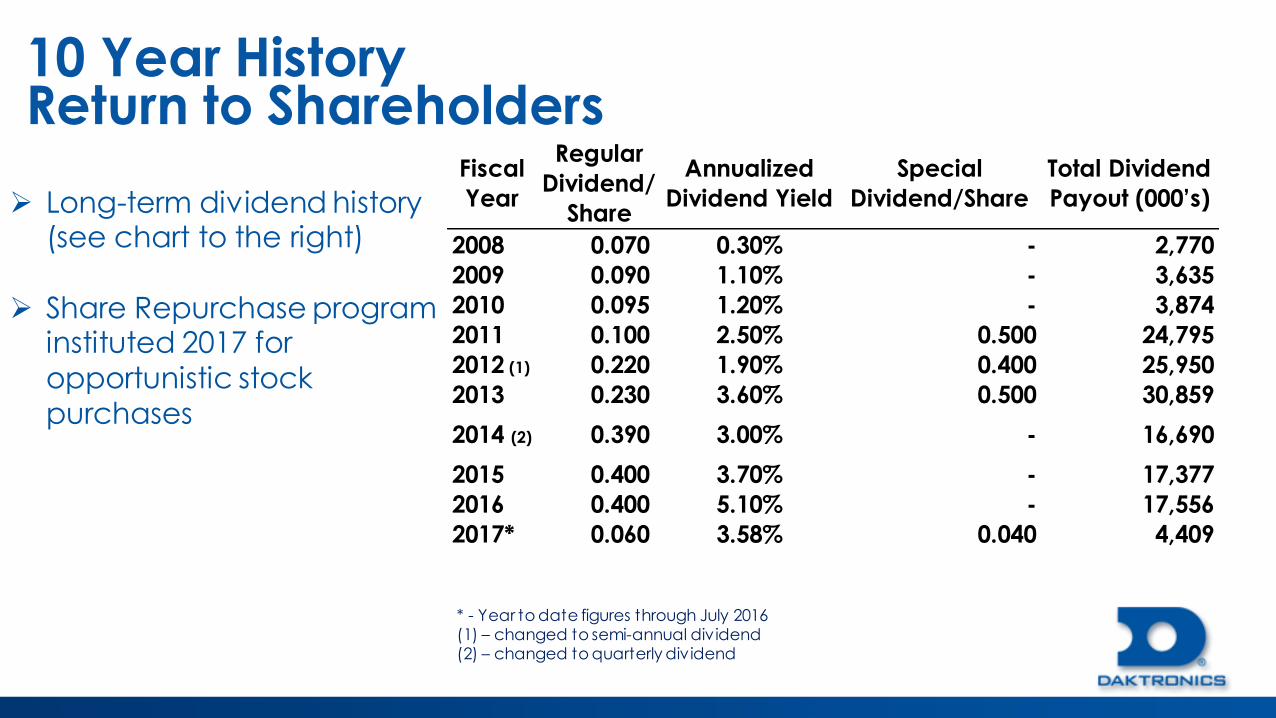
10 Year HistoryReturn to Shareholders
* - Year to date figures through July 2016(1) – changed to semi-annual dividend(2) – changed to quarterly dividend
Fiscal
Year
Regular
Dividend/
Share
Annualized
Dividend Yield
Special
Dividend/Share
Total Dividend
Payout (000’s)
2008 0.070 0.30% - 2,770
2009 0.090 1.10% - 3,635
2010 0.095 1.20% - 3,874
2011 0.100 2.50% 0.500 24,795
2012 (1) 0.220 1.90% 0.400 25,950
2013 0.230 3.60% 0.500 30,859
2014 (2) 0.390 3.00% - 16,690
2015 0.400 3.70% - 17,377
2016 0.400 5.10% - 17,556
2017* 0.060 3.58% 0.040 4,409
Long-term dividend history (see chart to the right)
Share Repurchase program instituted 2017 for opportunistic stock purchases

52/53 Week Fiscal Years ending in April – FY15
53 weeks (Q1 extra week), FY16 52 weeks
Seasonality to results (Sports/Construction
season)
Video systems comprise a large portion of
business with standard systems and services
comprising the remaining
Large video systems projects may include
general contracting with lower margin %, but
add margin $
Customer delivery schedules & sports season
impact quarterly results
Q3 Includes 2 major holidays
More about Daktronics10 YEAR HISTORY
DILUTED EARNINGS PER SHARE
(after adjustment for splits)
Fiscal Year Q1 Q2 Q3 Q4
2008 + 0.17 + 0.19 + 0.13 + 0.14
2009 + 0.24 + 0.29 + 0.10 + 0.01
2010 + 0.03 + 0.12 - 0.20 - 0.12
2011 + 0.06 + 0.17 + 0.04 + 0.07
2012 + 0.08 + 0.09 + 0.04 - 0.01
2013 + 0.16 + 0.27 + 0.06 + 0.04
2014 + 0.13 + 0.27 + 0.07 + 0.04
2015 + 0.20 + 0.18 + 0.01 + 0.08
2016 + 0.09 + 0.07 - 0.04 - 0.07
2017 + 0.13
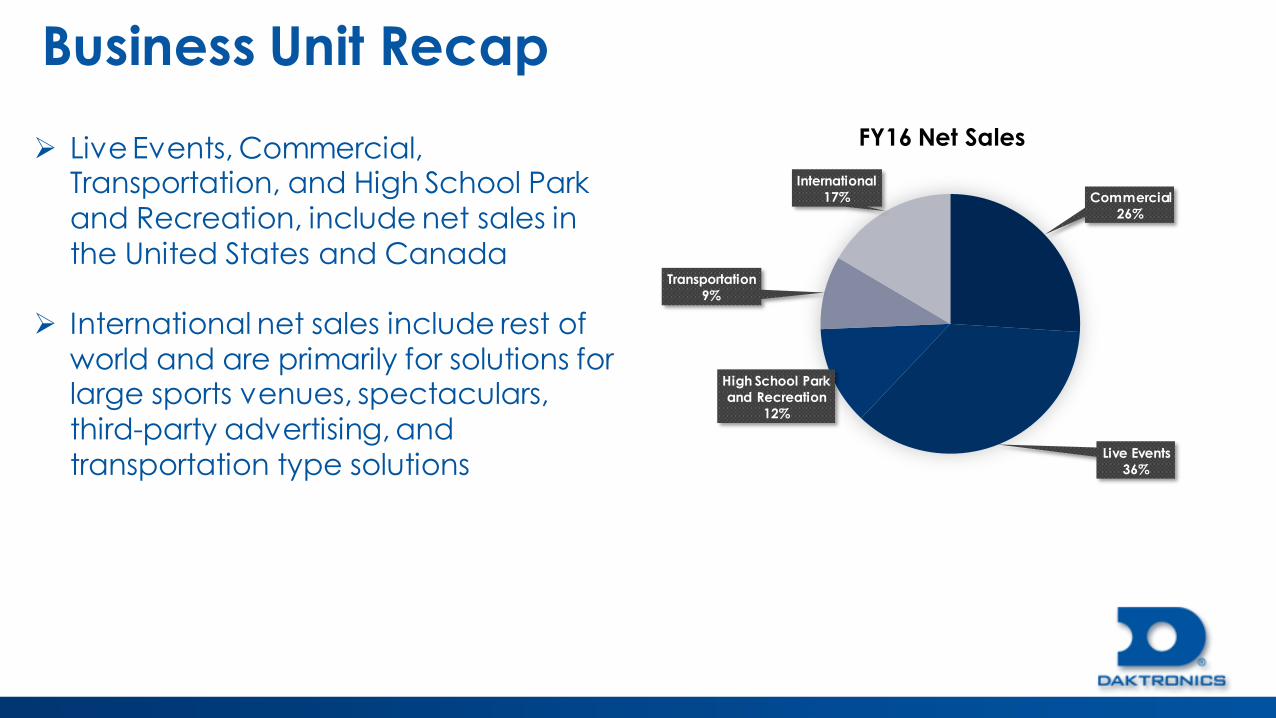
Business Unit Recap
Commercial
26%
Live Events
36%
High School Park
and Recreation
12%
Transportation
9%
International
17%
FY16 Net Sales Live Events, Commercial,
Transportation, and High School Park and Recreation, include net sales in the United States and Canada
International net sales include rest of world and are primarily for solutions for large sports venues, spectaculars, third-party advertising, and transportation type solutions

LIVE EVENTS BUSINESS UNIT
T-Mobile Arena, Las Vegas, NV

» Video displays solutions for
Large sports venues and live
entertainment facilities
• Professional sports
• College and university
• Arenas
» Competition
• Mitsubishi, Lighthouse, Panasonic and others
• Asian competition through U.S. integrators
LIVE EVENTS
South Dakota State University, Brookings, SD

LIVE EVENTS
Demand Drivers
» Facility increased spend to:• Enhance attendee event experience
• Revenue source from advertising
• Competitive nature to outperform other facilities
» Lower product costs, driving expansion of marketplace
» High definition product offering (HD)
» Replacement cycle (systems can last from 8-
12 years)
Minnesota Vikings – Minneapolis, MN
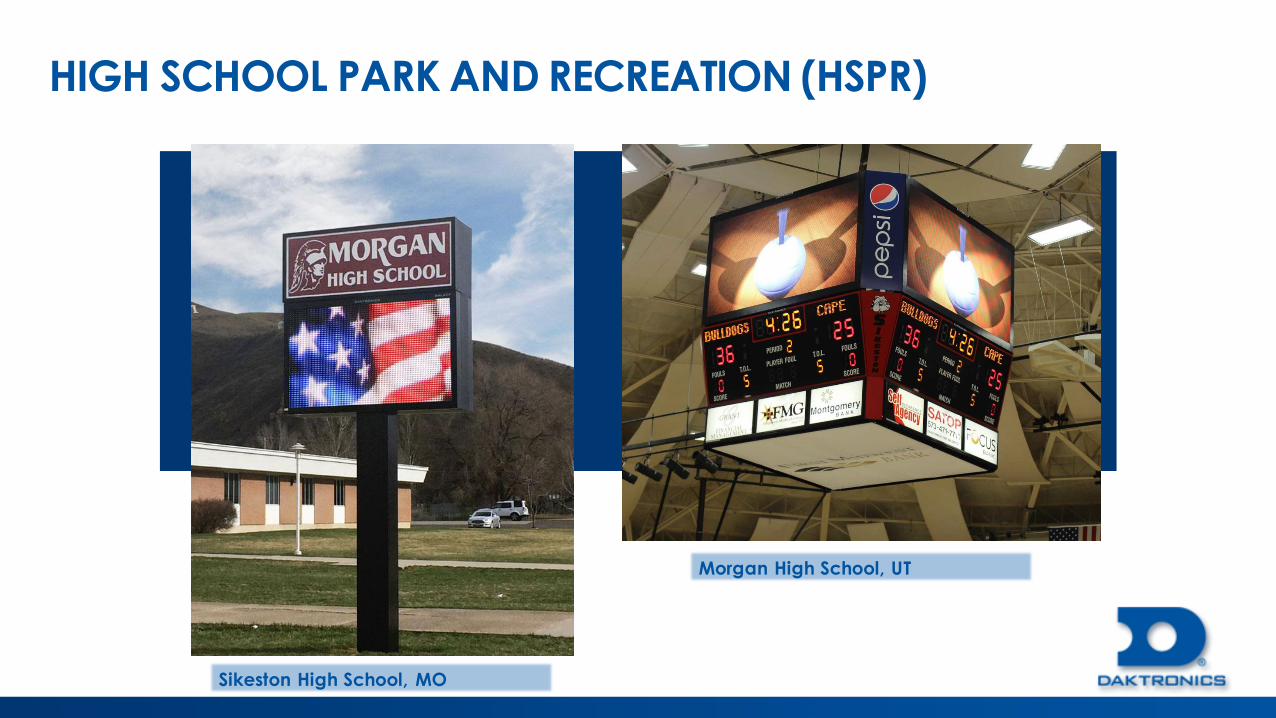
HIGH SCHOOL PARK AND RECREATION (HSPR)
Sikeston High School, MO
Morgan High School, UT

» Video and scoring systems and message centers to
• Elementary and high schools, junior colleges
• Park and recreation departments
» Primary funding is through local sponsors and advertisers
HSPR
Liberty North High School, Liberty MO

»Growth Drivers
• Larger more sophisticated displays in
sports venues
• Revenue generation
• Communication medium
• New construction/replacement cycles
»Competitors
• Translux, Nevco, other smaller
company manufacturers
HSPR
New Braunfels High School, TX

COMMERCIAL BUSINESS UNIT
LG Electronics - Times Square 1540 Broadway and West 45th Street

COMMERCIAL
Commercial Demo Trailer
» Sales channel focus
• Third party advertising/Out of Home Advertising (OOH)
• On-premise advertising (retail)
• Spectacular (custom video)
» Primary offerings• Digital billboards
• Message centers
• Video display systems
• Petroleum displays
• Dynamic messaging systems
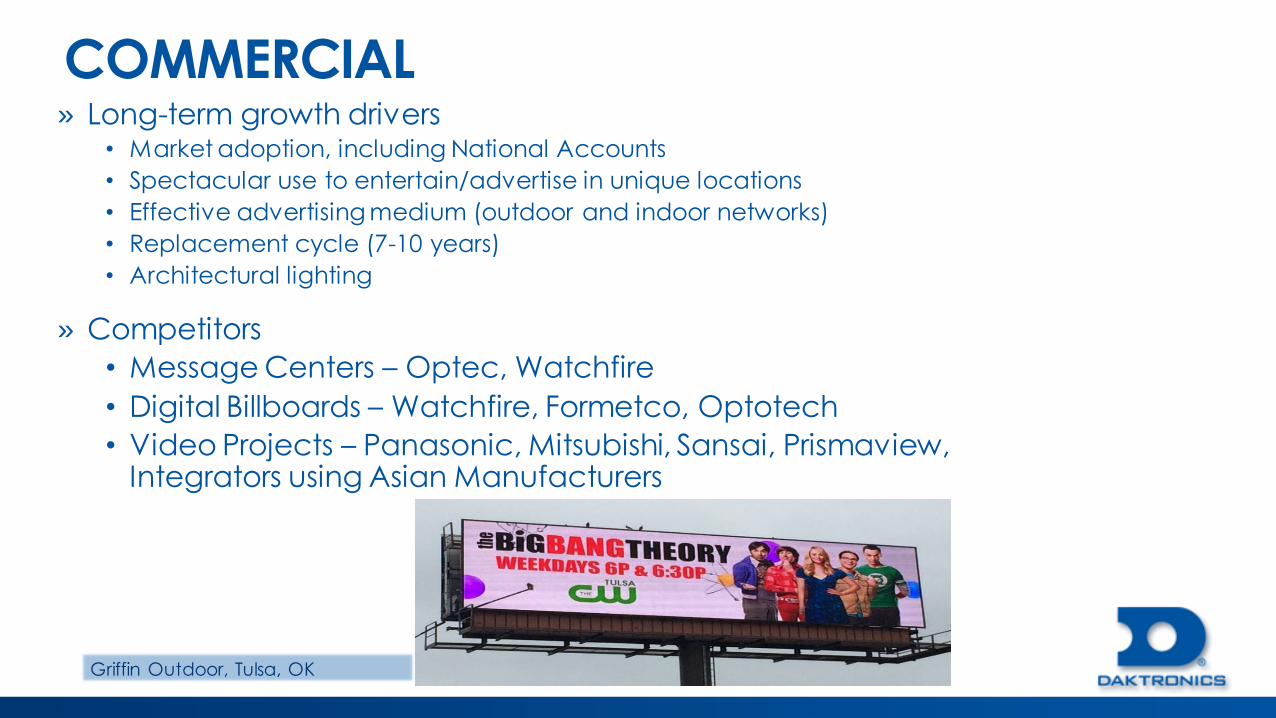
» Long-term growth drivers• Market adoption, including National Accounts
• Spectacular use to entertain/advertise in unique locations
• Effective advertising medium (outdoor and indoor networks)
• Replacement cycle (7-10 years)
• Architectural lighting
» Competitors
• Message Centers – Optec, Watchfire
• Digital Billboards – Watchfire, Formetco, Optotech
• Video Projects – Panasonic, Mitsubishi, Sansai, Prismaview, Integrators using Asian Manufacturers
COMMERCIAL
Griffin Outdoor, Tulsa, OK

TRANSPORTATION BUSINESS UNIT
Colorado DOTMiami-Dade International Airport

TRANSPORTATION
» Three niches
• Intelligent transportation systems (ITS)
• Airports
• Mass Transit
» Competitors
• Skyline, Ledstar, Telegra, SES-America, Imago, others
Vanguard Roadshow Demo Trailer
TRANSPORTATION
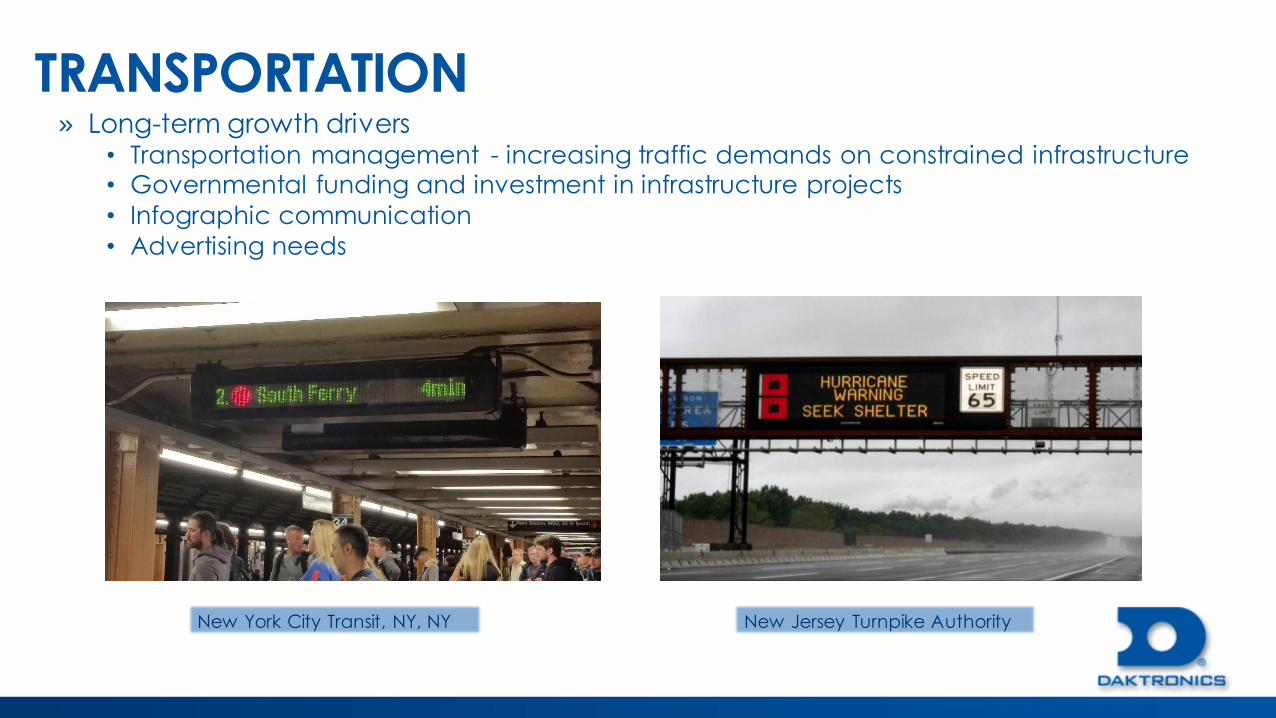
New York City Transit, NY, NY New Jersey Turnpike Authority
» Long-term growth drivers• Transportation management - increasing traffic demands on constrained infrastructure• Governmental funding and investment in infrastructure projects
• Infographic communication
• Advertising needs

INTERNATIONAL BUSINESS UNIT
Wuxi Inter IKEA, Wuxi China
JDC, Old Street London

Main products
» Commercial video systems
» Sports video systems
» Digital billboard (OOH)
» Architectural lighting
» Transportation systems
Infrastructure
» World-wide sales & service offices
» International Manufacturing facilities:
• China- architectural lighting and video
displays for Asian market
• Belgium – street furniture for Third Party/Out
of Home Advertising
• Ireland – transportation products
INTERNATIONAL
Trafford Tower, Manchester London UK

» Growth opportunities
• 3rd party advertising/Out of Home Advertising
• Live Events facilities/sports
• European/Middle East transportation systems
• Increased geographical coverage
» Competitors: Mitsubishi, Lighthouse, Panasonic, Barco and
other country-specific competitors
INTERNATIONAL
Salford Arch
Salford, UK

LOOKING AHEAD

Continued Global Demand
• Out-of Home Advertising
• Venue competition/ HD video for sports
• Increased geographic coverage and penetration
• New product introductions
• Continued market adoption and expansion
• Replacement cycle
• Worldwide economic conditions
ACHIEVING LONG-TERM PROFITABLE GROWTH

Robust solutions and operational excellence:
• New product introductions
• Enhanced Transportation products
• Localized and customer focused products
• Ultra high resolution solutions
• Enhanced product and control system platforms
• Agile Capacity
• Continuous Process improvements
• Quality focus and warranty cost reduction
ACHIEVING LONG-TERM PROFITABLE GROWTH

Modest revenue growth
International Macroeconomic trends tepid, yet strong level
of activity. Out of Home demand. Transportation focus
Europe and Middle East.
Live Events demand similar to prior years
Commercial macroeconomic conditions impact timing,
strong spectacular demand, OOH similar demand levels
Transportation opportunity for growth with funding/mass
transit/advertising
HSPR continued interest in larger video systems
OUTLOOK TO FISCAL 2017

SOLUTION EXAMPLES

Application of TechnologyPRODUCT PLATFORMS
TECHNOLOGY
CONTROL SYSTEMS
DYNAMIC MESSAGE SIGNS

QUESTIONS

10 YEAR HISTORY SUPPLEMENTAL INFORMATION F Y2007 F Y2008 F Y2009 F Y2010 F Y2011 F Y2012 F Y2013 F Y2014 F Y2015 F Y2016
N et sales $ 433,201 $ 499,677 $ 580,681 $ 393,185 $ 441,676 $ 489,526 $ 518,322 $ 551,970 $ 615,942 $ 570,168
Gro ss pro f it 126,597 147,590 155,358 94,556 111,484 113,437 133,894 141,710 144,579 121,019
Operat ing expenses 89,682 109,347 112,741 101,286 91,957 103,162 103,294 105,153 113,294 118,524
Operat ing inco me ( lo ss) 36,915 38,243 42,617 (6,730) 19,527 10,275 30,600 36,557 31,285 2,495
N et inco me ( lo ss) 24,427 26,213 26,428 (6,989) 14,244 8,489 22,779 22,206 20,882 2,061
Gro ss pro f it percentage 29.2% 29.5% 26.8% 24.0% 25.2% 23.2% 25.8% 25.7% 23.5% 21.2%
Operat ing margin percentage 8.5% 7.7% 7.3% (1.7%) 4.4% 2.1% 5.9% 6.6% 5.1% 0.4%
Weighted average diluted shares
o uttstanding 41,311 41,337 41,152 40,908 42,277 42,304 42,621 43,762 44,443 44,456
D iluted earnings per share 0.59 0.63 0.64 (0 .17) 0 .34 0 .20 0 .53 0 .51 0 .47 0 .05
C ash dividend per share 0.06 0.07 0.09 0 .10 0 .60 0 .62 0 .73 0 .39 0 .40 0 .40
Wo rking capital $ 44,904 $ 62,545 $ 107,405 $ 118,625 $ 128,160 $ 119,833 $ 125,456 $ 140,532 $ 149,075 $ 123,714
T o tal assets 265,850 294,479 324,876 305,851 327,847 315,967 319,418 357,451 379,479 349,948
Shareho lders' equity 153,708 183,253 211,911 207,053 203,102 190,805 188,246 203,119 212,039 201,067
B acklo g 127,000 175,000 120,000 127,000 131,000 123,000 141,000 172,000 191,000 181,000
P ro duct design and develo pment $ 15,627 $ 20,828 $ 21,619 $ 21,920 $ 18,949 $ 23,507 $ 23,131 $ 23,375 $ 24,652 $ 26,911
C apital expenditures 58,743 33,916 22,888 16,121 9,386 16,524 9,674 13,519 21,837 17,056
D epreciat io n and amo rt izat io n 13,801 21,121 24,448 22,260 19,641 17,518 15,607 14,501 14,968 16,856
C ash f lo w fro m o perat io ns 14,606 59,833 48,731 43,784 41,346 20,038 50,749 36,199 53,168 13,275
R egular dividend per share 0.06 0.07 0.09 0 .10 0 .10 0 .22 0 .23 0 .39 0 .40 0 .40
Special dividend per share - - - - 0 .50 0 .40 0 .50 - - -
Emplo yees as o f year-end:
F ull- t ime 2,300 2,600 2,500 2 ,100 2 ,100 2 ,300 2 ,210 2 ,280 2 ,420 2 ,470
P art - t ime and students 900 800 1,000 400 500 520 410 390 330 315
Sto ck price during f iscal year:
H igh $ 40.05 $ 32.37 21.32$ 9 .88$ 17.30$ 11.81$ 12.40$ 15.80$ 14.47$ 12.24$
Lo w 18.31 13.88 5.69 7 .00 7 .30 7 .68 6 .39 9 .63 10.03 6 .90
Sto ck price at f iscal year-end 23.92 14.79 8.96 8 .37 10.72 8 .46 9 .57 13.06 10.75 8 .70
EB IT D A 50,716 59,364 67,065 15,530 39,168 27,793 46,207 51,058 46,253 19,351