dakota, a first principles-based battery simulation … 1 of 14 white paper, october 2012 dakota, a...
TRANSCRIPT
Page 1 of 14
White Paper, October 2012
Dakota, a First Principles-based Battery Simulation and Modeling System
Gerald Halpert, Matthew K. Heun and Kerry T. Nock Global Aerospace Corporation
12981 Ramona Blvd., Suite E, Irwindale, CA 91706
ABSTRACT
Global Aerospace Corporation (GAC), in collaboration with its research partners, has been developing a state-of-the-art, object-oriented, first-principles-based simulation system, called Dakota, that can reproduce the actual behavior and performance of Li-Ion cells and batteries under a variety of operating conditions.
As a desktop modeling and simulation system, Dakota is designed to describe and predict performance under various operational modes and environments. The Dakota tool is not based on empirical cell test data nor particular cell chemistries, but instead incorporates and extends simple Single Particle Model (SPM) equations and includes user defined cell and battery design parameters that enables one to simulate complex charge and discharge profiles. Dakota is an engineer-friendly, extensible and platform-independent tool. The modeling tool has been successfully validated against results described in the literature, detailed Fortran SPM and full-physics model code results, and experimental cycling test data.
Our strategy for the initial development of Dakota has been to incorporate, and extend state-of-the-art first-principles Li-Ion chemistry and physics equations and to validate their operation using available long-duration Low Earth Orbit(LEO) cycle life test data. When Dakota correctly simulates the existing cycle life test data, we have successfully validated the first-principle models incorporated into Dakota. Where there are differences, we have worked to improve the first-principles chemistry and physics until it correctly simulates the test data. The implication of this strategy is that the Dakota tool can be applicable to any Li-Ion cell chemistry and many different applications including electric vehicle (EV) batteries.
INTRODUCTION
Li-Ion technology is highly attractive for electric vehicle (EV) energy storage; however, this technology is still relatively new for automotive drive applications. Because new vehicle platforms often require a very significant investment, to
reduce the risk of the use of this technology, battery performance and behavior needs be characterized and qualified by long, elaborate and expensive life testing. This testing can delay the use of the newest, best and safest Li-Ion technology on electric vehicles. In addition, it is not practical to perform laboratory life tests under all likely drive scenarios or operating environments to be encountered by a vehicle during its lifetime.
Unlike empirical-based battery models, Dakota is based on an advanced and extended first-principle SPM of Li-Ion cells that accurately replicates the actual Li-Ion chemistry and physics in a virtual environment. The architecture of the software system is patterned after the physics of the problem with elements of code taking on elements of the physical problem including battery, string configuration, cell, electrode, electrolyte, and separator software objects. In this fashion, a battery becomes an arrangement of cells that interact with each other defining the battery’s condition (e. g. voltage and capacity during charge or discharge) to change. In addition, Dakota is extremely engineer-friendly and is beneficial to a variety of people, including vehicle program managers, power systems and battery engineers, and battery manufacturing engineers.
This tool can enable EV development programs to predict battery life and performance based on extended, expanded and validated first-principles models rather than severely limited extrapolations of empirical cell test data; data that often fails to mimic actual battery usage. In addition, Dakota, used in concert with a real-time battery monitoring system, could permit the forecast of performance and life of EV batteries to be based upon their actual past usage, which makes possible real-time replacement decisions by maintenance operators.
In our most recent work, to be reported on here, we summarize the results of our effort to extend the SPM to a wider range of temperatures and rates and to perform long-duration simulations and to compare these results with actual laboratory data. In this work, we have improved the SPM; developed a way to extended the SPM to higher rates and lower temperatures without significant computational cost; developed a way to incorporate a thermal model to couple

Page 2 of 14
with SPM; developed a process for ingesting a new chemistry into the Dakota system that includes cell design and parameter information and beginning of life cell laboratory measurements; developed ways to integrate continuous, dynamic, physics-driven modeling with real material properties in a flexible computing environment; and developed advanced mathematical simulation techniques that will allow us to carry out accurate, 10-year, multi-cell (slightly imbalanced) battery simulations in less than a few days.
Dakota, for the first time, has the potential of offering battery and power system engineers the ability to carry out trade studies on the effect of cell design and cell operating conditions (rates, temperatures, end of charge voltage limit, depth of discharge, etc.) on long-term performance and life. In addition, Dakota can assist program managers with performance and life assessment of new chemistries that otherwise would require expensive and time-consuming life testing.
Battery Performance Prediction Tools
Current battery performance prediction tools consist of full physics models (FPMs), empirical-based models, and first-principle-based approximations or reformulations of the full-physics models.
FPMs usually do not include a comprehensive set of cell degradation mechanisms and they require finite element codes to run that prohibit long-duration, multi-cell battery life simulations due to their lengthy runtimes.
Empirical-based models are the result of fitting of actual laboratory cell and battery test data. They can be very fast running, however, they are severely limited since they can only give accurate predictions when a battery is operated in the exact same manner (i.e. rates, cycling protocol, temperature) as the tested cell or battery, which is almost never the case in real life.
First-principle-based simplified or reformulated models of the FPMs, of which Dakota is a unique example, can also be very fast, since their simplifications or equation reformulations significantly reduce the amount of computations required.
The advantages of Dakota over other simplified or reformulated models is a time-integratable, object-oriented software system that retains the physical and chemical connection to the first-principle models, which facilitates the addition and validation of new capabilities including new Li-Ion chemistries, new degradation mechanisms, and more accurate, but still simplified, formulations of the full-physics and chemistry. Currently the Dakota battery modeling and simulation system consists of over 40,000 lines of code, the result of over 5 years of government and private investment.
First-Principles Physics and ChemistryModel
Dakota currently includes two first-principles Li-Ion battery models, one of which is a simple SPM, based on the work of Dr. R. E. White and others [1] A pictorial view of this simple SPM, shown associated with lithium cobalt oxide chemistry, is illustrated in Figure 1, where a single particle represents all particles of an electrode. This SPM is based on the full physics models but makes several simplifying assumptions. These include: a) the concentration of the lithium ions in the electrolyte is assumed to be constant across the cell sandwich,b) the potential in the solution phase is assumed to be aconstant across the cell (zero volts relative to a Li/Li+ reference electrode in the solution phase), c) the potentials in the aluminum current collector and the cathode are assumed to be the same and depend on time, not position through the electrode, and d) the potentials in the anode and the copper current collector are assumed to be the same and depend on time, not on position.
Figure 1. White Single Particle Model Schematic
In addition, White’s SPM model with which we began Dakota contained a degradation parameter to reflect the growth of the Solid / Electrolyte Interface (SEI) on the anode, and loss of cathode active material upon cycling, and thus its performance decay upon cycle [2].
The SPM, which includes Butler-Volmer kinetics, contains both differential and algebraic equations. The differential equations describe how the average dimensionless concentration of Lithium ions in the solid phase changes over time.
DAKOTA MODELING APPROACH
In this section we address our approach to battery modeling by use of object-oriented software programming techniques, our improvements to and extension of the basic SPM that forms a core of Dakota’s modeling ability, and the additions of several cell degradation mechanisms important to accurately simulate cycle life performance.

Page 3 of 14
Object-Oriented Architecture
Object-oriented programming is ideally suited for simulating complex physical systems, of which, battery modeling is a very good example. Object-oriented programming methods have been used to construct the Dakota software models for the physical components of the battery. To illustrate the applicability of object-oriented programming to simulation of physical systems, one should compare the last sentence of the quote below with the description of a battery that follows.
“The idea of object-oriented programming is that functions and data are grouped together in an object, rather than treated separately. A program is a structured collection of objects that communicate with each other causing the internal state within a given object to change.” [3] (Emphasis added.) In Dakota a battery is an arrangement of cells that interact with each other causing the battery’s charge to change.
By highlighting the similarities between an object-oriented program and a battery, the following figure shows that an object-oriented programming approach is ideally suited to simulating physical systems (including batteries) with a variety of components. Figure 2 illustrates an example comparison of software and physical battery designs.
Figure 2 Notional Software and Physical Battery Designs
In this figure we have only shown a few of the software and physical objects that are employed in the Dakota battery model. The battery (on the right in the figure) displays a few of the components of a physical battery. In this example, the battery contains several cells arranged electrically in series-parallel. On the left is a rough representation of the software battery model with various software objects, or plugins, representing elements of the battery that need to be modeled. For example, the Cell Object contains a description of its characteristic electrode pair as described by the Electrode Pair Object. In addition we illustrate a Stochastic Object that could represent the physical size/shape statistics of each cell that might result from a realistic manufacturing process.
“A fundamental goal of object-oriented design is to increase the understandability and reusability of program code by focusing on what an object does and how it is used, rather than
how an object is implemented.” [3] In the case of simulating physical systems, the design objective is to achieve one-to-one correspondence between physical objects and software objects. By doing so, a battery modeler can arrange components in ways that the computer programmer never intended. Even then, the program “just works,” because the software objects know how to interact with each other given the definition and arrangement of objects specified by the designer. In this fashion, one can focus on correctly understanding and modeling the physics and chemistry of individual processes, process by process, rather than the complex physical ensemble.
To achieve this level of flexibility, two design principles must be maintained. First, the “data” contained by software objects must include variables representing the state of physical objects. For example, each software “cell” contains a variable that describes its charge. Second, each software object must know how to propagate its state forward in time. So, for example, each software “cell” contains equations to calculate its state, including partial differential equations, if necessary.
By using this model architecture, we were able to more quickly add capabilities and to discover problems with the underlying chemistry and physics. If the model did not accurately simulate the behavior of a laboratory test cell, this fact forced the modeler to focus their efforts on the correcting the basic physical and chemical software elements containing the partial differential equations and their various parameters in order to get the model to match the test cell behavior.
Improving the SPM
In the Dakota modeling effort we extended the state-of-the-art in first-principles modeling by improving the SPM in two ways: by implementing an approximation to the infinite series solutions and by improving the film formation equations at the end of taper during charge.
Infinite Series Approximation
Early in the development of Dakota, we noticed a fundamental difference between simulations from the FPM, implemented in COMSOL, and the SPM, implemented in Dakota. Figure 3 and Figure 4 show these differences for different values of cathode diffusion coefficient.
The difference can be readily seen at the beginning of discharge where all lines (representing different diffusion coefficients) show differences between the FPM and SPM models. The SPM model lines do not all start at 4.1 V, but the FPM lines do all start at 4.1 V. The differences are most severe for lower values of the cathode’s diffusion coefficient.
Essentially we found that the simple SPM’s 2-term approximation for the Li+ ion concentration distribution in the solid phase is a limiting factor. Thus, we needed to expand the SPM’s spherical diffusion equations.

For Sc << 1.0, solid phase diffusion effects are unimportant. For the objective of extending the temperature and rate Page 4 of 14
Figure 3 FPM simulation of MER cell run on COMSOL at 1C (8 A).
Figure 4 SPM simulation of MER cell run on Dakota at 1 C(8 A).
The Sc parameter, we will call the Solid Phase Diffusion Discharge Time Ratio, helps to understand the observed behaviors [4]. Sc is a function of applied current, particle size, diffusion coefficient, electrode solid phase volume fraction, active material thickness, and the maximum solid phase lithium ion concentration, as shown in the following equation.
€
Sc = fIR2
Ds(1−ε)t cs,max
where
Sc = (solid phase diffusion time) / (discharge time)I = rate [A]R = cathode particle radius [cm]Ds = diffusion coefficient [cm2/s]t = cathode active material thickness [cm]ε = cathode solid phase volume fraction [-]Cs, max = maximum solid phase Li+ concentration
envelope, if the diffusion coefficient is low (at low temperatures), solid phase diffusion becomes important at lower current rates.
The 2-term approximation to the solid-phase diffusion equation becomes problematic when Sc becomes large, because diffusion in the solid particles becomes important. The 2-term approximation simply does not have enough fidelity to capture the physics correctly. Sc becomes large when the current rate is high, when the active material particles are large, and when the diffusion coefficient is small (low temperature). So, the SPM is limited to low rates and moderate temperatures.
The reason for the SPM limitations is that concentration distributions in solid phases are approximated poorly. This is especially at the beginning of discharge under large Sc conditions where the SPM fails because it over-predicts the surface concentration of Li+ ions. This failure occurs because the two term polynomial approximation incorrectly predicts a “pile up” of Li+ ions at the surface of the solid phase particles. Incorrect prediction of the particle surface concentration results in low cell potential predictions as shown in the model comparison above.
To address the issue of using the SPM under conditions ofhigh Sc, we extended the SPM to include an approximation[5], to the infinite series solution to the SPM equations.
Improving the Film Formation Model
We observed that the simple SPM film formation model had an undesirable characteristic, namely that the end-of-taper intercalation/deintercalation current on the anode often goes slightly negative, especially when the taper cutoff currrent is low. This occurs because the current density for the film formation reaction (a constant in the original film formation equations) can be higher than the total current density for the anode when the taper limit is small. This requires that the intercalation/deintercalation current density switch sign. Essentially, this meant that the anode is discharging at the end of the charge process. To resolve this issue, we heuristically added an additional term to the film formation equations to ensure that the film formation current decreases at the end of the taper process.
Extending the SPM to Higher Rates andWider Range of Temperatures
In the past, the simple SPM has been know to have difficulty accurately modeling cell operation at high discharge rates, e.g. >1C for liquid electrolyte Li-Ion chemistry or when cell temperatures are much lower than room temperature. Our goal was to significantly improve the SPM simulation accuracy at high rates and for a wider range of temperatures without a significant increase in computation time. The use of the infinite series approximation, as opposed to the SPM’s 2-term approximation, was a significant step in this process, but we also realized that a number of cell parameters changed under

Page 5 of 14
different discharge conditions and it would be important to account for those changes in the Dakota SPM.
In addition to the basic cell design parameters, like electrode size, loading and coating thickness and porosity; particle size; separator thickness and porosity, etc., there are temperature-and rate-dependent, fundamental and necessary cell chemistry parameters needed to accurately predict cell behavior under a wider range of temperatures and high rate conditions. Knowledge is needed of the open circuit potentials (OCPs), the state of charge (SOC), diffusion coefficients and rate constants as a function of temperature for each of the electrodes. This information is chemistry and manufacturer dependent since different sources of base materials are often used. Some of this information exists in the literature, but most does not. Even what exists in the literature has very large differences between researchers, e.g. many orders of magnitude for rate constants. So, we recognized that we needed to develop a process for obtaining these data and for incorporating them into Dakota’s SPM. This process includes the very accurate and specialized measurement of OCP and SOC as a function of temperature for test electrodes, for example, and for determining the rate constants and diffusion coefficients in a systematic manner. However, this process also included parameter estimation of some of the difficult to determine cell parameters, like diffusion coefficients, rate constants and degradation parameters. Figure 5 illustrates this overall modeling process.
Figure 5 Example processes for determining cell parametersfor extending the SPM in rate and temperature.
What exactly is parameter estimation and how is it used in the modeling process? Parameter estimation is the method of estimating the values of important electrode quantities of a model when these parameters are difficult or impossible to estimate or measure with any accuracy. Examples include initial states of charge, solid phase diffusion coefficients, reaction rate constants, and loading derating factors. Early on we established a need for an automated method to estimate these parameters. Parameter estimation uses laboratory experimental data, compares predicted voltage vs. time curves to laboratory data, and adjusts key parameters to minimize
RMS error between predicted and laboratory curves. As we have developed this process for extending the SPM, we have realized that parameter estimation can significantly reduce the uncertainty of parameters that have many orders of magnitude uncertainty, like rate constants. In fact, to ensure thecharge/discharge behavior AND the thermal behavior is accurately modeled, we must carry out parameter estimation to determine the correct and appropriate rate constants. A key byproduct of this process is a much more accurate determination of some of the most illusive parameters, like rate constants.
As one can see in Figure 5, this process requires substantial cell measurements to characterize key cell parameters and some limited life-cycle testing in order to better determine degradation parameters.
Our philosophy is to accurately model the continuous physical and chemical changes in the cell as cycling proceeds and degradation occurs. By doing so, the model can predict cell performance even if rates and temperatures exceed nominal laboratory testing boundaries. This approach allows us to accurately simulate the life and performance of a cell over many thousands of cycles and many years of battery operation, without periodic measurements and resets of key parameters every few thousand cycles.
Integrating Cell Impedance Effects
Impedance is important because it affects the relationship between voltage and current. If the impedance is predicted incorrectly, the voltage during discharge will be incorrect. If the voltage is incorrect, we will incorrectly predict the time at which the cell will hit an end of discharge limit during a cycling regime.
Dakota incorporates the ability to set the ohmic resistance of a cell. This is important since the ohmic resistance of a cell causes a step change in voltage when switching from charge to discharge (and vice versa). This required us to develop algorithms for expressing cell impedance as a function of temperature that are incorporated into Dakota.
A number of factors have established the need for ohmic resistance of a cell, Rcell, in Dakota. First the FPM takes into account variation in electrolyte concentrations with time during operation, while the SPM in Dakota assumes constant electrolyte concentration. In addition, the constant electrolyte concentration assumption may not hold up at high rates and subzero temperatures, where Li+ diffusion coefficients may be very small and influences the cell performance. Incorporating Rcell in Dakota minimizes the effects of constant concentration assumption. Our objective was to develop an algorithm for calculating Rcell that includes the ionic and electronic contributions from cell components (electrolyte, cathode, anode, separator).
There are several components to impedance including ohmic, interfacial, and mass and charge transfer. We needed to include impedance to be able to predict proper cell behavior.

Page 6 of 14
Cell impedance increases as a cell ages under the influence of long term cycling. It’s important to understand which impedance components change and why. Their components include (1) Ohmic, (2) Solid / Electrolyte Interface (SEI) layer, (3) Charge Transfer (Activation) Polarization, and (4) Mass Transfer (Concentration) Polarization.
Ohmic impedance includes the ionic resistances of electrolyte in the separator and electrodes and the electronic resistances of active materials, current collectors, connecting tabs at both electrodes, contact resistances between the active material and current collectors.
The SEI layer is a surface film formed between the anode and electrolyte interphases. The SEI is ionically conducting, electronically insulating, passivation film that allows Li+
diffusion but reduces further solvent reactions at the electrode surface. SEI stability is important for long-term operation. Also, double layer effects on the electrode/solution interface contribute in this region.
Charge Transfer (Activation) Polarization is related to charge transfer during lithium intercalation as governed by Butler-Volmer equation, and its contributions depends on the rate-determining process of the reactions occurring at the electrodes.
Mass Transfer (Concentration) Polarization is as a result of slow mass transfer of either the reactants or products in one of rate determining electrodes (Fick’s law). The dominant mode of mass transfer is diffusion in lithium ion batteries, primarily due to slow lithium ion diffusion rates in the electrodes during intercalation/de-intercalation process.
Figure 6 illustrates the contribution of the various impedance sources and show how they affect cell behavior. Charge and mass transfer polarization, which have a longer time constant, are important if one is to simulate long-duration performance and life.
Figure 6 Impedance contribution schematic
Ohmic cell impedance, which consists of anode, cathode and separator resistance, can be both calculated and measured. In addition, we have used parameter estimation to refine cell impedance.
We investigated the variation of mass and charge transfer polarization of the electrode/cell impedance components with temperature and rate for lithium nickel cobalt oxide cells over a temperature range (0-30°C) and rates (2C, C, C/2, C/5, and C/20). The mass and charge transfer polarization impedance components were calculated using an FPM under given operating conditions (temperature, rate) for this chemistry, knowing the OCP-SOC as well as electrolyte conductivity vs. concentration correlation.
The mass transfer impedance was extracted from solution phase potentials in the cathode, separator and anode regions at different DOD (or SOC). The charge transfer impedance was calculated based on the FPM exchange current results extracted for the anode and cathode at different DOD (or SOC).
Analysis was completed for temperatures 20, 10 and 0°C. As expected, the total impedance increased with decrease in temperature and to a much smaller extent with an increase in the discharge rate.
Incorporating New Cell DegradationMechanisms
We have incorporated two new degradation mechanisms into the SPM in Dakota that can help us to accurately simulate cell life and performance. These new degradation mechanisms include electrolyte oxidation (which forms a cathode external film) and loss of active anode material (the simple SPM already included anode film formation and cathode active material loss).
Figure 7 illustrates the envelope of possible degradation mechanisms for Li-Ion cells. The red highlighted cells are all the degradation mechanisms currently incorporated into Dakota. The degradation mechanisms we selected offered the biggest benefit to the battery operation conditions of interest to our sponsors, i.e. long duration, LEO satellitecharge/discharge cycling with pulse discharge characteristics. A number of these mechanisms are relevant to Li-Ion cell failure, and therefore could be of interest for other modeling applications, e.g. EV battery modeling and simulation.
The model formulation and equations for the electrolyte oxidation, which forms an external film on the cathode particle, is based on the same treatment as that of the anode film formation (SEI layer growth) in the original SPM. The oxidation of the electrolyte happens during charging of the Li-Ion cells. Additionally, there is an internal film formation on the cathode resulting from the reaction of the cathode particles with the electrolyte, which is also formulated in a similar manner.

Page 7 of 14
Figure 7 Cell degradation matrix illustrating degradationmechanisms and corresponding modes of their acceleration.
Multi-cell Battery Modeling
Dakota can simulate a battery with multiple cells in various string relationships. A series of cells can also have a shunt resistor connected to it in parallel. The interactions among the cells of the battery are determined by utilizing the physics of series and parallel connections: all components connected in series have the same current and all components connected in parallel have the same potential. For example, Dakota can quickly create MpNs batteries (where M is the number of parallel cells in a virtual cell, and N is the number of virtual cells in a string).
In addition, Dakota can represent a Battery Control Board (BCB) that controls how much current is delivered to the battery. Shunt resistors can be connected in parallel with series-cells, and serve to draw current away from the series cells during taper charging.
Figure 8 illustrates a simple battery with 3 cells in parallel, in a “virtual” cell arrangement with a BCB. We can combine these virtual cells in a series connection, called a “string”(3p1s), a configuration of interest to one of our sponsors. Additionally, each virtual-cell has a shunt resistor connected to it in parallel, creating a “virtual-cell-pack.”
Figure 8. Schematic of 3p1s system circuit.
Creating a 3p8s battery required adding additional virtual-cell-packs to the existing 3p1s battery. Each virtual-cell in the battery has three cells, and each virtual-cell is connected in parallel with a shunt, creating eight virtual-cell-packs in series.
Figure 9 shows a simple circuit diagram of the 3p8s battery. The virtual-cell-packs are the sets of 3 cells and a shunt. The 8 virtual-cell-packs are connected in series, with a source (or load) connected to the series. There are connections from the shunts to the battery control board, which allow the battery control board to monitor the potential of the virtual-cell-pack, and to control the resistance of the shunts.
Figure 9: Schematic of 3p8s system circuit
Later, we will show some results of multi-cell battery modeling when the cells have slight imbalances.
MODEL VALIDATION ANDSIMULATIONS
Validation Strategy
The strategy for validating the Dakota tool was multifold using a Full Physics Model (FPM), laboratory test data, and published results. This strategy included the incorporation of three chemistries into Dakota, namely, (1) Doyle-Newman [6] (D-N) - LiyMn2O4, LixC6, (2) US government (USG) - LixCoO2, LixC6, and (3) the Lithion-manufactured Mars Exploration Rover(MER) cell - LiNixCo(1-x)O2, LixC6 chemistry. In addition, we incorporated these chemistries into a FPM using COMSOL. This enabled us to validate the SPM Dakota against D-N published results, MER LEO cycling data, and COMSOL full-physics model results for all three chemistries.
Charge/Discharge Behavior Validation
In this section we display the validation of Dakota with respect to a Fortran-based SPM, published results and laboratory test data.
One of the first things we did was to verify that the SPM in Dakota performed identically to the SPM provided by Dr. White. The chemistry in White’s SPM was based on a USG cell, i.e., with a lithiated cobalt oxide cathode and MCMB graphitic anode. The objective of this comparison was to ensure that the predictions from the Dakota model are comparable to that of White’s SPM model, before we made further modifications and validations against experimental or published data.

Figure 12 is a comparison of the SPM Dakota with actual data from a MER Li-Ion cell with the NiCoO2/MCMB chemistry. A cell designated YL094, and the SPM Dakota results were Page 8 of 14
Figure 10 illustrates the typical USG cell discharge profile from Dakota and a Fortran SPM at room temperature at a current of 1 A (current density of 9.5 mA/cm2), using the same set of cell parameters.
Figure 11 illustrates the validation of Dakota’scharge/discharge behavior using Doyle-Newman (LiyMn2O4, LixC6,) chemistry published results that included FPM simulations and laboratory test data. The reason for choosing this chemistry was fivefold: (1) existing literature was available and is well known to community, (2) all cell parameters are known or “easily” calculated, (3) OCPs were provided in the literature, (4) initial states of charge were provided in the literature, and finally (5) the Full-Physics Model (FPM) is available in Fortran and COMSOL.
Figure 10 Typical USG cell discharge curves simulated fromDakota and Fortran SPM
Figure 11 shows the comparison between the published resultsof Doyle-Newman with both the SPM Dakota and the FPM assimulated in COMSOL.
Figure 11 Comparison of Doyle-Newman results with SPMDakota and RFM COMSOL predictions for 0.5C
compared. The discharge rate was 1.6 A, which is C/5 based on the rated capacity of this cell. The YL094 cell was selected since its capacity was at the average capacity for the YL and YF MER cells groups.
These data show that Dakota performs as expected with respect to a Fortran-based SPM code and is very comparable to a FPM and experimental test data for two completely different Li-Ion chemistries.
Figure 12 MER cell YL094 100% discharge profile Dakotavalidation.
Cell Cycling Behavior Validation
A comparison of a Dakota simulation and the cycling of a MER cell for a Low Earth Orbit (LEO) protocol at 20°C is shown in Figure 13. The voltage and current outputs from laboratory test data are compared with a Dakota simulation. The protocol was 30% DOD (4A for initial charge to 3.95 V followed by taper for a total of 60 minutes and 6A discharge for 0.5 hours. The voltage comparison is shown in the top curves.
Figure 13 MER cell YF265 LEO cycling Dakota validation
As one can see in Figure 13, the Dakota simulation almostexactly tracks the laboratory test data.

Page 9 of 14
Multi-cell Battery Simulations
In this section, we discuss the simulation of an unbalanced 3p1s virtual cell pack and an unbalanced 3p8s battery.
For the 3p1s, “unbalanced,” means that the initial SOC of one of the cells in the virtual-cell was much lower than the other two cells. The differences in SOCs of the cells were achieved by adjusting the values of theta (the ratio between the average solid phase concentration of the lithium ions in the solid phase of the electrode and the maximum concentration of lithium ions in the active material) of the electrode for the cell in question. By adjusting these values (essentially moving around ions for the initial condition), we could achieve different states of charge for different cells. In addition, the active material loadings of each cell were randomized to be slightly different, e.g. within ±10%. However, the interactions between the cells are mostly defined by their initial SOC.
Figure 14: Simulation of an unbalanced virtual cell at 100%DOD
In a virtual-cell with one cell (Cell 1) starting at a lower SOC than the other two cells (Cells 2 and 3), as shown in Figure 14, the cells with the higher SOC can discharge into the cell with the lower SOC, if the imbalance is extreme (as shown above). Essentially, Cell 1 requires more current than delivered by the BCB to reach a potential equal to the other cells in the parallel string (Cells 2 and 3). Cells 2 and 3 ultimately deliver the extra current that Cell 1 needed.
As the charge progresses in the simulation, Cell 1 needs less current to keep its potential the same as Cells 2 and 3. After about 2700 s, the cells with initially higher SOCs (Cells 2 and3) begin to approach full charge, thereby requiring lesscurrent. The cell with initially lower SOC (Cell 1) then absorbs additional current as the virtual cell pack approaches taper (at about 4800 s). We see that the current through each cell decreases and the current through the shunt increases during taper mode.
One value of a good physics-based model is that it helps you to understand the physics better. The cell interaction model
that we have developed for Dakota has already done that. We note that the interaction model was developed simply and entirely based upon the physics for parallel and series circuit components.
In the case of the 3p8s simulations, “unbalanced” means that loading has been varied slight (by no more than ±10%). The initial values of thetas for the cells in the 3p8s battery simulation were all identical, meaning that all the cells had the same SOC at the beginning of the simulation. The initial theta value for all anodes was: 0.640587. The initial theta value for all cathodes was: 0.653898. These values were kept identical to prevent the possibility of an unbalanced cell-pack impeding the progress of the whole simulation.
The BCB for the 3p8s battery controls the resistance of the shunts to keep the cell voltage at the desired limit during taper charging. The potential and current settings of this BCB were:
Potential Charge Limit: 4.1 Volts Potential Discharge Limit: 3.0 Volts Charge Current: 12.0 Amperes Taper Limit: 0.15 Amperes Discharge Current: -12.0 Amperes
Because degradation was not included in this simulation, the behavior of the change in potential of the string and distribution of current within each virtual-cell-pack were identical throughout the simulation. Each virtual-cell-pack is allowed to be at a different level of potential, so there were some virtual-cell-packs that were at higher or lower potentials during charge and discharge than the others, as seen in Figure 15 and Figure 16.
Figure 15: Potentials of Virtual-Cell-Packs during one fullcycle
Since each virtual-cell consists of cells of different loadings, thepotentials of the virtual-cell-packs were different. Thesedifferences are most apparent during the beginning of charge,and the end of discharge. Although the virtual-cell-packs do notgo into taper mode at the same times, they do exit taper modesimultaneously as shown in Figure 15 and Figure 16.

Page 10 of 14
Figure 16: Potentials of Virtual-Cell-Pack during tapering.
Although the potentials of each virtual-cell-pack could bedifferent at any given time, the behavior of the shunt resistor isalways related to the behavior of its virtual-cell-pack. Theresistance of the shunt should be infinite (either very large oropen circuit) while the cell is charging or discharging, thensome finite value during tapering to allow current to be directedaway from the cells as seen in Figure 17.
Figure 17 Potential of Virtual-Cell-Pack #3 and Resistanceof Shunt #3 for one cycle
There are a number of positive results from this 3p8s battery simulation. First, the simulation ran to 5667 cycles, which is about 3 years of simulated time, until it ended due to the output file reaching the Windows file system limit of 4 gigabytes. All indications show that the simulation could have run forever if not for this computer system limitation. In the future, the output file(s) can be segmented to avoid this issue. Without a number of software and algorithm optimizations that we have already implemented, this early simulation ran about 160 times faster than real time on a personal computer. With algorithm optimization, we can expect a 10-year simulation of a 24-cell battery to take a few days (real time) on a personal computer. As computer capabilities advance, this time will drop. The implication of this capability in
Dakota is that complex battery operation scenario trade studies can be conducted in a reasonable period of time for battery and power systems engineers. This simulation performance is impossible with full physics models running on finite element codes.
Validation of the SPM Extension in Rateand Temperature
In this section we discuss some of the results of the validation of the extension of the Dakota SPM in rate and temperature. While there is still more validation and model refinement work to be done here, we have made significant progress.
We began the validation of the model using a 10-Ah capacity MER cell. Laboratory data for this cell consisted of 100%DOD and LEO cycling at different charge and discharge rates (C/20 to 1.5C) and at different temperatures (0° to 30°C). To begin the validation process, we compared the Dakota predictions with cell test data, to understand performance. Then we used results of the comparisons to correct and/or improve the physics of the model. This often required parameter estimation, which can be done automatically in Dakota, to refine some of the more uncertain cell or fundamental parameters. We began with the rate validation followed by the temperature validation.
Figure 18 shows the results of this validation process for 10 A discharge curves (1C) at various temperatures. The blue lines represent simulation data, while the red lines display the laboratory data.
Figure 18 Comparison of predicted and lab discharge curvesof 10 A at various temperatures
We see that the correct cell capacity is predicted at all temperatures at 1C. To achieve the capacity agreement observed in Figure 18, we performed parameter estimation on rate constants and diffusion coefficients at every rate and temperature. We believe that some of this parameter estimation may be unnecessary at higher rates if we can include electrolyte impedance in the SPM. This is an area for future improvement.
Figure 19 illustrates (for the most-challenging temperature only, 0°C) that we predict the correct cell capacity at all rates as well.

Page 11 of 14
Figure 19 YF298 predicted and lab discharge curvescomparisons at 0°C
Long-duration Cycling BehaviorValidation
In this section we discuss the validation of the Dakota degradation mechanisms by comparing long-duration laboratory cell LEO cycling data with Dakota simulations. We also compare long-duration simulations with and without operation capacity measurements in order to determine their potential impact. Finally, we describe an experiment where we attempt to predict the behavior of a cell after 7 years of cycling with only a year and a half of cycling data.
The approach to validating the new degradation models was to compare long-duration simulations that included the new degradation models with the long duration LEO cycling lab data for MER cell chemistry. We chose two sets of laboratory data. One was for a cell (YF265) that was cycled at 30% DOD at a temperature of 23°C and had around 23,000 cycles (about 4 years) on it and the other was for a cell that was cycled at about 15% DOD at 23°C for 41,100 cycles (more than 7 years).
Cycling Protocol
Our first step was to create a cycling protocol simulator, or cycler, in Dakota that mimics the operation a cell exactly as cell YF265 had been operated in the laboratory. This cycler allowed us to accurately compare data from the lab and the simulation to correctly determine the degradation mechanism parameters. Figure 20 and Figure 21 describe the cyclers used in the simulation of the YF265 cell. Figure 21 shows the cycles after 500 LEO cycles.
Part 1 describes the initial cycling of the cell that starts with twofull 100% DOD discharges before the LEO cycling began. Part2 describes the protocol around cycle 500 when the op-capswere carried out along with various other measurements that
include DC impedance measurements by injecting current pulses of C/2 for 60 seconds at different states of charges.
Figure 20 MER cell YF265 LEO cycling protocol - part 1.
Figure 21 MER cell YF265 LEO cycling protocol - part 2.
Degradation Mechanism Validation
In this validation, we added degradation mechanisms sequentially: anode film formation, cathode degradation, anode degradation, and cathode film formation. We then used the results to correct and/or improve the physics, if needed.
Our detailed approach was to use parameter estimation to match the first 20 cycles of lab data without degradation mechanisms in place. Then we carried out sensitivity studies on the 4 degradation mechanisms in Dakota. Then, using combinations of degradation mechanisms, we attempted to obtain better fits to laboratory data. All the while, we tracked film thickness as a percentage of particle radii and active material loss as a percentage of initial material in order to make sure we were still modeling physically representative systems.
The four degradation mechanisms are:
Anode external film formation Cathode external film formation Anode active material loss Cathode active material loss

Page 12 of 14
In this process, we learned that it is important to include all 4 degradation mechanisms, because they all interact to produce the overall degradation result. Figure 22 demonstrates that Dakota can accurately represent laboratory cell degradation behavior using its physics and chemistry-based model.
Figure 22 Best fit of degradation parameters for YF265 longduration cycling data
In Figure 22, it is noteworthy that we are predicting the magnitude of the cell “recovery” after op-caps (operation capacity checks) quite well, which is a testament to the performance of an infinite series approximation model that does a better job of predicting the Li+ concentration at the surface of the particles.
Effect of Op-Caps in Laboratory Testing
Because of questions about the impact of op-caps to potential cell life testing, we carried out a simulation with identical cell and degradation parameters as shown in Figure 22, but without the op-caps occurring every 500 cycles. The results are shown in Figure 23.
Figure 23 YF265 EODV vs. cycle simulation comparisonwith and without op-caps
These data suggest that laboratory testing with op-caps may have a detrimental influence on overall measured life and, therefore, may result in conservative estimates of LEO cycle life. For YF265, it could mean that, in actual LEO operations,
without op-caps, this cell may have up to 25% more life cycles than estimated by laboratory data where op-caps are done.
The increased cycle life is due to the fact that op-cap cycles areperformed over 100% DOD cycles, which is effectivelyequivalent to multiple shallow DOD cycles in terms ofdegradation effects. The results in Figure 23 illustrate the powerof a fast physics-based battery simulation system, like Dakota,to study the implications of laboratory cycling regimes ascompared to actual operations.
EODV Prediction Experiment
We also had one laboratory data set for a 7 Ah cell of the same MER chemistry that was cycled at about 15% DOD at 23°C for 41,100 cycles (more than 7 years). In addition, this data set had no op-caps. With this set of data we tried an experiment with Dakota to see how well Dakota could predict the end of discharge voltage (EODV) at the end of the cycling data. The comparison of laboratory EODV data to Dakota predictions is shown in Figure 24.
This cell was not cycled continuously, though there were rarely more than a few days between cycling tests. There were two instances where there was a 3–4 month span of time between cycling. This cell was cycled without op-caps,however, at the end of each cycling span, the cell was fully charged before storage that was not included in the simulation, hence, the simulation cycles begin with a charge only cycle that was taper-limited followed by a discharge (deeper than15% DOD), which brings the cell to a lower EODV than actually observed in the lab data. At the beginning of every set of continuous cycling data, the first cycle was a charge only cycle that was taper-limited. Then the remaining cycles were timed cycles (1 hour charge, 30 minute discharge). There were also two short instances where the cell cycling schedule was different from the intended protocol, and it was operated at 19.3% DOD, once at around 4,900 cycles and again around 29,000 cycles. These “mistake” cycles were accounted for in Dakota. The roller coaster appearance of the lab data may be attributable to seasonal variations in the “room” temperature.
Figure 24 Dakota simulation vs. lab data for cell Y702

Page 13 of 14
Overall the Dakota simulation in Figure 24 tracks laboratorydata well. There are some differences. First, the simulationstarts with a slightly lower EODV for the first 1500 cycles,and the initial slope of EODV decay is less than the slope ofthe actual data. Second, as discussed above, the lower greendiamonds of EODV from the simulation seen in Figure 24occurred after the first discharge cycle of each regimen sincethe simulation had not accounted for the full chargingsequence before cell storage, hence the EODV briefly dropsbelow the lab data. Third, the simulation nicely follows theEODV when the cell was cycled, at 19.3% DOD beginningwith cycle 5000. Fourth, from 3000 to 30,000 cycles, theDakota simulation matches the laboratory EODV very well.
In Figure 25, we present the same data without the 19.2%DOD points. We created a spline curve to match the simulation and then stretched it to get a quasi-fit to the lab data near the end of its cycling. Then we calculated the time at which an EODV of 3.65V was reached for both the simulation and the stretched spline fit of the actual lab data. The result was that the simulation underestimated this time by about 12%.
Figure 25 Comparison of time to reach an EODV of 3.65 Vfor a Dakota simulation and lab data fit for cell Y702
Our approach above was to use initial cycling data (first 8,000 cycles) to determine degradation parameters to predict the performance of the cell many years into the future (41,000 cycles). It is useful to consider the conditions under which we expect this approach to be successful.
Most Li-ion cells are made with excess anode material (the cells are “cathode limited”) to avoid Li plating on the anode during cycling. Cells are designed with enough excess anode material to avoid Li plating throughout the expected lifetime of the cell. In fact, end-of-life for a cell can be defined as the moment at which the limiting electrode switches from the cathode to the anode.
This design reality provides some promise that it will be possible to determine cell degradation parameters using parameter estimation techniques on the first few thousand cycles of laboratory data. In a well-functioning cell, the
cathode is the limiting electrode, therefore parameter estimation will be most sensitive to the degradation of the cathode during the first several thousand cycles in the laboratory. With cathode degradation parameters in hand (and to a lesser extent, with anode degradation parameters in hand), it should be possible to predict the behavior of the cell over its lifetime with an acceptable level of accuracy. The successful predictions shown above, especially with cell Y702, indicate that this approach has merit and should be pursued further.
10-year, Life-cycle Simulations
In this section, we simulate a long duration LEO operation, i.e. >10 years, of a MER chemistry cell in Dakota. Our approach was to assume a single cell with YF265 physical characteristics, initial cell parameters (θs and LDFs), and a representative set of degradation parameters to enable a 10 year simulation. Simulations were run and performance and life compared for two DODs, namely 30% and 40%. In addition, we compared the charge-discharge curves at the beginning of life and near the end of life.
Figure 26 shows EODV for a cell with degradation parameters that were reduced relative to the degradation parameters from Figure 22. Note that the top two dashed lines represent the cell “recovery” after op-caps. The solid line represents EODVs for LEO cycles. The dashed line at 3.0 V represents op-caps EODVs.
Figure 26 Representative 10-year simulation of a MER celloperated at 30% DOD at 20°C
We benchmarked the runtime required for the above simulation and found that it required about 4 hours clock time on a desktop computer (Intel Core2Quad Q9550 @2.83 GHz). We estimated that for a 24-cell battery, it would require about 4 days for simulation on the same computer. Future computer and software improvements can significantly reduce this time. The implications of these runtimes is that real batteries can be simulated relatively quickly allowing engineers to carry out numerous trade studies during satellite system design.
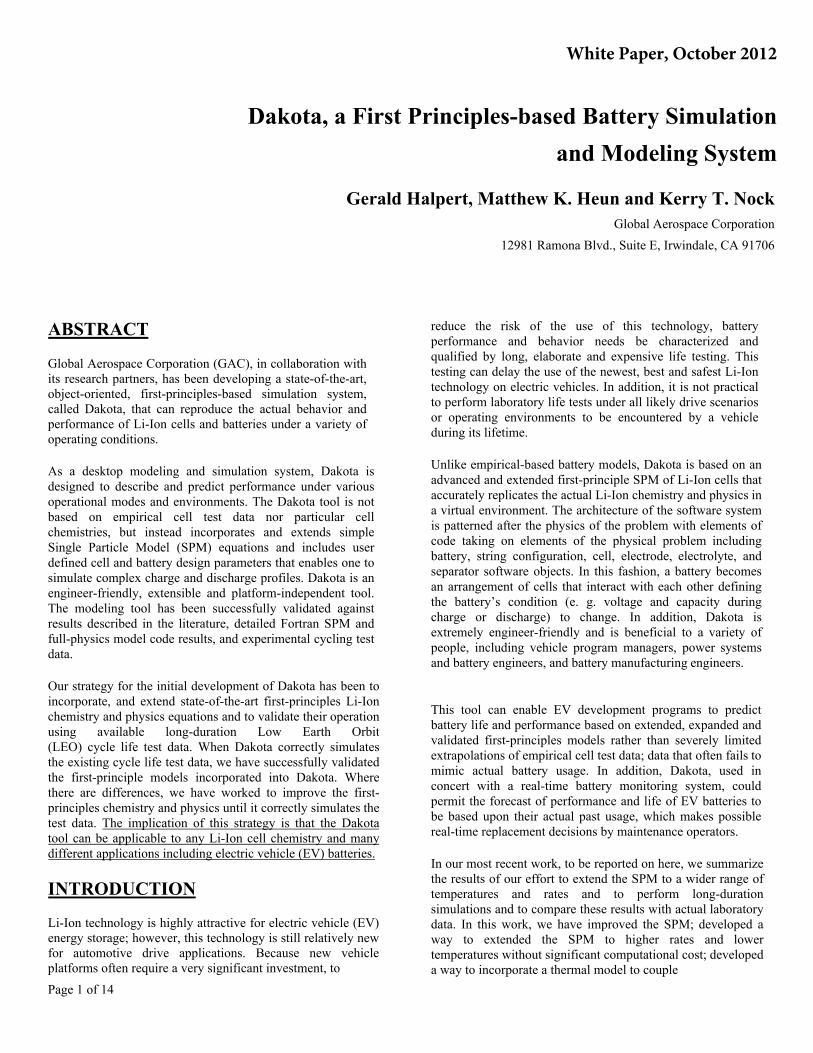
Figure 27 compares charge-discharge processes at the 100th
cycle (near beginning of life) and at the 50,100th cycle at 9
Page 14 of 14
years. Expected trends are observed: EODV is much lower at 9 years, and the aged cell reaches the charge limit faster.
Figure 27 Comparison of early and late cycle dischargebehavior for 10-year simulation
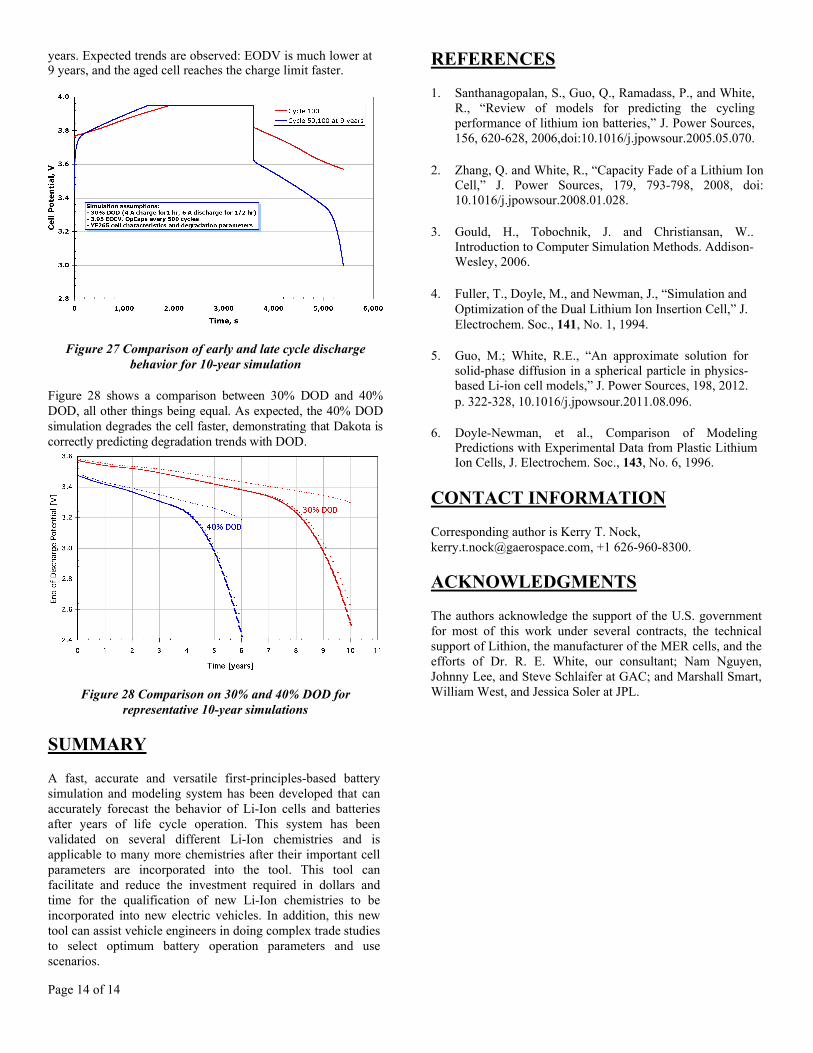
Figure 28 shows a comparison between 30% DOD and 40%DOD, all other things being equal. As expected, the 40% DODsimulation degrades the cell faster, demonstrating that Dakota iscorrectly predicting degradation trends with DOD.
Figure 28 Comparison on 30% and 40% DOD forrepresentative 10-year simulations
SUMMARY
A fast, accurate and versatile first-principles-based battery simulation and modeling system has been developed that can accurately forecast the behavior of Li-Ion cells and batteries after years of life cycle operation. This system has been validated on several different Li-Ion chemistries and is applicable to many more chemistries after their important cell parameters are incorporated into the tool. This tool can facilitate and reduce the investment required in dollars and time for the qualification of new Li-Ion chemistries to be incorporated into new electric vehicles. In addition, this new tool can assist vehicle engineers in doing complex trade studies to select optimum battery operation parameters and use scenarios.
REFERENCES
1. Santhanagopalan, S., Guo, Q., Ramadass, P., and White, R., “Review of models for predicting the cycling performance of lithium ion batteries,” J. Power Sources, 156, 620-628, 2006,doi:10.1016/j.jpowsour.2005.05.070.
2. Zhang, Q. and White, R., “Capacity Fade of a Lithium Ion Cell,” J. Power Sources, 179, 793-798, 2008, doi: 10.1016/j.jpowsour.2008.01.028.
3. Gould, H., Tobochnik, J. and Christiansan, W.. Introduction to Computer Simulation Methods. Addison-Wesley, 2006.
4. Fuller, T., Doyle, M., and Newman, J., “Simulation andOptimization of the Dual Lithium Ion Insertion Cell,” J.Electrochem. Soc., 141, No. 1, 1994.
5. Guo, M.; White, R.E., “An approximate solution for solid-phase diffusion in a spherical particle in physics-based Li-ion cell models,” J. Power Sources, 198, 2012.p. 322-328, 10.1016/j.jpowsour.2011.08.096.
6. Doyle-Newman, et al., Comparison of Modeling Predictions with Experimental Data from Plastic Lithium Ion Cells, J. Electrochem. Soc., 143, No. 6, 1996.
CONTACT INFORMATION
Corresponding author is Kerry T. Nock,[email protected], +1 626-960-8300.
ACKNOWLEDGMENTS
The authors acknowledge the support of the U.S. government for most of this work under several contracts, the technical support of Lithion, the manufacturer of the MER cells, and the efforts of Dr. R. E. White, our consultant; Nam Nguyen, Johnny Lee, and Steve Schlaifer at GAC; and Marshall Smart, William West, and Jessica Soler at JPL.