dairy cafos in california’s san joaquin valley · dairy cafos in california’s san joaquin...
TRANSCRIPT

Dairy CAFOs in California’s
San Joaquin Valley Local Benefits and Costs
May 2007
Chelsea N. MacMullan
Submitted to the Humane Society of the United States
The author conducted this study as part of the professional education program at the Goldman
School of Public Policy, University of California at Berkeley. This paper is submitted in partial
fulfillment of the course requirements for the Master of Public Policy degree. The judgments and
conclusions are solely those of the author, and are not necessarily endorsed by the Goldman School
of Public Policy, by the University of California, by the Humane Society of the United States, or by
any other agency.

California Dairy CAFOs
Page | 2
Contents I. Executive Summary .................................................................................................................................. 5
II. Background: The Dairy Industry ........................................................................................................ 7
A. Statewide Economic Benefits of the Dairy Industry ....................................................................... 7
B. Structural Change: Technology, Systems Transformation, and Specialization ............................ 8
C. Consequence of Structural Change: Nutrient Concentration ...................................................... 10
1. Excess Nutrients and Water Quality ........................................................................................... 11
2. Excess Nutrients and Air Quality ................................................................................................ 11
III. Unpacking the Federal and State Policy Regimes .......................................................................... 12
A. Surface and Groundwater Protection Policies ............................................................................... 12
1. U.S. Environmental Protection Agency: Clean Water Act ....................................................... 12
1. NPDES Permits .............................................................................................................................. 13
2. Waste Discharge Requirement Permits ....................................................................................... 14
B. Voluntary Regulatory Water Quality Improvement Programs .................................................... 15
1. Nonpoint Source Management Program .................................................................................... 15
2. California Dairy Quality Assurance Program ............................................................................. 15
C. Air Protection Policies ....................................................................................................................... 16
1. Senate Bill 700 ................................................................................................................................. 16
2. San Joaquin Valley Unified Air Pollution Control District (SJVACPD) Regulations: Rules
4550 and 4570.......................................................................................................................................... 17
IV. Community-Level Costs and Benefits of Dairy CAFOs .............................................................. 17
A. Perspective ........................................................................................................................................... 18
B. Community Benefits of Medium to Large Dairy CAFOs ........................................................ 18
1. Employment Opportunities .......................................................................................................... 18
C. Community Costs of Medium to Large Dairy CAFOs............................................................. 18
1. Environmental Injustice ................................................................................................................ 19
a. CAFO Community Demographics: GIS Analysis ..................................................................... 21
i. Data .................................................................................................................................................. 21
ii. Methodology ................................................................................................................................... 21
iii. Results .............................................................................................................................................. 21
iv. Discussion ........................................................................................................................................ 25
2. Production Externalities Undermine Quality of Life in Local Communities ........................ 25

California Dairy CAFOs
Page | 3
a. Economic Costs .............................................................................................................................. 26
i. Economic Development ............................................................................................................... 26
ii. Property Values ............................................................................................................................... 27
b. Public Health Costs ........................................................................................................................ 28
i. Respiratory Health .......................................................................................................................... 28
i. Occupational Risks ......................................................................................................................... 29
ii. Antibiotic Resistance ...................................................................................................................... 29
iii. Water Source Contamination ........................................................................................................ 30
iv. Mental Health .................................................................................................................................. 30
c. Quality of Life Costs ...................................................................................................................... 30
i. Outdoor Activity............................................................................................................................. 31
ii. Odor ................................................................................................................................................. 31
iii. Pests .................................................................................................................................................. 31
iv. Community Development ............................................................................................................. 31
D. Other Costs ..................................................................................................................................... 32
1. Environmental Degradation ......................................................................................................... 32
2. Animal Welfare ............................................................................................................................... 32
3. National and Global Economic Impacts .................................................................................... 32
E. Discussion ............................................................................................................................................ 33
F. Criteria for Policies Addressing Local Externalities ...................................................................... 33
1. Increase Local Economic Benefit ................................................................................................ 33
2. Improve Community Health ........................................................................................................ 33
3. Increase Local Quality of Life ...................................................................................................... 34
4. Increase Equity ............................................................................................................................... 34
V. Recommendations .............................................................................................................................. 34
A. San Joaquin Valley Policy Recommendations ............................................................................ 34
B. California Policy Recommendations ............................................................................................ 36
C. Federal Policy Recommendations ................................................................................................ 38
VI. Recommendations for Further Research ........................................................................................ 38
List of Acronyms ............................................................................................................................................. 40
Works Cited ..................................................................................................................................................... 41

California Dairy CAFOs
Page | 4
Appendix A: Statistical Analysis and Regression Results .......................................................................... 45
Appendix B: Additional Maps ....................................................................................................................... 48
List of Tables Table 1: Income and Poverty by County ..................................................................................................... 19
Table 2: County Education Attainment and Language Spoken ............................................................... 20
List of Figures Figure 1: Dairy Distribution in the San Joaquin Valley ............................................................................... 9
Figure 2: CAFO Nitrogen Cycle ................................................................................................................... 11
Figure 3: State and Federal CAFO Regulatory Regime ............................................................................. 13
Figure 4: Population Density and CAFO Distribution ............................................................................. 22
Figure 5: Percent Non-White Population and CAFO Distribution ........................................................ 23
Figure 6: Percent Households in Poverty and CAFO Distribution ........................................................ 24
Figure 7: Payroll v. Reactive Organic Gas and Nitrogen Oxide Emissions ........................................... 26
Figure 9: Northern SJV Population Density ............................................................................................... 48
Figure 10: Southern SJV Population Density .............................................................................................. 49
Figure 11: Northern SJV Non-White Population ...................................................................................... 50
Figure 12: Southern SJV Non-White Population ....................................................................................... 51
Figure 13: Northern SJV Poverty Rate ........................................................................................................ 52
Figure 14: Southern SJV Poverty Rate ......................................................................................................... 53

California Dairy CAFOs
Page | 5
I. Executive Summary
Since 1993, the State of California has led the United States in milk production. Sale of milk from
California comprises about 4.6 billion of California’s 30 billion dollars in agricultural sales, and the
total economic benefits of the dairy industry to the state of California were estimated to be more than
forty billion dollars in 2004. The San Joaquin Valley, located at the southern end of California’s great
Central Valley, is the leading dairy production region in California, and is home to almost 73% of
California cows.
Over the past fifty years, technological innovations, changes in the production system, and
specialization contributed to a total restructuring of the US dairy industry. As dairy production
industrialized, the number of farms decreased while herd sized increased. Production specialized,
and livestock waste began to be treated as waste instead of valuable fertilizer for crops.
The concentration of production created major waste management concerns for dairies producing
waste in excess of soil absorption capacities. Nutrients and inorganic materials concentrated in dairy
waste compromise surface water, ground water, and air quality.
Concerns about livestock waste management generated a complicated policy regime at the local,
state, and federal levels. However, major production externalities are still imposed upon the
communities in which Concentrated Animal Feeding Operations (CAFOs) are located, due in large
part to lack of resources, information, enforcement capability and political will on the part of local
and regional regulatory agencies.
Though the dairy industry is economically beneficial to the state economy, a local perspective of
costs and benefits reveals that CAFOs do more harm than good in their local communities. CAFO
communities in the San Joaquin Valley are disproportionately non-white and poor relative to the
state of California, raising concerns about environmental justice. Dairy production externalities
adversely affect local economies, public health, and quality of life. The following policy
recommendations, specific to local, state, and federal policies, are aimed at increasing local economic
benefit, improving community health, increasing local quality of life, and increasing equity.
San Joaquin Valley Policy Recommendations
• In order to enforce federal and state standards (and protect the health and quality of life of SJV
citizens), the Central Valley Regional Water Quality Control Board (CVRWQCB) and the San
Joaquin Valley Unified Air Pollution Control District (SJVUAPCD) should develop and
implement a strategy to collect and archive all relevant data about existing SJV dairy CAFOs and
associated manure storage structures, application fields, and production practices.
• In order to address resource and staff shortages, as well as enforce existing regulations,
CVRWQCB, SJVUAPCD, and local zoning/development boards should actively partner with
one another and with industry and related support organizations (such as CDQAP) to enforce
policies.
California Dairy CAFOs
Page | 6
• In order to stop additional growth of the dairy industry in a region already past its pollution
carrying capacity, institute a regional moratorium on new dairy CAFOs.
California Policy Recommendations
• To promote voluntary compliance with California water and air pollution regulations, set
achievable, understandable, and steady-state goals to reduce risk.
• To promote innovation, provide regulatory “safe harbor” for dairies that implement approved
technologies.
• To speed up research and development for dairy technology, fund research for new pollution
mitigation and monitoring technologies.
Federal Policy Recommendations
• In order to enforce the expanded federal CAFO regulations, develop and implement a strategy
for granting permits to CAFOs and enforcing discharge requirements. Should additional
resources be necessary to effectively enforce CAFO regulations, state regulatory agencies (such
as the CVRWQCB) should have access to such resources, contingent upon performance.

California Dairy CAFOs
Page | 7
II. Background: The Dairy Industry
Since 1993, California has led the United States in total dairy production.1 Once considered a non-
traditional dairy producing region (the Northeast is thought of as the traditional dairy producing
region in the US), California overtook Wisconsin in milk production thanks in large part to
abundant resources, most importantly land. The top-five milk producing counties in the State are in
the San Joaquin Valley, located at the southern end of California’s Central Valley. Tulare (26.5%),
Merced (14%), Stanislaus (10%), Kings (9%) and Kern (9%) counties together accounted for 65.8%
of total California milk production in 2006.2
The San Joaquin Valley is home to almost 73% of California’s cows.3 With 5.7 million acres of
available farmland, the San Joaquin Valley is recognized as one of the post productive agricultural
bioregions in the world.4 The Valley is also one of the most economically important regions in the
State of California.
A. Statewide Economic Benefits of the Dairy Industry
Sale of milk from California comprises about 4.6 billion of California’s 30 billion dollars in
agricultural sales.5 The economic benefit of the dairy industry in California was estimated to be as
high as 47.4 billion dollars in 2004, and the industry creates over 434,000 full time jobs in
California.6 Though this figure may be overestimated (the research was commissioned by the
California Milk Advisory Board), the California dairy industry is a major contributor to the economic
well-being of the state. Analysts project that milk production will increase 27% by 2015, and cheese
production will increase by 42%.7
The California Milk Advisory Board’s (CMAB) “It’s the Cheese” campaign and “Real California
Cheese” certification and branding program, launched more than ten years ago in the face of an on-
farm milk surplus, was recently adopted by the Columbia Business School as a case study for
effective industry promotion strategy.8 “As a result of the comprehensive programs put in place by
the CMAB in the 10 years since the initiative began, California has quickly developed a worldwide
1 California Dairy Research Foundation. California Dairy Facts. http://www.cdrf.org/content.asp?contentID=55. Accessed April 5, 2007. 2 California Department of Food and Agriculture. California Agricultural Resource Directory, 2006. January 2007. pp. 98-99. 3 Committee of Experts on Dairy Manure Management. Managing Dairy Manure in the Central Valley of California. Revised June 2005. University of California Division of Agriculture and Natural Resources. pp. 6. 4 Teitz, Michael, Charles Dietzel, and William Fulton. Urban Development Futures in the San Joaquin Valley. 2005. Public Policy Institute of California. pp. 27. 5 Committee of Experts. June 2005. pp. 6. 6 Dryer, Jerry. The Economic Impact of the California Dairy Business. September 2005. California Milk Advisory Board. pp. 2. (The author uses the macroeconomic principle of multipliers to estimate the total impact of each additional dollar of milk produced in California upon the economy, household earnings and employment). 7 Dryer. 2005. pp. 3. 8 California Milk Advisory Board. How California Created the Dairy Industry of the Future. 2005.

California Dairy CAFOs
Page | 8
reputation as a respected producer of many specialty, artisan and farmstead cheese types.”9
California ‘cheese tours,’ akin to traditional wine tasting tours, are providing a boon to the tourism
industry.
B. Structural Change: Technology, Systems Transformation, and Specialization
Over the past fifty years, technological innovations, changes in the production system, and
specialization contributed to a total restructuring of the US dairy industry.10 Technologies such as
mechanical milking machines, waste handling systems, and pharmaceuticals transformed the industry
from labor to capital intensive and increased efficiency.
Along with technological innovations came important changes to dairy production processes. The
electrification of rural areas (allowing for refrigeration and sanitary mass storage vats) and redesigned
milking parlors and free-stall or loafing corrals added to efficiency gains. One of the most important
changes to the milk production system was a shift from pasture-based feeding to confinement
feeding systems using imported feed. Instead of grazing cows on open pasture, dairy cows are now
most commonly fed in structures known as “Animal Feeding Operations (AFOs),” or “Confined
Animal Feeding Operations (CAFOs),” depending on the size of the herd. Corn and grain based
rations formulated precisely to the nutritional and milk production needs of cows both reduced
labor needs for feeding and increased milk production per cow by optimizing nutrient intake.11
In addition to technological advances and production structure changes, farm-level specialization is
now common in the dairy business. The total number of dairy farms decreased, geographic
distribution decreased, and average herd number increased dramatically. As the structure of the retail
food market changed and demand for milk increased, some diversified farms with milk cows as a
secondary activity had incentive to specialize in milk production to exploit economies of scale.
By increasing productivity, producers decreased cost per unit of production. In a highly competitive
commodity market with little product differentiation, low production costs and efficiency became
the most important considerations in production. According to the US Census of Agriculture, in
1940 over 76% of farms surveyed had milk cows. By 1997, that number dropped to just 6.1%. In
this same period of time, total milk production increased three-fold.12
Though milk production industrialized like many other agricultural production practices, dairy
production is unique in that most farms are still owned by families or family partnerships.
Researchers believe that availability of resources (such as land) was an important driving force in the
9 Greenwald, Michelle. Real California Cheese: It’s the Cheese. Columbia Business School. 2005. pp. 11. 10 Blayney, Don P. The Changing Landscape of U.S. Milk Production. United States Department of Agriculture Statistical Bulletin 978. June 2002. pp. v. 11 Robinson, Peter H. Interview. Cooperative Extension Specialist, Department of Animal Science, University of California, Davis, via telephone, February 27, 2007. 12 Blayney. 2002. pp. 2-6.

California Dairy CAFOs
Page | 9
Figure 1: Dairy Distribution in the San Joaquin Valley13
13 Data Source: Central Valley Regional Water Quality Control Board, Report of Waste Discharge Applications.
California Dairy CAFOs
Page | 10
growth of California dairy. Climate, family ties, and social networks are also believed to be an
important force in the geographic consolidation of California’s dairies.14
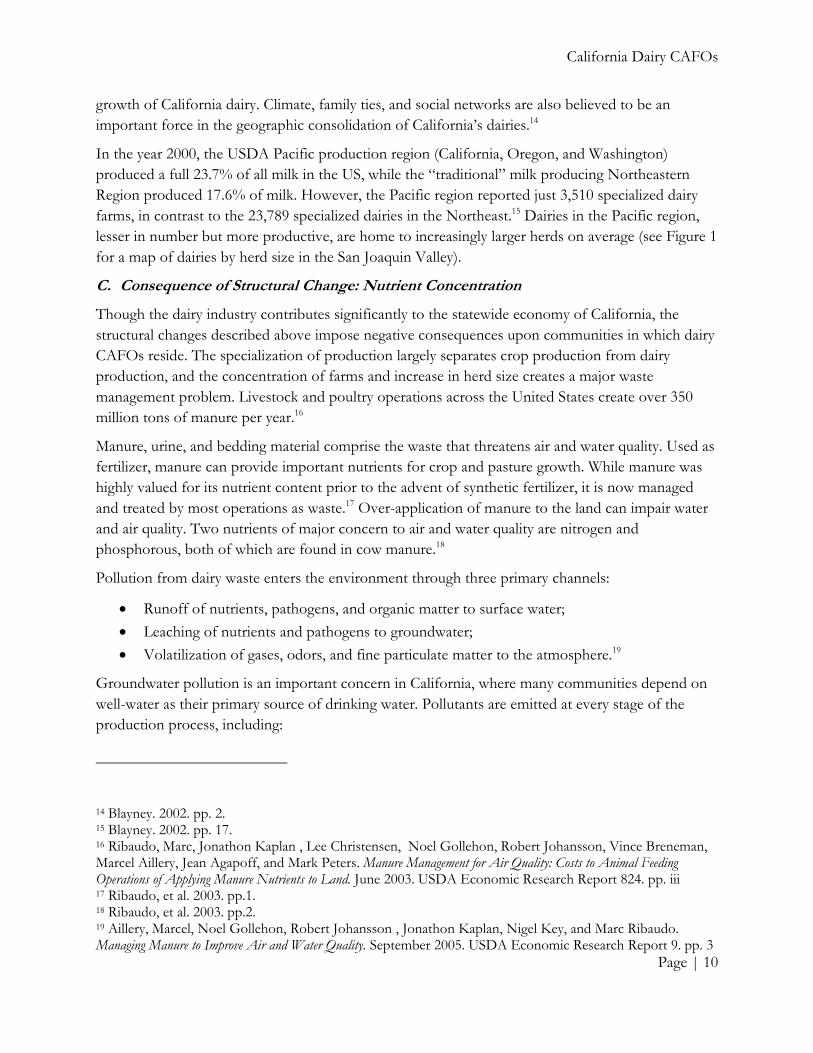
In the year 2000, the USDA Pacific production region (California, Oregon, and Washington)
produced a full 23.7% of all milk in the US, while the “traditional” milk producing Northeastern
Region produced 17.6% of milk. However, the Pacific region reported just 3,510 specialized dairy
farms, in contrast to the 23,789 specialized dairies in the Northeast.15 Dairies in the Pacific region,
lesser in number but more productive, are home to increasingly larger herds on average (see Figure 1
for a map of dairies by herd size in the San Joaquin Valley).
C. Consequence of Structural Change: Nutrient Concentration
Though the dairy industry contributes significantly to the statewide economy of California, the
structural changes described above impose negative consequences upon communities in which dairy
CAFOs reside. The specialization of production largely separates crop production from dairy
production, and the concentration of farms and increase in herd size creates a major waste
management problem. Livestock and poultry operations across the United States create over 350
million tons of manure per year.16
Manure, urine, and bedding material comprise the waste that threatens air and water quality. Used as
fertilizer, manure can provide important nutrients for crop and pasture growth. While manure was
highly valued for its nutrient content prior to the advent of synthetic fertilizer, it is now managed
and treated by most operations as waste.17 Over-application of manure to the land can impair water
and air quality. Two nutrients of major concern to air and water quality are nitrogen and
phosphorous, both of which are found in cow manure.18
Pollution from dairy waste enters the environment through three primary channels:
• Runoff of nutrients, pathogens, and organic matter to surface water;
• Leaching of nutrients and pathogens to groundwater;
• Volatilization of gases, odors, and fine particulate matter to the atmosphere.19
Groundwater pollution is an important concern in California, where many communities depend on
well-water as their primary source of drinking water. Pollutants are emitted at every stage of the
production process, including:
14 Blayney. 2002. pp. 2. 15 Blayney. 2002. pp. 17. 16 Ribaudo, Marc, Jonathon Kaplan , Lee Christensen, Noel Gollehon, Robert Johansson, Vince Breneman, Marcel Aillery, Jean Agapoff, and Mark Peters. Manure Management for Air Quality: Costs to Animal Feeding Operations of Applying Manure Nutrients to Land. June 2003. USDA Economic Research Report 824. pp. iii 17 Ribaudo, et al. 2003. pp.1. 18 Ribaudo, et al. 2003. pp.2. 19 Aillery, Marcel, Noel Gollehon, Robert Johansson , Jonathon Kaplan, Nigel Key, and Marc Ribaudo. Managing Manure to Improve Air and Water Quality. September 2005. USDA Economic Research Report 9. pp. 3

• Structures where cows are confined;
• Structures where manure is stored, such as tanks, lagoons, and ponds;
• Land to which manure is applied.
1. Excess Nutrients and Water Quality
Nitrate, salts, microbes, antibiotic metabolites, and organic compounds are present in dairy waste
and threaten ground and surface water quality.
manure or wastewater is applied above agronomic rates, nitrates and nitrites may leach beyond the
root zone (contaminating ground water) and surface runoff of solution or sediment may
contaminate surface water. Excess nutrients in surface water may cause eutrophication of the water
(algae blooms), impairing aquatic ecosystems.
application impairs subsequent plant growth and increases the salinity of ground and surface water
for municipal and irrigation use.
2. Excess Nutrients and Air Quality
Figure 2: CAFO Nitrogen Cycle22
20 Aillery, et al. 2005. pp. 3. 21 Committee of Experts. June 2005. pp. 12.22 Data Source: Aillery, et al. 2005.
Crops used for
feed
Leaching
California Dairy CAFOs
Structures where cows are confined;
Structures where manure is stored, such as tanks, lagoons, and ponds;
Land to which manure is applied.20
Excess Nutrients and Water Quality
Nitrate, salts, microbes, antibiotic metabolites, and organic compounds are present in dairy waste
and threaten ground and surface water quality.21 Though nitrogen is a powerful fertilizer, when
lied above agronomic rates, nitrates and nitrites may leach beyond the
root zone (contaminating ground water) and surface runoff of solution or sediment may
Excess nutrients in surface water may cause eutrophication of the water
(algae blooms), impairing aquatic ecosystems. Excess salt loads from manure and wastewater
application impairs subsequent plant growth and increases the salinity of ground and surface water
Excess Nutrients and Air Quality
Committee of Experts. June 2005. pp. 12.
Loafing house
ventilation
Manure
storage
structure
Soil
Application
Crops used for
Runoff
Nitrogen gases
Nitrogen gases
California Dairy CAFOs
Page | 11
Nitrate, salts, microbes, antibiotic metabolites, and organic compounds are present in dairy waste
Though nitrogen is a powerful fertilizer, when
lied above agronomic rates, nitrates and nitrites may leach beyond the
root zone (contaminating ground water) and surface runoff of solution or sediment may
Excess nutrients in surface water may cause eutrophication of the water
Excess salt loads from manure and wastewater
application impairs subsequent plant growth and increases the salinity of ground and surface water
Nitrogen gases

California Dairy CAFOs
Page | 12
The San Joaquin Valley Air Basin (SJVAB) is a federal non-attainment area for United States
Environmental Protection Agency (U.S. EPA) ozone and particulate matter (PM10) standards.
Volatile organic compounds (VOCs) and nitrogen oxides (NOx), both precursors to ozone, are
emitted from dairies, though the emissions rates have not been studied conclusively. The natural
digestive processes in dairy cows generate methane and other VOCs (volatile fatty acids, ketones,
aldehydes, alcohols).23 In addition, methane and VOCs are emitted from manure storage and holding
structures as waste decomposes.
Atmospheric losses of nitrogen begin as soon as urine and feces mix upon excretion, and continue
throughout the handling and storage process (as depicted in Figure 2).24 Ammonia and other
nitrogen gases volatilize from free-stall or loafing houses, holding structures, soil surface, and plant
surface. Ammonia is a major cause of the odors associated with CAFOs, and it can react with NOx
to form ammonium nitrate, which is classified by the U.S. EPA as fine particulate matter.
Environmental concerns about livestock waste and odor increased in recent years. Several high
profile waste spills, primarily in the Southeast, led to lawsuits.
III. Unpacking the Federal and State Policy Regimes
The CAFO policy regime is comprised of overlapping state and federal regulations, standards, and
permitting processes. A number of different local, state, and federal agencies administer the policies
(for a schematic view of the policy regime, please see Figure 3).
A. Surface and Groundwater Protection Policies
Runoff to surface water is regulated at the federal level by the United States Environmental
Protection Agency. Groundwater protection is of particular concern in the State of California, where
many communities rely on well-water. Groundwater regulation is primarily legislated at the state
level.
1. U.S. Environmental Protection Agency: Clean Water Act
The U.S. EPA regulates livestock waste from certain types of Animal Feeding Operations through
the Federal Clean Water Act (CWA).25 The CWA primarily concerns surface water contamination
from point sources26 of pollution. The national CAFO rule was expanded in 2003 and again in 2005
23Committee of Experts. June 2005. pp 12. 24 Committee of Experts. June 2005. pp. 28, 40. 25 Environmental Protection Agency. NPDES Permit Regulation and Effluent Limitation Guidelines and Standards for
Concentrated Animal Feeding Operations; Final Rule.40 CFR Parts 9, 122, 123, and 412. 26 CAFOs are defined by the Clean Water Act as point sources for the purposes of the National Pollutant Discharge Elimination System (NPDES) program. The rule also applies to States and Tribes with authorized NPDES Programs.

California Dairy CAFOs
Page | 13
as part of a legal challenge to existing standards.27 As a result of the new rules, an estimated 15,500
AFOs are subject to federal CAFO regulations.
Figure 3: State and Federal CAFO Regulatory Regime
U.S. EPA standards define a medium dairy CAFO as an operation with 200 or more dairy cows that
confines animals for forty-five or more days in a twelve-month period and has no grass or other
vegetation in the confinement area during the normal growing season.28 A large CAFO has 600 or
more dairy cows and meets the same criteria. Operations defined as CAFOs must apply for a
National Pollutant Discharge Elimination System (NPDES) permit through the U.S. EPA, or the
state permitting authority, if that state has been authorized to assign permits. The State of California
issues NPDES permits through its regional water boards.
1. NPDES Permits
27 Waterkeeper Alliance et al. v. EPA. 399 F.3d 486. This 2005 ruling clarifies the term “agricultural storm water” and requires a publicly available nutrient management plan. 28 NPDES Permitting Guidelines. 2003. pp. 7176.

California Dairy CAFOs
Page | 14
The Central Valley Regional Water Control Board (CVRWQCB) oversees the NPDES permitting
process for the San Joaquin Valley under U.S. EPA authorization. NPDES permits, pursuant to the
U.S. EPA’s CAFO rule, specify the terms under which a facility may discharge to surface waters of
the United States. Part of the 2003 amendments to the CWA require CAFO operators to follow an
approved Nutrient Management Plan (NMP) when applying manure to crop land. NPDES permits
cover facilities and associated cropland. However, if manure is applied in accordance with an
approved NMP, storm water runoff from crop land is not regulated by the permit. As a result, the
formulation and approval of NMPs is increasingly important to the protection of surface waters, as
CAFOs that discharge during storm events are free of responsibility for the waste if they can prove
compliance with an approved NMP.
2. Waste Discharge Requirement Permits
NPDES permits in California are assigned in conjunction with California Water Code (Section
13260) required Reports of Waste Discharges (ROWD). ROWDs are applications for Waste
Discharge Requirement (WDR) permits required by any facility that discharges or proposes to
discharge to land or groundwater from any source, or in a diffuse manner.29
Dischargers that require WDR permits must provide general information to CVRWQCB, including,
but not limited to:
• Average daily volume of facility wastewater and volume or weight of manure;
• Total animal population at the facility and types of animals;
• Animal capacity of the facility;
• Location and size of use or disposal fields and retention ponds, including animal capacity.30
In addition, any material changes to the operation must be reported to CVRWQCB, animals must
be prevented from entering any surface water within the CAFO, and local administrators can
monitor changes to dairies by requiring construction permits. Storm water runoff from associated
crop land is regulated under WDR permits, which do not allow any discharge that could adversely
affect water quality.31 Additional standards and regulations for dairy permits include:
• State appraisal of waste structure sites before development;
• Compliance with specific design standards;
• Lagoons lined with soil comprised of ≥ 10 % clay, and ≤ 10% gravel;
29 Office of Wastewater Management, U.S. Environmental Protection Agency. State Compendium, Programs and Regulatory Activities Related to Animal Feeding Operations. pp. 42. 30 Office of Wastewater Management. May 2002. pp. 42. 31 Office of Wastewater Management. May 2002. pp. 44.

California Dairy CAFOs
Page | 15
• Existing waste storage structures must contain wastewater and precipitation up to and
including a 25-year, 24-hour storm.32 New structures must contain waste water and
precipitation from a 100-year storm;
• Land application restricted to “reasonable rates” that do not cause surface runoff and do
minimize leaching into groundwater.33
CVRWQCB’s newest WDR General Order for livestock has not yet been finalized, but a tentative
plan was released on March 27, 2007. Most dairies in the San Joaquin Valley must apply for a WDR
permit, and facilities meeting the federal definition of medium and large CAFOs must jointly apply
for an NPDES permit in order to legally operate. Legal discharge levels for NPDES and WDR
permits have traditionally been set at zero for agricultural operations.
B. Voluntary Regulatory Water Quality Improvement Programs
1. Nonpoint Source Management Program
NPDES and WDR permitting programs reflect that most pollution from dairy waste is regulated as
a point source. However, the State Water Resources Control Board (SWRCB), California Coastal
Commission (CCC), and Regional Water Quality Control Boards (RWQCB) developed a long term
plan for managing non-point source (NPS) agricultural pollution to protect ground and surface
water in compliance with CWA Section 319.34
Section 319 provides grant funding for NPS improvement programs and AFO assessment,
contingent upon a state plan for managing NPS pollution. California’s management plan includes
education and outreach efforts, as well as commitments to inspection and complaint-response. In
addition, the State is in the process of developing Total Maximum Daily Load (TMDL) standards
with which to enforce NPS standards.
2. California Dairy Quality Assurance Program
The California Dairy Quality Assurance Program (CDQAP) is a partnership between California state
and local agencies, the academic community, and the dairy industry. CDQAP’s mission is to help all
dairies achieve compliance with federal, state, and local regulations.
CDQAP provides free services to California dairies including:
• Environmental stewardship, food safety, and animal health and welfare short-courses;
• Environmental stewardship farm management plans;
• Onsite evaluations by a third party;
32 Refers to the most intense 24-hour storm in the past 25 years. 33 Office of Wastewater Management. May 2002. pp. 44. 34 California State Water Resources Control Board. Non Point Source Management Plan, Section II Five Year
Implementation Plan. 2003. pp. 2.

California Dairy CAFOs
Page | 16
• Recertification;
• Quality control of the evaluation process.
Dairies can be certified in environmental stewardship by CDQAP, but the certification has no
regulatory weight other than the guarantee that a facility is in compliance with all legal regulations,
should it be inspected. In other words, certification offers no official status, and therefore no
guarantee against inspection and regulation.
C. Air Protection Policies
CWA amendments and NMP requirements were established in the interest of protecting surface and
ground water. However, a logical response by farmers constrained by an NMP is to reduce the
nutrient content of manure by allowing gases to volatilize to the atmosphere from uncovered
lagoons or applying manure to the land without incorporating it into the soil. Such practices
compromise air quality, specifically in the form of nitrogen-derived ammonia emissions, volatile
organic compounds (VOCs) and Particulate Matter.35 Each of the eight counties in the San Joaquin
Valley is classified as a “severe” or “serious” non-attainment area for ozone and PM10.36
California recently ramped up its efforts to create an air pollution permitting system for CAFOs,
especially in federal non-attainment areas for U.S. EPA ambient air quality standards. Federal laws
require permits for agricultural sources of air pollution. Until 2003, California granted air permit
exemptions to agricultural sources of pollution, and faced substantial federal fines if it did not
remove the exemption. In response, the state legislature passed Senate Bill 700 in 2003.
1. Senate Bill 700
On September 22, 2003 California Governor Gray Davis signed into law Senate Bill (SB) 700, a bill
amending air pollution control requirements to include restrictions for agricultural sources of air
pollution.37 Prior to SB 700, agricultural operations were exempted from air pollution permits. SB
700 includes several important guidelines:
1. Defines “agricultural source” under state law;
2. Removes the restriction from state law that prevented regional air districts from requiring
permits for agricultural operations;
3. Creates specific permit and exemption requirements for agricultural sources;
4. Requires emission regulations for areas not meeting the National Ambient Air Quality
standards for PM10;
35 Aillery et al. September 2005. pp. iii. 36 California Air Pollution Control Officers Association (CAPCOA), White Paper on SB 700. April 2004. pp. 23. 37 CAPCOA, April 2004. pp. 3.
California Dairy CAFOs
Page | 17
5. Requires permits and emissions mitigation for AFOs defined as “large” by the California Air
Resources Board research on contribution to total emissions.38
The California Air Resources Board (CARB) was charged with the task of defining large confined
animal facilities for the purpose of regulation.
CARB released the following regulatory definition of a large CAFO:
a) In any area designated as a federal ozone nonattainment area as of January 1, 2004, any
confined animal facility that maintains on any one day: 1,000 or more milk-producing dairy
cows;
b) In any area other than an area described in subsection (a) above, any confined animal facility
that maintains on any one day: 2,000 or more milk-producing dairy cows.39
2. San Joaquin Valley Unified Air Pollution Control District (SJVACPD) Regulations: Rules
4550 and 4570
Granted the ability to regulate agricultural sources of air pollution by SB 700, SJVAPCD released its
implementation plan for SB 700 on May 20, 2004. SJVACPD passed Rules 4550 and 4570, requiring
the adoption of Conservation Management Practices (CMPs) to reduce fugitive dust emissions.
Dairies with more than 500 mature dairy cows or 100 contiguous acres are required to adopt CMPs.
Rule 4570 is aimed at reducing the emissions of VOCs from dairies. Adopted in June 2006, the rule
requires any dairy with more than 100 cows to apply for a permit and adopt an approved emissions
mitigation plan.40 In addition, SJVACPD is currently developing a set of required “Best Available
Control Technologies” (BACTs) for use in its dairy permitting process.
Large confined animal operation permit applications were due on January 1, 2007. Permits are to be
issued within six months. Once complete, the board will require dairies meeting the definition of a
large CAFO to adopt an appropriate BACT.41 The facility will have one year to implement the
technology.
IV. Community-Level Costs and Benefits of Dairy CAFOs
There are over 1200 dairies in the San Joaquin Valley that together house over one million dairy
cows.42 The concentration of dairies and the resulting waste management challenge have serious
consequences for the communities in which dairies locate. An examination of the benefits and costs
38 CAPCOA. April 2004. pp. 4. 39 Final Regulation Order for the Definition of Large Confined Animal Facility. California Code of Regulations. Title 17. Division 1. Chapter 1. Subchapter 2.7. 40 San Joaquin Valley Unified Air Pollution Control District. Rule 4570. Adopted June 2005. 41 Dairy Permitting Advisory Group. Recommendations to the San Joaquin Valley Air Pollution Control Officer Regarding Best Available Control Technologies for Dairies in the San Joaquin Valley. January 31, 2006. pp. 7. 42 Data Source: Central Valley Regional Water Control Board
California Dairy CAFOs
Page | 18
at the community level is essential to understanding the local social and economic effects of dairy
CAFOs.
A. Perspective
The focus of this paper is on the benefits and costs of dairy CAFOs from the local perspective.
From this perspective, the benefits and costs that accrue to the citizens of the communities in which
CAFOs locate are considered. Wider economic benefits to the California economy, as well as wider
economic and environmental costs, are not considered in detail.
B. Community Benefits of Medium to Large Dairy CAFOs
As discussed above, the highly productive California dairy industry is hugely beneficial to
California’s agricultural economy. However, very few benefits from the dairy industry accrue directly
to the citizens of the communities in which dairy CAFOs locate. There are few documented local
benefits of dairy CAFOs beyond the employment opportunities provided by medium to large
facilities.
1. Employment Opportunities
Dairies in the SJV provide employment opportunities for local residents, both direct and indirect.
Agricultural employment is the leading employment category in Fresno and Madera counties.
However, as capital intensive farms, the employment benefits may be limited. A 1998 swine-CAFO
study estimated that three to four jobs were created for each 1000 sows in the operation.43
Economists estimated that each farm job adds another job to the local community, and $1 of farm
income adds $1 of income to the local community.
However, the impact of these multipliers will depend on how laborers are hired- locally, or through
contractors (who often commute) -- and on what proportion of inputs are purchased within the
community.44 Evidence suggests that the majority of inputs, such as corn and grain-based feed,
antibiotics, and equipment, are purchased from other regions, such as the Midwestern Corn Belt and
Canada.45 Because much of the revenue from dairy production is reinvested into communities
outside of the San Joaquin Valley, the one-to-one multiplier for farm income and local income is
likely to be less in this area.
C. Community Costs of Medium to Large Dairy CAFOs
Despite the economic importance of the San Joaquin Valley, communities in the region are relatively
underprivileged relative to the rest of California. Communities with large stocks of political capital
are poor locations for CAFOs, because the externalities associated with dairy production are
43 Weida, William. Considering the Rationales for Factory Farming. March 29, 2004. Presented at: Environmental Health Impacts of CAFOs: Anticipating Hazards, Searching for Solutions. Iowa City, IA. 44 Sporleder, T. Ohio Food Income Enhancement Program. 1997. Agricultural, Environmental, and Development Economics Department. Ohio State University. 45 Interview with Deanne Meyer. April 2, 2007.

California Dairy CAFOs
Page | 19
unattractive to local groups. More affluent communities resist local establishment of CAFOs when
possible, making it more expensive for producers to establish CAFOs nearby. Therefore, CAFOs
often locate in communities with the least political influence.
1. Environmental Injustice
According to the U.S. EPA, environmental justice will be achieved when “everyone enjoys the same
degree of protection from environmental and health hazards and equal access to the decision-
making process to have a healthy environment in which to live, learn, and work.”46 Though only
about 9% of the state’s population lives in the San Joaquin Valley (SJV), the region accounts for
approximately 15% of the state’s EPA-regulated criteria pollutants.47 The pollution present in the
San Joaquin Valley is especially troubling when one considers the demographic makeup of
communities in the SJV relative to the state of California. Persons in the SJV are likely to have less
political capital and less access to restitution from costs imposed by dairy CAFOs.
Table 1: Income and Poverty by County
County Income Per Capita 1999 Percent People Below Poverty Level 1999
Fresno $15,495 22.9
Kern $15,760 20.8
Kings $15,848 19.5
Madera $14,682 21.4
Merced $14,257 21.7
San Joaquin $17,365 17.7
Stanislaus $16,913 16.0
Tulare $14,006 23.9
California $22,711 14.2
Source: Perez and Curtis, 2003 (same applies to Table 2)
The San Joaquin Valley is one of the least affluent regions in the State of California. While the
average poverty rate in California is 14.2%, the average rate in the eight counties of the San Joaquin
46 U.S. EPA. Compliance Website. April 14, 2007. http://www.epa.gov/compliance/environmentaljustice 47 Perez, Miguel, and Kathleen Curtis. Healthy People 2010: A 2003 profile of health status in the Central San Joaquin
Valley. 2003. California State University, Fresno. pp. 8.

California Dairy CAFOs
Page | 20
Valley is 20.49%.48 According to the 2000 US Census, thirteen of the nation’s 101 poorest
communities are located in the SJV. The unemployment rate in the SJV is 12.9%, compared to the
3-4% rates reported for the U.S., and the 5.2% average for the state of California.49 Average income
per capita and poverty rates for the eight counties of the SJV and the state of California are listed in
Table 1.
In addition to below average economic status, citizens of the SJV are on average less educated than
other Californians. They are also more likely to speak a language other than English in the home--
indicating below-average proficiency in language. Table 2 lists educational attainment rates and
language statistics for the eight counties of the SJV and the state of California.
Table 2: County Education Attainment and Language Spoken
County Percentage People Age 25 and up with a High School
Diploma
Percentage People Age 25 and up with a Bachelor
Degree
Language Other than English Spoken in
Home
Fresno 67.5 17.5 40.8
Kern 68.5 13.5 33.4
Kings 68.8 10.4 36.7
Madera 65.4 12.0 37.0
Merced 63.8 11.0 45.2
San Joaquin
71.2 14.5 33.7
Stanislaus 70.4 14.1 32.4
Tulare 61.7 11.5 43.8
California 76.8 26.6 24.9
The San Joaquin Valley is home to a disproportionate amount of California’s pollution, while
simultaneously suffering from higher-than-average poverty rates and lower than average per-capita
income, education, and English proficiency. These statistics reflect that those affected by
externalities from dairy production in the San Joaquin Valley are more often the politically and
socially disenfranchised. Environmental justice in the San Joaquin Valley has not been achieved.
48 Perez and Curtis. 2003. pp. 2. 49 Perez and Curtis. 2003. pp. 11.

California Dairy CAFOs
Page | 21
a. CAFO Community Demographics: GIS Analysis
In order to examine environmental justice and equity in the San Joaquin Valley, the relationship
between CAFO location and demographic characteristics was analyzed. Geographic Information
System was used to create maps overlaying CAFOs by herd size and various demographic variables.
The analysis compares the demographic characteristics of block groups with varying numbers of
dairy cows.
i. Data
Data on dairy geographic location and herd size was provided by CVRWQCB.50 The information
was compiled from ROWD applications for WDR permits submitted by dairy operators. The
poverty, race, and population density data is from the 2000 Census, Summary File 3. Data for the
eight counties in the SJV are divided by census block group. Block groups are the smallest area for
which relevant demographic data is available.
ii. Methodology
Using Geographic Information System (GIS) software, the dairy location and herd size data was
overlaid with Census demographic data on population density, households in poverty, and non-
white population percentages. Facility and animal counts per block group were calculated using
spatial analysis tools in GIS. A multiple regression analysis was run including all block groups, and
another including only block groups with greater than zero cows (201 of the 2285 block groups in
the SJV were home to dairy cows). Number of cows per block group was the dependent variable
and population density, household poverty rate, and non-white population rates were the
explanatory variables. The regression was specified in simple multivariate regression form for both
cases, and using the natural log of cows in each block group in a Poisson regression for block
groups with >0 dairy cows.
It was also of interest to examine the influence of total number of cows, poverty, and race upon
population density. A fourth regression was specified using the natural log of population density as
the dependent variable and the variables mentioned above as explanatory variables. Because
population density influences CAFO location, and vice versa, this regression allows for an
examination of the bias this may cause in the original model specification.
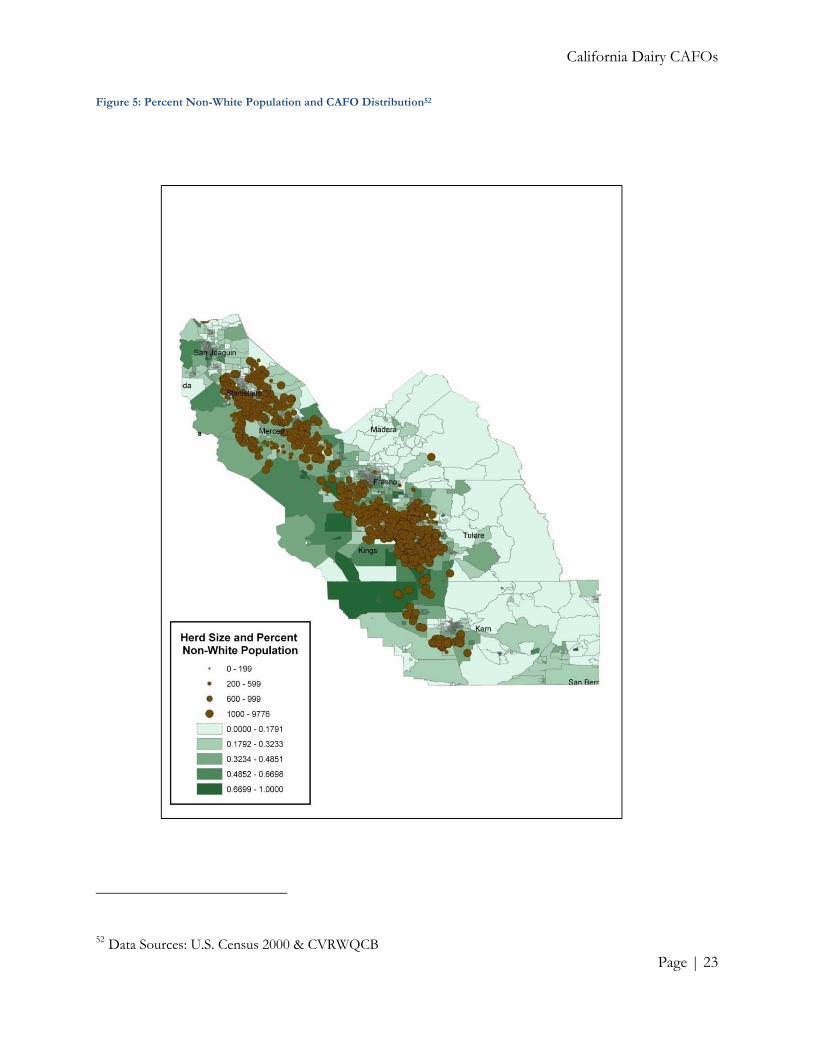
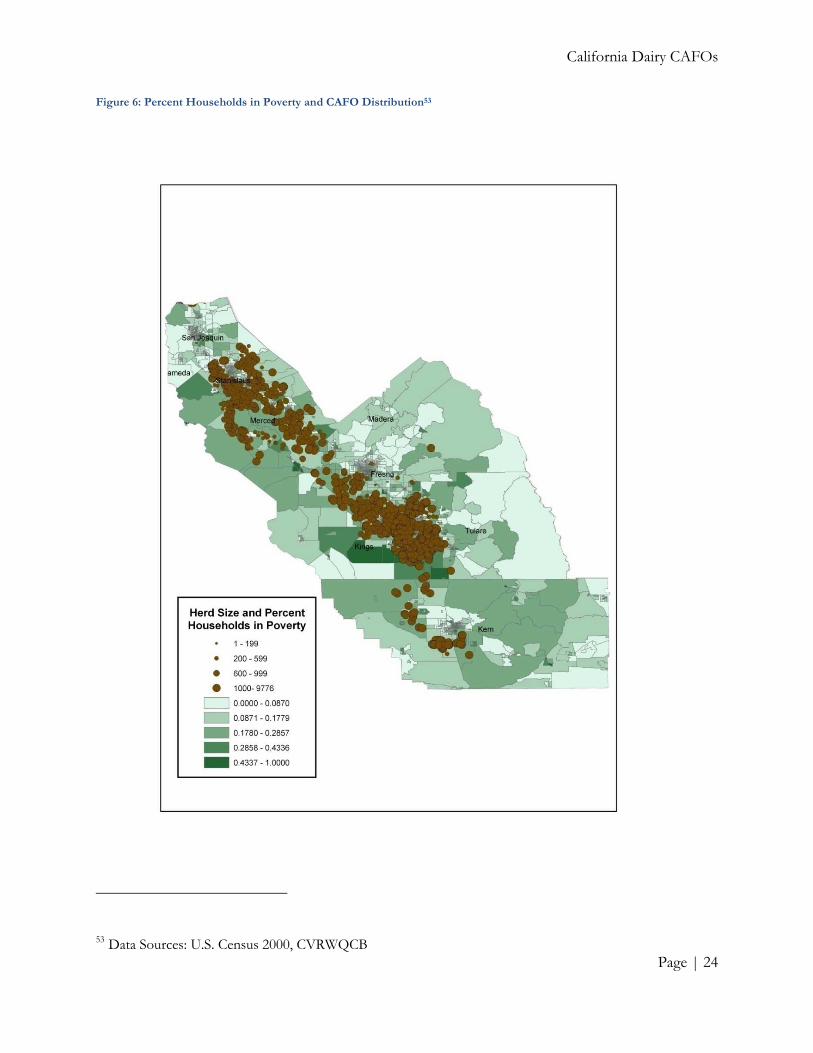
iii. Results
The results of this analysis were more visually striking than statistically conclusive (see Figures 4-6).
Population density in the San Joaquin Valley is extremely sparse, with populations concentrated in
urban centers such as Fresno and Modesto. The results of the regression may be driven by the lack
of cows in the most highly populated areas. The distribution of non-white population and poverty
rate appears to follow the distribution of CAFOs, though no conclusions can be drawn directly from
50 Thanks to CVRWQCB contacts Steven Hulbert (Fresno Office) and Charlene Herbst (Sacramento Office) for providing ROWD data.

California Dairy CAFOs
Page | 22
Figure 4: Population Density and CAFO Distribution51
51 Data Sources: U.S. Census 2000 & CVRWQCB
California Dairy CAFOs
Page | 23
Figure 5: Percent Non-White Population and CAFO Distribution52
52 Data Sources: U.S. Census 2000 & CVRWQCB
California Dairy CAFOs
Page | 24
Figure 6: Percent Households in Poverty and CAFO Distribution53
53 Data Sources: U.S. Census 2000, CVRWQCB
California Dairy CAFOs
Page | 25
visual appraisal. In each model specified with total cows as the dependent variable, population
density was the only statistically significant explanatory variable (for regression outputs, please see
Appendix A). The coefficient on poverty rate approached significance in the simple multivariate
model including all block groups. In the regression on the natural log of population density, the
coefficients on both poverty rate and total number of cows were negative and statistically significant.
Magnified maps of the Northern and Southern ends of the San Joaquin Valley are included in
Appendix B.
iv. Discussion
The demographic characteristics of the San Joaquin Valley relative to the rest of the State may
explain some of the results seen in this analysis. The region is home to more poverty and minority
communities on average than the rest of the state. Therefore, comparing block groups within the
county provides a limited amount of variation within the data analyzed.
In addition, it is hard to determine the direction of the relationship between CAFO location and
population density, poverty, and minority population. Rural communities are traditionally home to
more persistent poverty than metropolitan areas. Land is cheaper and more abundant in rural,
sparsely populated areas, making these regions attractive locations for large animal feeding
operations, which require large parcels of land. While the lack of political capital (due to low socio-
economic status) among the citizens of these communities may also make the region attractive, it
would be difficult to parse out the two effects. Regressing our explanatory variables upon the natural
log of population density is suggestive of the theory that poverty, population density, and CAFO
location simultaneously influence one another.
It may be that the specific within-valley location of dairy CAFOs is less important than I assumed in
designing this analysis. When one considers the non-excludable nature of runoff and emissions from
dairy CAFOs in an arid valley setting such as the SJV, within-valley block group comparisons may
be unimportant. If everyone living in the valley is affected by production externalities from CAFOs
(in the form of contaminated ground and surface water, ambient air quality, and quality of life
effects) it may be the case that a statewide comparison is essential to an accurate spatial analysis. But
given that geographical and historical factors render most of the state inappropriate for large dairy
CAFOs, this analysis would be fraught with limitations.
Given the time and resources available, a statewide comparison was not possible. However, a
detailed analysis of the entire state, including more variables omitted from this analysis, would be
valuable to understanding the placement patterns of dairy CAFOs seen in these maps, as well the
social and economic effects of CAFOs on local communities.
2. Production Externalities Undermine Quality of Life in Local Communities
If dairy production adversely affects CAFO communities without proper compensation, the dairy
industry can be said to impose externalities upon SJV residents. CAFO policies fail to regulate these
externalities due to a lack of information and a lack of resources. If the total social cost of milk
production is not internalized by dairy producers, production will be maintained at a level above the
social optimum (where social benefit is equal to social cost). As discussed above, the burden of this

externality would fall upon a population that is already somewhat disenfranchised.
of the costs of production borne by CAFO communities indicates that dai
consider total social costs in management decisions.
a. Economic Costs
i. Economic Development
Research indicates that concentration and industrialization of agricultural production removes more
money from the community in which a farm is lo
area.54 A comparative study of Central Valley communities dominated by one industrial farm versus
communities with multiple locally owned and operated farms showed that the communities with
smaller farms had better social and civic institutions, more even distribution of wealth, and more
Figure 7: Payroll v. Reactive Organic Gas and Nitrogen Oxide Emissions
local retail purchases.56 A similar study showed that the concentration of agriculture was associated
with local and regional economic and social declines.
54 Donham, Kelley, Steven Wing, David Osterberg, Jan Flora, Carol Hodne, Kendall Thu, and Peter Thorne. Community Health and Socioeconomic Issues Surrounding Concentrated Animal Feeding Operations.Environmental Health Perspectives. 115(2). pp. 317.55 California Partnership for the San Joaquin Valley. April 15, 2007. http://www.bth.ca.gov/capartnership/pdf/AirQualityandEnvironmentalProtection.pdf
0
2
4
6
8
10
12
14
1.59
6.94
% SJV Payroll
California Dairy CAFOs
upon a population that is already somewhat disenfranchised. An examination
of the costs of production borne by CAFO communities indicates that dairy producers fail to
consider total social costs in management decisions.
Research indicates that concentration and industrialization of agricultural production removes more
money from the community in which a farm is located than when smaller farms operate in the
A comparative study of Central Valley communities dominated by one industrial farm versus
communities with multiple locally owned and operated farms showed that the communities with
er social and civic institutions, more even distribution of wealth, and more
: Payroll v. Reactive Organic Gas and Nitrogen Oxide Emissions55
A similar study showed that the concentration of agriculture was associated
with local and regional economic and social declines.57
Donham, Kelley, Steven Wing, David Osterberg, Jan Flora, Carol Hodne, Kendall Thu, and Peter Thorne. Community Health and Socioeconomic Issues Surrounding Concentrated Animal Feeding Operations. February 2007.
rspectives. 115(2). pp. 317. California Partnership for the San Joaquin Valley. Overview Report for the Air Quality Work Group.
http://www.bth.ca.gov/capartnership/pdf/AirQualityandEnvironmentalProtection.pdf
5.58
9.04
1.06
2.59
12.21
6.37
% SJV Payroll % SJV ROG and NOx Emissions
California Dairy CAFOs
Page | 26
An examination
ry producers fail to
Research indicates that concentration and industrialization of agricultural production removes more
cated than when smaller farms operate in the
A comparative study of Central Valley communities dominated by one industrial farm versus
communities with multiple locally owned and operated farms showed that the communities with
er social and civic institutions, more even distribution of wealth, and more
A similar study showed that the concentration of agriculture was associated
Donham, Kelley, Steven Wing, David Osterberg, Jan Flora, Carol Hodne, Kendall Thu, and Peter Thorne. February 2007.
Overview Report for the Air Quality Work Group. Accessed http://www.bth.ca.gov/capartnership/pdf/AirQualityandEnvironmentalProtection.pdf
6.37

California Dairy CAFOs
Page | 27
Figure 7 represents the percentage of payroll contributions versus contributions to reactive organic
gas and nitrogen oxide emissions for four of the largest SJV industries. The dairy industry’s share in
emissions is almost six times greater than its share in the regional payroll and the ratio is worse even
than petroleum production and marketing- an industry traditionally thought to be one of the largest
contributors of atmospheric pollution. These figures indicate that the costs of dairy production to
environmental health may outweigh the economic benefits.
The seasonal “colonias”- essentially large labor camps housing seasonal agricultural workers, most of
who emigrate to the SJV from Mexico, pose major challenges for local social services.58 The colonias
are a by-product of increasingly industrialized agriculture that impairs the development and growth
of SJV communities. As long as agriculture dominates the economy of the SJV, low-skilled workers
will consider the region a destination for employment opportunities. This may expand the
agricultural sector, and with it the low-paid, low-skilled job sector.59 The low wages paid to migrant
workers impair significant economic growth by perpetuating widespread poverty.
As low-paid, low-skilled jobs dominate the job market in the SJV, economic development and the
introduction of higher-skilled job sectors may be prevented. A study by The Fresno Bee found that
average earnings in Fresno, Madera, and Tulare counties lagged behind the rest of the state. Farm
workers were the largest category of workers in Fresno and Madera counties. Just two of the top ten
employment categories earned on average more than $29,000 per year (grade school teachers and
nurses).60 The pollution, health risks, and odors associated with dairy CAFOs increase the
probability that the region will continue to be primarily agricultural, as large employers will not
locate in the Valley at the risk of low employee-retention rates and/or increased health care costs.
ii. Property Values
Depending on the proximity to the CAFO and type of CAFO, property values in farming
communities plummet after construction of a CAFO.61 Decreased marketability, loss of use and
enjoyment, and loss of exclusive use were shown in various case studies to decrease property values
by 10-40% of otherwise unimpaired values.62 If CAFOs lower the assessed tax base by reducing
56 Goldschmidt. Agribusiness and the rural community. 1978. As You Sow: Three Studies in the Social Consequence of Agribusiness. Allenheld, Osmun, and Co. 57 MacCannell, Dean. Industrial Agriculture and Rural Community Degradation. 1988. In: Agriculture and Community Change in the U.S.: The Congressional Research Reports. pp. 15–75. 58 Cowan, Tadlock. California’s San Joaquin Valley: A Region in Transition. 2005. CRS Report for Congress. pp. 7. 59 Cowan. 2005. pp. 9. 60 Cowan. 2005. pp. 21. 61 Kilpatrick, John. Concentrated Animal Feeding Operations and Proximate Property Values. 2001. The Appraisal Journal. LXIX(3). Palmquist, R, F. Roka, and T. Vukina. Hog operations, environmental effects, and residential property values.1997. Land Economics. 73. pp. 114-124. 62 Kilpatrick. 2001. pp. 9.

California Dairy CAFOs
Page | 28
property values, while imposing environmental externalities upon a community, the facility
simultaneously works to reduce local resources while increasing local costs. Reduced property value-
- in both absolute terms and in terms of personal enjoyment-- is perhaps the most directly
observable financial externality imposed upon neighbors of dairy CAFOs.
b. Public Health Costs
i. Respiratory Health
CAFO waste decomposition in holding structures and on the fields to which it is applied creates a
complex mixture of dust particles, bacteria, endotoxins, VOCs, and ammonia-- a highly odorous
gas.63 As a federal non-attainment region for particulate matter and ozone, residents of the San
Joaquin Valley face increased respiratory health risks. Air quality in the SJV air basin is especially
poor because of the “low pollution carrying capacity” of the area. Several factors contribute to the
low carrying capacities:
• Surrounding mountains restrict air flow in and out of the valley, impairing dispersion of
pollution;
• Surrounding mountains entrap pollution ‘drift’ from other air basins;
• Rapid daytime heating of the air and intense sunlight contribute to efficient formation of
smog and ozone;
• The valley is prone to thermal inversions, which concentrate pollution as the area of the
dispersion layer decreases.64
A multipart series in The Fresno Bee detailing air quality in the Valley stated that “the San Joaquin
Valley may be the most dangerous place in the United States to breathe.” In 1999, the SJV air basin
surpassed the South Coast air basin in eight-hour ozone violations. This is remarkable given that the
South Coast air basin is home to a population eighteen times as dense as that of the SJV. 65
Exposure to ozone, even at low rates, can decrease lung function and make at-risk groups (the
elderly and children) more susceptible to respiratory diseases.66 A recent survey by the Public Policy
Institute of California placed air pollution and the perceived associated health risks at the top of the
list of concerns for SJV residents.67
The SJV has a higher than average death rate from Chronic Obstructive Pulmonary Disease
(COPD), and some of the highest asthma rates in the nation. The regional prevalence rate for
63 Osterberg, David and David Wallinga. Addressing Externalities from Swine Production to Reduce Public Health and Environmental Impacts. October 2004. American Journal of Public Health. 94(10). pp.1705. 64 Meyer, Deanne. Cooperative Extension Specialist, Dairy Waste Management. Interview: April 2, 2007. University of California, Davis. 65 The Fresno Bee. The Last Gasp. December 15, 2002. http://www.valleyairquality.com/ Accessed April 15, 2007. 66 Perez and Curtis. 2003. pp. 17. 67 Baldassare, Mark. Special Survey of the Central Valley. June 2006. Public Policy Institute of California. pp. vi.

California Dairy CAFOs
Page | 29
asthma is 16.9%, while the statewide prevalence is only 9.6%.68 The SJV has one of the highest rates
of pollution-attributable mortality in the United States. Researchers have documented higher rates of
respiratory symptoms in communities neighboring large CAFOs, relative to comparison groups in
regions with low-density agricultural production.69
i. Occupational Risks
Exposure to CAFO gases is intensified for workers who spend hours within the confines of milking
parlors and free-stall or loafing barns. Chemical decomposition of animal waste begins from the
moment of excretion, and dairy workers (often residents of local communities) are therefore at a
higher risk of adverse health effects than citizens experiencing ‘downwind’ effects.
Analysis of toxin levels in the air in swine confinement facilities in North Carolina revealed
unhealthy levels of hydrogen sulfide, ammonia, fine particulate matter, and endotoxins.70 Respiratory
diseases associated with CAFO employment include: Sinusitis, Irritant Rhinitis, Allergic Rhinitis,
Pharyngitis, Alveolitis, Pulmonary Edema, Organic Dust Toxic Syndrome, Occupational Asthma,
Non-allergic Asthma, Reactive Airways Disease Syndrome, Allergic Asthma, Chronic Bronchitis,
and COPD.71
Given that agricultural jobs often employ undocumented, uninsured workers, the effects of CAFO-
related disease in the SJV may be intensified in terms of suffering and loss of welfare. ii. Antibiotic Resistance
Infectious livestock diseases spread rapidly in large herds of confined animals. As a preventive
measure, many operators regularly administer antibiotics in feed. Seventy percent of the antibiotics
produced in the United States are fed to animals to reduce infection and increase production,72 and it
is estimated that up to 75% of these antibiotics are excreted in manure and urine.73
The Union of Concerned Scientists estimates that 13 of the 20 million pounds of antibiotics
administered to animals each year are ‘medically important’- meaning that they are closely related to
medicines used in humans.74 The abuse of antibiotics in food production expedites the rise of
antibiotic resistant strains of bacteria, which may be transferred to humans through the food supply
and groundwater contamination. CAFOs have been referred to as “reservoirs of antibiotic
resistance.”75 The World Health Organization noted that drug-resistant strains of Salmonella,
68 Perez and Curtis. 2003. pp. 18. 69 Donham, et al. 2007. pp. 318. 70 Donham, et al. 2007. pp. 318. 71 Osterberg and Wallinga. pp. 1705. 72 Horrigan, Leo, Robert Lawrence, and Polly Walker. How Sustainable Agriculture can Address the Environmental
and Human Health Harms of Industrial Agriculture. May 2002. Environmental Health Perspectives. 110(5). pp. 451. 73 Osterberg and Wallinga. 2004. pp. 1705. 74 Osterberg and Wallinga, 2004. pp. 1705. 75 Osterberg and Wallinga. 2004. pp. 1703.
California Dairy CAFOs
Page | 30
Campylobacter, Enterococci, and E. coli have been transmitted from animals to humans, and called
for the reduced use of antibiotics in food production.
Those living near CAFOs have a higher risk of exposure to drug-resistant strains of bacteria,
through groundwater leaching, water-source contamination, and physical contact with waste.
iii. Water Source Contamination
Bacteria, microbes, and residual antibiotics are passed from dairy cows in manure. Manure stored in
holding ponds and lagoons that are improperly constructed or maintained may contaminate local
water sources through leaching or runoff. Samples from storage lagoons contained traces of
antibiotics administered in feed.76 Microbes that are toxic to humans thrive in water with high
nutrient concentration, and decompose nitrogen found in manure into nitrates77 Ingestion of nitrate
contaminated water can lead to the sometimes fatal shortage of oxygen in the blood of infants,
called Methemoglobinemia, or “blue baby syndrome.”78
In rural communities such as those found in the SJV, many rely on well water. The United States
Geological Service found nitrate concentrations that violated drinking water standards in 25% of
residential wells sampled in the SJV.79 Residents of the SJV are more likely to be exposed to
antibiotic residue, bacteria, and nitrates due to the high concentrations of dairy CAFOs in the water
basin.
iv. Mental Health
The effects of CAFOs upon mental health have not been researched extensively. However,
preliminary research, most of which concerns communities around swine CAFOs in the Midwest
and Southeast (swine CAFOs impose many of the same environmental effects as dairy CAFOs), is
suggestive.
Living in close proximity to hog CAFOs has been linked to higher rates of self-reported depression,
anxiety, and impaired mental health.80 Surveys administered during four days on which hog odors
could be smelled in the CAFO communities revealed that those experiencing odors had higher rates
of depression, tension, anger, fatigue, and confusion than the controls.81 The effects of CAFO
externalities upon mental health need to be examined more thoroughly, but preliminary evidence
suggests a possible deleterious effect.
c. Quality of Life Costs
76 Osterberg and Wallinga. 2004. pp. 1706. 77 Horrigan et al. May 2002. pp. 451. 78 Osterberg and Wallinga. 2004. pp. 1704. 79 Cowan. 2005. pp. 261. 80 Donham, et al. 2007. pp. 318. 81 Cole, Dana, Lori Todd and Steve Wing. Concentrated Swine Feeding Operations and Public Health: A review of
Occupational and Community Health Effects. 2000. Environmental Health Perspectives. 108(8). pp. 693.
California Dairy CAFOs
Page | 31
i. Outdoor Activity
The symptoms associated with asthma and other respiratory disease adversely affect quality of life,
especially among children. Poor air quality often prevents the enjoyment of outside activities and
physical exercise. The SJVAPCD adopted recommendations for “active indoor recess” in valley
schools on poor air quality days when children are advised not to play outdoors. CAFOs contribute
to this impairment of activity which no doubt impairs childhood development.
ii. Odor
Odors associated with dairy CAFOs are not only a nuisance, but also a hindrance to community and
social growth. Residents in communities near large CAFOs cannot enjoy outdoor activities on many
days due to unpleasant odor and the health risks associated with the odor. In communities where a
large part of community life is rooted in outdoor activity, this can have detrimental effects upon the
social fabric of the region.82
An essential component of being a home or property owner is the right to “exclusive use” of one’s
property. This right is pre-empted on days when air quality and odors are poor and individuals are
unable to enjoy their property to its fullest extent. This loss of the right -to -use one’s property
decreases the utility of owning property in the San Joaquin Valley.
iii. Pests
CAFOs and associated manure storage structures and spraying fields attract flies and other insects
that parasitize dairy cows. These pests are a nuisance to neighbors and represent possible disease
vectors. Because pesticides are often applied to animals in confinement to control flies and other
insects, traces of the pesticides are found in CAFO waste and may leach or runoff to local water
sources, posing additional health threats to the public and local community.83
iv. Community Development
Economic development models suggest that as the scale of farms increase and the number of farms
decrease, the community structure of rural communities change in a fundamental way. Individual
well-being becomes more vulnerable to the ups-and-downs of the global economy as local
production is geared towards producing undifferentiated commodity goods. Setback requirements
for CAFOs often hinder community development, as anyone wishing to move within limits of the
setback radius must sign away rights to exclusive use. 84
The poor air quality, odor, and health risks associated with dairy CAFOs decrease the desirability of
SJV communities. This may be one explanation for the significantly negative relationship seen
82 Thu, K. Public Health Concerns for Neighbors of Large-Scale Swine Production Operations. 2002. Journal of Agricultural Safety and Health. 8(2). pp. 175. 83 Environmental Protection Agency. NPDES Permit Regulation and Effluent Limitation Guidelines and Standards for
Concentrated Animal Feeding Operations; Final Rule.40 CFR Parts 9, 122, 123, and 412. pp. 7236. 84 Weida. 2004.
California Dairy CAFOs
Page | 32
between population density and total number of cows per block group. The benefits often
associated with rural areas-- abundant land, outdoor activity, and access to nature-- are significantly
reduced in the presence of CAFOs. Community development through outdoor activities such as
farmers markets is less frequent, if present at all.
D. Other Costs
Dairy CAFOs impose costs to society beyond the community-perspective assumed in this analysis.
As the wider benefits to California of a productive dairy industry were discussed in section II, the
wider costs of dairy production will now be considered briefly.
1. Environmental Degradation
Industrial agriculture contributes to environmental degradation at the national and global level. The
specialization of production necessitated inputs and created waste management problems that are
unsustainable. Feeding cows formulated feed trucked in to the Valley from grain-producing regions
leads to pollution that was unnecessary when cows grazed pastures fertilized by their waste.85
Pollution from dairy CAFOs in the SJV has effects beyond the confines of the region, for example,
through the contamination of the Sacramento delta water basin. On a global level, industrial
agriculture is one of the largest greenhouse gas contributors.86 In addition, the geographic
concentration of food production necessitates the use of fossil-fuels for product transport.
2. Animal Welfare
Dairy production facilities can have detrimental impacts on the welfare of heifers and cows. For
more information, please see www.FarmAnimalWelfare.org.
3. National and Global Economic Impacts
Milk and other animal products are artificially cheap in the United States. Federal and state subsidies
for agricultural production lead to overproduction. The federal government supports a long-
standing milk price support program that keeps farmers in business even when economic forces
would naturally drive them out of the market.87 The failure to internalize societal costs of production
contributes to over-production and under-pricing, as producers do not incur the total social cost of
milk production.
Over-production of milk has important national and global consequences. Cheap animal products
increase consumption (beyond the social and medical optimum), compromising cardiovascular
85 Interview with Deanne Meyer. April 2, 2007. 86 Steinfeld, Henning, Pierre Gerber, Tom Wassenaar, Vincent Castel, Mauricio Rosales, and Cees de Haan. Liverstock’s Long Shadow: Environmental Issues and Options. Food and Agriculture Agency of the United Nations. Rome, 2006. 87 Miller, James and Don Blayney. Dairy Backgrounder. July 2006. Economic Reasearch Service. United States Department of Agriculture.

California Dairy CAFOs
Page | 33
health and imposing indirect public health costs. Cheap animal products from the United States
flood the global market, hindering local food production in developing nations and increasing
dependence on global imports.
E. Discussion
The modest employment benefits from capital-intensive dairy CAFOs do not outweigh the many
direct and indirect costs dairy production imposes upon SJV communities. Though the statewide
economic benefits may be large, from the local perspective, the costs of dairy production in the SJV
outweigh the benefits. Additionally, national and global costs of industrial dairy production likely
outweigh statewide economic benefits.
Comparing census demographic data to the rest of California and the distribution of dairy CAFOs,
we see that the costs of dairy production are imposed upon a disproportionately poor, non-white,
undereducated, and non-English speaking population, raising important questions about
environmental justice in central California. Though this cost would be difficult to quantify, adversely
affecting a politically disenfranchised community for the sake of efficiency is unacceptable when
concerned with issues of equity.
The most basic problem with dairy CAFOs is a market failure in the form of production
externalities borne by local communities that are politically disenfranchised. The industrialization of
dairy production and the resultant nutrient concentration impose economic, public health, and
quality of life costs upon CAFO communities, none of which are considered in production decisions
on-farm. As such, milk is produced in quantities above the social optimum, contributing to
environmental degradation and negatively affecting local health and quality of life. Therefore, action
must be taken at the local, state, and federal level to ensure that SJV communities enjoy
environmental justice and protection from the costs imposed upon them by dairy CAFOs.
F. Criteria for Policies Addressing Local Externalities
While the focus of this paper is on the local benefits and costs of dairy CAFOs in the San Joaquin
Valley, local solutions may have regional, national, and even statewide consequences. Policy
alternatives addressing the externalities imposed by dairy CAFOs upon SJV communities should
ideally meet the following four criteria:
1. Increase Local Economic Benefit
The production externalities from dairy production in the SJV lead to a transfer of wealth from a
traditionally impoverished region to more affluent citizens. Local economic benefit could be
increased by internalizing the societal costs of dairy production to dairy producers, or by keeping
dairy revenues in production regions. Facing higher costs of production, dairies would have the
incentive to decrease herd size and production scale, thereby decreasing production externalities.
2. Improve Community Health
California Dairy CAFOs
Page | 34
The direct and indirect effects of CAFO pollution on public health have serious social and
economic consequences for SJV communities. Community health could be improved by reducing
pollution levels and internalizing production externalities.
3. Increase Local Quality of Life
Odors, air quality, impeded community development and poor health impair quality of life among
CAFO neighbors. Decreasing pollution levels could increase local quality of life.
4. Increase Equity
Dairy CAFOs in the SJV disproportionately affect poor, non-white, rural communities. Equity for
these communities could be improved by providing accessible avenues of reprieve for underserved
communities.
V. Recommendations
Given the traditional zero-discharge requirements for agriculture and the accompanying policy
regime, the external effects of dairy production upon local communities may seem surprising. Part
of the problem is due to California’s long standing exemption for agricultural sources of pollution,
just recently revoked.
Internalizing external costs of dairy production to dairy producers is, in economic terms, the most
efficient way to mitigate the problems caused by CAFOs in SJV communities. The effect would be
to decrease milk production to the point at which social cost was equal to demand, since the
production costs paid by dairies would be higher. This type of a regulatory scheme would be
unpopular on its face, as California is traditionally protective of agricultural interests. However, the
policies for internalization are in place already. The main problem is surveillance and
implementation-- policies simply are not being enforced, due in large part to lack of information,
lack of resources, and lack of will.88
Though violations of environmental justice are not directly addressed by the following
recommendations, enforcing CAFO regulations would contribute to the protection of these
disenfranchised communities-- something that has not yet been done in the SJV.
A. San Joaquin Valley Policy Recommendations
• In order to enforce federal and state standards (and protect the health and quality of life
of SJV citizens), the CVRWQCB and SJVUAPCD should develop and implement a
strategy to collect and archive all relevant data about existing SJV dairy CAFOs and
associated manure storage structures, application fields, and production practices.
One of the biggest challenges facing regulatory agencies in the SJV today is an information
asymmetry. Inspection and enforcement activities are conducted mainly as a response to local
88 Interview with Deanne Meyer. April 2, 2007.

California Dairy CAFOs
Page | 35
complaints. Given that SJV communities are politically disenfranchised and more likely to have low
English proficiency, complaints are less likely.
No sufficient data exists to determine if current dairies are in compliance with water and air
protection regulations. While dairies may be aware of compliance issues or sub-standard waste
management, the organizations charged with regulating these dairies are not. This creates moral
hazard for dairies to pollute locally without reporting.
The problem is not that policies are lacking, but information for enforcing the existing policies is
non-existent. For example, the CVRWQCB does not know which lagoons in the region are lined
with clay and gravel soils that meet state standards. This lack of information presents a significant
challenge to effectively enforcing water protection policies. Therefore, local priority should be given
to collecting the information needed to determine compliance.
Once compliance or non-compliance is determined for each facility, the local air and water quality
boards will have the ability to enforce discharge requirements, improving local health, quality of life,
and promoting equity.
• In order to address resource and staff shortages, as well as enforce existing regulations,
CVRWQCB, SJVUAPCD, and local zoning/development boards should actively partner
with one another and with industry and related support organizations (such as CDQAP)
to enforce policies.
When the water board requested ROWDs from the region’s dairies, they enjoyed a 98% response
rate thanks in large part to the outreach efforts of the CDQAP, which conducted over thirty free
short-courses and workshops to assist dairies with applications. Despite the service provided by
organizations such as CDQAP, which assist with voluntary compliance and self-regulation, there is a
lack of cooperation between agencies and outreach service providers.
Given the evidence of non-compliance with zero discharge requirements, and considering the lack
of resources available to these agencies (in the form of time, staff, and technology) relative to the
time effective enforcement would require (there are over 1000 dairies in the SJV alone), a
cooperative enforcement and monitoring strategy would help meet regulatory needs. Additionally,
agency cooperation would help to clarify existing confusion regarding jurisdiction and process (e.g.
Meyer noted that no agency-- local or regional-- currently claims responsibility for lagoon
composition analysis or enforcement89). The failure to enforce policies has serious consequences for
equity in the SJV. Partnering to enforce CAFO standards would promote environmental justice by
protecting SJV communities. Additionally, enforcement of CAFO regulations may increase local
economic benefit (to the extent the enforcement necessitates smaller-scale production which may
lead to local input purchases), improve community health, and improve quality of life.
89 Interview with Deanne Meyer. April 2, 2007.
California Dairy CAFOs
Page | 36
• In order to stop additional growth of the dairy industry in a region already past its
pollution carrying capacity, institute a regional moratorium on new dairy CAFOs.
The PPIC predicts that by 2040 the population of California will grow from its current level of 35
million people to somewhere between 45-55 million people.90 The SJV is predicted to be one of the
fastest growing regions in the state. Population growth in the SJV will likely lead to more
urbanization on agricultural land and further consolidation of dairies. The predicted population
growth in the SJV will exacerbate the problems discussed in this paper, as more people will be
adversely affected by dairy externalities. As population density increases, so will the public health
costs associated with dairy emissions and discharges.
Available evidence suggests that the SJV is already well beyond its dairy-cow carrying capacity.
Geographic features in the region, combined with the dense proliferation of dairy cows, have
created an environmental and public health crisis that must first be addressed by stopping the flow
of CAFOs into the region. The CVRWQCB could implement this policy suspending issuance of
new NPDES and WDR permits for new dairies. Though this policy may not increase local
economic benefit, it would prevent further declines in local health, quality of life, and process equity.
B. California Policy Recommendations
• To promote voluntary compliance with California water and air pollution regulations, set
achievable, understandable, and steady-state goals to reduce risk.
Dairy producers are hesitant to make large process improvement investments because of the
uncertainty associated with current regulations. For this reason, the number of dairies using the
latest pollution-mitigation technologies “can be counted on one hand.”91 This may be one
explanation for the remarkably high amount of pollution in the SJV.
According to Dr. Deanne Meyer, a UC Davis Cooperative Extension specialist who works directly
with California dairy operators, the biggest incentive for farmers to invest in pollution reduction
technologies would be to “get rid of the moving targets.” WDR standards and air pollution
standards have consistently changed at both the local and state levels. Says Meyer, “We need a
stepwise process to document benchmarks for dairies to meet standards. The regulatory agencies
must be firm and consistent, or they may as well not issue permits.” Dairy operators are hesitant to
invest in expensive pollution reduction technologies when they are not certain that the technology
will help them achieve compliance.
For example, installing a methane digester that produces energy from waste with a combustion
engine may mean that the dairy will be regulated as an air pollution point source (in addition to NPS
regulation). This is clearly a disincentive for innovation. A further complication arises from the
90 Teitz, et al. 2005. pp.v. 91 Interview with Deanne Meyer. April 2, 2002.

California Dairy CAFOs
Page | 37
separate regulation of air and water contamination. Measures taken to reduce water contamination
by reducing nutrient content (by allowing waste to volatilize in holding structures, for example)
often increase emissions to the atmosphere, and vice versa. Therefore, many producers are hesitant
to invest heavily in mitigation technologies that could bring them into conflict with other pollution
regulations.92 This risk aversion is especially salient in a commodity industry, where only the most
efficient farms are profitable. Reducing risk for farmers could substantially improve prospects for
innovation.
The tradeoff with this policy option comes with the reality that nutrient emissions rates are not
constant over time or between operations. Soil absorption capacities, acreage, lagoon lining
composition, non-organic content, and manure nutrient concentration (varying with diet) affect the
composition of waste water and manure. Therefore, having flexible agronomic rates of application
may provide some benefits. However, given the limitations in current technology, available data,
agency resources, and the political climate, it is recommended that a non-moving standard be
established for farmers to incentivize investment in mitigation technologies that may improve local
health and quality of life.
• To promote innovation, provide regulatory “safe harbor” for dairies that implement
approved technologies.
For the reasons discussed above, reducing risk for farmers trying innovative mitigation technologies
would encourage implementation of potentially helpful mitigation technologies. Dairies that attempt
to implement approved technologies but miss emissions targets as a result should be granted safe
harbor from serious legal consequences, perhaps in the form of a reasonable grace period for
process improvement. To the extent that safe-harbor leads to process innovations, local health and
quality of life may be improved.
• To speed up research and development for dairy technology, fund research for new
pollution mitigation and monitoring technologies.
Current BACT air control standards, CMPs, and other mitigation technologies were recommended
largely in the absence of concrete empirical evidence of their effectiveness. For example, the regional
water boards and state are not certain which organic compounds are precursors to ozone, and
therefore mitigation policies are implemented independent of this consideration. Technologies for
waste management and recycling are somewhat archaic. There are many research and development
opportunities in the field of livestock waste management. The state should incentivize or fund such
research.
This alternative would have small short-term benefits for SJV residents, but could lead to major
long-run benefits if technologies were developed to lessen the negative externalities of industrial
dairy farming.
92 Aillery et al. 2005.
California Dairy CAFOs
Page | 38
C. Federal Policy Recommendations
• In order to enforce the expanded federal CAFO regulations, develop and implement a
strategy for granting permits to CAFOs and enforcing discharge requirements. Should
additional resources be necessary to effectively enforce CAFO regulations, state
regulatory agencies (such as the CVRWQCB) should have access to such resources,
contingent upon performance.
The General Accounting Office (GAO) reported U.S. EPA failures to properly implement and
enforce state NPDES permitting programs. GAO cited two fundamental problems with EPA
implementation. The first was the failure to require permits for almost 60% of CAFOs with more
than 1000 animal units (through various exemptions), and the second was failure to ensure that state
permitting programs properly enforced regulations.93
U.S. EPA resources for enforcement of the CWA were insufficient even before the increase in
regulated facilities. U.S. EPA must ensure that states delegated the responsibility of enforcing CWA
standards meet federal requirements. More resources or an improved strategy for standard
enforcement will be essential to the program’s success.
Enforcement of federal standards would improve health and quality of life in the SJV, as well as
improve current violations of environmental justice. To the extent that enforcement of policies leads
to smaller, more numerous dairy farms, the local economic benefit in the long run could be
substantial.
VI. Recommendations for Further Research
Available evidence strongly suggests that from the local perspective, CAFO costs to the economy,
health, and quality of life outweigh any inherent benefits. The above examination of SJV
community demographics and CAFO distribution raises important concerns about environmental
justice in the region. Recommendations for further research include:
• A statewide analysis of trends in demographics and CAFO distribution to further examine the
relationship between CAFO location and community demographics.
• Systems analysis research regarding CAFO waste cycles will be imperative to the future of the
California dairy industry and the well being of SJV residents. If the current level of production is
sustained, new mitigation and systems technologies will be essential.
Oversight and enforcement of water and air regulations must be improved at the local, state and
federal levels, especially considering the predicted trajectory of the SJV toward urbanization and
population growth. Until dairy operators incur the total societal costs of production, the negative
93 General Accounting Office. Increased EPA Oversight will Improve Environmental Program for Concentrated Animal
Feeding Operations. 2003. GAO-03-285. pp. 6.

California Dairy CAFOs
Page | 39
environmental externalities described above will continue to negatively impact the citizens of the
SJV. Joint strategies for enforcement will be essential to the success of mitigation policies.

California Dairy CAFOs
Page | 40
List of Acronyms
AFO Animal Feeding Operation
CAFO Concentrated Animal Feeding Operation
CAPCOA California Air Pollution Control Officers Association
CARB California Air Resources Board
CCC California Coastal Commission
CDQAP California Dairy Quality Assurance Program
CMAB California Milk Advisory Board
CSWRCB California State Water Resources Control Board
CVRWQCB Central Valley Regional Water Quality Control Board
CWA Clean Water Act
NMP Nutrient Management Plan
NPDES National Pollutant Discharge Elimination System
NPS Non Point Source
NOx Nitrogen Oxide
PM Particulate Matter
ROWD Report of Waste Discharge
RWQCB Regional Water Quality Control Board
SJV San Joaquin Valley
SJVAB San Joaquin Valley Air Basin
SJVUAPCD San Joaquin Valley Unified Air Pollution Control District
SWRCB State Water Resources Control Board
TMDL Total Maximum Daily Load
VOC Volatile Organic Compound
WDR Waste Discharge Requirement

California Dairy CAFOs
Page | 41
Works Cited Data
California Health Interviews Survey. http://www.chis.ucla.edu/
Central Valley Water Quality Control Board, Fresno and Sacramento Offices. Report of Waste Discharge Applications.
U.S. Census, 2000. Summary File 3.
Interviews and Correspondences
Meyer, Deanne. Ph.D.,Cooperative Extension Specialist, Livestock Waste Management. University of California, Davis, in person, April 2, 2007.
Pollan, Michael. Professor of Journalism. University of California, Berkeley, in-person and via email. February through March, 2007.
Robinson, Peter H. Ph.D., Cooperative Extension Specialist, animal nutrition. University of California, Davis, via telephone, February 27, 2007.
Publications
Aillery, Marcel, Noel Gollehon, Robert Johansson , Jonathon Kaplan, Nigel Key, and Marc Ribaudo. Managing Manure in Improve Air and Water Quality. September 2005. USDA Economic Research Report 9. Baldassare, Mark. Special Survey of the Central Valley. June 2006. Public Policy Institute of California. Blayney, Don P. The Changing Landscape of U.S. Milk Production. United States Department of Agriculture Statistical Bulletin 978. June 2002.
California Air Pollution Control Officers Association (CAPCOA), White Paper on SB 700. April 2004.
California Dairy Research Foundation. California Dairy Facts. http://www.cdrf.org/content.asp?contentID=55. Accessed April 5, 2007. California Department of Food and Agriculture. California Agricultural Resource Directory, 2006. January 2007. California Milk Advisory Board. How California Created the Dairy Industry of the Future. 2005.
Committee of Experts on Dairy Manure Management. Managing Dairy Manure in the Central Valley of California. Revised June 2005. University of California Division of Agriculture and Natural Resources. California Partnership for the San Joaquin Valley. Overview Report for the Air Quality Work Group. Accessed April 15, 2007. http://www.bth.ca.gov/capartnership/pdf/AirQualityandEnvironmentalProtection.pdf

California Dairy CAFOs
Page | 42
California State Water Resources Control Board. Non Point Source Management Plan, Section II Five Year Implementation Plan. 2003. Cole, Dana, Lori Todd and Steve Wing. Concentrated Swine Feeding Operations and Public Health: A review of Occupational and Community Health Effects. 2000. Environmental Health Perspectives. 108(8). Copeland, Claudia. Animal Waste and Hazardous Substances: Current Laws and Legislative Issues. 2006. CRS Report for Congress. RL-33691. Cowan, Tadlock. California’s San Joaquin Valley: A Region in Transition. 2005. CRS Report for Congress. Dairy Permitting Advisory Group. Recommendations to the San Joaquin Valley Air Pollution Control Officer Regarding Best Available Control Technologies for Dairies in the San Joaquin Valley. January 31, 2006. Dairy Subcommittee of the San Joaquin Unified Air Pollution Control District. Air Emissions Action Plan for California Dairies. 2003. Donham, Kelley, Steven Wing, David Osterberg, Jan Flora, Carol Hodne, Kendall Thu, and Peter Thorne. Community Health and Socioeconomic Issues Surrounding Concentrated Animal Feeding Operations. February 2007. Environmental Health Perspectives. 115(2). Dryer, Jerry. The Economic Impact of the California Dairy Business. September 2005. California Milk Advisory Board. Environmental Law Institute. State Regulation of Animal Feeding Operations: Seven State Summaries. 2003. Environmental Protection Agency. National Pollutant Discharge Elimination System Permit Regulation and Effluent Limitation Guidelines and Standards for Concentrated Animal Feeding Operations (CAFOs). February 12, 2003. Federal Register. Volume 68. No. 29. Environmental Protection Agency. NPDES Permit Regulation and Effluent Limitation Guidelines and Standards for Concentrated Animal Feeding Operations; Final Rule.40 CFR Parts 9, 122, 123, and 412. Fenske, Richard. Incorporating Health and Ecologic Costs into Agricultural Production. 2002. Environmental Health Perspectives. 110(5). The Fresno Bee. The Last Gasp. December 15, 2002. http://www.valleyairquality.com/ Accessed April 15, 2007. Goldschmidt. Agribusiness and the rural community. 1978. As You Sow: Three Studies in the Social Consequence of Agribusiness. Montclair, New Jersey: Allenheld, Osmun & Co. Gollehon, Noel, Margriet Caswell, Marc Ribaudo, Robert Kellogg, Charles Lander, and David Letson. Confined Animal Production and Manure Nutrients. 2001.USDA Economic Research Service. AIB-771.
California Dairy CAFOs
Page | 43
Greenwald, Michelle. Real California Cheese: It’s the Cheese. Columbia Business School. 2005. Horrigan, Leo, Robert Lawrence, and Polly Walker. How Sustainable Agriculture Can Address the Environmental and Human Health Harms of Industrial Agriculture. May 2002. Environmental Health Perspectives. 110(5). Kilpatrick, John. Concentrated Animal Feeding Operations and Proximate Property Values. 2001. The Appraisal Journal. LXIX(3). Kirkhorn, Steven and Vincent Garry. Agricultural Lung Diseases. 2000. Environmental Health Perspectives. 108(4). Kirschten, Dick. Inviting Workers, Importing Poverty. February 27, 1999. National Journal. 31(9) MacCannell, Dean. Industrial Agriculture and Rural Community Degradation. 1988. Agriculture and community change in the U.S.: The Congressional Research Reports. Miller, James and Don Blayney. Dairy Backgrounder. July 2006. Economic Reasearch Service. United States Department of Agriculture. Mirabelli, Maria, Steve Wing, Stephen Marshall, and Timothy Wilcosky. Race, Poverty, and Potential Exposure of Middle-School Students to Air Emissions from Confined Swine Feeding Operations. Environmental Health Perspectives. 114(41). Office of Wastewater Management. State Compendium, Programs and Regulatory Activities Related to Animal Feeding Operations. U.S. Environmental Protection Agency. Osterberg, David and David Wallinga. Addressing Externalities from Swine Production to Reduce Public Health and Environmental Impacts. October 2004. American Journal of Public Health. 94(10). Palmquist, R, F. Roka, and T. Vukina. Hog operations, environmental effects, and residential property values. 1997. Land Economics. 73. pp. 114-124. Perez, Miguel, and Kathleen Curtis. Healthy People 2010: A 2003 profile of health status in the Central San Joaquin Valley. 2003. California State University, Fresno. Ribaudo, Marc. Managing Manure: New Clean Water Act Regulations Create Imperative for Livestock Producers. 2003. Amber Waves. 1(1). Ribaudo, Marc, Jonathon Kaplan , Lee Christensen, Noel Gollehon, Robert Johansson, Vince Breneman, Marcel Aillery, Jean Agapoff, and Mark Peters. Manure Management for Air Quality: Costs to Animal Feeding Operations of Applying Manure Nutrients to Land. June 2003. USDA Economic Research Report 824. Ribaudo, Marc and Marca Weinberg. Improving Air and Water Quality can be Two Sides of the Same Coin. September 2005. Amber Waves. 3(4).
California Dairy CAFOs
Page | 44
San Joaquin Valley Unified Air Pollution Control District. Rule 4550. Adopted May 2004. San Joaquin Valley Unified Air Pollution Control District. Rule 4570. Adopted June 2005. Sporleder, T. Ohio Food Income Enhancement Program. 1997. Agricultural, Environmental, and Development Economics Department. Ohio State University. Teitz, Michael, Charles Dietzel, and William Fulton. Urban Development Futures in the San Joaquin Valley. 2005. Public Policy Institute of California. Thu, K. Public Health Concerns for Neighbors of Large-Scale Swine Production Operations. 2002. Journal of Agricultural Safety and Health. 8(2). U.S. Department of Agriculture and U.S. EPA. Unified National Strategy for Animal Feeding Operations. 1999. U.S. EPA. Compliance Website. April 14, 2007. http://www.epa.gov/compliance/environmentaljustice U.S. General Accounting Office. Increased EPA Oversight will Improve Environmental Program for Concentrated Animal Feeding Operations. 2003. GAO-03-285. U.S. Government Accountability Office. USDA Should Improve its Process for Allocating Funds to States for the Environmental Quality Incentives Program. 2006. GAO-06-969. Waterkeeper Alliance et al. v. EPA. 399 F.3d 486 Weida, William. Comments on the Potential Regional Economic Effects of Large Feedlots. 2001. A GRACE Factory Farm Project Report. Weida, William. Considering the Rationales for Factory Farming. March 29, 2004. Presented at: Environmental Health Impacts of CAFOs: Anticipating Hazards, Searching for Solutions. Wing, Steve and Susanne Wolf. Intensive Livestock Operations, Health, and Quality of Life among Eastern North Carolina Residents. 2000. Environmental Health Perspectives. 108(3).

California Dairy CAFOs
Page | 45
Appendix A: Statistical Analysis and Regression Results Graphic Analysis of Trends Simple scatter-plots of the natural log of cows per block group (with cows > 0) versus block group data on non-white population proportion, percentage households in poverty, and population density reflect that population density is the only variable with an obvious correlation to ln(cows).
0.00
2.00
4.00
6.00
8.00
10.00
12.00
0.0000 0.2000 0.4000 0.6000 0.8000 1.0000
ln(c
ow
s)
Non-White Population Proportion
0.00
2.00
4.00
6.00
8.00
10.00
12.00
0.0000 0.1000 0.2000 0.3000 0.4000 0.5000
ln(c
ow
s)
Poverty Rate

California Dairy CAFOs
Page | 46
Multiple Regression Analysis Using data from the US Census 2000, the Central Valley Regional Water Quality Control Board, and
information calculated using GIS spatial analysis tools, four different regression models were
specified to examine the relationship between total cows per block group and various demographic
characteristics of the San Joaquin Valley.
Simple multivariate regressions with total cows per block group as the dependent variable, and
population density, non-white population, and households in poverty as the explanatory variables
were run including all block groups and including only block groups with > 0 cows (Regressions 1-
2), in order to determine how the relationship between the variables changed when excluding the
population-dense urban centers with zero cows. Including all block groups resulted in a highly
significant coefficient for population density, suggesting that the urban centers are a major driver of
the relationship between population density and total cows seen in Regression 2.
Models with the natural logs of total cows and population density as the dependent variable were
specified (Regressions 3-4), reflecting that the total cows and population density variables are counts
(over a specific geographic area), or prevalence rates, indicating that the Poisson distribution may
better fit the data. Examining the relationship between population density and total cows in both
directions was important to understanding the degree to which large herd sizes keep population
density low, and vice versa. The relationship appears to run in both directions.
Regression 1: Simple Multivariate Regression (block groups with total cows >0)
����� ��� = � + ������������� + �������ℎ���� + ���������� ���� + ! Where i denotes block group, n=201
0.00
2.00
4.00
6.00
8.00
10.00
12.00
0.0000 0.0005 0.0010 0.0015 0.0020
ln(c
ow
s)
Population Density (ppl/sq meter)

California Dairy CAFOs
Page | 47
Coefficient Standard Error T-Score P-Value
Population Density -10522974 4033819.12 -2.6086875 0.0098
Non-White Population -1358.04779 5976.072198 -0.22724755 0.8207
Poverty 384.2769 11605.3 0.033112 0.9736
Constant 8420.265 1982.643
Regression 2: Simple Multivariate Regression (all block groups)
n = 2285
Regression 3: Poisson Regression (block groups with total cows > 0)
�������� ���� = � + ������������� + �������ℎ���� + ���������� ���� + !
Coefficient Standard Error T-Score P-Value
Population Density -2601.1467 508.662615 -5.1136975 0.0000
Non-White Population -0.16819978 0.753579776 -0.22320103 0.8238
Poverty 0.190625 1.463423 0.13026 0.8965
Constant 8.159321 0.25001
Regression 4: Natural Log of Population Density as Dependent Variable (block groups with
total cows > 0)
������������� = � + �������ℎ���� + ����������� + �������� ���� + !
Coefficient Standard Error T-Score P-Value
Non-White Population 1.01030151 0.71023894 1.42248116 0.1565
Poverty -4.08166213 1.35877821 -3.0039208 0.0030
Total Cows -4.67E-05 8.47E-06 -5.513983762 0.0000
Constant -9.986918 -5.513983762
Coefficient Standard Error T-Score P-Value
Population Density -457253.63 55225.9884 -8.2796821 0.0000
Non-White Population 78.3528658 490.1616964 0.159851058 0.8731
Poverty 1154.326 796.4123 1.449408 0.1474
Constant 1141.991 166.0516
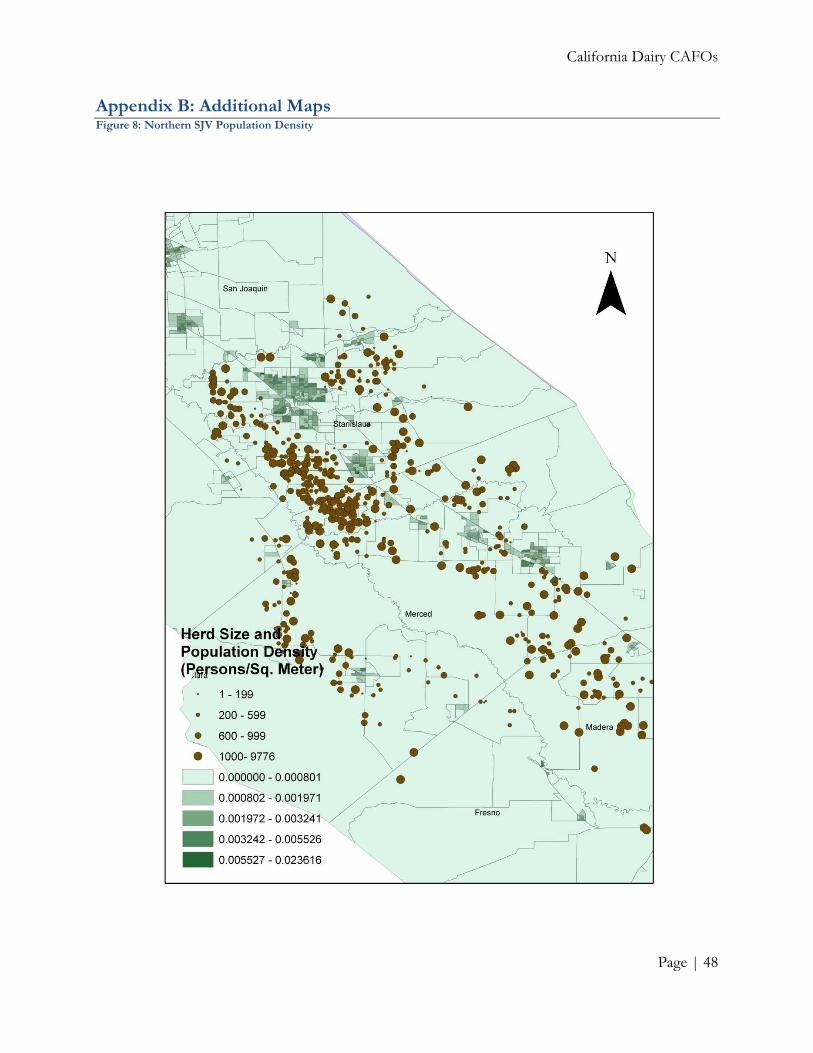
California Dairy CAFOs
Page | 48
Appendix B: Additional Maps Figure 8: Northern SJV Population Density

California Dairy CAFOs
Page | 49
Figure 9: Southern SJV Population Density

California Dairy CAFOs
Page | 50
Figure 10: Northern SJV Non-White Population

California Dairy CAFOs
Page | 51
Figure 11: Southern SJV Non-White Population

California Dairy CAFOs
Page | 52
Figure 12: Northern SJV Poverty Rate
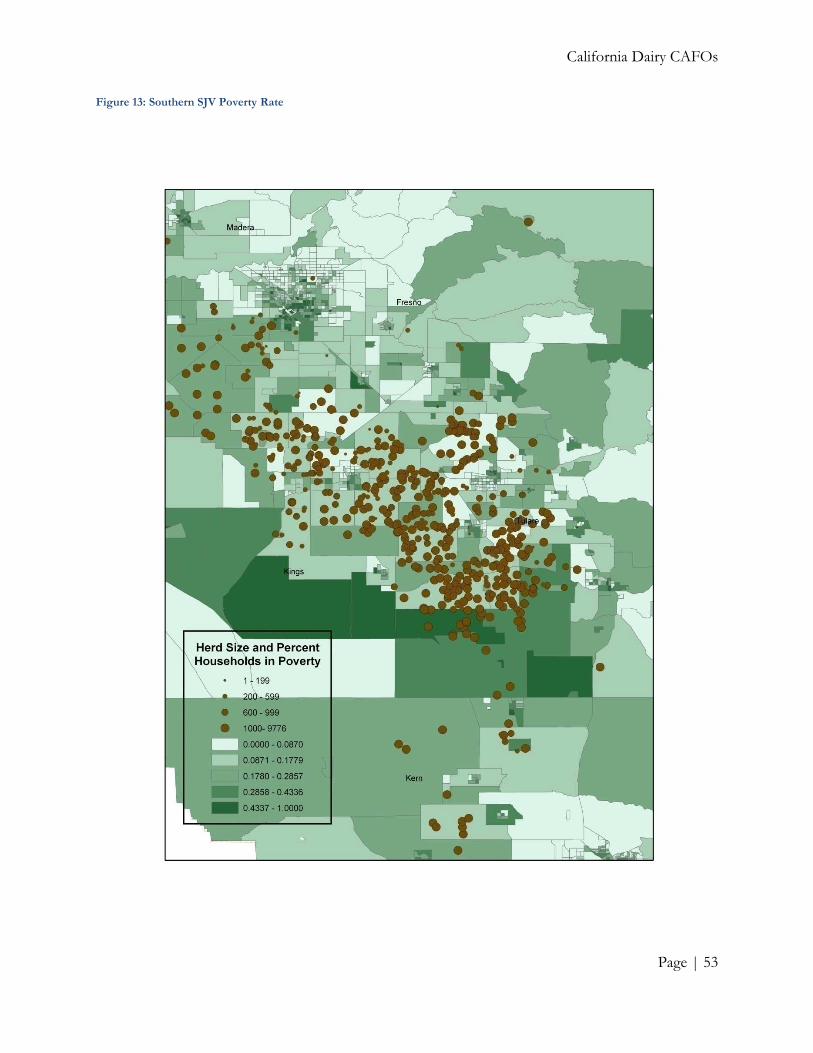
California Dairy CAFOs
Page | 53
Figure 13: Southern SJV Poverty Rate