dairy business analysis project: financial …dairy.ifas.ufl.edu/dbap/files/macon_talk.pdfdairy...
TRANSCRIPT
Dairy Business Analysis Project: Dairy Business Analysis Project: Financial Opportunities and Financial Opportunities and Constraints on Georgia and Florida Constraints on Georgia and Florida DairiesDairies
Marvin J. HoekemaMarvin J. HoekemaManager, Dairy Business Analysis ProjectManager, Dairy Business Analysis ProjectDepartment of Dairy and Poultry SciencesDepartment of Dairy and Poultry SciencesUniversity of Florida University of Florida

1998 Dairy Business Analysis Project1998 Dairy Business Analysis ProjectRuss Giesy Marvin HoekemaMary Sowerby Pat MillerAndy Andreasen Lane ElyTravis Seawright Chris VannMichelle Walter
Florida Dairy Check-Off

Presentation objectivesPresentation objectives•• Overview of projectOverview of project•• Financial performance comparison between Financial performance comparison between
Florida and Georgia dairies.Florida and Georgia dairies.•• Comparison between regionsComparison between regions•• Financial constraints and opportunitiesFinancial constraints and opportunities•• Management strategies to increase financial Management strategies to increase financial
performanceperformance

Credit policy of the new millenniumCredit policy of the new millennium
We will gladly extend credit to anyone over We will gladly extend credit to anyone over
the age of 87 accompanied by both of their the age of 87 accompanied by both of their
parentsparents


Dairy Business Analysis ProjectDairy Business Analysis Project--DescriptionDescription•• PurposePurpose: Improve the financial performance : Improve the financial performance
of participating dairies.of participating dairies.•• ScopeScope: Collect complete information which : Collect complete information which
includes balance sheet, income statement, includes balance sheet, income statement, statement of owner’s equity, and statement of statement of owner’s equity, and statement of cashflows. Data is validated and verified.cashflows. Data is validated and verified.
•• ParticipantsParticipants: 56 dairies submitted 1998 fiscal : 56 dairies submitted 1998 fiscal year information.year information.
•• OutlookOutlook: A large increase in participants is : A large increase in participants is anticipated due to collaboration efforts in both anticipated due to collaboration efforts in both Florida and Georgia.Florida and Georgia.

Revenue and expense categoriesRevenue and expense categories•• Milk salesMilk sales•• Cow salesCow sales•• Heifer and calf salesHeifer and calf sales•• Other livestockOther livestock•• CropsCrops•• Government receiptsGovernment receipts•• OtherOther
•• PersonnelPersonnel•• Purchased feedPurchased feed•• CropsCrops•• MachineryMachinery•• LivestockLivestock•• Milk marketingMilk marketing•• Real estateReal estate•• OtherOther•• DepreciationDepreciation
All are accrual adjusted for All are accrual adjusted for changes on the balance sheetchanges on the balance sheet

Balance sheet categoriesBalance sheet categories•• Farm cashFarm cash•• Feed and suppliesFeed and supplies•• Accounts receivableAccounts receivable•• Prepaid expensesPrepaid expenses•• Cows Cows •• HeifersHeifers•• MachineryMachinery•• Stocks and certificatesStocks and certificates•• Real estateReal estate•• BuildingsBuildings
•• Accounts payableAccounts payable•• Operating debtOperating debt•• ShortShort--term debtterm debt•• Term debtsTerm debts•• Financial leases: Financial leases:
cattle, machinery, cattle, machinery, buildings, and real buildings, and real estateestate
•• PaidPaid--inin--capitalcapital
Inventories are taken atInventories are taken atbeginning and end of yearbeginning and end of year
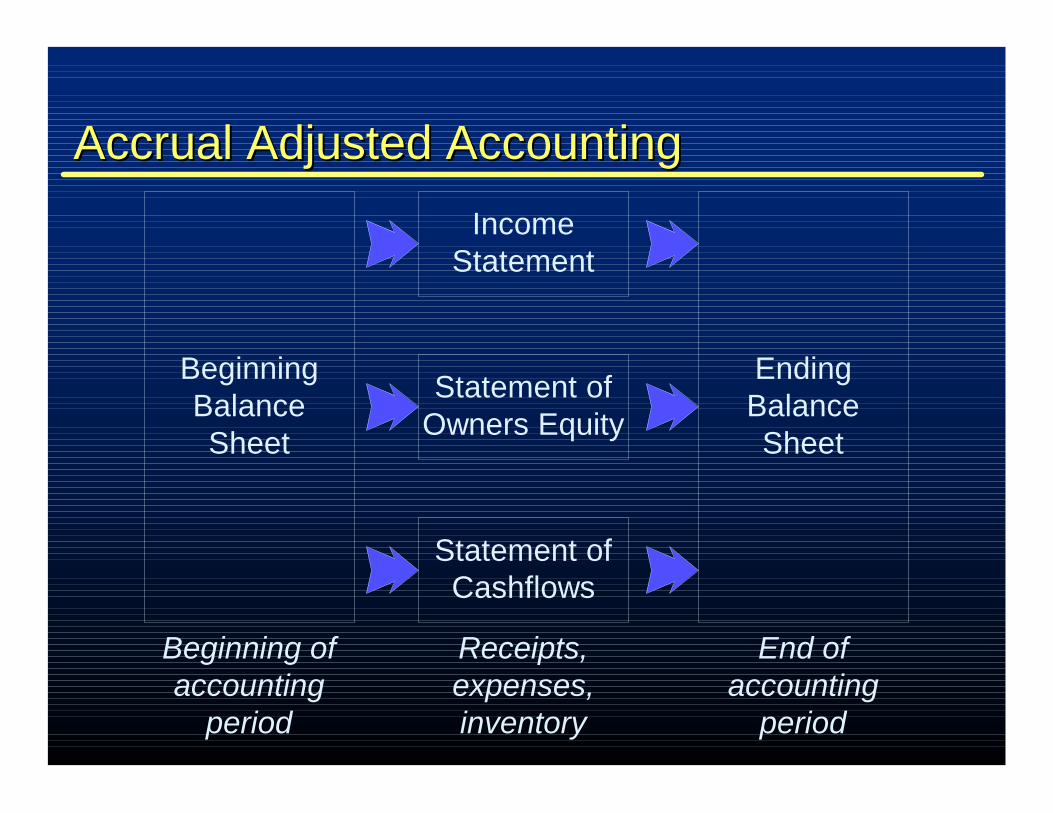
Accrual Adjusted AccountingAccrual Adjusted Accounting
BeginningBalanceSheet
IncomeStatement
Statement ofOwners Equity
Statement ofCashflows
EndingBalanceSheet
Beginning ofaccounting
period
Receipts,expenses,inventory
End ofaccounting
period

Objectives of dairy analysis reportsObjectives of dairy analysis reports•• Collect complete financial data (balance Collect complete financial data (balance
sheet, income statement, sheet, income statement, cashflowcashflow, equity)., equity).•• Information is verified and analyzed for Information is verified and analyzed for
completeness.completeness.•• Each dairy receives a report comparing Each dairy receives a report comparing
performance to other project dairies.performance to other project dairies.•• Opportunity areas are identified which are Opportunity areas are identified which are
specific to each business.specific to each business.•• FollowFollow--up consulting is encouraged.up consulting is encouraged.•• All information is kept in strict confidence.All information is kept in strict confidence.
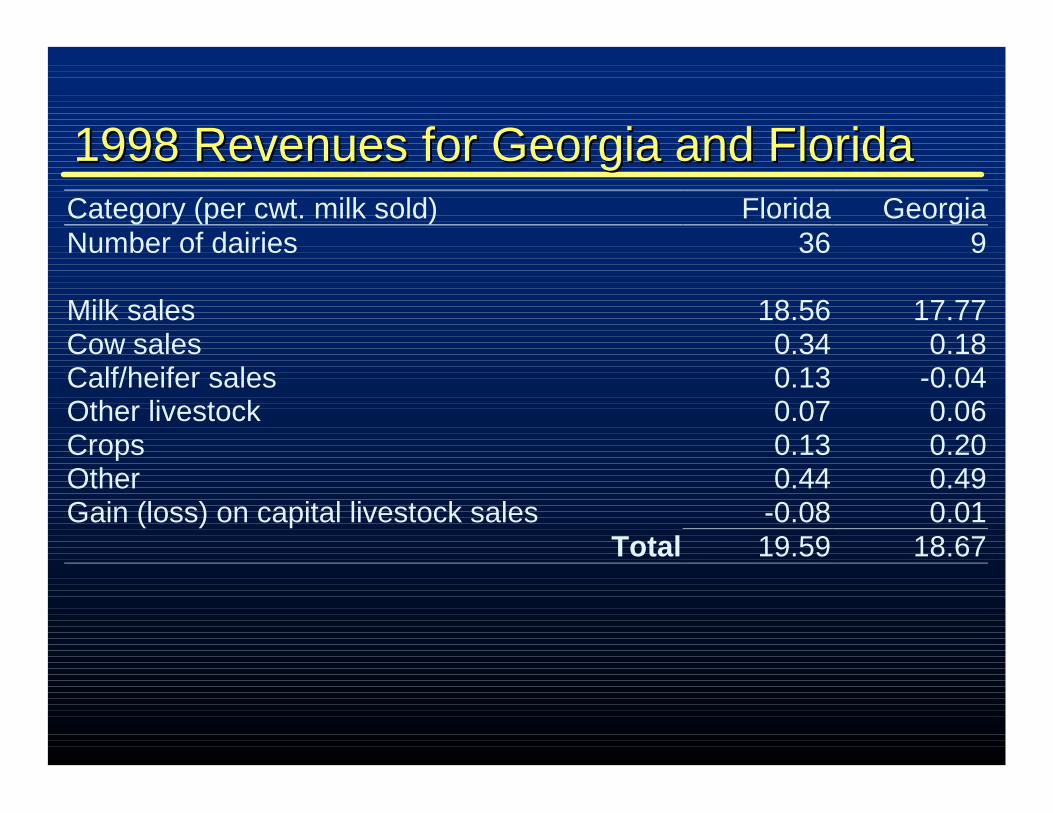
1998 Revenues for Georgia and Florida1998 Revenues for Georgia and FloridaCategory (per cwt. milk sold) Florida GeorgiaNumber of dairies 36 9
Milk sales 18.56 17.77Cow sales 0.34 0.18Calf/heifer sales 0.13 -0.04Other livestock 0.07 0.06Crops 0.13 0.20Other 0.44 0.49Gain (loss) on capital livestock sales -0.08 0.01
Total 19.59 18.67
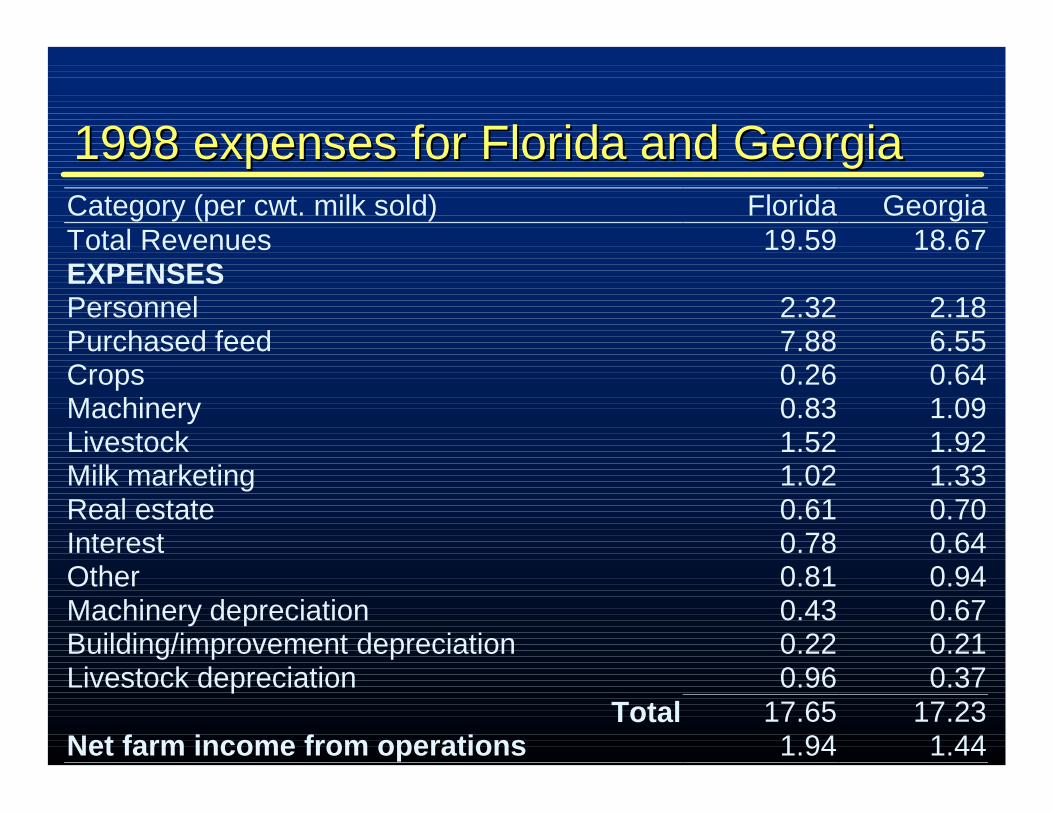
1998 expenses for Florida and Georgia1998 expenses for Florida and GeorgiaCategory (per cwt. milk sold) Florida GeorgiaTotal Revenues 19.59 18.67EXPENSESPersonnel 2.32 2.18Purchased feed 7.88 6.55Crops 0.26 0.64Machinery 0.83 1.09Livestock 1.52 1.92Milk marketing 1.02 1.33Real estate 0.61 0.70Interest 0.78 0.64Other 0.81 0.94Machinery depreciation 0.43 0.67Building/improvement depreciation 0.22 0.21Livestock depreciation 0.96 0.37
Total 17.65 17.23Net farm income from operations 1.94 1.44

1998 descriptive statistics 1998 descriptive statistics for Florida and Georgiafor Florida and Georgia
Category (per cwt. milk sold) Florida GeorgiaNumber of dairies 36 9Number of cows 914 596Number of heifers 496 219Milk sold per cow (pounds) 16,198 18,595Cull rate 38% 39%Cows per worker 56 52Milk sold per worker 886,849 950,913
Average total assets per cow $3,895 $5,045Average total liabilities per cow $1,574 $1,431
Rate of return on assets 9% 5%Operating profit margin 9% 6%Asset turnover ratio 0.95 1.04
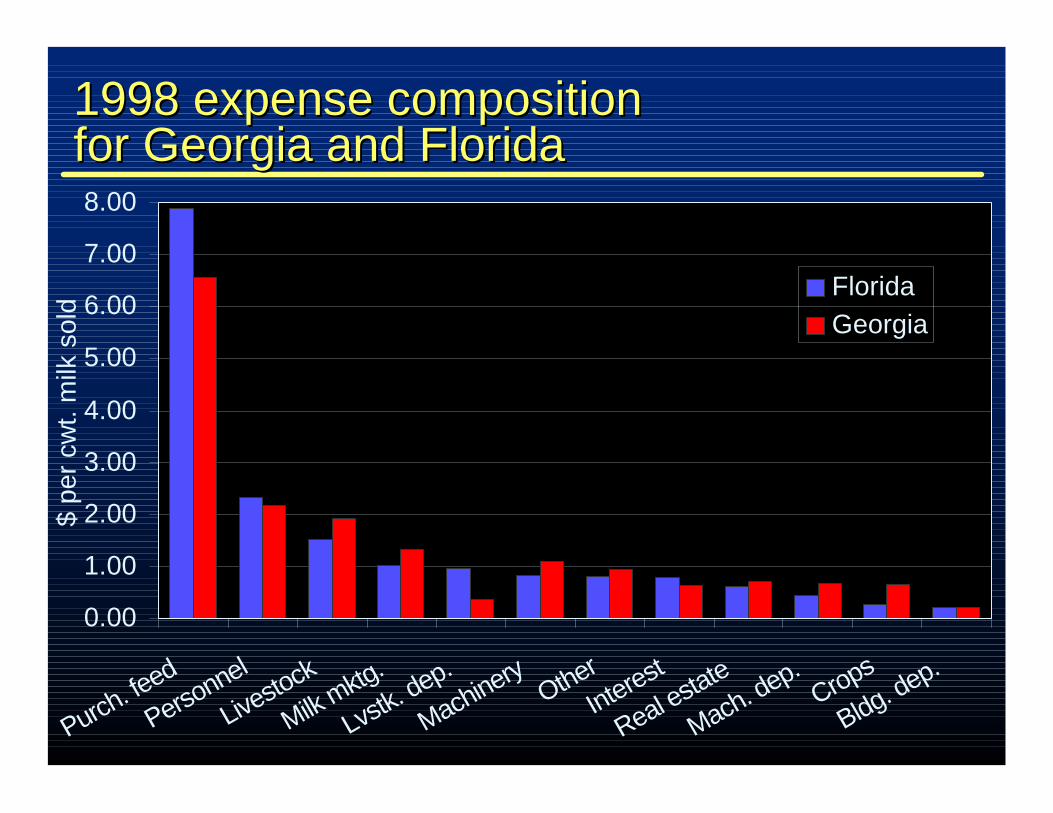
1998 expense composition 1998 expense composition for Georgia and Floridafor Georgia and Florida
0.00
1.00
2.00
3.00
4.00
5.00
6.00
7.00
8.00
Purch. fe
ed
Personnel
Livestock
Milk mktg.
Lvstk. dep.
MachineryOther
Interest
Real estate
Mach. dep.Crops
Bldg. dep.
$ pe
r cw
t. m
ilk s
old
FloridaGeorgia

Year ended 1998 per cow asset Year ended 1998 per cow asset composition for Florida and Georgiacomposition for Florida and Georgia
-
250
500
750
1,000
1,250
1,500
1,750
2,000
Livestock
Mach./equip.
Bldg./imprv.
Real estateOther
$ pe
r cow
FloridaGeorgia

Year ended 1998 per cow liability Year ended 1998 per cow liability composition for Florida and Georgiacomposition for Florida and Georgia
-
250
500
750
1,000
1,250
1,500
Accountspayable
Operating Short term Capitallease
Notespayable
$ pe
r cow
FloridaGeorgia

ObservationsObservations•• Total revenues for Florida project dairies Total revenues for Florida project dairies
(19.59 per cwt. milk sold) were $0.92 higher (19.59 per cwt. milk sold) were $0.92 higher than for Georgia project dairies ($18.67).than for Georgia project dairies ($18.67).
•• Total expenses for Florida project dairies Total expenses for Florida project dairies ($17.65 per cwt. milk sold) were higher than ($17.65 per cwt. milk sold) were higher than Georgia project dairies ($17.23). Georgia project dairies ($17.23).
•• Georgia project dairies sold substantially Georgia project dairies sold substantially more milk per cow (18,595 pounds) when more milk per cow (18,595 pounds) when compared to Florida (16,198 pounds).compared to Florida (16,198 pounds).

ObservationsObservations--continuedcontinued•• Differences between milk marketing areas Differences between milk marketing areas
determined most of the $0.50 difference in net determined most of the $0.50 difference in net farm income from operations ($1.94 per cwt. farm income from operations ($1.94 per cwt. milk sold for Florida and $1.44 for Georgia).milk sold for Florida and $1.44 for Georgia).
•• Capital structure differences were also Capital structure differences were also substantial as Georgia ($5,045) had higher substantial as Georgia ($5,045) had higher average total assets per cow than did Florida average total assets per cow than did Florida ($3,895).($3,895).
•• Georgia project dairies had less average total Georgia project dairies had less average total liabilities per cow ($1,431) compared to liabilities per cow ($1,431) compared to Florida ($1,574).Florida ($1,574).

North GA
South GA
West FLNorth FL
Central FL
South FL
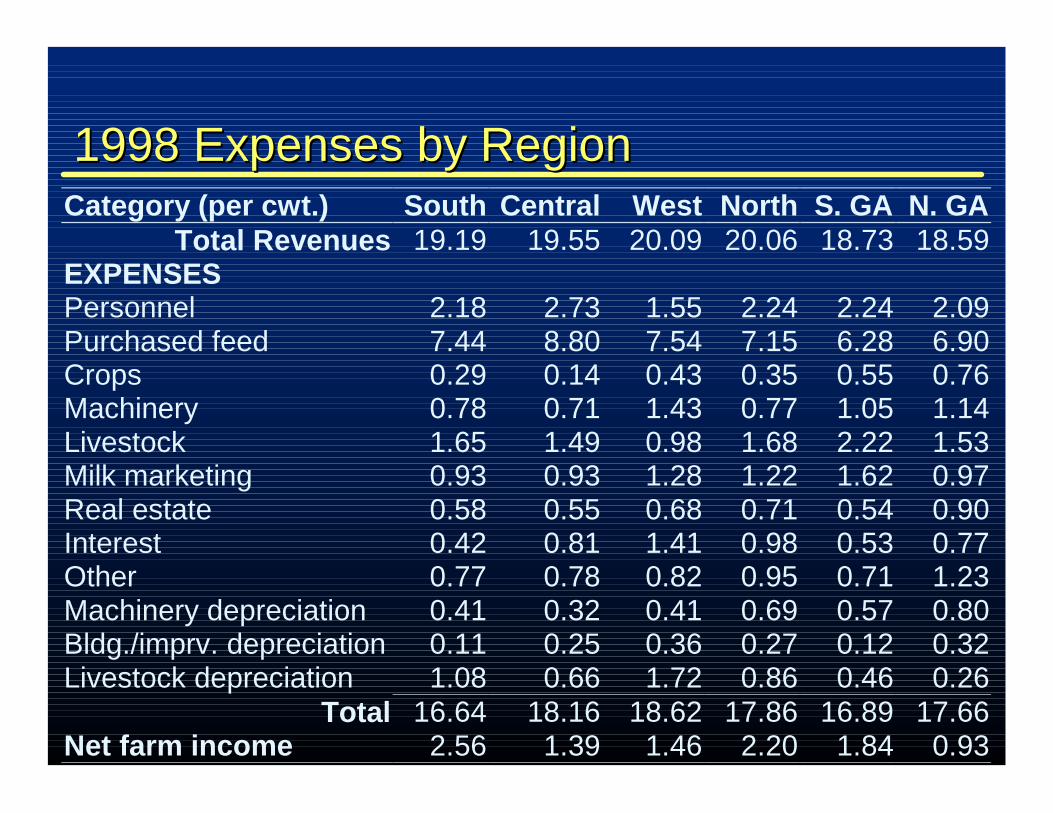
1998 Expenses by Region1998 Expenses by RegionCategory (per cwt.) South Central West North S. GA N. GA
Total Revenues 19.19 19.55 20.09 20.06 18.73 18.59EXPENSESPersonnel 2.18 2.73 1.55 2.24 2.24 2.09Purchased feed 7.44 8.80 7.54 7.15 6.28 6.90Crops 0.29 0.14 0.43 0.35 0.55 0.76Machinery 0.78 0.71 1.43 0.77 1.05 1.14Livestock 1.65 1.49 0.98 1.68 2.22 1.53Milk marketing 0.93 0.93 1.28 1.22 1.62 0.97Real estate 0.58 0.55 0.68 0.71 0.54 0.90Interest 0.42 0.81 1.41 0.98 0.53 0.77Other 0.77 0.78 0.82 0.95 0.71 1.23Machinery depreciation 0.41 0.32 0.41 0.69 0.57 0.80Bldg./imprv. depreciation 0.11 0.25 0.36 0.27 0.12 0.32Livestock depreciation 1.08 0.66 1.72 0.86 0.46 0.26
Total 16.64 18.16 18.62 17.86 16.89 17.66Net farm income 2.56 1.39 1.46 2.20 1.84 0.93

1998 Selected Financial Performance 1998 Selected Financial Performance Statistics by RegionStatistics by Region
Category South Central West North S. GA N. GANumber of cows 1,056 1,136 335 591 854 274Number of heifers 452 738 157 318 213 226Milk sold per cow 15,134 17,664 13,483 16,850 17,947 19,406Cull rate 40% 36% 35% 41% 38% 41%Cows per worker 67 46 69 48 59 44Milk sold perworker 1,016,317 792,596 915,471 823,588 1,036,485 843,948
Assets per cow $2,944 $4,368 $3,931 $4,627 $3,650 $6,788Liabilities per cow $835 $1,819 $2,345 $1,947 $1,402 $1,468
Return on assets 13% 6% 6% 10% 9% 2%Profit margin 11% 7% 7% 12% 10% 2%Asset turnoverratio 1.12 0.97 0.73 0.77 1.19 0.86

1998 Revenues and expenses by region1998 Revenues and expenses by region
16.00
17.00
18.00
19.00
20.00
21.00
South Central West North S.Georgia
N.Georgia
per c
wt.
milk
sol
d
2.00
1.00
0.00
1.00
2.00
3.00
Net
farm
inco
me
per c
wt.
milk
sol
d
Total revenues Total expenses Net farm income

1998 financial performance 1998 financial performance factors by regionfactors by region
0
1,000
2,000
3,000
4,000
5,000
6,000
7,000
8,000
South Central West North S.Georgia
N.Georgia
$ pe
r cow
0%
2%
4%
6%
8%
10%
12%
14%Liabilities per cow Assets per cow ROA Profit margin

South Florida region highlightsSouth Florida region highlights•• Highest net farm income from operations per Highest net farm income from operations per
cwt. milk sold ($2.56).cwt. milk sold ($2.56).•• Highest milk price $18.87 per cwt.Highest milk price $18.87 per cwt.•• Lowest total expenses of $16.64 per cwt. milk Lowest total expenses of $16.64 per cwt. milk
sold.sold.•• Lowest in interest ($0.42), milk marketing Lowest in interest ($0.42), milk marketing
($0.93), and building/improvement depreciation ($0.93), and building/improvement depreciation ($0.11).($0.11).
•• Average total assets per cow lowest among Average total assets per cow lowest among regions ($2,944).regions ($2,944).
•• Lowest average total liabilities per cow ($835).Lowest average total liabilities per cow ($835).•• Second lowest milk sold per cow (15,134 Second lowest milk sold per cow (15,134
pounds).pounds).

South Georgia region highlightsSouth Georgia region highlights•• Second lowest total expenses ($16.89 per Second lowest total expenses ($16.89 per
cwt. milk sold).cwt. milk sold).•• Lowest purchased feed expense ($6.28 per Lowest purchased feed expense ($6.28 per
cwt. milk sold).cwt. milk sold).•• Second highest milk sold per cow (17,947 Second highest milk sold per cow (17,947
pounds).pounds).•• Highest milk sold per worker (1.04 million Highest milk sold per worker (1.04 million
pounds)pounds)•• Highest asset turnover ratio (1.19)Highest asset turnover ratio (1.19)

North Florida region highlightsNorth Florida region highlights•• Second highest net farm income ($2.20 per Second highest net farm income ($2.20 per
cwt. milk sold).cwt. milk sold).•• Highest operating profit margin (12%)Highest operating profit margin (12%)•• Not particularly high in any expense category Not particularly high in any expense category
nor particularly low.nor particularly low.

Central Florida region highlightsCentral Florida region highlights•• Highest purchased feed expense ($8.80 per Highest purchased feed expense ($8.80 per
cwt. milk sold).cwt. milk sold).•• Lowest crop, real estate, and machinery Lowest crop, real estate, and machinery
expensesexpenses--indicative of less intensive indicative of less intensive cropping enterprise.cropping enterprise.
•• Largest average herd size (1,136 cows).Largest average herd size (1,136 cows).•• Lowest cull rate (36%).Lowest cull rate (36%).•• Moderate operating profit margin (7%).Moderate operating profit margin (7%).

West region highlightsWest region highlights•• Lowest milk sold per cow (13,483 pounds).Lowest milk sold per cow (13,483 pounds).•• Machinery, interest, and livestock expenses Machinery, interest, and livestock expenses
were highest among regions.were highest among regions.•• Personnel expense was lowest among Personnel expense was lowest among
regions ($1.55 per cwt.).regions ($1.55 per cwt.).•• Purchased feed expense was second highest Purchased feed expense was second highest
($7.54)($7.54)•• Average total liabilities per cow was highest Average total liabilities per cow was highest
among regions ($2,345 per cow).among regions ($2,345 per cow).

North Georgia region highlightsNorth Georgia region highlights•• Lowest net farm income from operations Lowest net farm income from operations
($0.93 per cwt. milk sold).($0.93 per cwt. milk sold).•• Small sample size (n=4)Small sample size (n=4)•• Operating profit margin lowest among regions Operating profit margin lowest among regions
(2%).(2%).•• Highest crop, real estate, and machinery Highest crop, real estate, and machinery
expenses.expenses.•• Highest milk sold per cow (19,046 pounds).Highest milk sold per cow (19,046 pounds).•• Low purchased feed expense ($6.90 per cwt. Low purchased feed expense ($6.90 per cwt.
milk sold).milk sold).
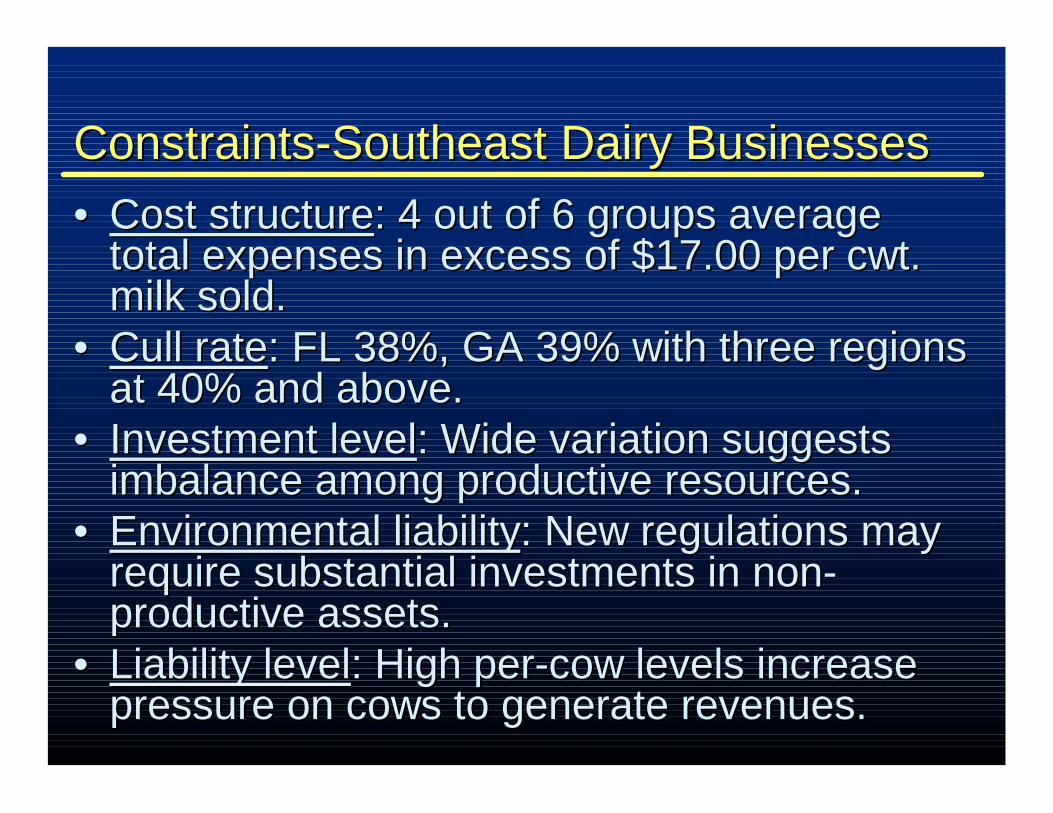
ConstraintsConstraints--Southeast Dairy BusinessesSoutheast Dairy Businesses•• Cost structureCost structure: 4 out of 6 groups average : 4 out of 6 groups average
total expenses in excess of $17.00 per cwt. total expenses in excess of $17.00 per cwt. milk sold.milk sold.
•• Cull rateCull rate: FL 38%, GA 39% with three regions : FL 38%, GA 39% with three regions at 40% and above.at 40% and above.
•• Investment levelInvestment level: Wide variation suggests : Wide variation suggests imbalance among productive resources.imbalance among productive resources.
•• Environmental liabilityEnvironmental liability: New regulations may : New regulations may require substantial investments in nonrequire substantial investments in non--productive assets.productive assets.
•• Liability levelLiability level: High per: High per--cow levels increase cow levels increase pressure on cows to generate revenues.pressure on cows to generate revenues.
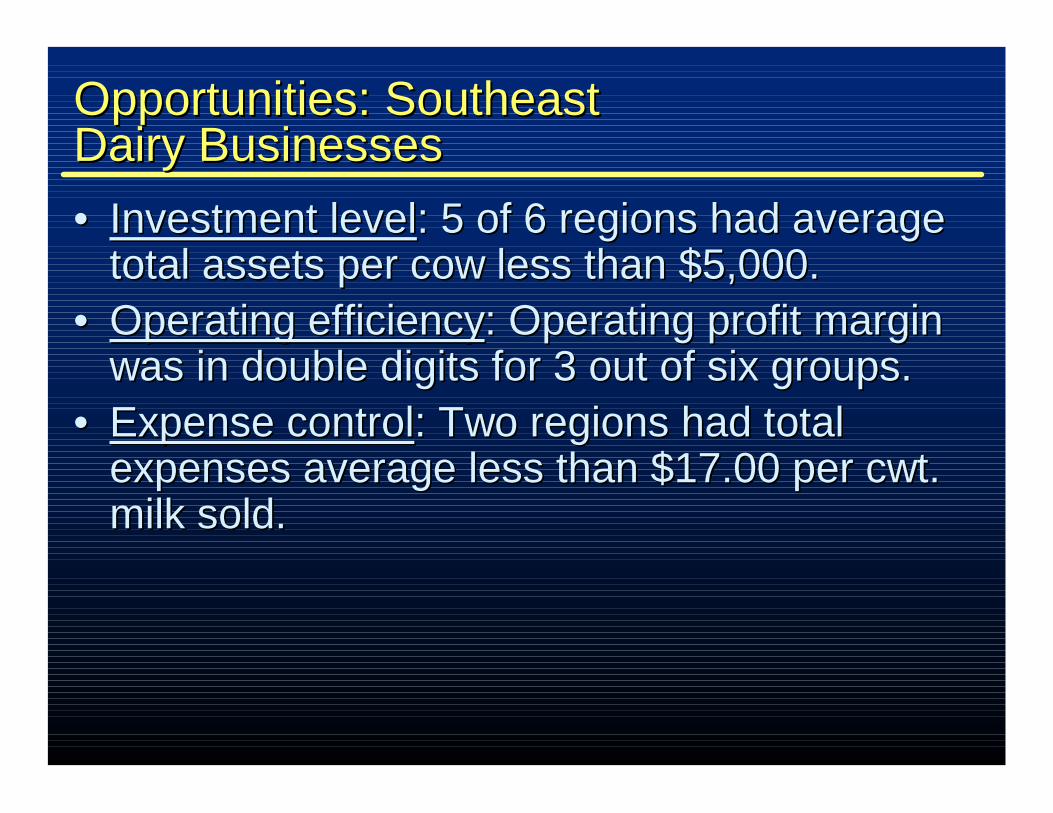
Opportunities: Southeast Opportunities: Southeast Dairy BusinessesDairy Businesses•• Investment levelInvestment level: 5 of 6 regions had average : 5 of 6 regions had average
total assets per cow less than $5,000.total assets per cow less than $5,000.•• Operating efficiencyOperating efficiency: Operating profit margin : Operating profit margin
was in double digits for 3 out of six groups.was in double digits for 3 out of six groups.•• Expense controlExpense control: Two regions had total : Two regions had total
expenses average less than $17.00 per cwt. expenses average less than $17.00 per cwt. milk sold. milk sold.

Take home messagesTake home messages•• Continue focus on improving cow comfort. Continue focus on improving cow comfort.
This has implications on:This has implications on:–– Cull rateCull rate–– Feeding efficiencyFeeding efficiency
•• Feeding efficiency was an important control Feeding efficiency was an important control point.point.
•• Make sound investments in productive Make sound investments in productive assets.assets.
•• Control of liabilities per cow can strategically Control of liabilities per cow can strategically make or break the dairymake or break the dairy
•• Milk market volatility directly impacts ability to Milk market volatility directly impacts ability to cashflow cashflow and service debt.and service debt.

The bottom lineThe bottom line
•• Grow equity in the business (profits).Grow equity in the business (profits).•• Service debt in a timely manner (profits).Service debt in a timely manner (profits).•• Make a living in the dairy business (profits).Make a living in the dairy business (profits).•• Reinvest in the business (profits).Reinvest in the business (profits).


For more informationFor more information
This and other information is available on This and other information is available on the Dairy Business Analysis Project the Dairy Business Analysis Project
website located at: website located at:
http://http://dpsdps..uflufl..eduedu/DBAP/DBAP