daimler unicredit credit conference london · contents highlights first quarter 2014 daimler...
TRANSCRIPT
UniCredit Automotive Credit Conference
Kurt SchäferVice President Treasury
Contents
Highlights First Quarter 2014
Daimler Strategy
Outlook 2014
2
Mercedes-Benz Cars
Daimler Trucks
Financing Strategy
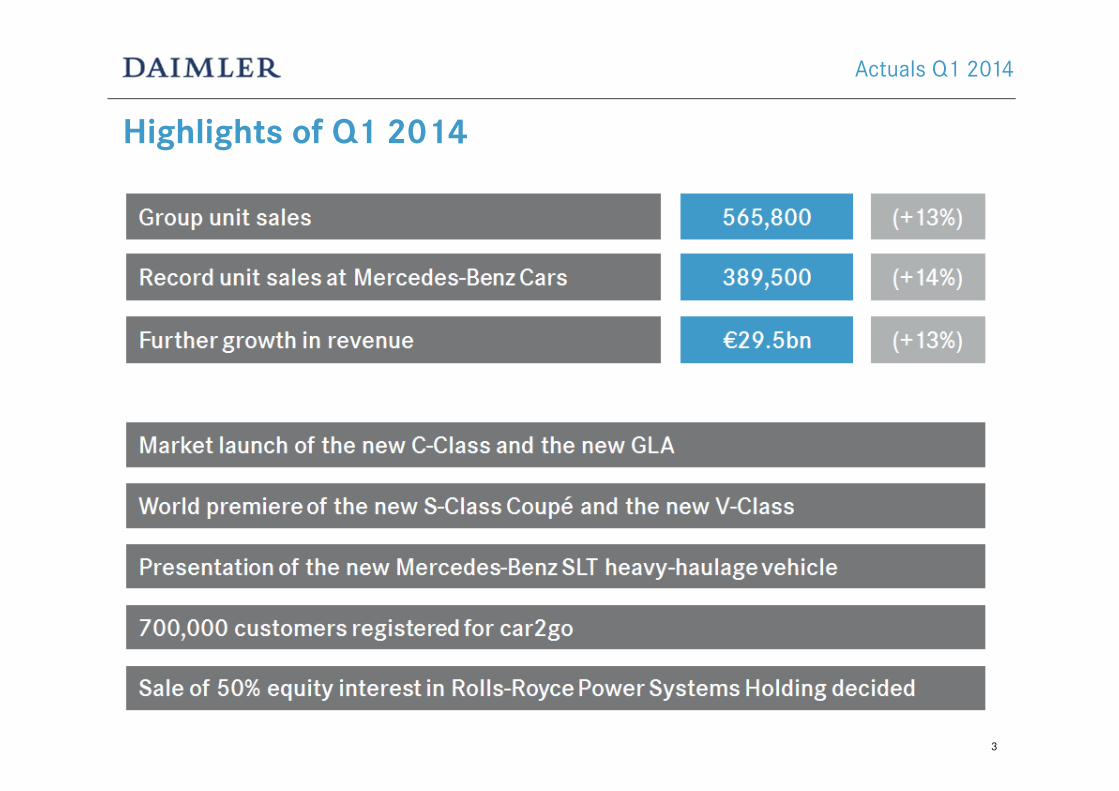
Highlights of Q1 2014
Actuals Q1 2014
3
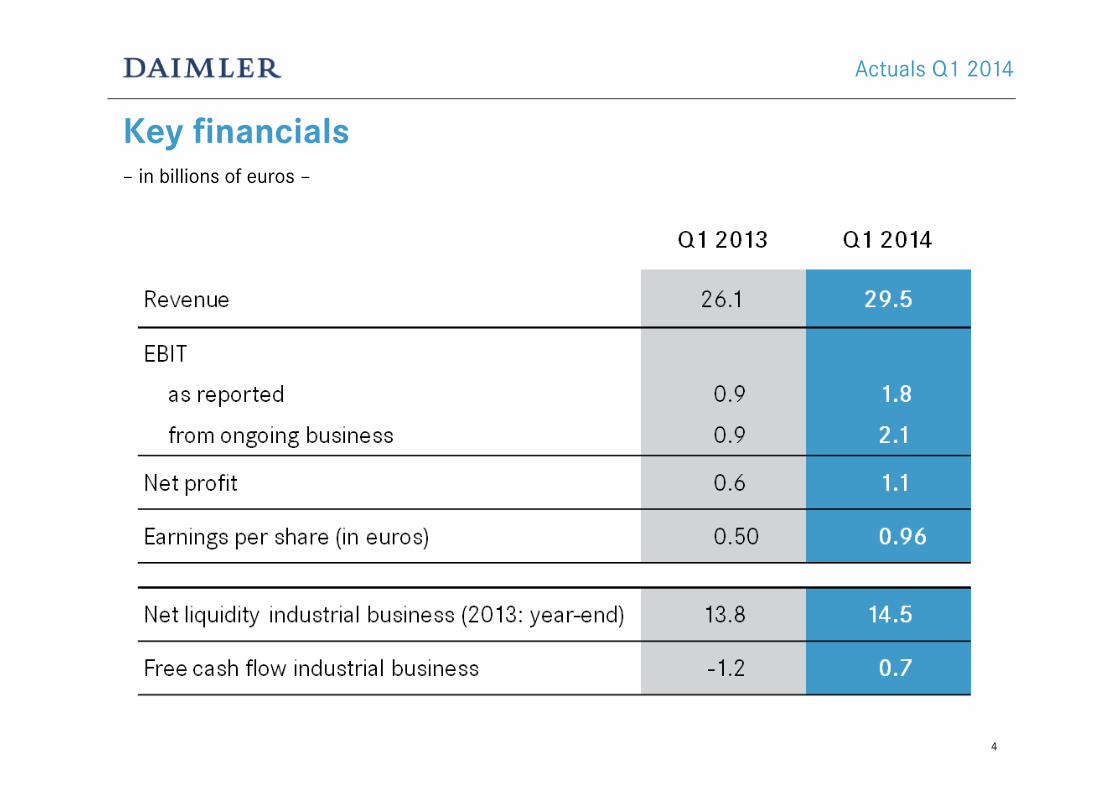
Key financials– in billions of euros –
Actuals Q1 2014
4
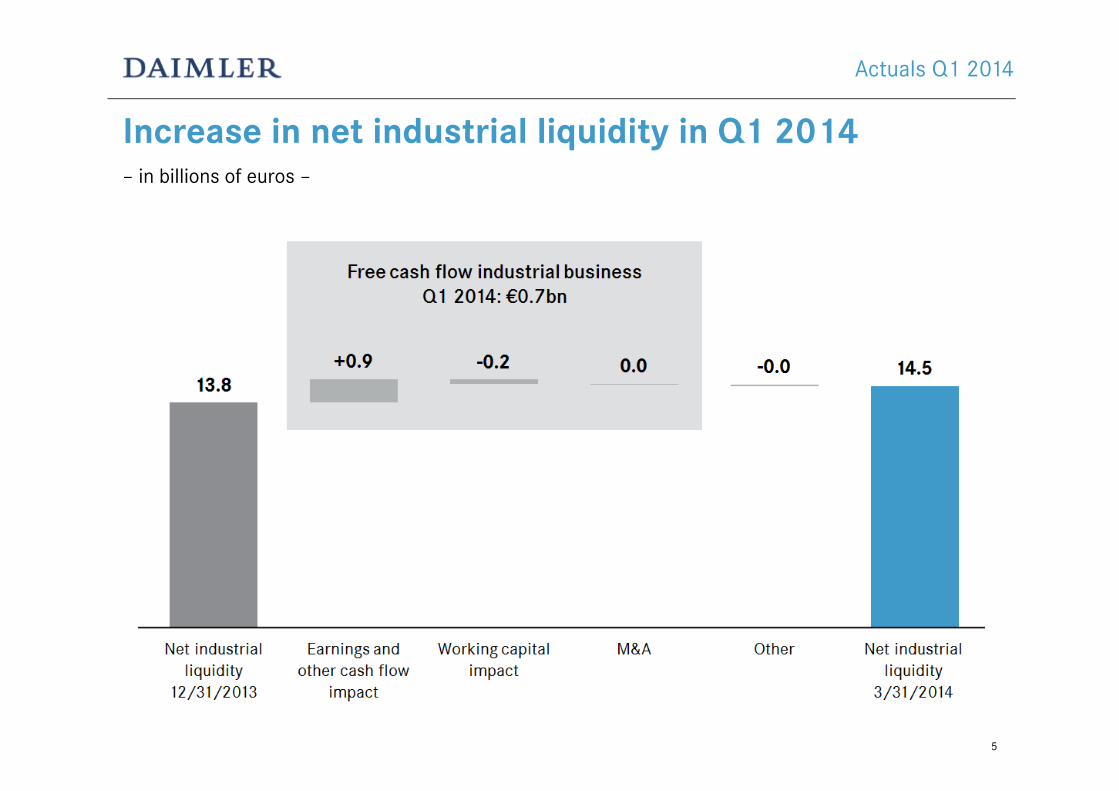
Increase in net industrial liquidity in Q1 2014– in billions of euros –
Actuals Q1 2014
5
Contents
6
Highlights First Quarter 2014
Daimler Strategy
Outlook 2014
Mercedes-Benz Cars
Daimler Trucks
Funding Strategy
7
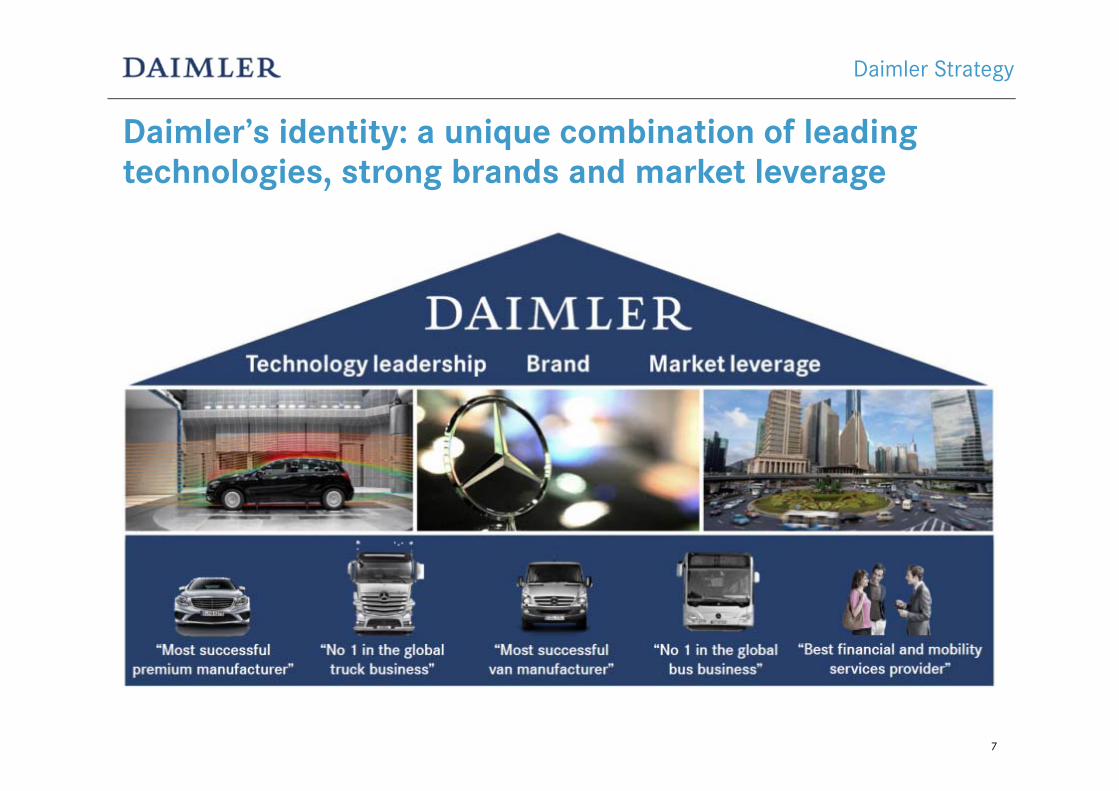
Daimler’s identity: a unique combination of leading technologies, strong brands and market leverage
Daimler Strategy
8
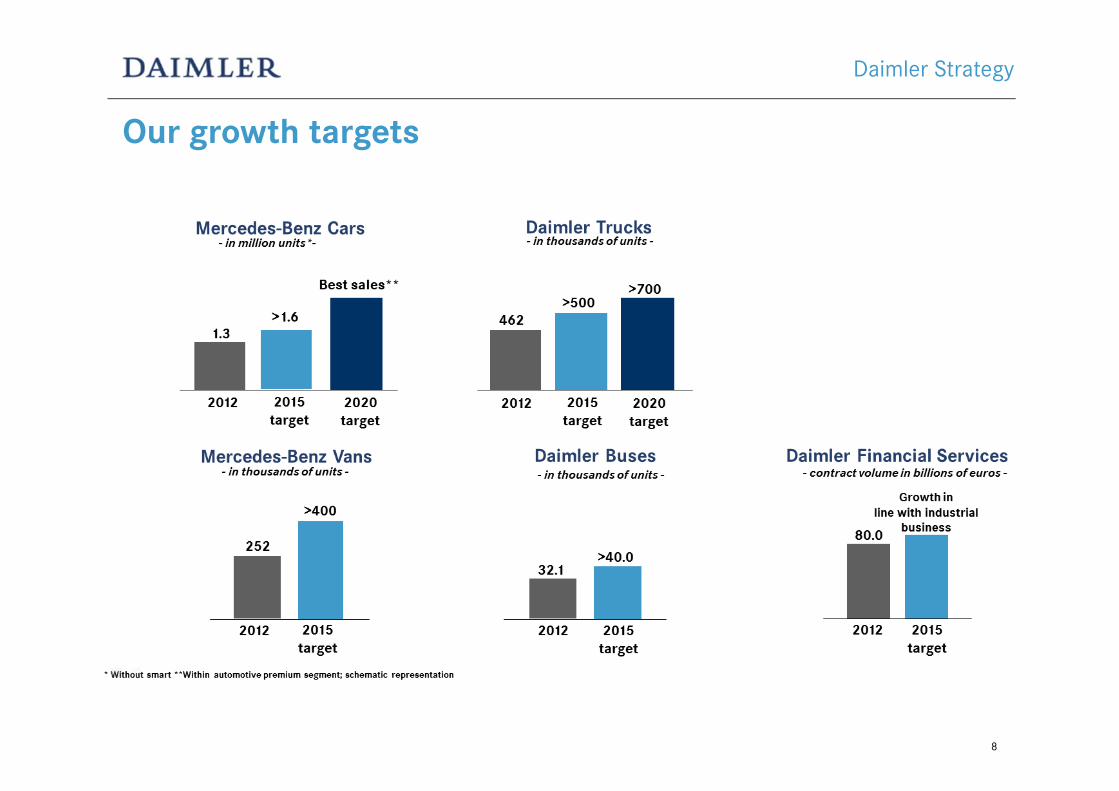
Our growth targets
Daimler Strategy
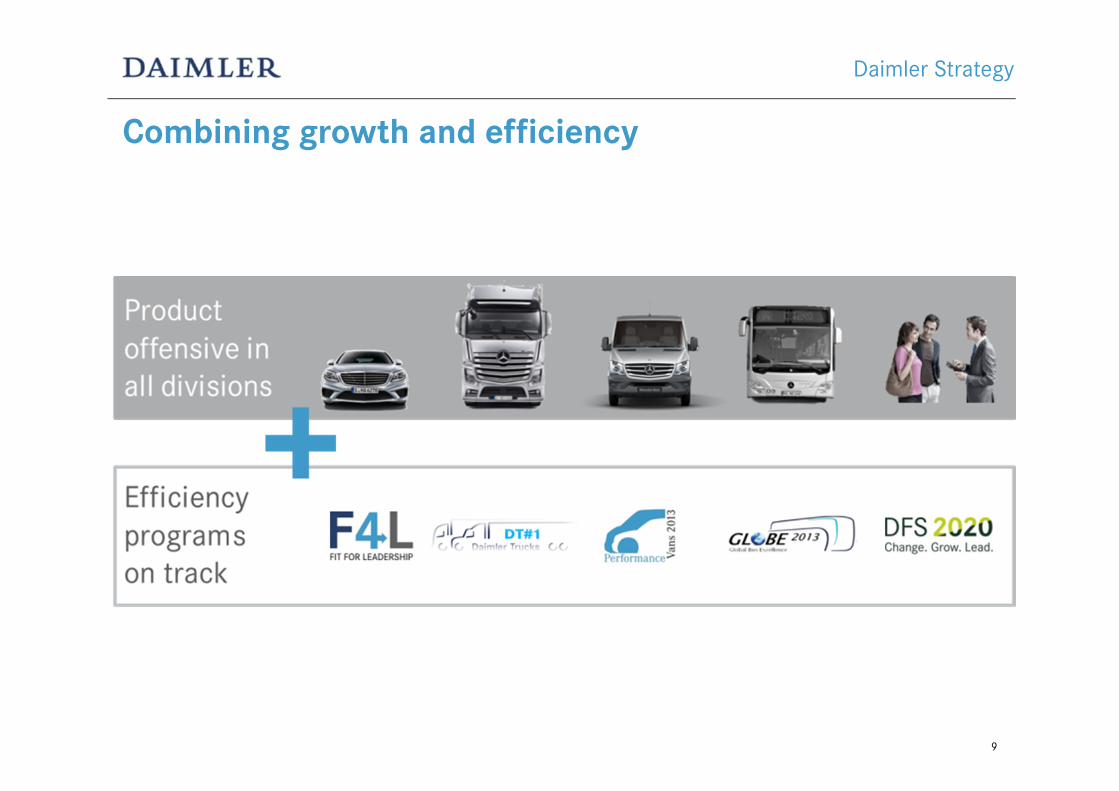
Combining growth and efficiency
9
Daimler Strategy
Contents
10
Highlights First Quarter 2014
Daimler Strategy
Outlook 2014
Mercedes-Benz Cars
Daimler Trucks
Financing Strategy
11
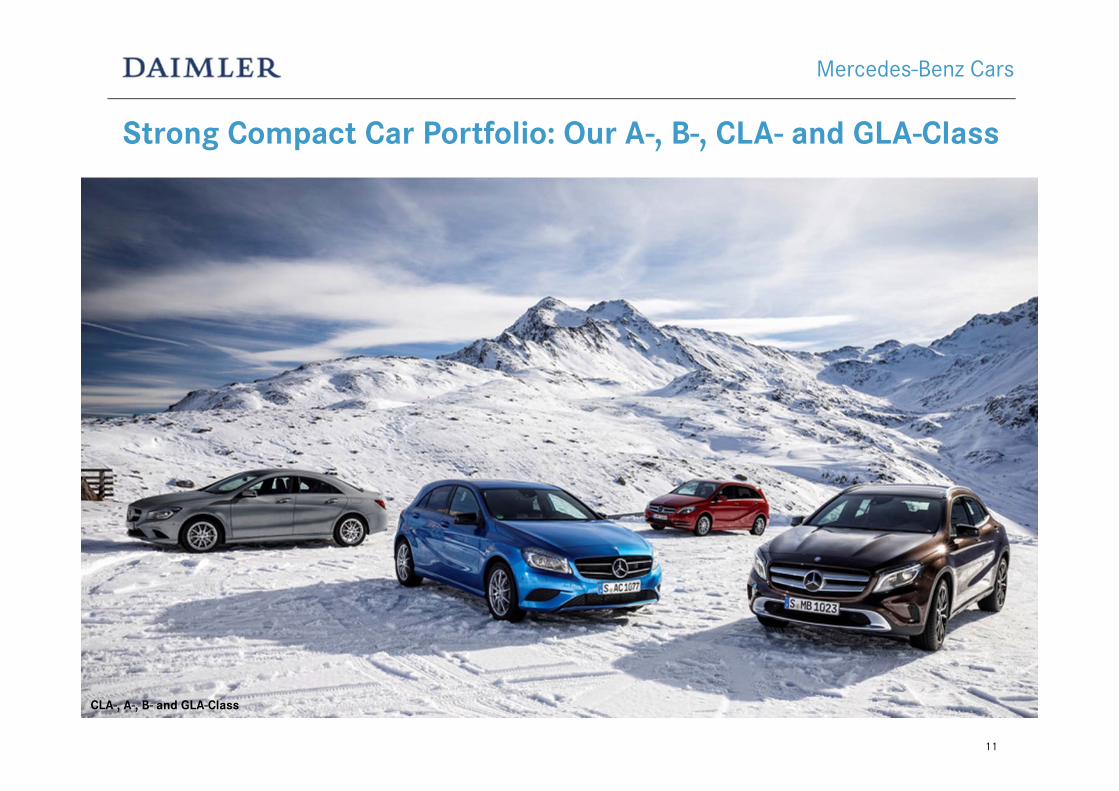
Strong Compact Car Portfolio: Our A-, B-, CLA- and GLA-Class
Mercedes-Benz Cars
A-, CLA- and B-ClassCLA-, A-, B- and GLA-Class
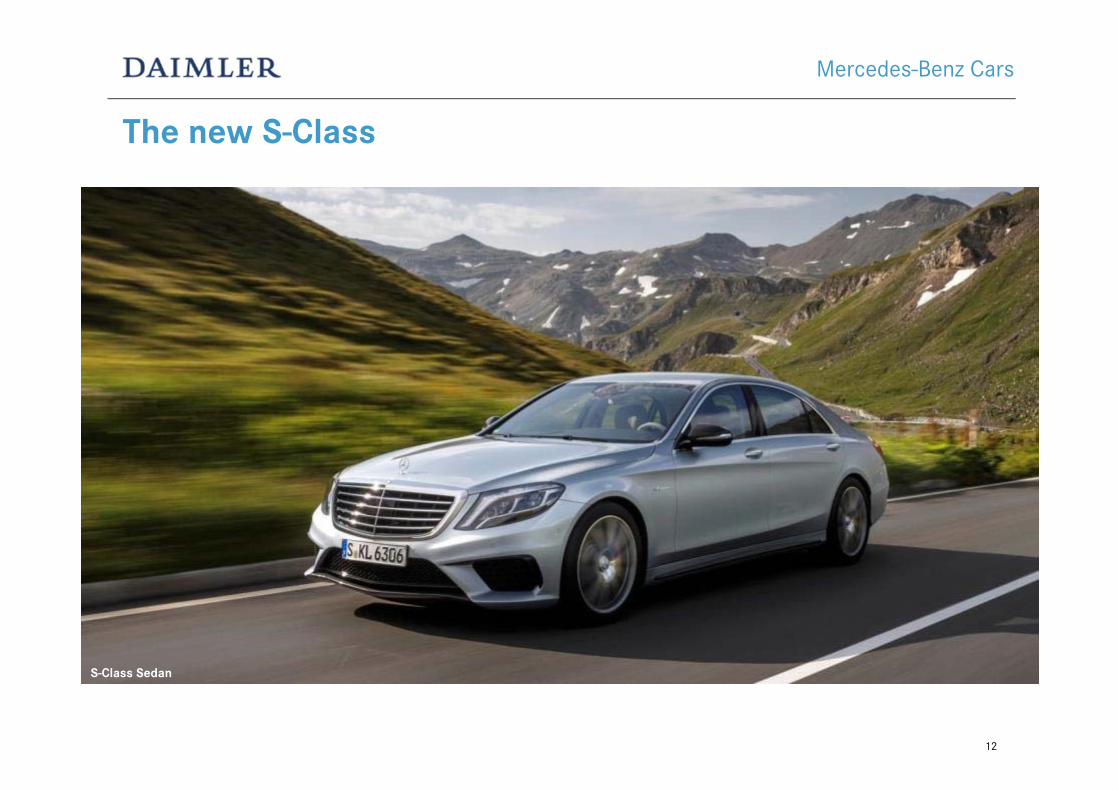
The new S-Class
12
Mercedes-Benz Cars
S-Class Sedan

13
The new S-Class Interior
Mercedes-Benz Cars
S-Class
14
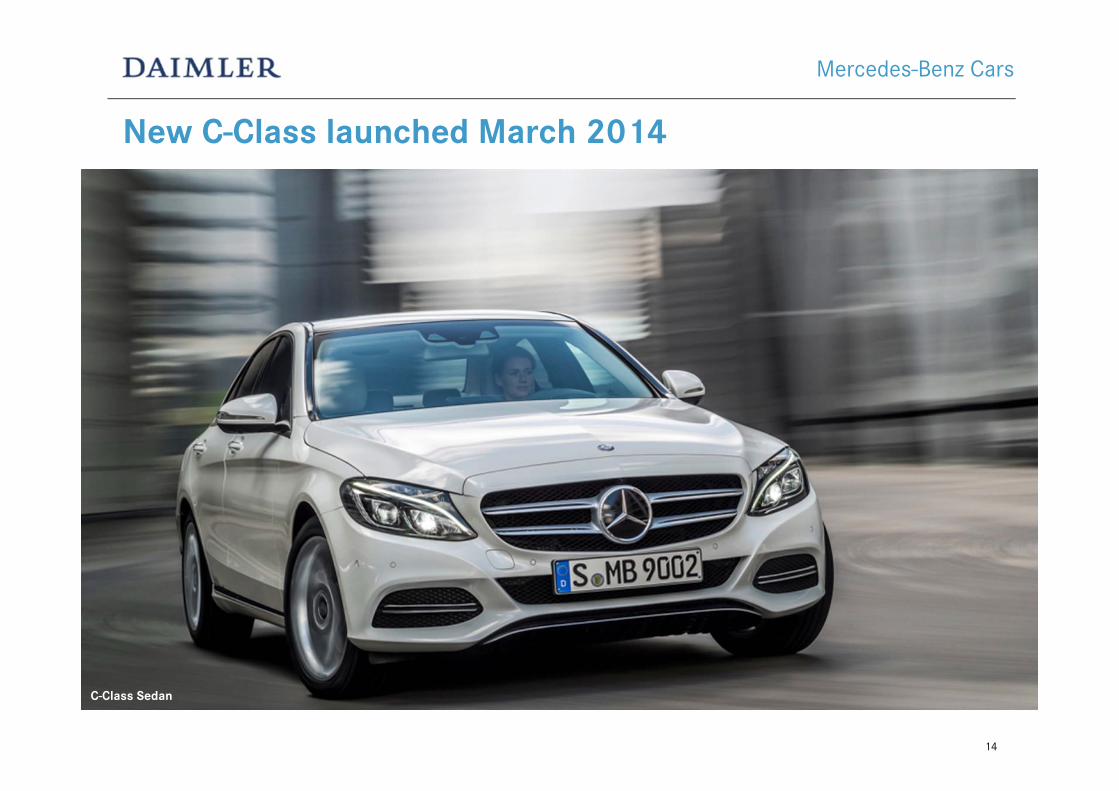
New C-Class launched March 2014
Mercedes-Benz Cars
C-Class SedanC-Class Sedan
15
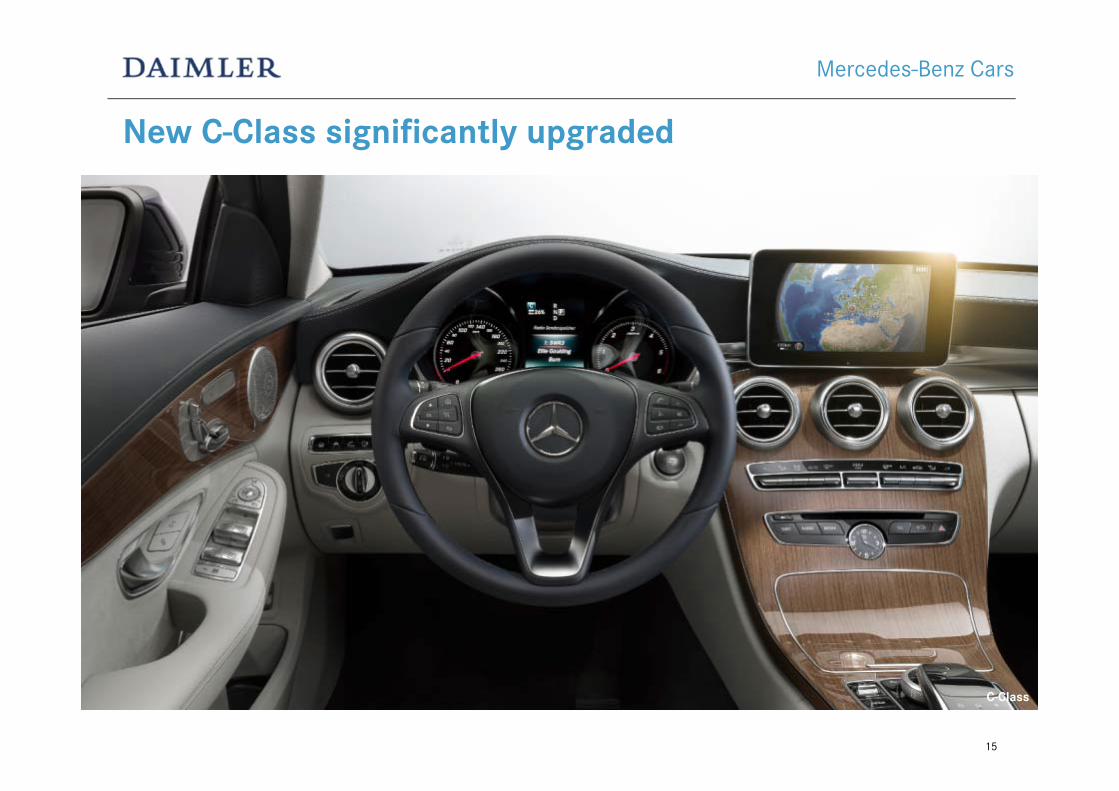
New C-Class significantly upgraded
Mercedes-Benz Cars
C-Class
16
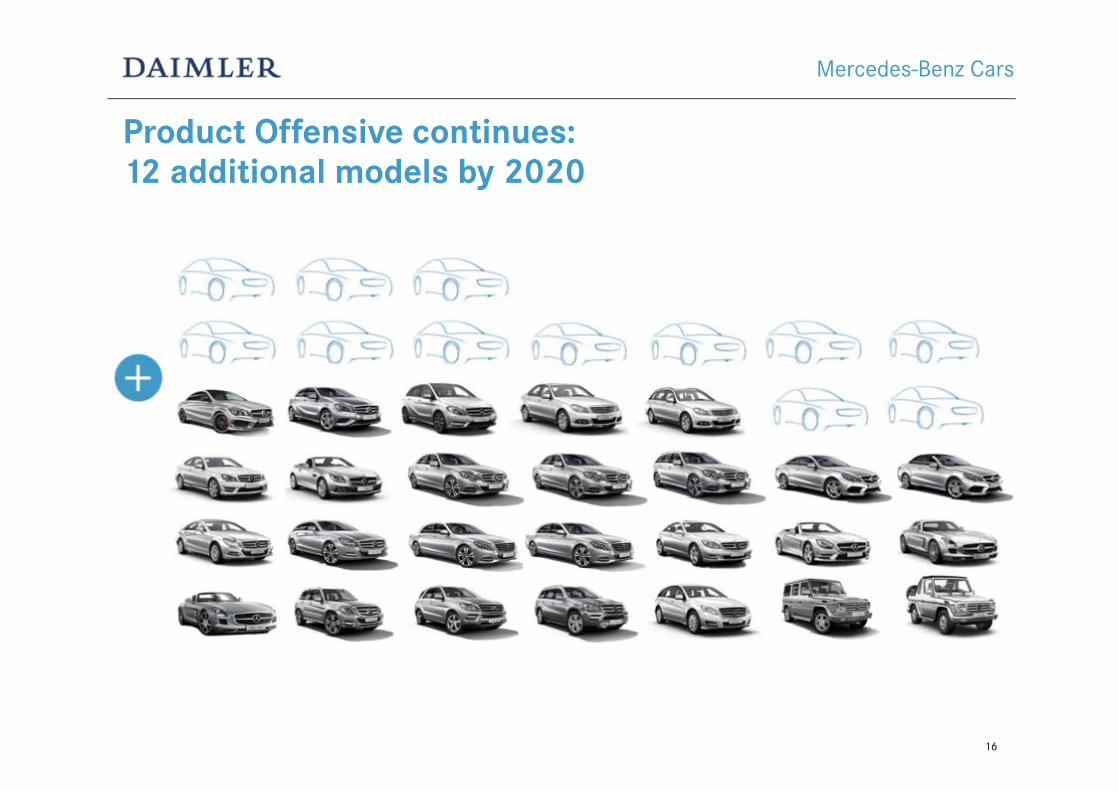
Product Offensive continues: 12 additional models by 2020
Mercedes-Benz Cars
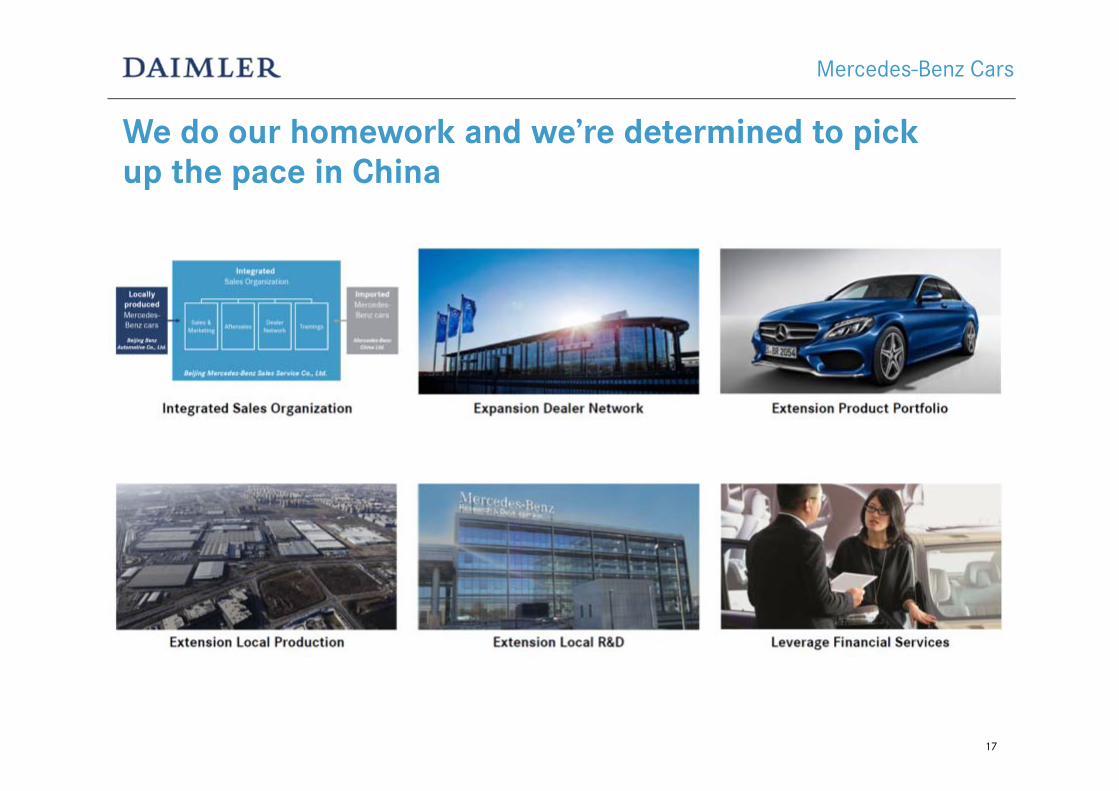
We do our homework and we’re determined to pickup the pace in China
17
Mercedes-Benz Cars
18
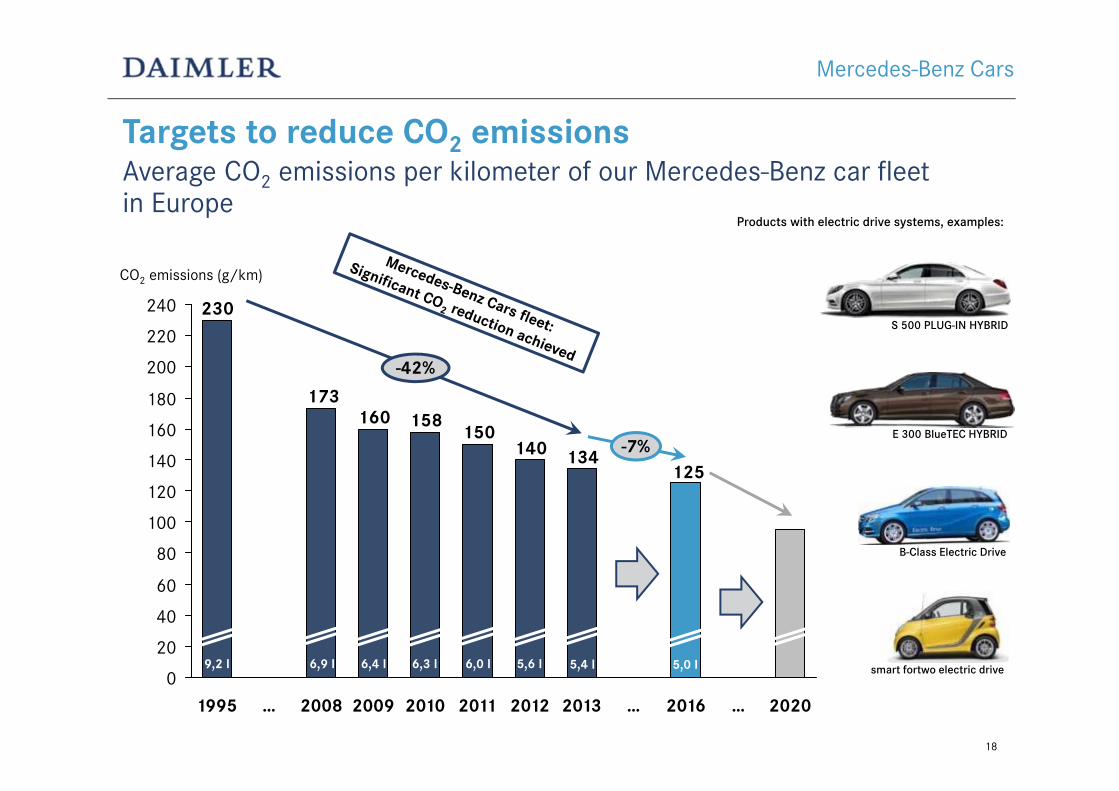
Targets to reduce CO2 emissionsAverage CO2 emissions per kilometer of our Mercedes-Benz car fleetin Europe
Mercedes-Benz Cars
125134140
150158160
173
230
0
20
40
60
80
100
120
140
160
180
200
220
240
CO2 emissions (g/km)
2020…2016…201320122011201020092008…1995
S 500 PLUG-IN HYBRID
E 300 BlueTEC HYBRID
B-Class Electric Drive
smart fortwo electric drive
Products with electric drive systems, examples:
-42%
-7%
9,2 l 6,9 l 6,4 l 6,3 l 6,0 l 5,6 l 5,0 l5,4 l
19
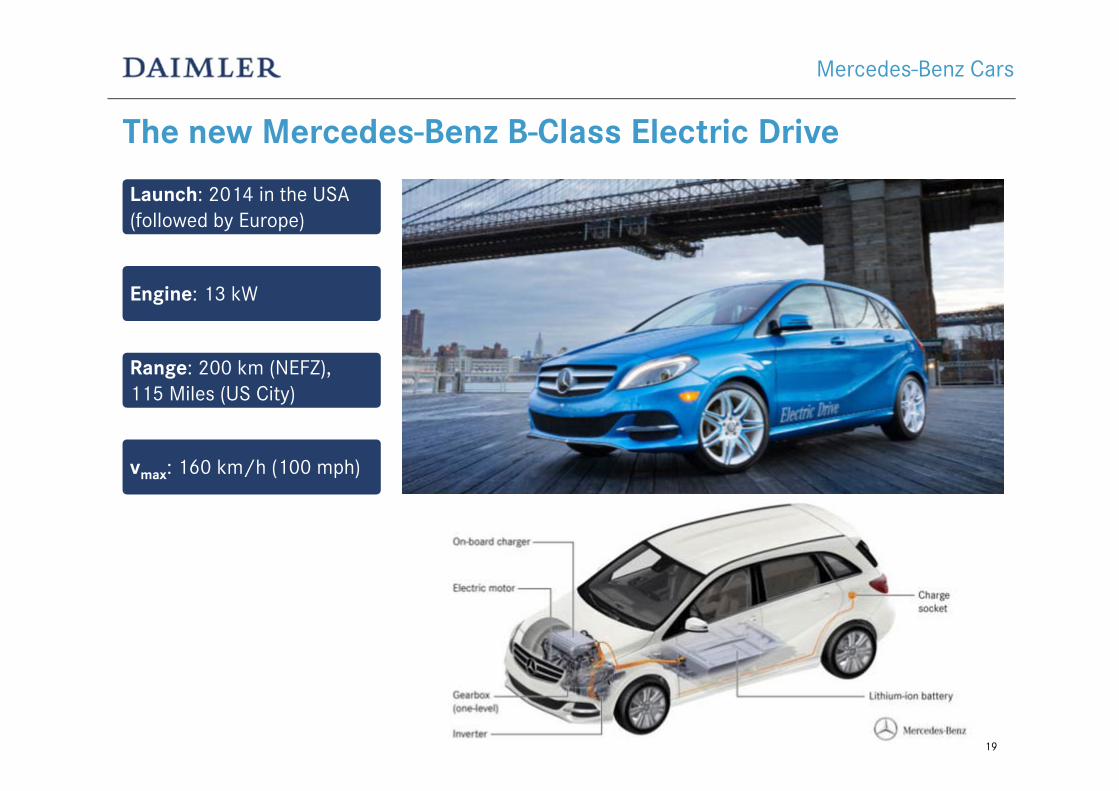
The new Mercedes-Benz B-Class Electric Drive
Mercedes-Benz Cars
Launch: 2014 in the USA (followed by Europe)
Range: 200 km (NEFZ), 115 Miles (US City)
vmax: 160 km/h (100 mph)
Engine: 13 kW
20
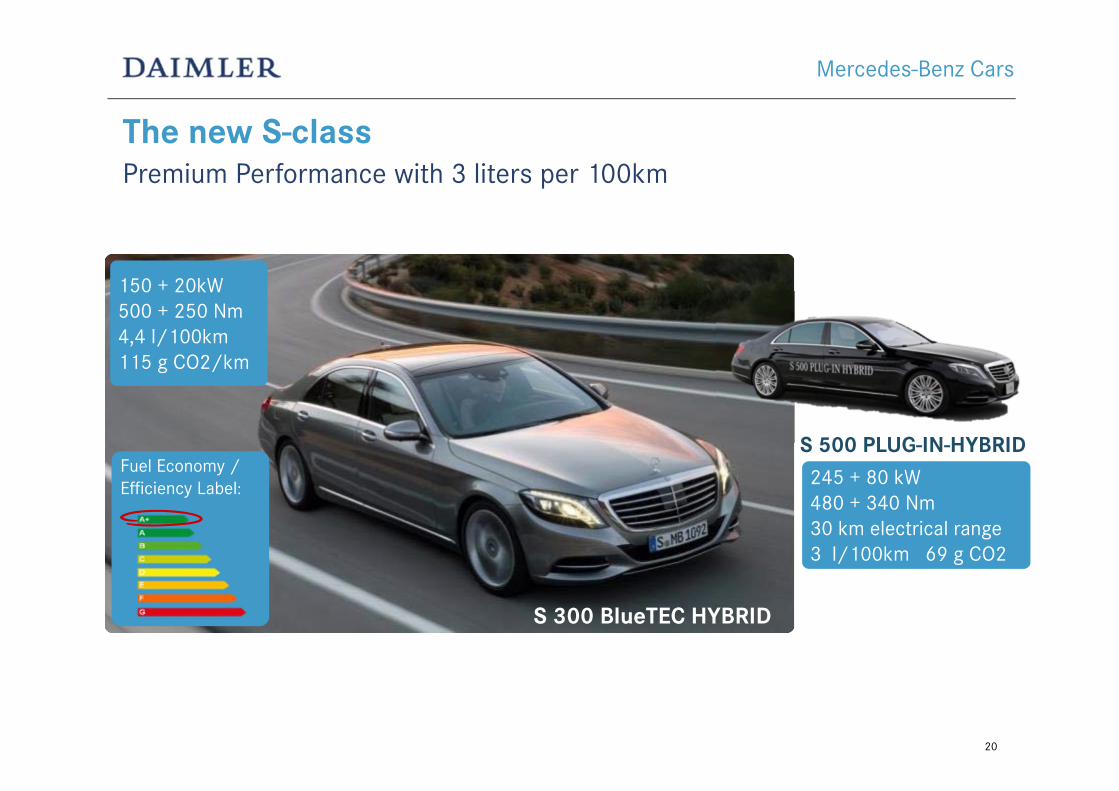
The new S-classPremium Performance with 3 liters per 100km
Mercedes-Benz Cars
Fuel Economy / Efficiency Label:
150 + 20kW500 + 250 Nm4,4 l/100km115 g CO2/km
245 + 80 kW480 + 340 Nm30 km electrical range3 l/100km 69 g CO2
S 300 BlueTEC HYBRID
S 500 PLUG-IN-HYBRID
21
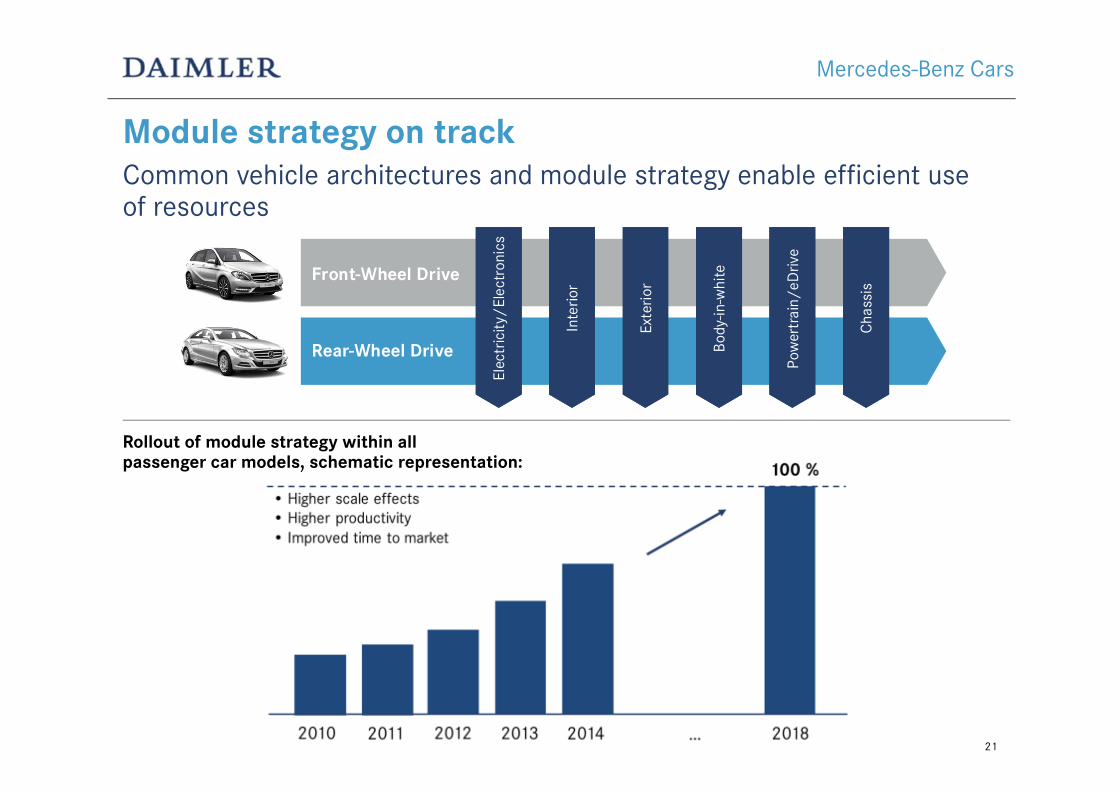
Module strategy on trackCommon vehicle architectures and module strategy enable efficient useof resources
Elec
tric
ity/
Elec
tron
ics
Elec
tric
ity/
Elec
tron
ics
Front-Wheel Drive
Rear-Wheel Drive
Inte
rior
Inte
rior
Exte
rior
Exte
rior
Body
-in-w
hite
Body
-in-w
hite
Pow
ertr
ain/
eDriv
ePo
wer
trai
n/eD
rive
Cha
ssis
Cha
ssis
Rollout of module strategy within allpassenger car models, schematic representation:
Mercedes-Benz Cars
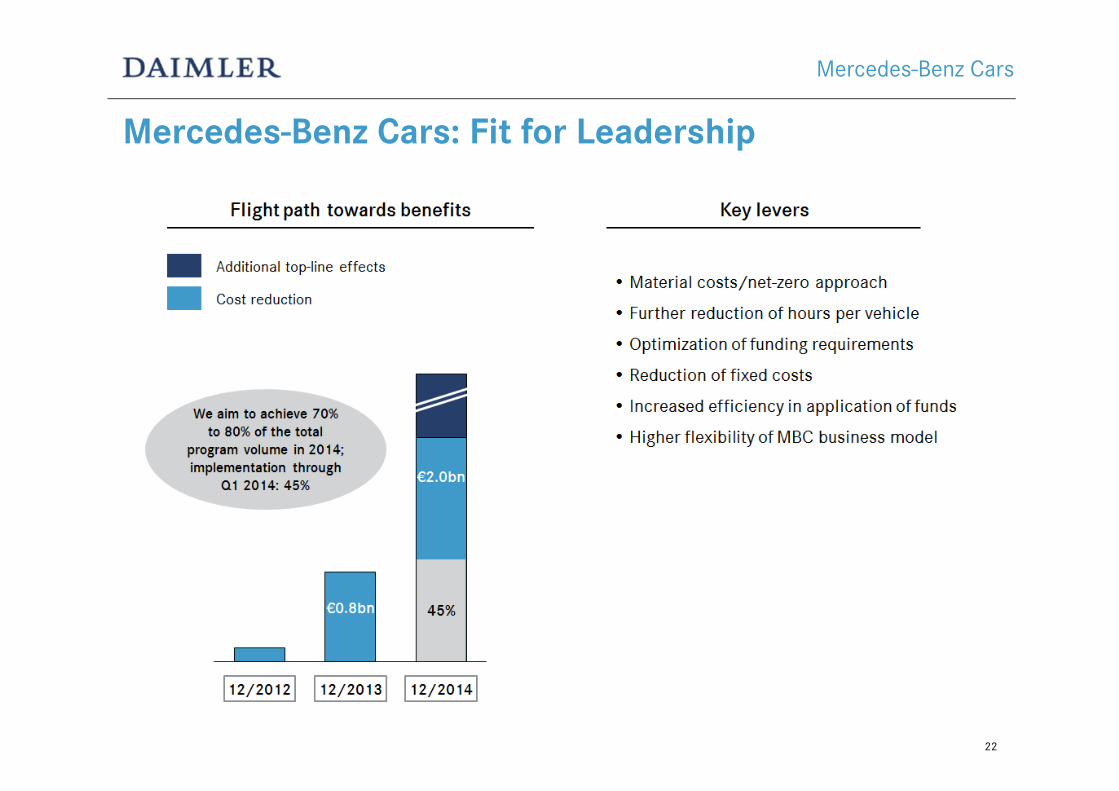
Mercedes-Benz Cars: Fit for Leadership
22
Mercedes-Benz Cars
Contents
23
Highlights First Quarter 2014
Daimler Strategy
Outlook 2014
Mercedes-Benz Cars
Daimler Trucks
Financing Strategy
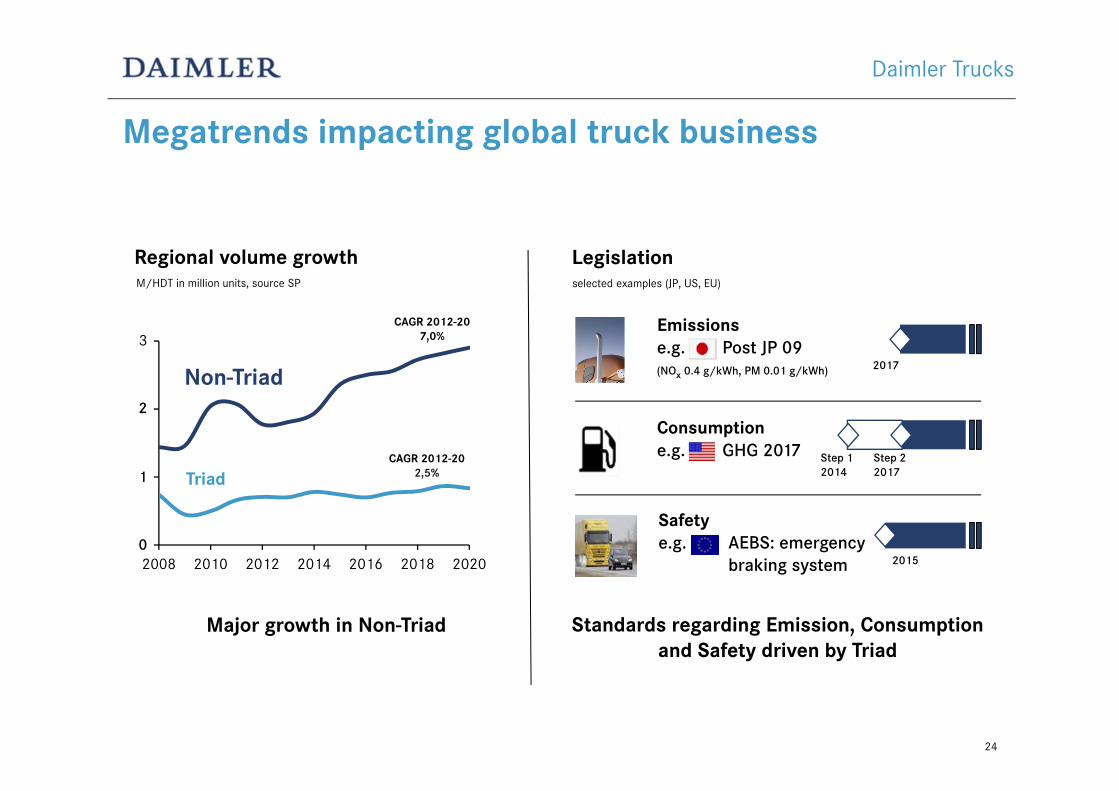
2008 2010 2012 2014 2016 2018 2020
Megatrends impacting global truck business
Major growth in Non-Triad
Triad
Non-Triad
Regional volume growthM/HDT in million units, source SP
0
3
2
1CAGR 2012-20
2,5%
CAGR 2012-207,0%
Safetye.g. AEBS: emergency
braking system
Standards regarding Emission, Consumption and Safety driven by Triad
Legislationselected examples (JP, US, EU)
Consumptione.g. GHG 2017
Emissionse.g. Post JP 09(NOx 0.4 g/kWh, PM 0.01 g/kWh)
2015
2017
Step 2 2017
Step 1 2014
24
Daimler Trucks
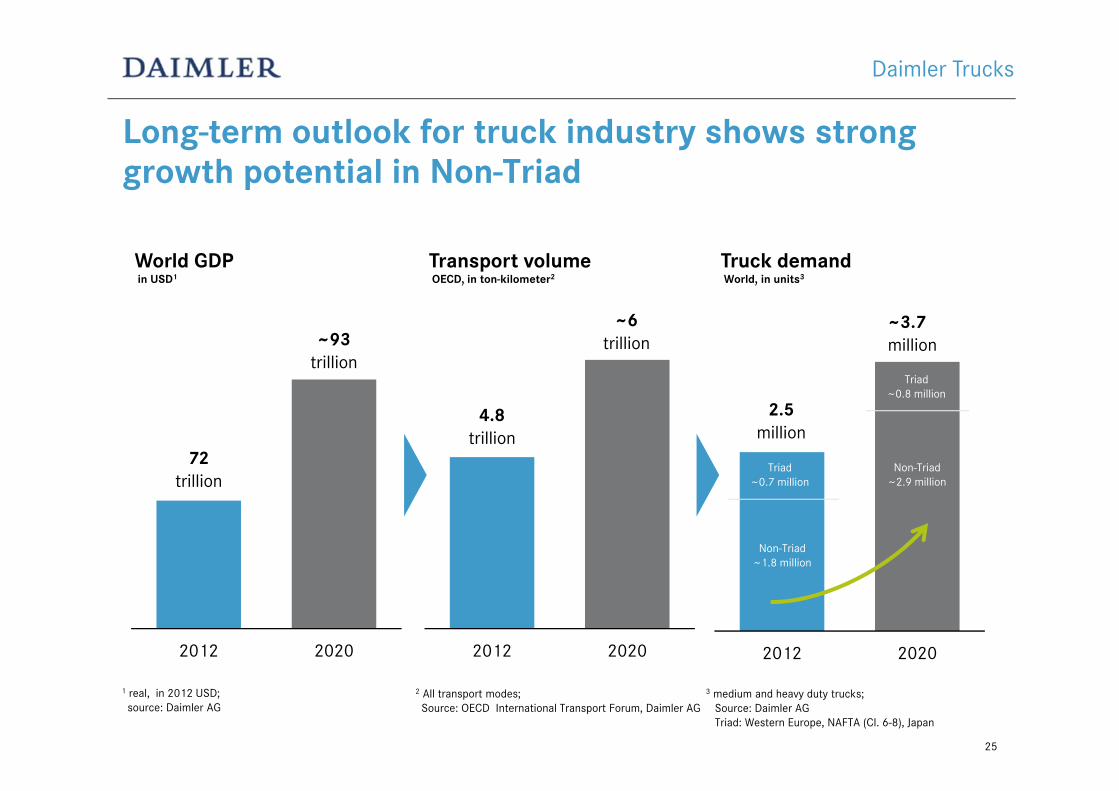
2012 2020
2.5million
~3.7million
Truck demandWorld, in units3
Triad~0.8 million
Non-Triad ~2.9 million
Triad~0.7 million
Non-Triad ~1.8 million
Long-term outlook for truck industry shows strong growth potential in Non-Triad
2012 2020
1 real, in 2012 USD;source: Daimler AG
2 All transport modes; Source: OECD International Transport Forum, Daimler AG
2012 2020
World GDPin USD1
Transport volumeOECD, in ton-kilometer2
72trillion
~93trillion
4.8trillion
~6trillion
3 medium and heavy duty trucks;Source: Daimler AGTriad: Western Europe, NAFTA (Cl. 6-8), Japan
25
Daimler Trucks
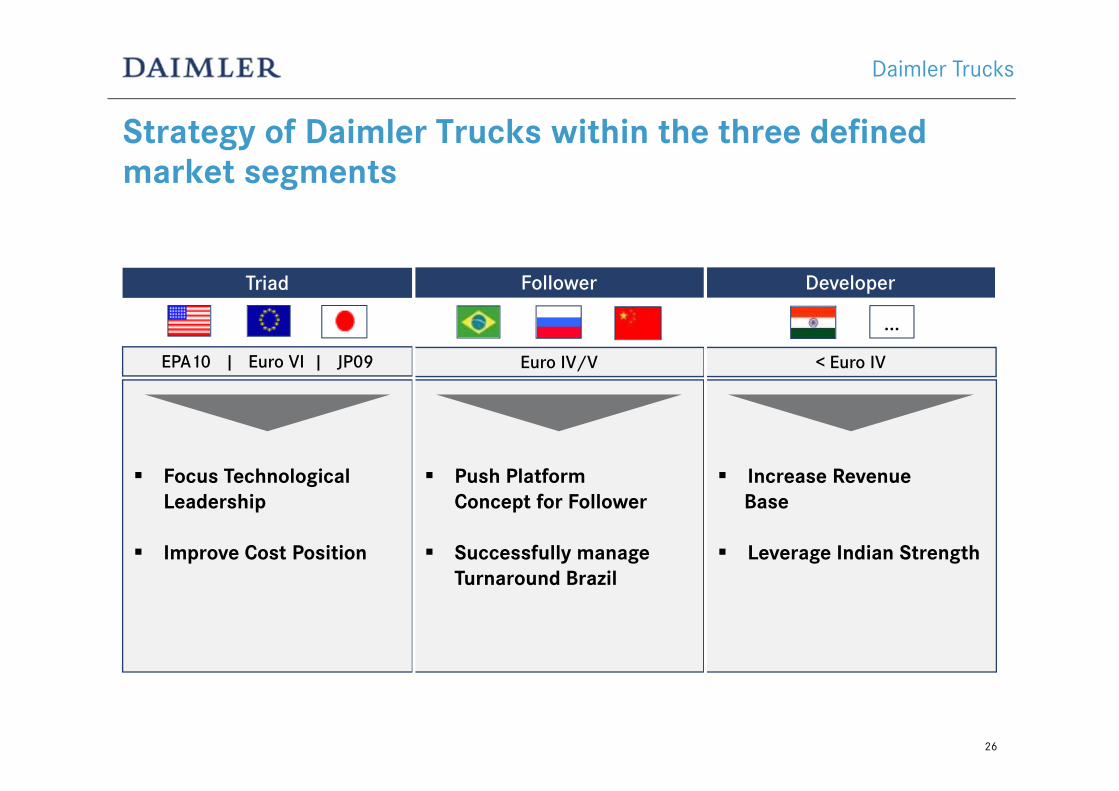
Strategy of Daimler Trucks within the three defined market segments
…
Triad Follower Developer
EPA10 | Euro VI | JP09 Euro IV/V < Euro IV
Focus Technological Leadership
Improve Cost Position
Push Platform Concept for Follower
Successfully manage Turnaround Brazil
Increase Revenue Base
Leverage Indian Strength
26
Daimler Trucks
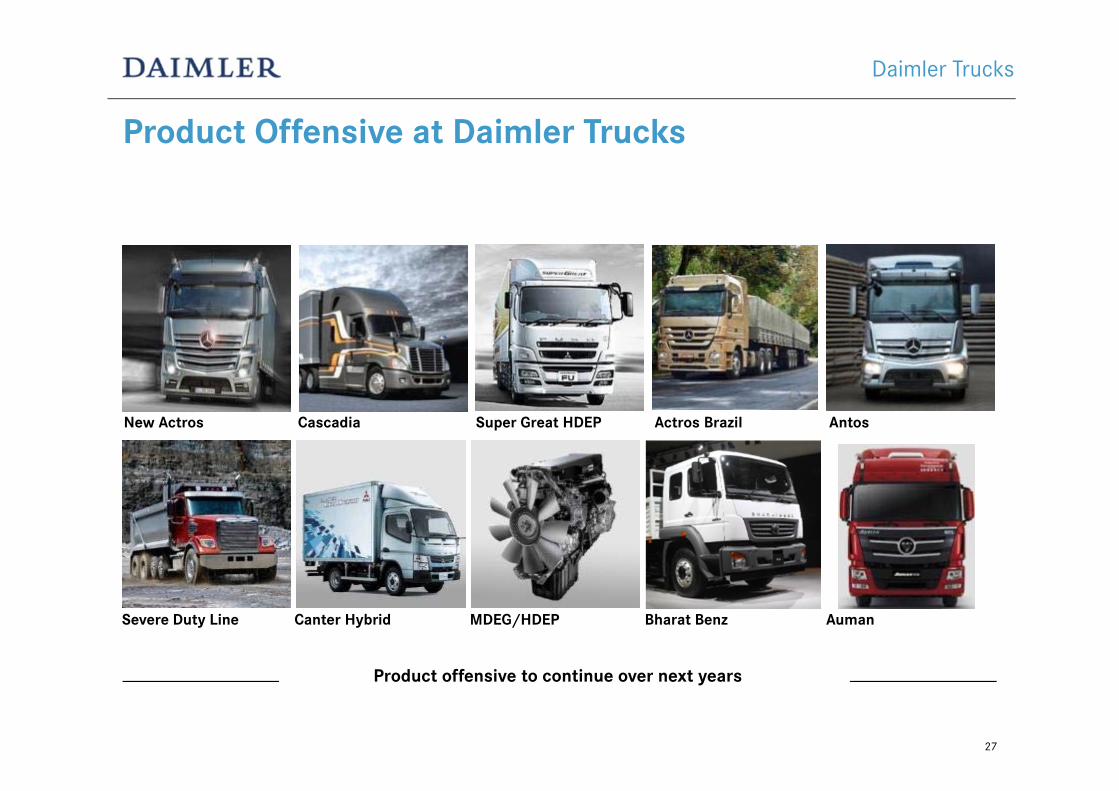
Product Offensive at Daimler Trucks
27
Product offensive to continue over next years
Bharat BenzMDEG/HDEP
New Actros Super Great HDEP Actros Brazil Antos
AumanCanter Hybrid
Cascadia
Severe Duty Line
Daimler Trucks
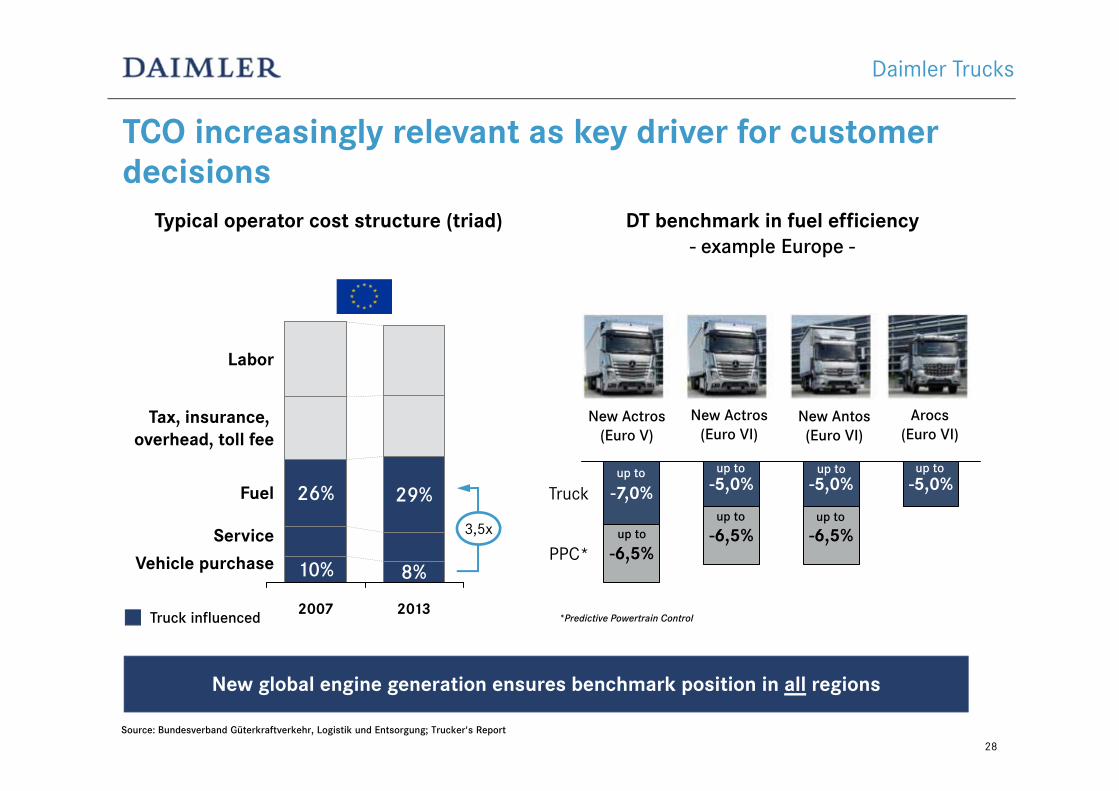
TCO increasingly relevant as key driver for customer decisions
28
DT benchmark in fuel efficiency- example Europe -
DT benchmark in fuel efficiency- example Europe -
Typical operator cost structure (triad)Typical operator cost structure (triad)
Truck influenced
Source: Bundesverband Güterkraftverkehr, Logistik und Entsorgung; Trucker's Report
3,5x
New global engine generation ensures benchmark position in all regions
26%
Vehicle purchaseService
Fuel
Tax, insurance, overhead, toll fee
Labor
2013
8%
29%
2007
10%
Daimler Trucks
New Actros(Euro V)
New Actros(Euro VI)
New Antos(Euro VI)
Arocs(Euro VI)
-6,5%
-7,0%
PPC*
Truck -5,0%
-6,5%
-5,0%
-6,5%
-5,0%
*Predictive Powertrain Control
up toup to up to
up to up to up to up to
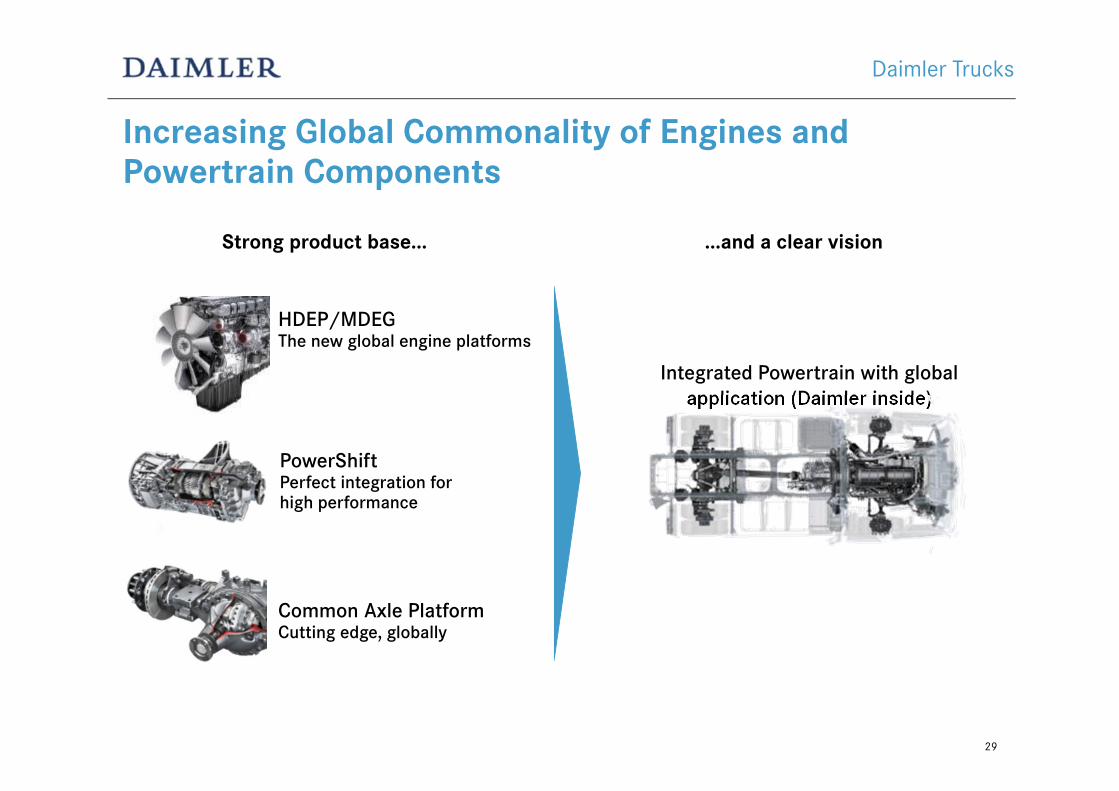
Increasing Global Commonality of Engines and Powertrain Components
29
PowerShiftPerfect integration for high performance
HDEP/MDEGThe new global engine platforms
Common Axle PlatformCutting edge, globally
Strong product base...Strong product base...
Integrated Powertrain with global application (Daimler inside)
...and a clear vision...and a clear vision
Daimler Trucks
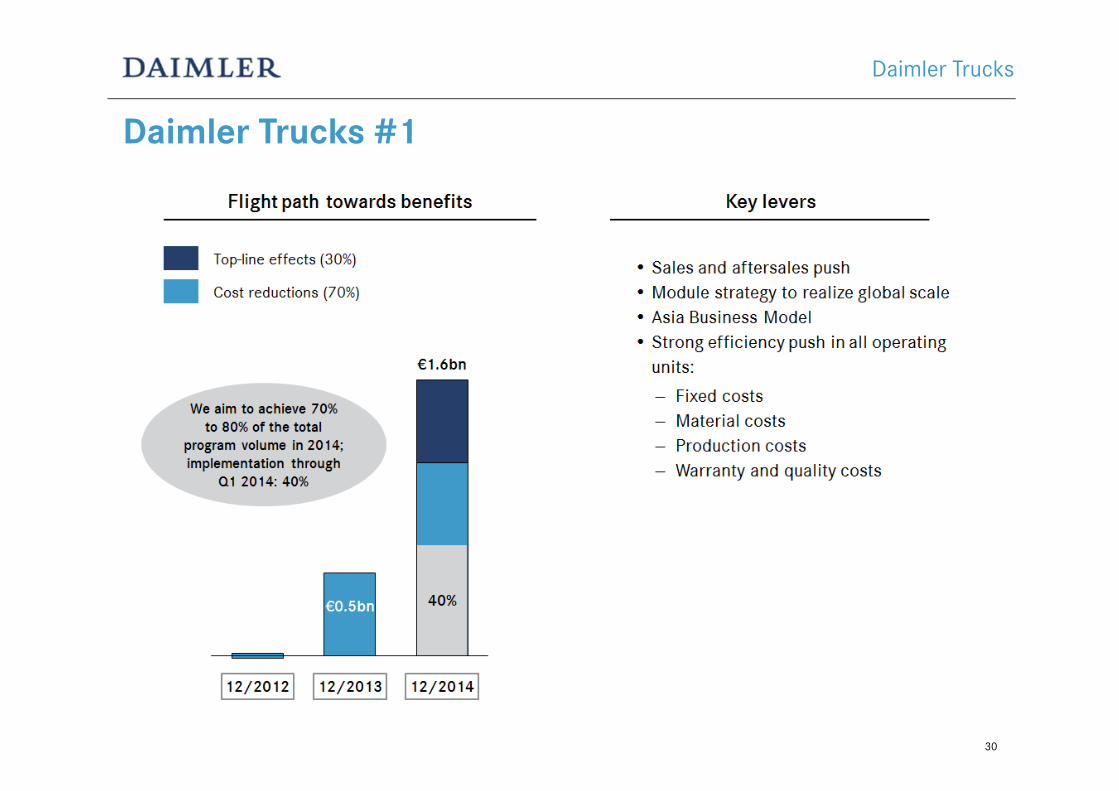
Daimler Trucks #1
30
Daimler Trucks
Contents
31
Highlights First Quarter 2014
Daimler Strategy
Outlook 2014
Mercedes-Benz Cars
Daimler Trucks
Financing Strategy
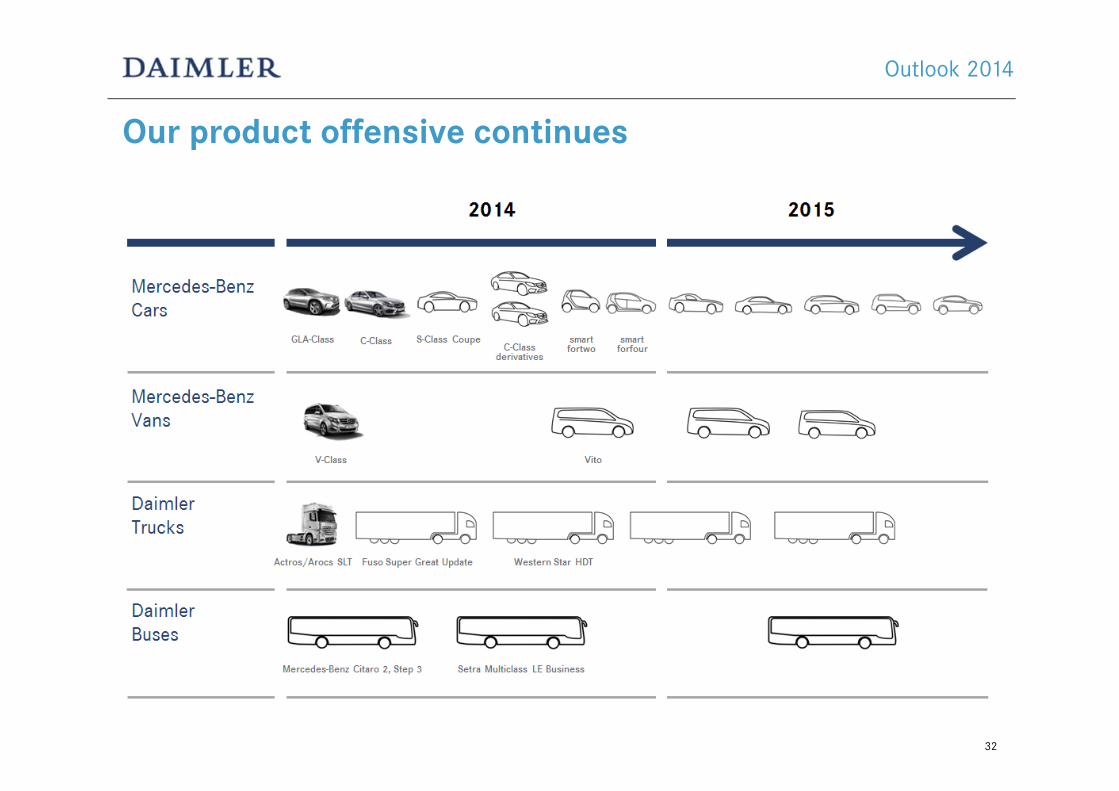
Our product offensive continues
Outlook 2014
32
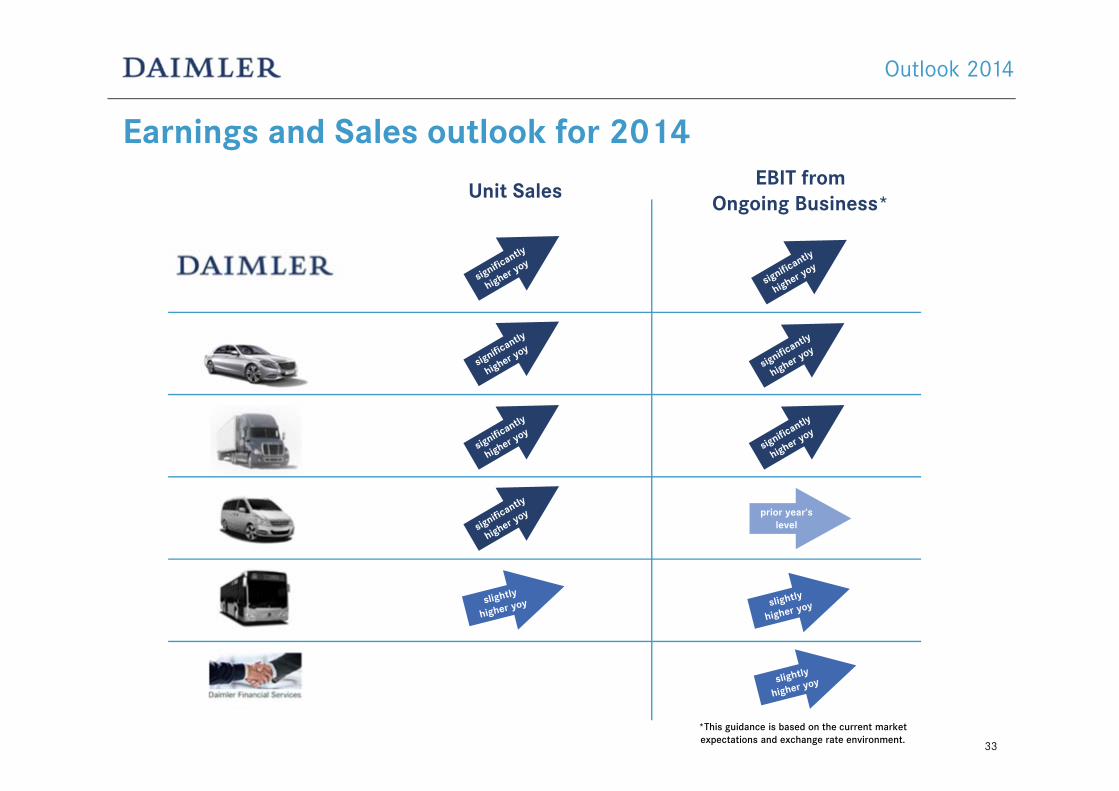
Earnings and Sales outlook for 2014
Outlook 2014
33
*This guidance is based on the current marketexpectations and exchange rate environment.
prior year‘slevel
Unit SalesEBIT from
Ongoing Business*
34
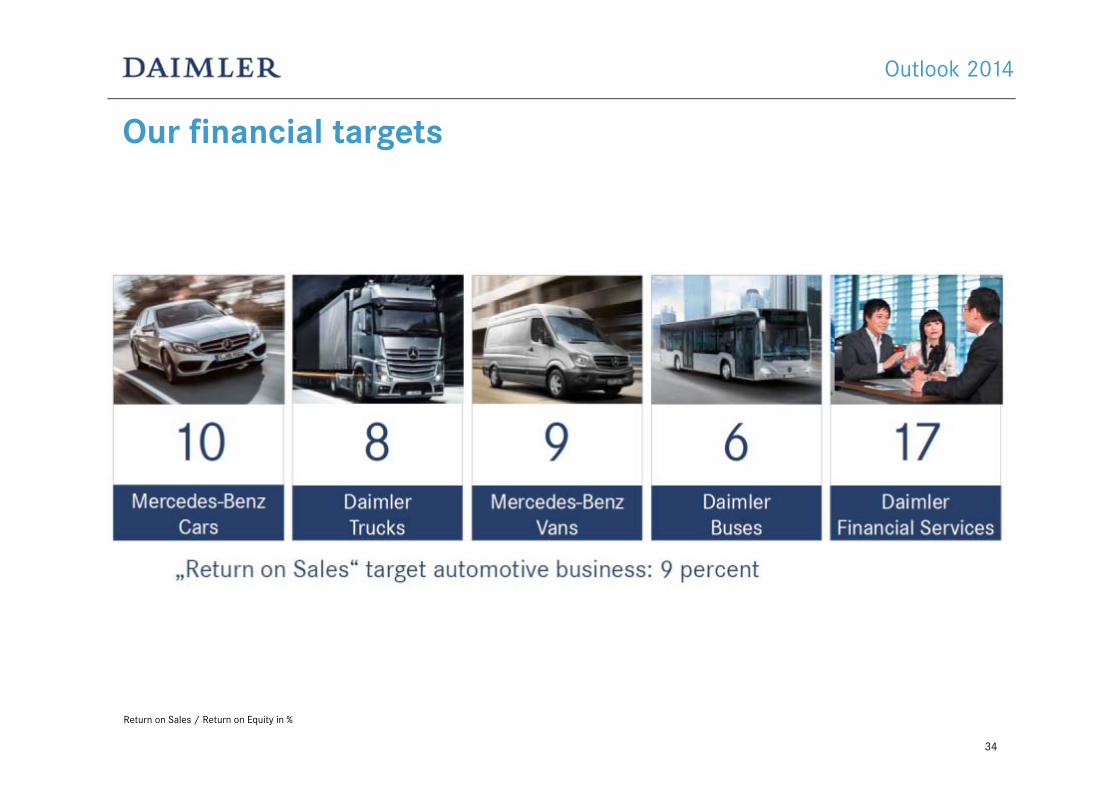
Our financial targets
Return on Sales / Return on Equity in %
Outlook 2014
Contents
35
Highlights First Quarter 2014
Daimler Strategy
Outlook 2014
Mercedes-Benz Cars
Daimler Trucks
Financing Strategy
36
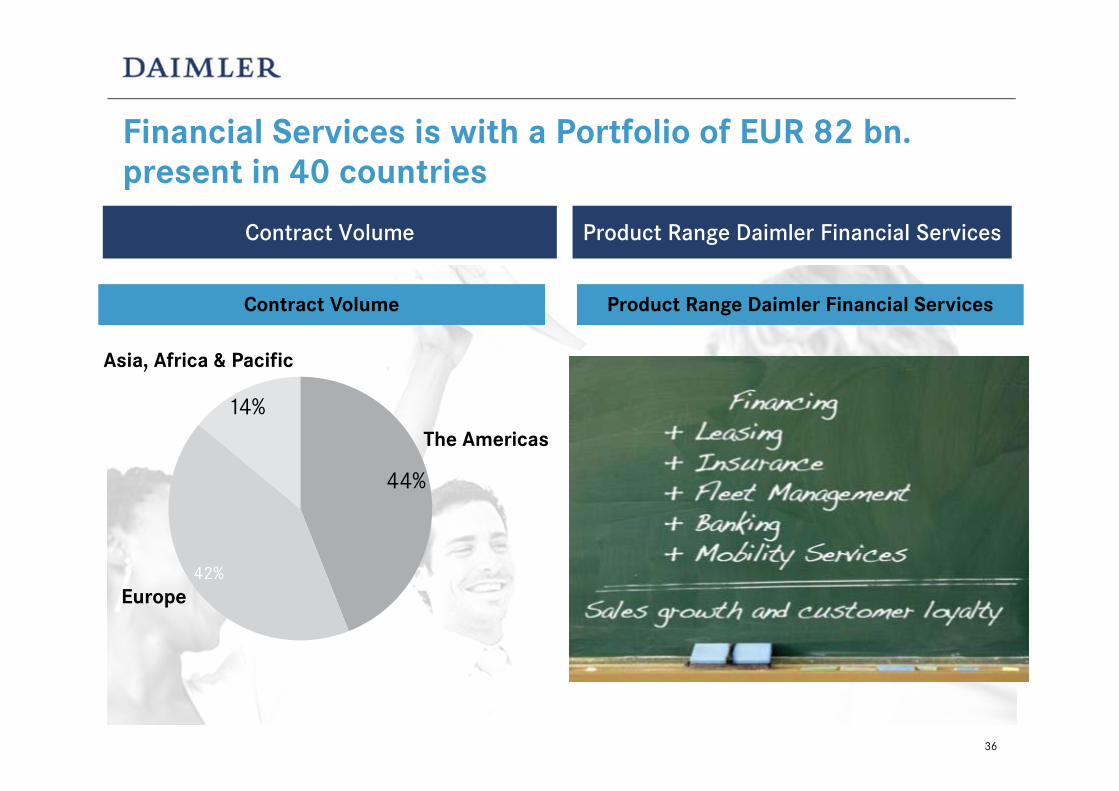
Financial Services is with a Portfolio of EUR 82 bn. present in 40 countries
Contract Volume Product Range Daimler Financial Services
44%
14%The Americas
Europe42%
Asia, Africa & Pacific
Contract Volume Product Range Daimler Financial Services
37
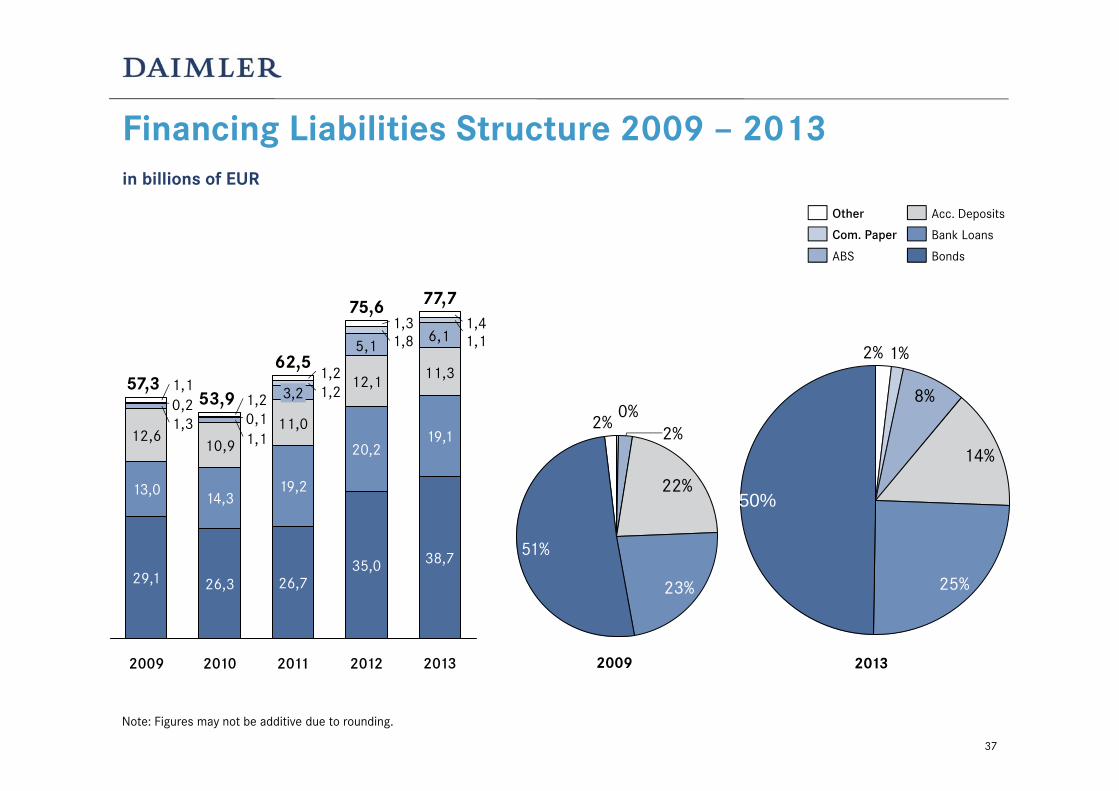
Financing Liabilities Structure 2009 – 2013 in billions of EUR
Note: Figures may not be additive due to rounding.
12,610,9
11,0
12,1 11,3
5,16,1
1,11,3
1,11,8
1,2
0,10,2
1,41,3
1,2
1,21,1
2013
77,7
38,7
19,1
2012
75,6
35,0
20,2
2011
62,5
26,7
19,2
3,2
2010
53,9
26,3
14,3
2009
57,3
29,1
13,0
Com. Paper
Other
Bonds
Bank Loans
Acc. Deposits
ABS
22%
2%0%
2%
51%
23%
8%
14%
50%
25%
1%2%
2009 2013
38
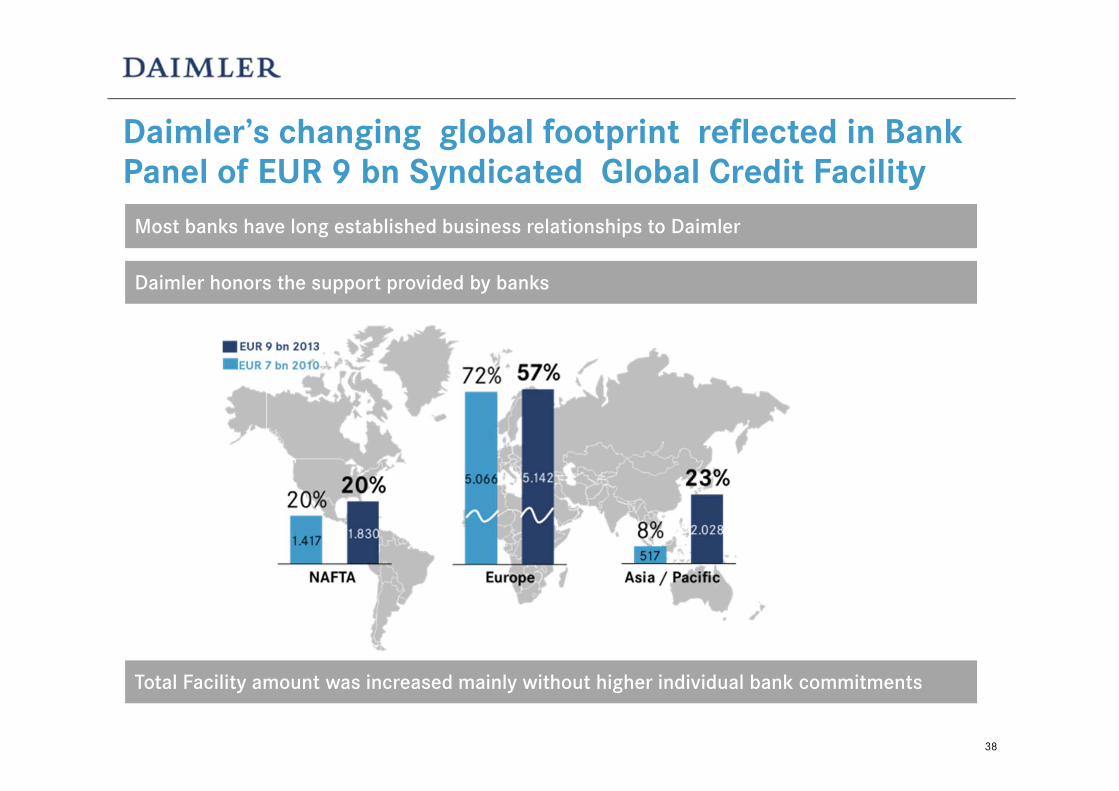
Most banks have long established business relationships to Daimler
Total Facility amount was increased mainly without higher individual bank commitments
Daimler’s changing global footprint reflected in Bank Panel of EUR 9 bn Syndicated Global Credit Facility
Daimler honors the support provided by banks
39
Several Issuing Programs ensure an optimized financing approach and reaches a broad investor base
Global programs:
144a / RegS Documentation for US offerings
Local Programs established in Mexico, Brazil, Argentina, South Africa, Thailand, Japan, Korea and China
In future: India and others to be added, when capital markets open and funding requirements justify the effort
Euro MTN Program (multi currency and multi issuers)
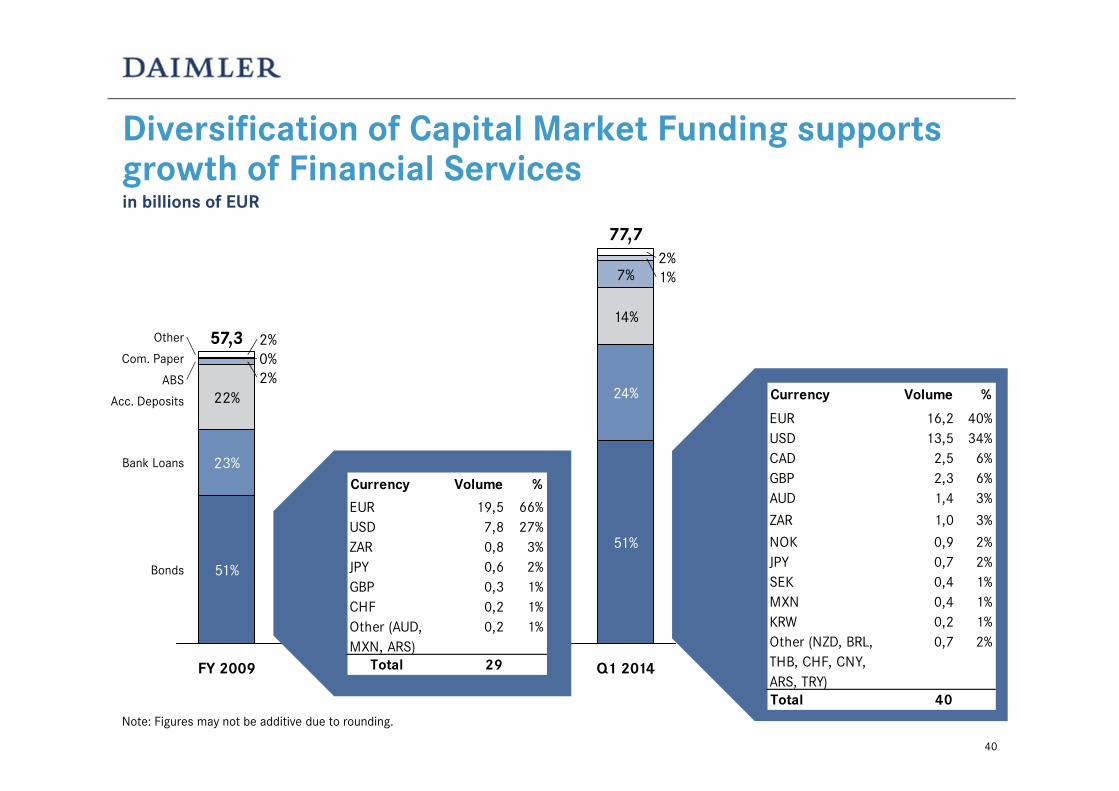
Diversification of Capital Market Funding supports growth of Financial Servicesin billions of EUR
Note: Figures may not be additive due to rounding.
Bank Loans
Bonds
Acc. Deposits
ABS
Com. Paper
Other
Q1 2014
77,7
51%
24%
14%
7% 1%2%
FY 2009
57,3
51%
23%
22%2%0%2%
Currency Volume %
EUR 19,5 66%USD 7,8 27%ZAR 0,8 3%JPY 0,6 2%GBP 0,3 1%CHF 0,2 1%Other (AUD,MXN, ARS)
0,2 1%
Total 29
Currency Volume %
EUR 16,2 40%USD 13,5 34%CAD 2,5 6%GBP 2,3 6%AUD 1,4 3%
ZAR 1,0 3%
NOK 0,9 2%JPY 0,7 2%SEK 0,4 1%MXN 0,4 1%KRW 0,2 1%Other (NZD, BRL, 0,7 2%THB, CHF, CNY, ARS, TRY)Total 40
40
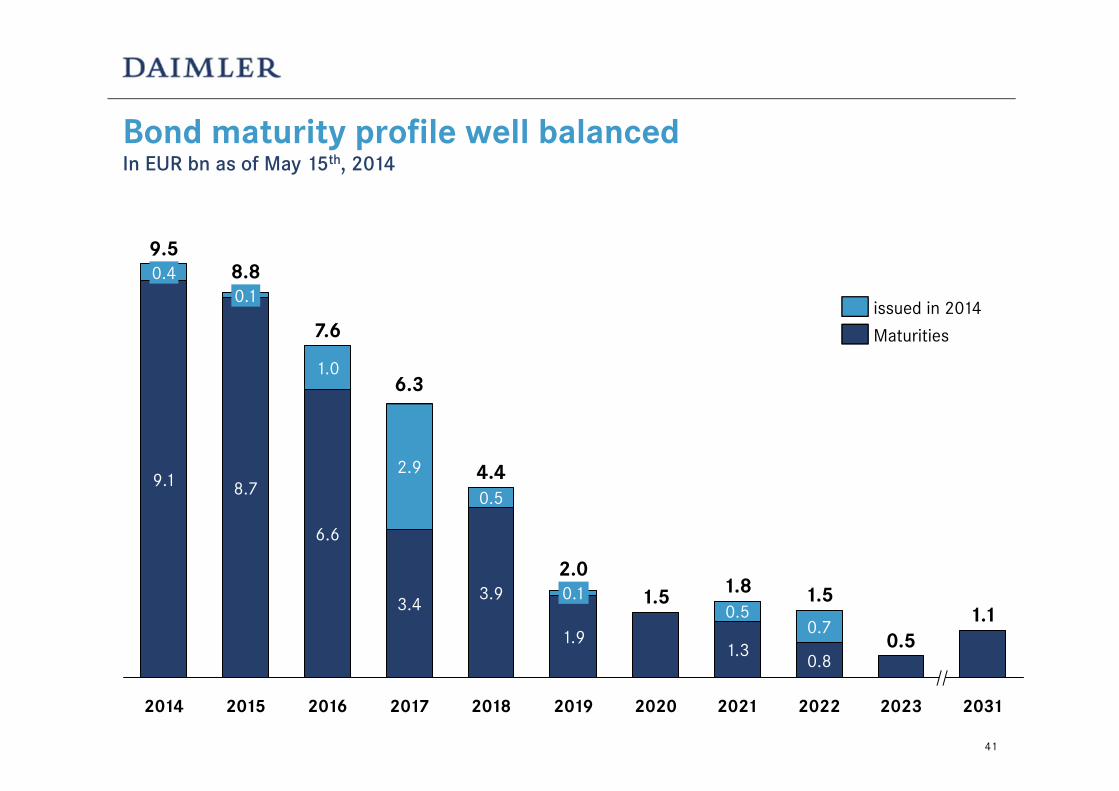
Bond maturity profile well balancedIn EUR bn as of May 15th, 2014
1.3
0.5
2020
1.5 1.82.0
1.9
0.1
2019
1.0
2015
8.8
8.7
0.1
2014
9.5
9.1
0.4
2031
1.1
2023
0.5
2022
1.5
0.8
0.7
20212018
4.4
3.9
0.5
2017
6.3
3.4
2.9
2016
7.6
6.6
Maturities
issued in 2014
41
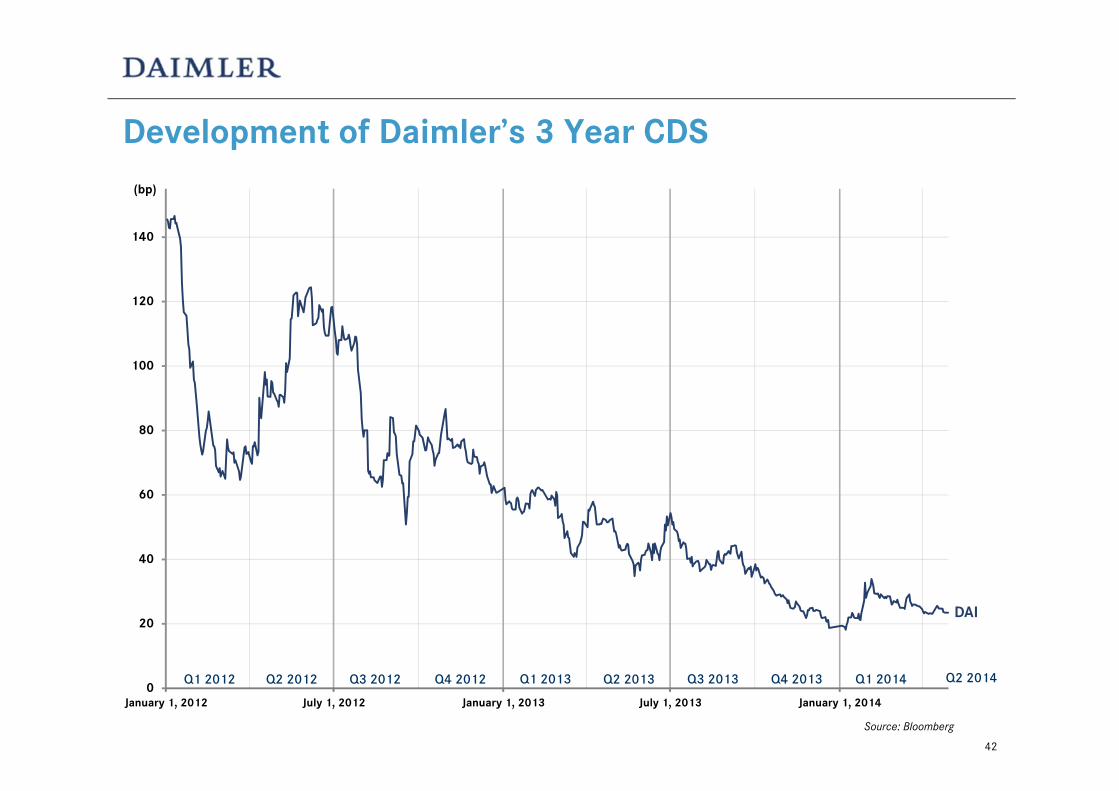
Development of Daimler’s 3 Year CDS
0
20
40
60
80
100
120
140
January 1, 2012 July 1, 2012 January 1, 2013 July 1, 2013 January 1, 2014
Q1 2012
Source: Bloomberg
Q2 2012 Q3 2012 Q4 2012 Q1 2013 Q2 2013 Q3 2013 Q4 2013
DAI
(bp)
Q1 2014 Q2 2014
42
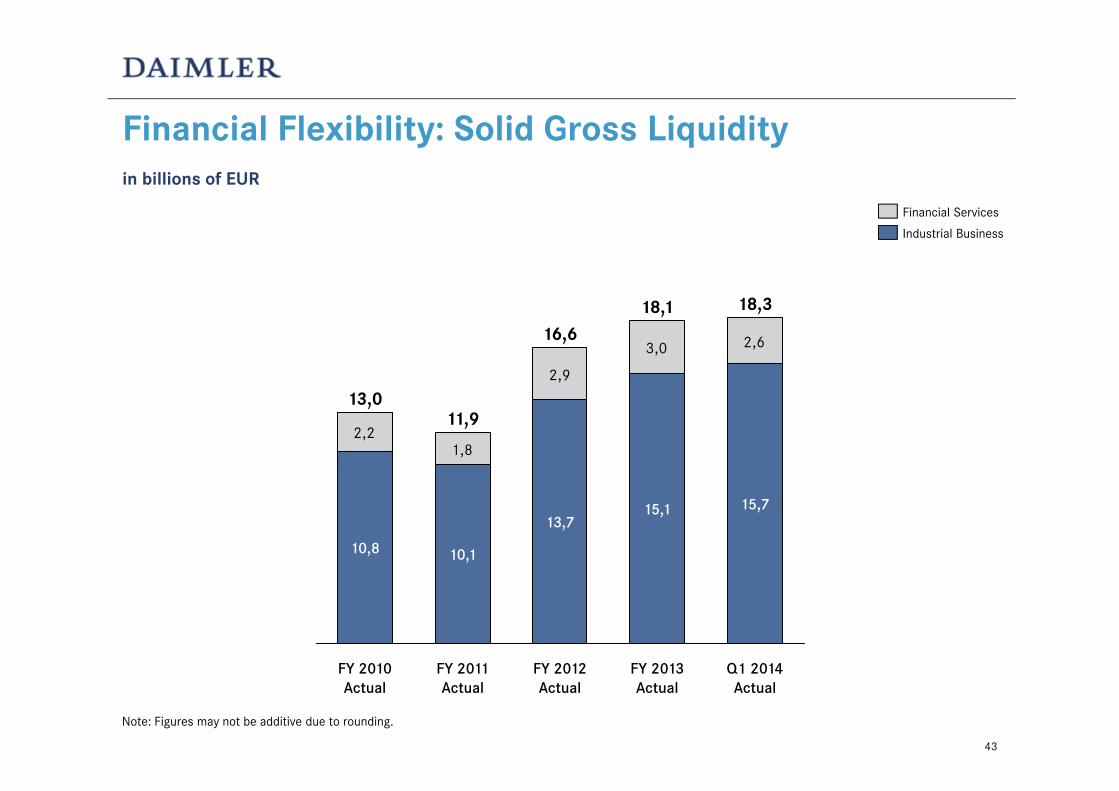
Financial Flexibility: Solid Gross Liquidityin billions of EUR
Note: Figures may not be additive due to rounding.
2,21,8
2,9
3,0 2,6
18,3
FY 2011 Actual
FY 2010 Actual
FY 2012 Actual
FY 2013 Actual
10,8
13,0
Q1 2014 Actual
10,1
11,9
13,7
16,6
15,1
18,1
15,7
Financial Services
Industrial Business
43
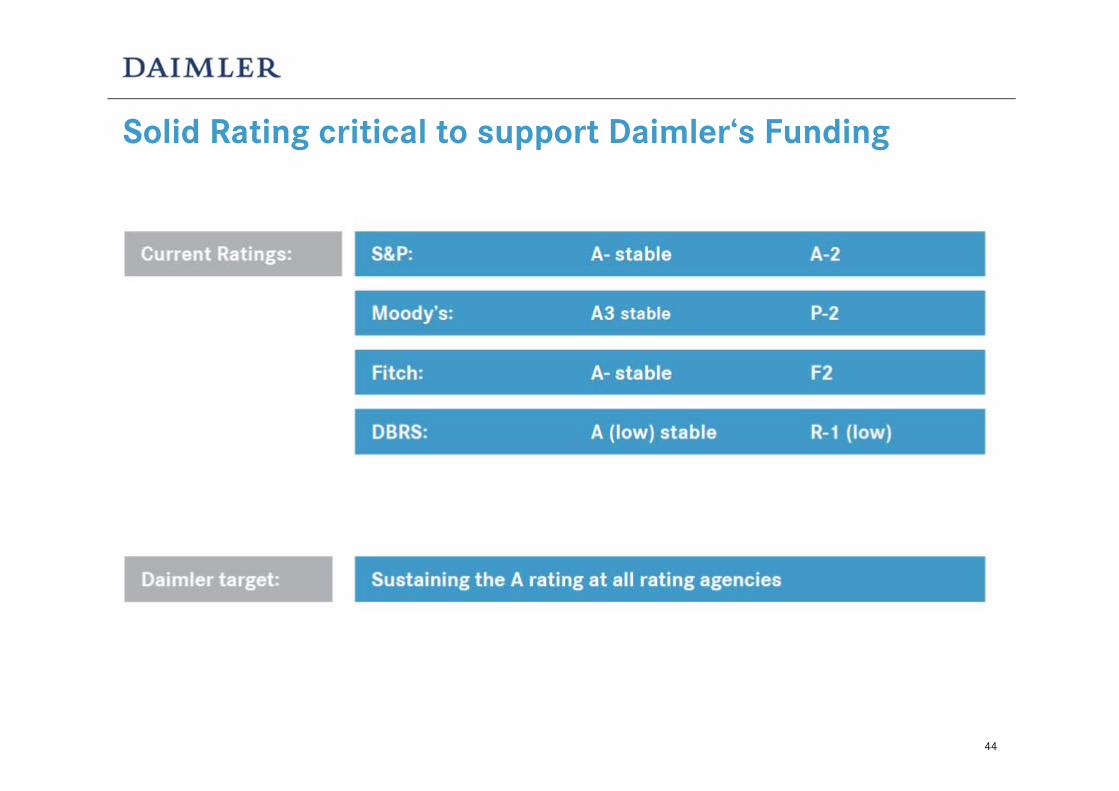
Solid Rating critical to support Daimler‘s Funding
44
45
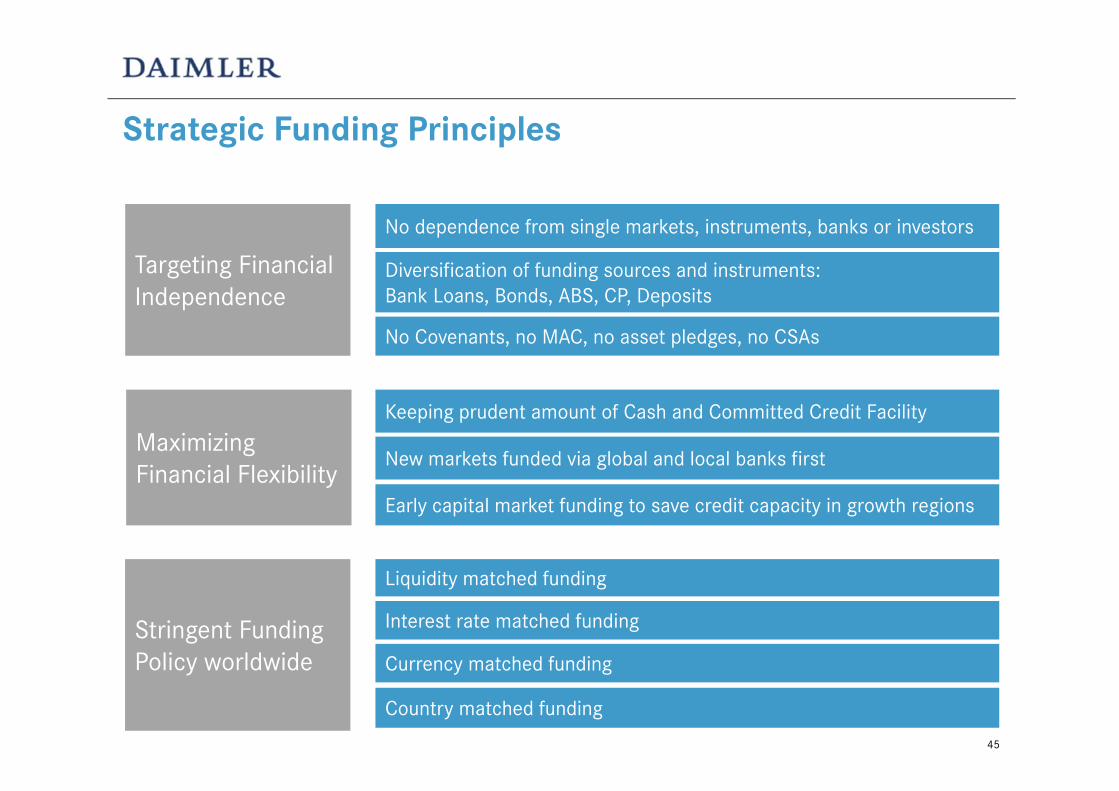
Targeting Financial Independence
No dependence from single markets, instruments, banks or investors
Strategic Funding Principles
Diversification of funding sources and instruments: Bank Loans, Bonds, ABS, CP, Deposits
No Covenants, no MAC, no asset pledges, no CSAs
Maximizing Financial Flexibility
Early capital market funding to save credit capacity in growth regions
New markets funded via global and local banks first
Stringent FundingPolicy worldwide
Liquidity matched funding
Interest rate matched funding
Currency matched funding
Country matched funding
Keeping prudent amount of Cash and Committed Credit Facility
Disclaimer
This document contains forward-looking statements that reflect our current views about future events. The words“anticipate,” “assume,” “believe,” “estimate,” “expect,” “intend,” “may,” ”can,” “could,” “plan,” “project,” “should”and similar expressions are used to identify forward-looking statements. These statements are subject to many risksand uncertainties, including an adverse development of global economic conditions, in particular a decline ofdemand in our most important markets; a worsening of the sovereign-debt crisis in the Eurozone; an exacerbation ofthe budgetary situation in the United States; a deterioration of our refinancing possibilities on the credit and financialmarkets; events of force majeure including natural disasters, acts of terrorism, political unrest, industrial accidentsand their effects on our sales, purchasing, production or financial services activities; changes in currency exchangerates; a shift in consumer preference towards smaller, lower-margin vehicles; or a possible lack of acceptance of ourproducts or services which limits our ability to achieve prices and adequately utilize our production capacities; priceincreases in fuel or raw materials; disruption of production due to shortages of materials, labor strikes or supplierinsolvencies; a decline in resale prices of used vehicles; the effective implementation of cost-reduction andefficiency-optimization measures; the business outlook of companies in which we hold a significant equity interest;the successful implementation of strategic cooperations and joint ventures; changes in laws, regulations andgovernment policies, particularly those relating to vehicle emissions, fuel economy and safety; the resolution ofpending government investigations and the conclusion of pending or threatened future legal proceedings; and otherrisks and uncertainties, some of which we describe under the heading “Risk Report” in Daimler’s most recent AnnualReport. If any of these risks and uncertainties materialize or if the assumptions underlying any of our forward-lookingstatements prove to be incorrect, the actual results may be materially different from those we express or imply bysuch statements. We do not intend or assume any obligation to update these forward-looking statements since theyare based solely on the circumstances at the publication date.
46