d7 - europa · of 2.2 nlpm, adsoption at 75 atm and desorption at 2.42 atm.10 ... figure 7 smart...
TRANSCRIPT

D7.4
RESULTS FROM H2-FUEL GAS QUALITY MONITORING AT VARIOUS HRSS IN OSLO AREA
Final Version 2013-02-01
Thor Anders Aarhaug Alain Marc Charles Ferber
Acknowledgement
This project is co-financed by European funds from the
Fuel Cells and Hydrogen Joint Undertaking under
FCH-JU-2008-1 Grant Agreement Number 245101
The project partners would like to thank the EU for establishing the Fuel cells and hydrogen framework and or supporting this activity.

Disclaimer
The staff of H2moves Scandinavia partners prepared this report.
The views and conclusions expressed in this document are those of the staff of the respective H2moves Scandinavia partner(s). Neither the H2moves Scandinavia partner(s), nor any of their employees, contractors or subcontractors, makes any warranty, expressed or implied, or assumes any legal liability or responsibility for the accuracy, completeness, or usefulness of any information, product, or process enclosed, or represents that its use would not infringe on privately owned rights.

Deliverable D7.4
i
CONTENTS
TABLES II
FIGURES III
ACRONYMS AND ABBREVIATIONS IV
EXECUTIVE SUMMARY V
1 INTRODUCTION AND MOTIVATION 7
2 SAMPLING 12 2.1 Methodology ................................................................................................................................... 12
2.1.1 HRS Økern: 2012-11-06 .............................................................................................. 13
2.1.2 HRS Gaustad: 2012-11-06 ........................................................................................... 13
2.1.3 HRS Herøya: 2012-11-07 ............................................................................................ 13
2.1.4 HRS Økern: 2013-01-16 .............................................................................................. 14
3 RESULTS FROM HYDROGEN FUEL QC 15 3.1 Results from SmartChemistry ......................................................................................................... 15
3.1.1 Total Hydrocarbons ...................................................................................................... 15
3.1.2 Nitrogen ....................................................................................................................... 15
3.1.3 Argon ........................................................................................................................... 15
3.1.4 Carbon Dioxide ............................................................................................................ 15
3.1.5 Carbon Monoxide......................................................................................................... 15
3.1.6 Total Sulphur ............................................................................................................... 16
3.1.7 Total Halogenates ........................................................................................................ 16
3.2 Particles ......................................................................................................................................... 16
3.3 Results from SINTEF ...................................................................................................................... 16
3.3.1 Long Path FTIR ........................................................................................................... 16
3.3.2 GC-MS......................................................................................................................... 17
4 LITERATURE 20
5 LIST OF APPENDICES 21

Deliverable D7.4
ii
TABLES
Table 1: SmartChemistry QC results. All results in ppmv unless specifically noted. Tolerance levels are in accordance with SAE J2719. Results in read are in conflict with the standard. 15
Table 2 Analytical results from Long Path FTIR quantification of impurities. 17
Deliverable D7.4
iii
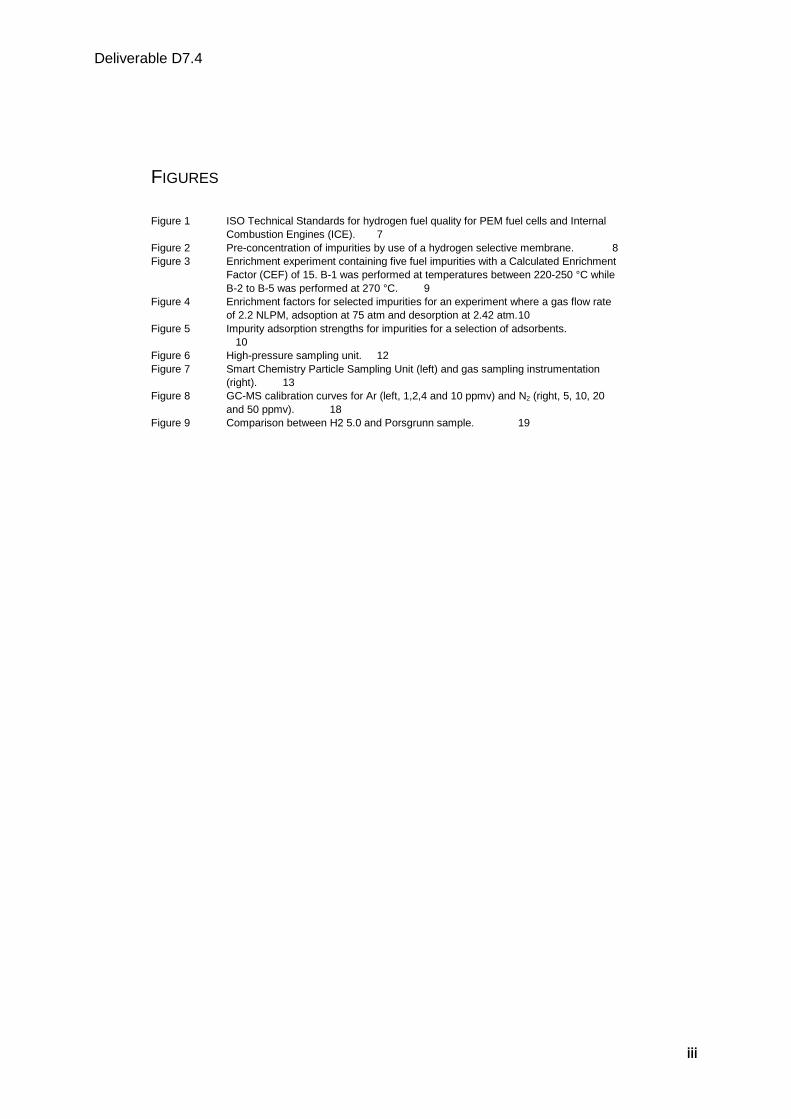
FIGURES
Figure 1 ISO Technical Standards for hydrogen fuel quality for PEM fuel cells and Internal Combustion Engines (ICE). 7
Figure 2 Pre-concentration of impurities by use of a hydrogen selective membrane. 8 Figure 3 Enrichment experiment containing five fuel impurities with a Calculated Enrichment
Factor (CEF) of 15. B-1 was performed at temperatures between 220-250 °C while B-2 to B-5 was performed at 270 °C. 9
Figure 4 Enrichment factors for selected impurities for an experiment where a gas flow rate of 2.2 NLPM, adsoption at 75 atm and desorption at 2.42 atm. 10
Figure 5 Impurity adsorption strengths for impurities for a selection of adsorbents. 10
Figure 6 High-pressure sampling unit. 12 Figure 7 Smart Chemistry Particle Sampling Unit (left) and gas sampling instrumentation
(right). 13 Figure 8 GC-MS calibration curves for Ar (left, 1,2,4 and 10 ppmv) and N2 (right, 5, 10, 20
and 50 ppmv). 18 Figure 9 Comparison between H2 5.0 and Porsgrunn sample. 19

Deliverable D7.4
iv
ACRONYMS AND ABBREVIATIONS BOP Balance Of Plant BTL Biomass-to-Liquid CTL Coal-to-Liquid GTL Gas-to-Liquid FC Fuel Cell FTIR Fourier-Transform Infrared Spectroscopy GC Gas Chromatography GHG Greenhouse Gas GT Gas Turbine H2 Hydrogen ICE Internal Combustion Engine LBST Ludwig-Bölkow-Systemtechnik LCA Life-Cycle Assessment LOD Limit Of Detection LOQ Limit Of Quantification MEA Membrane Electrode Assembly MS Mass Spectrometry N2 Nitrogen PEM Polymer Electrolyte Membrane PM Particulate Matter PSA Pressure Swing Adsorption QA Quality Assurance QC Quality Control SDD Sustainability Due Diligence WtT Well-to-Tank WtW Well-to-Wheel yr Year

Deliverable D7.4
v
EXECUTIVE SUMMARY
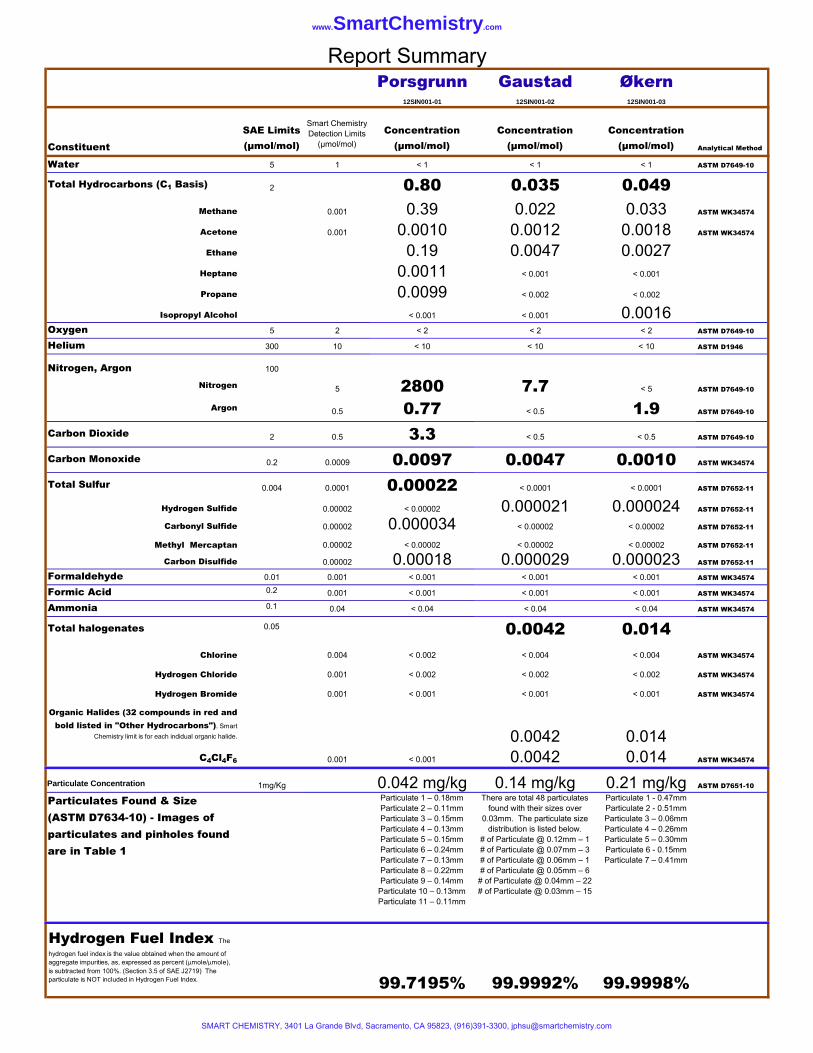
Hydrogen fuel quality control has been conducted for three Hydrogen Refuelling Stations in the Oslo area. The sampling of gas and particles were conducted by SINTEF. Sampling was limited to 350 bar for several reasons. The samples were analysed by a subcontracting laboratory, fully capable of performing quality control in accordance with prevailing standards on hydrogen fuel for fuel cells. The main results are summarized in the table:
Constituent Tolerance Porsgrunn Gaustad Økern Total Hydrocarbons
(C1 basis) 2 0.80 0.035 0.049
Nitrogen 100* 2800 7.7 < 5 Argon 100* 0.77 < 0.5 1.9
Carbon Dioxide 2 3.3 < 0.5 < 0.5 Carbon Monoxide 0.2 0.0097 0.0047 0.0010
Total Sulphur 0.004 0.00022 < 0.0001 < 0.0001 Total Halogenates 0.05 < 0.002 0.0042 0.014
Particulate Concentration 1 mg kg-1 0.042 0.14 0.21
Number of particles 11 48 7 Hydrogen Fuel Index 99.97 % 99.7195% 99.9992 % 99.9998%
* Sum of N, Ar should be less than 100 ppm.
One HRS failed the hydrogen QC on several criteria. For one of HRSs a large deviation from the nitrogen tolerance limit resulted in a significant reduction in the fuel index. All particle concentrations were lower than the tolerance limit, although each and every particle had a larger diameter than the accepted 10 µm.
In addition to the subcontracted analysis, SINTEF used the opportunity to evaluate the feasibility of FTIR and GC-MS for fuel quality analysis. Because of the limited number of impurities found in the samples, evaluation of feasibility of these techniques for an extended range of impurities was difficult. It is suggested that a pre-concentration techniques is applied to sample before analysis.


Deliverable D7.4
7
1 INTRODUCTION AND MOTIVATION As PEM technology is still trying to attain its durability targets, the tolerance for potentially degrading conditions is strict. It is well established that the tolerance for sulfur for platinum catalysts are limited as the element adsorbs irreversibly on the surface. In PEM fuel quality standards, this is reflected in a maximum tolerance level of 4 ppb total sulphur. A list of tolerance levels for impurities is shown in Figure 1.
Figure 1 ISO Technical Standards for hydrogen fuel quality for PEM fuel cells and Internal Combustion Engines (ICE).
It is not difficult to foresee that hydrogen fuel quality control could be cost driving for hydrogen fuel production and delivery.
Whether the tolerance levels of inerts and water are too stringent could be debated, as these components are mainly associated with Balance of Plant (BOP) issues. It has also been argued that the nitrogen gas cross-over from an air-fed cathode is higher than the tolerance levels set in the standards.
In the case of sulphur, the impact on durability is unquestionable. Sulphur, in the form of a sticky gas such as H2S, is almost impossible to quantify at a level of 4 ppb. Verification of the impact of 4 ppb H2S fed to a fuel cell is also difficult to evaluate, as a significant part of the molecules would stick to the gas feed line and never reach the catalyst. For hydrogen produced from Steam Methane Reforming (SMR), Pressure Swing Adsorption (PSA) is always applied to purify hydrogen. It has been argued that for the adsorbents normally applied, the selectivity of H2S is much higher than that of CO. Thus, breakthrough of H2S should only be possible in the case of saturation of the PSA. This condition could, however, evaluated by monitoring the CO concentration.
Currently, fuel quality standards do not reflect the hydrogen fuel feedstock. For onsite, electrolytically produced hydrogen fuel the sources of sulphur or halogenates are very limited. In the case of trucked-in hydrogen, using hydrogen fuel of various feedstocks might complicate the impurity situation at an HRS. It is expected that as more experience data from HRS of various feedstock is reported, it is possible to differentiate the standards.

Deliverable D7.4
8
A proposed approach to simplify the quality control of hydrogen fuel is by the use of canary constituents. By establishing well know correlations between impurities, the canary could be used as an indicator of impurities present in the fuel. Although thermochemical calculation has been performed to evaluate equilibria relevant for the composition of the gas, most of the co-variance between impurity species requires an experimental verification as they do not react with each other. It could be argued by taking feedstock into consideration, this might simplify the evaluation of co-varying species.
A pre-requisite for the use of canary constituents is that the co-variance between constituents is verified. This requires execution of quality control and collection of data from several HRS based on different feedstock. Another challenge for the evaluation of co-variance is the low concentration of some of these constituents. If the concentration is lower than the Limit of Quantification (LOQ), analytical error is high.
There are currently two approaches to pre-concentration of impurities in hydrogen fuel. The first approach reported by Papadias [Papadias 2010] was to use hydrogen selective membranes. By using a palladium membrane allowing for hydrogen permeation, the impurities are thus accumulated. The schematic setup is shown in Figure 2.
Figure 2 Pre-concentration of impurities by use of a hydrogen selective membrane.
Silicon lined sample vessels are commonly used for sampling of hydrogen fuel in order to avoid losses of "sticky gases" to the vessel walls. This is also a challenge for the hydrogen selective membrane: Not only is gas molecules lost to the membrane, they also block the hydrogen permeation rate. There is, however, possible to tailor the membrane alloying composition but also to use temperature to reduce membrane surface adsorption.
Figure 3 shows the result of enrichment experiments for five fuel impurity constituents.

Deliverable D7.4
9
With hydrogen disulfide present in the gas, the gas permeation rate was significantly reduced. A total sampling rate of 6 hours was reported. The palladium alloy membrane used for the application was not optimized for the application with respect to sulphur tolerance and hydrogen permeation rate.
A more recent study by Papadias [Papadias 2012] approaches impurity pre-concentration by means of Pressure Swing Adsorption (PSA). By sampling at high pressure over an adsorbent like activated carbon on zeolite, impurities can be pre-concentrated by a desorption step by reducing the pressure. The enrichment efficiency is a function of adsorbent type and the desorption pressure. For a given adsorbent, the enrichment efficiency is a non-linear function of the pressure ratio of adsorption and desorption pressure. Generally, an as-low-as possible desorption pressure is beneficial, but the volume and/or pressure requirements for the analytical techniques normally limits desorption from being close to ambient pressure.
As higher temperature decreases the efficiency of the adsorbent, compression work as well as head of adsorption must be minimized by slow pressurization. Enrichment efficiency is shown in Figure 4.
Figure 3 Enrichment experiment containing five fuel impurities with a Calculated Enrichment Factor (CEF) of 15. B-1 was performed at temperatures between 220-250 °C while B-2 to B-5 was performed at 270 °C.

Deliverable D7.4
10
Unlike the case for pre-concentration through the application of a palladium membrane where the same enrichment factor is obtained for all constituents, enrichment factors vary with the adsorption affinity. Most impurities, Helium often being the exception, have higher affinities than hydrogen.
Both approaches have their pros and cons. The hydrogen selective membrane approach has the highest enrichment potential. The draw backs are the long sampling time required as well as membrane temperature control requirement. The PSA approach is more limited when it comes to enrichment potential. However, tenfold enrichment can be obtained in less than 20 minutes.
Neither work discusses the applicability of pre-concentration with respect to the full constituent list. From the Dynamis EU project [Besancon 2009], more information on impurity adsorption strengths are available. These data are shown in Figure 5.
Figure 5 Impurity adsorption strengths for impurities for a selection of adsorbents.
Figure 4 Enrichment factors for selected impurities for an experiment where a gas flow rate of 2.2 NLPM, adsoption at 75 atm and desorption at 2.42 atm.
Deliverable D7.4
11
SINTEF’s approach to simplification of hydrogen fuel QC has so far been to evaluate a possible reduction in the number of analytical techniques required to perform QC in accordance with the standards proposed. The two analytical techniques that could potentially cover most analytes are FTIR and GC-MS. The goal for task 7.2.1 of the H2Moves Scandinavia project was to ensure the quality hydrogen fuel supply. SINTEF approached this goal by subcontracting a laboratory capable of performing QC in accordance with standards. In addition, SINTEF collected samples to be analysed with FTIR and GC-MS. In this way, the findings by SINTEF could be reference to the results from the professional laboratory.
Another approach of interest for simplification of hydrogen fuel control QC is evaluation of co-variance between impurities in the fuel. By establishing knowledge of correlation between impurities, although most likely hydrogen feedstock dependent, QC could be simplified. The main challenge for this strategy is that the co-variance study is challenging due to low concentration levels, often near or below Limit of Quantification (LOQ). With low analytical performance, the co-variance study requires a large population of samples in order to establish knowledge about known correlations. One possible approach to remedy this is to make use of pre-concentration techniques in order to simplify analysis.

Deliverable D7.4
12
2 SAMPLING
2.1 Methodology Sampling instrumentation for gases at 700 bar was not commercially available at the start of the project activies for Task 7.2.1. In collaboration with Hochdruch Reduziertechnik GmbH, a sampling unit was designed. The unit is shown in Figure 6.
Figure 6 High-pressure sampling unit.
Although a contract was made for 12 weeks delivery time, due to technical difficulties with components during pressure verification at approximately 1000 bar. It was then resolved to rent 350 bar gas sampling instrumentation from Smart Chemistry. The unit is shown with a 700 bar receptacle in Figure 7.
For sampling of particles, a 700 bar sampling unit was available for purchase, but not for rent, from Wenger Engineering, GMBH. The purchase of gas sampling unit(s) was not an option given the task budget for direct expenses. It was therefore resolved to rent particle sampling units from Smart Chemistry. The PSU is shown in Figure 7.

Deliverable D7.4
13
Figure 7 Smart Chemistry Particle Sampling Unit (left) and gas sampling instrumentation (right).
As sampling was to be conducted at 350 bar, the available fuel cell vehicles could not be used as sink for the sampled hydrogen. The hydrogen fuel was therefore vented through two ½” tubes. This approach also made manual override of the HRS safety system required. With no pressure detected at the nozzle (like in a completely empty hydrogen gas powered vehicle or at ambient condition) the HRS safety system shuts down the hydrogen flow.
2.1.1 HRS Økern: 2012-11-06 The HRS at Økern has Hydrogen fuel from alkaline electrolysis feedstock. It is not produced at site, but trucked-in from Rjukan in Norway. The HRS has separate nozzles for 350 and 700 bar. As particle sampling instrumentation was only available for 350 bar, all sampling was performed at this nozzle. The HRS operator calculated the mass of hydrogen from the buffer tank pressure drop. However, for particle sampling, the requested 2 kg of fuel turned out to be 0.95 kg. Gaseous samples were collected in silicon lined containers at 70 bar for subsequent analysis at Smart Chemistry and at SINTEF. All hydrogen sampled through gas containers and particle filters was vented to air.
2.1.2 HRS Gaustad: 2012-11-06 The HRS at Gaustad (SINTEF) delivers hydrogen fuel from onsite electrolytic production. It is only equipped with a 700 bar nozzle so the operators from H2 Logic had to reduce delivery pressure to fit 350 bar certified sampling instrumentation. The operators used software to gauge 2.1 kg of hydrogen through the PSU. As there were no 700 bar nozzle available for the gas sampling unit, an additional 0.3 kg of hydrogen was passed through the PSU connected upstream the gas sampling unit. The gas samples were collected in silicon lined containers at 70 bar for subsequent analysis at Smart Chemistry and at SINTEF. All hydrogen sampled through gas containers and particle filters was vented to air.
2.1.3 HRS Herøya: 2012-11-07 The HRS on Herøya, Porsgrunn delivers by-product hydrogen from chlorine-alkaline industry at 350 bar. The operators used software to gauge 2.4 kg of hydrogen through the PSU. Gaseous samples were collected in silicon lined containers at 70 bar for subsequent gas analysis. All hydrogen sampled through gas containers and particle filters was vented to air.
Deliverable D7.4
14
2.1.4 HRS Økern: 2013-01-16 SINTEF received the 700 bar sampling equipment from Germany after the QC sampling campaign was over. Even if the task activity was ended in December 2013, SINTEF arranged for one sampling campaign in January 2013 in order to make use of the sampling unit. Upon arrival at HRS Økern, SINTEF representatives were informed that the instrument specification was insufficient for sampling at 700 bar. Apparently, the pressure testing at around 1025 bar was insufficient for this application. The reason given was that the initial pressure pulse at the 700 bar nozzle could be higher due to temperature effects. SINTEF was therefore unable to sample hydrogen fuel at 700 bar as planned.
Detailed description is given in Appendix 3.

Deliverable D7.4
15
3 RESULTS FROM HYDROGEN FUEL QC
3.1 Results from SmartChemistry The full report from SmartChemistry is given in Appendix 1. The main results and results of interest are shown in Table 1.
Table 1: SmartChemistry QC results. All results in ppmv unless specifically noted. Tolerance levels are in accordance with SAE J2719. Results in read are in conflict with the standard.
Constituent Tolerance Porsgrunn Gaustad Økern Total Hydrocarbons
(C1 basis) 2 0.80 0.035 0.049
Nitrogen 100* 2800 7.7 < 5 Argon 100* 0.77 < 0.5 1.9
Carbon Dioxide 2 3.3 < 0.5 < 0.5 Carbon Monoxide 0.2 0.0097 0.0047 0.0010
Total Sulphur 0.004 0.00022 < 0.0001 < 0.0001 Total Halogenates 0.05 < 0.002 0.0042 0.014
Particulate Concentration 1 mg kg-1 0.042 0.14 0.21
Number of particles 11 48 7 Hydrogen Fuel Index 99.97 % 99.7195% 99.9992 % 99.9998%
*The sum N and Ar required tobe less than 100 ppm.
The individual results are discussed in the following paragraphs.
3.1.1 Total Hydrocarbons The total hydrocarbon level in Porsgrunn was higher than for the other HRSs, although well below the tolerance level. The main hydrocabons found were Methane (0.39 ppmv) and Ethane (0.19 ppmv). Traces of acetone, heptane and propane were also reported.
3.1.2 Nitrogen The nitrogen level of 0.28 % found in Porsgrunn lowers the fuel index well outside the tolerance level of 99.97 %.
3.1.3 Argon For the HRS in Porsgrunn, a significant concentration of 0.77 ppmv was found. The sum of argon and nitrogen should be less than 100 ppm.
3.1.4 Carbon Dioxide Carbon dioxide was only detected at Porsgrunn at a level slightly higher than the tolerance limit.
3.1.5 Carbon Monoxide All three HRSs were well within the tolerance limit. Again, the HRS in Porsgrunn has the highest level, as the case is for other impurities containing carbon listed in Table 1.

Deliverable D7.4
16
3.1.6 Total Sulphur For Porsgrunn a total sulphur level of 0.22 ppbv was recorded. This is well below the tolerance limit of 4 ppbv. 0.18 ppbv of this was found in the form of carbon disulphide. The rest was made up by carbonyl sulphide.
For Gaustad and Økern, hydrogen sulphide and carbonyl disulfide were detected in concentrations just above the dectection limit of 0.02 ppbv.
3.1.7 Total Halogenates For the Porsgrunn HRS, with hydrogen sourcing from chlor-alkali electrolysis, this result was of particular interest. The results show that all three HRSs are well below the 50 ppbv tolerance limit. For both Gaustad and Økern, traces of tetrachlorohexafluorobutane were found. These C4Cl4F6 isomers are frequently found and are belived to be sourcing from stainless steel tubing [Hsu 2012].
3.2 Particles For all HRSs, the particle concentration was found to be well below the tolerance limit of 1 mg kg-1. The HRS at Økern had the highest concentration with 0.21 mg kg-1 while the lowest result was found for Porsgrunn with 0.042 mg kg-1. Both prevailing standards, SAE J2719 and ISO/TS 14687-2 sets maximum allowable particle to be less than 10 µm. All particles counted by SmartChemistry is larger than 10 µm.
For the Gaustad HRS visual inspection of the filter revealed several oily stains, green of colour. The total particle count was 48 and the larges particle found was 1.4 mm.
For the HRS at Porsgrunn, 11 discrete particles was found. The parges particle was measured to be 0.22 mm.
For the Økern HRS seven particles were found. The largest two, at 0.47 and 0.51, appeared in polarized light to be of a metallic nature.
3.3 Results from SINTEF
3.3.1 Long Path FTIR An extensive study on applicability of FTIR to hydrogen has been done by SINTEF. The scope of this work is too extensive for this report, so only the analytical results are presented. The full-length MEMO can be found in Appendix 2.
As the study has been based on real samples, collected from three HRSs in the Oslo area, the study is limited to the species found in these samples. This does not mean that FTIR could be applied to other impurities listed in the hydrogen fuel for fuel cells standards. In order to evaluate the full potential of FTIR, synthetic gas compositions have to be analysed. Optionally, pre-concentration of impurities would also extend the list of quantifiable impurities in the fuel.
The result from the SINTEF FTIR analysis is shown in Table 2.

Deliverable D7.4
17
Table 2 Analytical results from Long Path FTIR quantification of impurities.
Analyte CO CO2 H2O CH4 C3H8 C4H10 Heptane Acetone
LOD 5 ppb 100 ppb 1 ppm 5 ppb 10 ppb 20 ppb 10 ppb 40 ppb
Gaustad 12 ppb < 500 ppb < 1 ppm 8 ppb <10 ppb < 20 ppb < 10 ppb < 40 ppb
Porsg. 21 ppb 3150 ppb < 1 ppm 22 ppb 45 ppb 460 ppb < 40 ppb < 80 ppb
Økern 11 ppb < 500 ppb < 1 ppm 5 ppb <10 ppb < 20 ppb < 10 ppb < 40 ppb
The estimated detection limits are better than required by the fuel standards. Especially the LOD for CO is very good. This is important with respect to the fact that CO has been proposed as a potential canary constituent.
The SINTEF results verify the trends in SmartChemistry data for several impurities. The high CO2 level found for the Porsgrunn HRS is this way verified. The trend for CO is also similar for the two analyses, although the
concentration levels are slightly different. The higher level of hydrocarbons is also verified by the SINTEF analysis.
3.3.2 GC-MS SINTEF approach to QC simplification has been to cover the list of impurities by as few analytical techniques as possible. An inherent limitation to IR spectroscopy is the ability to analyse homonuclear molecues (ie. N2, O2, Cl2 etc.) as well as helium and argon. One of the more versatile instruments available to SINTEF was a GC-MS from agilent: 5975T LTM. Upon adaptation to the standard method used and developed by Smart Chemistry (ASTM D7649-10), several challenges were faced:
• Due to laboratory safety regulations, the GC-MS was not allowed to use hydrogen as carrier gas
• Multivalve, pressurized sample and standard injection instrumentation was not available
• Standards with hydrogen as balance gas could not be made by gas mixing in the laboratory
As the proposed instrument setup is quite complex, SINTEF attempted a simplified approach. Using a gas tight syringe for sample injection is not feasible when trying to quantify components in air. However, a manual multivalve with a 100 uL sample loop made sample injection from the canisters possible after pressure reduction.
Quantification was set up for helium carrier gas and for gas mixtures balanced by helium. Examples on calibration curves are given in Figure 8.

Deliverable D7.4
18
Figure 8 GC-MS calibration curves for Ar (left, 1,2,4 and 10 ppmv) and N2 (right, 5, 10, 20 and 50 ppmv).
The curves show that there is scope for analysis of these impurities in the low ppmv concentration range.
After analysing samples from the three HRSs, the results were compared with those from SmartChemistry.The correlations were not good. After comparing the calibrations with samples of hydrogen 5.0, it became clear that the ionization of analytes is significantly different in hydrogen and helium gas.
A direct comparison between hydrogen 5.0 and the Porsgrunn samples is shown in Figure 9.

Deliverable D7.4
19
Figure 9 Comparison between H2 5.0 and Porsgrunn sample.
The high nitrogen level found in the Porsgrunn sample is seen in contrast to the hydrogen 5.0 sample (m/z 14, 29 and partly 28). A lower oxygen level is indicated by m/z 32 whereas argon (m/z 40) and carbon dioxide (m/z 44). The water concentration appears to be fairly similar for the two samples (m/z 18).
SINTEF has experienced that for the application of GC-MS to the fuel quality assessment, hydrogen carrier and gas balancing is required. The current investigation used a limited mass range for investigation (10-50 m/z). In order to investigate the full potential of the GC-MS, a wider mass range should be applied in order to evaluate heavier mass fragments.
Deliverable D7.4
20
4 LITERATURE [Papadias 2010] International Journal of Hydrogen Energy, 35 (2010)
12480-12490.
[Papadias 2012] International Journal of Hydrogen Energy, 37 (2012) 14413-14426
[Besancon 2009] International Journal of Hydrogen Energy, 34 (2009) 2350-2360.
[Hsu 2012] International Journal of Hydrogen Energy, 37 (2012) 1770-1780.

Deliverable D7.4
21
5 LIST OF APPENDICES 1. SmartChemistry analytical report
2. SINTEF report on FTIR analysis of fuel samples
3. SINTEF note on high temperature (700 bar) sampling
www.SmartChemistry.com
Report SummaryPorsgrunn Gaustad Økern
12SIN001-01 12SIN001-02 12SIN001-03
ConstituentSAE Limits (μmol/mol)
Smart Chemistry Detection Limits
(μmol/mol)
Concentration (μmol/mol)
Concentration (μmol/mol)
Concentration (μmol/mol) Analytical Method
Water 5 1 < 1 < 1 < 1 ASTM D7649-10
Total Hydrocarbons (C1 Basis) 2 0.80 0.035 0.049Methane 0.001 0.39 0.022 0.033 ASTM WK34574
Acetone 0.001 0.0010 0.0012 0.0018 ASTM WK34574
Ethane 0.19 0.0047 0.0027Heptane 0.0011 < 0.001 < 0.001
Propane 0.0099 < 0.002 < 0.002
Isopropyl Alcohol < 0.001 < 0.001 0.0016Oxygen 5 2 < 2 < 2 < 2 ASTM D7649-10
Helium 300 10 < 10 < 10 < 10 ASTM D1946
Nitrogen, Argon 100
Nitrogen 5 2800 7.7 < 5 ASTM D7649-10
Argon 0.5 0.77 < 0.5 1.9 ASTM D7649-10
Carbon Dioxide 2 0.5 3.3 < 0.5 < 0.5 ASTM D7649-10
Carbon Monoxide 0.2 0.0009 0.0097 0.0047 0.0010 ASTM WK34574
Total Sulfur 0.004 0.0001 0.00022 < 0.0001 < 0.0001 ASTM D7652-11
Hydrogen Sulfide 0.00002 < 0.00002 0.000021 0.000024 ASTM D7652-11
Carbonyl Sulfide 0.00002 0.000034 < 0.00002 < 0.00002 ASTM D7652-11
Methyl Mercaptan 0.00002 < 0.00002 < 0.00002 < 0.00002 ASTM D7652-11
Carbon Disulfide 0.00002 0.00018 0.000029 0.000023 ASTM D7652-11
Formaldehyde 0.01 0.001 < 0.001 < 0.001 < 0.001 ASTM WK34574
Formic Acid 0.2 0.001 < 0.001 < 0.001 < 0.001 ASTM WK34574
Ammonia 0.1 0.04 < 0.04 < 0.04 < 0.04 ASTM WK34574
Total halogenates 0.05 0.0042 0.014Chlorine 0.004 < 0.002 < 0.004 < 0.004 ASTM WK34574
Hydrogen Chloride 0.001 < 0.002 < 0.002 < 0.002 ASTM WK34574
Hydrogen Bromide 0.001 < 0.001 < 0.001 < 0.001 ASTM WK34574
Organic Halides (32 compounds in red and bold listed in "Other Hydrocarbons"). Smart
Chemistry limit is for each indidual organic halide. 0.0042 0.014C4Cl4F6 0.001 < 0.001 0.0042 0.014 ASTM WK34574
Particulate Concentration 1mg/Kg 0.042 mg/kg 0.14 mg/kg 0.21 mg/kg ASTM D7651-10
Particulates Found & Size (ASTM D7634-10) - Images of particulates and pinholes found are in Table 1
Particulate 1 – 0.18mm Particulate 2 – 0.11mmParticulate 3 – 0.15mmParticulate 4 – 0.13mmParticulate 5 – 0.15mm Particulate 6 – 0.24mmParticulate 7 – 0.13mmParticulate 8 – 0.22mmParticulate 9 – 0.14mmParticulate 10 – 0.13mmParticulate 11 – 0.11mm
There are total 48 particulates found with their sizes over
0.03mm. The particulate size distribution is listed below.
# of Particulate @ 0.12mm – 1# of Particulate @ 0.07mm – 3# of Particulate @ 0.06mm – 1# of Particulate @ 0.05mm – 6# of Particulate @ 0.04mm – 22# of Particulate @ 0.03mm – 15
Particulate 1 - 0.47mm Particulate 2 - 0.51mm Particulate 3 – 0.06mm Particulate 4 – 0.26mm Particulate 5 – 0.30mm Particulate 6 - 0.15mm Particulate 7 – 0.41mm
Hydrogen Fuel Index The
hydrogen fuel index is the value obtained when the amount of aggregate impurities, as, expressed as percent (µmole/µmole), is subtracted from 100%. (Section 3.5 of SAE J2719) The particulate is NOT included in Hydrogen Fuel Index. 99.7195% 99.9992% 99.9998%
SMART CHEMISTRY, 3401 La Grande Blvd, Sacramento, CA 95823, (916)391-3300, [email protected]

www.Smartchemistry.com
Analytical Data for Non-Hydrogen Gaseous Constituents
Smart Chemistry, 3401 La Grande Blvd, Sacramento, CA 95823, (916)391-3300, [email protected]
The analytical data is tabulated for each non-hydrogen gaseous constituent, required by Chevron, listed in the sequence below. The analytical data includes calibration standards, detection limit study, sample analysis, spike, or duplicate.
Non-Hydrogen Gaseous Constituents 1. Water 2. Total Hydrocarbons
2.1 Methane 2.2 Other Hydrocarbons
3. Oxygen 4. Helium 5. Nitrogen 6. Argon 7. Carbon Dioxide 8. Carbon Monoxide 9. Sulfur
9.1 H2S (Only); COS, CH3SH & CS2 (Not Required) 9.2 Total Sulfurs, H2S, COS, CH3SH, CH3CH2SH, CS2, (CH3)3CSH
and Tetrahydrothiophene are analyzed (Not Required) 10. Formaldehyde (Not Required) 11. Formic Acid (Not Required) 12. Ammonia 13. Total Organic Halogenates (Not Required)
13.1 Chlorine (Not Required) 13.2 Hydrogen Chloride (Not Required) 13.3 Hydrogen Bromide (Not Required) 13.4 Organic Halides (32 compounds in red and bold listed in "Other Hydrocarbons")

www.SmartChemistry.com
Analytical Data
File Name, Sample, Sample Loop Pressure (psi)
21005B.D - PRAXAIR UHP H2;ENTECH SPLIT 0.01;3 10UL G0793;10,5&2UL AIR;ES1:100;CF=1.5ML/MN214.7
12122001.D - G0860,4PPM CO2,3.2PPM AR,4PPM N2 & O2;ES0.01 3 10UL G0793;10,5&1UL AIR;ES1:100;CF=1.5ML/MN162.7
12122002.D - G0860,4PPM CO2,3.2PPM AR,4PPM N2 & O2;ES0.01 3 10UL G0793;10,5&1UL AIR;ES1:100;CF=1.5ML/MN158.7
12122003.D - G0860,4PPM CO2,3.2PPM AR,4PPM N2 & O2;ES0.01 3 10UL G0793;10,5&1UL AIR;ES1:100;CF=1.5ML/MN154.8
12122004.D - PRAXAIR UHP H2;ES0.01 3 10UL G0793;10,5&2UL AIR;ES1:100;CF=1.5ML/MN218.8
12122005.D - 12SIN00101#5,PORSGRUNN I,R121220;ES0.01 3 10UL G0793;10,5&2UL AIR;ES1:100;CF=1.5ML/MN173.9
12122006.D - 12SIN00101#5,PORSGRUNN I,R121220;ES0.01 3 10UL G0793;10,5&2UL AIR;ES1:100;CF=1.5ML/MN312.5
12122007.D - 12SIN00101#5,PORSGRUNN I,R121220;ES0.01 3 10UL G0793;10,5&2UL AIR;ES1:100;CF=1.5ML/MN263.9
12122008.D - 12SIN00102#13,GAUSTAD I,R121220;ES0.01 3 10UL G0793;10,5&2UL AIR;ES1:100;CF=1.5ML/MN348
12122009.D - 12SIN00102#13,GAUSTAD I,R121220;ES0.01 3 10UL G0793;10,5&2UL AIR;ES1:100;CF=1.5ML/MN318.8
12122010.D - 12SIN00102#13,GAUSTAD I,R121220;ES0.01 3 10UL G0793;10,5&2UL AIR;ES1:100;CF=1.5ML/MN376
12122011.D - 12SIN00103#8,OKEM I,R121220;ES0.01 3 10UL G0793;10,5&2UL AIR;ES1:100;CF=1.5ML/MN148.2
12122012.D - 12SIN00103#8,OKEM I,R121220;ES0.01 3 10UL G0793;10,5&2UL AIR;ES1:100;CF=1.5ML/MN137.7
12122013.D - 12SIN00103#8,OKEM I,R121220;ES0.01 3 10UL G0793;10,5&2UL AIR;ES1:100;CF=1.5ML/MN127.6
1. H2O ASTM 7649-10
H2O Sample RT or BAD RF in Pink
H2O Sample Area
Co-Injected Peak RT
Co-Injected Peak AREA
Conc. (PPMV) of
H2O in G0793 RF
H2O CONC. (ppmv)
0.00 0 0 874012 0 1.4E-09 0.000 489084 0 1.3E-090 152421 0 1.6E-09
0.00 0 0 1629882 0 7.6E-10 0.000 899700 0 6.9E-100 267282 0 9.2E-10
0.00 0 0 1631681 0 7.6E-10 0.000 917381 0 6.7E-100 271572 0 9.1E-10
0.00 0 0 1685953 0 7.3E-10 0.000 887162 0 7.0E-100 287202 0 8.6E-10
0.00 0 0 1604737 0 7.7E-10 0.000 908840 0 6.8E-100 289649 0 8.5E-10
0.00 0 0 1680346 0 7.3E-10 0.000 909931 0 6.8E-100 294825 0 8.4E-10
0.00 0 0 1758473 0 7.0E-10 0.000 858392 0 7.2E-10
0.00 254121 0 9.7E-10
0.00 0 0 1620567 0 7.6E-10 0.000 866575 0 7.1E-100 270546 0 9.1E-10
0.00 0 0 1635131 0 7.5E-10 0.000 898412 0 6.9E-100 282882 0 8.7E-10
0.00 0 0 1541051 0 8.0E-10 0.000 869310 0 7.1E-100 283131 0 8.7E-10
0.00 0 0 1760689 0 7.0E-10 0.000 940462 0 6.6E-100 274811 0 9.0E-10
0.00 0 0 1711405 0 7.2E-10 0.000 930398 0 6.6E-100 324346 0 7.6E-10
0.00 0 0 1723569 0 7.2E-10 0.000 837966 0 7.4E-100 318215 0 7.8E-10
0.00 0 0 1618989 0 7.6E-10 0.000 928553 0 6.6E-100 213801 0 1.2E-09
Smart Chemistry, 3401 La Grande Blvd, Sacramento, CA 95823, [email protected], (916)391-3300
www.SmartChemistry.com
Analytical Data
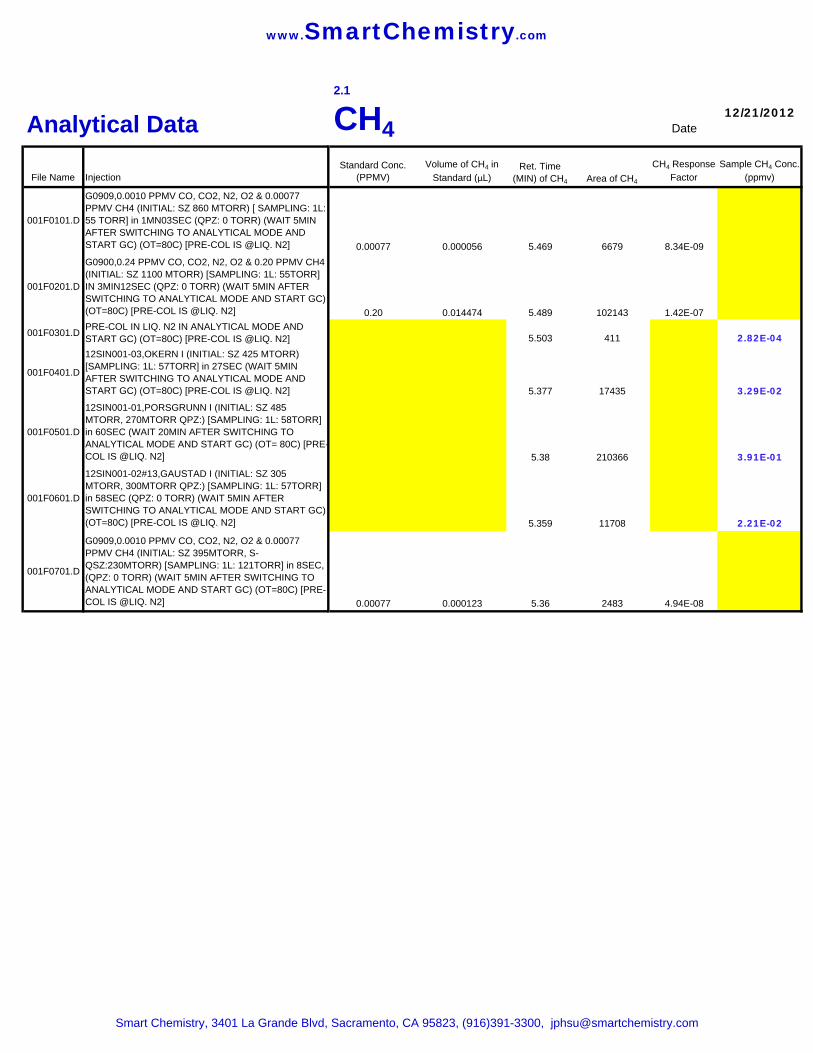
File Name Injection
001F0101.D
G0909,0.0010 PPMV CO, CO2, N2, O2 & 0.00077 PPMV CH4 (INITIAL: SZ 860 MTORR) [ SAMPLING: 1L: 55 TORR] in 1MN03SEC (QPZ: 0 TORR) (WAIT 5MIN AFTER SWITCHING TO ANALYTICAL MODE AND START GC) (OT=80C) [PRE-COL IS @LIQ. N2]
001F0201.D
G0900,0.24 PPMV CO, CO2, N2, O2 & 0.20 PPMV CH4 (INITIAL: SZ 1100 MTORR) [SAMPLING: 1L: 55TORR] IN 3MIN12SEC (QPZ: 0 TORR) (WAIT 5MIN AFTER SWITCHING TO ANALYTICAL MODE AND START GC) (OT=80C) [PRE-COL IS @LIQ. N2]
001F0301.D PRE-COL IN LIQ. N2 IN ANALYTICAL MODE AND START GC) (OT=80C) [PRE-COL IS @LIQ. N2]
001F0401.D
12SIN001-03,OKERN I (INITIAL: SZ 425 MTORR) [SAMPLING: 1L: 57TORR] in 27SEC (WAIT 5MIN AFTER SWITCHING TO ANALYTICAL MODE AND START GC) (OT=80C) [PRE-COL IS @LIQ. N2]
001F0501.D
12SIN001-01,PORSGRUNN I (INITIAL: SZ 485 MTORR, 270MTORR QPZ:) [SAMPLING: 1L: 58TORR] in 60SEC (WAIT 20MIN AFTER SWITCHING TO ANALYTICAL MODE AND START GC) (OT= 80C) [PRE-COL IS @LIQ. N2]
001F0601.D
12SIN001-02#13,GAUSTAD I (INITIAL: SZ 305 MTORR, 300MTORR QPZ:) [SAMPLING: 1L: 57TORR] in 58SEC (QPZ: 0 TORR) (WAIT 5MIN AFTER SWITCHING TO ANALYTICAL MODE AND START GC) (OT=80C) [PRE-COL IS @LIQ. N2]
001F0701.D
G0909,0.0010 PPMV CO, CO2, N2, O2 & 0.00077 PPMV CH4 (INITIAL: SZ 395MTORR, S- QSZ:230MTORR) [SAMPLING: 1L: 121TORR] in 8SEC, (QPZ: 0 TORR) (WAIT 5MIN AFTER SWITCHING TO ANALYTICAL MODE AND START GC) (OT=80C) [PRE-COL IS @LIQ. N2]
2.1
CH4 Date12/21/2012
Standard Conc. (PPMV)
Volume of CH4 in Standard (µL)
Ret. Time (MIN) of CH4 Area of CH4
CH4 Response Factor
Sample CH4 Conc. (ppmv)
0.00077 0.000056 5.469 6679 8.34E-09
0.20 0.014474 5.489 102143 1.42E-07
5.503 411 2.82E-04
5.377 17435 3.29E-02
5.38 210366 3.91E-01
5.359 11708 2.21E-02
0.00077 0.000123 5.36 2483 4.94E-08
Smart Chemistry, 3401 La Grande Blvd, Sacramento, CA 95823, (916)391-3300, [email protected]

Smart Chemistry Corporation
3402 La Grande Blvd, Sacramento, CA 95823, (916)391-3300, (916)391-3440 (fax), www.smartchemistry.com, [email protected]
2.3 Analytical Laboratory Report for "Other Hydrocarbons"ASTM 5466
Client: SINTEF Field ID #: 400ML 12SIN001-01#5Hydrogen Station at: Porsgrunn Lab Sample ID: 12SIN00101
Sample Type: Hydrogen Fuel Concentration Units: PPBVDate Sampled: 11092012,12:00 Date File Location 12SIN001TPH.pdfDate Received: 1109/2012 Data Filename: 12122303.DDate Analyzed: 12042012 Dilution Factor: 1.0Time Analyzed: 12:43 pm
Analytes MW CASNUM MQL (PPBV) Results (PPBV) Qualifier MQL (ug/L) Results (ug/L)
1,1,1-Trichloroethane 132 71-55-6 1 0 U 0.005 0
1,1,2,2-Tetrachloroethane 166 79-34-5 1 0 U 0.007 01,1,2-Trichloroethane 132 79-00-5 1 0 U 0.005 01,2-Dibromoethane 186 106-93-4 1 0 U 0.008 01,1-Dichloroethane 98 75-34-3 1 0 U 0.004 01,1-Dichloroethene 96 75-35-4 1 0 U 0.004 01,2,4-Trichlorobenzene 180 120-82-1 1 0 U 0.007 01,2,4-Trimethylbenzene 120 95-63-6 1 0 U 0.005 01,2-Dichloroethane 98 107-06-2 1 0 U 0.004 01,2-Dichloropropane 112 78-87-5 1 0 U 0.005 01,3,5-Trimethylbenzene 120 108-67-8 1 0 U 0.005 01,3-Butadiene 54 106-99-0 1 0 U 0.002 01,2-Dichlorobenzene 146 95-50-1 1 0 U 0.006 01,3-Dichlorobenzene 146 541-73-1 1 0 U 0.006 01,4-Dichlorobenzene 146 106-46-7 1 0 U 0.006 01,4-Dioxane 88 123-91-1 1 0 U 0.004 02-Butanone 72 78-93-3 1 0 U 0.003 02-Hexanone 100 591-78-6 1 0 U 0.004 04-Ethyltoluene 120 622-96-8 1 0 U 0.005 04-Methyl-2-Pentanone 100 108-10-1 1 0 U 0.004 0Acetone 58 67-64-1 1 1 = 0.002 0.0024Ethene 28 9002-88-4 2 0 U 0.002 0Benzene 78 71-43-2 1 0 U 0.003 0Benzyl Chloride 126 100-44-7 1 0 U 0.005 0Bromodichloromethane 162 75-27-4 1 0 U 0.007 0Bromoform 250 75-25-2 1 0 U 0.01 0Bromomethane 94 74-83-9 1 0 U 0.004 0Carbon Disulfide 76 75-15-0 1 0 U 0.003 0Carbon tetrachloride 152 56-23-5 1 0 U 0.006 0Chlorobenzene 112 108-90-7 1 0 U 0.005 0Chloroethane 64 75-00-3 1 0 U 0.003 0Chloroform 118 67-66-3 1 0 U 0.005 0Chloromethane 50 74-87-3 1 0 U 0.002 0cis-1,2-dichloroethene 96 156-59-2 1 0 U 0.004 0cis-1,3-Dichloropropene 110 10061-01-5 1 0 U 0.005 0Cyclohexane 84 110-82-7 1 0 U 0.003 0Dibromochloromethane 206 124-48-1 1 0 U 0.008 0Dichlorodifluoromethane 120 75-71-8 1 0 U 0.005 0Ethane 30 74-84-0 2 186 E 0.002 0.23Ethanol 46 64-17-5 1 0 U 0.002 0Ethyl Acetate 88 141-78-6 1 0 U 0.004 0Ethylbenzene 106 100-41-4 1 0 U 0.004 0Freon113 186 76-13-1 1 0 U 0.008 0Freon114 170 76-14-2 1 0 U 0.007 0Heptane 100 142-82-5 1 1.1 = 0.004 0.0045Hexane 86 110-54-3 1 0 U 0.004 0Hexachlorobutadiene 258 87-68-3 1 0 U 0.01 0Isopropyl Alcohol 60 67-63-0 1 0 U 0.002 0Methylene chloride 84 75-09-2 1 0 U 0.003 0Methyl tert-Butyl Ether 88 1634-04-4 1 0 U 0.004 0Propane 44 74-98-6 2 9.9 = 0.004 0.018Propene 36 115-07-1 1 0 U 0.001 0Styrene 104 100-42-5 1 0 U 0.004 0Tetrachloroethene 164 127-18-4 1 0 U 0.007 0Tetrahydrofuran 72 109-99-9 1 0 U 0.003 0Toluene 92 108-88-3 1 0 U 0.004 0trans-1,2-dichloroethene 96 156-60-5 1 0 U 0.004 0trans-1,3-Dichloropropene 110 10061-02-6 1 0 U 0.005 0Trichloroethene 130 79-01-6 1 0 U 0.005 0Trichlorofluoromethane 136 75-69-4 1 0 U 0.006 0Vinyl acetate 86 108-05-4 1 0 U 0.004 0Vinyl chloride 62 75-01-4 1 0 U 0.003 0Xylenes, m&p- 106 108-38-3 & 106-42-3 1 0 U 0.004 0Xylenes, o- 106 95-47-6 1 0 U 0.004 0
1,1,3,4-Tetrachlorohexafluorobutane 334 423-38-1 1 0 U 0.01 0
Bromochloromethane (surrogate) 128 74-97-5 70 =
4-BFB(surrogate) 174 460-00-4 103 =NOTES:U - Analytes not detected at, or above the stated detection limit.0 - A result of zero represents an undetected result at the MQL reported and does not imply an actual value.PPBV - Parts per billion volume.MQL - Method quantitation limit.Surrogate results are in units of percent recovery with control limits: 65 to 135%.The compounds in red and bold are organic halides.
Tentatively Identified Compound Estimated Concentration (PPBV)None
Page 1 of 1 12SIN001.xlsx 1/7/2013 12:55 AM

Smart Chemistry Corporation
3402 La Grande Blvd, Sacramento, CA 95823, (916)391-3300, (916)391-3440 (fax), www.smartchemistry.com, [email protected]
2.3 Analytical Laboratory Report for "Other Hydrocarbons"ASTM 5466
Client: SINTEF Field ID #: 400ML 12SIN001-02#13
Hydrogen Station at: Gaustad Lab Sample ID: 12SIN00102
Sample Type: Hydrogen Fuel Concentration Units: PPBV
Date Sampled: 11092012,12:00 Date File LocationDate Received: 12202012 Data Filename: 12122304.D
Date Analyzed: 12042012 Dilution Factor: 1.0
Time Analyzed: 1:27 pm
Analytes MW CASNUM MQL (PPBV) Results (PPBV) Qualifier MQL (ug/L) Results (ug/L)
1,1,1-Trichloroethane 132 71-55-6 1 0 U 0.005 0
1,1,2,2-Tetrachloroethane 166 79-34-5 1 0 U 0.007 0
1,1,2-Trichloroethane 132 79-00-5 1 0 U 0.005 0
1,2-Dibromoethane 186 106-93-4 1 0 U 0.008 0
1,1-Dichloroethane 98 75-34-3 1 0 U 0.004 0
1,1-Dichloroethene 96 75-35-4 1 0 U 0.004 0
1,2,4-Trichlorobenzene 180 120-82-1 1 0 U 0.007 0
1,2,4-Trimethylbenzene 120 95-63-6 1 0 U 0.005 0
1,2-Dichloroethane 98 107-06-2 1 0 U 0.004 0
1,2-Dichloropropane 112 78-87-5 1 0 U 0.005 0
1,3,5-Trimethylbenzene 120 108-67-8 1 0 U 0.005 0
1,3-Butadiene 54 106-99-0 1 0 U 0.002 0
1,2-Dichlorobenzene 146 95-50-1 1 0 U 0.006 0
1,3-Dichlorobenzene 146 541-73-1 1 0 U 0.006 0
1,4-Dichlorobenzene 146 106-46-7 1 0 U 0.006 0
1,4-Dioxane 88 123-91-1 1 0 U 0.004 0
2-Butanone 72 78-93-3 1 0 U 0.003 0
2-Hexanone 100 591-78-6 1 0 U 0.004 0
4-Ethyltoluene 120 622-96-8 1 0 U 0.005 0
4-Methyl-2-Pentanone 100 108-10-1 1 0 U 0.004 0
Acetone 58 67-64-1 1 1.2 = 0.002 0.0028
Ethene 28 9002-88-4 2 0 U 0.002 0
Benzene 78 71-43-2 1 0 U 0.003 0
Benzyl Chloride 126 100-44-7 1 0 U 0.005 0
Bromodichloromethane 162 75-27-4 1 0 U 0.007 0
Bromoform 250 75-25-2 1 0 U 0.01 0
Bromomethane 94 74-83-9 1 0 U 0.004 0
Carbon Disulfide 76 75-15-0 1 0 U 0.003 0
Carbon tetrachloride 152 56-23-5 1 0 U 0.006 0
Chlorobenzene 112 108-90-7 1 0 U 0.005 0
Chloroethane 64 75-00-3 1 0 U 0.003 0
Chloroform 118 67-66-3 1 0 U 0.005 0
Chloromethane 50 74-87-3 1 0 U 0.002 0
cis-1,2-dichloroethene 96 156-59-2 1 0 U 0.004 0
cis-1,3-Dichloropropene 110 10061-01-5 1 0 U 0.005 0
Cyclohexane 84 110-82-7 1 0 U 0.003 0
Dibromochloromethane 206 124-48-1 1 0 U 0.008 0
Dichlorodifluoromethane 120 75-71-8 1 0 U 0.005 0
Ethane 30 74-84-0 2 4.7 = 0.002 0.0058
Ethanol 46 64-17-5 1 0 U 0.002 0
Ethyl Acetate 88 141-78-6 1 0 U 0.004 0
Ethylbenzene 106 100-41-4 1 0 U 0.004 0
Freon113 186 76-13-1 1 0 U 0.008 0
Freon114 170 76-14-2 1 0 U 0.007 0
Heptane 100 142-82-5 1 0 U 0.004 0
Hexane 86 110-54-3 1 0 U 0.004 0
Hexachlorobutadiene 258 87-68-3 1 0 U 0.01 0
Isopropyl Alcohol 60 67-63-0 1 0 U 0.002 0
Methylene chloride 84 75-09-2 1 0 U 0.003 0
Methyl tert-Butyl Ether 88 1634-04-4 1 0 U 0.004 0
Propane 44 74-98-6 2 0 U 0.004 0
Propene 36 115-07-1 1 0 U 0.001 0
Styrene 104 100-42-5 1 0 U 0.004 0
Tetrachloroethene 164 127-18-4 1 0 U 0.007 0
Tetrahydrofuran 72 109-99-9 1 0 U 0.003 0
Toluene 92 108-88-3 1 0 U 0.004 0
trans-1,2-dichloroethene 96 156-60-5 1 0 U 0.004 0
trans-1,3-Dichloropropene 110 10061-02-6 1 0 U 0.005 0
Trichloroethene 130 79-01-6 1 0 U 0.005 0
Trichlorofluoromethane 136 75-69-4 1 0 U 0.006 0
Vinyl acetate 86 108-05-4 1 0 U 0.004 0
Vinyl chloride 62 75-01-4 1 0 U 0.003 0
Xylenes, m&p- 106 108-38-3 & 106-42-3 1 0 U 0.004 0
Xylenes, o- 106 95-47-6 1 0 U 0.004 0
1,1,3,4-Tetrachlorohexafluorobutane 334 423-38-1 1 4.22 = 0.01 0.058
Bromochloromethane (surrogate) 128 74-97-5 70 =
4-BFB(surrogate) 174 460-00-4 104 =
NOTES:U - Analytes not detected at, or above the stated detection limit.0 - A result of zero represents an undetected result at the MQL reported and does not imply an actual value.PPBV - Parts per billion volume.MQL - Method quantitation limit.Surrogate results are in units of percent recovery with control limits: 65 to 135%.The compounds in red and bold are organic halides.
Tentatively Identified CompoundEstimated Concentration (PPBV)None
Page 1 of 1 12SIN001.xlsx 1/7/2013 12:57 AM

Smart Chemistry Corporation
3402 La Grande Blvd, Sacramento, CA 95823, (916)391-3300, (916)391-3440 (fax), www.smartchemistry.com, [email protected]
2.3 Analytical Laboratory Report for "Other Hydrocarbons"ASTM 5466
Client: SINTEF Field ID #: 400ML 12SIN001-03#8
Hydrogen Station at: Økern Lab Sample ID: 12SIN00103
Sample Type: Hydrogen Fuel Concentration Units: PPBV
Date Sampled: 11092012,12:00 Date File Location 12SIN001TPH.pdf
Date Received: 12202012 Data Filename: 12122305.D
Date Analyzed: 12042012 Dilution Factor: 1.0
Time Analyzed: 2:07 pm
Analytes MW CASNUM MQL (PPBV) Results (PPBV) Qualifier MQL (ug/L) Results (ug/L)
1,1,1-Trichloroethane 132 71-55-6 1 0 U 0.005 0
1,1,2,2-Tetrachloroethane 166 79-34-5 1 0 U 0.007 0
1,1,2-Trichloroethane 132 79-00-5 1 0 U 0.005 0
1,2-Dibromoethane 186 106-93-4 1 0 U 0.008 0
1,1-Dichloroethane 98 75-34-3 1 0 U 0.004 0
1,1-Dichloroethene 96 75-35-4 1 0 U 0.004 0
1,2,4-Trichlorobenzene 180 120-82-1 1 0 U 0.007 0
1,2,4-Trimethylbenzene 120 95-63-6 1 0 U 0.005 0
1,2-Dichloroethane 98 107-06-2 1 0 U 0.004 0
1,2-Dichloropropane 112 78-87-5 1 0 U 0.005 0
1,3,5-Trimethylbenzene 120 108-67-8 1 0 U 0.005 0
1,3-Butadiene 54 106-99-0 1 0 U 0.002 0
1,2-Dichlorobenzene 146 95-50-1 1 0 U 0.006 0
1,3-Dichlorobenzene 146 541-73-1 1 0 U 0.006 0
1,4-Dichlorobenzene 146 106-46-7 1 0 U 0.006 0
1,4-Dioxane 88 123-91-1 1 0 U 0.004 0
2-Butanone 72 78-93-3 1 0 U 0.003 0
2-Hexanone 100 591-78-6 1 0 U 0.004 0
4-Ethyltoluene 120 622-96-8 1 0 U 0.005 0
4-Methyl-2-Pentanone 100 108-10-1 1 0 U 0.004 0
Acetone 58 67-64-1 1 1.8 = 0.002 0.0043
Ethene 28 9002-88-4 2 0 U 0.002 0
Benzene 78 71-43-2 1 0 U 0.003 0
Benzyl Chloride 126 100-44-7 1 0 U 0.005 0
Bromodichloromethane 162 75-27-4 1 0 U 0.007 0
Bromoform 250 75-25-2 1 0 U 0.01 0
Bromomethane 94 74-83-9 1 0 U 0.004 0
Carbon Disulfide 76 75-15-0 1 0 U 0.003 0
Carbon tetrachloride 152 56-23-5 1 0 U 0.006 0
Chlorobenzene 112 108-90-7 1 0 U 0.005 0
Chloroethane 64 75-00-3 1 0 U 0.003 0
Chloroform 118 67-66-3 1 0 U 0.005 0
Chloromethane 50 74-87-3 1 0 U 0.002 0
cis-1,2-dichloroethene 96 156-59-2 1 0 U 0.004 0
cis-1,3-Dichloropropene 110 10061-01-5 1 0 U 0.005 0
Cyclohexane 84 110-82-7 1 0 U 0.003 0
Dibromochloromethane 206 124-48-1 1 0 U 0.008 0
Dichlorodifluoromethane 120 75-71-8 1 0 U 0.005 0
Ethane 30 74-84-0 2 2.7 = 0.002 0.0033
Ethanol 46 64-17-5 1 0 U 0.002 0
Ethyl Acetate 88 141-78-6 1 0 U 0.004 0
Ethylbenzene 106 100-41-4 1 0 U 0.004 0
Freon113 186 76-13-1 1 0 U 0.008 0
Freon114 170 76-14-2 1 0 U 0.007 0
Heptane 100 142-82-5 1 0 U 0.004 0
Hexane 86 110-54-3 1 0 U 0.004 0
Hexachlorobutadiene 258 87-68-3 1 0 U 0.01 0
Isopropyl Alcohol 60 67-63-0 1 1.6 = 0.002 0.0039
Methylene chloride 84 75-09-2 1 0 U 0.003 0
Methyl tert-Butyl Ether 88 1634-04-4 1 0 U 0.004 0
Propane 44 74-98-6 2 0 U 0.004 0
Propene 36 115-07-1 1 0 U 0.001 0
Styrene 104 100-42-5 1 0 U 0.004 0
Tetrachloroethene 164 127-18-4 1 0 U 0.007 0
Tetrahydrofuran 72 109-99-9 1 0 U 0.003 0
Toluene 92 108-88-3 1 0 U 0.004 0
trans-1,2-dichloroethene 96 156-60-5 1 0 U 0.004 0
trans-1,3-Dichloropropene 110 10061-02-6 1 0 U 0.005 0
Trichloroethene 130 79-01-6 1 0 U 0.005 0
Trichlorofluoromethane 136 75-69-4 1 0 U 0.006 0
Vinyl acetate 86 108-05-4 1 0 U 0.004 0
Vinyl chloride 62 75-01-4 1 0 U 0.003 0
Xylenes, m&p- 106 108-38-3 & 106-42-3 1 0 U 0.004 0
Xylenes, o- 106 95-47-6 1 0 U 0.004 0
1,1,3,4-Tetrachlorohexafluorobutane 334 423-38-1 1 14 = 0.01 0.19
Bromochloromethane (surrogate) 128 74-97-5 74 =
4-BFB(surrogate) 174 460-00-4 105 =
NOTES:U - Analytes not detected at, or above the stated detection limit.0 - A result of zero represents an undetected result at the MQL reported and does not imply an actual value.PPBV - Parts per billion volume.MQL - Method quantitation limit.Surrogate results are in units of percent recovery with control limits: 65 to 135%.The compounds in red and bold are organic halides.
Tentatively Identified CompoundEstimated Concentration (PPBV)None
Page 1 of 1 12SIN001.xlsx 1/7/2013 12:58 AM

www.SmartChemistry.com
Analytical Data
File Name, Sample, Sample Loop Pressure (psi)
21005B.D - PRAXAIR UHP H2;ENTECH SPLIT 0.01;3 10UL G0793;10,5&2UL AIR;ES1:100;CF=1.5ML/MN214.7
12122001.D - G0860,4PPM CO2,3.2PPM AR,4PPM N2 & O2;ES0.01 3 10UL G0793;10,5&1UL AIR;ES1:100;CF=1.5ML/MN162.7
12122002.D - G0860,4PPM CO2,3.2PPM AR,4PPM N2 & O2;ES0.01 3 10UL G0793;10,5&1UL AIR;ES1:100;CF=1.5ML/MN158.7
12122003.D - G0860,4PPM CO2,3.2PPM AR,4PPM N2 & O2;ES0.01 3 10UL G0793;10,5&1UL AIR;ES1:100;CF=1.5ML/MN154.8
12122004.D - PRAXAIR UHP H2;ES0.01 3 10UL G0793;10,5&2UL AIR;ES1:100;CF=1.5ML/MN218.8
12122005.D - 12SIN00101#5,PORSGRUNN I,R121220;ES0.01 3 10UL G0793;10,5&2UL AIR;ES1:100;CF=1.5ML/MN173.9
12122006.D - 12SIN00101#5,PORSGRUNN I,R121220;ES0.01 3 10UL G0793;10,5&2UL AIR;ES1:100;CF=1.5ML/MN312.5
12122007.D - 12SIN00101#5,PORSGRUNN I,R121220;ES0.01 3 10UL G0793;10,5&2UL AIR;ES1:100;CF=1.5ML/MN263.9
12122008.D - 12SIN00102#13,GAUSTAD I,R121220;ES0.01 3 10UL G0793;10,5&2UL AIR;ES1:100;CF=1.5ML/MN348
12122009.D - 12SIN00102#13,GAUSTAD I,R121220;ES0.01 3 10UL G0793;10,5&2UL AIR;ES1:100;CF=1.5ML/MN318.8
12122010.D - 12SIN00102#13,GAUSTAD I,R121220;ES0.01 3 10UL G0793;10,5&2UL AIR;ES1:100;CF=1.5ML/MN376
12122011.D - 12SIN00103#8,OKEM I,R121220;ES0.01 3 10UL G0793;10,5&2UL AIR;ES1:100;CF=1.5ML/MN148.2
12122012.D - 12SIN00103#8,OKEM I,R121220;ES0.01 3 10UL G0793;10,5&2UL AIR;ES1:100;CF=1.5ML/MN137.7
12122013.D - 12SIN00103#8,OKEM I,R121220;ES0.01 3 10UL G0793;10,5&2UL AIR;ES1:100;CF=1.5ML/MN127.6
3. O2 ASTM 7649-10
O2 Sample RT OR Appraent Injection
Vol. (uL) O2 Sample Area
Co-Injected Peak RT, or O2 Conc. (ppmv) in P0136 Co-Injected Peak AREA
O2 RF at Low Conc.
O2 RF at High Conc.
O2 CONC. (ppmv)
0.00 0 61804 1263083 1.5E-08 3.1E-08 0.056881 662761 1.6E-08 3.0E-0853274 253016 1.7E-08 3.1E-08
0.85 27360 77480 1916893 1.2E-08 2.1E-08 4.372572 989257 1.3E-08 2.0E-0869535 390089 1.3E-08 2.0E-08
0.85 23080 79936 1877270 1.1E-08 2.1E-08 3.775620 972082 1.2E-08 2.0E-0869258 383448 1.3E-08 2.1E-08
0.85 18072 73989 1879959 1.2E-08 2.1E-08 2.965422 982498 1.4E-08 2.0E-0866923 383680 1.4E-08 2.1E-08
0.00 0 67768 1917229 1.3E-08 2.1E-08 0.071721 977788 1.3E-08 2.0E-0868519 378295 1.3E-08 2.1E-08
0.00 0 72026 1912719 1.3E-08 2.1E-08 0.071375 987581 1.3E-08 2.0E-0874936 376468 1.2E-08 2.1E-08
0.00 0 75048 1916331 1.2E-08 2.1E-08 0.066549 973145 1.4E-08 2.0E-0866976 380460 1.4E-08 2.1E-08
0.00 0 70755 1937211 1.3E-08 2.0E-08 0.065172 983473 1.4E-08 2.0E-0871326 373575 1.3E-08 2.1E-08
0.00 0 71736 1937150 1.3E-08 2.0E-08 0.073339 980636 1.2E-08 2.0E-0871332 379657 1.3E-08 2.1E-08
0.85 22722 68882 1922504 1.3E-08 2.1E-08 3.667507 987637 1.3E-08 2.0E-0871030 367405 1.3E-08 2.1E-08
0.83 22838 81312 1915026 1.1E-08 2.1E-08 3.666718 995156 1.4E-08 2.0E-0868057 381699 1.3E-08 2.1E-08
0.00 0 62825 1906145 1.4E-08 2.1E-08 0.060305 979810 1.5E-08 2.0E-0864423 392228 1.4E-08 2.0E-08
0.00 0 71913 1966190 1.3E-08 2.0E-08 0.066607 910643 1.4E-08 2.2E-0867207 377370 1.4E-08 2.1E-08
0.00 0 69698 1828267 1.3E-08 2.2E-08 0.064800 991944 1.4E-08 2.0E-0853561 317784 1.7E-08 2.5E-08
Smart Chemistry, 3401 La Grande Blvd, Sacramento, CA 95823, [email protected], (916)391-3300

Smartchemistry.com
Analytical Data
4. He Date of Analysis 12/23/2012 Instrumentation GC/TCD
File Name Helium Retention Time (min)Helium Retention
Time (min)Helium Standard Conc. (PPMV) Area
Response Factor (RF)
Sample Concentration
(PPMV)
001F0101.D G0812 (164.2 PPMV HE IN HYDROGEN). OT=40C. 3.798 164.2 1.31E+01 12.6
001F0201.D G0813 (58.9 PPMV HE IN HYDROGEN). OT=40C. 3.743 58.9 4.11E+00 14.3
001F0301.D G0814 (9.1 PPMV HE IN HYDROGEN). OT=40C. 3.801 9.1 6.40E-01 14.2
001F0401.D 12SIN001-01#5,PORSGRUNN I. R121220. OT=40C. 3.801 0.00E+00 0
001F0501.D 12SIN001-02#13,GAUSTAD I. R121220. OT=40C. 3.989 5.84E-01 8.5
001F0601.D 12SIN001-03#8,OKERN I. R121220. OT=40C. 3.801 0.00E+00 0.0
001F0701.D G0814 (9.1 PPMV HE IN HYDROGEN). OT=40C. 3.78 9.1 6.14E-01 14.8
SMART CHEMISTRY, 3401 La Grande Blvd,Sacramento, CA, 95823, (916)391-3300, [email protected]

www.SmartChemistry.com
Analytical Data
File Name, Sample, Sample Loop Pressure (psi)
21005B.D - PRAXAIR UHP H2;ENTECH SPLIT 0.01;3 10UL G0793;10,5&2UL AIR;ES1:100;CF=1.5ML/MN214.7
12122001.D - G0860,4PPM CO2,3.2PPM AR,4PPM N2 & O2;ES0.01 3 10UL G0793;10,5&1UL AIR;ES1:100;CF=1.5ML/MN162.7
12122002.D - G0860,4PPM CO2,3.2PPM AR,4PPM N2 & O2;ES0.01 3 10UL G0793;10,5&1UL AIR;ES1:100;CF=1.5ML/MN158.7
12122003.D - G0860,4PPM CO2,3.2PPM AR,4PPM N2 & O2;ES0.01 3 10UL G0793;10,5&1UL AIR;ES1:100;CF=1.5ML/MN154.8
12122004.D - PRAXAIR UHP H2;ES0.01 3 10UL G0793;10,5&2UL AIR;ES1:100;CF=1.5ML/MN218.8
12122005.D - 12SIN00101#5,PORSGRUNN I,R121220;ES0.01 3 10UL G0793;10,5&2UL AIR;ES1:100;CF=1.5ML/MN173.9
12122006.D - 12SIN00101#5,PORSGRUNN I,R121220;ES0.01 3 10UL G0793;10,5&2UL AIR;ES1:100;CF=1.5ML/MN312.5
12122007.D - 12SIN00101#5,PORSGRUNN I,R121220;ES0.01 3 10UL G0793;10,5&2UL AIR;ES1:100;CF=1.5ML/MN263.9
12122008.D - 12SIN00102#13,GAUSTAD I,R121220;ES0.01 3 10UL G0793;10,5&2UL AIR;ES1:100;CF=1.5ML/MN348
12122009.D - 12SIN00102#13,GAUSTAD I,R121220;ES0.01 3 10UL G0793;10,5&2UL AIR;ES1:100;CF=1.5ML/MN318.8
12122010.D - 12SIN00102#13,GAUSTAD I,R121220;ES0.01 3 10UL G0793;10,5&2UL AIR;ES1:100;CF=1.5ML/MN376
12122011.D - 12SIN00103#8,OKEM I,R121220;ES0.01 3 10UL G0793;10,5&2UL AIR;ES1:100;CF=1.5ML/MN148.2
12122012.D - 12SIN00103#8,OKEM I,R121220;ES0.01 3 10UL G0793;10,5&2UL AIR;ES1:100;CF=1.5ML/MN137.7
12122013.D - 12SIN00103#8,OKEM I,R121220;ES0.01 3 10UL G0793;10,5&2UL AIR;ES1:100;CF=1.5ML/MN127.6
5. N2 ASTM 7649-10
N2 Sample RT OR Appraent Injection
Vol. (uL) N2 Peak 1 AreaCo-Injected
Peak RT Co-Injected Peak
AREA N2 RF at Low
Conc. N2 RF at High
Conc.N2 CONC.
(ppmv)
Appraent Injection Vol.
(uL)
0.00 0 200531 4663013 4.5E-09 3.1E-08 0.0191082 2583950 4.8E-09 2.8E-08177408 1052164 5.1E-09 2.8E-08
0.85 89066 270803 8121014 3.4E-09 1.8E-08 4.8 78255348 4474867 3.6E-09 1.6E-08252116 1853865 3.6E-09 1.6E-08
0.85 66584 302250 8158035 3.0E-09 1.8E-08 3.6 59266067 4506845 3.4E-09 1.6E-08257219 1868272 3.5E-09 1.6E-08
0.86 68960 287002 8191852 3.2E-09 1.8E-08 3.7 61267498 4536160 3.4E-09 1.6E-08265451 948716 3.4E-09 3.1E-08
0.00 0 250878 8367474 3.6E-09 1.7E-08 0.0234932 4551275 3.9E-09 1.6E-08256716 1905084 3.5E-09 1.5E-08
0.88 6371338 274142 8431867 3.3E-09 1.7E-08 340 2203245736 4574391 3.7E-09 1.6E-08292861 1884294 3.1E-09 1.6E-08
0.86 9606674 252463 8411693 3.6E-09 1.7E-08 513 3322247424 4557868 3.7E-09 1.6E-08268926 1885036 3.4E-09 1.6E-08
0.86 8219032 265060 8428170 3.4E-09 1.7E-08 439 2842247713 4587131 3.7E-09 1.6E-08270684 1897626 3.4E-09 1.5E-08
0.85 111714 269049 8387270 3.4E-09 1.7E-08 6.0265845 4578387 3.4E-09 1.6E-08243215 1899629 3.7E-09 1.5E-08
0.87 144274 270711 8446965 3.4E-09 1.7E-08 7.7257728 4621490 3.5E-09 1.6E-08260732 1829358 3.5E-09 1.6E-08
0.85 174373 313897 8478125 2.9E-09 1.7E-08 9.3247116 4667175 3.7E-09 1.6E-08259354 1922357 3.5E-09 1.5E-08
0.88 30274 257516 8332688 3.5E-09 1.8E-08 1.6244178 4628505 3.7E-09 1.6E-08231019 1920280 3.9E-09 1.5E-08
0.87 32100 262949 8521322 3.5E-09 1.7E-08 1.7240360 4283403 3.8E-09 1.7E-08274055 1873679 3.3E-09 1.6E-08
0.88 31867.79 259302 8106489 3.5E-09 1.8E-08 1.7249271 4629139 3.6E-09 1.6E-08197322 1630077 4.6E-09 1.8E-08
Smart Chemistry, 3401 La Grande Blvd, Sacramento, CA 95823, [email protected], (916)391-3300

www.SmartChemistry.com
Analytical Data
File Name, Sample, Sample Loop Pressure (psi)
21005B.D - PRAXAIR UHP H2;ENTECH SPLIT 0.01;3 10UL G0793;10,5&2UL AIR;ES1:100;CF=1.5ML/MN214.7
12122001.D - G0860,4PPM CO2,3.2PPM AR,4PPM N2 & O2;ES0.01 3 10UL G0793;10,5&1UL AIR;ES1:100;CF=1.5ML/MN162.7
12122002.D - G0860,4PPM CO2,3.2PPM AR,4PPM N2 & O2;ES0.01 3 10UL G0793;10,5&1UL AIR;ES1:100;CF=1.5ML/MN158.7
12122003.D - G0860,4PPM CO2,3.2PPM AR,4PPM N2 & O2;ES0.01 3 10UL G0793;10,5&1UL AIR;ES1:100;CF=1.5ML/MN154.8
12122004.D - PRAXAIR UHP H2;ES0.01 3 10UL G0793;10,5&2UL AIR;ES1:100;CF=1.5ML/MN218.8
12122005.D - 12SIN00101#5,PORSGRUNN I,R121220;ES0.01 3 10UL G0793;10,5&2UL AIR;ES1:100;CF=1.5ML/MN173.9
12122006.D - 12SIN00101#5,PORSGRUNN I,R121220;ES0.01 3 10UL G0793;10,5&2UL AIR;ES1:100;CF=1.5ML/MN312.5
12122007.D - 12SIN00101#5,PORSGRUNN I,R121220;ES0.01 3 10UL G0793;10,5&2UL AIR;ES1:100;CF=1.5ML/MN263.9
12122008.D - 12SIN00102#13,GAUSTAD I,R121220;ES0.01 3 10UL G0793;10,5&2UL AIR;ES1:100;CF=1.5ML/MN348
12122009.D - 12SIN00102#13,GAUSTAD I,R121220;ES0.01 3 10UL G0793;10,5&2UL AIR;ES1:100;CF=1.5ML/MN318.8
12122010.D - 12SIN00102#13,GAUSTAD I,R121220;ES0.01 3 10UL G0793;10,5&2UL AIR;ES1:100;CF=1.5ML/MN376
12122011.D - 12SIN00103#8,OKEM I,R121220;ES0.01 3 10UL G0793;10,5&2UL AIR;ES1:100;CF=1.5ML/MN148.2
12122012.D - 12SIN00103#8,OKEM I,R121220;ES0.01 3 10UL G0793;10,5&2UL AIR;ES1:100;CF=1.5ML/MN137.7
12122013.D - 12SIN00103#8,OKEM I,R121220;ES0.01 3 10UL G0793;10,5&2UL AIR;ES1:100;CF=1.5ML/MN127.6
6. Ar ASTM 7649-10 Date of Analysis 12/20/2012
Ar Sample RT or BAD RF Ar Sample Area
Co-Injected Peak RT
Co-Injected Peak AREA RF RF
Ar CONC. (ppmv)
0.00 0 46113.51 110626 1.6E-08 1.6E-08 0.044217.56 60249 1.6E-08 1.5E-0845841.79 23898 1.6E-08 1.5E-08
0.86 17206 76337.54 173450 9.5E-09 1.0E-08 3.477542.89 92967 9.3E-09 9.4E-0977035.66 40027 9.4E-09 8.8E-09
0.85 15121 75239.41 170537 9.6E-09 1.0E-08 3.077076.48 92407 9.4E-09 9.5E-0975858.87 40309 9.5E-09 8.7E-09
0.86 16547 78258.15 90896 9.2E-09 1.9E-08 3.379238.17 34770 9.1E-09 2.5E-08
170945.72 34576 4.2E-09 1.0E-08
0.00 0 79518.07 180215 9.1E-09 9.7E-09 0.078449.60 92384 9.2E-09 9.5E-0978093.64 38574 9.3E-09 9.1E-09
0.89 3846 79743.56 173494 9.1E-09 1.0E-08 0.7679855.78 92227 9.0E-09 9.5E-0979215.85 37905 9.1E-09 9.2E-09
0.86 3956 76332.20 180136 9.5E-09 9.7E-09 0.7877870.50 93403 9.3E-09 9.4E-0977856.17 36812 9.3E-09 9.5E-09
0.87 3903.8 80528 177721 9.0E-09 9.9E-09 0.7779532 94908 9.1E-09 9.2E-0978571 35879 9.2E-09 9.8E-09
0.00 0 79243 178483 9.1E-09 9.8E-09 0.0078857 95070 9.2E-09 9.2E-0980011 37912 9.0E-09 9.2E-09
0.85 3246 77669 177370 9.3E-09 9.9E-09 0.6477680 93672 9.3E-09 9.4E-0979716 35316 9.1E-09 9.9E-09
0.00 0 83739 182825 8.6E-09 9.6E-09 0.0080780 94329 8.9E-09 9.3E-0981105 37654 8.9E-09 9.3E-09
0.88 8494 77393 178454 9.3E-09 9.8E-09 1.6777984 94459 9.3E-09 9.3E-0979029 37305 9.1E-09 9.4E-09
0.85 10216 77642 185842 9.3E-09 9.4E-09 2.0180314 89016 9.0E-09 9.8E-0979501 37874 9.1E-09 9.3E-09
0.87 9776.716 82268 172859 8.8E-09 1.0E-08 1.9273432 93988 9.8E-09 9.3E-0979961 32953 9.0E-09 1.1E-08
Smart Chemistry, 3401 La Grande Blvd, Sacramento, CA 95823, [email protected], (916)391-3300

www.SmartChemistry.com
Analytical Data 7. CO2 ASTM 7649-10 Date of Analysis 12/20/2012
File Name, Sample, Sample Loop Pressure (psi) CO2 Sample RTCO2 Sample
AreaCo-Injected Peak
RTCo-Injected Peak
AREA RFConc. CO2 in Air
(PPMV)CO2 CONC.
(ppmv)
Appraent Injection Vol.
(uL)
21005B.D - PRAXAIR UHP H2;ENTECH SPLIT 0.01;3 10UL G0793;10,5&2UL AIR;ES1:100;CF=1.5ML/MN 0.00 0 180981 74122 5.0E-09 20 0.0214.7 178550 15420 5.1E-09 8
175483 6579 5.2E-09 912122001.D - G0860,4PPM CO2,3.2PPM AR,4PPM N2 & O2;ES0.01 3 10UL G0793;10,5&1UL AIR;ES1:100;CF=1.5ML/MN 0.87 72269 298399 79599 3.0E-09 22 4.0 49162.7 305468 26091 3.0E-09 14
308557 10052 2.9E-09 1412122002.D - G0860,4PPM CO2,3.2PPM AR,4PPM N2 & O2;ES0.01 3 10UL G0793;10,5&1UL AIR;ES1:100;CF=1.5ML/MN 0.87 71362 301622 110366 3.0E-09 30 4.0 49158.7 299359 41638 3.0E-09 23
302175 20695 3.0E-09 2812122003.D - G0860,4PPM CO2,3.2PPM AR,4PPM N2 & O2;ES0.01 3 10UL G0793;10,5&1UL AIR;ES1:100;CF=1.5ML/MN 0.86 70712 322853 100151 2.8E-09 27 4.0 48154.8 332290 22117 2.7E-09 12
333249 12032 2.7E-09 16
12122004.D - PRAXAIR UHP H2;ES0.01 3 10UL G0793;10,5&2UL AIR;ES1:100;CF=1.5ML/MN 0.00 0 334436 102093 2.7E-09 28 0.0218.8 342323 55177 2.7E-09 30
339651 12394 2.7E-09 1712122005.D - 12SIN00101#5,PORSGRUNN I,R121220;ES0.01 3 10UL G0793;10,5&2UL AIR;ES1:100;CF=1.5ML/MN 0.88 48302 339199 95555 2.7E-09 26 2.7173.9 343367 28148 2.6E-09 15
341649 10809 2.7E-09 1512122006.D - 12SIN00101#5,PORSGRUNN I,R121220;ES0.01 3 10UL G0793;10,5&2UL AIR;ES1:100;CF=1.5ML/MN 0.86 70760 331458 90853 2.7E-09 25 4.0312.5 335541 40317 2.7E-09 22
342541 13658 2.7E-09 1912122007.D - 12SIN00101#5,PORSGRUNN I,R121220;ES0.01 3 10UL G0793;10,5&2UL AIR;ES1:100;CF=1.5ML/MN 0.86 57727 330285 92970 2.8E-09 25 3.2263.9 337025 39386 2.7E-09 21
341584 13310 2.7E-09 1812122008.D - 12SIN00102#13,GAUSTAD I,R121220;ES0.01 3 10UL G0793;10,5&2UL AIR;ES1:100;CF=1.5ML/MN 0.00 0 335791 70913 2.7E-09 19 0.0348 341168 35615 2.7E-09 19
343699 9566 2.6E-09 1312122009.D - 12SIN00102#13,GAUSTAD I,R121220;ES0.01 3 10UL G0793;10,5&2UL AIR;ES1:100;CF=1.5ML/MN 0.00 0 340720 118370 2.7E-09 32 0.0318.8 341380 45577 2.7E-09 25
345318 12015 2.6E-09 1612122010.D - 12SIN00102#13,GAUSTAD I,R121220;ES0.01 3 10UL G0793;10,5&2UL AIR;ES1:100;CF=1.5ML/MN 0.00 0 349987 130761 2.6E-09 36 0.0376 349718 28602 2.6E-09 16
349696 14575 2.6E-09 2012122011.D - 12SIN00103#8,OKEM I,R121220;ES0.01 3 10UL G0793;10,5&2UL AIR;ES1:100;CF=1.5ML/MN 0.00 0 334009 72929 2.7E-09 20 0.0148.2 355403 25713 2.6E-09 14
347817 11742 2.6E-09 1612122012.D - 12SIN00103#8,OKEM I,R121220;ES0.01 3 10UL G0793;10,5&2UL AIR;ES1:100;CF=1.5ML/MN 0.00 0 339342 76521 2.7E-09 21 0.0137.7 342943 22501 2.7E-09 12
340471 10315 2.7E-09 1412122013.D - 12SIN00103#8,OKEM I,R121220;ES0.01 3 10UL G0793;10,5&2UL AIR;ES1:100;CF=1.5ML/MN 0 0 347597 114426 2.6E-09 31 0.0127.6 312588 36365 2.9E-09 20
351133 8398 2.6E-09 11
Smart Chemistry, 3401 La Grande Blvd, Sacramento, CA 95823, [email protected], (916)391-3300

www.SmartChemistry.com
Analytical Data 8. CO Date12/21/2012
File Name InjectionStandard Conc.
(PPMV)Volume of CO in
Standard (µL)Ret. Time
(MIN) of CO Area of COCO Response
FactorSample CO Conc.
(ppmv)
001F0101.D
G0909,0.0010 PPMV CO, CO2, N2, O2 & 0.00077 PPMV CH4 (INITIAL: SZ 860 MTORR) [ SAMPLING: 1L: 55 TORR] in 1MN03SEC (QPZ: 0 TORR) (WAIT 5MIN AFTER SWITCHING TO ANALYTICAL MODE AND START GC) (OT=80C) [PRE-COL IS @LIQ. N2] 0.0010 0.000072 6.316 506 1.43E-07
001F0201.D
G0900,0.24 PPMV CO, CO2, N2, O2 & 0.20 PPMV CH4 (INITIAL: SZ 1100 MTORR) [SAMPLING: 1L: 55TORR] IN 3MIN12SEC (QPZ: 0 TORR) (WAIT 5MIN AFTER SWITCHING TO ANALYTICAL MODE AND START GC) (OT=80C) [PRE-COL IS @LIQ. N2] 0.24 0.017368 6.317 70252 2.47E-07
001F0301.D PRE-COL IN LIQ. N2 IN ANALYTICAL MODE AND START GC) (OT=80C) [PRE-COL IS @LIQ. N2] 6.317 0 0.00E+00
001F0401.D
12SIN001-03,OKERN I (INITIAL: SZ 425 MTORR) [SAMPLING: 1L: 57TORR] in 27SEC (WAIT 5MIN AFTER SWITCHING TO ANALYTICAL MODE AND START GC) (OT=80C) [PRE-COL IS @LIQ. N2] 6.21 508 9.68E-04
001F0501.D
12SIN001-01,PORSGRUNN I (INITIAL: SZ 485 MTORR, 270MTORR QPZ:) [SAMPLING: 1L: 58TORR] in 60SEC (WAIT 20MIN AFTER SWITCHING TO ANALYTICAL MODE AND START GC) (OT= 80C) [PRE-COL IS @LIQ. N2] 6.204 5156 9.66E-03
001F0601.D
12SIN001-02#13,GAUSTAD I (INITIAL: SZ 305 MTORR, 300MTORR QPZ:) [SAMPLING: 1L: 57TORR] in 58SEC (QPZ: 0 TORR) (WAIT 5MIN AFTER SWITCHING TO ANALYTICAL MODE AND START GC) (OT=80C) [PRE-COL IS @LIQ. N2] 6.182 2451 4.67E-03
001F0701.D
G0909,0.0010 PPMV CO, CO2, N2, O2 & 0.00077 PPMV CH4 (INITIAL: SZ 395MTORR, S- QSZ:230MTORR) [SAMPLING: 1L: 121TORR] in 8SEC, (QPZ: 0 TORR) (WAIT 5MIN AFTER SWITCHING TO ANALYTICAL MODE AND START GC) (OT=80C) [PRE-COL IS @LIQ. N2] 0.0010 0.000159 6.191 457 3.48E-07
Smart Chemistry, 3401 La Grande Blvd, Sacramento, CA 95823, (916)391-3300, [email protected]

www.Smart Chemistry.com
Analytical Data
9.1 S Date of Analysis 12/21/2012 H2S COS CH3SH C2H5SH CS2 (CH3)3CSH Tetrahydrothiophene
File Names InjectionH2 VOLUME
(µL)
Volume of Standard
Injected (µL)
Injected Standard
Conc (ppbv)
Amount Injeced (uL) or Spiked
Conc. (ppbv) H2S RT H2S Area
H2S RF, H2S Conc. (PPBV) or
% Spike Recovery COS RT COS Area
COS RF, COS Conc. (PPBV) or
% Spike Recovery CH3SH RT
CH3SH Area
CH3SH RF, CH3SH Conc. (PPBV) or %
Spike Recovery C2H5SH RT C2H5SH Area
C2H5SH RF, C2H5SH Conc. (PPBV) or %
Spike Recovery CS2 RT CS2 Area
CS2 RF, CS2
Conc. (PPBV) or % Spike
Recovery TBM RT TBM Area
TBM RF, TBM Conc. (PPBV) or
% Spike Recovery THT RT THT Area
THT RF, THT Conc. (PPBV) or %
Spike Recovery
12122101.D200UL G0915,1PPMV H2S,COS,CH3SH,CS2,DB@H2O,LN, 1PPMV ETHYLMERCAPTAN,TBM & THT 200 1000 2.00E-04 1.37 4862 4.11E-08 1.48 13471 1.48E-08 2.07 4433 4.51E-08 3.10E+00 4.47E+03 4.48E-08 3.85E+00 1.38E+04 1.45E-08 4.84 9806 2.04E-08
12122102.D50UL G0915,1PPMV H2S,COS,CH3SH,CS2,DB@H2O,LN, 1PPMV ETHYLMERCAPTAN,TBM & THT 50 1000 5.00E-05 1.37 1559 3.21E-08 1.48 3809 1.31E-08 2.07 1624 3.08E-08 3.10E+00 1.74E+03 2.88E-08 3.85E+00 5.68E+03 8.81E-09 4.83 4306 1.16E-08
12122103.D200UL G0915,1PPMV H2S,COS,CH3SH,CS2,DB@H2O,LN, 1PPMV ETHYLMERCAPTAN,TBM & THT 200 1000 2.00E-04 1.37 3461 5.78E-08 1.48 12399 1.61E-08 2.07 4102 4.88E-08 3.10E+00 4.47E+03 4.47E-08 3.85E+00 1.43E+04 1.40E-08 4.84 10516 1.90E-08 8.17 18597 1.08E-08
12122104.D100UL G0915,1PPMV H2S,COS,CH3SH,CS2,DB@H2O,LN, 1PPMV ETHYLMERCAPTAN,TBM & THT 100 1000 1.00E-04 1.37 2138 4.68E-08 1.48 7499 1.33E-08 2.07 2328 4.29E-08 3.11E+00 2.61E+03 3.83E-08 3.85E+00 8.44E+03 1.19E-08 4.83 6935 1.44E-08 8.16 7427 1.35E-08
12122105.D50UL G0915,1PPMV H2S,COS,CH3SH,CS2,DB@H2O,LN, 1PPMV ETHYLMERCAPTAN,TBM & THT 50 1000 5.00E-05 1.37 1523 3.28E-08 1.48 3772 1.33E-08 2.07 1537 3.25E-08 3.09E+00 1.98E+03 2.52E-08 3.84E+00 5.73E+03 8.73E-09 4.84 4399 1.14E-08 8.17 7756 6.45E-09
12122106.D20UL G0915,1PPMV H2S,COS,CH3SH,CS2,DB@H2O,LN, 1PPMV ETHYLMERCAPTAN,TBM & THT 20 1000 2.00E-05 1.38 579 3.45E-08 1.49 1396 1.43E-08 2.07 573 3.49E-08 3.11E+00 9.13E+02 2.19E-08 3.85E+00 1.94E+03 1.03E-08 4.82 1433 1.40E-08 8.17 2163 9.24E-09
12122107.D10UL G0915,1PPMV H2S,COS,CH3SH,CS2,DB@H2O,LN, 1PPMV ETHYLMERCAPTAN,TBM & THT 10 1000 1.00E-05 1.36 244 4.10E-08 1.47 677 1.48E-08 2.06 303 3.30E-08 3.09E+00 3.36E+02 2.97E-08 3.84E+00 1.09E+03 9.15E-09 4.84 986 1.01E-08 8.17 1349 7.41E-09
12122108.D 500ML 12SIN00101#5,PORSGRUNN I,DB@H2O,LN, R121220
500 1.34 60 0.0049 1.45 1176 0.034 2.05 68 0 3.10E+00 0.00E+00 0 3.83E+00 7.97E+03 0.18 4.84 164 0.0047 8.34 389 0.0075
12122109.D 500ML 12SIN00102#13,GAUSTAD I,DB@H2O,LN, R121220
500 1.35 309 0.0251 1.45 492 0.014 2.03 141 0.011 3.10E+00 0.00E+00 0 3.83E+00 1.51E+03 0.034 4.82 0 0 8.16 0 0
12122110.D 500ML 12SIN00103#8,OKERN I,DB@H2O,LN, R121220
500 1.34 297 0.0242 1.44 312 0.009 2.05 163 0.012 3.10E+00 0.00E+00 0 3.82E+00 1.06E+03 0.023 4.82 0 0 8.16 0 0.0000
12122111.D 500ML 12HYF001#11,DB@H2O,LN,
500 1.34 220 0.0179 1.45 1522 0.044 2.04 455 0 3.10E+00 0.00E+00 0 3.82E+00 6.91E+03 0.15 4.81 19052 0.55 8.16 5350 0.1036
12122112.D 500ML 12SIN00101#9,PORSGRUNN II,DB@H2O,LN, R121220
500 1.34 264 0.0215 1.45 588 0.017 2.02 150 0 3.10E+00 0.00E+00 0 3.82E+00 4.82E+03 0.11 4.82 0 0 8.28 183 0.0036
12122113.D 500ML 12SIN00102#1,GAUSTAD II,DB@H2O,LN, R121220
500 1.34 218 0.0177 1.45 374 0.011 2.06 0 0.00 3.10E+00 0.00E+00 0 3.83E+00 1.13E+03 0.025 4.82 0 0 8.16 0 0
12122114.D 500ML 12SIN00103#12,OKERN II,DB@H2O,LN, R121220
500 1.34 698 0.0567 1.45 942 0.027 2.06 0 0 3.10E+00 0.00E+00 0 3.82E+00 1.99E+04 0.44 4.82 0 0 8.16 0 0.0000
12122115.D10UL G0915,1PPMV H2S,COS,CH3SH,CS2,DB@H2O,LN, 1PPMV ETHYLMERCAPTAN,TBM & THT 10 1000 1.00E-05 1.36 255 3.92E-08 1.47 680 1.47E-08 2.06 316 3.16E-08 3.10E+00 3.50E+02 2.85E-08 3.83E+00 8.92E+02 1.12E-08 4.82 677 1.48E-08 8.16 926 1.08E-08
Smart Chemistry, 3401 La Grande Blvd, Sacramento, CA 95823, (916)391-3300, [email protected]

www.SmartChemistry.com
Analytical Data
10.
HCHO Date of Analysis 12/28/2012
FILE NAME Standards or Sample RT OF M/E30HCHO AREA
OF M/E30
H2 VOLUME
(ML)
EJ INJECTION HCHO
VOLUME (UL)
CONC OF HCHO
STANDARD (PPMV)
SPIKED HCHO STD
CONC (PPBV)
HCHO RESPONSE
FACTOR
SAMPLE HCHO CONC
(PPBV)
12122801.DEJ132UL G0905 (3.8PPMV HCHO),500ML H2 G0862-3.8PPMV HCHO 2.984 2687 500 132 3.8 1.0 1.9E-07
12122802.D 500ML H2 3.016 269 500 0.10
12122803.D 500ML 12SIN001-01#5,PORGRUNN I,R121220 12SIN001-01#5 0 0 500 0.00
12122804.D 500ML 12SIN001-02#13,GAUSTAD I,R121220 12SIN001-02#13 0 0 500 0.00
12122805.D 500ML 12SIN001-03#8,OKERN I,R121220 12SIN001-032#8 0 0 500 0.00
12122806.DEJ132UL G0905 (3.8PPMV HCHO),500ML H2 G0862-3.8PPMV HCHO 2.974 1328 500 132 3.8 1.0 3.8E-07
Smart Chemistry, 3401 La Grande Blvd, Sacramento, CA 95823, (916)391-3300, [email protected]

www.SmartChemistry.com
Analytical Data11.
HCOOH Date of Analysis 12/12/2029
FILE NAME Injection
Volume of Hydrogen
(mL)
Volume Injected (uL) of HCOOH Standard @ 43
PPMV
Volume of HCOOH (uL) Injected in
Standard & Spike Analysis
RET TIME OF
HCOOHAREA OF HCOOH
Response Factor or Sample Conc in
ppmv, Spike Recovery
001F0701.D
12UL G0918 (43 PPMV HCOOH IN H2) WITH LN2 AND FAST MODE. CF=14.3MLK/MIN AND MAKE- UP+CF=100ML/MIN. 30M 0.53MM ID 3.0UM DB5 FSCC (SC0CC 001). PUMP=5 TURNS. INJ. T= 100C. OT=50C. DESORBED @RT H2O. 12 0.000516 0.779 6.70E+05 7.7E-10
001F0801.D
12UL G0918 (43 PPMV HCOOH IN H2) WITH LN2 AND FAST MODE. CF=14.3MLK/MIN AND MAKE- UP+CF=100ML/MIN. 30M 0.53MM ID 3.0UM DB5 FSCC (SC0CC 001). PUMP=5 TURNS. INJ. T= 100C. OT=50C. DESORBED @RT H2O. 12 0.000516 0.77 8.68E+05 5.9E-10
001F0901.D
12UL G0918 (43 PPMV HCOOH IN H2) WITH LN2 AND FAST MODE. CF=14.3MLK/MIN AND MAKE- UP+CF=100ML/MIN. 30M 0.53MM ID 3.0UM DB5 FSCC (SC0CC 001). PUMP=5 TURNS. INJ. T= 100C. OT=50C. DESORBED @RT H2O. 12 0.000516 0.778 6.67E+05 7.7E-10
001F1001.D
12UL G0918 (43 PPMV HCOOH IN H2) WITH LN2 AND FAST MODE. CF=14.3MLK/MIN AND MAKE- UP+CF=100ML/MIN. 30M 0.53MM ID 3.0UM DB5 FSCC (SC0CC 001). PUMP=5 TURNS. INJ. T= 120C. OT=50C. DESORBED @RT H2O. 12 0.000516 0.78 5.21E+05 9.9E-10
001F1101.D
12UL G0918 (43 PPMV HCOOH IN H2) WITH LN2 AND FAST MODE. CF=14.3MLK/MIN AND MAKE- UP+CF=100ML/MIN. 30M 0.53MM ID 3.0UM DB5 FSCC (SC0CC 001). PUMP=5 TURNS. INJ. T= 100C. OT=50C. DESORBED @RT H2O. 12 0.000516 0.776 4.29E+05 1.2E-09
001F1201.D
12UL G0918 (43 PPMV HCOOH IN H2) WITH LN2 AND FAST MODE. CF=14.3MLK/MIN AND MAKE- UP+CF=100ML/MIN. 30M 0.53MM ID 3.0UM DB5 FSCC (SC0CC 001). PUMP=5 TURNS. INJ. T= 100C. OT=50C. DESORBED @RT H2O. 12 0.000516 0.775 6.78E+05 7.6E-10
001F1301.D
12UL G0918 (43 PPMV HCOOH IN H2) WITH LN2 AND FAST MODE. CF=14.3MLK/MIN AND MAKE- UP+CF=100ML/MIN. 30M 0.53MM ID 3.0UM DB5 FSCC (SC0CC 001). PUMP=5 TURNS. INJ. T= 100C. OT=50C. DESORBED @RT H2O. 12 0.000516 0.773 5.13E+05 1.0E-09
001F1701.D
500ML 12SIN001-01#5,PORSGRUNN I, R121220. WITH LN2 AND FAST MODE. CF=14.3MLK/MIN AND MAKE-UP+CF=100ML/MIN. 30M 0.53MM ID 3.0UM DB5 FSCC (SC0CC 001). PUMP=5 TURNS. INJ. T=100C. OT=50C. DESORBED @RT H2O. 500 0.773 0.00E+00 0.000000
001F1901.D
12UL G0918 (43 PPMV HCOOH IN H2) WITH LN2 AND FAST MODE. CF=14.3MLK/MIN AND MAKE- UP+CF=100ML/MIN. 30M 0.53MM ID 3.0UM DB5 FSCC (SC0CC 001). PUMP=5 TURNS. INJ. T= 100C. OT=50C. DESORBED @RT H2O. 12 0.000516 0.78 4.72E+05 1.1E-09
001F2101.D
12UL G0918 (43 PPMV HCOOH IN H2)+500ML 12SIN001-01#5,PORSGRUNN I, R121220. WITH LN2 AND FAST MODE. CF=14.3MLK/MIN AND MAKE-UP+CF=100ML/MIN. 30M 0.53MM ID 3.0UM DB5 FSCC (SC0CC 001). PUMP=5 TURNS. INJ. T=100C. OT=50C. DESORBED @RT H2O. 500 12 0.000516 1.153 3.42E+05
Percent Spike Recovery of
HCOOH @0.001 PPMV is 57%
001F2401.D
500ML 12SIN001-02#13,GAUSTAD I, R121220. WITH LN2 AND FAST MODE. CF=14.3MLK/MIN AND MAKE-UP+CF=100ML/MIN. 30M 0.53MM ID 3.0UM DB5 FSCC (SC0CC 001). PUMP=5 TURNS. INJ. T=100C. OT=50C. DESORBED @RT H2O. 500 1.226 3.85E+04 0.000066
001F2501.D
12UL G0918 (43 PPMV HCOOH IN H2)+500ML 12SIN001-02#13,GAUSTAD I, R121220. WITH LN2 AND FAST MODE. CF=14.3MLK/MIN AND MAKE-UP+CF=100ML/MIN. 30M 0.53MM ID 3.0UM DB5 FSCC (SC0CC 001). PUMP=5 TURNS. INJ. T=100C. OT=50C. DESORBED @RT H2O. 500 12 0.000516 1.085 1.99E+05
Percent Spike Recovery of
HCOOH @0.001 PPMV is 33%
001F2701.D
500ML 12SIN001-03#8,OKERN I, R121220. WITH LN2 AND FAST MODE. CF=14.3MLK/MIN AND MAKE-UP+CF=100ML/MIN. 30M 0.53MM ID 3.0UM DB5 FSCC (SC0CC 001). PUMP=5 TURNS. INJ. T=100C. OT=50C. DESORBED @RT H2O. 500 1.077 3.82E+04 0.000065
001F2801.D
12UL G0918 (43 PPMV HCOOH IN H2)+500ML 12SIN001-03#8,OKERN I, R121220. WITH LN2 AND FAST MODE. CF=14.3MLK/MIN AND MAKE-UP+CF=100ML/MIN. 30M 0.53MM ID 3.0UM DB5 FSCC (SC0CC 001). PUMP=5 TURNS. INJ. T=100C. OT=50C. DESORBED @RT H2O. 500 12 0.000516 1.035 3.74E+05
Percent Spike Recovery of
HCOOH @0.001 PPMV is 62%
001F2901.D
12UL G0918 (43 PPMV HCOOH IN H2) WITH LN2 AND FAST MODE. CF=14.3MLK/MIN AND MAKE- UP+CF=100ML/MIN. 30M 0.53MM ID 3.0UM DB5 FSCC (SC0CC 001). PUMP=5 TURNS. INJ. T= 100C. OT=50C. DESORBED @RT H2O. 12 0.000516 0.778 9.89E+05 5.2E-10
Smart Chemistry, 3401 La Grande Blvd, Sacramento, CA 95823, (916)391-3300, [email protected]

www.SmartChemistry.com
12.
NH3Date of Analysis 12/12/2028
FILE NAME Injection H2 VOLUME (ML)
Volume Injected (uL) of 12. NH3 Standard @
4976 PPMV
Injected Stnadard
Volume (uL)RET TIME
OF 12. NH3AREA OF 12. NH3
Response Factor or Sample Conc in
ppmv, Spike Recovery
001F0201.D
4UL G0808 (4976PPMV NH3 IN H2). WITH LIQ. N2. CF=30ML/MN AND MAKE-UP=88ML/MIN. 30M 0.53MM ID 3.0UM DB5 FSCC (SC0CC 001). N MODE. PUMP AT 5 BACK TURNS RATE. DESORBED @RT. NO LIQ. N2 CRYOFUCUSSING. 4 0.0199040 0.542 1.06E+06 1.9E-08
001F0301.D
4UL G0808 (4976PPMV NH3 IN H2). WITH LIQ. N2. CF=30ML/MN AND MAKE-UP=88ML/MIN. 30M 0.53MM ID 3.0UM DB5 FSCC (SC0CC 001). N MODE. PUMP AT 5 BACK TURNS RATE. DESORBED @RT. NO LIQ. N2 CRYOFUCUSSING. 4 0.0199040 0.54 1.22E+06 1.6E-08
001F0401.D
4UL G0808 (4976PPMV NH3 IN H2). WITH LIQ. N2. CF=30ML/MN AND MAKE-UP=88ML/MIN. 30M 0.53MM ID 3.0UM DB5 FSCC (SC0CC 001). N MODE. PUMP AT 5 BACK TURNS RATE. DESORBED @RT. NO LIQ. N2 CRYOFUCUSSING. 4 0.0199040 0.548 8.13E+05 2.4E-08
001F0501.D
4UL G0808 (4976PPMV NH3 IN H2). WITH LIQ. N2. CF=30ML/MN AND MAKE-UP=88ML/MIN. 30M 0.53MM ID 3.0UM DB5 FSCC (SC0CC 001). N MODE. PUMP AT 5 BACK TURNS RATE. DESORBED @RT. NO LIQ. N2 CRYOFUCUSSING. 4 0.0199040 0.545 6.41E+05 3.1E-08
001F0601.D
4UL G0808 (4976PPMV NH3 IN H2). WITH LIQ. N2. CF=30ML/MN AND MAKE-UP=88ML/MIN. 30M 0.53MM ID 3.0UM DB5 FSCC (SC0CC 001). N MODE. PUMP AT 5 BACK TURNS RATE. DESORBED @RT. NO LIQ. N2 CRYOFUCUSSING. 4 0.0199040 0.545 1.48E+06 1.3E-08
001F0701.D
4UL G0808 (4976PPMV NH3 IN H2). WITH LIQ. N2. CF=30ML/MN AND MAKE-UP=88ML/MIN. 30M 0.53MM ID 3.0UM DB5 FSCC (SC0CC 001). N MODE. PUMP AT 5 BACK TURNS RATE. DESORBED @RT. NO LIQ. N2 CRYOFUCUSSING. 4 0.0199040 0.541 1.78E+06 1.1E-08
001F1001.D
500ML 12SIN001-01#5,PORSGRUNN I,R121220. WITH LIQ. N2. CF=30ML/MN AND MAKE-UP= 88ML/MIN. 30M 0.53MM ID 3.0UM DB5 FSCC (SC0CC 001). N MODE. PUMP AT 5 BACK TURNS RATE. DESORBED @RT. NO LIQ. N2 CRYOFUCUSSING. 500 0.541 0.00E+00 0
001F1401.D
4UL G0808 (4976PPMV NH3 IN H2)+500ML 12SIN001-01#5,PORSGRUNN I,R121220. WITH LIQ. N2. CF=30ML/MN AND MAKE-UP=88ML/MIN. 30M 0.53MM ID 3.0UM DB5 FSCC (SC0CC 001). N MODE. PUMP AT 5 BACK TURNS RATE. DESORBED @RT. NO LIQ. N2 CRYOFUCUSSING. 500 4 0.0199040 0.556 7.41E+05
Percent Spike Recovery of NH3 @0.040
PPMV is 74%
001F1501.D
500ML 12SIN001-02#13,GAUSTAD I,R121220. WITH LIQ. N2. CF=30ML/MN AND MAKE-UP= 88ML/MIN. 30M 0.53MM ID 3.0UM DB5 FSCC (SC0CC 001). N MODE. PUMP AT 5 BACK TURNS RATE. DESORBED @RT. NO LIQ. N2 CRYOFUCUSSING. 500 0.541 0.00E+00 0
001F1601.D
4UL G0808 (4976PPMV NH3 IN H2)+500ML 12SIN001-02#13,GAUSTAD I,R121220. WITH LIQ. N2. CF=30ML/MN AND MAKE-UP=88ML/MIN. 30M 0.53MM ID 3.0UM DB5 FSCC (SC0CC 001). N MODE. PUMP AT 5 BACK TURNS RATE. DESORBED @RT. NO LIQ. N2 CRYOFUCUSSING. 500 4 0.0199040 0.569 6.20E+05
Percent Spike Recovery of NH3 @0.040
PPMV is 62%
001F1701.D
500ML 12SIN001-03#8,OKERN I,R121220. WITH LIQ. N2. CF=30ML/MN AND MAKE-UP=88ML/ MIN. 30M 0.53MM ID 3.0UM DB5 FSCC (SC0CC 001). N MODE. PUMP AT 5 BACK TURNS RATE. DESORBED @RT. NO LIQ. N2 CRYOFUCUSSING. 500 0.569 0.00E+00 0
001F1801.D
4UL G0808 (4976PPMV NH3 IN H2)+500ML 12SIN001-03#8,OKERN I,R121220. WITH LIQ. N2. CF=30ML/MN AND MAKE-UP=88ML/MIN. 30M 0.53MM ID 3.0UM DB5 FSCC (SC0CC 001). N MODE. PUMP AT 5 BACK TURNS RATE. DESORBED @RT. NO LIQ. N2 CRYOFUCUSSING. 500 4 0.0199040 0.545 8.49E+05
Percent Spike Recovery of NH3 @0.040
PPMV is 85%
001F1901.D
4UL G0808 (4976PPMV NH3 IN H2). WITH LIQ. N2. CF=30ML/MN AND MAKE-UP=88ML/MIN. 30M 0.53MM ID 3.0UM DB5 FSCC (SC0CC 001). N MODE. PUMP AT 5 BACK TURNS RATE. DESORBED @RT. NO LIQ. N2 CRYOFUCUSSING. 4 0.0199040 0.55 9.25E+05 2.2E-08
001F2001.D
4UL G0808 (4976PPMV NH3 IN H2)+500ML 12SIN001-03#8,OKERN I,R121220. WITH LIQ. N2. CF=30ML/MN AND MAKE-UP=88ML/MIN. 30M 0.53MM ID 3.0UM DB5 FSCC (SC0CC 001). N MODE. PUMP AT 5 BACK TURNS RATE. DESORBED @RT. NO LIQ. N2 CRYOFUCUSSING. 4 0.0199040 0.538 1.28E+06 1.6E-08
001F2101.D
4UL G0808 (4976PPMV NH3 IN H2). WITH LIQ. N2. CF=30ML/MN AND MAKE-UP=88ML/MIN. 30M 0.53MM ID 3.0UM DB5 FSCC (SC0CC 001). N MODE. PUMP AT 5 BACK TURNS RATE. DESORBED @RT. NO LIQ. N2 CRYOFUCUSSING. 4 0.0199040 0.547 7.53E+05 2.6E-08
Smart Chemistry, 3401 La Grande Blvd, Sacramento, CA 95823, [email protected], (916)391-3300

www.SmartChemistry.com
Analytical Data13.1
Cl2 Date of Analysis 01/04/2013
FILE NAME Injection
Volume of Hydrogen
(mL)
Volume Injected (uL) of Cl2 Standard @
100.0 PPMV
Volume of Cl2 (uL) Injected in Standard
& Spike AnalysisRET TIME OF
Cl2 AREA OF Cl2
Response Factor or Sample Conc in ppmv, Spike
Recovery
001F0501.D 5UL G0922 (100 PPMV CL2 IN H2) WITH LIQ. N2. N AND FAST MODE. CF=32.6ML/MIN AND 5 0.0005 0.464 1.23E+06 4.1E-10
001F0601.D 5UL G0922 (100 PPMV CL2 IN H2) WITH LIQ. N2. N AND FAST MODE. CF=32.6ML/MIN AND 5 0.0005 0.445 1.38E+06 3.6E-10
001F0701.D 5UL G0922 (100 PPMV CL2 IN H2) WITH LIQ. N2. N AND FAST MODE. CF=32.6ML/MIN AND 5 0.0005 0.489 1.11E+06 4.5E-10
001F0801.D 5UL G0922 (100 PPMV CL2 IN H2) WITH LIQ. N2. N AND FAST MODE. CF=32.6ML/MIN AND 5 0.0005 0.52 1.26E+06 4.0E-10
001F0901.D 5UL G0922 (100 PPMV CL2 IN H2) WITH LIQ. N2. N AND FAST MODE. CF=32.6ML/MIN AND 5 0.0005 0.496 9.48E+05 5.3E-10
001F1001.D 5UL G0922 (100 PPMV CL2 IN H2) WITH LIQ. N2. N AND FAST MODE. CF=32.6ML/MIN AND 5 0.0005 0.515 9.04E+05 5.5E-10
001F1101.D 5UL G0922 (100 PPMV CL2 IN H2) WITH LIQ. N2. N AND FAST MODE. CF=32.6ML/MIN AND 5 0.0005 0.511 9.80E+05 5.1E-10
001F1201.D 500ML 12ALA001-01#5,PORSGRUNN I, R121220 WITH LIQ. N2. N AND FAST MODE. CF=32. 500 0 0.511 0.00E+00 0.0E+00
001F1401.D 5UL G0922 (100 PPMV CL2 IN H2) WITH LIQ. N2. N AND FAST MODE. CF=32.6ML/MIN AND 5 0.0005 0.534 6.29E+05 7.9E-10
001F1801.D 5UL G0922 (100 PPMV CL2 IN H2) WITH LIQ. N2. N AND FAST MODE. CF=32.6ML/MIN AND 5 0.0005 0.573 7.74E+05 6.5E-10
001F1901.D 5UL G0922 (100 PPMV CL2 IN H2)+500ML 12ALA001-01#5,PORSGRUNN I, R121220 WITH
500 5 0.0005 0.858 2.54E+05
Percent Spike Recovery of Cl2 @0.001
PPMV is 23%
001F2001.D 5UL G0922 (100 PPMV CL2 IN H2)+500ML 12ALA001-01#5,PORSGRUNN I, R121220 WITH
500 5 0.0005 0.925 1.72E+05
Percent Spike Recovery of Cl2 @0.001
PPMV is 16%
001F2101.D 10UL G0922 (100 PPMV CL2 IN H2)+500ML 12ALA001-01#5,PORSGRUNN I, R121220 WITH
500 10 0.001 0.761 1.53E+06
Percent Spike Recovery of Cl2 @0.002
PPMV is 71%
001F2201.D 500ML 12ALA001-02#13,GAUSTAD I, R121220 WITH LIQ. N2. N AND FAST MODE. CF=32. 500 0 0.7 0.00E+00 0.0E+00
001F2501.D 10UL G0922 (100 PPMV CL2 IN H2)+500ML 12ALA001-02#13,GAUSTAD I, R121220 WITH
500 10 0.001 0.678 3.73E+05
Percent Spike Recovery of Cl2 @0.002
PPMV is 17%
001F2701.D 20UL G0922 (100 PPMV CL2 IN H2)+500ML 12ALA001-02#13,GAUSTAD I, R121220 WITH
500 20 0.002 0.617 7.46E+05
Percent Spike Recovery of Cl2 @0.004
PPMV is 17%
001F2801.D 500ML 12ALA001-03#8,OKERN I, R121220 WITH LIQ. N2. N AND FAST MODE. CF=32.6ML/ 500 0 0.619 0.00E+00 0.0E+00
001F2901.D 10UL G0922 (100 PPMV CL2 IN H2)+500ML 12ALA001-03#8,OKERN I, R121220 WITH LIQ.
500 10 0.001 0.7 2.85E+05
Percent Spike Recovery of Cl2 @0.002
PPMV is 13%
001F3001.D 20UL G0922 (100 PPMV CL2 IN H2)+500ML 12ALA001-03#8,OKERN I, R121220 WITH LIQ.
500 20 0.002 0.675 8.99E+05
Percent Spike Recovery of Cl2 @0.004
PPMV is 21%
001F3101.D 5UL G0922 (100 PPMV CL2 IN H2) WITH LIQ. N2. N AND FAST MODE. CF=32.6ML/MIN AND 5 0.0005 0.416 1.05E+06 4.7E-10
Smart Chemistry, 3401 La Grande Blvd, Sacramento, CA 95823, (916)391-3300, [email protected]
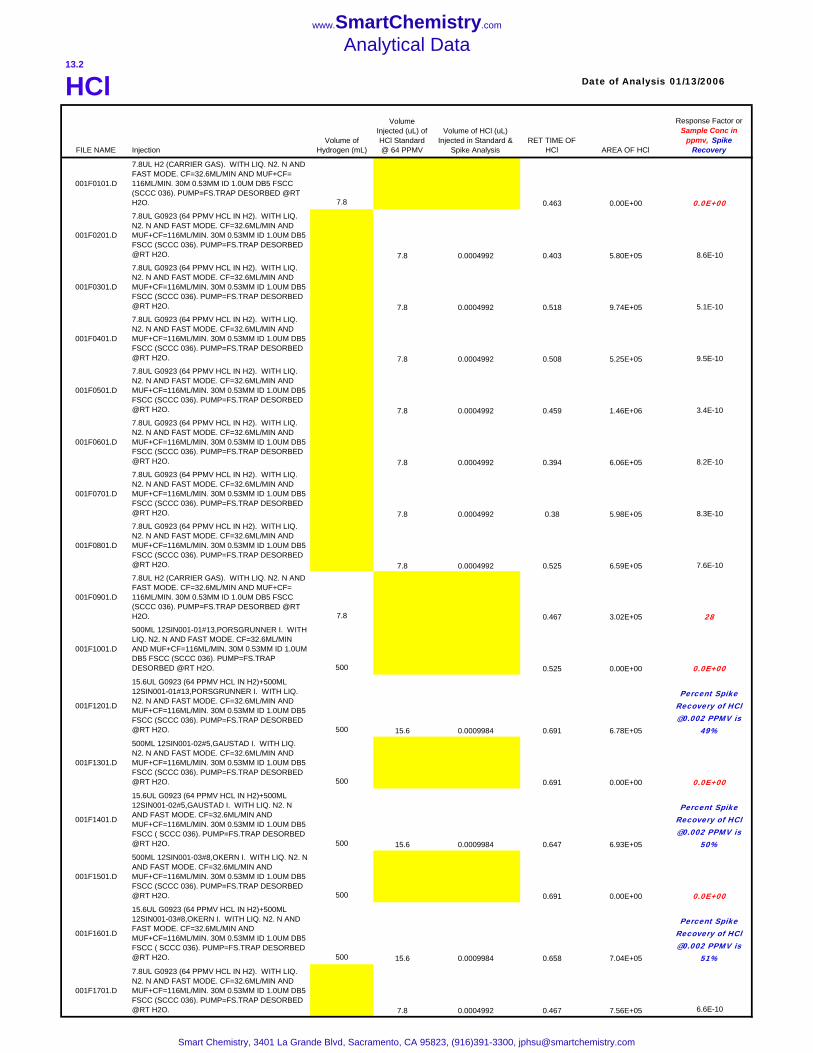
www.SmartChemistry.com
Analytical Data13.2
HCl Date of Analysis 01/13/2006
FILE NAME InjectionVolume of
Hydrogen (mL)
Volume Injected (uL) of HCl Standard @ 64 PPMV
Volume of HCl (uL) Injected in Standard &
Spike AnalysisRET TIME OF
HCl AREA OF HCl
Response Factor or Sample Conc in
ppmv, Spike Recovery
001F0101.D
7.8UL H2 (CARRIER GAS). WITH LIQ. N2. N AND FAST MODE. CF=32.6ML/MIN AND MUF+CF= 116ML/MIN. 30M 0.53MM ID 1.0UM DB5 FSCC (SCCC 036). PUMP=FS.TRAP DESORBED @RT H2O. 7.8 0.463 0.00E+00 0.0E+00
001F0201.D
7.8UL G0923 (64 PPMV HCL IN H2). WITH LIQ. N2. N AND FAST MODE. CF=32.6ML/MIN AND MUF+CF=116ML/MIN. 30M 0.53MM ID 1.0UM DB5 FSCC (SCCC 036). PUMP=FS.TRAP DESORBED @RT H2O. 7.8 0.0004992 0.403 5.80E+05 8.6E-10
001F0301.D
7.8UL G0923 (64 PPMV HCL IN H2). WITH LIQ. N2. N AND FAST MODE. CF=32.6ML/MIN AND MUF+CF=116ML/MIN. 30M 0.53MM ID 1.0UM DB5 FSCC (SCCC 036). PUMP=FS.TRAP DESORBED @RT H2O. 7.8 0.0004992 0.518 9.74E+05 5.1E-10
001F0401.D
7.8UL G0923 (64 PPMV HCL IN H2). WITH LIQ. N2. N AND FAST MODE. CF=32.6ML/MIN AND MUF+CF=116ML/MIN. 30M 0.53MM ID 1.0UM DB5 FSCC (SCCC 036). PUMP=FS.TRAP DESORBED @RT H2O. 7.8 0.0004992 0.508 5.25E+05 9.5E-10
001F0501.D
7.8UL G0923 (64 PPMV HCL IN H2). WITH LIQ. N2. N AND FAST MODE. CF=32.6ML/MIN AND MUF+CF=116ML/MIN. 30M 0.53MM ID 1.0UM DB5 FSCC (SCCC 036). PUMP=FS.TRAP DESORBED @RT H2O. 7.8 0.0004992 0.459 1.46E+06 3.4E-10
001F0601.D
7.8UL G0923 (64 PPMV HCL IN H2). WITH LIQ. N2. N AND FAST MODE. CF=32.6ML/MIN AND MUF+CF=116ML/MIN. 30M 0.53MM ID 1.0UM DB5 FSCC (SCCC 036). PUMP=FS.TRAP DESORBED @RT H2O. 7.8 0.0004992 0.394 6.06E+05 8.2E-10
001F0701.D
7.8UL G0923 (64 PPMV HCL IN H2). WITH LIQ. N2. N AND FAST MODE. CF=32.6ML/MIN AND MUF+CF=116ML/MIN. 30M 0.53MM ID 1.0UM DB5 FSCC (SCCC 036). PUMP=FS.TRAP DESORBED @RT H2O. 7.8 0.0004992 0.38 5.98E+05 8.3E-10
001F0801.D
7.8UL G0923 (64 PPMV HCL IN H2). WITH LIQ. N2. N AND FAST MODE. CF=32.6ML/MIN AND MUF+CF=116ML/MIN. 30M 0.53MM ID 1.0UM DB5 FSCC (SCCC 036). PUMP=FS.TRAP DESORBED @RT H2O. 7.8 0.0004992 0.525 6.59E+05 7.6E-10
001F0901.D
7.8UL H2 (CARRIER GAS). WITH LIQ. N2. N AND FAST MODE. CF=32.6ML/MIN AND MUF+CF= 116ML/MIN. 30M 0.53MM ID 1.0UM DB5 FSCC (SCCC 036). PUMP=FS.TRAP DESORBED @RT H2O. 7.8 0.467 3.02E+05 28
001F1001.D
500ML 12SIN001-01#13,PORSGRUNNER I. WITH LIQ. N2. N AND FAST MODE. CF=32.6ML/MIN AND MUF+CF=116ML/MIN. 30M 0.53MM ID 1.0UM DB5 FSCC (SCCC 036). PUMP=FS.TRAP DESORBED @RT H2O. 500 0.525 0.00E+00 0.0E+00
001F1201.D
15.6UL G0923 (64 PPMV HCL IN H2)+500ML 12SIN001-01#13,PORSGRUNNER I. WITH LIQ. N2. N AND FAST MODE. CF=32.6ML/MIN AND MUF+CF=116ML/MIN. 30M 0.53MM ID 1.0UM DB5 FSCC (SCCC 036). PUMP=FS.TRAP DESORBED @RT H2O. 500 15.6 0.0009984 0.691 6.78E+05
Percent Spike Recovery of HCl @0.002 PPMV is
49%
001F1301.D
500ML 12SIN001-02#5,GAUSTAD I. WITH LIQ. N2. N AND FAST MODE. CF=32.6ML/MIN AND MUF+CF=116ML/MIN. 30M 0.53MM ID 1.0UM DB5 FSCC (SCCC 036). PUMP=FS.TRAP DESORBED @RT H2O. 500 0.691 0.00E+00 0.0E+00
001F1401.D
15.6UL G0923 (64 PPMV HCL IN H2)+500ML 12SIN001-02#5,GAUSTAD I. WITH LIQ. N2. N AND FAST MODE. CF=32.6ML/MIN AND MUF+CF=116ML/MIN. 30M 0.53MM ID 1.0UM DB5 FSCC ( SCCC 036). PUMP=FS.TRAP DESORBED @RT H2O. 500 15.6 0.0009984 0.647 6.93E+05
Percent Spike Recovery of HCl @0.002 PPMV is
50%
001F1501.D
500ML 12SIN001-03#8,OKERN I. WITH LIQ. N2. N AND FAST MODE. CF=32.6ML/MIN AND MUF+CF=116ML/MIN. 30M 0.53MM ID 1.0UM DB5 FSCC (SCCC 036). PUMP=FS.TRAP DESORBED @RT H2O. 500 0.691 0.00E+00 0.0E+00
001F1601.D
15.6UL G0923 (64 PPMV HCL IN H2)+500ML 12SIN001-03#8,OKERN I. WITH LIQ. N2. N AND FAST MODE. CF=32.6ML/MIN AND MUF+CF=116ML/MIN. 30M 0.53MM ID 1.0UM DB5 FSCC ( SCCC 036). PUMP=FS.TRAP DESORBED @RT H2O. 500 15.6 0.0009984 0.658 7.04E+05
Percent Spike Recovery of HCl @0.002 PPMV is
51%
001F1701.D
7.8UL G0923 (64 PPMV HCL IN H2). WITH LIQ. N2. N AND FAST MODE. CF=32.6ML/MIN AND MUF+CF=116ML/MIN. 30M 0.53MM ID 1.0UM DB5 FSCC (SCCC 036). PUMP=FS.TRAP DESORBED @RT H2O. 7.8 0.0004992 0.467 7.56E+05 6.6E-10
Smart Chemistry, 3401 La Grande Blvd, Sacramento, CA 95823, (916)391-3300, [email protected]

www.SmartChemistry.com
Analytical Data13.3
HBr Date of Analysis 01/13/2006
FILE NAME InjectionVolume of
Hydrogen (mL)
Volume Injected (uL) of HBr
Standard @ 120 PPMV
Volume of HBr (uL) Injected in
Standard & Spike Analysis
RET TIME OF HBr AREA OF HBr
Response Factor or Sample Conc in ppmv,
Spike Recovery
001F0101.D
8.4UL H2 (CARRIER GAS). WITH LIQ. N2. N AND FAST MODE. CF=32.6ML/MIN AND MUF+CF= 116ML/MIN. 30M 0.53MM ID 1.0UM DB5 FSCC (SCCC 036). PUMP=FS.TRAP DESORBED @RT H2O. 8.4 0.509 1.45E+05 11
001F0201.D
8.4UL G0924 (120 PPMV HCL IN H2). WITH LIQ. N2. N AND FAST MODE. CCF=32.6ML/MIN AND MUF+CF=116ML/MIN. 30M 0.53MM ID 1.0UM DB5 FSCC (SCCC 036). PUMP=FS.TRAP DESORBED @RT H2O. 8.4 0.001008 0.511 2.95E+06 3.4E-10
001F0301.D
4.2UL G0924 (120 PPMV HCL IN H2). WITH LIQ. N2. N AND FAST MODE. CF=32.6ML/MIN AND MUF+CF=116ML/MIN. 30M 0.53MM ID 1.0UM DB5 FSCC (SCCC 036). PUMP=FS.TRAP DESORBED @RT H2O. 4.2 0.000504 0.412 1.10E+06 4.6E-10
001F0401.D
4.2UL G0924 (120 PPMV HCL IN H2). WITH LIQ. N2. N AND FAST MODE. CF=32.6ML/MIN AND MUF+CF=116ML/MIN. 30M 0.53MM ID 1.0UM DB5 FSCC (SCCC 036). PUMP=FS.TRAP DESORBED @RT H2O. 4.2 0.000504 0.442 8.77E+05 5.7E-10
001F0501.D
4.2UL G0924 (120 PPMV HCL IN H2). WITH LIQ. N2. N AND FAST MODE. CF=32.6ML/MIN AND MUF+CF=116ML/MIN. 30M 0.53MM ID 1.0UM DB5 FSCC (SCCC 036). PUMP=FS.TRAP DESORBED @RT H2O. 4.2 0.000504 0.439 8.64E+05 5.8E-10
001F0601.D
4.2UL G0924 (120 PPMV HCL IN H2). WITH LIQ. N2. N AND FAST MODE. CF=32.6ML/MIN AND MUF+CF=116ML/MIN. 30M 0.53MM ID 1.0UM DB5 FSCC (SCCC 036). PUMP=FS.TRAP DESORBED @RT H2O. 4.2 0.000504 0.476 5.82E+05 8.7E-10
001F0701.D
4.2UL G0924 (120 PPMV HCL IN H2). WITH LIQ. N2. N AND FAST MODE. CF=32.6ML/MIN AND MUF+CF=116ML/MIN. 30M 0.53MM ID 1.0UM DB5 FSCC (SCCC 036). PUMP=FS.TRAP DESORBED @RT H2O. 4.2 0.000504 0.418 7.41E+05 6.8E-10
001F0801.D
4.2UL G0924 (120 PPMV HCL IN H2). WITH LIQ. N2. N AND FAST MODE. CF=32.6ML/MIN AND MUF+CF=116ML/MIN. 30M 0.53MM ID 1.0UM DB5 FSCC (SCCC 036). PUMP=FS.TRAP DESORBED @RT H2O. 4.2 0.000504 0.498 6.35E+05 7.9E-10
001F0901.D
4.2UL G0924 (120 PPMV HCL IN H2). WITH LIQ. N2. N AND FAST MODE. CF=32.6ML/MIN AND MUF+CF=116ML/MIN. 30M 0.53MM ID 1.0UM DB5 FSCC (SCCC 036). PUMP=FS.TRAP DESORBED @RT H2O. 4.2 0.000504 0.405 6.56E+05 7.7E-10
001F1001.D
4.2UL H2 (CARRIER GAS). WITH LIQ. N2. N AND FAST MODE. CF=32.6ML/MIN AND MUF+CF= 116ML/MIN. 30M 0.53MM ID 1.0UM DB5 FSCC (SCCC 036). PUMP=FS.TRAP DESORBED @RT H2O. 4.2 0.473 2.73E+05 41
001F1101.D
500ML 12SIN001-01#13,PORSGRUNNER I. WITH LIQ. N2. N AND FAST MODE. CF=32.6ML/MIN AND MUF+CF=116ML/MIN. 30M 0.53MM ID 1.0UM DB5 FSCC (SCCC 036). PUMP=FS.TRAP DESORBED @RT H2O. 500 0.448 1.74E+04 2.2E-05
001F1201.D
500ML 12SIN001-01#13,PORSGRUNNER I. WITH LIQ. N2. N AND FAST MODE. CF=32.6ML/MIN AND MUF+CF=116ML/MIN. 30M 0.53MM ID 1.0UM DB5 FSCC (SCCC 036). PUMP=FS.TRAP DESORBED @RT H2O. 500 0.405 0.00E+00 0.0E+00
001F1301.D
8.4UL G0924 (120 PPMV HBR IN H2)+500ML 12SIN001-01#13,PORSGRUNNER I. WITH LIQ. N2. N AND FAST MODE. CF=32.6ML/MIN AND MUF+CF=116ML/MIN. 30M 0.53MM ID 1.0UM DB5 FSCC (SCCC 036). PUMP=FS.TRAP DESORBED @RT H2O. 500 8.4 0.001008 0.652 2.76E+06
Percent Spike Recovery of HBr @0.002 PPMV is
173%
001F1401.D
500ML 12SIN001-02#5,GAUSTAD I. WITH LIQ. N2. N AND FAST MODE. CF=32.6ML/MIN AND MUF+CF=116ML/MIN. 30M 0.53MM ID 1.0UM DB5 FSCC (SCCC 036). PUMP=FS.TRAP DESORBED @RT H2O. 500 0.76 6.66E+04 8.4E-05
001F1501.D
8.4UL G0924 (120 PPMV HBR IN H2)+500ML 12SIN001-02#5,GAUSTAD I. WITH LIQ. N2. N AND FAST MODE. CCF=32.6ML/MIN AND MUF+CF=116ML/MIN. 30M 0.53MM ID 1.0UM DB5 FSCC (SCCC 036). PUMP=FS.TRAP DESORBED @RT H2O. 500 8.4 0.001008 0.6 1.73E+06
Percent Spike Recovery of HBr @0.002 PPMV is
109%
001F1601.D
500ML 12SIN001-03#8,OKERN I. WITH LIQ. N2. N AND FAST MODE. CF=32.6ML/MIN AND MUF+CF=116ML/MIN. 30M 0.53MM ID 1.0UM DB5 FSCC (SCCC 036). PUMP=FS.TRAP DESORBED @RT H2O. 500 0.783 1.13E+05 1.4E-04
001F1701.D
500ML 12SIN001-03#8,OKERN I. WITH LIQ. N2. N AND FAST MODE. CF=32.6ML/MIN AND MUF+CF=116ML/MIN. 30M 0.53MM ID 1.0UM DB5 FSCC (SCCC 036). PUMP=FS.TRAP DESORBED @RT H2O. 500 0.652 0.00E+00 0.0E+00
001F1801.D
8.4UL G0924 (120 PPMV HBR IN H2)+500ML 12SIN001-03#8,OKERN I. WITH LIQ. N2. N AND FAST MODE. CF=32.6ML/MIN AND MUF+CF=116ML/MIN. 30M 0.53MM ID 1.0UM DB5 FSCC ( SCCC 036). PUMP=FS.TRAP DESORBED @RT H2O. 500 8.4 0.001008 0.595 1.88E+06
Percent Spike Recovery of HBr @0.002 PPMV is
118%
001F1901.D
4.2UL G0924 (120 PPMV HCL IN H2). WITH LIQ. N2. N AND FAST MODE. CF=32.6ML/MIN AND MUF+CF=116ML/MIN. 30M 0.53MM ID 1.0UM DB5 FSCC (SCCC 036). PUMP=FS.TRAP DESORBED @RT H2O. 4.2 0.000504 0.398 3.63E+06 1.4E-10
001F2001.D
4.2UL G0924 (120 PPMV HBR IN H2)+500ML 12SIN001-01#13,PORSGRUNNER I. WITH LIQ. N2. N AND FAST MODE. CF=32.6ML/MIN AND MUF+CF=116ML/MIN. 30M 0.53MM ID 1.0UM DB5 FSCC (SCCC 036). PUMP=FS.TRAP DESORBED @RT H2O. 500 4.2 0.000504 0.638 2.10E+06
Percent Spike Recovery of HBr
@0.001 PPMV is 65%
001F2101.D
4.2UL G0924 (120 PPMV HBR IN H2)+500ML 12SIN001-02#5,GAUSTAD I. WITH LIQ. N2. N AND FAST MODE. CCF=32.6ML/MIN AND MUF+CF=116ML/MIN. 30M 0.53MM ID 1.0UM DB5 FSCC (SCCC 036). PUMP=FS.TRAP DESORBED @RT H2O. 500 4.2 0.000504 0.685 3.93E+06
Percent Spike Recovery of HBr @0.001 PPMV is
122%
001F2201.D
4.2UL G0924 (120 PPMV HBR IN H2)+500ML 12SIN001-03#8,OKERN I. WITH LIQ. N2. N AND FAST MODE. CF=32.6ML/MIN AND MUF+CF=116ML/MIN. 30M 0.53MM ID 1.0UM DB5 FSCC ( SCCC 036). PUMP=FS.TRAP DESORBED @RT H2O. 500 4.2 0.000504 0.719 4.30E+06
Percent Spike Recovery of HBr @0.001 PPMV is
133%
001F2301.D
4.2UL H2 (CARRIER GAS). WITH LIQ. N2. N AND FAST MODE. CF=32.6ML/MIN AND MUF+CF= 116ML/MIN. 30M 0.53MM ID 1.0UM DB5 FSCC (SCCC 036). PUMP=FS.TRAP DESORBED @RT H2O. 4.2 0.431 6.58E+05 22
001F2401.D
4.2UL G0924 (120 PPMV HCL IN H2). WITH LIQ. N2. N AND FAST MODE. CF=32.6ML/MIN AND MUF+CF=116ML/MIN. 30M 0.53MM ID 1.0UM DB5 FSCC (SCCC 036). PUMP=FS.TRAP DESORBED @RT H2O. 4.2 0.000504 0.451 2.90E+06 1.7E-10
Smart Chemistry, 3401 La Grande Blvd, Sacramento, CA 95823, (916)391-3300, [email protected]

www.SmartChemistry.com
Report Summary for Particulates
Porsgrunn Gaustad Økern12SIN001-01 12SIN001-02 12SIN001-03
ConstituentSAE Limits (μmol/mol)
Smart Chemistry
Detection Limits (μmol/mol)
Concentration (μmol/mol)
Concentration (μmol/mol)
Concentration (μmol/mol)
Analytical Method
Particulate Concentration 1mg/Kg 0.042 mg/kg 0.14 mg/kg 0.21 mg/kg ASTM D7651-10
Particulates Found & Size (ASTM D7634-10) - Images of particulates and pinholes found are in Table 1
Particulate 1 – 0.18mm Particulate 2 – 0.11mmParticulate 3 – 0.15mmParticulate 4 – 0.13mmParticulate 5 – 0.15mm Particulate 6 – 0.24mmParticulate 7 – 0.13mmParticulate 8 – 0.22mmParticulate 9 – 0.14mm
Particulate 10 – 0.13mmParticulate 11 – 0.11mm
There are total 48 particulates found with their sizes over
0.03mm. The particulate size distribution is listed below.
# of Particulate @ 0.12mm – 1# of Particulate @ 0.07mm – 3# of Particulate @ 0.06mm – 1# of Particulate @ 0.05mm – 6
# of Particulate @ 0.04mm – 22# of Particulate @ 0.03mm – 15
Particulate 1 - 0.47mm Particulate 2 - 0.51mm Particulate 3 – 0.06mm Particulate 4 – 0.26mm Particulate 5 – 0.30mm Particulate 6 - 0.15mm Particulate 7 – 0.41mm
SMART CHEMISTRY, 3401 La Grande Blvd, Sacramento, CA 95823, (916)391-3300, [email protected]

Table 1 Particulate Report
Smart Chemistry, 3401 La Grande Blvd, Sacramento, CA 95823, (916)391-3300, [email protected]
Porsgrunn: Particulate Concentration - 0.042 mg/kg
This is particulate
filter after sampling,
in which 0.086 mg
particulates are found
in 2.07 kilogram
hydrogen. Eleven
particulates are found and shown on the left and below along with images and sizes.
Particulate 1 – 0.18mm
Particulate 2 – 0.11mm Particulate 3 – 0.15mm Particulate 4 – 0.13mm Particulate 5 – 0.15mm
Particulate 6 – 0.24mm
Particulate 7 – 0.13mm
Particulate 8 – 0.22mm
Particulate 9 – 0.14mm Particulate 10 – 0.13mm
Particulate 11 – 0.11mm

Table 1 Particulate Report
Smart Chemistry, 3401 La Grande Blvd, Sacramento, CA 95823, (916)391-3300, [email protected]
Gaustad: Particulate Concentration - 0.14 mg/kg
This is particulate filter after sampling, in which 0.346 mg particulates are found in 2.4
kilogram hydrogen. The picture on the right with 27 times magnification shows many oily stains in the filter
center within diameter of 8.3mm, in which four large spots with the sizes 1.4, 1.0, 0.87 and 0.40 mm length are found. Forty eight particulates with size larger than 0.02mm are found in the central 8.3mm OD circle. The images and sizes of the 48 particulates are shown below.
Particulate 1 – 0.04mm Particulate 2 – 0.04mm Particulate 3 – 0.04mm Particulate 4 – 0.07mm Particulate 5 – 0.03mm Particulate 6 – 0.04mm Particulate 7 – 0.04mm Particulate 8 – 0.12mm Particulate 9 – 0.04mm Particulate 10 – 0.07mm
Particulate 11 – 0.06mm Particulate 12 – 0.04mm Particulate 13 – 0.04mm Particulate 14 – 0.04mm Particulate 15 – 0.03mm Particulate 16 – 0.03mm Particulate 17 – 0.03mm Particulate 18 – 0.03mm Particulate 19 – 0.03mm Particulate 20 – 0.03mm Particulate 21 – 0.05mm Particulate 22 – 0.03mm Particulate 23 – 0.03mm Particulate 24 – 0.04mm Particulate 25 – 0.05mm

Table 1 Particulate Report
Smart Chemistry, 3401 La Grande Blvd, Sacramento, CA 95823, (916)391-3300, [email protected]
Gaustad: Particulate Concentration - 0.14 mg/kg
Particulate 26 – 0.05mm Particulate 27 – 0.04mm Particulate 28 – 0.04mm Particulate 29 – 0.05mm Particulate 30 – 0.07mm Particulate 31 – 0.03mm Particulate 32 – 0.03mm Particulate 33 – 0.04mm Particulate 34 – 0.04mm Particulate 35 – 0.05mm Particulate 36 – 0.03mm Particulate 37 – 0.04mm Particulate 38 – 0.04mm Particulate 39 – 0.04mm Particulate 40 – 0.03mm Particulate 41 – 0.04mm Particulate 42 – 0.04mm Particulate 43 – 0.04mm Particulate 44 – 0.03mm Particulate 45 – 0.04mm Particulate 46 – 0.04mm Particulate 47 – 0.03mm Particulate 48 – 0.05mm

Table 1 Particulate Report
Smart Chemistry, 3401 La Grande Blvd, Sacramento, CA 95823, (916)391-3300, [email protected]
Økern: Particulate Concentration - 0.21 mg/kg
This is particulate filter after sampling, in
which 0.195 mg particulates are found in
0.950 kilogram hydrogen. Seven particulates
are found and shown below along with images and sizes.
Particulate 1 (0.47mm) looks metalic under polarized light.
Particulate 2 (0.51mm) looks metalic under polarized light.
Particulate 3 –
0.06mm
Particulate 4 –
0.26mm Particulate 5 –
0.30mm
Particulate 6 -
0.15mm
Particulate 7 – 0.41mm

www.SmartChemistry.com
Particulate Concentration Calculation Sheet
Date
WMF (Weight Monitoring Filter)
Weight (g)
WMF (Filter#88) (Weight Monitoring Filter) Weight (g)
#129, PORGRUNN: 2.07KG - Filter
Weight (g) before Sampling
#129, PORGRUNN: 2.07KG - Filter Weight
(g) after Sampling
#130, GAUSTAD: 2.04KG - Filter Weight
(g) before Sampling
#130, GAUSTAD: 2.04KG - Filter Weight
(g) after Sampling
#131, ΦKERN: 950G - Filter Weight (g) before Sampling
#131, ΦKERN: 950G - Filter Weight (g)
after Sampling
2012-10-24time 12.45.58 0.09605 0.09745 0.09773 0.097130.09745 0.09773 0.097130.09746 0.09778 0.097140.09745 0.09779 0.097150.09746 0.09775 0.097150.09743 0.09777 0.097170.09742 0.09777 0.097140.09745 0.09776 0.097150.09744 0.09778 0.097160.09745 0.09779 0.09714
2012-10-24time 16.18.57 0.09259 2012-11-13time 15.11.08 0.0961 0.09754 0.09809 0.09732
0.09753 0.0981 0.097310.09754 0.0981 0.097360.09754 0.09813 0.097320.09754 0.09812 0.097380.09755 0.09813 0.097320.09754 0.09811 0.097340.09754 0.0981 0.097350.09752 0.09811 0.09737
2012-11-13time 17.55.34 0.09265 0.09748 0.09812 0.09734Number of Measurement 2 2 10 10 10 10 10 10
Average Filter Weight 0.09608 0.09262 0.09745 0.09753 0.09777 0.09811 0.09715 0.09734Average Standard Deviation of Weight (g) 3.54E-05 4.24E-05 1.26E-05 1.99E-05 2.22E-05 1.37E-05 1.26E-05 2.38E-05Relative Standard Deviation of Weight (g) 0.0368% 0.0458% 0.0130% 0.0204% 0.0227% 0.0140% 0.0130% 0.0244%
Average Weight of Particulates (g) on
Filter 0.000086
Average Weight of Particulates (g) on
Filter 0.000346
Average Weight of Particulates (g) on
Filter 0.000195
SamplingEvent
Sampling Duration (second) Inlet Pressure (psi) Sampling Flow Rate Hydrogen Sampled (kg) Sampling Flow Rate Hydrogen Sampled (kg) Sampling Flow Rate
Hydrogen Sampled (kg)
Particulate Sampling 2.07 2.4 0.95H2 Sampled for Particulate (m3) 25.3 29.3 11.6Particulate Concentration
Average Particulate Concentration (mg/kg) 0.042 mg/kg 0.14 mg/kg 0.21 mg/kg
Average Particulate Concentration (μg/L) 0.0034 μg/Liter 0.0137 μg/Liter0.0077 μg/Liter
SMART CHEMISTRY, 3401 La Grande Blvd,Sacramento, CA, 95823, (916)391-3300, [email protected]
FTIR measurement of Hydrogen fuel gas impurities at 3 different H2 refuelling stations in Norway
Table of contents
1. OBJECTIVES .......................................................................................................................................................... 2
2. EQUIPMENT ......................................................................................................................................................... 2
3. SYSTEM PREPARATIONS AND TESTS ..................................................................................................................... 3
INSTRUMENT SELECTION ......................................................................................................................................................... 3 SYSTEM TESTS ....................................................................................................................................................................... 5
4. MEASUREMENTS .................................................................................................................................................. 5
PRELIMINARY VACUUMING AND FLASHING .................................................................................................................................. 5 BACKGROUND SPECTRA .......................................................................................................................................................... 5 CALIBRATION SPECTRA ............................................................................................................................................................ 6 ACQUISITION OF SPECTRA ........................................................................................................................................................ 7
5. DATA ANALYSIS .................................................................................................................................................... 7
6. REQUIRED SYSTEM SPECIFICATIONS .................................................................................................................... 11
7. CONCLUSION ....................................................................................................................................................... 11
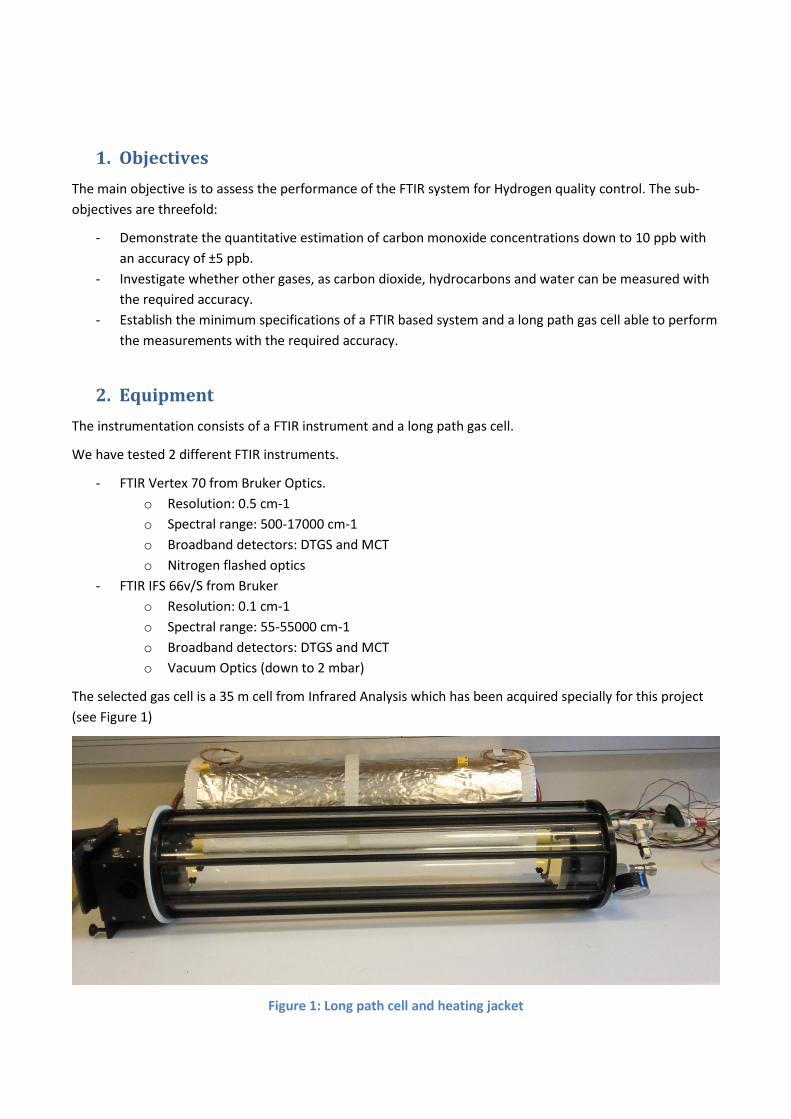
1. Objectives The main objective is to assess the performance of the FTIR system for Hydrogen quality control. The sub-objectives are threefold:
- Demonstrate the quantitative estimation of carbon monoxide concentrations down to 10 ppb with an accuracy of ±5 ppb.
- Investigate whether other gases, as carbon dioxide, hydrocarbons and water can be measured with the required accuracy.
- Establish the minimum specifications of a FTIR based system and a long path gas cell able to perform the measurements with the required accuracy.
2. Equipment The instrumentation consists of a FTIR instrument and a long path gas cell.
We have tested 2 different FTIR instruments.
- FTIR Vertex 70 from Bruker Optics. o Resolution: 0.5 cm-1 o Spectral range: 500-17000 cm-1 o Broadband detectors: DTGS and MCT o Nitrogen flashed optics
- FTIR IFS 66v/S from Bruker o Resolution: 0.1 cm-1 o Spectral range: 55-55000 cm-1 o Broadband detectors: DTGS and MCT o Vacuum Optics (down to 2 mbar)
The selected gas cell is a 35 m cell from Infrared Analysis which has been acquired specially for this project (see Figure 1)
Figure 1: Long path cell and heating jacket

Measurement Gas cell specifications
The long path gas cell has the following specifications: - Path length: 35 meters - Body material: Borosilicate glass - Mirror coating: Protected gold - Body dimensions: Length, 60 cm; diameter, 12.5 cm. - Volume: 8.5 liters. - Window material: Potassium chloride
Others: Two stainless steel plug valves, pressure release valve, compound gauge (0-2 bar abs.) and septum holder for gas mixing.
The heating jacket is temperature controlled and may provide heating up to 200 °C
3. System preparations and tests
Instrument selection The gas cell was first tested with the Vertex 70 FTIR from Bruker. This spectrometer has a fast scanning frequency, but the instrument optics and the transfer optics of the gas cell must be purged continuously if low levels of carbon monoxide and water have to be measured. Figure 2 is showing the 35 m gas cell mounted in the sample compartment of the Vertex 70 FTIR.
Figure 2: 35 m gas cell mounted in the sample compartment of the Vertex 70

When averaging over 250 scans at a resolution of 1 cm-1, we were able to detect 100±50 ppb CO with continuous nitrogen purging and a DTGS detector. The signal to noise ratio (SNR) was about 4000 RMS (800 peak to peak)1.
Using a liquid nitrogen cooled MCT detector can usually enhance the signal to noise ratio (SNR) by a factor of 5 or better, but this would only make us able to detect 20±10 ppb CO.
Furthermore it appeared that it could become difficult to detect low concentrations of CO2 and H2O without a high nitrogen flow through the optics and/or a better evacuation system for the sampling compartment.
We therefore decided to test a FTIR instrument with vacuumed optics.
Professor Claus Jørgen Nielsen, at the Chemical Institute of the University of Oslo, made the IFS 66v/S FTIR instrument available for our use and has contributed with its FTIR expertise.
Figure 3: 35 m long path cell with vacuum housing mounted in the IFS 66v/S
The IFS 66v/S FTIR instrument is a relatively old brand with vacuumed optics and high spectral resolution. Its main weakness was the MCT detector which was negatively affected by a non-original focusing.
1 During the adjustment of the gas cell inside the IFS 66v/S is was been found that the cell mirrors were not optimally adjusted and that the throughput could easily be enhanced by about 50%.

To make use of the vacuuming capability of the IFS 66V/S with the 35 m gas cell, we had to build a sealed housing around the gas cell and the sampling compartment of the FTIR. The gas cell, with its vacuum sealed housing, mounted in the sample compartment of the IFS 66v/S is shown in Figure 3.
It was unfortunately not possible to integrate the heating jacket inside the sealed housing of the gas cell.
This instrument configuration has been used for both the collection of calibration spectra and the acquisition of absorption spectra for the hydrogen samples collected at the Hydrogen station of Gaustad, Økern and Porsgrunn.
It should be noted that the Vertex 70 FTIR or equivalent may still be an option if an efficient arid zone is fitted between the transfer optics of the cell and the instrument.
System tests We have used a MCT detector (Mercury-Cadmium Telluride) and obtained a signal to noise ratio (SNR) of nearly 18000 RMS (amplitude ratio of 3200) at a wavenumber of 2600 cm-1. This is 40% below the expected SNR. This sensitivity shortage was probably due to a non-optimal evacuation of the detector Dewar and the previous mentioned non-original focusing mirror. In comparison we did obtain a SNR of nearly 6000 for the same conditions with the DTGS detector.
An optimal, healthy, MCT detector will therefore enhance the Limit Of Detection (LOD) and the resolution significantly.
Another observation we made was a small, but significant, instrument baseline drift and a substantial baseline deformation that we later found was due to the incomplete evacuation of the liquid nitrogen Dewar. These discrepancies have complicated the processing of the baseline compensation/correction and introduced an additional inaccuracy.
4. Measurements
Preliminary vacuuming and flashing Before starting the measurements, the cell must be vacuumed and optionally flashed with nitrogen. This procedure depends highly upon the quality of the vacuum equipment. Optimally, the nitrogen flashing is not absolutely required when a high capacity vacuum pump and a moderate heating of the gas cell are applied over a significant number of hours (e.g. over one night). However, since our vacuum pump was not very efficient and the gas cell could not be heated, we decided to perform three subsequent vacuuming-flashing cycles with each vacuuming period lasting 1 hour.
In a future commercial system the vacuuming procedure will be significantly enhanced by heating up the gas-cell moderately in order to release the remaining gas molecules sticking more or less to the cell's walls.
Medium quality Nitrogen 4.6 (purity 99.996%) was used during the flushing procedure.
Background spectra The quality of the background spectra is decisive to obtain a reliable and low noise measurement. The background spectra may be collected with either a vacuumed or nitrogen filled cell. A vacuumed cell is preferred but is only useful when high vacuum (<= 2mbar) can be confirmed in both the cell and the optics (transferring optics and FTIR optics). In the present case we had 2 mbar inside the optics, but unfortunately

we were not able to validate a vacuum better than 20 mbar in the cell because of a relatively inefficient vacuum pump and a low resolution manometer2.
The background spectra have therefore been collected with the cell filled with high quality Nitrogen 6.0. (Purity >= 99.9999%, H2O<=1ppm hydrocarbons (CnHm) <=100ppb, CO<=100 ppb, CO2<=500ppb). This quality is necessary when low concentrations of H2O, CO, CO2 and hydrocarbons are to be estimated.
Calibration spectra Calibration spectra were collected for carbon monoxide, methane, ethane and propane. Only two concentrations for each gas species have been used, since the absorbencies were expected to be low and a linear behavior was therefore ensured.
The following calibration spectra have been collected and used in a PLS model: - Carbon monoxide (CO): 100 ppb and 400 ppb - Methane (CH4): 100 ppb and 400 ppb - Ethane (C2H6): 200 ppb and 1 ppm - Propane (C3H8): 100 ppb and 400 ppb (doubtful quality)
For gas with overlapping absorption features (e.g. hydrocarbons like methane, ethane, propane and heptane) it is recommended to collect calibration spectra of mixtures in order to generate reliable calibration models that can be used to predict the individual components. Such gas mixing process must be performed with high accuracy and is time-consuming. Unfortunately, we had not enough time and resources to prepare the mixtures of hydrocarbons and collect their calibration spectra.
However, as long as the total absorbance is low (<0.5) and the calibration spectra of single gases are of high quality it is possible to handle mixture by adding scaled and pressure corrected calibration spectra from different gases to each other. One should be careful and remember that although total simulated pressure is correctly adjusted to 1 bar, scaling also affect the final noise. Furthermore, addition of spectra (scaled or not) from different sources is impaired by instrument transfer function differences and should be avoided.
However, this was not a real hindrance for the estimation of methane concentration because of the clear line structure of its absorption spectrum and the possibility to select a spectral range outside the main C-H stretching band. Ethane, propane and heptane were more affected by this omission, but the concentration of Ethane in the Porsgrunn sample was so high than a measurement accuracy of ±15% could be confirmed.
The calibration was performed with a relatively low precision manometer and without controlling the temperature which, however, however not fluctuating by more than 5 °C. Furthermore, the non-optimal dilution of the reference gases used to generate the calibration samples may introduce an inaccuracy of about ± 15%. As we can assume that this inaccuracy is normal distributed we can conclude that the standard deviation for the calibration gas concentration is not far from 15%.
An optimal procedure for calibration gas preparation, like the one we have used for NASA, can bring this value down to 2.5%. Such a procedure is tedious and will only be used for a final calibration.
2 We have subsequently acquired a high capacity vacuum pump and a Pirani vacuum manometer, and have tested the 35m gas cell down to 1 mbar. The next calibration will therefore be simplified and much more accurate.

Synthetic spectra generated from HITRAN2008 by SpectralCalc software (SC) have been used to model carbon dioxide (CO2) and water, while spectra from the Infrared Analysis database have been used for Heptane and Acetone.
Noise in the collected spectra is a limiting factor for both calibration and sample measurements. A main purpose of the PLS modeling is to assign optimal weights on the measured values to balance information against noise. The synthetic spectra must therefore reflect the actual noise in the collected spectra. We have therefore added spectral dependent, but stochastically independent noise, generated by the baseline corrected ratio of two subsequent background spectra to the simulated spectra.
Acquisition of spectra The acquisition of the absorption spectra has been performed at 1 cm-1 (unapodised) and averaged over 250 scans. It should be noted that the real apodised resolution is in reality 1.25 cm-1.
5. Data analysis The analysis has been performed on two different platforms:
- Essential FTIR software (Partial Least Square – PLS modeling and prediction) - Our one Matlab program (Baseline correction, PLS modeling and prediction).
To simplify PLS modeling we have assumed relatively low absorbencies (<0.5) and concentrations < 1 ppm.
The two platforms have issued nearly the same results and the results from the Essential FTIR PLS prediction are listed in Table 1.
CO CO2 H2O Methane Propane Ethane Heptane Acetone
LOD 5 ppb 100 ppb 1 ppm 5 ppb 10 ppb 20 ppb 10 ppb 40 ppb
Gaustad 12 ppb < 500 ppb < 1 ppm 8 ppb <10 ppb < 20 ppb < 10 ppb < 40 ppb
Porsgrunn 21 ppb 3150 ppb < 1 ppm 22 ppb 45 ppb 460 ppb < 40 ppb < 80 ppb
Økern 11 ppb < 500 ppb < 1 ppm 5 ppb <10 ppb < 20 ppb < 10 ppb < 40 ppb Table 1: Measurement results based upon our own calibration (the value in italic are doubtful)
Only carbon monoxide, carbon dioxide and methane have been detected above their estimated Limit of Detection (LOD) in the samples from Gaustad and Økern. Furthermore, the 5 ppb methane concentration found in Økern's sample is doubtful because this sample was too small, resulting in a cell pressure of only 650 mbar (absolute pressure) which had to be corrected for during the analysis.
Additionally; carbon dioxide, ethane and propane have been detected in the Porsgrunn's sample. Carbon monoxide is easy to estimate, methane is relatively easy although other hydrocarbon were interfering and the sensitivity of our MCT detector is lower at 3000 cm-1 than at 2000 cm-1. Figure 7 is showing the absorption by methane from the Porsgrunn's sample in the range 3060-3110 cm-1.
Ethane is absorbing through a broad absorption range (2800-3100 cm-1) and has many narrow lines superimposed the broad absorption (see Figure 5 where the ethane reference is matching nicely with the absorption in our sample). The broad feature means that other gases, absorbing in the same range, like

propane and heptane (also shown in the same figure) can be partially masked and difficult to estimate separately with non-optimal modeling. This uncertainty/doubtfulness is pertinent regarding the concentration of propane. It should be noted that a more thorough calibration and modeling will tackle this superposition.
The reliability of these results has been checked, for Carbon monoxide (CO) and methane (CH4), against synthetic spectra generated from the HITRAN-2008 database by making use of the SpectraCalc software (SC). Carbon monoxide, carbon dioxide, methane, propane and ethane have also been checked with spectra from the Infrared-Analysis database (IR-A). The results obtained when applying these spectra are listed in Table 2
CO CO2 Methane Ethane Propane
ppb ppb ppb ppb ppb
Database SC IR-A SC IR-A SC IR-A IR-A IR-A
Gaustad 13 18 < 500 < 500 <50 <10 <50 <40
Porsgrunn 23 32 3150 1400 20 17 510 <40
Økern 12 16 < 500 < 500 <50 <10 <50 <40 Table 2: Comparison with results estimated with calibration spectra obtained from HITRAN2008 (SC) and
Infrared-Analysis database (IR-A)
Inaccuracy related to the data-analysis and the non-optimal calibration task may also be significant when estimating hydrocarbons which are largely overlapping each other's in the 3000 cm-1 C-H stretching band. This last remark does not apply for methane which usually is easy to quantify using prediction based on PLS-modeling because of its fine line absorption spectrum (see Figure 7).
All the remarks about accuracy mean that an overall inaccuracy of up to ± 30% is undoubtedly realistic a decade above the LOD for some gas species. This inaccuracy will definitely be lowered to less than 10% by a thorough calibration making use of a precision manometer, temperature monitoring and professional gas dilution equipment.
Our calibration with 100 ppb CO, together with a 100 ppb CO spectrum from IR-A database and the synthetic spectrum for 100 ppb CO generated with the HITRAN2008 database are plotted in Figure 4. It is easy to see that our calibration spectrum is comparable with the HITRAN2008 simulation, while the spectrum from IR-A has significant lower amplitude. The comparison also appears for methane estimation in Figure 7.
Characteristics ISO/TS 14687-2 Type 1, Grade D
Hydrogen Fuel Index 99.99%
Total hydrocarbons (C1 basis) 2ppm
Water (H2O) 5 ppm
Carbon dioxide (CO2) 2 ppm
Carbon monoxide (CO) 200 ppb
Table 3: Fuel specification according to ISO/TS14687-2

Figure 4: Comparison of the present calibration for 100 ppb CO (256 scans) with 100 ppb CO spectrum from Infrared-Analysis's database and 100 ppb CO synthetic spectrum generated by the SpectraCalc
software from the HITRAN2008 database.
Figure 5: Hydrogen sample from the Porsgrunn's station and main hydrocarbon's absorbency associated with the fundamental C-H stretching vibration around 3000 cm-1

Figure 6: Selected spectral range and interfering gases for the estimation of CO. (23 ppb CO)
Figure 7: Selected estimation range for CH4. The 100ppb calibration spectrum (black) has been averaged through 1000 scans. The reference spectrum from the IR-A database and the synthetic generated
spectrum from the HITRAN database are also plotted.

6. Required system specifications The following specifications should be followed when designing a FTIR based system able to perform the Hydrogen Quality Control with the requested specifications (see Table 3)
FTIR instrument
• Resolution: 1 cm-1 • Spectral range: 600-4000 cm-1 (this is standard range for commercial FTIR) • Broadband detectors: Liquid nitrogen MCT (or Stirling Cycle Cryo-cooler) • Vacuum Optics: Preferably down to 2 mbar for very low concentrations of CO2 and H2O.
Vacuum optics is not required for carbon monoxide and hydrocarbons. A properly sealed arid zone flashed with high quality nitrogen will also be sufficient if the SAE limits of 5ppm H2O and 2 ppm CO2 are maintained.
Gas cell
A 10m long path cell will be sufficient for CO, CO2, CH4 and H2O. The cell should sustain high vacuum (<= 2 mbar) and preferably include a heating function in order to ensure efficient removing of gases. Even hydrocarbons could probably be measured with a 10 m long path cell with heating functionality and high efficiency vacuum equipment for purging.
Vacuum pump
A high efficiency vacuum pump and a high precision pressure gauge are required.
Software
The PLS-modeling software must be optimized for the Hydrogen Quality Control task and instrument dependent variables must be considered to ensure system robustness.
7. Conclusion We have demonstrated the quantitative estimation of carbon monoxide concentrations down to 5 ppb with an accuracy of ±4 ppb (conservative estimation). We have also shown that both the limit of detection and accuracy can be significantly enhanced by making use of simple improvements.
We were also able to quantify relatively low concentrations of carbon dioxide, methane and ethane. A thoroughly scrupulous calibration of hydrocarbons like propane, heptane, acetone and others will absolutely allow us to quantify these species with the accuracy required for Hydrogen Quality Control (QC).
Water may also be measured with the required accuracy if efficient vacuuming equipment is used and the optics parts of the system are nitrogen purged continuously or a vacuum FTIR is used.
A lot of work remains, especially concerning the calibration procedure and the PLS-modeling, before an optimal and robust quantification of the target gases for QC can be routinely quantified with a commercially available FTIR instrument. But this work is manageable and can lead to a commercially feasible cost for hydrogen quality assurance (QA).
Furthermore, if CO is selected as a canary constituent and the concentration of CO for the H2 fuel specification is maintained at 200 ppb (or even 100ppb), then the calibration and the PLS-modeling will be

tremendously simplified. The system requirements, and by this the instrumentation cost will also be lowered significantly.

This memo contains project information and preliminary results as a basis for final report(s).
SINTEF accepts no responsibility of this memo and no part of it may be copied.
1 of 3
SINTEF IKT SINTEF Group Head Office Address: Postboks 124 Blindern NO-0314 Oslo NORWAY
Telephone: +47 73593000 Telefax:+47 22067350
[email protected] www.sintef.no Enterprise /VAT No: NO 948 007 029 MVA
Memo Hydrogen Sampling equipment
PERSON RESPONSIBLE / AUTHOR Alain Marc C Ferber
FOR
YOU
R AT
TEN
TIO
N
COM
MEN
TS A
RE
INVI
TED
FOR
YOU
R IN
FORM
ATIO
N
AS A
GREE
D
DISTRIBUTION Alain Marc C Ferber
PROJECT NO / FILE CODE Project No. or File code
DATE 2013-01-23
CLASSIFICATION Restricted
1 Background At the beginning of the H2-moves project we realised that special equipment was necessary to collect hydrogen samples from Hydrogen station. We found that the best way to do this was to design and order a sampling system with the same receptical as the one used for the filling of the car's reservoir and able to withstand the working pressure of 700 bar. This sampling system should also be able to be flashed with nitrogen for security reasons and flashed with hydrogen from the station for cleanliness of the sample.
2 Design of the sampling system We have tried to order the system from Svafas i Stavanger and Dynetek in Denmark, but they were both unable to deliver the sampling system for 700 bar. The system required by Sintef is shown in Figure 1. We have then contacted GHR in Germany which was ready to cooperate with Dynetek Europe to build our sampling system. They had, however, to modify our layout and used a single side opening cylinder. GHR has built the system according to the design shown in Figure 2.

PROJECT NO / FILE NO Project No. or File code
2 of 3
Figure 1: High pressure sampling system (Sintef's design)
Figure 2: High pressure sampling system (GHR's update)

PROJECT NO / FILE NO Project No. or File code
3 of 3
3 Test of the sampling system. We have tried to test the sampling system at the Økern hydrogen station, but the responsible for the station was concerned about the aptitude of the system to withstand the pressure of 700 bar and was questioning about the system's ability to survive the filling procedure. The main concern was the lack of documentation about the system specification and certification. We have now recovered test information and certifications from the cylinder manufacturer and are waiting for additional documentation and certification from GHR. Another important concern was the heat-transfer issue. Hydrogen is undergoing a temperature increase during fast tank-filling processes. This because hydrogen exhibits a reverse Joule-Thomson effect at room temperature, i.e., throttling processes from a high pressure stationary tank to a tank being filled cause heating of the gas instead of cooling. A third concern was related to the pressure pulse used for measuring the initial vehicle tank pressure and the available volume in the tanks. This pulse is very short (< 1s) but is completed at 875 bar and may represent a mechanical chock for the system. During this time, the pressure at the nozzle should not be less than 6.7 bar and not exceed 670 bar. The recommended fuelling process is drafted in Figure 3
Figure 3: Fuelling process (with "pressure corridor" and start pulse) which satisfy the fuelling
protocol.
The system has therefore only been tested at lower pressure (60 bar) with manual control of the station output pressure and, during this test, we have found that hydrogen flashing was not optimal and should be enhanced by installing an additional high pressure regulator and a stop valve between the input valve and the main regulator.