d6.1.2 national report austria
TRANSCRIPT
Deliverable D6.1.2: Impact assessment of ITS applications in Austria
AUSTRIATECH
SEPTEMBER, 2014

Deliverable D6.1.2: Impact assessment of ITS applications in Austria 1
PROJECT INFORMATION
Title: Intelligent Transport Systems in South East Europe
Acronym: SEE-ITS
EoI Reference number: SEE/D/0099/3.2/X
Programme: South East Europe Transnational Cooperation
Starting date: September 28th, 2012
Duration: 24 months
Web site: www.seeits.eu
PROJECT PARTNERS
No Name Short name Country
LP Centre for Research and Technology Hellas - Hellenic Institute of Transport
CERTH-HIT Greece
ERDF PP1 Patras Municipal Enterprise for Planning and Development S.A.
ADEP S.A. Greece
ERDF PP2 AustriaTech - Federal Agency for Technological Measures Ltd
ATE Austria
ERDF PP3 Hungarian Transport Administration HTA Hungary
ERDF PP4 Bulgarian Association Intelligent Transport Systems
ITS Bulgaria Bulgaria
ERDF PP5 Intelligent Transport Systems Romania ITS Romania Romania
ERDF PP6 University of Ljubljana UL Slovenia
ERDF PP7 Institute for Transport and Logistics Foundation
ITL Italy
EU ASP1 Hellenic Intelligent Transport Systems ITS HELLAS Greece
EU ASP2 ITS Hungary Association ITS Hungary Hungary
20% ASP1 Italian ITS Association TTS Italia Italy
10% PP1 Albanian Association of Urban Transport SHKTQ Albania
10% PP2 Faculty of Transport and Traffic Sciences, University of Zagreb
FPZ Croatia

Deliverable D6.1.2: Impact assessment of ITS applications in Austria 2
DOCUMENT PROFILE
Document status: Final Deliverable code: D6.1.2 Deliverable title: Impact assessment of ITS applications in Austria Work Package: 6 Preparation date: 30/09/2014 Submission date: 31/03/2015 Total pages: 22 Dissemination level: Public Author: Austriatech
Contributors: Jonathan Rossetti

Deliverable D6.1.2: Impact assessment of ITS applications in Austria 3
CONTENTS
1. Introduction ___________________________________________________________ 5
Purpose and Scope of this Report ______________________________________ 5 1.1.
Methodology _______________________________________________________ 5 1.2.
Organization of this Report ___________________________________________ 6 1.3.
Project Background _________________________________________________ 6 1.4.
2. Pilot-Project Summary ___________________________________________________ 8
Thessaloniki Pilot-site: advanced travel information services __________________ 8 2.1.
Patras Pilot-site: travellers information __________________________________ 8 2.2.
Vienna Pilot-site: cooperative traffic management __________________________ 8 2.3.
Timisoara and Danube Area Pilot-site: ITS deployment for road networks ______ 8 2.4.
Hungary Pilot-site: intermodal travel planning services ______________________ 9 2.5.
Emilia Romagna Pilot-site: dangerous goods monitoring _____________________ 9 2.6.
Sofia Pilot-site: optimal use of traffic and travel data _______________________ 10 2.7.
Categories of ITS implemented within SEE-ITS demonstrations ______________ 10 2.8.
3. Statistical Datasets _____________________________________________________ 11
Introduction ______________________________________________________ 11 3.1.
Statistical Datasets _________________________________________________ 12 3.2.
Data sources ______________________________________________________ 15 3.3.
4. Expected Impacts ______________________________________________________ 16
Demo-Sites Impacts ________________________________________________ 16 4.1.
5. Impacts assessment ____________________________________________________ 18
Area Type Evaluation _______________________________________________ 18 5.1.
6. Transfer of Impacts Evaluation ____________________________________________ 19
Transferability of demo impacts to Austria ______________________________ 19 6.1.
7. Sources ______________________________________________________________ 22

Deliverable D6.1.2: Impact assessment of ITS applications in Austria 4
LIST OF TABLES
Table 1: Indicative example of final impacts ______________________________________ 10
Table 2: Statistical datasets – AustriaTech - Austria ________________________________ 13
Table 3: Statistical datasets ___________________________________________________ 14
Table 4: Impacts per Demo Site _______________________________________________ 17
Table 5 Final impacts _______________________________________________________ 18
Table 6: Local Impacts “Thessaloniki Demo-site” _________________________________ 19
Table 7: Transfer of Impacts to Austria _________________________________________ 19
Table 8: Local Impacts “Timisoara and Danube Area Demo-site” ____________________ 20
Table 9: Transfer of Impacts to Austria _________________________________________ 20
Table 10: Local Impacts of the Hungarian Demo-site ______________________________ 20
Table 11: Transfer of Impacts to Austria ________________________________________ 21
Table 12: Local Impacts “Emilia Romagna Demo-site” _____________________________ 21
Table 13: Local Impacts “Sofia Demo-site” ______________________________________ 21

Deliverable D6.1.2: Impact assessment of ITS applications in Austria 5
1. INTRODUCTION
Purpose and Scope of this Report 1.1.
In the present activity the impact assessment of the ITS applications, conducted in task 5.3,
will be transferred to other regions and scaled up at larger geographic areas. Thus, the
activity explores the main options for achieving the objectives of the ITS services and analyses
their likely impacts in the economic, environmental and social fields.
The scope of this task is to evaluate the performance of the ITS piloted services at network
level aiming at quantifying the benefits of the system when applied to larger areas. At the
same time, the benefits of each individual ITS service will be transferred to each Demo
activities. The network under study can be comprised of city streets and/or interurban roads,
depending on the characteristics of the service to be examined, while the wider area
extension can be local, regional or national.
The results of this activity will provide input to activity 6.2 in which the advantages and
disadvantages of each ITS system will be outlined and possible synergies and trade-offs will be
examined. The examination of synergies will follow an area type evaluation, namely for each
type of area level (local, regional, nationally) all possible interrelationships will be explored
and analysed, setting the basis for further more technical procedural integration. Besides the
importance of understanding the impacts of the ITS at network level, the results of this task
are going to provide also inputs to the Cost Benefit Analyses, to be elaborated under WP7.
Methodology 1.2.
The proposed methodology includes the scaling up of the impacts of the systems
demonstrated under WP5 from local to regional and national levels. The scaling up process
will follow the assessment methodology developed in the framework of the Compass4D
project1.
More specifically the proposed statistical extrapolation/scaling up methodology will allow the
scaling up of the results obtained by the demonstrations’ evaluation activities under 5.3. The
statistical methods, used in several previous related studies (Zwaneveld and Arem 1997,
Maccubbin et al. 2008, Chiara et al. 2009, Klunder et al. 2009), are based on the
measurements of real world impacts/benefits coupled with transport-related statistics for
weighting these benefits and obtaining scaled up ones to regional and national levels.
The methodology requires as the first step, desktop research of statistical data at city,
regional and national level related to the tested scenarios. These general data are the
multipliers that allow assessing impacts on different levels as to transfer impacts of Demo
activities in all the other countries.
1 www.compass4d.eu

Deliverable D6.1.2: Impact assessment of ITS applications in Austria 6
The second step is to collect through the activities of WP5 (5.3) major impacts/benefits, as
resulted through the application of the ITS services per Demo Site. Due to the fact that not
all the impacts are suitable for all the Demonstrators, an indication of the impacts to be
considered by each partner for the national pilot project is provided in the documents.
Impacts are expressed in terms of percentage of reduction or increase and are referred to
the measure unit with which are expressed the statistical data.
The matching of statistical data on various levels with impact “rates” at urban level provides
an assessment of the impacts on the Environment, Society and the Economy of the city,
region or country for each of the 8 countries.
Finally, an analysis of the impacts that are expected at national level in case of the application
of the Demo activities performed in the other considered countries is conducted. In order to
apply this activity, a validation of the expected impacts at country level of other Demo
activities is performed by each partner together with ITS experts. Using the same
“mechanism” previously described (matching between statistical data and impact rates) the
forecasted impacts in view of a future implementation of all the considered pilots project are
provided as conclusion of this document.
Organization of this Report 1.3.
Chapter 2 provides a brief description of the Demo activities performed in each participating
country and groups them for commonly analysing and assessing the suitable impacts of each.
Chapter 3 includes the guidelines the methodology for developing the desk research and
provides statistical data to be collected.
Chapter 4 identifies the considered impacts at Environmental, Social and Economic level and
defines a “rate” for each impact that is generally an expression of the percentage of
reduction/increase (or a range of percentages) of one specific aspect/impact.
Chapter 5 analyses the impact that would be transferred in the other participating countries
thanks to the application of the demonstrators implemented within SEE-ITS project activities
by the other partners.
Project Background 1.4.
In the first steps of the project (WP3) the existing ITS applications in South East Europe have
been investigated and collected. Best practices have been analysed and selected. The gap of
regional/national ITS architectures with the EU ITS framework, as set with the newly
published EU ITS Action Plan, have been documented and communicated to stakeholders of
the domain with the main emphasis on the added value of the integrated traffic management
that may have to the efficient road network and users transport demand management,
including exception situation handling.
Deliverable D6.1.2: Impact assessment of ITS applications in Austria 7
Following (WP4), the requirements for interoperable ITS along regional, national and urban
Networks of SEE for integrated traffic management and ITS deployment at all levels have
been prioritized. Regional and national studies for e-traffic taking into account existing and
foreseen systems were conducted. The output is an EU ITS Action Plan focused on needs for
transnational integration. Moreover, proposals for revising existing national ITS architectures
and guidelines for developing ITS architectures have been identified.
Within the WP5 ITS demonstrations have been implemented through feasibility studies and
the development of interoperable traffic management systems and intermodal traveller
information services along corridors and urban networks in several areas of the SEE region.
The impacts detected, measured and calculated by Demonstration Activities are analysed and
elaborated in the work package (6).
Deliverable D6.1.2: Impact assessment of ITS applications in Austria 8
2. PILOT-PROJECT SUMMARY
Thessaloniki Pilot-site: advanced travel information 2.1.services
The demonstration activities focus on advanced traveller information services based on
optimal use of real time traffic data. The outcome of the data fusion combined with the use of
Dynamic traffic assignment and simulation software for the estimation of traffic condition of
the road network in the near future ensure the provision of the real time information
regarding the traffic condition of the road network to the end users.
Patras Pilot-site: travellers information 2.2.
The demonstration activities focus on information provision to travellers, with optimal use of
road and traffic data, on main local and regional corridors and in conurbations, data security
and protection, and liability issues and European ITS cooperation and coordination. The
demonstration area covers urban and peri-urban corridors and the activities foresee data
security, protection & liability system design as well as the supply and installation of
equipment, the development of standardized interfaces to traffic management based on
DATEX and the development of driver information applications for the web.
Vienna Pilot-site: cooperative traffic management 2.3.
The demonstration activities focus on cooperative traffic management. The existing systems
(www.anachb.at) are merged with complete new mobility approaches in the area of
cooperative systems. The demonstration shows hand-held systems presenting traveller
information based on existing state-of-the-art TIS systems with having cooperative
information from the Test field Telematics embedded. This is a big step towards Cooperative
Traffic Management Solutions.
Timisoara and Danube Area Pilot-site: ITS 2.4.deployment for road networks
The Romanian Pilot is a multimodal traffic information solution/route planner that covers four
different modes of transport. The pilot system brings together relevant traffic information
from public transport, railway, road and inland waterway transport and provide multimodal
routing strategies.
The main objective of the pilot solution is to assist a traveller in selecting a multimodal trip.
The system uses data from all modes of transport, combines them in order to provide
accurate travel time and the best selection of modes of transport.

Deliverable D6.1.2: Impact assessment of ITS applications in Austria 9
The Romanian Pilot covers a trip on a selected corridor that starts in Timisoara, goes thru
Bucharest and ends in Constanta
Hungary Pilot-site: intermodal travel planning 2.5.services
The Public Transport Route Planner for Cyclists (hereinafter as the TUK, “Tömegközlekedési
Útvonaltervez Kerékpárosoknak”) program package was created on commission of the
Hungarian Transport Administration, within the framework of the project entitled
"Southeastern European Programme SEE/D/0099/3.2/X. SEE-ITS" on a research trial (pilot)
basis. It aims to demonstrate that it is possible to create such an intermodal route planning
application for use with today's generally available mobile phones of average capacities that
satisfies the following conditions:
Capability to take the timetables of more than one mode of public transportation into
account, including the transfer options among them so that in between two closely
situated stops potentially bicycles should be used.
Ability to perform route planning from its own database offline (without Internet
access).
The program is expected to make up its own data base from the GTFS format
national timetables of the railway services (MÁV), Budapest public transport services
(BKK) and the Danube ferries (altogether 297 MB), with the use of such effective
data storage where the combined size of the database should not exceed 10 MB.
The route search operation should not take longer than a few seconds even with the
use of the national database.
The TUK program package has been successfully completed; it meets the requirements, and
thus proves that the task is technically feasible. The program package consists of the following
components:
TUKMobile: Android mobile phone application (main program)
TUKAdmin: Operator desktop program to load the updated GTFS databases
Server-side devices: Server modules running on the updating webserver.
Emilia Romagna Pilot-site: dangerous goods 2.6.monitoring
The pilot project pursues in-depth knowledge and aimed to assess the conditions of risk
arising from emergencies due to accidents involving the transport of dangerous goods. The
primary goal of the feasibility study is to assess the development of a centre for real-time
monitoring of the transit of dangerous goods.
To this end it is useful to determine points and directions of the transport network more
related to the occurrence of events linked to the themes of the project. The goal is therefore

Deliverable D6.1.2: Impact assessment of ITS applications in Austria 10
to reduce the risk resulting from the movement of dangerous goods and the impact due to
this particular type of roads transit transport systems using ICT tools.
At its bare minimum, the pilot project will read the vehicle’s number plate carrying dangerous
goods and the Orange Slate with the UN number and Kemler classification.
Sofia Pilot-site: optimal use of traffic and travel 2.7.data
The demonstration activities focus on the optimal use of traffic and travel data, continuity of
traffic management ITS services on main local and regional corridors and in conurbations of
the area and on road safety aspects related to the deployment of ITS.
Categories of ITS implemented within SEE-ITS 2.8.demonstrations
Within WP5 of SEE-ITS, the following ITS systems have been developed and evaluated.
1. Advanced Travelers Information System (ATIS) for provision of real time travel time information
2. Advanced Travelers Information System (ATIS) for provision of multiple information to drivers deriving from Cooperative ITS
3. Multimodal route planner (urban Public Transport, suburban railways, inland waterway, private transport routing) along a specific “corridor”
4. Multimodal route planner for cyclists (private transport routing, urban public transport) in the urban area of Budapest
5. Road Safety systems for road transport
Table 1: Indicative example of final impacts
Location of the pilot-project
ITS
category Thess. Patras Vienna Romania Budapest Sofia
Emilia
Romagna
Cat. 1 X X Cat. 2 X Cat. 3 X Cat. 4 X Cat. 5 X X
Deliverable D6.1.2: Impact assessment of ITS applications in Austria 11
3. STATISTICAL DATASETS
Introduction 3.1.
The chapter aims to collect statistical data available at city/local, regional and national level.
Data collected within this section are useful as multipliers used for the scaling up of the
environmental, social and economic impacts at the different territorial levels above
mentioned. If not already available to the partners, the data has to be provided through a
Desk Research on the studies, databases and project existent at country level.
The tentative list of statistical data to be collected is the following:
Transport demand in the area
Total Vehicle-kilometres travelled per day
Total Vehicles-hours travelled per day
Modal split
Number of vehicles per type
Total fuel consumption in the same specific conditions as in the pilot
Total emissions in the same specific conditions as in the pilot
Population
Population density
Number of cars owned per household
Average number of daily trips per household
Spatial coverage of the public transport network
In table 3, the type of road (or context in with it is applied the impact) and the Measure Unit
in which the data has to be provided for each statistical data are specified.

Deliverable D6.1.2: Impact assessment of ITS applications in Austria 12
Statistical Datasets 3.2.
The table below provides the abovementioned statistical data for the following territorial
levels:
Cities
o Thessaloniki
o Sofia
o Vienna
o Bologna
o Zagreb
o Ljubljana
o Bucharest & Timisoara
o Patras
o Budapest
Regions
o Region of Central Macedonia
o Sofia Region
o Vienna Region
o Emilia-Romagna Region
o Zagreb Region
o Ljubljana Region
o Bucharest & Timisoara
o Patras Region
o Budapest Region
And the correspondent European countries to which the cities and the Regions belong, as
reported in Table 3.

Deliverable D6.1.2: Impact assessment of ITS applications in Austria 13
Table 2: Statistical datasets – AustriaTech - Austria
Statistical datasets Measure Unit Specific Field City level Regional level National level
Transport demand in the area N° of daily trips passengers 1.721.800 1.873.400 5.310.000
N° of daily trips vehicles 1.596.900 1.946.100 17.515.000
Total Vehicle-kilometres travelled per day Km/day urban road networks N/A N/A 27.994.535
Km/day interurban/highway net. N/A2 N/A 190.898.907
Total Vehicles-hours travelled per day Hours/day urban road networks N/A N/A N/A
Hours/day interurban/highway net. N/A N/A 748.634
Modal split % passenger using private vehicles
road 28% 41% 50%
Number of vehicles per type N° of vehicles cars 679.492 930.912 4.641.308
N° of vehicles trucks 62.075 85.043 408.560
N° of vehicles buses 3.646 4.095 9.579
N° of vehicles motorcycles 83.325 114.155 743.648
N° of vehicles bicycles 989.285 1.356.213 6.378.495
N° of vehicles total 1.817.823 2.490.418 12.181.590
Total fuel consumption in the same specific conditions as in the pilot
L/day urban road networks N/A N/A N/A
L/day interurban/highway net. N/A N/A N/A
L/day cars N/A N/A 19.320.492
L/day trucks N/A N/A 3.604.372
L/day buses N/A N/A 530.055
L/day motorcycles N/A N/A 3.180.328
L/day total N/A N/A 26.502.732
2 As per law there are no highways on the area of Austrian cities

Deliverable D6.1.2: Impact assessment of ITS applications in Austria 14
Table 3: Statistical datasets
Statistical datasets Measurement
Unit Specific Field City level Regional level National level
Total emissions in the same specific conditions as in the pilot
CO2/day urban road networks N/A N/A N/A
CO2/day interurban/highway net. N/A N/A 19.019
CO2/day3 cars N/A N/A 49.000
CO2/day trucks N/A N/A 9.196
CO2/day buses N/A N/A 1.342
CO2/day motorcycles N/A N/A 7.853
CO2/day total N/A N/A 67.123
Population N° of inhabitants 1.741.246 2.402.920 8.477.230
Number of cars owned per household N° of cars household 0,78 1,08 1,25
Number of inhabitants per household N° of inhabitants household 1,99 2,27 2,26
Response time in case of emergency minutes Average value 11 14 15
Average number of daily trips per household N° daily trips household 3,81 3,8 3,73
Spatial coverage of the public transport network
Km / 1000 citizens vehicles N/A N/A N/A
Km / 1000 citizens passengers 1,084 N/A N/A
3 All these are tons/day
4 Vienna has a total of 1,077.5 kilometers of public transport network
Deliverable D6.1.2: Impact assessment of ITS applications in Austria 15
Data sources 3.3.
As a major and comprehensive provider of statistical data, STATISTICS AUSTRIA has been
the most important source for reliable information on City, Regional and National level. The
largest part of the required statistical data could be extracted from their data bases,
comprising:
Transport demand in the area
Total Vehicle-kilometres travelled per day
Total Vehicle-hours travelled per day
Number of vehicles per type
Total fuel consumption in the same specific conditions as in the pilot
Total emissions in the same specific conditions as in the pilot
Population
Numbers of cars owned per household
Numbers of inhabitants per household
Average number of daily trips per household
Being at the centre of Austrian transport the Federal Ministry of Transport, Innovation and
Technology (BMVIT) was of course another important source providing relevant information,
comprising:
Modal split
With vast knowledge and experience in emergency and rescue services the Austrian Red
Cross provided important information on:
Response time in case of emergency
Last but not least, Viennese public transport operator Wiener Linien, being an internationally
renowned key stakeholder and promoter of best practices, offered the following data:
Spatial coverage of the public transport network
Deliverable D6.1.2: Impact assessment of ITS applications in Austria 16
4. EXPECTED IMPACTS
Demo-Sites Impacts 4.1.
Through the activities of WP5, specifically the output 5.3, major impacts/benefits of the ITS
applications have been identified. In the table (5) below the main impacts considered in WP5
activities are shown. Due to the fact that the demonstration activities each focus on different
ITS services, the impacts are not always suitable for each demonstrator.

Deliverable D6.1.2: Impact assessment of ITS applications in Austria 17
Table 4: Impacts per Demo Site
LOCAL IMPACTS System Specific Fields/ Context
STATISTICS DATA (LOC/REG/NAT level)
needed for calculating LOC/REG/NAT
impacts
Impact Value
(%)
Reduction of Vehicle-kilometres Romania Urban and interurban Network Total Vehicle-kilometres travelled per day 15% Reduction of Vehicle-hours Romania Interurban networks Total Vehicle-hours travelled per day 25-30% Reduction of travel times Romania Interurban networks Average Travel Time 12% Reduction of Vehicle-kilometres Hungary Urban and interurban Network Total Vehicle-kilometres travelled per day 11% Reduction of Vehicle-hours Hungary Interurban networks Total Vehicle-hours travelled per day 17-22% Reduction of travel times Hungary Interurban networks Average Travel Time 9% Reduction of Vehicle-kilometres Greece Urban and interurban Network Total Vehicle-kilometres travelled per day 7% Reduction of Vehicle-hours Greece Interurban networks Total Vehicle-hours travelled per day 20-25% Reduction of travel times Greece Interurban networks Average Travel Time 10% Reduction of Vehicle-kilometres Italy Urban and interurban Network Total Vehicle-kilometres travelled per day 8% Reduction Vehicle-hours Italy Interurban networks Total Vehicle-hours travelled per day 12-17% Reduction of travel times Italy Interurban networks Average Travel Time 7% CO2 Emission reduction Romania Interurban networks Total fuel consumption 10% CO2 Emission reduction Hungary Interurban networks Total fuel consumption 6% CO2 Emission reduction Greece Interurban networks Total fuel consumption (city level) 7% CO2 Emission reduction Italy Interurban networks Total fuel consumption (city level) 5%
Reduction of number of accidents Romania Traffic Flow of DG vehicles on Ring Road – Urban Motorway/Highway
Number of accidents involving DG vehicles on the considered road
8 %
Reduction of number of accidents Hungary Traffic Flow of DG vehicles on Ring Road – Urban Motorway/Highway
Number of accidents involving DG vehicles on the considered road
3 %
Reduction of number of accidents Greece Traffic Flow of DG vehicles on Ring Road – Urban Motorway/Highway
Number of accidents involving DG vehicles on the considered road
2 %
Reduction of number of accidents Italy Traffic Flow of DG vehicles on Ring Road – Urban Motorway/Highway
Number of accidents involving DG vehicles on the considered road
4 %
Deliverable D6.1.2: Impact assessment of ITS applications in Austria 18
5. IMPACTS ASSESSMENT
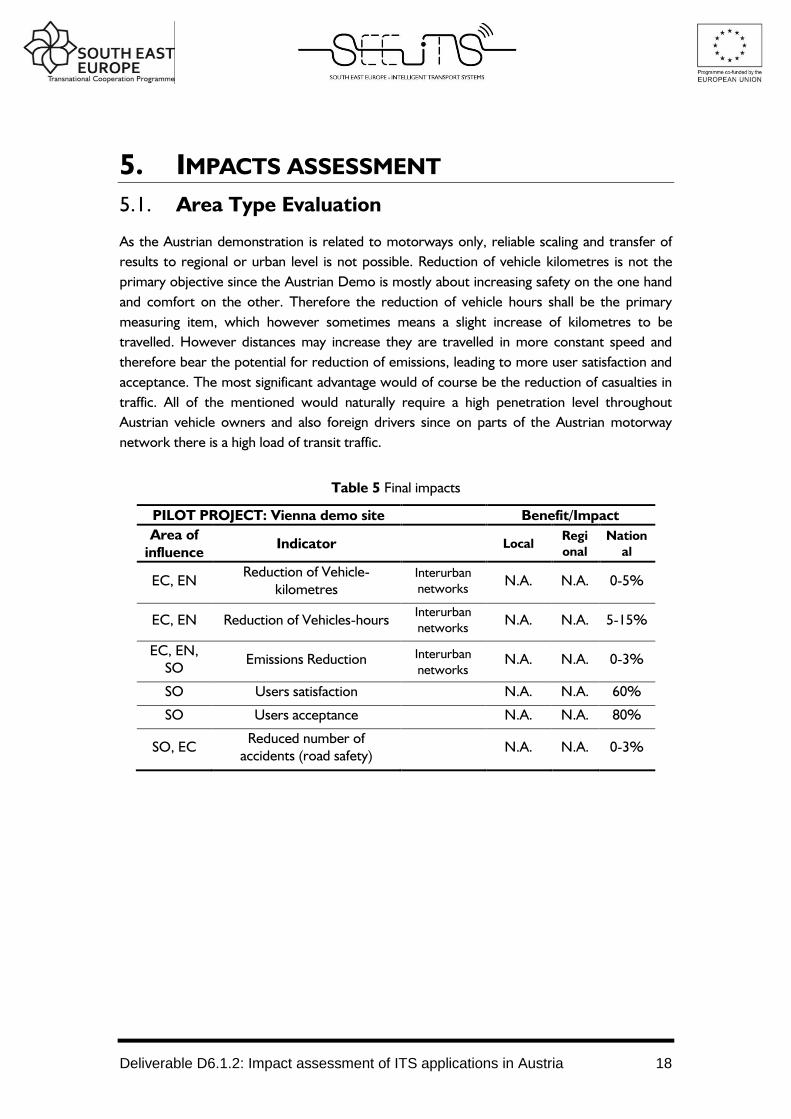
Area Type Evaluation 5.1.
As the Austrian demonstration is related to motorways only, reliable scaling and transfer of
results to regional or urban level is not possible. Reduction of vehicle kilometres is not the
primary objective since the Austrian Demo is mostly about increasing safety on the one hand
and comfort on the other. Therefore the reduction of vehicle hours shall be the primary
measuring item, which however sometimes means a slight increase of kilometres to be
travelled. However distances may increase they are travelled in more constant speed and
therefore bear the potential for reduction of emissions, leading to more user satisfaction and
acceptance. The most significant advantage would of course be the reduction of casualties in
traffic. All of the mentioned would naturally require a high penetration level throughout
Austrian vehicle owners and also foreign drivers since on parts of the Austrian motorway
network there is a high load of transit traffic.
Table 5 Final impacts
PILOT PROJECT: Vienna demo site Benefit/Impact
Area of
influence Indicator
Local
Regi
onal
Nation
al
EC, EN Reduction of Vehicle-
kilometres Interurban networks
N.A. N.A. 0-5%
EC, EN Reduction of Vehicles-hours Interurban networks
N.A. N.A. 5-15%
EC, EN, SO
Emissions Reduction Interurban networks
N.A. N.A. 0-3%
SO Users satisfaction N.A. N.A. 60%
SO Users acceptance N.A. N.A. 80%
SO, EC Reduced number of
accidents (road safety) N.A. N.A. 0-3%
Deliverable D6.1.2: Impact assessment of ITS applications in Austria 19
6. TRANSFER OF IMPACTS EVALUATION
Transferability of demo impacts to Austria 6.1.
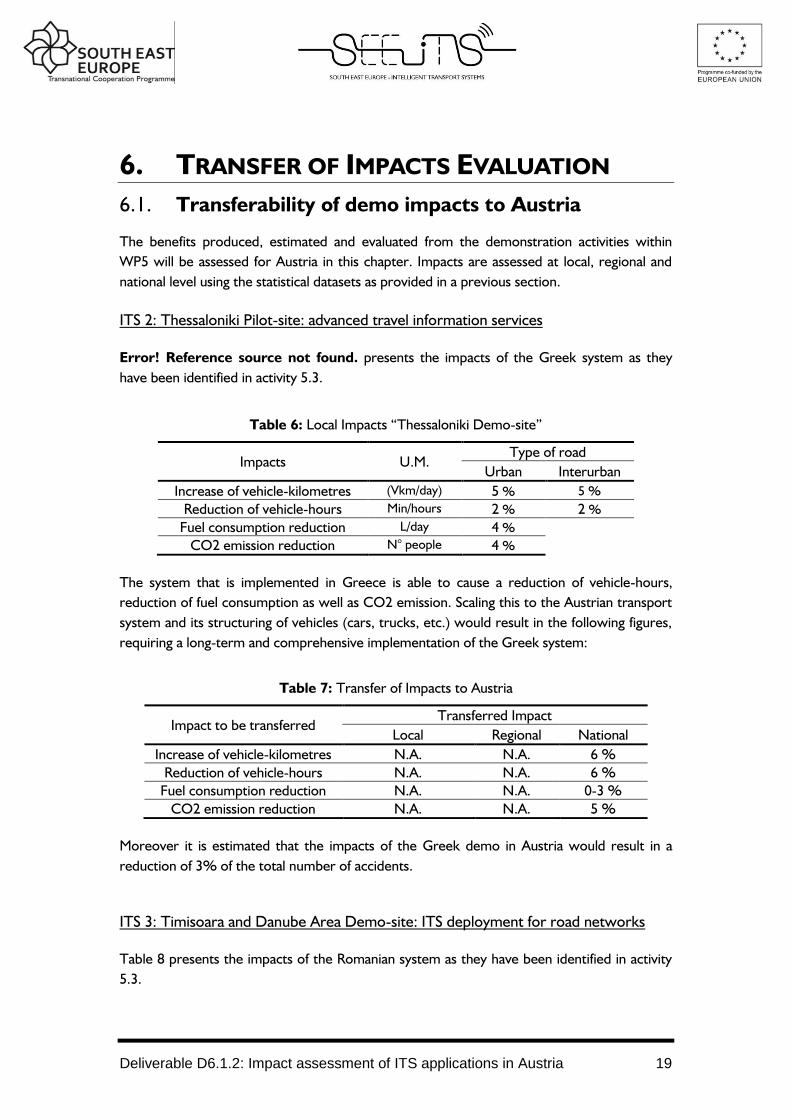
The benefits produced, estimated and evaluated from the demonstration activities within
WP5 will be assessed for Austria in this chapter. Impacts are assessed at local, regional and
national level using the statistical datasets as provided in a previous section.
ITS 2: Thessaloniki Pilot-site: advanced travel information services
Error! Reference source not found. presents the impacts of the Greek system as they
have been identified in activity 5.3.
Table 6: Local Impacts “Thessaloniki Demo-site”
Impacts U.M. Type of road
Urban Interurban
Increase of vehicle-kilometres (Vkm/day) 5 % 5 %
Reduction of vehicle-hours Min/hours 2 % 2 %
Fuel consumption reduction L/day 4 %
CO2 emission reduction N° people 4 %
The system that is implemented in Greece is able to cause a reduction of vehicle-hours,
reduction of fuel consumption as well as CO2 emission. Scaling this to the Austrian transport
system and its structuring of vehicles (cars, trucks, etc.) would result in the following figures,
requiring a long-term and comprehensive implementation of the Greek system:
Table 7: Transfer of Impacts to Austria
Impact to be transferred Transferred Impact
Local Regional National
Increase of vehicle-kilometres N.A. N.A. 6 % Reduction of vehicle-hours N.A. N.A. 6 %
Fuel consumption reduction N.A. N.A. 0-3 % CO2 emission reduction N.A. N.A. 5 %
Moreover it is estimated that the impacts of the Greek demo in Austria would result in a
reduction of 3% of the total number of accidents.
ITS 3: Timisoara and Danube Area Demo-site: ITS deployment for road networks
Table 8 presents the impacts of the Romanian system as they have been identified in activity
5.3.

Deliverable D6.1.2: Impact assessment of ITS applications in Austria 20
Table 8: Local Impacts “Timisoara and Danube Area Demo-site”
Impacts U.M. Type of road
Urban Interurban
Reduction Vehicle-kilometres travelled (Vkm/day) 10 % 1 %
Reduction of travel times Min/hours 5-9 % 11 %
Fuel consumption reduction L/day 10 % 5 %
Increased number of better informed travellers N° people 60 %
Modal shift - reduction road transport 20 %
User Satisfaction N° of people 80 %
User Acceptance N° of people 90 %
The impact assessment of the effects of the impacts of the Romanian demonstration to
Austria is performed assuming a comprehensive penetration level in terms of better informed
travellers.
Table 9: Transfer of Impacts to Austria
Impact to be transferred Transferred Impact
Local Regional National
Reduction Vehicle-kilometres N.A. N.A. 8 %
Reduction of travel times N.A. N.A. 0-5 %
Fuel consumption reduction N.A. N.A. 3-7 %
Increased number of better informed travellers N.A. N.A. 15-25 %
ITS 4: Hungary Demo-site: intermodal travel planning services Table 10 presents the impacts of the Hungarian system as they have been identified in activity
5.3.
Table 10: Local Impacts of the Hungarian Demo-site
Impacts U.M. Type of road
Urban Interurban
Reduction Vehicle-kilometres travelled (Vkm/day) 0,1 % 0,2 %
Increased number of better informed travellers N° people 1-8 %5
Modal shift - reduction of use of private vehicles Ton/km Pass/km
- 1 %
5 Depends on weather’s circumstances, because the target users are the tourists and recreational
cyclist
Deliverable D6.1.2: Impact assessment of ITS applications in Austria 21
The impact assessment of the effects of the impacts of the Hungarian demonstration to
Austria is performed assuming a comprehensive penetration level in terms of better informed
travellers.
Table 11: Transfer of Impacts to Austria
Impact to be transferred Transferred Impact
Local Regional National
Reduction Vehicle-kilometres N.A. N.A. 0-4 %
Increased number of better informed travellers N.A. N.A. 35-45 % Modal shift - reduction of use of private vehicles N.A. N.A. 2-7 %
ITS 5: Emilia Romagna Demo-site: dangerous goods monitoring
Table 12 presents the impacts of the Italian system as they have been identified in activity 5.3.
Table 12: Local Impacts “Emilia Romagna Demo-site”
Impacts U.M.
Type of road
Urban
Recognition Rate N° vehicles 80 %
Reduction of number of accidents N° acc 10 %
For Austria, no current numbers regarding the amount of dangerous goods transports are
available. Therefore the numbers used in this report are based on figures provided by the
Austrian Court of Auditors in 2006. In 2013 of 38,502 total traffic accidents there were only
20 with dangerous goods transports involved, amounting to a percentage of only 0,05 %. The
potential of the Italian system to decrease this number even further is therefore estimated to
be negligible.
ITS 6: Sofia Demo-site: optimal use of traffic and travel data
The Bulgarian system is able to reduce CO2 emissions at a motorway level in the range of 2.5
%-15 %. Therefore transferring this impact to Austria, and using the most conservative
scenario of 2.5 % reduction, the quantities that can be saved in Austria are provided on the
table below:
Table 13: Local Impacts “Sofia Demo-site”
Impact to be transferred Transferred Impact
Local Regional National
CO2 emissions reduction N.A. N.A. 5-10 %

Deliverable D6.1.2: Impact assessment of ITS applications in Austria 22
7. SOURCES
References
1. Chiara B.D., Deflorio F., Diwan S. (2009) Assessing the effects of intervehicle
communication systems on road safety, IET Intell. Transp. Syst., 3, (2), pp. 225–235.
2. Daganzo C. (2010) Lecture notes, University of Berkeley
3. Farrell M. J. The Measurement of Productive Efficiency (1957) Journal of the Royal
Statistical Society. Series A (General), Vol. 120, No. 3, pp. 253-290.
4. Holroyd E. M. (1965) The optimum bus service: a theoretical model for a large
uniform urban area. In L. C. Edie, R. Herman, and R. Rothery (Eds.), Vehicular Traffic
Science. Proc of the 3rd International Symposium on the Theory of Traffic Flow.
New York: Elsevier.
5. Klunder G.A., Malone K., Mak J., Wilmink I. R., Schirokoff A., Sihvola N., Holmén C.,
Berger A., de Lange R., Roeterdink W., Kosmatopoulos E. (2009) Impact of
information and communication technologies on energy efficiency in road transport
final report. Delft, The Netherlands.
6. Maccubbin R. P., Staples B. L., Kabir F., Lowrance C. F., Mercer M. R., Philips B. H.,
Gordon S. R. (2008) Intelligent Transportation Systems Benefits, Costs, Deployment,
and Lessons Learned: 2008 Update, U. S. Department of Transportation, Research
and Innovative Technology Administration.
7. Psaraki V., Pagoni I. and Schafer A. (2012) Techno-economic assessment of the
potential of intelligent transport systems to reduce CO2 emissions, IET Intelligent
Transport Systems.
8. Smeed R. J. (1975) Traffic studies and urban congestion. Journal of Transport
Economics and policy 2 No. 1 pp. 33 - 71.
9. Vayghan Rodney (1987) Urban Spatial Traffic Patterns.
10. Zwaneveld P. J., Van Arem B. (1997) Traffic effects of automated vehicle guidance
systems: a literature survey. PhD Thesis, TNO Inro, Delft, The Netherlands.