d5-07 apt 48m
TRANSCRIPT

TIP4-CT-2005-516420 Page 1 of 52
QCITY December 29, 2008
D5-07_APT_48M.doc
DELIVERABLE 5.7
CONTRACT N° TIP4-CT-2005-516420
PROJECT N° FP6-516420
ACRONYM QCITY
TITLE Quiet City Transport
Subproject 5 5
Work Package 5.7 Ostend - Freight operations in urban maritime environment
Performance report of applied measures
Written by Tom Vanhonacker APT
Jan Allaert
Dirk Rotthier
HOOS
FDP
Date of issue of this report December 29, 2008
PROJECT CO-ORDINATOR Acoustic Control ACL SEPARTNERS Accon ACC DE
Akron AKR BEAlfa Products & Technologies APT BEBanverket BAN SEComposite Damping Material CDM BEHavenbedrijf Oostende HOOS BEFrateur de Pourcq FDP BEGoodyear GOOD LUHead Acoustics HAC DEHeijmans Infra HEIJ BERoyal Institute of Technology KTH SEVlaamse Vervoersmaatschappij DE LIJN LIJN BELucchini Sidermeccanica LUC ITNCC Roads NCC SEStockholm Environmental & Health Administration SEA SESociété des Transports Intercommunaux de Bruxelles STIB BENetherlands Organisation for Applied Scientific Research TNO NLTrafikkontoret Göteborg TRAF SETram SA TRAM GRTT&E Consultants TTE GRUniversity of Cambridge UCAM UKUniversity of Thessaly UTH GRVoestalpine Schienen VAS ATZbloc Norden ZBN SEUnion of European Railway Industries UNIFE BE
PROJECT START DATE February 1, 2005
DURATION 48 monthsProject funded by the European Community under theSIXTH FRAMEWORK PROGRAMMEPRIORITY 6Sustainable development, global change & ecosystems

TIP4-CT-2005-516420 Page 2 of 52
QCITY December 29, 2008
D5-07_APT_48M.doc
T A B L E O F C O N T E N T S
0 Executive Summary...........................................................................................................3
0.1 Objective of the deliverable .....................................................................................3
0.2 Strategy used and/or a description of the methods (techniques) used with the
justification thereof ...............................................................................................................3
0.3 Background info available and the innovative elements which were
developed.............................................................................................................................4
0.4 Problems encountered ..............................................................................................4
0.5 Partners involved and their contribution ..................................................................4
0.6 Conclusions.................................................................................................................5
1 Problem identification and Design of a track based solution .......................................6
1.1 Problem idenfication and first conceptual solution design ....................................6
1.2 Problems with the first design ....................................................................................7
1.3 Final design .................................................................................................................8
1.3.1 Overview..............................................................................................................8
1.3.2 Stress calculation in the L-profiles.....................................................................10
2 Implementation of the solution on site ..........................................................................25
2.1 Preparations in the workshop ..................................................................................25
2.2 Measurement and numbering of existing track ....................................................26
2.3 Modification of existing track ..................................................................................27
2.4 Design and installation of additional counter weights on the bridge .................32
2.4.1 Introduction .......................................................................................................32
2.4.2 Determination extra moment...........................................................................33
2.4.3 Determination extra counter weight ...............................................................34
2.4.4 Conclusion .........................................................................................................34
2.4.5 Installation of the counter weight ....................................................................35
3 Measurements after installation .....................................................................................37
3.1 Introduction...............................................................................................................37
3.2 Measurement set up for pass-by levels ..................................................................39
3.3 Measurement results ................................................................................................45
3.4 Comparison of results before and after modification...........................................46
3.4.1 Accelerations.....................................................................................................46
3.4.2 Noise...................................................................................................................48
3.5 Conclusion ................................................................................................................52

TIP4-CT-2005-516420 Page 3 of 52
QCITY December 29, 2008
D5-07_APT_48M.doc
0 E X E C U T I V E S U M M A R Y
0.1 OBJECTIVE OF THE DELIVERABLE
The objective of WP5.7 is to develop a general purpose track based solution for low
noise reduction of steel railway bridges. This problem is very common: the low
frequency bridge noise is radiating over long distances and it is difficult to mitigate this
noise in the transmission path and at the receiver. Therefore, a noise reduction at the
source is targeted by a specific vibration isolation of the track system which reduces the
relevant dynamic input forces into the bridge. Ease of installation of the solution and
possibility of refurbishment of existing bridges with the solution are important elements in
the development of the solution since a wide use of the developed solution is targeted.
This developed solution type is validated by evaluating the structural noise reduction by
track modification of an existing new steel bridge to be used by the Belgian railways in
the port of Ostend (Plassendale bridge). This type of bridge with wooden sleepers
directly connected to and supported by structural steel beams has been chosen
because it is representative for thousand’s of steel bridges use by European Railway
operators and infra managers.
0.2 STRATEGY USED AND/OR A DESCRIPTION OF THE METHODS (TECHNIQUES) USED WITH THE
JUSTIFICATION THEREOF
Problem identification
Problem identification;
Modal analysis measurements of the bridge;
Noise and vibration measurements and analysis during train passage;
Definition of the problem to be solved;
Conceptual & detailed design of a track based solution
Conceptual design of an appropriate track system;
Calculation of the effect on noise emission;
Detailed design of track system, including FE analysis
Contacts with Belgian railways for type approval.
Implementation
Prefabrication of new track elements;
Installation of new track system on site.
Validation measurements
Noise and vibration measurements during train passage;
Conclusions.

TIP4-CT-2005-516420 Page 4 of 52
QCITY December 29, 2008
D5-07_APT_48M.doc
0.3 BACKGROUND INFO AVAILABLE AND THE INNOVATIVE ELEMENTS WHICH WERE DEVELOPED
A broad general knowledge was available within the project: results of the EC 6th FP
project ‘Sustainable Bridges’ and results from earlier attempts to reduce the low
frequency noise emission from steel bridges : use of rail dampers (SNCF) and use of
added damping layers to the steel members of the bridge.
Although track vibration isolation in itself is not innovative, its application to existing
railway bridges has been challenging: a low dynamic track stiffness had to be
combined with reduced rail deflections and track stability had to be ensured. This has
been done by inserting very resilient pads between sleepers and steel members which
have been highly preloaded with spring assemblies. Lateral track stability has been
ensured by specially designed L shaped add-on beams.
0.4 PROBLEMS ENCOUNTERED
No major problems were encountered. The long time needed by the Belgian Railways
to approve the design and the calculation notes (long administrative procedure) has
been disappointing. A challenge has been the unforeseen required tuning of the
bridge counterweights (specific problem for a turning bridge). A stringent inspection
from the Belgian Railways after installing the solution (including corrosion control) has
been passed with minor remarks and corrections.
0.5 PARTNERS INVOLVED AND THEIR CONTRIBUTION
The following partners were/are involved:
Port of Ostend (HOOS): for initial meetings with Belgian railways, organisation of
tests on site before installation of the track based solution, assistance on site with
the organisation of measurements (before and after), implementation of the
prototype on site, acquisition of the required track elements for installation on the
bridge, installation of the additional bridge counter weight to compensate for the
modifications caused by the track solution, assistance and contacts with Belgian
railways and Flemish Community for type and safety approval.
Akron (AKR): for assistance during initial measurements.
Alfa Products & Technologies (APT): for measurements and modal analysis of the
bridge behaviour, noise and vibration measurements, finite element modelling of
bridge structure, dynamic structural response calculations, and noise calculations,
conceptual and detailed design of the appropriate track system, stress
calculations in the L profiles, calculations of additional counter weight for the
bridge, follow up of the on site installation.
Frateur de Pourcq (FDP): for the practical implementation of the solution on site.
This included all on site and preparatory works such as dismounting of the existing
fixation, lifting of the existing track and inserting elastomers between the
longitudinal girders, installing and welding L profiles to guarantee horizontal track
stability, pre-stressing the elastomers with the spring system, adaptation of the track
protection systems according to the safety requirements, painting the L profiles and
protection systems according to the standards.

TIP4-CT-2005-516420 Page 5 of 52
QCITY December 29, 2008
D5-07_APT_48M.doc
0.6 CONCLUSIONS
The noise and vibration measurements during train passage on the steel bridge have
shown a very good performance of the modified (isolated) track structure: the low
frequency noise and vibrations are reduced by in average 10 dB from 63 Hz to 200 Hz.
This performance is very interesting and it opens wide application possibilities since
mitigation measures at the receiver or in the propagation path are not effective at
these low frequencies. The developed solution is relatively easy to install. Its
performance is far better than the use of rail dampers or the use of damping layers on
the steel structure. Dissemination of the findings will start immediately by publishing
articles and presenting results at specialized conferences.

TIP4-CT-2005-516420 Page 6 of 52
QCITY December 29, 2008
D5-07_APT_48M.doc
1 P R O B L E M I D E N T I F I C A T I O N A N D D E S I G N O F AT R A C K B A S E D S O L U T I O N
1.1 PROBLEM IDENFICATION AND FIRST CONCEPTUAL SOLUTION DESIGN
For the problem identification reference is made to technical report TR5-
7A_APT_24M.pdf describing the detailed noise and vibration measurements and modal
analysis of the steel railway bridge in Plassendale, Ostend.
Based on the conclusions of this technical report, the design target for the modified
track is to have a low frequency track isolation in order to obtain first wheel/rail
resonance frequency below 35 Hz. In this way structure borne noise emission can be
reduced above 50 Hz.
In the existing track system, the wooden sleepers are firmly fixed to the steel girders of
the bridge. All vibrations generated at the wheel/rail interface are transmitted to the
steel bridge structure.
In the newly proposed design elastomer pads are inserted between the longitudinal
girders and the wooden sleepers of the bridge.
To guarantee the lateral stability of the track, longitudinal profiles are added on both
sides of the sleepers to restrain the sleepers transversally. These profiles are welded onto
existing longitudinal bridge beams.
In order to limit the vertical displacement and keep the high vertical resiliency, the
elastomer pads are vertically pre-stressed with spring systems.

TIP4-CT-2005-516420 Page 7 of 52
QCITY December 29, 2008
D5-07_APT_48M.doc
Figure 1.1
First design of a track based solution; springs are pre-stressing an elastomer underneath the sleeper. A L-
profile guarantees the transversal stability (view 1)
Figure 1.2
First design of a track based solution; springs are pre-stressing an elastomer underneath the sleeper. A L-
profile guarantees the transversal stability (view 2)
1.2 PROBLEMS WITH THE FIRST DESIGN
This first design of the track based solution has one major disadvantage: the practical
difficulty of welding the small anchor profiles on the existing profile.

TIP4-CT-2005-516420 Page 8 of 52
QCITY December 29, 2008
D5-07_APT_48M.doc
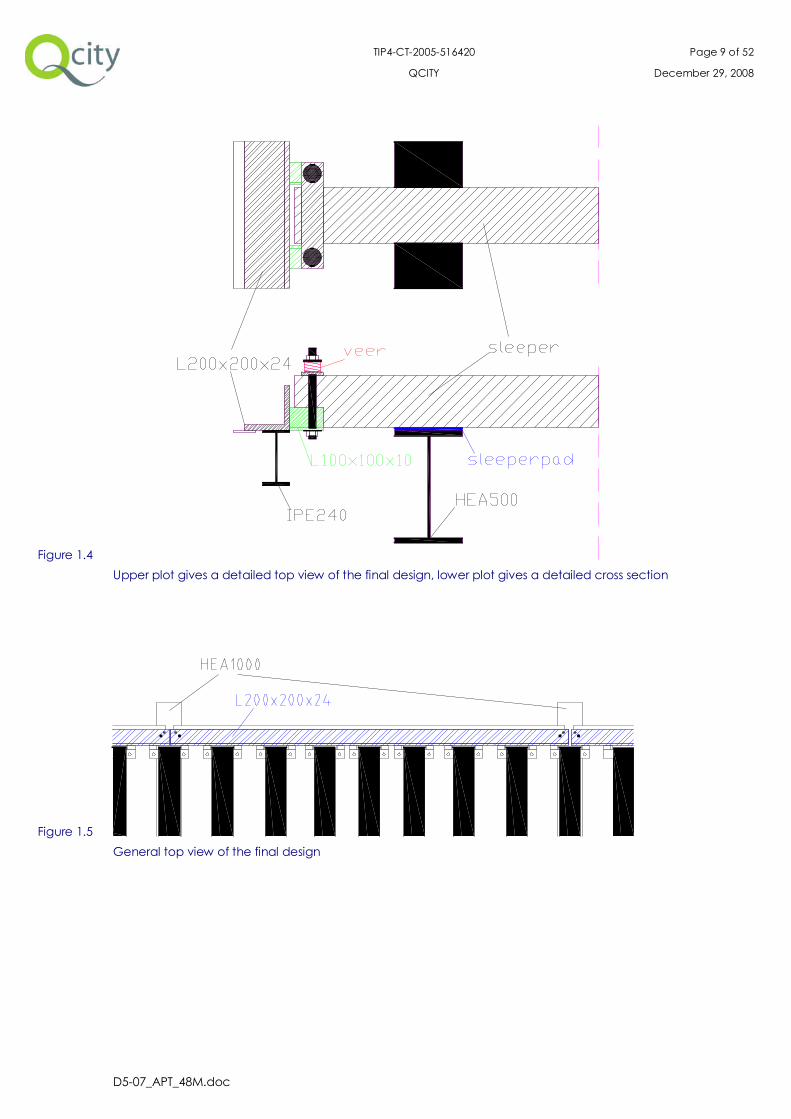
1.3 FINAL DESIGN
1.3.1 Overview
The final design is similar to the first design but it now includes for lateral stability larger
longitudinal L200 beams which are fixed onto transversal HEA1000 bridge beams. The
required stiffness of the undersleeper pads has been calculated: dynamic stiffness of
maximum 25 kN/mm each in order to reach the required vibration isolation target.
Figure 1.3
Detailed view of the final design
TIP4-CT-2005-516420 Page 9 of 52
QCITY December 29, 2008
D5-07_APT_48M.doc
Figure 1.4
Upper plot gives a detailed top view of the final design, lower plot gives a detailed cross section
Figure 1.5
General top view of the final design

TIP4-CT-2005-516420 Page 10 of 52
QCITY December 29, 2008
D5-07_APT_48M.doc
1.3.2 Stress calculation in the L-profiles
Reference is made to technical report TR5-7B_APT_24M.
1.3.2.1 Introduction
The goal of this simulation is to analyse the static behaviour of the railway bridge
Plassendale in Oostende. A new design limiting lateral deflections of the supported
track system is investigated. It consists mainly out of L-shaped beams welded and
bolted to the big HEA1000 beams.
The purpose of this analysis is to determine the stresses introduced in those L-beams by
a 10 ton lateral load acting on the rail.
A finite element model of the bridge has been created consisting of shell and solid
elements.
§1.3.2.2 describes the model set-up and the assumptions made.
§1.3.3.3 presents the results.
All the models have been created using GEOMESH, VISUAL MESH and SYSTUS2007 on a
Windows NT workstation. GEOMESH is a geometric modelling software, VISUAL MESH is
a very performing mesh generator, SYSTUS is a general finite element software. All
products are developed and maintained by ESI Software (part of ESI-Group).
1.3.2.2 Model setup and assumptions
The mesh model
In order to model and determine precisely the static behaviour of the new design, a 3-
dimensional shell/solid model of a part of the bridge has been created. Three sections,
each 4.85 m long, have been modelled. The generated finite element model is
composed of following type of elements:
Solid elements (with 3 DOF per node)for rails, railpads, sleepers and sleeperpads;
Shell elements (with 6 DOF per node) for the steel structure (plates and beams).
Figure 1.6 represents the 3D finite element model of the part of the bridge.

TIP4-CT-2005-516420 Page 11 of 52
QCITY December 29, 2008
D5-07_APT_48M.doc
Figure 1.6
Figure 1.7 represents a detailed view of the mesh. One can clearly distinguish different
parts of the structure: rail with railpad attached to the sleeper posed on the
sleeperpad. Red contact elements are created at the extremities of the sleepers,
coming in to contact with the L200x200x24 (dark blue coinciding elements). The L-
beam is welded and bolted to the big HEA1000 beam (green).
The model contains 94560 nodes and 83522 elements !
Figure 1.7

TIP4-CT-2005-516420 Page 12 of 52
QCITY December 29, 2008
D5-07_APT_48M.doc
Material data
Following linear material data has been used:
E nu rho[N/m²] [-] [kg/m³]
Steel beams 21.E10 0.3 7850
Sleeperpads 5045240 0.45 1050
Sleepers 1.9E10 0.3 1314
Media
Initially, there is no contact between the L-beam and the sleepers. Due to a lateral
force on the top of the rail, sleepers move laterally on the sleeperpads and become in
this way in contact with the beams. This contact is modelled by means of media
represented in next figures:
- Figure 1.8 shows the different contact zones on the sleepers.
- Figure 1.9 shows the different contact zones on the L200x200x24.
- Figure 1.10 shows the different contact zones on the IPE240 when in contact with
L200x200x24.
Figure 1.8

TIP4-CT-2005-516420 Page 13 of 52
QCITY December 29, 2008
D5-07_APT_48M.doc
Figure 1.9
Figure 1.10

TIP4-CT-2005-516420 Page 14 of 52
QCITY December 29, 2008
D5-07_APT_48M.doc
Load
The load case consists of a lateral force of 10 ton/axle. This force is applied in two
nodes on the side of the rail (each 50000 N) for each axle of the bogie (4 forces in
total).
Several positions have been investigated, only the two resulting in extreme values
(minimum and maximum stresses) have been retained:
- a bogie with one axle above the HEA1000 (figure 1.11). This is referred to as position
1 in the result description.
- a bogie with both axles between 2 HEA1000 (figure 1.12). This is referred to as
position 2 in the result description.
Those loads are applied incrementally (non linear because of the contact
phenomena).

TIP4-CT-2005-516420 Page 15 of 52
QCITY December 29, 2008
D5-07_APT_48M.doc
Figure 1.11

TIP4-CT-2005-516420 Page 16 of 52
QCITY December 29, 2008
D5-07_APT_48M.doc
Figure 1.12

TIP4-CT-2005-516420 Page 17 of 52
QCITY December 29, 2008
D5-07_APT_48M.doc
Boundary conditions
The complete structure is supposed to be clamped longitudinal at the extremities (no
displacement in X direction, no rotation round lateral or vertical axis). To stabilize the
structure, a few nodes are blocked in other directions.
1.3.2.3 Results
Using the model described in §4.3.2.2, a non linear static analysis is performed using a
L200x200x24 beam. Due to the contact phenomena, the analysis is non linear.
The table below gives an overview of the results:
position Description Figure
1 Max disp (mm) 3.26 At top of rail 8
1 Max disp L (mm) 2.37 At top of L200x100x15 9
1 Max VonMise (MPa) 76 Near HEA1000 10
2 Max disp (mm) 3.37 At top of rail 11
2 Max disp L (mm) 2.75 At top of L200x100x15 12
2 Max VonMise (MPa) 37 Near HEA1000 13
Remarks:
1. The maximum displacement occurs at the top of the rail where forces are applied.
2. The maximum displacement of the L200x200x24 occurs between the two HEA1000
beams.
3. Maximum stresses occur in the contact zone of the sleepers close to the HEA1000.

TIP4-CT-2005-516420 Page 18 of 52
QCITY December 29, 2008
D5-07_APT_48M.doc
Figure 1.13

TIP4-CT-2005-516420 Page 19 of 52
QCITY December 29, 2008
D5-07_APT_48M.doc
Figure 1.14

TIP4-CT-2005-516420 Page 20 of 52
QCITY December 29, 2008
D5-07_APT_48M.doc
Figure 1.15

TIP4-CT-2005-516420 Page 21 of 52
QCITY December 29, 2008
D5-07_APT_48M.doc
Figure 1.16

TIP4-CT-2005-516420 Page 22 of 52
QCITY December 29, 2008
D5-07_APT_48M.doc
Figure 1.17

TIP4-CT-2005-516420 Page 23 of 52
QCITY December 29, 2008
D5-07_APT_48M.doc
Figure 1.18

TIP4-CT-2005-516420 Page 24 of 52
QCITY December 29, 2008
D5-07_APT_48M.doc
1.3.2.4 Conclusions
In order to cope with the lateral wheel loads, a L200x200x24 beam is proposed as a
displacement limiting beam.
Finite element analysis shows that the maximum VonMise uniaxial stress in this beam
does not exceed 76 MPa for a lateral force of 10 ton/axle.
This stress load is acceptable.
Figure 1.19 shows a sketch of the proposed solution.
Figure 1.19

TIP4-CT-2005-516420 Page 25 of 52
QCITY December 29, 2008
D5-07_APT_48M.doc
2 I M P L E M E N T A T I O N O F T H E S O L U T I O N O N S I T E
2.1 PREPARATIONS IN THE WORKSHOP
The profiles 200x200x24 were sawed to the correct length and drilled in order to prepare
them for fixation onto the bridge.
Figure 2.1
Drilling and sawing of the profiles in the workshop
L-beams 100x100x10x150 were connected to the longitudinal profile in order to attach
the bolts for pre-stressing the elastomer underneath the sleeper.
Figure 2.2
This work was performed in a workshop before transportation to the site.

TIP4-CT-2005-516420 Page 26 of 52
QCITY December 29, 2008
D5-07_APT_48M.doc
2.2 MEASUREMENT AND NUMBERING OF EXISTING TRACK
Due to the fact that the distance between the wooden sleepers on the steel bridge
was not equal, all the profiles had to be numbered and adapted to assure a correct
reinstatement after the modifications.
Figure 2.3
Numbering of the profiles
Figure 2.4
Original situation before modification of the track

TIP4-CT-2005-516420 Page 27 of 52
QCITY December 29, 2008
D5-07_APT_48M.doc
2.3 MODIFICATION OF EXISTING TRACK
The modification works and the installation of the new track system were performed
between 26th of November 2007 and 22nd of January 2008.
The pictures shown below demonstrate the different steps which were performed
during the adaptation of the existing track system to the new solution.
Figure 2.5
Demounting of the protection infrastructure
Figure 2.6
Demounting of the existing track fixation

TIP4-CT-2005-516420 Page 28 of 52
QCITY December 29, 2008
D5-07_APT_48M.doc
Figure 2.7
Lifting the existing track
Figure 2.8
Inserting the elastomers between longitudinal girders and the wooden sleepers

TIP4-CT-2005-516420 Page 29 of 52
QCITY December 29, 2008
D5-07_APT_48M.doc
Figure 2.9
Dolting and welding the new L profiles to guarantee lateral stability of the track
Figure 2.10
Detailed on the designed solution, pre-stressing the elastomer by means of two springs

TIP4-CT-2005-516420 Page 30 of 52
QCITY December 29, 2008
D5-07_APT_48M.doc
Figure 2.11
Modification of the protection infrastructure
Figure 2.12
Free space-correction by filling up the opening between sleeper and L-profile

TIP4-CT-2005-516420 Page 31 of 52
QCITY December 29, 2008
D5-07_APT_48M.doc
Figure 2.13
Track based solution in place
After verification by experts from Flemish Community, the new profiles and protection
infrastructure were repainted to protect them from corrosion. This repainting was done
in the period 3rd to 7th March 2008.

TIP4-CT-2005-516420 Page 32 of 52
QCITY December 29, 2008
D5-07_APT_48M.doc
2.4 DESIGN AND INSTALLATION OF ADDITIONAL COUNTER WEIGHTS ON THE BRIDGE
Reference is made to technical report TR5-7C_APT_36M.
2.4.1 Introduction
The swing bridge Plassendale in Ostend has been strengthened over its entire length
which causes an unbalance with respect to the rotation axis.
This report will determine the need of extra counter weight in order to stabilize the
bridge. A proposition is made about the location of this extra counter weight.
Figure 2.14
Schematically, the bridge can be presented as follows:
Figure 2.15
L_short
L_long
L_1
F_moment
L_2F_1L_moment
L_total

TIP4-CT-2005-516420 Page 33 of 52
QCITY December 29, 2008
D5-07_APT_48M.doc
2.4.2 Determination extra moment
The extra weight over length L_short, to the left of the rotation axis, is completely
compensated by the extra weight to the right of the rotation axis over the same length
L_short. The extra weight over length creates a momentum M which can be
presented as a force F_moment with point of application at L_moment distance from
the rotation axis. It is this moment that needs to be compensated.
Table 2.1 gives all data in relation to the weight of the parts. Table 2.2 gives an
overview of the measured and calculated lengths.
part weight number per crossbeam
L-profile 200x200x24 71.1 kg/m
L-profile 100x100x10 2.265 kg/piece 4
threaded rod M33x400 2.685 kg/piece 4
spring 0.502 kg/piece 4
plate 100x15x470 5.534 kg/piece 2
bolt 0.254 kg/piece 8
Table 2.1
L_short 19.87 m
L_long 42.00 m
L_total 61.87 m
22.13 m
interdistance cross beams 0.69 m
Table 2.2
The total weight over length equals 4 274 kg and thus force F_moment is 41 930 kN.
Because the force's point of application lays at a distance of 30 935 m from the rotation
axis, the moment to be compensated equals 1 297 kNm. The installation of an extra
counter weight to the left of the rotation axis, at the level of the current ballast chest is
needed.

TIP4-CT-2005-516420 Page 34 of 52
QCITY December 29, 2008
D5-07_APT_48M.doc
2.4.3 Determination extra counter weight
The total counter weight is divided over different types of ballast chests. Ballast chests
V3, originally installed, are mounted along the exterior sides of the bridge and are used
for fine tuning. They have a capacity of 5 000 kg (2 500 kg at each side).
Table 2.3 shows the data of these chests.
length width height[m] [m] [m]
V3 ballast chest 2.81 0.25 0.61
Table 2.3
These chests are only half full. It is estimated that another 2 500 kg of steel can be
added. This will allow a counter moment of 446 kNm (F_1 = 24.5 kN, L_1 = 18.2 m).
From a practical point of view, we recommend to install V3' ballast chests to the right of
the current V3 ballast chests, at the same level. The dimensions of the V3' chests are
equal to those of the V3s, with the exception of the height. The determination of this
height depends on the weight to be installed.
The moment to be compensated is still 851 kN. The point of application for the V3'
ballast chests lays at 15.4 m (= L_2) of the rotation axis. This implies that in total, divided
on both sides of the bridge, 5 630 kg of additional weight must be installed. Taking into
account the empty volumes in the chests, the minimum height of the chests equals
0.69 m (calculated with a specific gravity of a full chest: 6 000 kg/m³).
2.4.4 Conclusion
The current V3 ballast chests need to be complemented with 2 500 kg of steel (1 250 kg
on each side). This is however not enough to repair the unbalance of the bridge.
Hereto, two extra V3' ballast chests need to be installed on each side of the bridge, as
indicated in figure 2.1. These V3' chests have equal dimensions in comparison with the
V3 ballast chests, with exception of the height. This height is established at 0.85 m. The
chests are filled until a total weight of 5 630 kg is reached for the weight of the two V3'
ballast chests and the counter weight together.
subdivided into 4 compartments
AutoCAD drawing 001-B, Asbuilt Staalbouw, annex B

TIP4-CT-2005-516420 Page 35 of 52
QCITY December 29, 2008
D5-07_APT_48M.doc
2.4.5 Installation of the counter weight
The preparation and installation of the counter weights was executed during the first
two week of February 2008. Due to the limited access to the bridge structure from the
waterside, the ballast chests holding the counter weights had to be manually welded
to the bridge by installing a working platform on the bridge.
The ballast chests were made from 10 mm steel plate (with certificate 2.2) and were
painted in three layers according to the S05.96 system.
Figure 2.16
Installation of an additional box holding the counter weight
Execution drawings of the counter weight ballast chests are provided in Annex C to this
document.
Initially the counter weights, consisting of steel plates, were not put inside the new
ballast chests but they were placed on the walkway above these ballast chests. Only
after a successful trial on 14/02/08 to turn the bridge over the channel, the weights
were put in their ballast chests. This was done to avoid a possible difficult removal of
excess weight from the ballast chests.

TIP4-CT-2005-516420 Page 36 of 52
QCITY December 29, 2008
D5-07_APT_48M.doc
Figure 2.17
Additional counter weights are initially placed on the walkway above the new ballast chests
After successfully turning the bridge, the alignment of the rails was verified and
approval from Belgian railways and Flemish Community was obtained.

TIP4-CT-2005-516420 Page 37 of 52
QCITY December 29, 2008
D5-07_APT_48M.doc
3 M E A S U R E M E N T S A F T E R I N S T A L L A T I O N
3.1 INTRODUCTION
The bridge status in December 2008 is such that train passage on the bridge is not yet
possible for administrative reasons (maintenance and insurance issues to be cleared
between Ostend Harbour (user), NMBS (transport operator) and Flemish Government
(owner)).
In order to verify the noise emission behaviour of the bridge before the end of the
QCITY project, we got permission to carry out a limited number of measurements with a
test train.
Similar pass-by noise and vibration measurements were carried out on the steel railway
bridge on December 2, 2008 as those executed on the original non modified bridge on
September 29, 2006. These measurements include :
vibrations of main beams of the bridge;
noise close to the bridge (2 m) and in the surroundings.
Results after modification are compared with the original measurements.
Next pages show some pictures of the modified bridge deck.
Figure 3.1
Modified bridge deck

TIP4-CT-2005-516420 Page 38 of 52
QCITY December 29, 2008
D5-07_APT_48M.doc
Figure 3.2
Modified bridge deck
Figure 3.3
Modified bridge deck
TIP4-CT-2005-516420 Page 39 of 52
QCITY December 29, 2008
D5-07_APT_48M.doc
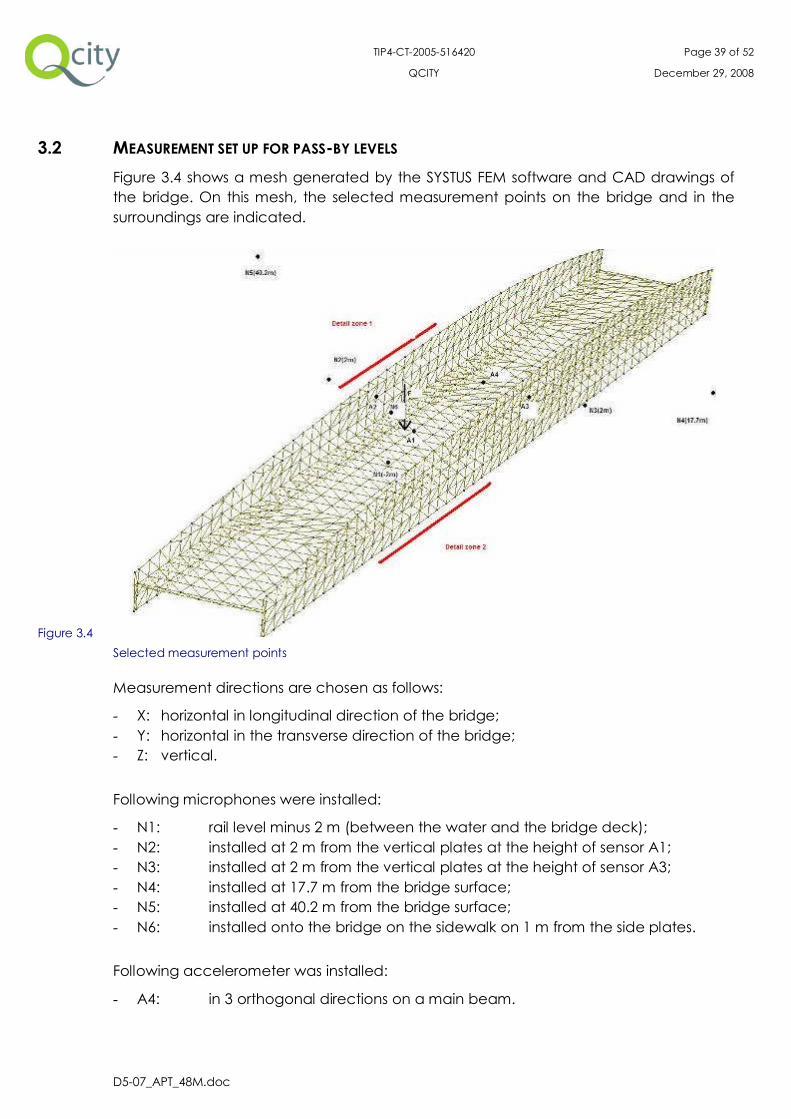
3.2 MEASUREMENT SET UP FOR PASS-BY LEVELS
Figure 3.4 shows a mesh generated by the SYSTUS FEM software and CAD drawings of
the bridge. On this mesh, the selected measurement points on the bridge and in the
surroundings are indicated.
Figure 3.4
Selected measurement points
Measurement directions are chosen as follows:
- X: horizontal in longitudinal direction of the bridge;
- Y: horizontal in the transverse direction of the bridge;
- Z: vertical.
Following microphones were installed:
- N1: rail level minus 2 m (between the water and the bridge deck);
- N2: installed at 2 m from the vertical plates at the height of sensor A1;
- N3: installed at 2 m from the vertical plates at the height of sensor A3;
- N4: installed at 17.7 m from the bridge surface;
- N5: installed at 40.2 m from the bridge surface;
- N6: installed onto the bridge on the sidewalk on 1 m from the side plates.
Following accelerometer was installed:
- A4: in 3 orthogonal directions on a main beam.

TIP4-CT-2005-516420 Page 40 of 52
QCITY December 29, 2008
D5-07_APT_48M.doc
A global view of the bridge and the sensor positions are shown in the following
photographs. Sensor positions are the same as for the previous measurements.
Figure 3.5
Global view bridge and surroundings
Figure 3.6
Global view bridge and track work

TIP4-CT-2005-516420 Page 41 of 52
QCITY December 29, 2008
D5-07_APT_48M.doc
Figure 3.7
Details: Sensor N2
Figure 3.8
Details: Sensor N5

TIP4-CT-2005-516420 Page 42 of 52
QCITY December 29, 2008
D5-07_APT_48M.doc
Figure 3.9
Details: Sensors N3
Figure 3.10
Details: Sensor N4

TIP4-CT-2005-516420 Page 43 of 52
QCITY December 29, 2008
D5-07_APT_48M.doc
Figure 3.11
Details: Sensor N6
Figure 3.12
Details: Sensor A4
The train composition used for pass-by measurements is illustrated in following pictures:
The composition is slightly different for the measurements before and after modification.
In both cases, the containers are empty.

TIP4-CT-2005-516420 Page 44 of 52
QCITY December 29, 2008
D5-07_APT_48M.doc
Figure 3.13
Train composition for the measurements on 02/12/2008
Figure 3.14
Previous train composition for measurements on 29/09/2006
Figure 3.15
Train composition for the measurements on 02/12/2008

TIP4-CT-2005-516420 Page 45 of 52
QCITY December 29, 2008
D5-07_APT_48M.doc
Figure 3.16
Train composition for the measurements on 02/12/2008
3.3 MEASUREMENT RESULTS
As explained above, the vibration and noise levels are recorded during some train
pass-bys on the bridge.
For four pass-bys, the noise and vibration levels are analysed. A recorded ID number
identifies the runs, as the table below indicates, and is repeated on each figure below.
The speed was measured with a handheld RADAR with 1 km/h precision.
For direction indication, the side where the train entered onto the bridge was noted,
since the bridge is not symmetric to its turning point.
ID Direction Speed in front [km/h] Speed at rear [km/h]
10 Entering on long side < 20 < 20
11 Entering on short side 20 < 20
12 Entering on long side 37 32
13 Entering on short side < 20 < 20
Table 3.1
Noise and vibration signals were analysed in 1/3 octave bands.
Detailed fine band spectral analysis (fine band spectrogram) shows that some
important frequencies lower than 40 Hz are induced by the very powerful diesel engine,
thus are not directly radiated by the bridge.

TIP4-CT-2005-516420 Page 46 of 52
QCITY December 29, 2008
D5-07_APT_48M.doc
Figure 3.17
During the pass by of the train, the variation of speed of the diesel engine is visualised and shows to be not
constant in time (driver adjusts power to keep speed constant)
3.4 COMPARISON OF RESULTS BEFORE AND AFTER MODIFICATION
This section shows the comparison of the average 1/3 octave band spectra for the
passage at 20 km/h considering the same measurement locations.
Before modification, 29/09/2006 (red curves).
After modification, 02/12/2008 (blue curves).
3.4.1 Accelerations
In the longitudinal direction X, a global vibration reduction of approximately 5 dB is
achieved for the complete frequency range between 0 Hz and 100 Hz. This is as
expected, due to the decoupling of the track work.
In vertical direction Z and in transversal direction Y, a reduction of 10 dB achieved from
63 Hz and higher.
Diesel engine speed variation

TIP4-CT-2005-516420 Page 47 of 52
QCITY December 29, 2008
D5-07_APT_48M.doc
Figure 3.18
Comparison of the average 1/3 octave band spectra for A4X at 20 km/h (Blue curves: after modification -
red curves: before modification)
Figure 3.19
Comparison of the average 1/3 octave band spectra for A4Y at 20 km/h (Blue curves: after modification -
red curves: before modification)

TIP4-CT-2005-516420 Page 48 of 52
QCITY December 29, 2008
D5-07_APT_48M.doc
Figure 3.20
Comparison of the average 1/3 octave band spectra for A4Z at 20 km/h (Blue curves: after modification -
red curves: before modification)
3.4.2 Noise
The results of the low frequency noise measurements (between 6.3 Hz and 200 Hz) are
presented hereafter.

TIP4-CT-2005-516420 Page 49 of 52
QCITY December 29, 2008
D5-07_APT_48M.doc
Figure 3.21
Comparison of the average 1/3 octave band spectra for N1 at 20 km/h (Blue curves: after modification -
red curves: before modification)
Figure 3.22
Comparison of the average 1/3 octave band spectra for N2 at 20 km/h (Blue curves: after modification -
red curves: before modification)

TIP4-CT-2005-516420 Page 50 of 52
QCITY December 29, 2008
D5-07_APT_48M.doc
Figure 3.23
Comparison of the average 1/3 octave band spectra for N3 at 20 km/h (Blue curves: after modification -
red curves: before modification)
Figure 3.24
Comparison of the average 1/3 octave band spectra for N4 at 20 km/h (Blue curves: after modification -
red curves: before modification)

TIP4-CT-2005-516420 Page 51 of 52
QCITY December 29, 2008
D5-07_APT_48M.doc
Figure 3.25
Comparison of the average 1/3 octave band spectra for N5 at 20 km/h (Blue curves: after modification -
red curves: before modification
Figure 3.26
Comparison of the average 1/3 octave band spectra for N6 at 20 km/h (Blue curves: after modification -
red curves: before modification)

TIP4-CT-2005-516420 Page 52 of 52
QCITY December 29, 2008
D5-07_APT_48M.doc
3.5 CONCLUSION
The noise and vibration measurements during train passage on the steel bridge have
shown a very good performance of the modified (isolated) track structure: the low
frequency noise and vibrations are reduced by in average 10 dB from 63 Hz and
above. This performance is very interesting and it opens wide application possibilities
since mitigation measures at the receiver or in the propagation path are not effective
at these low frequencies.