d3.7 initial runtime container · a container is a runtime instance of an image—what the image...
TRANSCRIPT

This project has received funding from the European Union’s Horizon 2020 research and innovation
programme under grant agreement No 723650.
D3.7–Initial Runtime Container
Deliverable ID D3.7
Deliverable Title Initial Runtime Container
Work Package WP3 – Real time Plant Operations Platform
Dissemination Level PUBLIC
Version 1.0
Date 30/11/2017
Status Final
Lead Editor CAP
Main Contributors Jean Gaschler (CAP)
Anook Sheikh (ISMB)
VincentBonnivard (PROB)
DimitrisKalatzis (CERTH)
Massimo De Pieri (LCEN)
Published by the MONSOON Consortium
Model based control framework for Site-wide OptimizatiON of data-intensive processes
Deliverable nr.
Deliverable Title
Version
D3.7
Initial Runtime Container
1.0 - 30/11/2017
Page 2 of 32
Document History
Version Date Author(s) Description
0.1 2017-06-27 Jean Gaschler
(CAP)
First Draft with TOC
0.2 2017-09-03 AAy (CAP) Update
0.3 2017-09-28 Jean Gaschler
(CAP)
Update
0.4 2017-09-28 ASh (ISMB) Added section for the monitoring part
0.5 2017-10-09 Jean Gaschler
(CAP)
Adding description PF result format description
0.6 2017-10-25 Jean Gaschler
(CAP)
Change description of runtime container accordingly to the
decision taken during Plenary Meeting
0.7 2017-10-27 V. Bonnivard
(PROB)
(Partial) filling of PROB sections
0.8 2017-10-30 Jean Gaschler
(CAP)
Numbering correction + adding ??? for missing paragraphs for
LCEN and CERTH
0.9 2017-10-31 D.Kalatzis
(CERTH)
Added CERTH sections (5.5 & 6.2).
0.10 2017-11-02 Jean Gaschler
(CAP)
Merge CERTH contribution
0.11 2017-11-02 M. De Pieri
(LCEN)
Added LCEN sections (chapter 7 + annex)
0.12 2017-11-13 Jean Gaschler
(CAP)
CAP internal review
0.13 2017-11-20 Jean Gaschler
(CAP)
Version sent to reviewers
1.0 2017-11-27 Jean Gaschler
(CAP)
Final version
Internal Review History
Version Review Date Reviewed by Summary of comments
0.13 2017-11-24 Ameline Bernard (AP) No major comments on its content, It is a well
detailed document. I have just added proposals
0.13 2017-11-24 Hassan Rasheed (FIT) Notably the executive summary and conclusion
sections are missing.

Model based control framework for Site-wide OptimizatiON of data-intensive processes
Deliverable nr.
Deliverable Title
Version
D3.7
Initial Runtime Container
1.0 - 30/11/2017
Page 3 of 32
Table of Contents
Document History ...................................................................................................................................................................................... 2
Internal Review History ............................................................................................................................................................................ 2
Table of Contents ....................................................................................................................................................................................... 3
1 Introduction ........................................................................................................................................................................................ 4
1.1 Scope .......................................................................................................................................................................................... 4
1.2 Related documents................................................................................................................................................................ 4
2 Role of the Runtime Container ................................................................................................................................................... 5
3 Environment System Specification ............................................................................................................................................ 7
4 Architecture ........................................................................................................................................................................................ 8
4.1 Functional architecture ........................................................................................................................................................ 8
4.2 Technical architecture .......................................................................................................................................................... 9
5 Modules description ..................................................................................................................................................................... 11
5.1 Predictive Functions and preparation packages repository ................................................................................ 11
5.2 Data ingestion ....................................................................................................................................................................... 11
5.3 Data preparation and Prediction Function application ......................................................................................... 12
5.4 Results storage and dissemination ............................................................................................................................... 12
5.5 Results visualization ............................................................................................................................................................ 13
5.6 Monitoring .............................................................................................................................................................................. 13
6 Interfaces description ................................................................................................................................................................... 15
6.1 Standardization of the raw input data ......................................................................................................................... 15
6.2 Prediction results .................................................................................................................................................................. 16
7 Compliance with life cycle management functions .......................................................................................................... 18
7.1 Rationale behind Life Cycle Assessment ..................................................................................................................... 18
7.2 Requirements of life cycle management functions ................................................................................................ 18
8 Conclusion ......................................................................................................................................................................................... 20
Acronyms ..................................................................................................................................................................................................... 21
List of figures .............................................................................................................................................................................................. 21
List of tables ................................................................................................................................................................................................ 21
References ................................................................................................................................................................................................... 22
1 Annex A: How to ―dockerize‖ an application? .................................................................................................................... 23
1.1 What is docker? .................................................................................................................................................................... 23
1.2 How to build an own image? .......................................................................................................................................... 24
2 Annex B: cAdvisor installation and dashboard ................................................................................................................... 27
2.1 Installation and Execution ................................................................................................................................................. 27
3 Annex C: Example of life cycle function ................................................................................................................................. 31
Model based control framework for Site-wide OptimizatiON of data-intensive processes
Deliverable nr.
Deliverable Title
Version
D3.7
Initial Runtime Container
1.0 - 30/11/2017
Page 4 of 32
1 Introduction
The task T3.3 of the MONSOON project aims to implement the Runtime Container, namely the component
executing model based predictive control functionsat runtime, running within the overall plant infrastructure.
The document D3.7 ―Initial Runtime Container‖ collects the initialspecification of the Runtime Containeralong
with the description of the environment infrastructure, in both pilot sites, and the initial architecture and
modules.
This document provides theinitialdescription of the fundamentals of the containercomponents used for
theperiod 1 of the MONSOON project and an overview of the role that the components will cover in the final
framework (period 2).
1.1 Scope
In this deliverable are documentedthe firstresults generated by Work Package 3 ―Real-time Plant Operations
Platform‖ with respect to Task 3.3 ―Runtime Container for Model Based Predictive Control Functions‖.
In particular, it describes thechosen solutions within Monsoon project, the study of the plants
infrastructureand the technologies needed.
The final goal of this component is to
Execute model based predictive control functions at runtime, running within the overall plant
infrastructure,
Ensure proper deployment and execution of specific predictive functions developed by the DataLab.
A final version of this document is foreseen in the project plan: itwill present the final and consolidated
version of the component integrated in the MONSOON platform.
1.2 Related documents
ID Title Reference Version Date
[RD.1] Grant Agreement-723650-MONSOON
723650 final 24/06/2016
[RD.2] D3.2 – Updated Real time Communications Framework
-- draft 31/11/2017
[RD.3] D3.5 – UpdatedVirtual Process Industries Resources Adaptation
-- draft 31/11/2017
[RD.4] D4.3 Initial Big Data Storage and Analytics Platform
-- draft 31/03/2017
[RD.5] D2.5 Initial Requirements and Architecture Specifications
-- draft 29/03/2017
[RD.6] D5.7 Initial Lifecycle Management plugin
-- final 31/12/2017
[RD.7] D7.1 Initial Evaluation Framework
-- final 29/03/2018

Model based control framework for Site-wide OptimizatiON of data-intensive processes
Deliverable nr.
Deliverable Title
Version
D3.7
Initial Runtime Container
1.0 - 30/11/2017
Page 5 of 32
2 Role of the Runtime Container
The MONSOON vision is to provide Process Industries with dependable tools to help improve in the efficient
use and re-use of raw resources and energy.
MONSOON aims to establish a data-driven methodology supporting the exploitation of optimization
potentials by applying multi-scale model based predictive controls in production processes.
MONSOON features harmonized site-wide dynamic models and builds upon the concept of the Cross-
Sectorial Data Lab, a collaborative environment where high amounts of data from multiple sites are collected
and processed in a scalable way. The Data Lab enables multidisciplinary collaboration of experts allowing
teams to jointly model, develop and evaluate distributed controls in rapid and cost-effective way. Further
details about the MONSOON project and architecture can be found in[RD.5].
Indeed, for the purpose of this document, it is important to highlight two main parts of the MONSOON
framework: the ―Real time Plant Operations Platform‖ and the ―Cross Sectorial Data Lab‖. These components
are colored in green in Figure 1.
Figure 1 – MONSOON Conceptual Architecture
The red box in Figure 1 highlights the Runtime Container in the initial MONSOON conceptual architecture.
The Runtime Container,namely the component executing model based predictive control functions at
runtime, running within the overall plant infrastructure, is designed to ensure proper deployment and
execution of specific predictive functions developed by the Cross Sectorial DataLab, ensuring that the
provided implementation can access the correct industry resources including raw data from sensors and
systems, actuators features, scheduling systems, enterprise system interfaces, etc.
When in operations, the container manages all aspects of predictive functions life-cycle:
- Run predictive functions within the container
o Receive streaming sensor data from the plant platform,
Model based control framework for Site-wide OptimizatiON of data-intensive processes
Deliverable nr.
Deliverable Title
Version
D3.7
Initial Runtime Container
1.0 - 30/11/2017
Page 6 of 32
o Store them in an embedded local storage Big Data platform (volume, software solution,
hardware or virtual architecture),
o Process them in real time performing predictive calculations
- Generate controls/alerts towards plant’s system tools to warn operators or process experts so that
they can intervene on equipment or adjust the process regulation parameters (done in period 2).
The visualization of the predictive alerts detail and context is done with appropriate tools (data visualization
solutions and dashboards) embedded on the Runtime Container. Visual analytics and advanced information
visualization technologies will be exploited to present relevant information to different stakeholders in a
user-friendly and effective manner.
The Runtime Container should host functions compatible withexisting IT manufacturing and data mining
standards (ISA-95, B2MML, PMML, etc.).

Model based control framework for Site-wide OptimizatiON of data-intensive processes
Deliverable nr.
Deliverable Title
Version
D3.7
Initial Runtime Container
1.0 - 30/11/2017
Page 7 of 32
3 Environment System Specification
MONSOON framework will be developed and evaluated in two different sites:aluminium and plastic plants.
Both environments are described in documents [RD.2] and[RD.3].

Model based control framework for Site-wide OptimizatiON of data-intensive processes
Deliverable nr.
Deliverable Title
Version
D3.7
Initial Runtime Container
1.0 - 30/11/2017
Page 8 of 32
4 Architecture
The functional and technical architecture chosen for the Runtime container is based on separated
components (with only one specific functional behavior by component).
This strategic bias permits the following features:
- Upgradability of each components: as each one is independent, it can be upgraded without impacts
on the other components
- Simplification of the exploitationof the whole system
- Making easier to understand the functionality of each blocks or components.
4.1 Functional architecture
The figure below represents the Functional view as planned for the final version of the Runtime Container.
Figure 2 – Final Runtime Container Functional architecture
The Runtime Container is composed of the following 4 main blocks subdivided in components:
- The ―Ingestion‖ block contains:
o ―Data ingestion‖ module which
Transforms raw data coming from the connectors (Pi, Euromap63, MESAL, etc.) into a
common format (if necessary (see §6.1)
Transmits data to the Prediction block
Stores the data into a database
o ―Predictive Functions and preparation packages repository‖ modulewhich
Stores the Predictive Function images (generated into the DataLab)into a repository
- The ―Prediction‖ blockcontains:
o ―Data preparation and Prediction Function application‖ module which
Runs instances of Predictive Functions
Transmits Predictionresults (see format description in §6.2)to the ―Output‖ block
- The ―Output‖ block contains:
o ―Results storage and dissemination ‖ module which

Model based control framework for Site-wide OptimizatiON of data-intensive processes
Deliverable nr.
Deliverable Title
Version
D3.7
Initial Runtime Container
1.0 - 30/11/2017
Page 9 of 32
Stores the Prediction resultsinto a database
Returns feedback instructions to the site shopfloor operators or machines
(implemented in period 2)
Manage acknowledged results (human approved results) and disseminate them to
the Datalab (implemented in period 2)
o ―Results visualization‖ module which
Displays Prediction results, including possible graphs and plots
- The ―Monitoring‖ block
o Monitors the health of the 3 other blocks and components.
The Initial version of the Runtime Container doesn’t contain the features of returning feedback instructions
and managing acknowledged results.
4.2 Technical architecture
The document [RD.5] about Monsoon Architecture provides a study of some possible implementation for the
Runtime Container. According to the functional architecture and the technical constraints above, the chosen
technical solution for the Runtime Container will be based on the Docker project.
Dockeris an open source project that automates the deployment of applications inside Linux Containers, and
provides the capability to package an application with its runtime dependencies into a container. It provides
a Docker CLI command line tool for the lifecycle management of image-based containers. Linux containers
enable rapid application deployment, simpler testing, maintenance, and troubleshooting while improving
security.
Dockerbrings in an API for container management, an image format and a possibility to use a registry for
sharing containers.
This scheme benefits both developers and system administrators with advantages such as:
- Rapid application deployment– containers include the minimal runtime requirements of the
application, reducing their size and allowing them to be deployed quickly.
- Portability across machines– an application and all its dependencies can be bundled into a single
container that is independent from the host version of Linux kernel, platform distribution, or
deployment model. This container can be transferred to another machine that runsDocker, and
executed there without compatibility issues.
- Version control and component reuse–successive versions of a container can be tracked, roll-backed
to previous versions and differences inspected. Containers reuse components from the preceding
layers, which makes them noticeably lightweight.
- Sharing–a remote repository can be used to share images with others. Red Hat provides a registry for
this purpose, and it is also possible to configure an own private repository.
- Lightweight footprint and minimal overhead– Docker images are typically very small, which facilitates
rapid delivery and reduces the time to deploy new application containers.
- Simplified maintenance– Docker reduces effort and risk of problems with application dependencies.
Docker works with the following fundamental components:
Model based control framework for Site-wide OptimizatiON of data-intensive processes
Deliverable nr.
Deliverable Title
Version
D3.7
Initial Runtime Container
1.0 - 30/11/2017
Page 10 of 32
- Container – an application sandbox. Each container is based on an image that holds necessary
configuration data. When a container is launched from an image, a writable layer is added on top of
this image.
- Platform Image – an image that has no parent. Platform images define the runtime environment,
packages and utilities necessary for containerized application to run. The platform image is read-
only, so any changes are reflected in the copied images stacked on top of it.
- Image – a static snapshot of the containers' configuration. Image is a read-only layer that is never
modified, all changes are made in top-most writable layer, and can be saved only by creating a new
image. Each image depends on one or more parent images.
- Registry or Store– a repository of images. Registries are public or private repositories that contain
images available for download. Some registries allow users to upload images to make them available
to others.
- Dockerfile– a configuration file with build instructions for Docker images. Dockerfiles provide a way
to automate, reuse, and share build procedures.
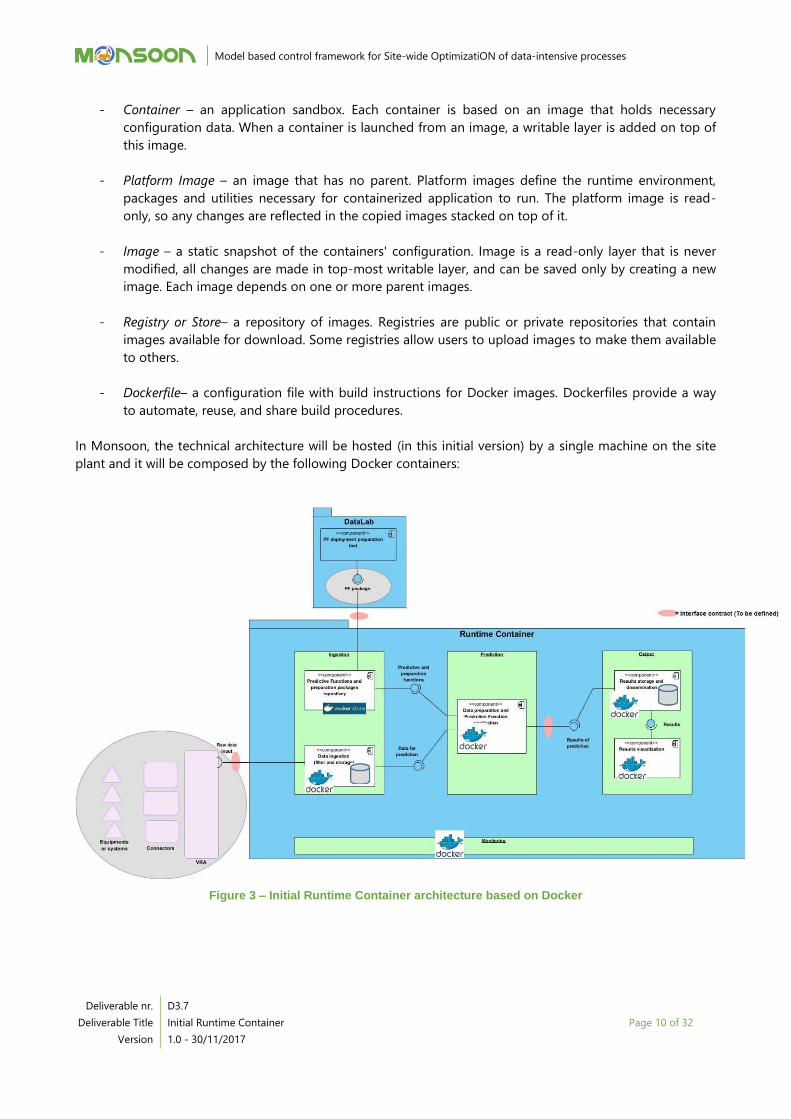
In Monsoon, the technical architecture will be hosted (in this initial version) by a single machine on the site
plant and it will be composed by the following Docker containers:
Figure 3 – Initial Runtime Container architecture based on Docker

Model based control framework for Site-wide OptimizatiON of data-intensive processes
Deliverable nr.
Deliverable Title
Version
D3.7
Initial Runtime Container
1.0 - 30/11/2017
Page 11 of 32
5 Modulesdescription
In order to understand the following paragraphs, the ―Annex A: How to ―dockerize‖ an application?‖
givessome guidelines about how to dockerize an application.‖
5.1 Predictive Functions and preparation packages repository
5.1.1 Objectives
The objective of this module is mainly to store locally (on the site plant) the ―dockerized‖ predictive function
packagesproduced by the Datalab.
5.1.2 Module architecture description
This module is based on the Docker Registry standard container. The Registry is a stateless, highly scalable
server side application that stores and lets the developers/operators/integratorsdistribute Docker images.
The Registry is open-source, under the permissive Apache license. The Registry permits atightly control
Docker images are being stored and distributed.
The Docker Registry is installed and used as any other Docker containers.
5.2 Data ingestion
5.2.1 Objectives
The objectives of this module are to:
- Filter raw input data (see description in §6.1) and retain only those which are needed by the
instanced Predictive Function packages.
- Transform them into JSON format if necessary
- Store the retained raw data in a homogeneous way in a database
- Make availabledata to the Prediction Function instances.
5.2.2 Module architecture description
This module is composed of 2 dockerized components:
- A NIFI flow for raw data transformation (into JSON format) and filtering
- A MongoDB database for data storage
Figure 4 – Data ingestion module

Model based control framework for Site-wide OptimizatiON of data-intensive processes
Deliverable nr.
Deliverable Title
Version
D3.7
Initial Runtime Container
1.0 - 30/11/2017
Page 12 of 32
The ―Filter and preparation‖ component takes the following inputs:
- raw data files,
- filter configuration files (set when a Predictive Function package is instanced)
- storage database connection configuration file
The ―storage‖ component is composed by a MongoDB database in which each filtered data is stored as a
JSON document.
5.3 Data preparation and Prediction Function application
5.3.1 Objectives
The objectives of this modules are:
- To apply the pre-processing of the raw input data, in order to transform them in the format needed
by each predictive function;
- To apply the predictive function to the pre-processed data;
- To produce the prediction results files, including files needed for visualization.
5.3.2 Module architecture description
Each predictive function is individually dockerized. Two scripts are part of this module:
- The data preparation script:
o Takes JSON files produced by the Data Ingestion module
o Applies the pre-processing needed by the predictive function
o Produces files ready to be read by the predictive function
- The predictive function script:
o Takes as input the files produced by the data preparation script
o Applies the predictive function
o Writes a JSON Prediction Result file
o Writes eventually the JSON files needed for visualizing other results.
5.4 Results storage and dissemination
5.4.1 Objectives
The objective (for period 1) of this module is to storein a database and in a homogeneous way, the
prediction results of the instanced Predictive Functions (see description in §6.2).
5.4.2 Module architecture description
The same components as the ―Data ingestion‖ (see §5.2) module will be used for this module.
Figure 5 – Prediction results storage
The ―Import results flow‖ component takes the following inputs:
Model based control framework for Site-wide OptimizatiON of data-intensive processes
Deliverable nr.
Deliverable Title
Version
D3.7
Initial Runtime Container
1.0 - 30/11/2017
Page 13 of 32
- JSON Prediction Result files produced by the instanced Predictive Function packages,
- storage database connection configuration file
The ―storage‖ component is composed by a MongoDB database in which each JSON Prediction
Resultsdocumentare stored.
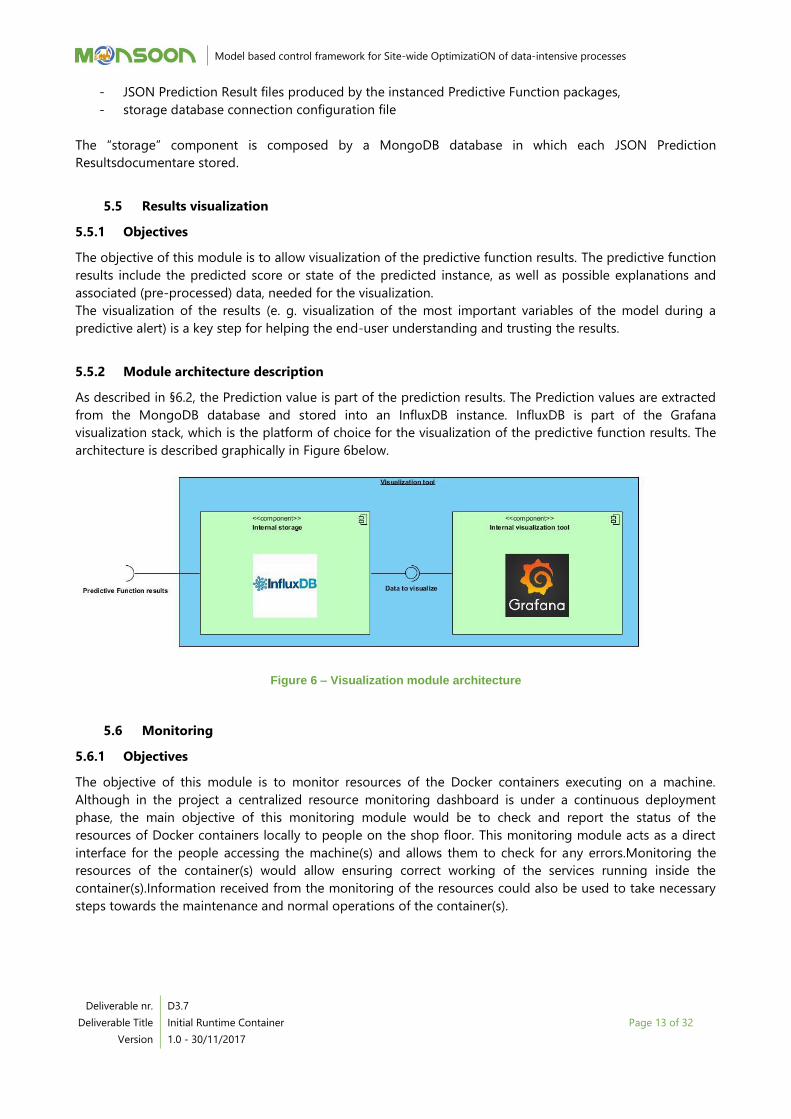
5.5 Results visualization
5.5.1 Objectives
The objective of this module is to allow visualization of the predictive function results. The predictive function
results include the predicted score or state of the predicted instance, as well as possible explanations and
associated (pre-processed) data, needed for the visualization.
The visualization of the results (e. g. visualization of the most important variables of the model during a
predictive alert) is a key step for helping the end-user understanding and trusting the results.
5.5.2 Module architecture description
As described in §6.2, the Prediction value is part of the prediction results. The Prediction values are extracted
from the MongoDB database and stored into an InfluxDB instance. InfluxDB is part of the Grafana
visualization stack, which is the platform of choice for the visualization of the predictive function results. The
architecture is described graphically in Figure 6below.
Figure 6 – Visualization module architecture
5.6 Monitoring
5.6.1 Objectives
The objective of this module is to monitor resources of the Docker containers executing on a machine.
Although in the project a centralized resource monitoring dashboard is under a continuous deployment
phase, the main objective of this monitoring module would be to check and report the status of the
resources of Docker containers locally to people on the shop floor. This monitoring module acts as a direct
interface for the people accessing the machine(s) and allows them to check for any errors.Monitoring the
resources of the container(s) would allow ensuring correct working of the services running inside the
container(s).Information received from the monitoring of the resources could also be used to take necessary
steps towards the maintenance and normal operations of the container(s).
Model based control framework for Site-wide OptimizatiON of data-intensive processes
Deliverable nr.
Deliverable Title
Version
D3.7
Initial Runtime Container
1.0 - 30/11/2017
Page 14 of 32
5.6.2 Module architecture description
Resource monitoring of the containers currently being executed by the Docker engine can be performed via
the Docker engine itself. However, the Docker engine itself does not report this information explicitly in a
graphically organized manner. To overcome this limitation, the cAdvisor software can be utilized (Installation
and dashboard are described in ―Annex B: cAdvisorinstallation and dashboard‖). The cAdvisor software does
not require any installation on the system, rather can be executed as a container itself, in-line with the other
components of the Runtime Container.
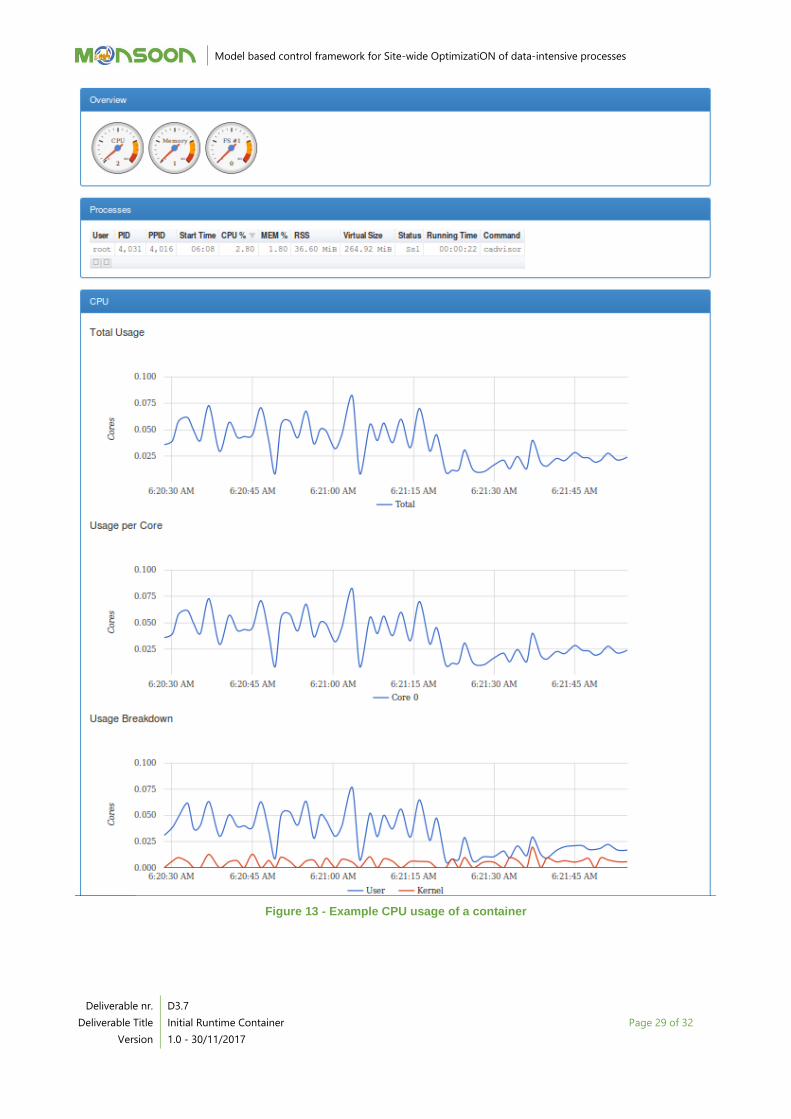
Using cAdvisor, the following parameters of the container(s) currently running on the Docker engine can be
reported:
CPU usage
Memory
Filesystem usage
Network usage
cAdvisor provides a visualization of all the parameters using a dashboard, which is accessible via a web
interface.
The cAdvisordashboard module is executed inside the runtime container as a docker container.

Model based control framework for Site-wide OptimizatiON of data-intensive processes
Deliverable nr.
Deliverable Title
Version
D3.7
Initial Runtime Container
1.0 - 30/11/2017
Page 15 of 32
6 Interfaces description
6.1 Standardization of the raw input data
In order to have homogeneous inputs for the Datalab or the Runtime Container, a standardization of the
format is proposed. This format is JSON based.
The format of the raw input data is transformed if not already in JSON format in order to match the following
attributes:
Attribute
name
(M)andatory
/
(O)ptional
Definition
timestamp M
ISO8601 date/time format (yyyy-MM-ddTHH:mm:ss.ffffffzzz) with
yyyy specifies a four-digit year
mm as part of a date, specifies a two-digit month, 01 – 12
dd specifies a two-digit day, 01 – 31
hh specifies a two-digit hour, 00 – 24
mm as part of a time, specifies a two-digit minute, 00 – 59
ss specifies a two-digit second, 00 – 59
ffffff specifies an optional fraction of a second using the digits 0 – 9 (use 1 – 6
digits)
zzz is the timezone with format +|-hh:mm
+|- the + indicates the time zone offset to the east of Greenwich, England.
The – indicates the time zone offset to the west of Greenwich, England.
source M Source of the value (plant name, file name, sensor name, etc.)
name M Name of the variable
value M Value of the variable
unit O Unit of the value
status O Status of the value (Good/Bad)
Table 1 – Standardized JSON elements
The first step of data transformation into JSONmust consist in:
- Removing values tagged with a ―Bad‖ status
- Removing ―source‖, ―name‖, ―status‖ and ―unit‖ fields from data
- Renaming file as <source>---<the transformation timestamp>---<name>.json
Finally, the JSON schema below describes the expected format of the inputdata:
Figure 7 - Input data JSON schema

Model based control framework for Site-wide OptimizatiON of data-intensive processes
Deliverable nr.
Deliverable Title
Version
D3.7
Initial Runtime Container
1.0 - 30/11/2017
Page 16 of 32
6.2 Prediction results
A common format of a prediction result has been defined in Monsoon. Each Predictive Function must
generate JSON results validated by the following JSON template.
Figure 8 - Predictive result JSON schema
A Predictive Function result should contain the following sections:
• The context of the Predictive Function execution (plant, machine, pot, anode, molding cycle, etc.)
• The result of thisexecution
– Execution date (mandatory)
– Prediction value (mandatory) : percentage or any value
– Analysis status (optional) : if an alert is raised or not (not always possible to predict this
point)
– Some instructions (optional) for the site operators or a code for the setpoint optimization of
a machine, etc.
• The failure data which causes this prediction (optional)
• The symptoms used by the Predictive Function to spot the failures (optional)
The figure below shows an example of a prediction result:

Model based control framework for Site-wide OptimizatiON of data-intensive processes
Deliverable nr.
Deliverable Title
Version
D3.7
Initial Runtime Container
1.0 - 30/11/2017
Page 17 of 32
Figure 9 – Example of prediction result
The predictive function can also produce JSON files that will be needed for visualization (e. g. important pre-
processed data). Their format will be similar to the JSON schema of the input data (see section 6.1).

Model based control framework for Site-wide OptimizatiON of data-intensive processes
Deliverable nr.
Deliverable Title
Version
D3.7
Initial Runtime Container
1.0 - 30/11/2017
Page 18 of 32
7 Compliance with life cycle management functions
Life Cycle aspects of the industrial processes investigated by MONSOON are covered by means of a
dedicated ―Life Cycle Management plugin‖ developed within WP5 activities. Details about goal, scope,
assumptions and architecture of this component are provided by deliverable [RD.6].
In the MONSOON project, a selection of the results coming from the LC plugin will feed the Evaluation
Framework that will be developed by WP7 and documented in deliverable[RD.7].
7.1 Rationale behind Life Cycle Assessment
Life Cycle Assessment aims at tracking material and energy flows into a system and to compute the
associated environmental load. After flow inventory, the environmental impact related to the execution of a
process (e.g. anode production, coffee capsule molding, etc.) can be quantified using specific impact
assessment indicators such as energy demand, carbon footprint, and water consumption1.
The application of the LCA is intended to provide managers and decision makers with a reliable set of
information that can be used to boost process efficiency, either from the perspective of enhanced use of raw
materials and energy and from the perspective of minimization of waste streams.
7.2 Requirements of life cycle management functions
Life Cycle plugin will contain a package of life cycle functions (an example of function is given in Annex C:
Example of life cycle function) that will be operated and handled by the runtime container as well as any
other predictive function developed for MONSOON. Therefore, requirements about raw data pre-processing,
timestamp alignment, acquisition and filtering are the same as described in the previous chapters of this
deliverable.
An additional component is required to transform the system input/output flow into an environmental
impact indicator. This component can be defined as an ―environmental database‖ and will include all the
coefficients to compute all the environmental indicators that will be relevant for each of the industrial
scenarios covered by MONSOON. The environmental database will be implemented as a set of MongoDB
collections.
The workflow of life cycle function can be graphically represented in Figure 10:
Figure 10 – Life cycle function workflow
1Several environmental variables/indicators can be computed, according to the goal of each specific process. All the indicators share
the same calculation rules and computational logic, therefore no further specifications about which are the actual assessed indicators are listed here

Model based control framework for Site-wide OptimizatiON of data-intensive processes
Deliverable nr.
Deliverable Title
Version
D3.7
Initial Runtime Container
1.0 - 30/11/2017
Page 19 of 32
Output of the results, as well as visualization, will be handled by the runtime container in the same way as
predictive function. To be coherent with the rest of the document, the following paragraphs highlight the
objectives and the architecture description.
7.2.1 Objectives
The objectives of this modules are:
- To apply the pre-processing of the raw input data, to transform them in the format needed by each
life cycle function;
- To apply the life cycle function to the pre-processed data;
- To produce the prediction results files, including files needed for visualization.
7.2.2 Module architecture description
Each life cycle function is individually dockerized. Within the Docker, two applications (e. g. Python scripts)
are deployed: one for the data preparation, and another for the application of the life cycle function.
The data preparation script:
- Takes JSON files produced by the Data Ingestion module
- Applies the pre-processing needed by the life cycle function
- Produces files ready to be read by the life cycle function
The life cycle function script:
- Takes as input the files produced by the data preparation script
- Applies the life cycle function
- Writes a JSON Prediction Result file
Writes eventually the JSON files needed for visualizing other results.

Model based control framework for Site-wide OptimizatiON of data-intensive processes
Deliverable nr.
Deliverable Title
Version
D3.7
Initial Runtime Container
1.0 - 30/11/2017
Page 20 of 32
8 Conclusion
This document presents the initial specification of the Runtime Container, along with the description of the
environment infrastructure, in both pilot sites. Moreover, the relevant initial architecture and modules have
been described.
The final version of this documentis planned to be released in document D3.8 (during the third year of the
MONSOON project).
This project has received funding from the European Union’s Horizon 2020 research and innovation
programme under grant agreement No 723650.
Acronyms
Acronym Explanation
B2MML Business To Manufacturing Markup Language
ISA-95 ANSI/ISA-95, or ISA-95 as it is more commonly referred, is an international standard from the International Society of Automation for developing an automated interface between enterprise and control systems
PMML Predictive Model Markup Language
List of figures
Figure 1 – MONSOON Conceptual Architecture ...................................................................................................................................................... 5
Figure 2 – Final Runtime Container Functional architecture ............................................................................................................................... 8
Figure 3 – Initial Runtime Container architecture based on Docker .............................................................................................................. 10
Figure 4 – Data ingestion module ................................................................................................................................................................................ 11
Figure 5 – Prediction results storage ........................................................................................................................................................................... 12
Figure 6 – Visualization module architecture........................................................................................................................................................... 13
Figure 7 - Input data JSON schema ............................................................................................................................................................................. 15
Figure 8 - Predictive result JSON schema ................................................................................................................................................................. 16
Figure 9 – Example of prediction result ...................................................................................................................................................................... 17
Figure 10 – Life cycle function workflow .................................................................................................................................................................... 18
Figure 11 – VM vs. Docker container ........................................................................................................................................................................... 24
Figure 12 - Example Containers executing on the Docker Engine ................................................................................................................. 28
Figure 13 - Example CPU usage of a container ....................................................................................................................................................... 29
Figure 14 - Example Memory and Network usage of a container .................................................................................................................. 30
Figure 15 - Example Filesystem usage of a container .......................................................................................................................................... 30
Figure 16 - life cycle functions logic ............................................................................................................................................................................ 32
List of tables
Table 1 – Standardized JSON elements ..................................................................................................................................................................... 15

Model based control framework for Site-wide OptimizatiON of data-intensive processes
Deliverable nr.
Deliverable Title
Version
D3.7
Initial Runtime Container
1.0 - 30/11/2017
Page 22 of 32
References
1 https://docs.docker.com/engine/reference/builder/
2 https://12factor.net/

This project has received funding from the European Union’s Horizon 2020 research and innovation
programme under grant agreement No 723650.
1 Annex A: How to “dockerize” an application?
1.1 What is docker?
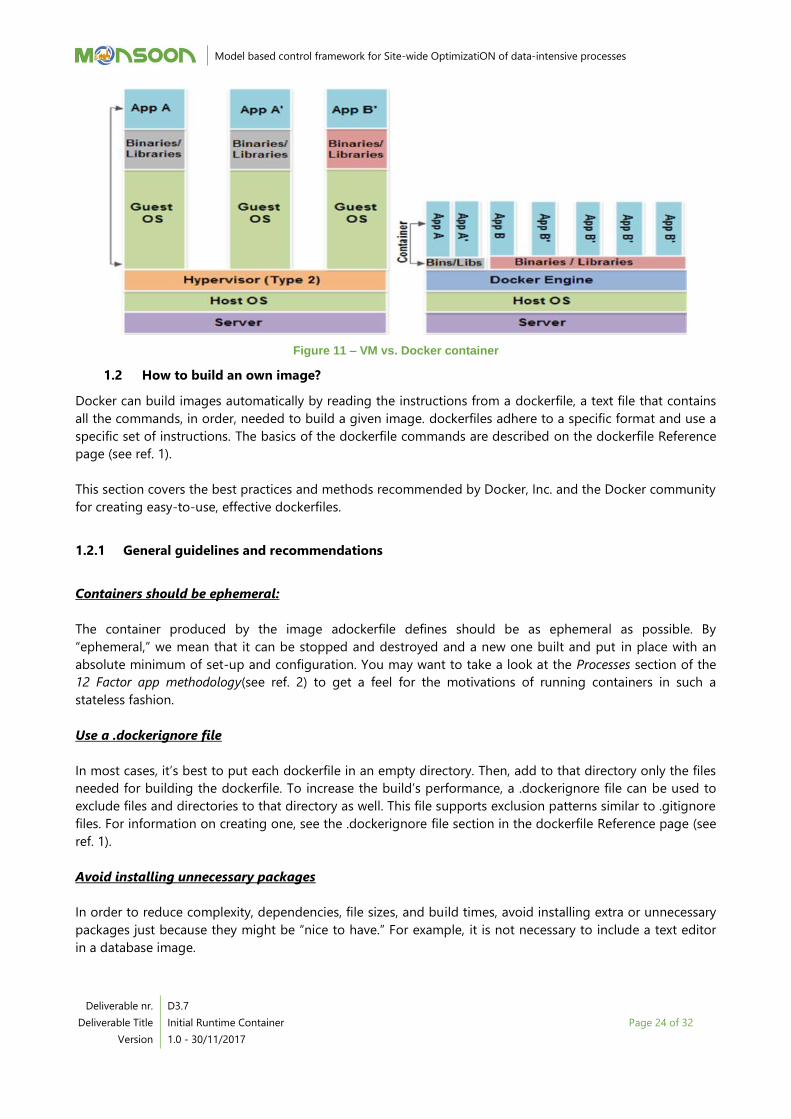
In the past (and present), main enterprise applications ran on VMs, little virtual servers. Cloud infrastructure
made it easy and cheap to get VMs, but maintenance people were still saddled with the frustrations of
managing these little servers and updating them with each code deploy. Docker is designed so that
developers have all of the tools they need (code, runtime, system tools, system libraries) to install a piece of
software on a server, regardless of the environment and that operations of maintenance are facilitated.
1.1.1 A brief explanation of containers
An image is a lightweight, stand-alone, executable package that includes everything needed to run a piece
of software, including the code, a runtime, libraries, environment variables, and configuration files.
A container is a runtime instance of an image—what the image becomes in memory when actually executed.
It runs completely isolated from the host environment by default, only accessing host files and ports if
configured to do so.
A dockerfile is the main set of instructions a user can execute to form a new Docker image, via the ―docker
build‖ command. The instructions are executed in the order they are written.
Containers run apps natively on the host machine’s kernel. They have better performance characteristics than
virtual machines that only get virtual access to host resources through a hypervisor. Containers can get native
access, each one running in a discrete process, taking no more memory than any other executable.
1.1.2 Virtual machines vs. containers
Virtual machines run guest operating systems—note the OS layer in each box. This is resource intensive, and
the resulting disk image and application state is an entanglement of OS settings, system-installed
dependencies, OS security patches, and other easy-to-lose, hard-to-replicate ephemera.
Containers can share a single kernel, and the only information that needs to be in a container image is the
executable and its package dependencies, which never need to be installed on the host system. These
processes run like native processes, and they can be managed individually by running commands
like dockerps—just like a ps command on Linux to see active processes. Finally, because they contain all
their dependencies, there is no configuration entanglement; a containerized app ―runs anywhere.‖
Model based control framework for Site-wide OptimizatiON of data-intensive processes
Deliverable nr.
Deliverable Title
Version
D3.7
Initial Runtime Container
1.0 - 30/11/2017
Page 24 of 32
Figure 11 – VM vs. Docker container
1.2 How to build an own image?
Docker can build images automatically by reading the instructions from a dockerfile, a text file that contains
all the commands, in order, needed to build a given image. dockerfiles adhere to a specific format and use a
specific set of instructions. The basics of the dockerfile commands are described on the dockerfile Reference
page (see ref. 1).
This section covers the best practices and methods recommended by Docker, Inc. and the Docker community
for creating easy-to-use, effective dockerfiles.
1.2.1 General guidelines and recommendations
Containers should be ephemeral:
The container produced by the image adockerfile defines should be as ephemeral as possible. By
―ephemeral,‖ we mean that it can be stopped and destroyed and a new one built and put in place with an
absolute minimum of set-up and configuration. You may want to take a look at the Processes section of the
12 Factor app methodology(see ref. 2) to get a feel for the motivations of running containers in such a
stateless fashion.
Use a .dockerignore file
In most cases, it’s best to put each dockerfile in an empty directory. Then, add to that directory only the files
needed for building the dockerfile. To increase the build’s performance, a .dockerignore file can be used to
exclude files and directories to that directory as well. This file supports exclusion patterns similar to .gitignore
files. For information on creating one, see the .dockerignore file section in the dockerfile Reference page (see
ref. 1).
Avoid installing unnecessary packages
In order to reduce complexity, dependencies, file sizes, and build times, avoid installing extra or unnecessary
packages just because they might be ―nice to have.‖ For example, it is not necessary to include a text editor
in a database image.

Model based control framework for Site-wide OptimizatiON of data-intensive processes
Deliverable nr.
Deliverable Title
Version
D3.7
Initial Runtime Container
1.0 - 30/11/2017
Page 25 of 32
Each container should have only one concern
Decoupling applications into multiple containers makes it much easier to scale horizontally and reuse
containers. For instance, a web application stack might consist of three separate containers, each with its own
unique image, to manage the web application, database, and an in-memory cache in a decoupled manner.
Normallythe rule ―one process per container‖ must be followed. While this mantra has good intentions, it is
not necessarily true that there should be only one operating system process per container. In addition to the
fact that containers can now be spawned with an init process, some programs might spawn additional
processes of their own accord. For instance, Celery can spawn multiple worker processes, or Apache might
create a process per request. While ―one process per container‖ is frequently a good rule of thumb, it is not a
hard and fast rule. Keeping containers as clean and modular as possible must be the main goal of the builder.
If containers depend on each other, Docker container networks must be used to ensure that these containers
can communicate.
Minimize the number of layers
A balance between readability (and thus long-term maintainability) of the dockerfile and minimizing the
number of layers it uses must be found. Be strategic and cautious about the number of layers used to build
the final image.
Sort multi-line arguments
Whenever possible, ease later changes by sorting multi-line arguments alphanumerically. This will help in
avoiding duplication of packages and making the list much easier to update. This also makes PRs a lot easier
to read and review. Adding a space before a backslash (\) helps as well.
Here’s an example from the buildpack-deps image:
RUN apt-get update && apt-get install -y \
bzr \
cvs \
git \
mercurial \
subversion
Build cache
During the process of building an image Docker will step through the instructions in the dockerfile executing
each in the order specified. As each instruction is examined Docker will look for an existing image in its cache
that it can reuse, rather than creating a new (duplicate) image.
The --no-cache=true option on the docker build command can be set in order to not used the cache at
all.
However, normally, as Docker uses its cache, then it is very important to understand when it will, and will not,
find a matching image. The basic rules that Docker will follow are outlined below:
Starting with a parent image that is already in the cache, the next instruction is compared against all
child images derived from that base image to see if one of them was built using the exact same
instruction. If not, the cache is invalidated.

Model based control framework for Site-wide OptimizatiON of data-intensive processes
Deliverable nr.
Deliverable Title
Version
D3.7
Initial Runtime Container
1.0 - 30/11/2017
Page 26 of 32
In most cases simply comparing the instruction in the dockerfile with one of the child images is
sufficient. However, certain instructions require a little more examination and explanation.
For the ADD and COPY instructions, the contents of the file(s) in the image are examined and a
checksum is calculated for each file. The last-modified and last-accessed times of the file(s) are not
considered in these checksums. During the cache lookup, the checksum is compared against the
checksum in the existing images. If anything has changed in the file(s), such as the contents and
metadata, then the cache is invalidated.
Aside from the ADD and COPY commands, cache checking will not look at the files in the container
to determine a cache match. For example, when processing a RUN apt-get -y update command the
files updated in the container will not be examined to determine if a cache hit exists. In that case just
the command string itself will be used to find a match.
Once the cache is invalidated, all subsequent dockerfile commands will generate new images and the cache
will not be used.

This project has received funding from the European Union’s Horizon 2020 research and innovation
programme under grant agreement No 723650.
2 Annex B: cAdvisorinstallation and dashboard
2.1 Installation and Execution
The following command would execute the cAdvisor container; if not present it would be automatically
downloaded. Variable values in the command can be changed such as to use another port instead of 8080
for the web access, or a different name, etc.
docker run \
--volume=/:/rootfs:ro \
--volume=/var/run:/var/run:rw \
--volume=/sys:/sys:ro \
--volume=/var/lib/docker/:/var/lib/docker:ro \
--publish=8080:8080 \
--detach=true \
--name=cadvisor \
google/cadvisor:latest
2.1.1 cAdvisor Dashboard
The cAdvisordashboard and visualizations can be accessed via a web browser at IP/localhost:Port.
Following are some examples of the parameters being monitored and reported by the component.

Model based control framework for Site-wide OptimizatiON of data-intensive processes
Deliverable nr.
Deliverable Title
Version
D3.7
Initial Runtime Container
1.0 - 30/11/2017
Page 28 of 32
Figure 12 - Example Containers executing on the Docker Engine
Model based control framework for Site-wide OptimizatiON of data-intensive processes
Deliverable nr.
Deliverable Title
Version
D3.7
Initial Runtime Container
1.0 - 30/11/2017
Page 29 of 32
Figure 13 - Example CPU usage of a container

Model based control framework for Site-wide OptimizatiON of data-intensive processes
Deliverable nr.
Deliverable Title
Version
D3.7
Initial Runtime Container
1.0 - 30/11/2017
Page 30 of 32
Figure 14 - Example Memory and Network usage of a container
Figure 15 - Example Filesystem usage of a container
This project has received funding from the European Union’s Horizon 2020 research and innovation
programme under grant agreement No 723650.
3 Annex C: Example of life cycle function
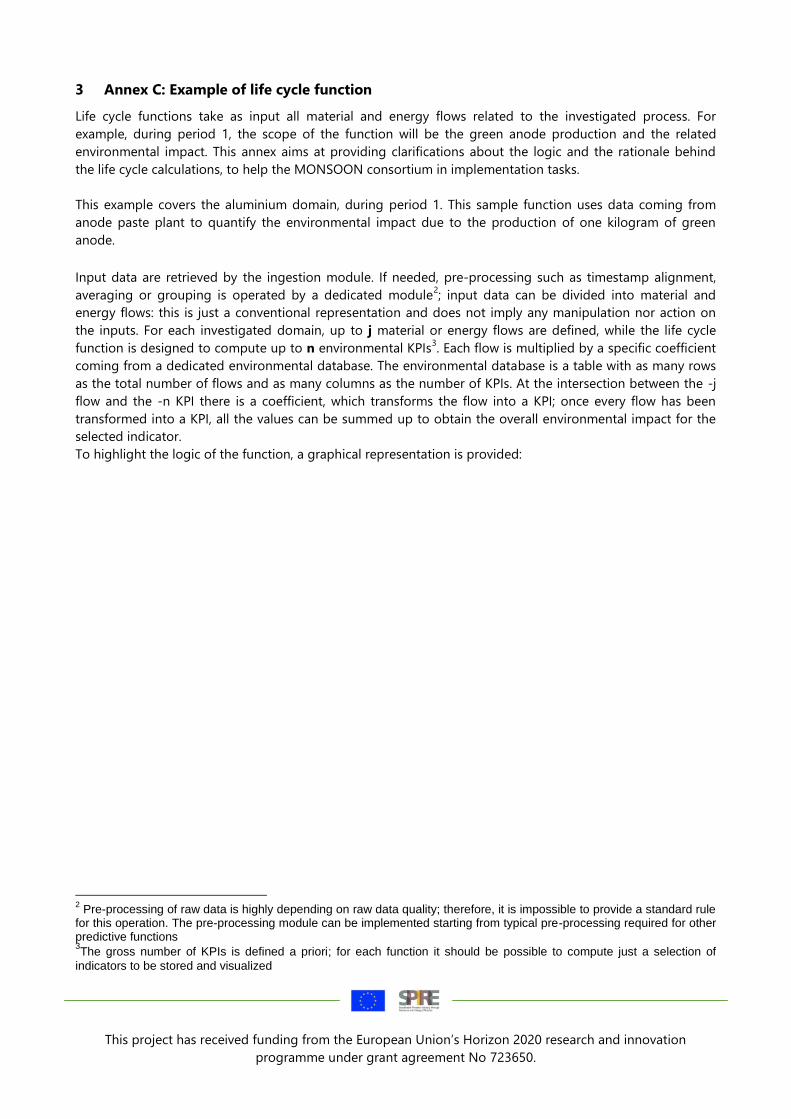
Life cycle functions take as input all material and energy flows related to the investigated process. For
example, during period 1, the scope of the function will be the green anode production and the related
environmental impact. This annex aims at providing clarifications about the logic and the rationale behind
the life cycle calculations, to help the MONSOON consortium in implementation tasks.
This example covers the aluminium domain, during period 1. This sample function uses data coming from
anode paste plant to quantify the environmental impact due to the production of one kilogram of green
anode.
Input data are retrieved by the ingestion module. If needed, pre-processing such as timestamp alignment,
averaging or grouping is operated by a dedicated module2; input data can be divided into material and
energy flows: this is just a conventional representation and does not imply any manipulation nor action on
the inputs. For each investigated domain, up to j material or energy flows are defined, while the life cycle
function is designed to compute up to n environmental KPIs3. Each flow is multiplied by a specific coefficient
coming from a dedicated environmental database. The environmental database is a table with as many rows
as the total number of flows and as many columns as the number of KPIs. At the intersection between the -j
flow and the -n KPI there is a coefficient, which transforms the flow into a KPI; once every flow has been
transformed into a KPI, all the values can be summed up to obtain the overall environmental impact for the
selected indicator.
To highlight the logic of the function, a graphical representation is provided:
2 Pre-processing of raw data is highly depending on raw data quality; therefore, it is impossible to provide a standard rule
for this operation. The pre-processing module can be implemented starting from typical pre-processing required for other predictive functions 3The gross number of KPIs is defined a priori; for each function it should be possible to compute just a selection of
indicators to be stored and visualized

Model based control framework for Site-wide OptimizatiON of data-intensive processes
Deliverable nr.
Deliverable Title
Version
D3.7
Initial Runtime Container
1.0 - 30/11/2017
Page 32 of 32
Figure 16 - life cycle functions logic
The computational flow is reported below:
For each flow
o The flow is transformed into a KPI by multiplying the flow by the specific coefficient into the
environmental database
For each of the selected KPIs:
o The sum of each KPI obtained by previous operation is performed to obtain the overall value
Flow 1 (e.g. coke)
Flow 2 (e.g. pitch)
Flow 3 (e.g. waste to landfill)
Flow 4 (e.g. electricity)
Flow 5 (e.g. natural gas)
Flow j
Flow KPI 1 KPI 2 KPI n
Coke F11 F12 F1n
Pitch F21 F22 F2n
Waste to landfill F31 F32 F3n
Electricity F41 F42 F4n
Natural gas F51 F52 F5n
Material/energy flow -j Fj1 Fj2 Fjn
ENVIRONMENTAL DATABASE
j m
ate
ria
l+
en
erg
yflo
ws
n environmental KPIsM
AT
ER
IAL
FL
OW
SE
NE
RG
Y F
LO
WS
KPI 1 KPI 2 KPI n
To storage
and
visualization
modules