d2 5 13 - development of uv-led disinfection - techneau · pdf filetechneau is an integrated...
TRANSCRIPT

TECHNEAU Development of UV-LED Disinfection
TECHNEAU February 2010
© 2007 TECHNEAU TECHNEAU is an Integrated Project Funded by the European Commission under the Sixth Framework Programme, Sustainable Development, Global Change and Ecosystems Thematic Priority Area (contract-number 018320). All rights reserved. No part of this book may be reproduced, stored in a database or re-trieval system, or published, in any form or in any way, electronically, mechanically, by print, photoprint,
TECHNEAU Report within WP2.5: Compact Units for Decentralised Water Supply.
TECHNEAU February 2010

Colofon
Title Development of UV-LED disinfection Author(s) Prof. Dr. Michael Kneissl, TU Berlin & Ferdinand-Braun Institute Tim Kolbe, Technical University of Berlin Marlene Würtele, Technical University of Berlin Eric Hoa, KompetenzZentrum Wasser Berlin gGmbH Quality Assurance Prof. Dr. Martin Jekel, Technical University of Berlin Dr. Markus Weyers, Ferdinand-Braun-Institute Boris Lesjean, KompetenzZentrum Wasser Berlin gGmbH Florencio Martin, Anjou Recherche Deliverable number D 2.5.13
This report is: PU = Public when the final version appears.
Development of UV-LED Disinfection © TECHNEAU - 1 - February, 2010
Table of Content
Table of Content 1
Glossary 2
1 Introduction 3
2 State-of-the-art on UV Light Emitting Diodes 4 2.1 The Dawn of Solid State Lighting 4 2.2 Materials for UV light emitting diodes (LEDs) 4 2.3 Applications of UV light emitting diodes (LEDs) 6 2.4 Water purification with UV LEDs 7 2.5 Challenges regarding the UV device structure 8
3 Characterisation of commercial UV-LEDs at 265 and 280 nm 9 3.1 Spectra 9 3.2 Current-Voltage Characteristics 9 3.3 Emission Power 10
4 Design of a UV-LED disinfection module 11 4.1 Design constraints for biodosimetry trials in bench-scale reactors 11 4.2 Module I 12 4.3 Module II 13
5 UV-LED Disinfection Performance Tests 15 5.1 Material and Methods 15 5.2 Results and Discussion 17 5.3 Conclusions 23
6 Overall Conclusion and Perspectives 24
7 References 25
8 Annex 27
Development of UV-LED Disinfection © TECHNEAU - 2 - February, 2010
Glossary – preliminary definitions
Fluence (H'; often called UV dose) : total amount of radiant energy from all directions passing through an infinitesimally small sphere of cross-sectional area dA, divided by dA. The fluence is the fluence rate times the irradiation time in seconds [SI unit: J/m²]. [1] The term fluence has commonly been called the UV dose. Dose is a term that is used to describe the total absorbed energy. In the case of microorganisms, only a few percent of the ultraviolet light are absorbed, the rest of it just passes through the organism. The term fluence is thus more appropriate, since it relates to the incident UV energy, rather than the absorbed UV en-ergy1. [1, 2] Fluence rate (E') is the radiant power passing from all directions through an infinitesimally small sphere of cross-sectional area dA, divided by dA [SI unit: W/m²]. Fluence rate, instead of intensity or irradiance, is the appropriate term for UV disinfection, since UV-light can penetrate the microorganism from any direction. [1] Irradiance is the appropriate term when a surface is irradiated by UV light coming from all directions above the surface. The radiometer that is used with a UV apparatus measures the irradiance. In a well-designed bench setup, the fluence rate and the irradiance are almost the same. [2]
1 For aspects influencing the fluence see chapter 4.1
Development of UV-LED Disinfection © TECHNEAU - 3 - February, 2010
1 Introduction
TECHNEAU WP2.5 targets the development of new technologies for decen-tralised water treatment. One important aspect is to have low-energy con-suming systems. In that regard, the UV disinfection using LEDs (Light-Emitting Diode) seems a promising technology. Research activities on this cutting-edge technology were organised in collabo-ration with the Ferdinand-Braun Institute in Berlin, which works on innova-tive applications in the fields of microwaves and optoelectronics, and the Technical University of Berlin. That includes a state-of-the-art of the current challenges with UV-LEDs, the characterisation of the commercial offers, the design and construction of UV-LED disinfection modules and the completion of biodosimetric tests to evaluate their efficiencies. The different results re-ported in this report.
Development of UV-LED Disinfection © TECHNEAU - 4 - February, 2010
2 State-of-the-art on UV Light Emitting Diodes
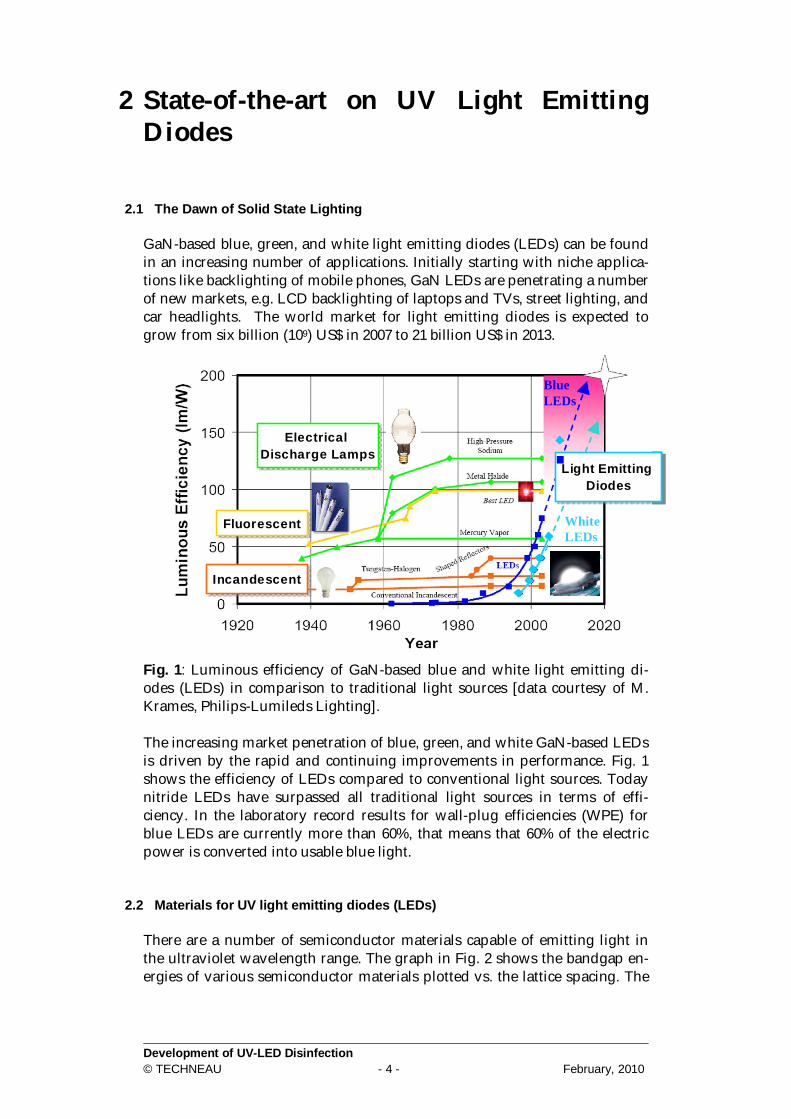
2.1 The Dawn of Solid State Lighting GaN-based blue, green, and white light emitting diodes (LEDs) can be found in an increasing number of applications. Initially starting with niche applica-tions like backlighting of mobile phones, GaN LEDs are penetrating a number of new markets, e.g. LCD backlighting of laptops and TVs, street lighting, and car headlights. The world market for light emitting diodes is expected to grow from six billion (109) US$ in 2007 to 21 billion US$ in 2013.
Fig. 1: Luminous efficiency of GaN-based blue and white light emitting di-odes (LEDs) in comparison to traditional light sources [data courtesy of M. Krames, Philips-Lumileds Lighting]. The increasing market penetration of blue, green, and white GaN-based LEDs is driven by the rapid and continuing improvements in performance. Fig. 1 shows the efficiency of LEDs compared to conventional light sources. Today nitride LEDs have surpassed all traditional light sources in terms of effi-ciency. In the laboratory record results for wall-plug efficiencies (WPE) for blue LEDs are currently more than 60%, that means that 60% of the electric power is converted into usable blue light.
2.2 Materials for UV light emitting diodes (LEDs) There are a number of semiconductor materials capable of emitting light in the ultraviolet wavelength range. The graph in Fig. 2 shows the bandgap en-ergies of various semiconductor materials plotted vs. the lattice spacing. The
ElectricalDischarge Lamps
ElectricalDischarge Lamps
FluorescentFluorescent
IncandescentIncandescent
Light EmittingDiodes
Light EmittingDiodes
ElectricalDischarge Lamps
ElectricalDischarge Lamps
FluorescentFluorescent
IncandescentIncandescent
Light EmittingDiodes
Light EmittingDiodes
WhiteLEDs
Blue LEDs
ElectricalDischarge Lamps
ElectricalDischarge Lamps
FluorescentFluorescent
IncandescentIncandescent
Light EmittingDiodes
Light EmittingDiodes
ElectricalDischarge Lamps
ElectricalDischarge Lamps
FluorescentFluorescent
IncandescentIncandescent
Light EmittingDiodes
Light EmittingDiodes
WhiteLEDs
Blue LEDs

Development of UV-LED Disinfection © TECHNEAU - 5 - February, 2010
bandgap energy determines the emission wavelength of the LED devices. For a emission at 265 nm a bandgap energy of 4.68 eV is required.
Fig. 2: Bandgap energy vs. lattice spacing for different semiconductor materi-als. ZnS/MgS/BeSe compounds can be grown on GaAs substrates and would allow accessing the UVB and UVC spectral range. Problems: These materials are very “soft” and develop defects when generating light. This leads to early failure of LEDs and lasers. Another challenge is to find appropriate p-dopants for the wide-bandgap compounds. Summary: A possible candidate with a number of fundamental questions that still need to be solved. So far no UV LED has been demonstrated with this materials system. Diamond: An indirect semiconductor and therefore fundamentally limited regarding the efficiencies that can be achieved. There is also no other wide-bandgap compound that would allow the fabrication of heterostructures for efficient carrier injection and confinement. Summary: Due to fundamental physical limitations, diamond is not a suitable candidate for high efficiency UV emitters. ZnO/MgO compounds would allow accessing the UVB and parts of the UVC spectral range. However, up to now no reliable p-dopant has been found for these materials. Controlled p-doping is critical to realize pn-junctions for light emitting diodes. Although there are several reports in literature about p-doping of ZnO and even demonstrations of LED devices, none of these re-ports makes a convincing case. Summary: It may be still possible that ZnMgO compounds will one day yield functioning UV LED devices, but considering the huge effort and meager results so far, a successful outcome is becoming increasingly doubtful. In addition, MgZnO is undergoing a transition from wurtzite to rock-salt crystal structure at Mg mole fractions in the range of 30% - 50%, which would limit the accessible UV wavelength range.
2,0 2,5 3,0 3,5 4,0 5,5 6,0 6,50
1
2
3
4
5
6
7BeSe
MgS
DiamondhBN
Mg0.33ZnOZnOCd
0.08ZnO
CdSe
ZnS
ZnSeGaN
AlN
InN6H-SiC
Sapphire
band
gap
ener
gy (
eV)
lattice spacing (Å)
Development of UV-LED Disinfection © TECHNEAU - 6 - February, 2010
GaN/AlN are the most promising compound materials to realize LEDs in the UVB and UVC wavelength range. GaN-based high efficiency LEDs have been already demonstrated in the near UV (EQE of ~40% at 365nm and EQE of ~60% at 400nm) and there is no fundamental physical limit to achieving simi-lar efficiencies in the deep UV. Furthermore, GaN materials and devices can build on the already existing technology infrastructure that has been estab-lished for blue/green LEDs and provide high volume, low cost production.
2.3 Applications of UV light emitting diodes (LEDs)
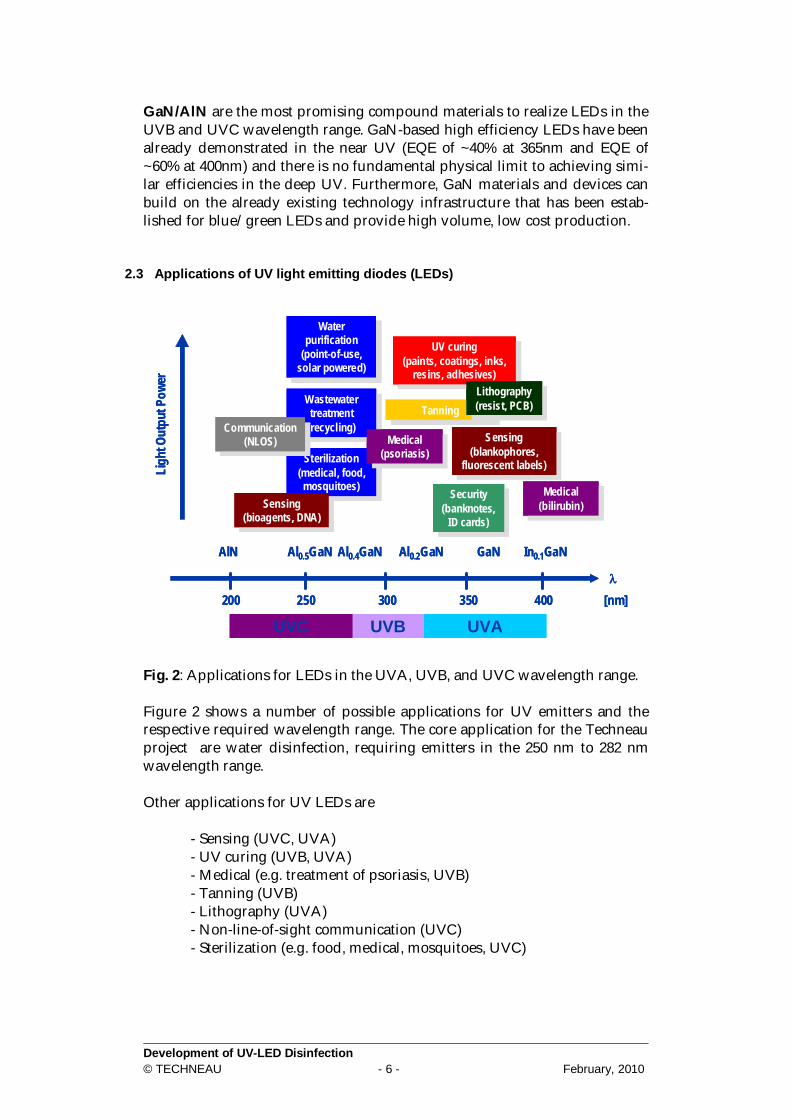
Fig. 2: Applications for LEDs in the UVA, UVB, and UVC wavelength range. Figure 2 shows a number of possible applications for UV emitters and the respective required wavelength range. The core application for the Techneau project are water disinfection, requiring emitters in the 250 nm to 282 nm wavelength range. Other applications for UV LEDs are
- Sensing (UVC, UVA) - UV curing (UVB, UVA) - Medical (e.g. treatment of psoriasis, UVB) - Tanning (UVB) - Lithography (UVA) - Non-line-of-sight communication (UVC) - Sterilization (e.g. food, medical, mosquitoes, UVC)
UV curing (paints, coatings, inks,
resins, adhesives)
UV curing (paints, coatings, inks,
resins, adhesives)
Water purification
(point-of-use, solar powered)
Water purification
(point-of-use, solar powered)
AlN Al0.5GaN Al0.4GaN Al0.2GaN GaN In0.1GaN
200 250 300 350 400 [nm]
UVAUVBUVC
Sterilization(medical, food,
mosquitoes)
Sterilization(medical, food,mosquitoes)
Wastewater treatment(recycling)
Wastewater treatment
(recycling)Sensing
(blankophores, fluorescent labels)
Sensing (blankophores,
fluorescent labels) Medical
(psoriasis)Medical
(psoriasis)
Security(banknotes,
ID cards)
Security(banknotes,
ID cards)Sensing
(bioagents, DNA) Sensing
(bioagents, DNA)
Tanning Tanning Lithography(resist, PCB)
Lithography(resist, PCB)
Medical(bilirubin)Medical
(bilirubin)
Communication(NLOS)
Communication(NLOS)
Ligh
t Out
put P
ower
UV curing (paints, coatings, inks,
resins, adhesives)
UV curing (paints, coatings, inks,
resins, adhesives)
Water purification
(point-of-use, solar powered)
Water purification
(point-of-use, solar powered)
AlN Al0.5GaN Al0.4GaN Al0.2GaN GaN In0.1GaN
200 250 300 350 400 [nm]
UVAUVBUVC
Sterilization(medical, food,
mosquitoes)
Sterilization(medical, food,mosquitoes)
Wastewater treatment(recycling)
Wastewater treatment
(recycling)Sensing
(blankophores, fluorescent labels)
Sensing (blankophores,
fluorescent labels) Medical
(psoriasis)Medical
(psoriasis)
Security(banknotes,
ID cards)
Security(banknotes,
ID cards)Sensing
(bioagents, DNA) Sensing
(bioagents, DNA)
Tanning Tanning Lithography(resist, PCB)
Lithography(resist, PCB)
Medical(bilirubin)Medical
(bilirubin)
Communication(NLOS)
Communication(NLOS)
Ligh
t Out
put P
ower

Development of UV-LED Disinfection © TECHNEAU - 7 - February, 2010
2.4 Water purification with UV LEDs UV light at the proper fluence and wavelength inactivates microorganisms by disrupting their DNA or RNA molecules, rendering them unable to repro-duce. DNA absorbs UV light with wavelengths between 200 and 300 nm. The maximum of UV-light absorption through DNA is typically reached at a wavelength around 260 nm [3]. The peak wavelength distribution is depend-ent on the target organism [4]. Chen et al [2009] presented that Bacillus subtilis spores (the target organism of this research) have an absorption maximum below 240 nm and around 270 nm. The fluence-inactivation response for 254 nm and 279 nm wavelengths were shown to be similar. [3] Different wavelengths are emitted depending on the UV-source: Convention-ally, UV-light is generated from mercury lamps. Low pressure mercury lamps emit nearly monochromatic UV light at a wavelength of 254 nm whereas me-dium pressure lamps emit a polychromatic spectrum with various wave-lengths [5]. A relatively new method to generate UV light is the use of UV LEDs [6]. UV LEDs offer the possibility to use a preferred wavelength instead of the 254 nm emitted by low pressure mercury lamps [6]. Further benefits of UV-LEDs in applications for water purification were as-sessed by Crawford et al. [7]. They summarised the following advantages of UV LEDs compared to conventional mercury lamps: no disposal problem (LEDs do not contain mercury) compact and robust design: more durable in transit and handling (no
glass or filaments) faster start-up time ability to turn on and off with higher frequency lower voltages, low power requirements high energy efficiency (in future) reduced frequency of replacement because of longer lifetime (in future).

Development of UV-LED Disinfection © TECHNEAU - 8 - February, 2010
2.5 Challenges regarding the UV device structure
Fig. 3: Heterostrucutre and chip design for a InAlGaN deep UV LED. Figure 3 shows a flip-chip mounted LED device for deep UV emission. The light is extracted through the UV-transparent AlGaN and AlN layers and sapphire substrate. The light emitting region is comprised of AlGaN or InAl-GaN multiple quantum wells. A number of key challenges remain to realize high efficiency UV emitters:
- Enhancing light extraction from the chip - Reducing the high dislocation density in the AlN/AlGaN buffer lay-ers - Reducing the series resistance of the Si-doped AlGaN current spread-ing layer - Improving the internal quantum efficiency of the InAlGaN MQWs - Reducing the series resistance of the Mg-doped AlGaN layers - Reducing the p-contact resistance - Enhancing heat extraction from the chip.
Challenges:
Light extraction
Dislocations
Current spreading
Active regionP-layer resistanceP-contacts
Heat extraction
Challenges:
Light extraction
Dislocations
Current spreading
Active regionP-layer resistanceP-contacts
Heat extraction

Development of UV-LED Disinfection © TECHNEAU - 9 - February, 2010
3 Characterisation of commercial UV-LEDs at 265 and 280 nm
Five LEDs from Sensor Electronic Technology (SET) [1] and three LEDs from Seoul Semiconductor (SSC) [2] with emission wavelength of 265 nm and 280 nm were characterized. All LEDs were housed in TO-18 packages.
3.1 Spectra The emission spectra of the 265 nm and 280 nm LEDs from SET are shown in Fig. 4. The spectra were measured under continuous-wave (cw) conditions at 20 mA with an optical fiber spectrometer. The “265 nm” LEDs have an emis-sion peak around 269 nm, the “280 nm” LEDs are emitting between 282 nm and 283 nm. A typical spectral emission full-width at half-maximum (FWHM) between 10 nm and 11 nm was found. Three LEDs from SSC were investigated for every emission wavelength. It was found that the “265 nm” LEDs have an emission peak between 267 nm and 269 nm, the “280 nm” LEDs are emitting between 279 nm and 282 nm. A similar FWHM of the emission spectrum around 10 nm was found.
250 260 270 280 290 3000,0
0,2
0,4
0,6
0,8
1,0
SET, at 20 mA Diode 1 Diode 2 Diode 3 Diode 4 Diode 5
Max.: ~ 269 nmFWHM: ~ 10 nm
Inte
nsity
(nor
mal
ised
)
Wavelength (nm)
a)
260 270 280 290 300 310 3200,0
0,2
0,4
0,6
0,8
1,0
SET, at 20 mA Diode 1 Diode 2 Diode 3 Diode 4 Diode 5
Max.: 282 bis 283 nmFWHM: ~ 10,5 nm
Inte
nsity
(nor
mal
ised
)
Wavelength (nm)
b)
Fig. 4: Emission spectra of the a) 265 nm and b) 280 nm LEDs from SET.
3.2 Current-Voltage Characteristics The current-voltage characteristics were measured with an Agilent power supply and a Keithley 2000 multimeter under cw conditions. Figure 5 shows the current-voltage characteristics of the LEDs from SET. All tested LEDs had a very similar current-voltage characteristic with operating voltages of ~5.8 V
0 1 2 3 4 5 6 70
10
20
30
SET, 265 nm
Diode 1 Diode 2 Diode 3 Diode 4 Diode 5
Cur
rent
(mA)
Voltage (V)
a)
0 1 2 3 4 5 6 70,00
0,01
0,02
0,03
SET, 280 nm
Diode 1 Diode 2 Diode 3 Diode 4 Diode 5
Cur
rent
(mA)
Voltage (V)
b)
Fig. 5: Current-voltage characteristics of the a) 265 nm and b) 280 nm LEDs from SET.

Development of UV-LED Disinfection © TECHNEAU - 10 - February, 2010
for the 265 nm LEDs and ~6.5 V for the 280 nm LEDs (at 20 mA). For the SSC LEDs a typical operating voltage of ~6.2 V was found for all wavelengths.
3.3 Emission Power For the measurement of the emission power a Si-Photodiode with a detector area of 100 mm² was used. In Fig. 6 the emission power vs. current (LI) char-acteristics for the SET LEDs is plotted. All tested LEDs exhibit similar L-I characteristics. The emission power at 20 mA initially was always higher than specified in the data sheet (0.35 mW for the 265 nm LEDs and 0.5 mW for the 280 nm LEDs according to specifications). For the LEDs from SSC similar results were found. All tested LEDs also ini-tially showed a higher emission power than specified in the data sheet.
0 10 20 300,0
0,2
0,4
0,6
0,8
1,0
SET, 265 nm Diode 1 Diode 2 Diode 3 Diode 4 Diode 5
Emis
sion
Pow
er (m
W)
Current (mA)
a)
0 10 20 300,0
0,2
0,4
0,6
0,8
1,0
SET, 280 nm Diode 1 Diode 2 Diode 3 Diode 4 Diode 5
Em
issi
on P
ower
(mW
)
Current (mA)
b)
Fig. 6: Emission power-current characteristics of the a) 265 nm and b) 282 nm LEDs from SET. Maintaining a constant output power is an important factor for a water disin-fection module. Fig. 7 shows the development of the power at a current of a 20 mA for a 265 nm LED. After 100 hours the emission power has decreased by 40%. The series resistance increased from 11.8 Ohm (0 hours) to 12.9 Ohm �(after 100 hours) while we observe no change in the emission wavelength. The degradation of the emission power makes it necessary to monitor this parameter during all test and keep it constant by increasing the current as required.
0 20 40 60 80 1000,35
0,40
0,45
0,50
0,55
0,60
0,65
Em
issi
on P
ower
(mW
)
Time (h)
SET, 265 nm
Fig. 7: Emission power over 100 hours of a 265 nm SET LED at 20 mA.

Development of UV-LED Disinfection © TECHNEAU - 11 - February, 2010
4 Design of a UV-LED disinfection module
4.1 Design constraints for biodosimetry trials in bench-scale reactors Researchers have made considerable headway in standardising protocols for conventional mercury lamps to investigate UV disinfection on bench-scale. They have found that factors as e.g. the water quality and contact time influ-ence the delivered fluence and various correction factors have to be consid-ered when calculating the fluence. These factors are described in more detail in this section, to design an adequate disinfection module for UV-LEDs. The water quality has a major effect on the transmitted fluence and the result-ing level of inactivation, since the incoming water quality determines how well the UV light penetrates the water [8]. The UV transmittance of the unfil-tered water measures the amount of UV light absorbed by UV-absorbing wa-ter components, reducing its availability to inactivate microorganisms [5]. In a flow-through UV disinfection system, contact time (cumulative exposure to UV light) is a crucial parameter affecting the fluence received by the mi-croorganisms. In contrast to chemical disinfection systems, the contact time in UV disinfection cannot be monitored directly. It is influenced by the flow rate and UV reactor hydraulics, determining the specific path of the organism through the reactor [9, 10]. This complexity of the factors influencing UV dis-infection performance in flow-through reactors led to the development of a method to calibrate the expected performance of full-scale units. This method called biodosimetry, was originally proposed by Qualls and Johnson [11]. Today there are several norms in Europe and USA that specify this analysis protocol with different types of microorganisms. During biodosimetry tests bench-scale and field-scale tests are conducted with a biological test organism. The relationship between UV fluence and the inactivation of a test organism is established under carefully controlled labo-ratory conditions in bench scale tests. The field scale test is conducted at de-sign flow and under conditions designed to represent a conservative simula-tion of full-scale operation. The disinfection fluence received by the unit, called reduction equivalent fluence (REF), is then determined by the fluence that accomplishes the same level of inactivation under bench scale conditions [9]. Experimental protocols for performing microorganism inactivation versus fluence have been established for mercury lamp based measurements [2]. These protocols include a “collimated beam apparatus” to deliver a highly uniform beam of UV-light to a water sample in a Petri dish. This conventional design limits the use of UV LEDs because conventional collimated beam ap-proaches need high power output sources, to compensate for losses between the UV light source and the water sample. Since UV LEDs have a low output power a LED array composed of a number of LEDs is needed, which has to be placed as close as possible to the water sample. According to Bolton and Linden [2] it is not necessary to completely stan-dardise a bench scale apparatus, but basic guidelines should be considered when designing a modified apparatus for a specific application. Amongst other aspects, the design has to ensure that the beam irradiating the water

Development of UV-LED Disinfection © TECHNEAU - 12 - February, 2010
sample is reasonably uniform and the divergence is small enough to ensure accurate sensor readings. The average fluence for all microorganisms in the suspension has to be kept equal by carefully controlled stirring (no vortex) [2]. The delivered average fluence differs from the measured irradiance, caused by a number of factors. The sensor reading gives the incident irradiance, from which the average irradiance is derived. The average irradiance is an estimate for the average fluence rate; the average fluence rate multiplied by the expo-sure time gives the delivered average fluence [2]. The measured irradiance is influenced by [2]: the refraction and reflection that occurs when UV light passes from one
medium to an other, the inhomogeneous distribution of the UV light over the Petri dish and the absorption of the UV light by water components.
The challenge of this project was to develop an optical system to deliver uni-form and well-calibrated UV fluences to the water sample from deep UV LED arrays. The design had to enhance the uniformity of the inhomogeneous light output distribution while reducing UV light losses.
4.2 Module I Figure 8 shows the first generation UV LED water disinfection module pro-duced to perform the biodosimetry trials. The UV LED array consists of 33 devices with an emission wavelength of 269 nm. The LEDs for this investiga-tion were obtained from Seoul Semiconductor [2]. The LEDs were placed on the base of the water disinfection module with a pitch of one cm in order to obtain a sufficiently high power density and a nearly homogeneous UV light distribution. Because of the low emission power of 0.3 mW per LED at 20 mA an array of 33 LEDs (28.5 LEDs were considered to be active) was used to provide sufficiently high emission intensity of around 8.5 mW at 20 mA. A Petri dish with a diameter of 6 cm was placed on the top of the UV LED array with a 2 mm thick suprasil base, that allows over 90% of the deep UV light to be transmitted. On top of the disinfection module a UV sensitive sili-con photodiode and a stirrer were mounted. The photodiode was used to monitor the emission power of the LED module in order to guarantee the same irradiation fluence during all microbiological tests. In order to obtain a homogeneous irradiation of the entire water volume the water was stirred during the tests. An external power supply was used for the operation of the water disinfec-tion module.

Development of UV-LED Disinfection © TECHNEAU - 13 - February, 2010
Fig. 8: UV LED water disinfection module generation I.
4.3 Module II Figure 9a shows the second generation UV LED water disinfection module produced to perform biodosimetry trials. In this module the layout of the LED array was optimized. The 35 LEDs from SET [1] were concentrically lo-cated in three circles with diameters of 1.8 cm, 3.5 cm and 5.2 cm. A reference LED from the same batch was placed in front of an UV sensitive silicon pho-todiode to monitor the emission power of the LED module in order to guar-antee the same irradiation fluence during all microbiological tests. The inte-gration of this reference LED in the module has the advantage that now it is not necessary to shade the setup from the surrounding area light. Other im-provements were the compact setup of the module with an integrated power supply and the possibility for a manual or computer control of the disinfec-tion module. In this module LEDs with emission at 282 nm were used that had shown a slightly higher output power and less thermal roll-over than the 269 nm ones (see fig. 6). For this second illumination unit also a simple flow reactor had been de-signed. It can replace the Petri dish and has a potential flow rate of ~12 cm³/min. The flowing module is shown in Fig. 6b. It consists of aluminium with a milled water canal for a good reflection of the UV light. As window a 2 mm suprasil plate was used.

Development of UV-LED Disinfection © TECHNEAU - 14 - February, 2010
Fig. 9: a) UV LED water disinfection module generation II with control electronics. b) Optional flow module. c) Desing geometry of the flow module.
a) b)
Development of UV-LED Disinfection © TECHNEAU - 15 - February, 2010
5 UV-LED Disinfection Performance Tests
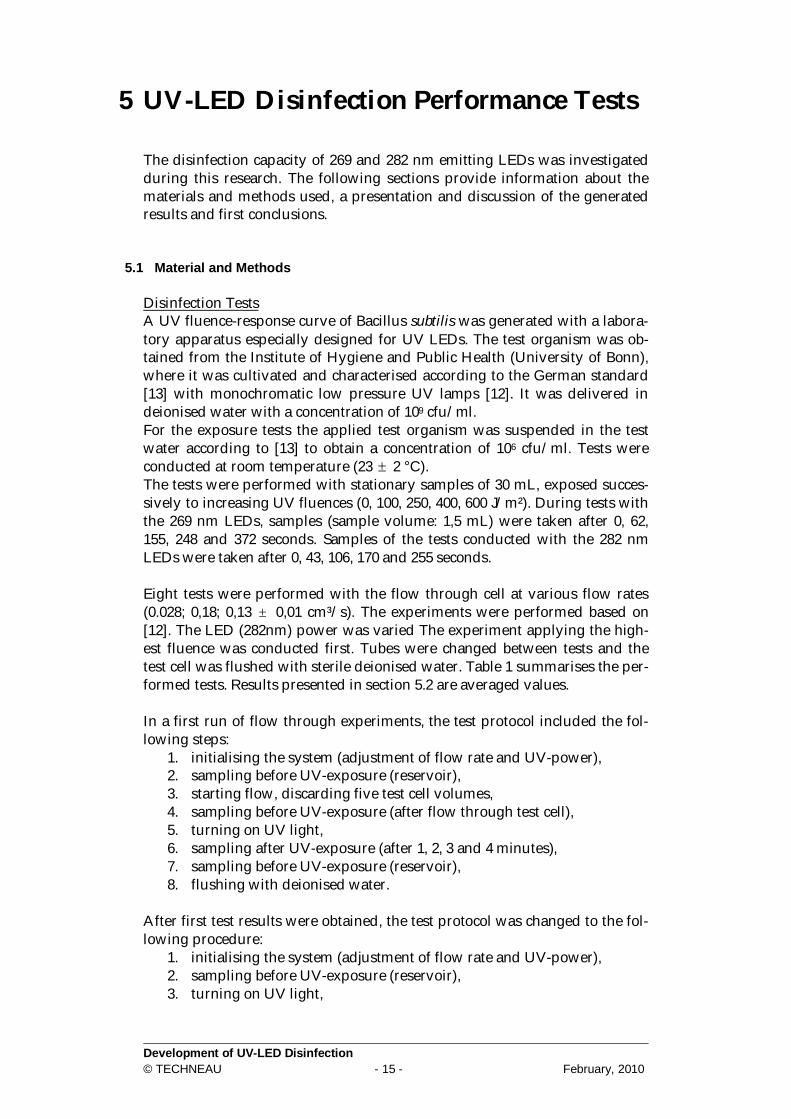
The disinfection capacity of 269 and 282 nm emitting LEDs was investigated during this research. The following sections provide information about the materials and methods used, a presentation and discussion of the generated results and first conclusions.
5.1 Material and Methods Disinfection Tests A UV fluence-response curve of Bacillus subtilis was generated with a labora-tory apparatus especially designed for UV LEDs. The test organism was ob-tained from the Institute of Hygiene and Public Health (University of Bonn), where it was cultivated and characterised according to the German standard [13] with monochromatic low pressure UV lamps [12]. It was delivered in deionised water with a concentration of 109 cfu/ml. For the exposure tests the applied test organism was suspended in the test water according to [13] to obtain a concentration of 106 cfu/ml. Tests were conducted at room temperature (23 2 °C). The tests were performed with stationary samples of 30 mL, exposed succes-sively to increasing UV fluences (0, 100, 250, 400, 600 J/m²). During tests with the 269 nm LEDs, samples (sample volume: 1,5 mL) were taken after 0, 62, 155, 248 and 372 seconds. Samples of the tests conducted with the 282 nm LEDs were taken after 0, 43, 106, 170 and 255 seconds. Eight tests were performed with the flow through cell at various flow rates (0.028; 0,18; 0,13 0,01 cm³/s). The experiments were performed based on [12]. The LED (282nm) power was varied The experiment applying the high-est fluence was conducted first. Tubes were changed between tests and the test cell was flushed with sterile deionised water. Table 1 summarises the per-formed tests. Results presented in section 5.2 are averaged values. In a first run of flow through experiments, the test protocol included the fol-lowing steps:
1. initialising the system (adjustment of flow rate and UV-power), 2. sampling before UV-exposure (reservoir), 3. starting flow, discarding five test cell volumes, 4. sampling before UV-exposure (after flow through test cell), 5. turning on UV light, 6. sampling after UV-exposure (after 1, 2, 3 and 4 minutes), 7. sampling before UV-exposure (reservoir), 8. flushing with deionised water.
After first test results were obtained, the test protocol was changed to the fol-lowing procedure:
1. initialising the system (adjustment of flow rate and UV-power), 2. sampling before UV-exposure (reservoir), 3. turning on UV light,
Development of UV-LED Disinfection © TECHNEAU - 16 - February, 2010
4. starting flow, discarding five test cell volumes, 5. sampling after UV-exposure (after 1, 2, 3 and 4 minutes), 6. sampling before UV-exposure (reservoir).
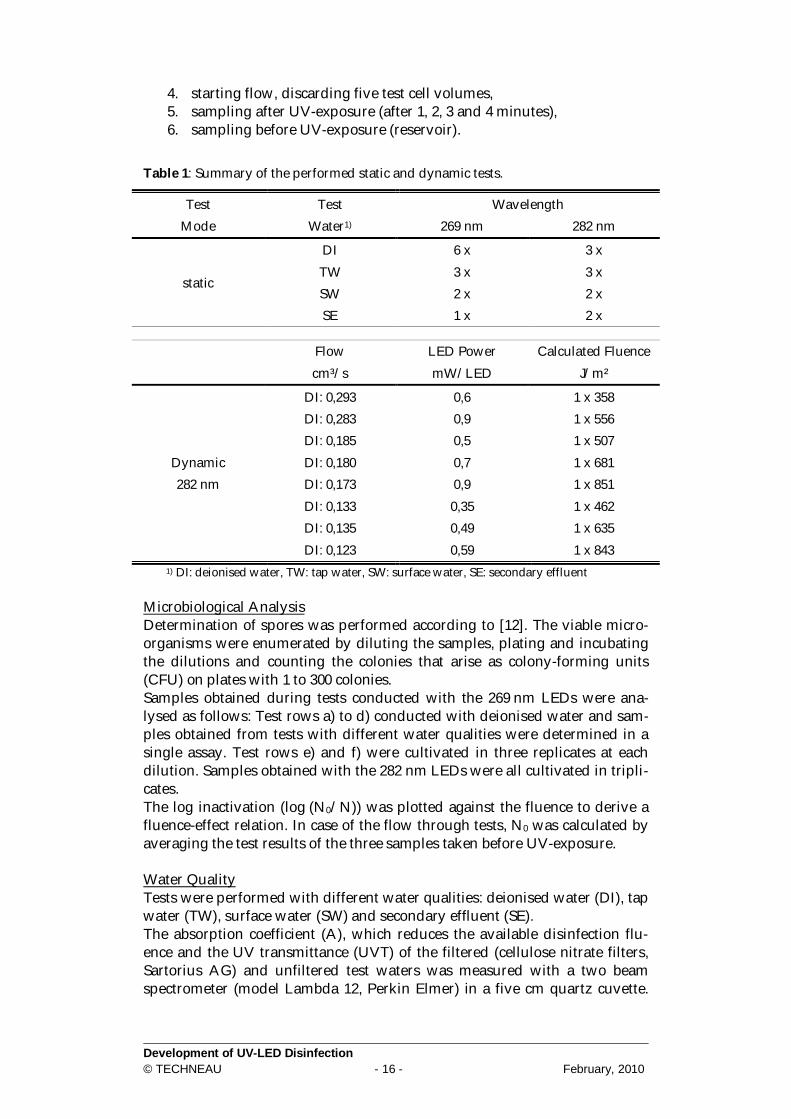
Table 1: Summary of the performed static and dynamic tests.
Test Mode
Test Water1)
Wavelength 269 nm 282 nm
static
DI 6 x 3 x TW 3 x 3 x SW 2 x 2 x SE 1 x 2 x
Flow LED Power Calculated Fluence cm³/s mW/LED J/m²
Dynamic 282 nm
DI: 0,293 0,6 1 x 358 DI: 0,283 0,9 1 x 556 DI: 0,185 0,5 1 x 507 DI: 0,180 0,7 1 x 681 DI: 0,173 0,9 1 x 851 DI: 0,133 0,35 1 x 462 DI: 0,135 0,49 1 x 635 DI: 0,123 0,59 1 x 843
1) DI: deionised water, TW: tap water, SW: surface water, SE: secondary effluent Microbiological Analysis Determination of spores was performed according to [12]. The viable micro-organisms were enumerated by diluting the samples, plating and incubating the dilutions and counting the colonies that arise as colony-forming units (CFU) on plates with 1 to 300 colonies. Samples obtained during tests conducted with the 269 nm LEDs were ana-lysed as follows: Test rows a) to d) conducted with deionised water and sam-ples obtained from tests with different water qualities were determined in a single assay. Test rows e) and f) were cultivated in three replicates at each dilution. Samples obtained with the 282 nm LEDs were all cultivated in tripli-cates. The log inactivation (log (N0/N)) was plotted against the fluence to derive a fluence-effect relation. In case of the flow through tests, N0 was calculated by averaging the test results of the three samples taken before UV-exposure. Water Quality Tests were performed with different water qualities: deionised water (DI), tap water (TW), surface water (SW) and secondary effluent (SE). The absorption coefficient (A), which reduces the available disinfection flu-ence and the UV transmittance (UVT) of the filtered (cellulose nitrate filters, Sartorius AG) and unfiltered test waters was measured with a two beam spectrometer (model Lambda 12, Perkin Elmer) in a five cm quartz cuvette.

Development of UV-LED Disinfection © TECHNEAU - 17 - February, 2010
The absorbance at 254 nm is relating to a one m path length. UV transmit-tance is defined as the percent transmittance in the medium when the path length is one cm and the wavelength is 254 nm. Since tests were performed with UV-LEDs emitting at 2692 and 282 nm, A and UVT were also determined for these wavelengths. The turbidity was measured with a turbidity meter (2100 N IS HACH). The detector, placed at 90° from the incident 860 nm beam, measured the scat-tered light. The sample was homogenised by shaking before every measure-ment. Table 2 summarises the measured water quality parameters.
Table 2: Water quality parameters (mean values) of the applied test waters.
Parameter Unit Deionised Water (DI)
Tap Water (TW)
Surface Water (SW)
Secondary Effluent (SE)
269 nm A1) (254) [1/m] 1.1 8.8 19.0 29.2
unfil
-te
red A (269) [1/m] n.a.3) 7.7 17.1 26.6
UVT2) (254) % 97.5 81.7 64.6 51.0
filte
red A (254) [1/m] 0.8 8.5 17.6 28.2
A (269) [1/m] n.a. 7.5 15.7 25.7
282 nm A1) (254) [1/m] 2,7 10,8 18,4 28,7
unfil
-te
red A (282) [1/m] 2,3 8,2 13,4 22,1
UVT2) (254) % 94,1 78,0 65,5 51,7
filte
red A (254) [1/m] 0,69 7,9 15,9 23,6
A (282) [1/m] 0,43 5,4 11,0 17,6
1) A: absorption coefficient 2) UVT: UV transmission 3) n.a.: not available
5.2 Results and Discussion The disinfection capacity of 269 and 282 nm emitting LEDs was investigated by running disinfection tests with deionised water on the specially designed UV-LED disinfection modules described in section 3. The obtained results were then compared to the inactivation response curve of a conventional col-limated beam apparatus to quantify the disinfection capacity of the UV LEDs. In order to verify the application of UV-LEDs for varying water disinfection applications, experiments were conducted with different water qualities and a bench-scale flow through cell. Static Tests with 269 nm LEDs and Deionised Water Microorganism inactivation tests were performed with arrays of UV LEDs emitting at 269 nm (test module I). Bacillus subtilis spores, suspended in de-ionised water, were used as test organism and exposed successively to UV
2 This wavelength was specified by the manufacturer. During this research a wavelength of 268 was determined, for the applied LEDs.
Development of UV-LED Disinfection © TECHNEAU - 18 - February, 2010
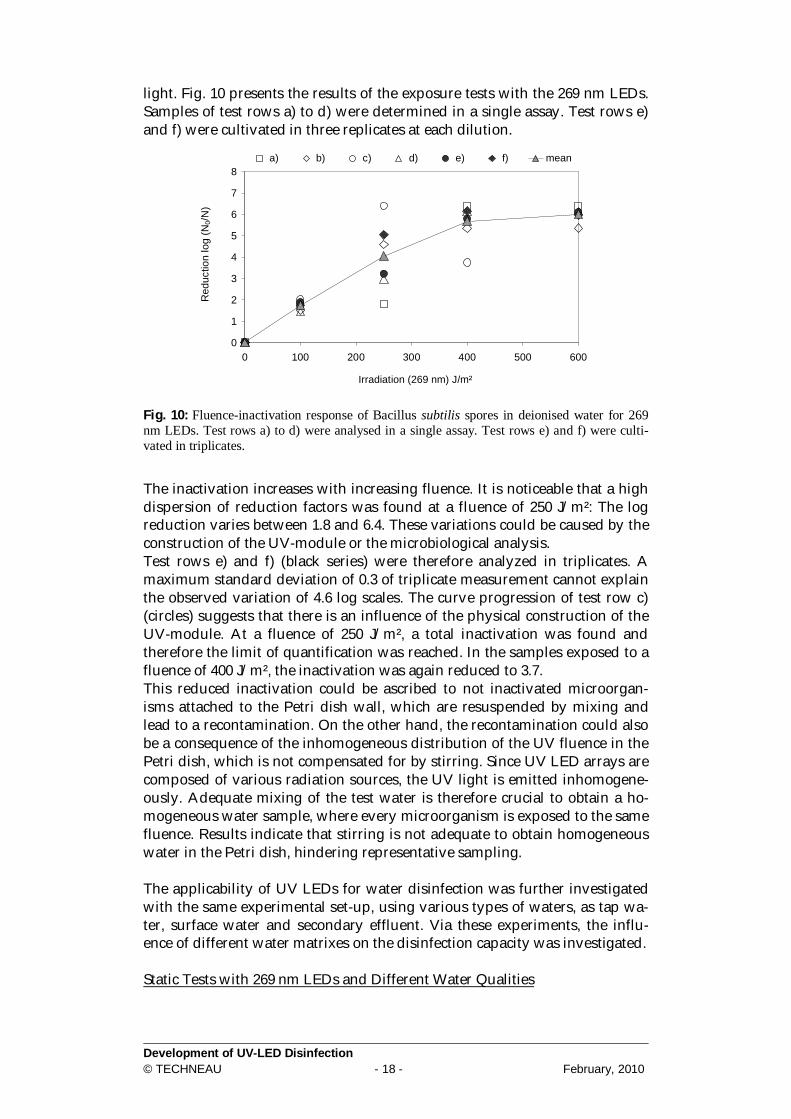
light. Fig. 10 presents the results of the exposure tests with the 269 nm LEDs. Samples of test rows a) to d) were determined in a single assay. Test rows e) and f) were cultivated in three replicates at each dilution.
0
1
2
3
4
5
6
7
8
0 100 200 300 400 500 600
Irradiation (269 nm) J/m²
Red
uctio
n lo
g (N
0/N)
a) b) c) d) e) f) mean
Fig. 10: Fluence-inactivation response of Bacillus subtilis spores in deionised water for 269 nm LEDs. Test rows a) to d) were analysed in a single assay. Test rows e) and f) were culti-vated in triplicates.
The inactivation increases with increasing fluence. It is noticeable that a high dispersion of reduction factors was found at a fluence of 250 J/m²: The log reduction varies between 1.8 and 6.4. These variations could be caused by the construction of the UV-module or the microbiological analysis. Test rows e) and f) (black series) were therefore analyzed in triplicates. A maximum standard deviation of 0.3 of triplicate measurement cannot explain the observed variation of 4.6 log scales. The curve progression of test row c) (circles) suggests that there is an influence of the physical construction of the UV-module. At a fluence of 250 J/m², a total inactivation was found and therefore the limit of quantification was reached. In the samples exposed to a fluence of 400 J/m², the inactivation was again reduced to 3.7. This reduced inactivation could be ascribed to not inactivated microorgan-isms attached to the Petri dish wall, which are resuspended by mixing and lead to a recontamination. On the other hand, the recontamination could also be a consequence of the inhomogeneous distribution of the UV fluence in the Petri dish, which is not compensated for by stirring. Since UV LED arrays are composed of various radiation sources, the UV light is emitted inhomogene-ously. Adequate mixing of the test water is therefore crucial to obtain a ho-mogeneous water sample, where every microorganism is exposed to the same fluence. Results indicate that stirring is not adequate to obtain homogeneous water in the Petri dish, hindering representative sampling. The applicability of UV LEDs for water disinfection was further investigated with the same experimental set-up, using various types of waters, as tap wa-ter, surface water and secondary effluent. Via these experiments, the influ-ence of different water matrixes on the disinfection capacity was investigated. Static Tests with 269 nm LEDs and Different Water Qualities
Development of UV-LED Disinfection © TECHNEAU - 19 - February, 2010
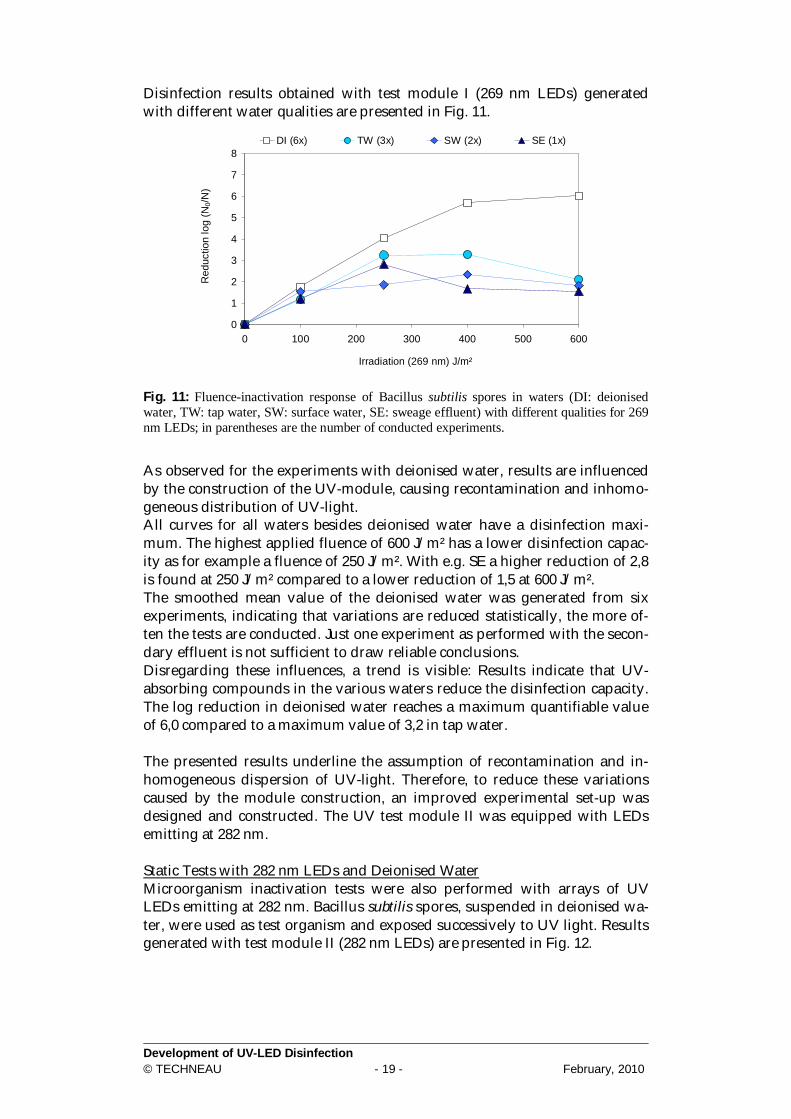
Disinfection results obtained with test module I (269 nm LEDs) generated with different water qualities are presented in Fig. 11.
0
1
2
3
4
5
6
7
8
0 100 200 300 400 500 600
Irradiation (269 nm) J/m²
Red
uctio
n lo
g (N
0/N)
DI (6x) TW (3x) SW (2x) SE (1x)
Fig. 11: Fluence-inactivation response of Bacillus subtilis spores in waters (DI: deionised water, TW: tap water, SW: surface water, SE: sweage effluent) with different qualities for 269 nm LEDs; in parentheses are the number of conducted experiments.
As observed for the experiments with deionised water, results are influenced by the construction of the UV-module, causing recontamination and inhomo-geneous distribution of UV-light. All curves for all waters besides deionised water have a disinfection maxi-mum. The highest applied fluence of 600 J/m² has a lower disinfection capac-ity as for example a fluence of 250 J/m². With e.g. SE a higher reduction of 2,8 is found at 250 J/m² compared to a lower reduction of 1,5 at 600 J/m². The smoothed mean value of the deionised water was generated from six experiments, indicating that variations are reduced statistically, the more of-ten the tests are conducted. Just one experiment as performed with the secon-dary effluent is not sufficient to draw reliable conclusions. Disregarding these influences, a trend is visible: Results indicate that UV-absorbing compounds in the various waters reduce the disinfection capacity. The log reduction in deionised water reaches a maximum quantifiable value of 6,0 compared to a maximum value of 3,2 in tap water. The presented results underline the assumption of recontamination and in-homogeneous dispersion of UV-light. Therefore, to reduce these variations caused by the module construction, an improved experimental set-up was designed and constructed. The UV test module II was equipped with LEDs emitting at 282 nm. Static Tests with 282 nm LEDs and Deionised Water Microorganism inactivation tests were also performed with arrays of UV LEDs emitting at 282 nm. Bacillus subtilis spores, suspended in deionised wa-ter, were used as test organism and exposed successively to UV light. Results generated with test module II (282 nm LEDs) are presented in Fig. 12.

Development of UV-LED Disinfection © TECHNEAU - 20 - February, 2010
0
1
2
3
4
5
6
7
8
0 100 200 300 400 500 600
Irradiation (282 nm) J/m²
Red
uctio
n lo
g (N
0/N)
a) b) c) mean
Fig. 12: Fluence-inactivation response of Bacillus subtilis spores in deionised water for 282 nm LEDs. Test rows were cultivated in triplicates.
The inactivation increases clearly with higher applied fluences. The maxi-mum variation between the test runs (0,5 log reduction) were in the same order of magnitude as the standard deviation of the triplicate analysis (0,4 log reduction). The test set-up of module II therefore admits more reproducible results than test module I, reducing influences of the physical construction. Static Tests with 282 nm LEDs and Different Water Qualities Disinfection results obtained with test module II (282 nm LEDs) generated with different water qualities are presented in Fig. 13.
0
1
2
3
4
5
6
7
8
0 100 200 300 400 500 600
Irradiation (282 nm) J/m²
Red
uctio
n lo
g (N
0/N)
DI (3x) TW (3x) SW (2x) SE (2x)
Fig. 13: Fluence-inactivation response of Bacillus subtilis spores in waters (DI: deionised water, TW: tap water, SW: surface water, SE: sewage effluent) with different qualities (UVT as representative parameter) for 282 nm LEDs; in parentheses are the numbers of conducted experiments.
The disinfection capacity is decreased with higher contents of UV-absorbing compounds. The highest difference was observed for DI, which is nearly free of UV-absorbing compounds (UVT 94,1 %), and TW, which contains UV-absorbing compounds (UVT 78,0 %). A further increase of absorbing com-
UVT [%] / cm DI: 94,1 TW: 78,0 SW: 65,5 SE: 51,7

Development of UV-LED Disinfection © TECHNEAU - 21 - February, 2010
pounds reduces the inactivation capacity; but the decrease is not linearly de-pendant on the concentration. Comparison of 269 and 282 nm LEDs Figure 14 presents the inactivation curves derived from the results obtained with the apparatus’ designed for UV LEDs.
y = 0,0117x - 0,3175R2 = 0,969
y = 0,0142x + 0,2038R2 = 0,9905
0
1
2
3
4
5
6
7
8
0 100 200 300 400 500 600
Irradiation J/m²
Red
uctio
n lo
g (N
0/N)
269 nm LEDs 282 nm LEDs
Fig. 14: Comparison of fluence-inactivation response of Bacillus subtilis spores in deionised water, obtained with the apparatus’ designed for UV LEDs.
The results indicate a higher disinfection capacity for the 269 nm LEDs than for the 282 nm LEDs. This enhanced disinfection capacity could be attributed to the higher germicidal effectiveness at this wavelength. Chen et al. [2009] published an absorption maximum of Bacillus subtilis spores at 270 nm. The inactivation performances of the UV-LEDs compared to a conventional mercury lamp are presented in Table 3. The results were calculated by linear regression of the fluence-inactivation response of Bacillus subtilis.
Table 3: Comparison of inactivation curves obtained with the apparatus’ designed for UV LEDs and a conventional bench-scale mercury lamp apparatus.
Fluence 269 nm UV LED 282 nm UV LED Mercury Lamp [J/m²] [log RF] [log RF] 0,2 [log RF] 0,1 100 1.6 0,2 0,9 0.8 250 3.7 1,4 2,7 1.9 400 5.8 0,7 4,5 2.9
When comparing the inactivation curves obtained with the UV LED-modules to the inactivation curve obtained with a conventional mercury UV bench-scale apparatus, higher inactivation results are obtained. It is noticeable that both UV LEDs perform better than the conventional mercury lamp. Accord-ing to Chen et al. [2009] the inactivation of Bacillus subtilis spores should be comparable at the wavelengths of 254 nm and 279 nm [3]. Various factors as for example the condition of the test suspension (agglom-erated spores), the fluence calculations and/or the different constructions of the LED-apparatus and the conventional apparatus might influence the test

Development of UV-LED Disinfection © TECHNEAU - 22 - February, 2010
results. Schoenen et al. (1994) investigated the influence of the set-up design on the inactivation kinetics of different microorganisms. They found that smallest differences in the irradiation geometry cause varia-tions of various orders of magnitude [14]. Experiments conducted with dif-ferent apparatus might therefore not be comparable. However, at this stage, a clear explanation for this much higher disinfection capacity, compared to the conventional UV-source still has to be investigated. Flow Through Tests with 282 nm LEDs and Deionised Water Dynamic tests were performed with a flow-through cell, to obtain first results for the applicability of UV LEDs under real conditions. The flow rate was adjusted to 0,28 0,01 cm³/s, 0,18 0,01 cm³/ and 0,13 0,01 cm³/, while the UV-LED power was varied (see 5.1). Results are presented in Figure 15.
0
1
2
3
4
5
6
7
8
0 100 200 300 400 500 600 700 800 900 1000
Irradiation (282 nm) J/m²
Red
uctio
n lo
g (N
0/N)
x-a) x-b) x-meany-a) y-b) y-c) y-meanz-a) z-b) z-c) z-mean
0,28 cm³/s0,18 cm³/s0,13 cm³/s
expected log reduction
y = 0,012 x -0,318
Fig. 15: Fluence-inactivation response of Bacillus subtilis spores in deionised water, obtained with the apparatus’ designed for 282 nm UV LEDs in static tests (expected log reduction) compared to results obtained during flow through tests.
As expected, the reduction equivalent fluence (REF) highly differs from the calculated fluence. The inactivation of Bacillus subtilis in the flow through test cell is much lower than in the static tests, theoretically applying the same flu-ence. This is a common phenomenon, when up-scaling UV-reactors and con-structing flow through reactors instead of static reactors. These results indi-cate that the flow conditions lead to areas of lower UV irradiation and short-circuiting in the flow through test cell, reducing the overall performance of the UV-LEDs. The considerably lower reduction in test run x could therefore possibly be ascribed to the higher flow-rate, which could have increased dead volumes, reducing the disinfection capacity. On the other hand, these results could also be caused by the test procedure. During test run x the spore suspension was passed through the test unit without turning on the UV-LEDs. The test cell was therefore flushed with Bacillus subtilis in a very high concentration (106 cfu/ml). Subsequently flushing the unit, while the UV-LEDs were turned on, could probably not avoid a contamination of the sample. For the following test runs y and z the test procedure was therefore adapted, to avoid contami-nation of the test cell before the start of the test run. Results show a better performance of the test runs y and z using the adapted procedure.

Development of UV-LED Disinfection © TECHNEAU - 23 - February, 2010
Results at high fluences around 850 J/m² cannot be evaluated, because of a high variation of the test results. This effect might be forced by experimental artefacts as e.g. spore clumping. However, an increase of the applied fluence leads to a higher inactivation, indicating a promising design of the UV LED configuration in the flow through cell.
5.3 Conclusions First test results indicate an effective inactivation of Bacillus subtilis spores through UV LEDs emitting at the wavelengths of 269 and 282 nm, even con-sidering the low optical power of the LEDs. However, water purification ap-plications, where water has to be disinfected within a few seconds, are still limited by long exposure times of up to 3 to 4 minutes.

Development of UV-LED Disinfection © TECHNEAU - 24 - February, 2010
6 Overall Conclusion and Perspectives
This report presented recent developments in the field on the UV-LED disin-fection. This technological field is very recent and further interests - along with rapid and continuing improvements in performance (especially in terms of emission power) – are expected within the next years. After the physical characterisation of the few UV-LEDs - at 269 and 282 nm - that are currently available on the market, their disinfecting action was to be measured via biodosimetric tests. They show an increase of the inactivation with an increasing fluence using different types of raw water, although some early static tests tend to highlight potential recontamination and inhomoge-neous distribution of UV-light – which may be explained by the module con-figuration. Main other results indicate that UV-absorbing compounds in the various waters reduce the disinfection capacity. Morevoer, a more effective disinfection is observed at 269 nm than at 282 nm for a similar fluence. However, the emission output is better with 282 nm - UV-LEDs. Therefore, an interesting aspect, worth being investigated in the future is to ensure an optimized configuration, which balances the input power, which is necessay to run the UV-LED module, and its disinfecting action. With potential enhanced emission powers, new developments for UV-LED water purification applications would enable to perform larger-scale tests and shorten UV exposure times.

Development of UV-LED Disinfection © TECHNEAU - 25 - February, 2010
7 References
1. Bolton, J.R., Calculation of ultraviolet fluence rate distributions in an annu-lar reactor: Significance of refraction and reflection. Water Research, 2000. 34(13): p. 3315-3324.
2. Bolton, J.R. and K.G. Linden, Standardization of methods for fluence (UV dose) determination in bench-scale UV experiments. Journal of Environ-mental Engineering-Asce, 2003. 129(3): p. 209-215.
3. Chen, R.Z., S.A. Craik, and J.R. Bolton, Comparison of the action spectra and relative DNA absorbance spectra of microorganisms: Information impor-tant for the determination of germicidal fluence (UV dose) in an ultraviolet disinfection of water. Water Research. In Press, Corrected Proof.
4. Bolton, J.R. and C.A. Cotton, The Ultraviolet Disinfection Handbook. 1 ed. 2008, Denver: American Water Works Association.
5. DVGW, Arbeitsblatt W 294-1: UV-Geräte zur Desinfektion in der Wasser-versorgung Teil 1: Anforderungen an Beschaffenheit, Funktion und Betrieb. 2003 a, Deutsche Vereinigung des Gas- und Wasserfaches, Bonn.
6. Vilhunen, S., H. Särkkä, and M. Sillanpää, Ultraviolet light-emitting diodes in water disinfection. Environmental Science and Pollution Re-search, 2009. 16(4): p. 439-442.
7. Crawford, M.H., M.A. Banas, M.P. Ross, D.S. Ruby, J.S. Nelson, R. Boucher, and A.A. Allerman, Final LDRD Report: Ultraviolet Water Pu-rification Systems for Rural Environments and Mobile Applications. 2005, Sandria National Laboratories: Albuquerque, New Mexico. p. 1-37.
8. Caron, E., G.C. Jr., B. Barbeau, P. Payment, and M. Prévost, Impact of microparticles on UV disinfection of indigenous aerobic spores. Water Re-search, 2007. 41: p. 4546-4556.
9. MWH, Water Treatment: Principles and Design 2nd ed. 2005, Hoboken, NJ: John Wiley & Sons, Inc.
10. Blatchley, E.R., C. Shen, O.K. Scheible, J.P. Robinson, K. Ragheb, D.E. Bergstrom, and D. Rokjer, Validation of large-scale, monochromatic UV disinfection systems for drinking water using dyed microspheres. Water Re-search, 2008. 42(3): p. 677-688.
11. Qualls, R.G. and J.D. Johnson, Bioassay and Dose Measurement in UV Disinfection. Applied and Environmental Microbiology, 1983. 45(3): p. 872-877.
12. DVGW, Arbeitsblatt W 294-2: UV-Geräte zur Desinfektion in der Wasser-versorgung Teil 2: Prüfung von Beschaffenheit, Funktion und Desinfekti-onswirkung. 2003 b, Deutsche Vereinigung des Gas- und Wasserfaches, Bonn.
13. DVGW, Arbeitsblatt W 294-3: UV-Geräte zur Desinfektion in der Wasser-versorgung Teil 3: Messfenster und Sensoren zur radiometrischen Überwa-chung von UV-Desinfektionsgeräten - Anforderungen, Prüfung und Kali-brierung. 2003 c, Deutsche Vereinigung des Gas- und Wasserfaches, Bonn.
14. Schoenen, D., J. Gebel, A. Kolch, O. Hoyer, R. Sommer, A. Cabaj, P. Karanis, W. Maier, H.M. Seitz, A. Wiedenmann, T. Hahn, and K. Botzenhart, F + E Verbundvorhaben: Untersuchungen zur Sicherheit des technischen Einsatzes von UV-Strahlen zur Trinkwasserdesinfektion - Mik-
Development of UV-LED Disinfection © TECHNEAU - 26 - February, 2010
robiologische Untersuchungen zur UV-Desinfektion von Trinkwasser. 1994, Arbeitsgemeinschaft Trinkwasser Talsperren e.V. : Siegburg.

Development of UV-LED Disinfection © TECHNEAU - 27 - February, 2010
8 Annex
Fig. A. 1: Typical angular diagram of the UV LEDs. The following tables summarize the results obtained with test module I equipped with 269 nm LEDs.
Table A. 1: Results obtained with 269 nm LEDs in static tests with deionised water (DI). Bacillus subtilis analysis of test run a) to d) were conducted in a single assay. Test run e) and f) were analised in triplicates.
Fluence test run a) test run b) test run c) test run d) [J/m²] [cfu/ml] [cfu/ml] [cfu/ml] [cfu/ml]
0 2300000 230000 2500000 1400000 100 39000 7100 24000 48000 250 35000 6 n.d. 1500 400 n.d. n.d. 450 n.d. 600 n.d. n.d. 2 n.d.
Fluence test run e) [J/m²] [cfu/ml] [cfu/ml] [cfu/ml]
0 1200000 1400000 1100000 100 20000 11000 16000 250 1200 500 500 400 4 n.d. 2 600 n.d. n.d. n.d.
Fluence test run f) [J/m²] [cfu/ml] [cfu/ml] [cfu/ml]
0 880000 1000000 1000000 100 17000 17000 16000 250 8 10 8 400 2 n.d. n.d. 600 n.d. n.d. n.d.
n.d.: not detectable
Development of UV-LED Disinfection © TECHNEAU - 28 - February, 2010
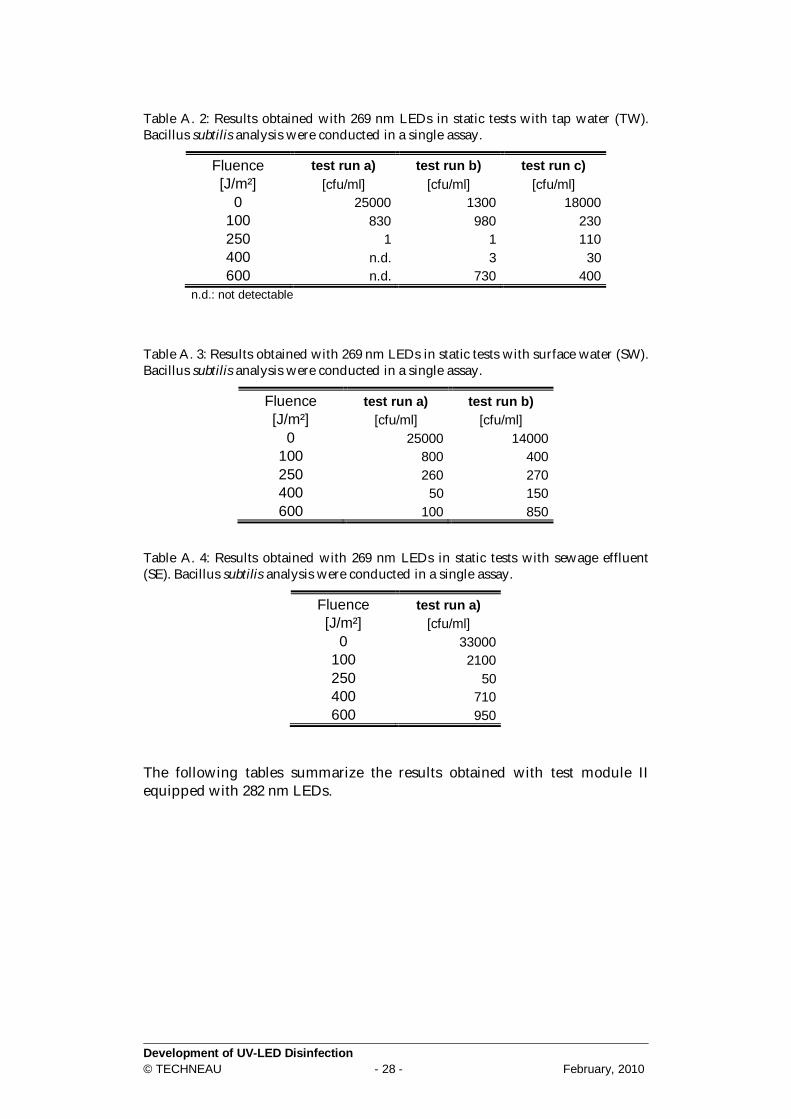
Table A. 2: Results obtained with 269 nm LEDs in static tests with tap water (TW). Bacillus subtilis analysis were conducted in a single assay.
Fluence test run a) test run b) test run c) [J/m²] [cfu/ml] [cfu/ml] [cfu/ml]
0 25000 1300 18000 100 830 980 230 250 1 1 110 400 n.d. 3 30 600 n.d. 730 400
n.d.: not detectable
Table A. 3: Results obtained with 269 nm LEDs in static tests with surface water (SW). Bacillus subtilis analysis were conducted in a single assay.
Fluence test run a) test run b) [J/m²] [cfu/ml] [cfu/ml]
0 25000 14000 100 800 400 250 260 270 400 50 150 600 100 850
Table A. 4: Results obtained with 269 nm LEDs in static tests with sewage effluent (SE). Bacillus subtilis analysis were conducted in a single assay.
Fluence test run a) [J/m²] [cfu/ml]
0 33000 100 2100 250 50 400 710 600 950
The following tables summarize the results obtained with test module II equipped with 282 nm LEDs.
Development of UV-LED Disinfection © TECHNEAU - 29 - February, 2010
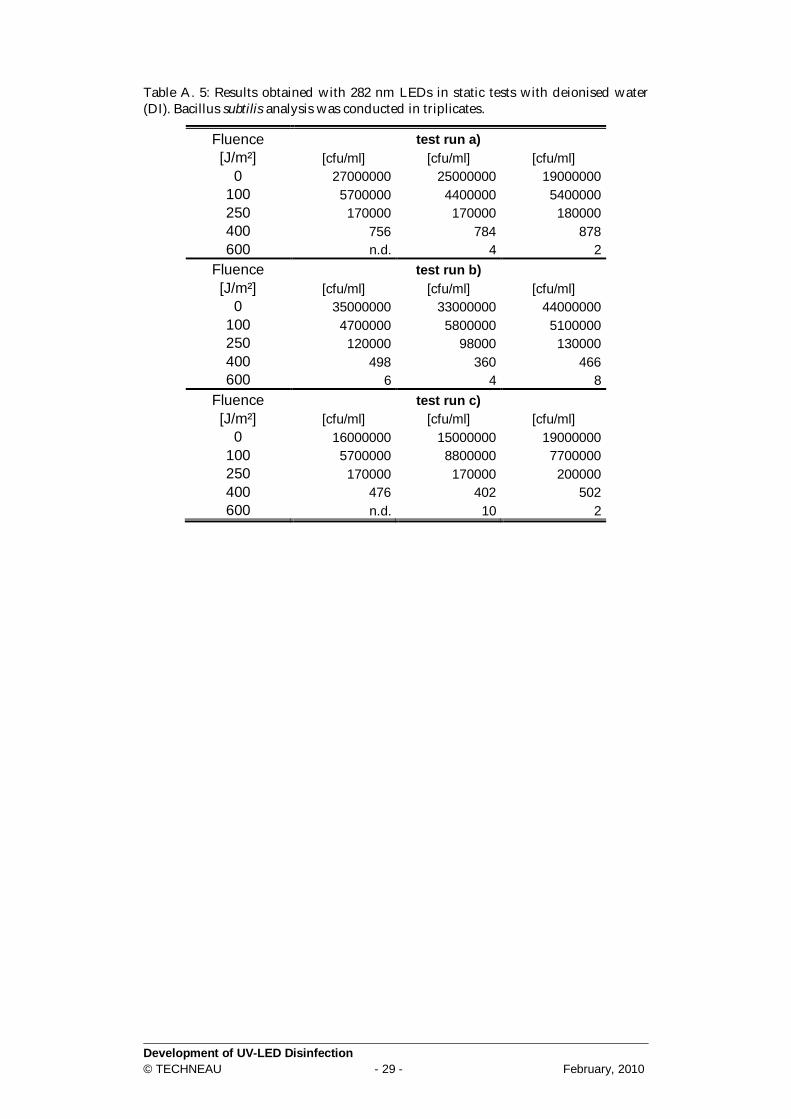
Table A. 5: Results obtained with 282 nm LEDs in static tests with deionised water (DI). Bacillus subtilis analysis was conducted in triplicates.
Fluence test run a) [J/m²] [cfu/ml] [cfu/ml] [cfu/ml]
0 27000000 25000000 19000000 100 5700000 4400000 5400000 250 170000 170000 180000 400 756 784 878 600 n.d. 4 2
Fluence test run b) [J/m²] [cfu/ml] [cfu/ml] [cfu/ml]
0 35000000 33000000 44000000 100 4700000 5800000 5100000 250 120000 98000 130000 400 498 360 466 600 6 4 8
Fluence test run c) [J/m²] [cfu/ml] [cfu/ml] [cfu/ml]
0 16000000 15000000 19000000 100 5700000 8800000 7700000 250 170000 170000 200000 400 476 402 502 600 n.d. 10 2

Development of UV-LED Disinfection © TECHNEAU - 30 - February, 2010
Table A. 6: Results obtained with 282 nm LEDs in static tests with tap water (TW). Bacillus subtilis analysis was conducted in triplicates.
Fluence test run a) [J/m²] [cfu/ml] [cfu/ml] [cfu/ml]
0 1500000 1100000 1300000 100 1000000 820000 800000 250 33000 24000 37000 400 624 984 756 600 32 20 24
Fluence test run b) [J/m²] [cfu/ml] [cfu/ml] [cfu/ml]
0 1100000 1300000 2100000 100 500000 640000 710000 250 38000 45000 47000 400 536 400 506 600 10 14 8
Fluence test run c) [J/m²] [cfu/ml] [cfu/ml] [cfu/ml]
0 1600000 1500000 1300000 100 800000 760000 590000 250 57000 41000 54000 400 256 52 236 600 6 14 16
Table A. 7: Results obtained with 282 nm LEDs in static tests with surface water (SW). Bacillus subtilis analysis was conducted in triplicates.
Fluence test run a) [J/m²] [cfu/ml] [cfu/ml] [cfu/ml]
0 1800000 2100000 2100000 100 470000 630000 540000 250 28000 33000 29000 400 2600 2900 3000 600 60 54 58
Fluence test run b) [J/m²] [cfu/ml] [cfu/ml] [cfu/ml]
0 1100000 2500000 1900000 100 1000000 1400000 1100000 250 48000 44000 43000 400 4100 4000 4100 600 104 164 130
Development of UV-LED Disinfection © TECHNEAU - 31 - February, 2010
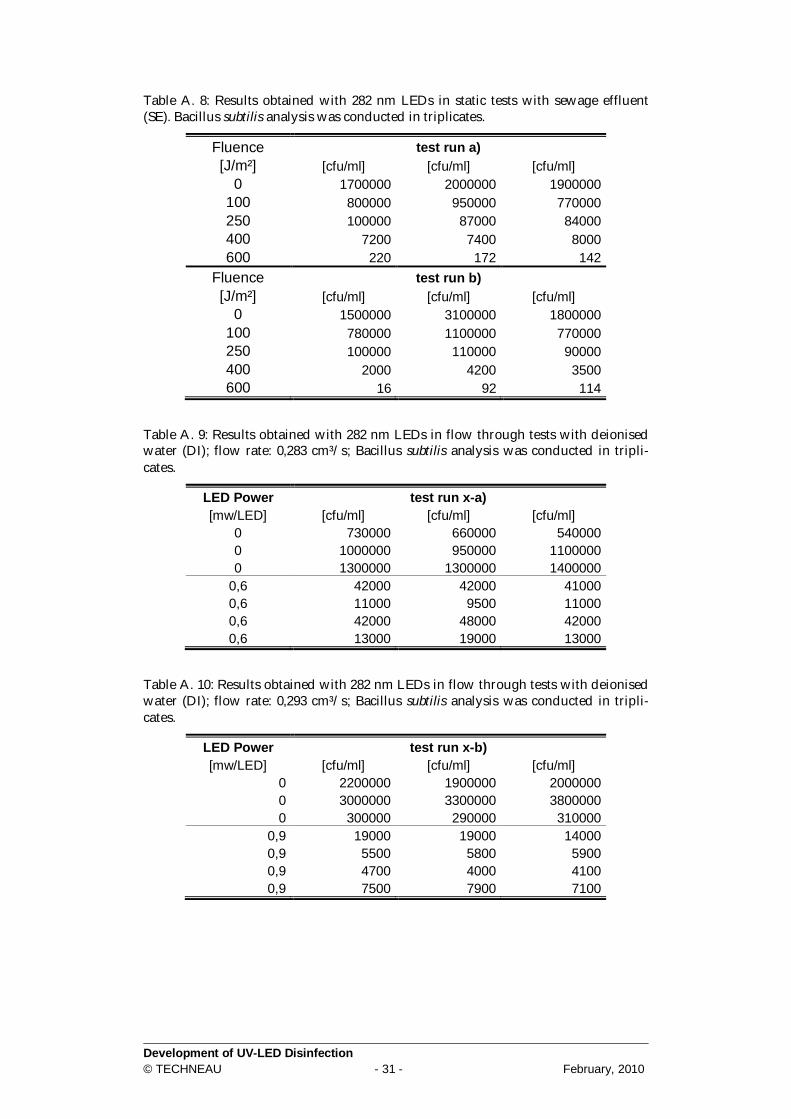
Table A. 8: Results obtained with 282 nm LEDs in static tests with sewage effluent (SE). Bacillus subtilis analysis was conducted in triplicates.
Fluence test run a) [J/m²] [cfu/ml] [cfu/ml] [cfu/ml]
0 1700000 2000000 1900000 100 800000 950000 770000 250 100000 87000 84000 400 7200 7400 8000 600 220 172 142
Fluence test run b) [J/m²] [cfu/ml] [cfu/ml] [cfu/ml]
0 1500000 3100000 1800000 100 780000 1100000 770000 250 100000 110000 90000 400 2000 4200 3500 600 16 92 114
Table A. 9: Results obtained with 282 nm LEDs in flow through tests with deionised water (DI); flow rate: 0,283 cm³/s; Bacillus subtilis analysis was conducted in tripli-cates.
LED Power test run x-a) [mw/LED] [cfu/ml] [cfu/ml] [cfu/ml]
0 730000 660000 540000 0 1000000 950000 1100000 0 1300000 1300000 1400000
0,6 42000 42000 41000 0,6 11000 9500 11000 0,6 42000 48000 42000 0,6 13000 19000 13000
Table A. 10: Results obtained with 282 nm LEDs in flow through tests with deionised water (DI); flow rate: 0,293 cm³/s; Bacillus subtilis analysis was conducted in tripli-cates.
LED Power test run x-b) [mw/LED] [cfu/ml] [cfu/ml] [cfu/ml]
0 2200000 1900000 2000000 0 3000000 3300000 3800000 0 300000 290000 310000
0,9 19000 19000 14000 0,9 5500 5800 5900 0,9 4700 4000 4100 0,9 7500 7900 7100
Development of UV-LED Disinfection © TECHNEAU - 32 - February, 2010
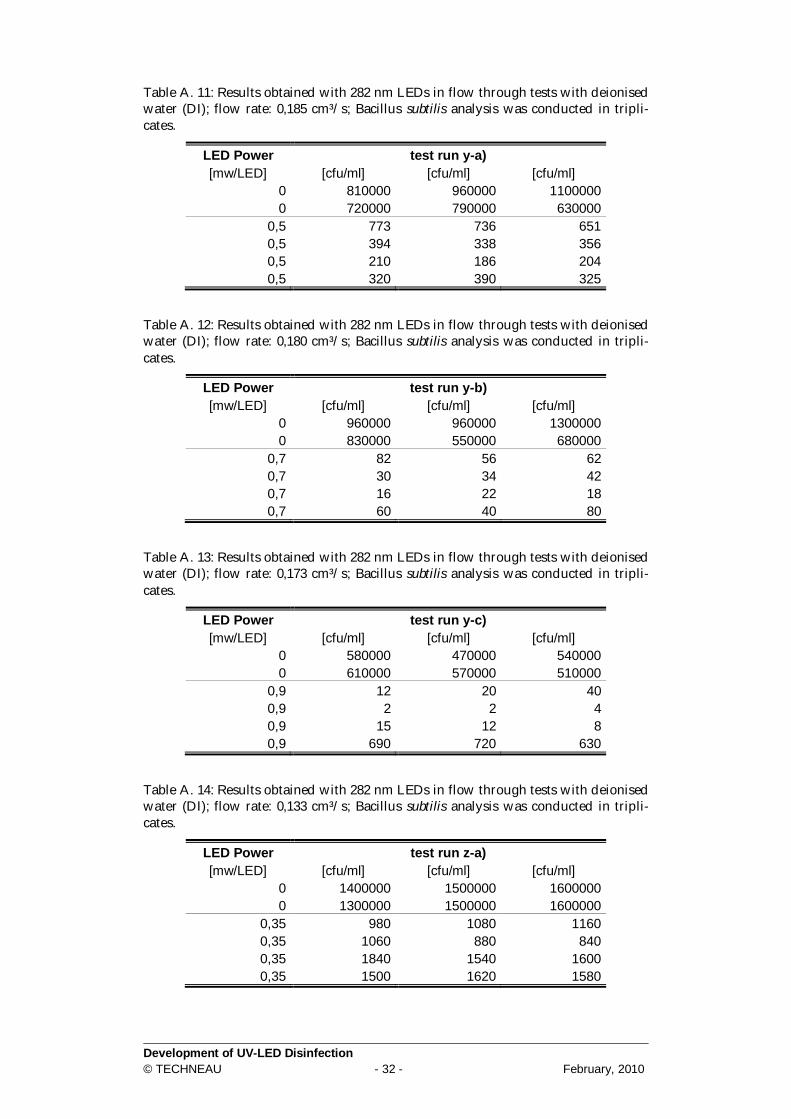
Table A. 11: Results obtained with 282 nm LEDs in flow through tests with deionised water (DI); flow rate: 0,185 cm³/s; Bacillus subtilis analysis was conducted in tripli-cates.
LED Power test run y-a) [mw/LED] [cfu/ml] [cfu/ml] [cfu/ml]
0 810000 960000 1100000 0 720000 790000 630000
0,5 773 736 651 0,5 394 338 356 0,5 210 186 204 0,5 320 390 325
Table A. 12: Results obtained with 282 nm LEDs in flow through tests with deionised water (DI); flow rate: 0,180 cm³/s; Bacillus subtilis analysis was conducted in tripli-cates.
LED Power test run y-b) [mw/LED] [cfu/ml] [cfu/ml] [cfu/ml]
0 960000 960000 1300000 0 830000 550000 680000
0,7 82 56 62 0,7 30 34 42 0,7 16 22 18 0,7 60 40 80
Table A. 13: Results obtained with 282 nm LEDs in flow through tests with deionised water (DI); flow rate: 0,173 cm³/s; Bacillus subtilis analysis was conducted in tripli-cates.
LED Power test run y-c) [mw/LED] [cfu/ml] [cfu/ml] [cfu/ml]
0 580000 470000 540000 0 610000 570000 510000
0,9 12 20 40 0,9 2 2 4 0,9 15 12 8 0,9 690 720 630
Table A. 14: Results obtained with 282 nm LEDs in flow through tests with deionised water (DI); flow rate: 0,133 cm³/s; Bacillus subtilis analysis was conducted in tripli-cates.
LED Power test run z-a) [mw/LED] [cfu/ml] [cfu/ml] [cfu/ml]
0 1400000 1500000 1600000 0 1300000 1500000 1600000
0,35 980 1080 1160 0,35 1060 880 840 0,35 1840 1540 1600 0,35 1500 1620 1580
Development of UV-LED Disinfection © TECHNEAU - 33 - February, 2010
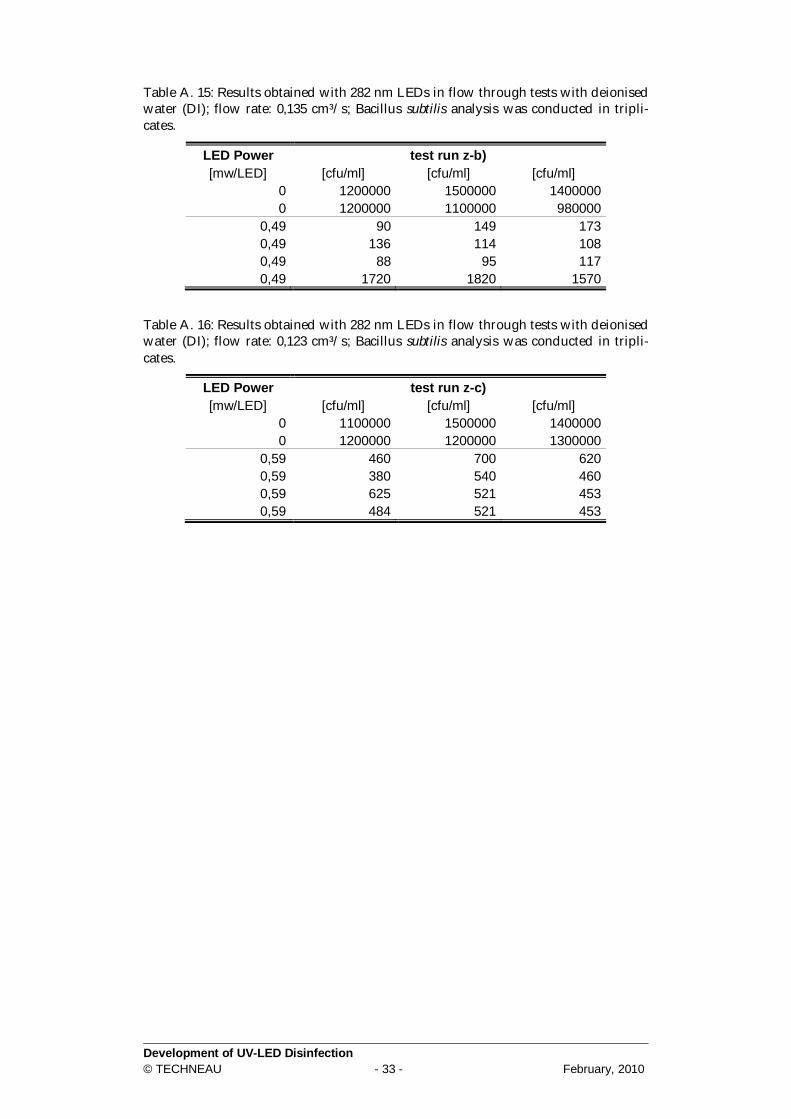
Table A. 15: Results obtained with 282 nm LEDs in flow through tests with deionised water (DI); flow rate: 0,135 cm³/s; Bacillus subtilis analysis was conducted in tripli-cates.
LED Power test run z-b) [mw/LED] [cfu/ml] [cfu/ml] [cfu/ml]
0 1200000 1500000 1400000 0 1200000 1100000 980000
0,49 90 149 173 0,49 136 114 108 0,49 88 95 117 0,49 1720 1820 1570
Table A. 16: Results obtained with 282 nm LEDs in flow through tests with deionised water (DI); flow rate: 0,123 cm³/s; Bacillus subtilis analysis was conducted in tripli-cates.
LED Power test run z-c) [mw/LED] [cfu/ml] [cfu/ml] [cfu/ml]
0 1100000 1500000 1400000 0 1200000 1200000 1300000
0,59 460 700 620 0,59 380 540 460 0,59 625 521 453 0,59 484 521 453