d. enard - european southern observatory · design of the coude echelle spectrometer for the eso...
TRANSCRIPT
DESIGN OF THECOUDE ECHELLE SPECTROMETER
FOR THE ESO 3.6 mAND CAT TELESCOPES
D. ENARD

This report is published by the
European Southern Observatory
Telescope Project Division
c/o CER N
1211 Geneva 23
Switzerland
The European Southern Observatory (ESO) is the result of a
scientific collaboration for astronomical research in the Southern
Hemisphere between the six member countries, Belgium, Denmark,
Federal Republik of Germany, France, Netherlands and Sweden.
Copyright © ESO 1979
DESIGN OF THE COUDE ECHELLE SPECTROMETER
FOR THE ESO 3.6 m AND CAT TELESCOPES
D. ENARD
SEPTEMBER 1979

A B S T R A C T
The Coude Echelle Spectrometer for the ESO 3.6 m telescope was
designed as an integral part of the existing and planned spectroscopic
instrumentation of the 3.6 m and the other telescopes on La Silla. It
will provide facilities for spectroscopic observation at very high
spectral resolutions, with the additional features of good photometrie
accuracy and a clean instrumental profile. Since it can be used together
with the 1.4 m Coude Auxiliary Telescope as weil as with the 3.6 m
itself, it is expected to be in year-round operation.
The spectrometer is based on a 20 cm echelle grating with
79 lines/mm, blazed at 63026'. Order separation is effected by a prism
pre-monochromator. In order to minimize reflection losses two
completely separate optical paths are provided, each with its own
monochromator and optimized for the blue and red, respectively. The
main use of the spectrometer is expected to be in the multichannel
mode, where an f/S camera gives a fixed maximum resolution of 100 000
( 40 mR) when used with single-row, 1872-element DIGICON (UV-visual)
or cooled RETICON (red-infrared) array detectors. Considerable
flexibility in the choice of resolution, spectral range, and detector
sensitivity is achieved in the scanning mode, where an f/30 camera in
a straightforward Czerny-Turner arrangement focuses the spectrum onto
an exit slit, where various types of photomultiplier may be used as a
detector. In the scanning mode, tilting a single optical element
changes the instrument into a true double-pass spectrometer, an inter
mediate slit blocking off the faint outer extensions of the single
pass instrumental profile. Scanning is accomplished by rotating the
grating on a high-precision, air-bearing turn-table, with possible
scanning frequencies up to S Hz for optimum elimination of seeing
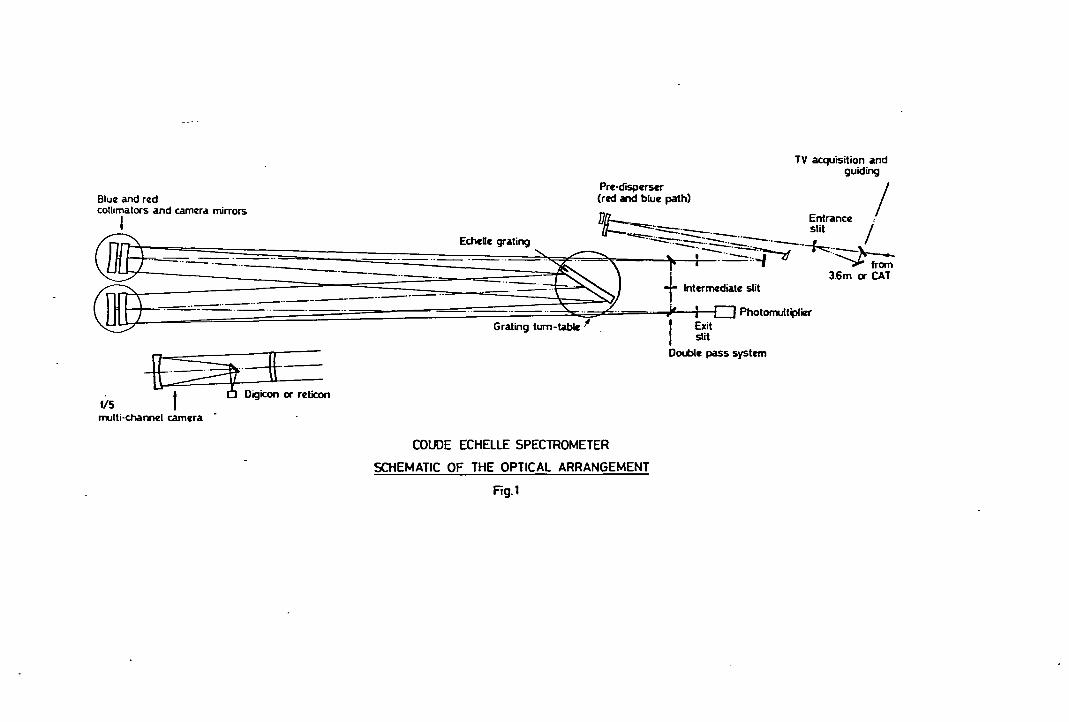
variations. Figs. 1 and 2 show the optical schematic of the instrument.
The instrument is thus expected to meet the most stringent demands of
modern model atmosphere, spectrum synthesis, and detailed abundance
analysis techniques with regard to resolution, spectral purity, and
photometrie aeeuracy, but it should at the same time be a versatile
tool for a wide range of speetroseopie observing programmes. The
estimated limiting magnitude for a l-hour integration in the multi-m
ehannel mode (with the DIGICON) is about 9 , assuming a photometrie
aeeuraey in the eontinuum of 3% per ehannel.
The whole speetrometer is eomputer-eontrolled, and an effort is
made in designing the software to keep routine operation as simple and
eonvenient as possible while retaining the option of non-standard
modes of use. Onee a few parameters have been entered, normal
operation of the instrument or the versatile eontrols for the on-line
display of the ineoming data should be earried out mainly by means
of a few push-buttons, keeping night-time typing to aminimum.
C 0 N T E N T S
5. MULTICHANNEL MODE
3. ORDER SEPARATION - PRE-DISPERSER
4. SPECTROMETER - SCANNER
INTRODUCTION
1. TELESCOPE" ADAPTATION - CAT FOCAL REDUCERS
2 • ENTRANCE SLIT AND SLIT ENV IRONMENT
5.1 Choice of the detector
5.2 Optimization of the camera aperture
5.3 Camera
5.4 Digicon
1
3
4
4
6
7
7
7
8
11
11
15
15
15
16
17
18
18
18
20
21
22
22
23
23
24
25
26
Basic geometrical data
Dispersion
Optica1 quali ty
Requirements
Description
Operation
Performances
Princip1e
Optica1 data of scanner
Detector
System performances
Spectral resolution
Grating turn-tab1e
2.1 Acquisition and s1it viewing
2.2 Ca1ibration
2.3 Sli t
2.4 Decker
2.5 Image s1icers
4.1
4.2
4.2.1
4.2.2
4.2.3
4.3
4.4
4.4.1
4.4.2
4.4.3
4.4.4
4.5
4.6
5.4.1 Description
5.4.2 Predicted Digicon performances
5.5 Reticon
5.5.1 Description
5.5.2 Performances
6. CONTROL AND INSTRUMENT OPERATION
RELATIVE EFFICIENCIES OF DIFFERENT OPTICAL ARRANGEMENTS(ANNEX 1)
HIGH EFFICIENCY COATIN3S (ANNEX 2)
26
27
29
29
29
30
35
37
- 1 -
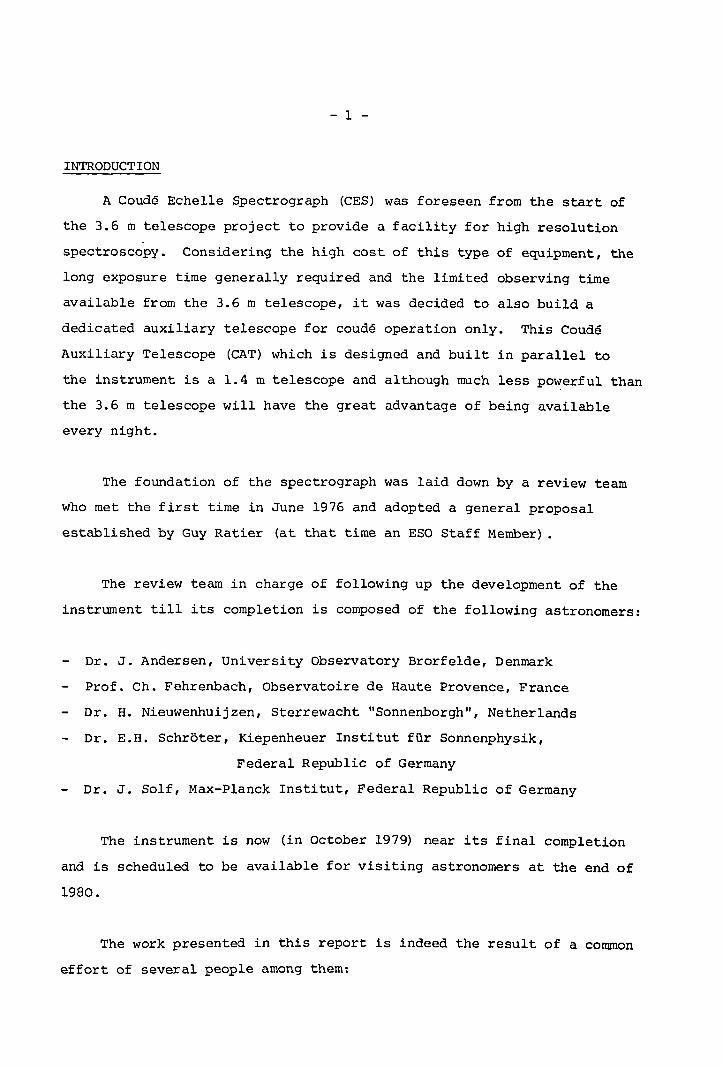
INTRODUCTION
A Coude Echelle Spectrograph (CES) was foreseen from the start of
the 3.6 m telescope project to provide a facility for high resolution
spectroscopy. Considering the high cost of this type of equipment, the
long exposure time generally required and the limited observing time
available from the 3.6 m telescope, it was decided to also build a
dedicated auxiliary telescope for coude operation only. This Coude
Auxiliary Telescope (CAT) which is designed and built in parallel to
the instrument is a 1.4 m telescope and although much less powerfu1 than
the 3.6 m telescope will have the great advantage of being avai1ab1e
every night.
The foundation of the spectrograph was laid down by a review team
who met the first time in June 1976 and adopted a general proposal
estab1ished by Guy Ratier (at that time an ESO Staff Member) .
The review team in charge of fo11owing up the development of the
instrument ti1l its comp1etion is composed of the fo1lowing astronomers:
Dr. J. Andersen, University Observatory Brorfelde, Denmark
Prof. Ch. Fehrenbach, Observatoire de Haute Provence, France
Dr. H. Nieuwenhuijzen, Sterrewacht "Sonnenborgh", Nether1ands
Dr. E.H. Schröter, Kiepenheuer Institut für Sonnenphysik,
Federal Repub1ic of Germany
Dr. J. Solf, Max-P1anck Institut, Federal Repub1ic of Germany
The instrument is now (in October 1979) near its final comp1etion
and is scheduled to be availab1e for visiting astronomers at the end of
1980.
The work presented in this report is indeed the result of a common
effert ef severa1 peep1e among them:
- 2 -
B. Amrhein, responsible for the electronics,
R. Clop, responsible for the mechanics,
M. Le Luyer, responsible for the optical calculation,
P. Rossignol, responsible for the software.
Although it is difficult to mention all those who also participated
in the project one should also cite B. Forel, F. Franza, M. Wensveen
and also thanks to the astronomers who have a particularly long
experience with this type of instrument and from whom very much was
learned:
Dr. A. Baranne, Observatoire de Marseille, France
Dr. E. Richardson, Dominion Astrophysical Observatory, Victoria,
Canada
Dr. R.G. Tull, University of Texas, USA
- 3 -
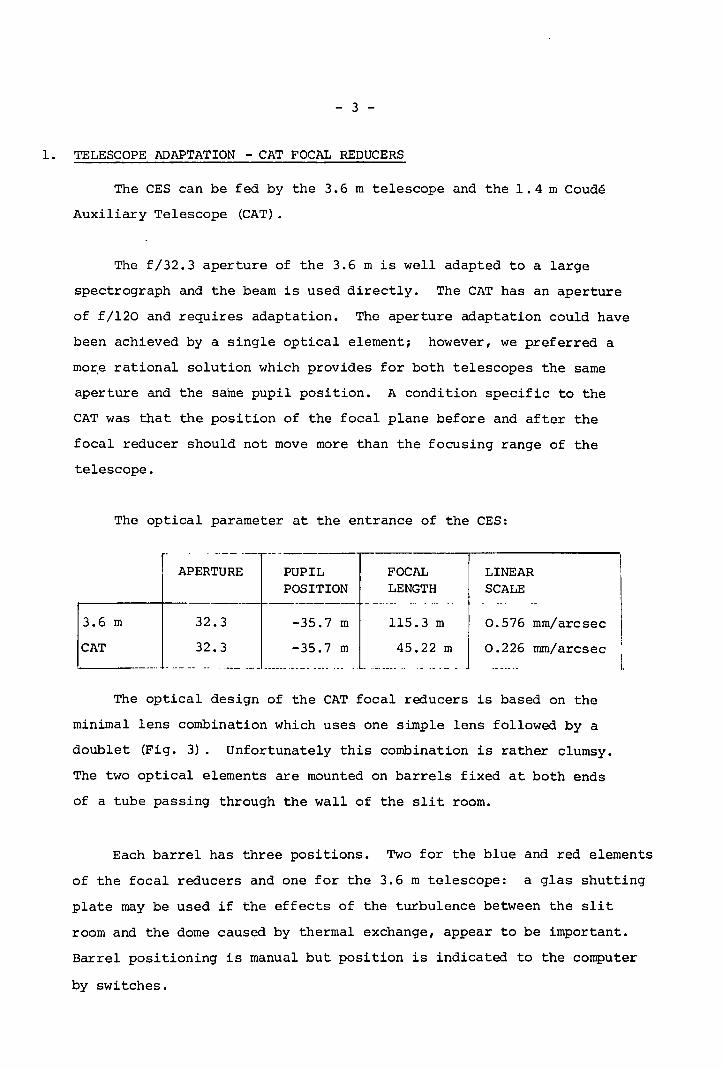
1. TELESCOPE ADAPTATION - CAT FOCAL REDUCERS
The CES can be fed by the 3.6 m telescope and the 1.4 m Coude
Auxiliary Telescope (CAT).
The f/32.3 aperture of the 3.6 m is well adapted to a large
spectrograph and the beam is used directly. The CAT has an aperture
of f/120 and requires adaptation. The aperture adaptation could have
been achieved by a single optical element; however, we preferred a
mo~e rational solution which provides for both telescopes the same
aperture and the same pupil position. A condition specific to the
CAT was that the position of the focal plane before and after the
focal reducer should not move more than the focusing range of the
telescope.
The optical parameter at the entrance of the CES:
. ~._&_.- ---------APERTURE PUPIL FOCAL LINEAR
POSITION LENGTH SCALE---------_. --- - -- --- .-
3.6 m 32.3 -35.7 m 115.3 m 0.576 mm/arcsec
CAT 32.3 -35.7 m 45.22 m 0.226 mm/arcsec
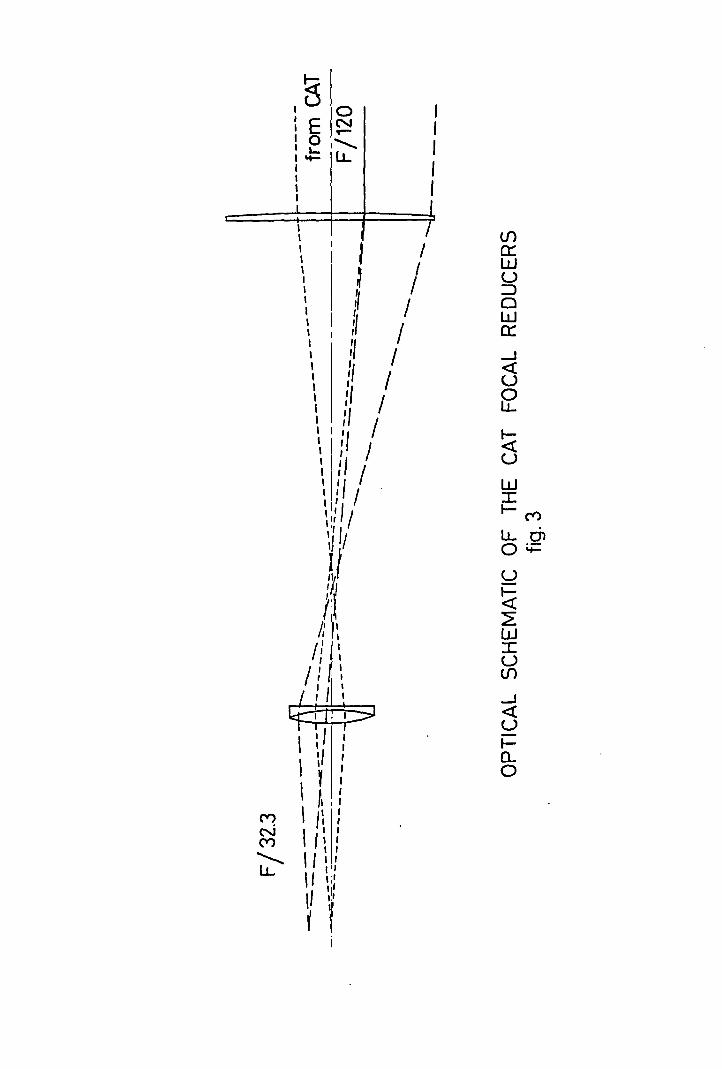
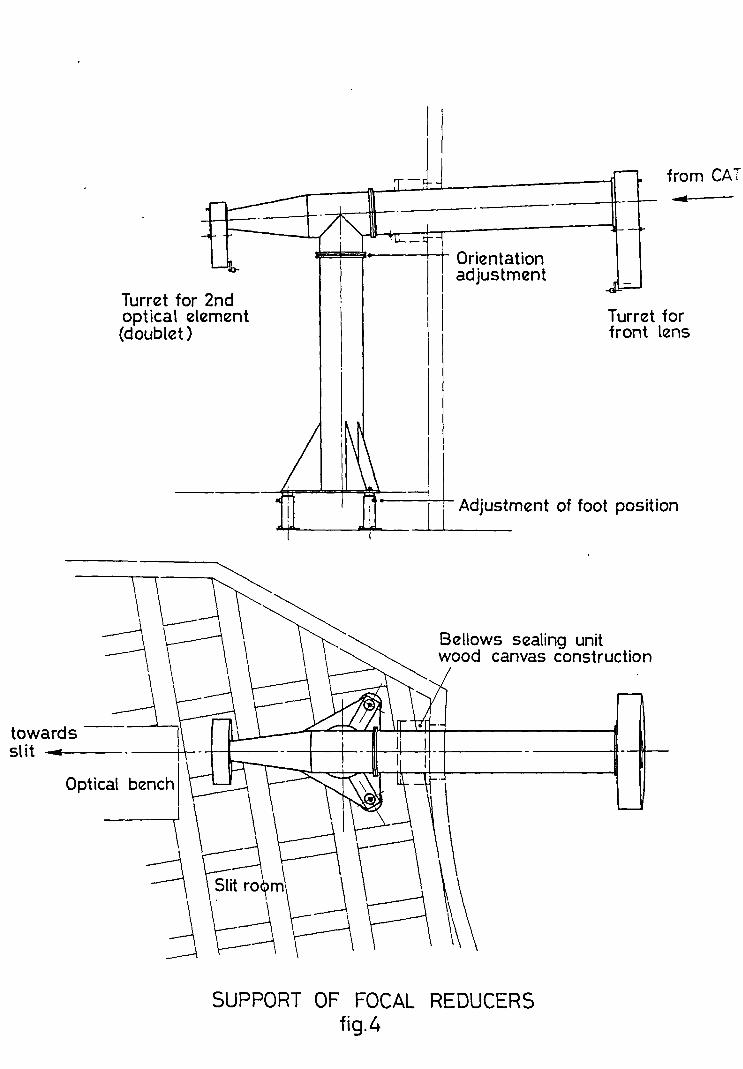
The optical design of the CAT focal reducers is based on the
minimallens combination which uses one simple lens followed by a
doublet (Fig. 3). Unfortunately this combination is rather clumsy.
The two optical elements are mounted on barrels fixed at both ends
of a tube passing through the wall of the slit room.
Each barrel has three positions. Two for the blue and red elements
of the focal reducers and one for the 3.6 m telescope: a glas shutting
plate may be used if the effects of the turbulence between the slit
room and the dome caused by thermal exchange, appear to be important.
Barrel posit1oning 1s manual but position is 1ndicated to the computer
by switches.
- 4 -
Dry nitrogen may be circulated within the tube, to prevent water
vapour condensation on the windows, due to a temperature difference
between the slit and the dome.
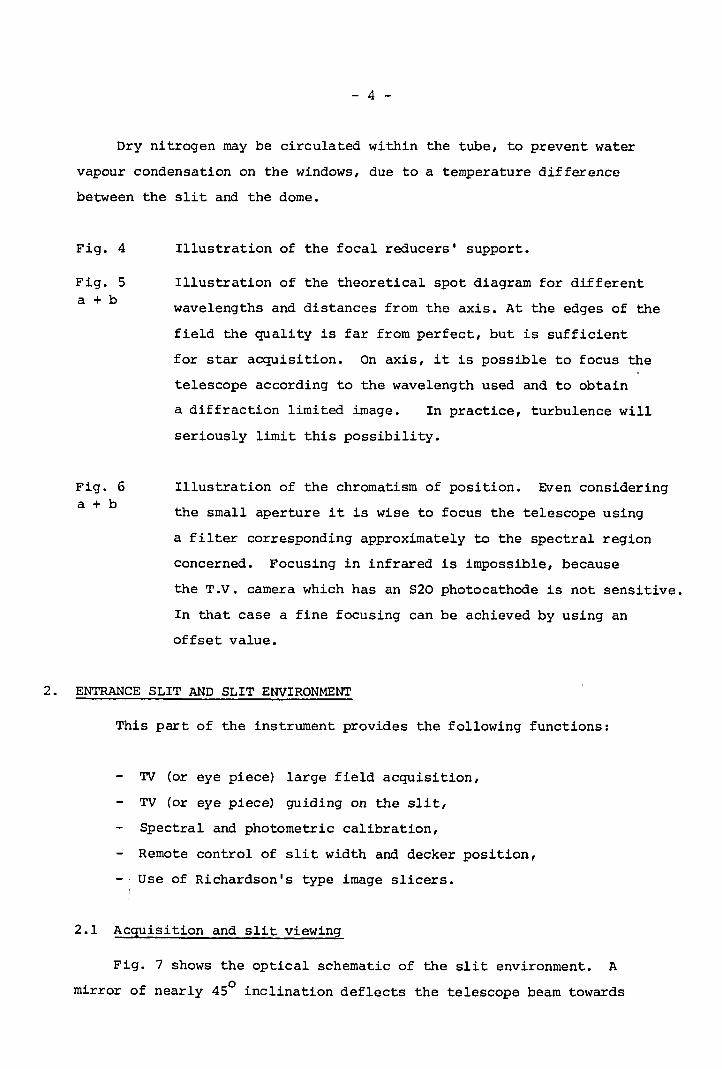
Fig. 4
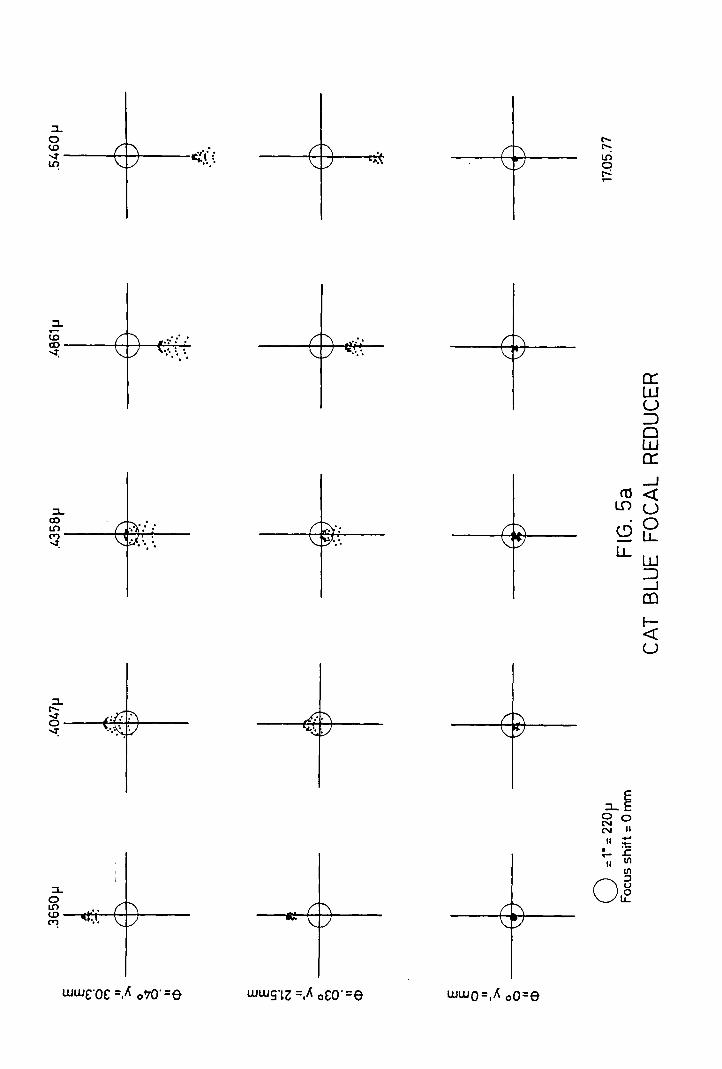
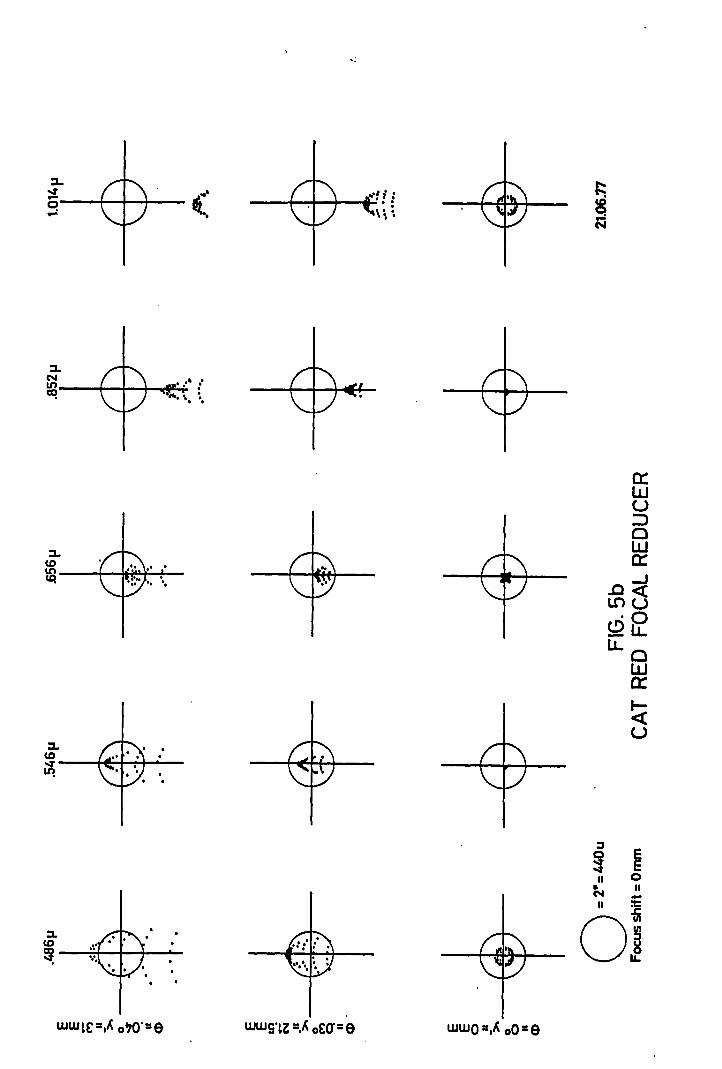
Fig. 5a + b
Illustration of the focal reducers' support.
Illustration of the theoretical spot diagram for different
wavelengths and distances from the axis. At the edges of the
field the quality is far from perfect, but is sufficient
for star acquisition. On axis, it is possible to focus the
telescope according to the wavelength used and to obtain
a diffraction limited image. In practice, turbulence will
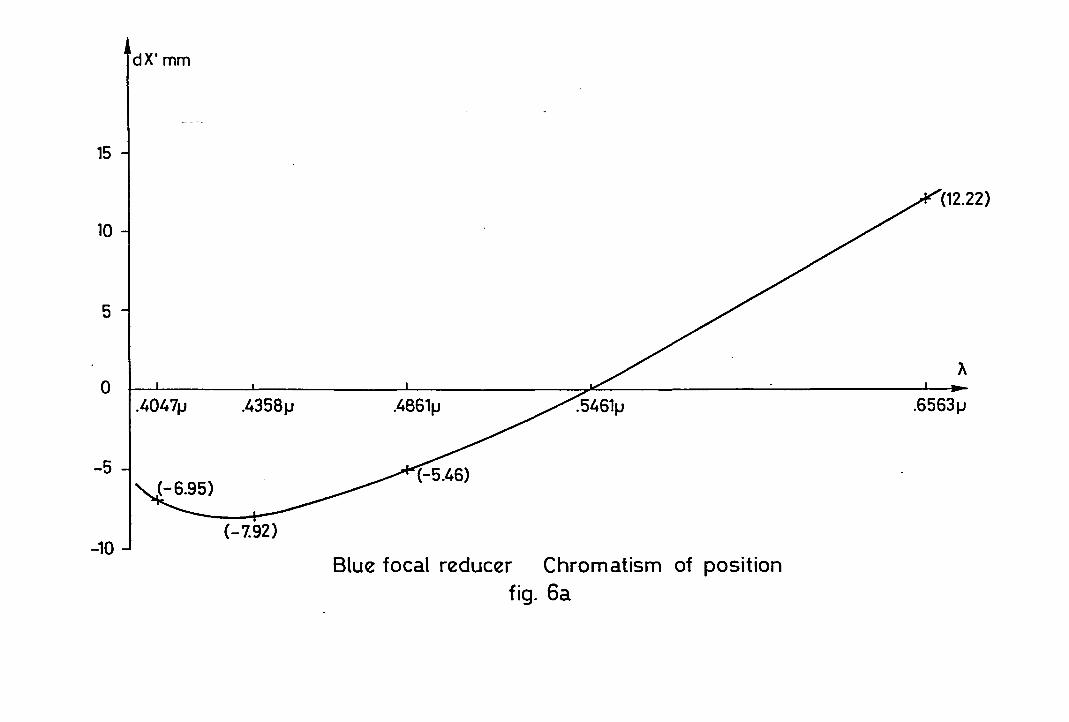
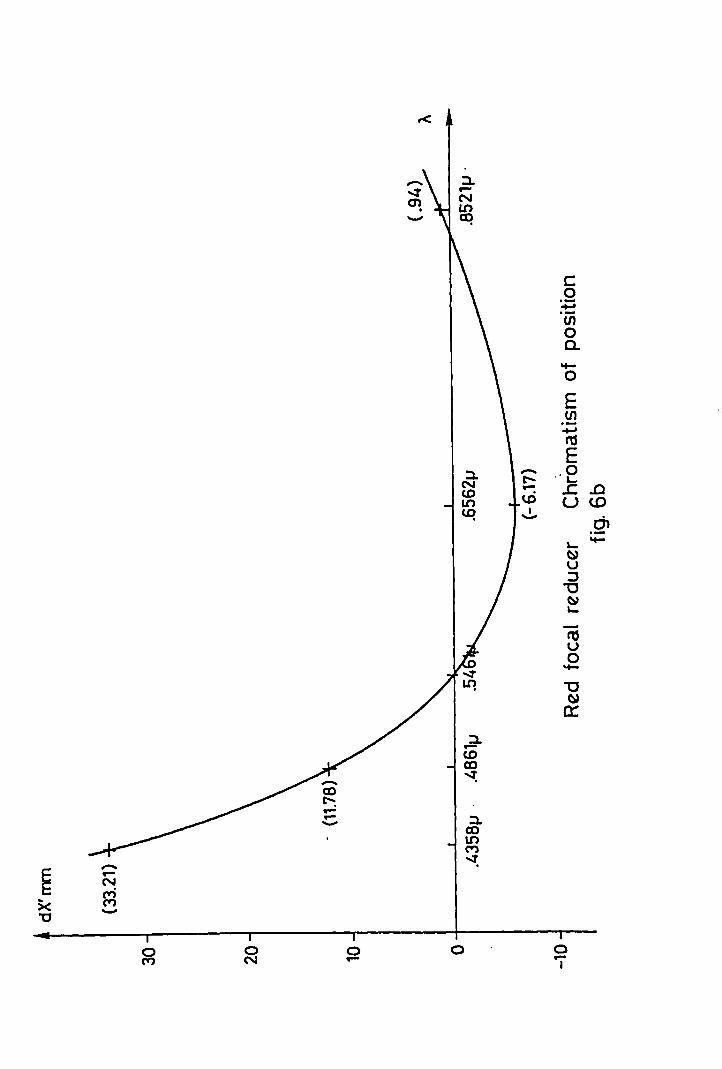
Fig. 6a + b
seriously limit this possibility.
Illustration of the chromatism of position. Even considering
the small aperture it is wise to focus the telescope using
a filter corresponding approximately to the spectral region
concerned. Focusing in infrared is impossible, because
the T.V. camera which has an S20 photocathode is not sensitive.
In that case a fine focusing can be achieved by using an
offset value.
2. ENTRANCE SLIT AND SLIT ENVIRONMENT
This part of the instrument provides the following functions:
TV (or eye piece) large field acquisition,
TV (or eye piece) guiding on the slit,
Spectral and photometric calibration,
Remote control of slit width and decker position,
-, Use of Richardson's type image slicers.
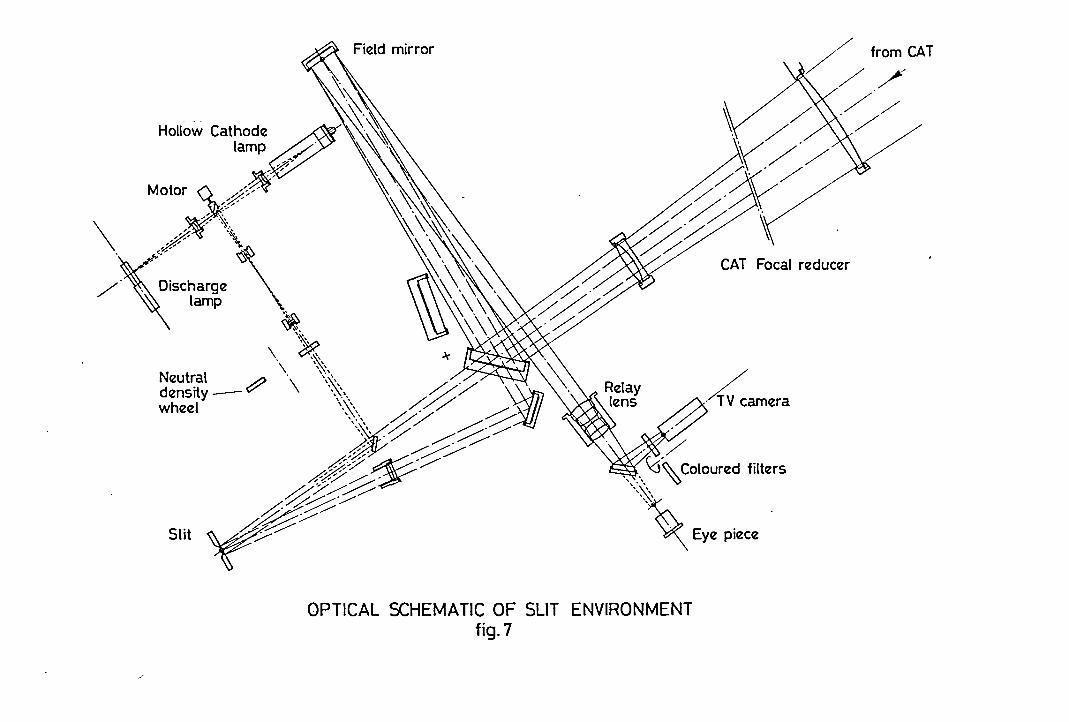
2.1 ACquisition and slit viewing
Fig. 7 shows the optical schematic of the slit environment. A
mirror of nearly 450 inclination deflects the telescope beam towards
- 5 -
a field mirror. The image of the sky is then projected onto a TV
camera (QUANTEX QX 26 - ISIT tube). When the star is recognised and
centered on the screen, the mirror can be rotated out and the beam
reaches the entrance slit and the decker. The beam is reflected by the
slit and the decker and an objective and mirror send it into the same
optical path as for the acquisition. Also foreseen is a rear viewer
which, with a similar system, images the slit seen from the back on the
TV camera. It is not shown on Fig. 7 for more clarity.
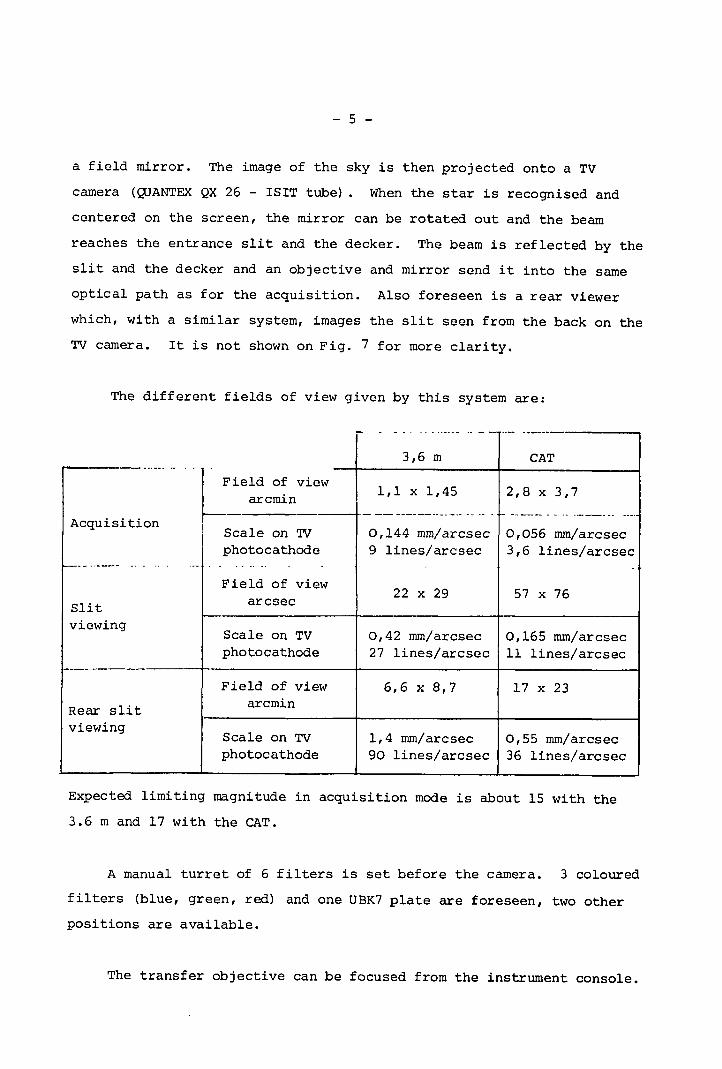
The different fields of view given by this system are:
- - - .. ....._. -- .. _..- '.- ...._-_ ..
3,6 m CATr-.---- ...... -
.. ~ield of view 1,1 x 1,45 2,8 x 3,7arcm~n
-- - -- ---------- ---- -- -- - . -- ----- - _..- .._---_. ....Acquisition
Scale on 'IV 0,144 mm/arcsec 0,056 mm/arcsecphotocathode 9 lines/arcsec 3,6 lines/arcsec
1---- ..---- ... ... ._- .. -.. -
Field of view22 29 57 76x x
Slit arcsec
viewingScale TV 0,42 mm/arcsec 0,165 mm/arcseconphotocathode 27 lines/arcsec 11 lines/arcsec
Field of view 6,6 x 8,7 17 x 23
slitarcmin
Rearviewing
Scale on TV 1,4 mm/arcsec 0,55 mm/arcsecphotocathode 90 lines/arcsec 36 lines/arcsec
Expected limiting magnitude in acquisition mode is about 15 with the
3.6 m and 17 with the CAT.
A manual turret of 6 filters is set before the camera. 3 coloured
filters (blue, green, red) and one UBK7 plate are foreseen, two other
positions are available.
The transfer objective can be focused from the instrument console.
- 6 -
In case of fai1ure of the TV camera, an eye-piece can be used,
without co10ured filters. An F = 16 rnrn eye-piece provides about the
same fie1d of view as that of the diagonal of the corresponding TV
fie1d of view.
TV camera, 1arge fie1d mirror setting and objective focusing are
contro11ed from the conso1e independent1y of the computer which
neverthe1ess knows the mirror position. Switching from eye-piece to TV
and filter changes are manual.
2.2 Ca1ibration
The ca1ibration unit images an aperture onto the entrance slit.
The pupi1 imaging is identica1 to that of the te1escope to minimise
errors due to a different illumination of the grating during observation
and ca1ibration. Severa1 ca1ibration sources are disposed around this
aperture. A 450 mirror rotating around the optica1 axis se1ects one
of the sources whose emittive area is projected onto the aperture.
A 450 mirror set on the te1escope axis projects the ca1ibration beam
onto the entrance slit and, when turned off, c10ses the ca1ibration
unit in such a way that the sources can be switched on during observation
for warrning up. Provision has been made for 8 sourees. So far the
fo110wing have been attributed:
l. Fe-Ne Ho110w cathode 1amp,
2. Th-Ne Ho110w cathode 1arnp,
3. Ne 10w pressure 1amp,
4. Hg 10w pressure 1amp (for a1ignment),
5. Quartz iodine 1amp BV/50W (28000 K) , for
photometrie ca1ibration,
He-Ne Laser ))
Hg 198 Isotopic 1amp )
8. avai1ab1e
both for instrument profilerecording
- 7 -
Switching and selection of the sources and setting the 450
mirror are controlled from the console. Selected source and mirror
position are known by the computer.
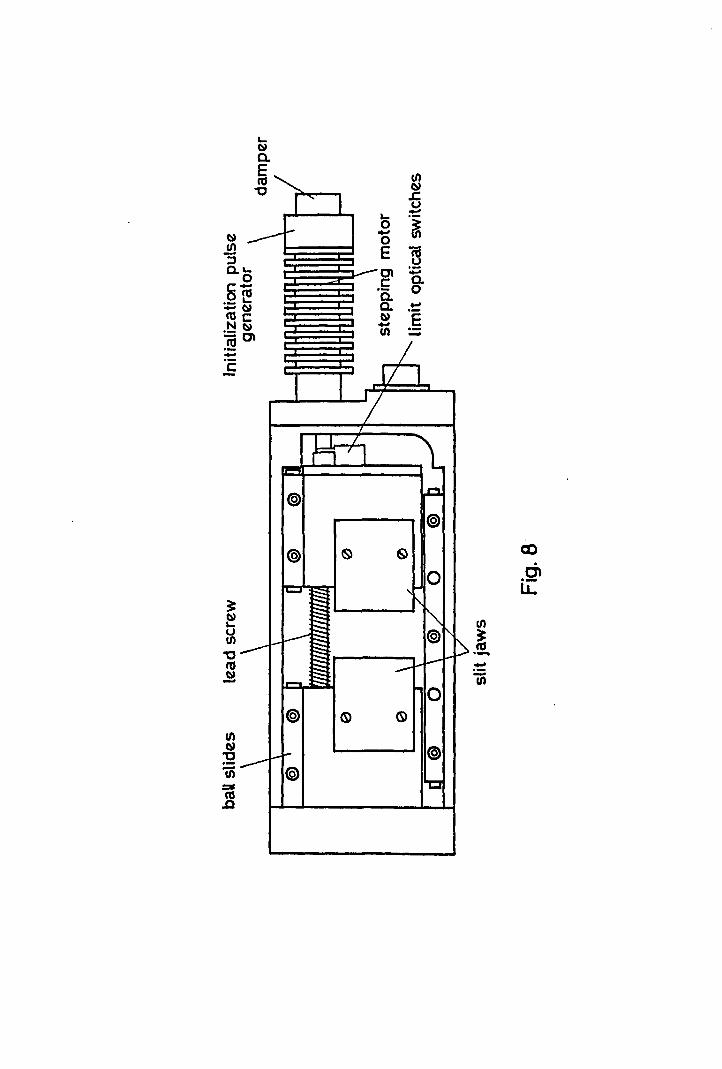
2.3 Slit (Fig. 8)
Two symmetric jaws provide an aperture variable between 50~
and 5 mm. The maximum height is 30 mm. The two jaws are coated with
a silica-protected aluminium layer. The unit is remote controlled and
although the width is normally set by the computer, a manual setting
is possible.
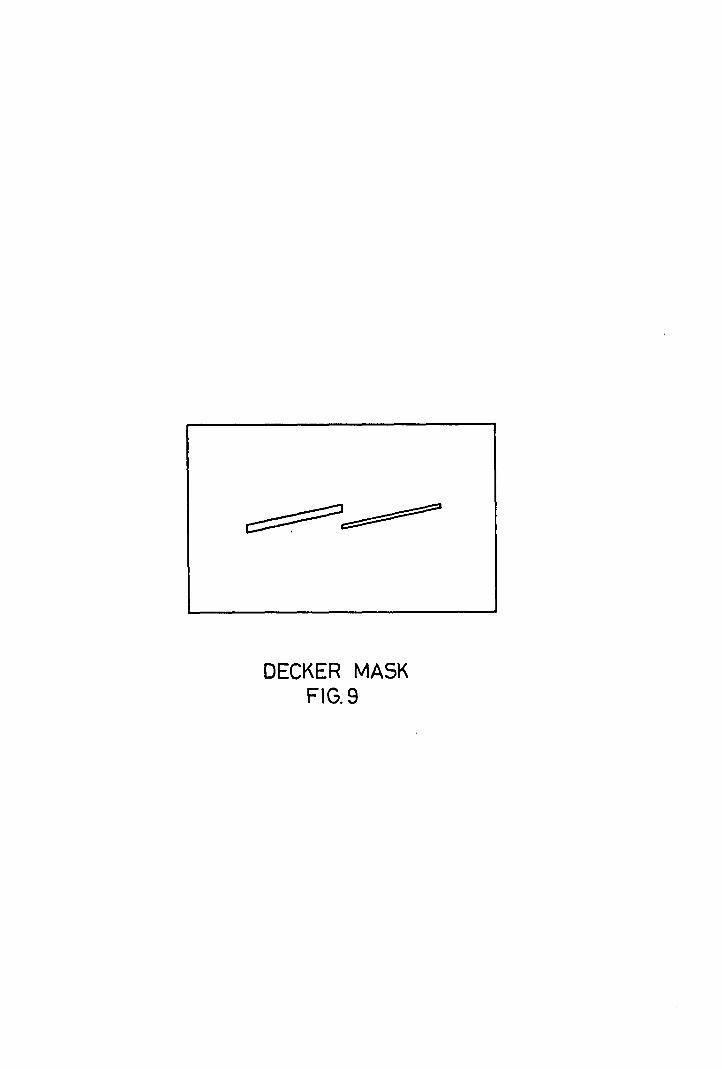
2.4 Decker
A reflecting mask is set at a short distance from the slit
(0.5 mm) - total stroke is 50 mm. The mask being reflecting, the
complete field of view can be observed without removing the mask.
The present mask is shown in Fig. 9. An inclined slot allows
centering of the spectrum onto the detector. Considering the different
scales of the two telescopes, two slots are provided which give a
4 arcsec spectrum height with each telescope. This mask is adapted
to single array detectors; it can be easily changed for other detectors.
The decker position is also remote controlled from the computer in the
same way as the slits.
2.5 Image slicers
The slit and the decker can be removed and replaced by an image(1)
slicer of fixed aperture. Two I.S. of the RICHARDSON type are
foreseen. One will be dedicated to the blue spectral range, the other
to the red. They are well adapted to array detectors. The characteristics
of these I.8.'s are:
Number of slices = 3
81it width 0,2 mm (0,89 and 0,35 arcsec)
Projected area on the sky: CAT: 2,6 x 6,6 arcsec3.6 m: 1 x 2,6 arcsec
- 8 -
3. ORDER SEPARATION - PRE-DISPERSER
The separation of orders of an echelle grating is quite crucial.
A very classical solution consists to use a cross disperser - generally
a grating - to disperse the light in a direction perpendicular to the
echelle spectrum. The result is a set of parallel spectrums corresponding
to the different orders of the echelle grating. All the spectral
information is recorded if a two-dimension detector is used. The
spectrums are slightly curved and the spectral lines correspondingly
inclined due to the combination of the two dispersions. Therefore,
processing of data becomes delicate. It was a deliberate choice in
h . f . t 1 (2)t at ~nstrument to avour accuracy aga~nst spec ra coverage •
A pre-filtering, having a band-pass smaller than the free spectral
range of the echelle grating has been preferred to a cross dispersion.
Then the final spectrum is rectilinear easy to process but limited in
length to the free spectral range of the grating. Another advantage
is that reducing the total quantity of light introduced in the
instrument, stray light is reduced and spectral purity improved.
This filtering must isolate a spectral band inferior to the free
spectral range of the echelle grating which with a 79 grimm varies .
from 50 Rat 350 nm to 350 Rat 900 nm. Several solutions have been
examined.
Interference filters would have been an elegant solution if
their transmission was greater in V.V. and blue. They have not
been considered a valid solution.
Grating monochromator. Although a compact and straightforward
solution, gratings have the disadvantage of being less efficient
than prisms, when angular dispersion is not a critical parameter.
Prism monochromator. We rapidly came to the conclusion that this
was the correct principle to apply. In order to choose a convenient
arrangement we took into account the following constraints:
- 9 -
have the minimum of active surfaces,
avoid refractive solutions which always introduce
additional problems of chromatism,
keep the exit beam with approximately the same orientation as
the telescope beam (because of the coude room dimensions) ,
avoid as far as possible a change of orientation of the
exit beam when varying the wavelength,
put the pre-disperser spectrum parallel to the echelle's.
(A cross dispersion would give a spectrum with a variable
position difficult to compensate) .
The dispersion necessary depends on the wavelength and on the
slit width.
f 01.. hI (5X ~s t e
should have
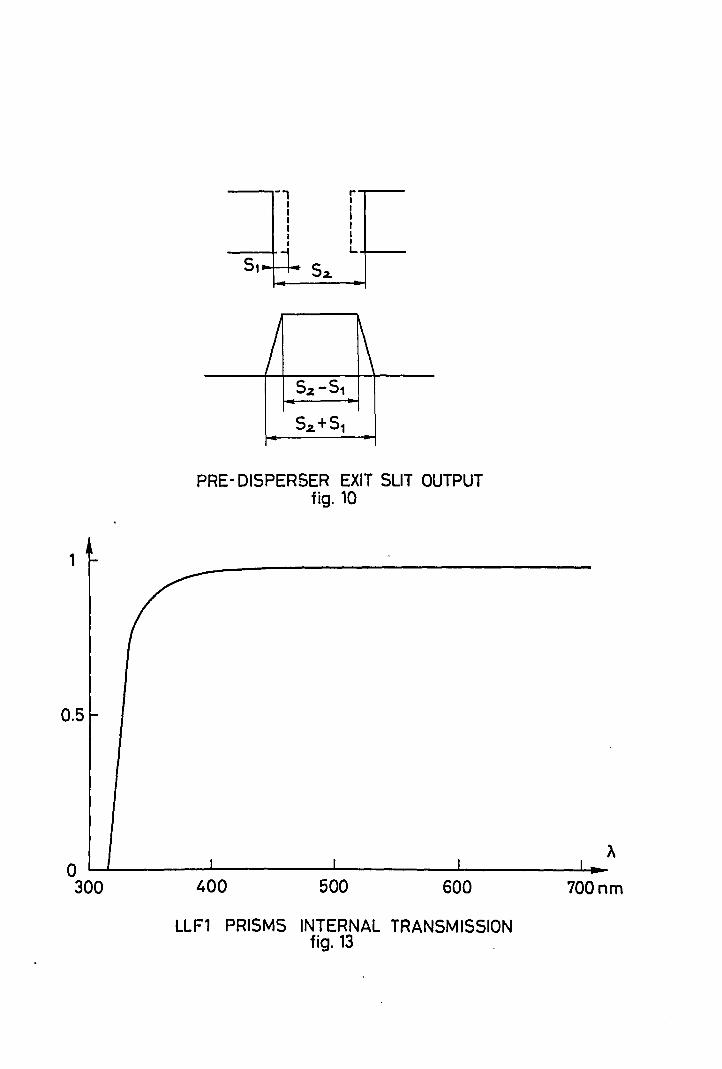
Fig. 10 shows how the output from the exit slit looks.
reciprocal linear dispersion of the pre-disperser one
S2 + SI < tHA~
OX
>6Ü
S2 - SI~
OX
where 611. is the free spectral range, 621. is the useful spectral range,
and SI - S2 the entrance and exit slit widths. With an entrance slit
of 1 arcsec (with the 3.6 m), the 79 grimm echelle grating and a 30 mm
long detector with an f/S camera, one is led to a minimum dispersion
of about 47 R/mm and at 3850 Rand 320 R/mm at 9300 R. However, higher
dispersion could increase the possibility of working with a larger
slit on a different camera/detector combination.
The final choice was for a sYmmetrical mirror arrangement using
a Littrow prism as a dispersive element. The relative low dispersion
of a prism was compensated without severe inconvenience by increasing
the collimator focal length.
- 10 -
The final characteristics of the monochromator are:
focal length of collimators:
relative aperture:
prism material:
prisn angle:
angle between beams:
2 meters
f/32,3
LLFl glass
22 degrees
3 degrees
Considering the low priority put on UV below 3500 i, a dispeLsive
glass was preferred to silica. Therefore, a smaller angle gives a
sufficient dispersion and incidence angle on prism is kept reasonable,
thus limiting light losses by reflexion.
Figure captions
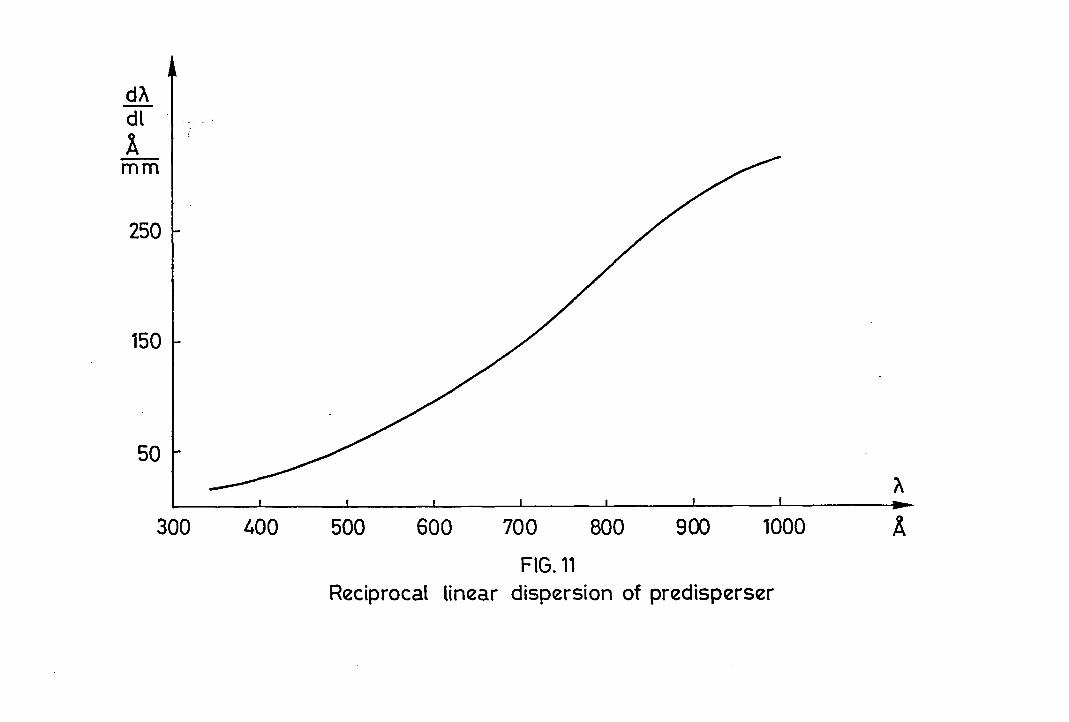
Fig. 11:
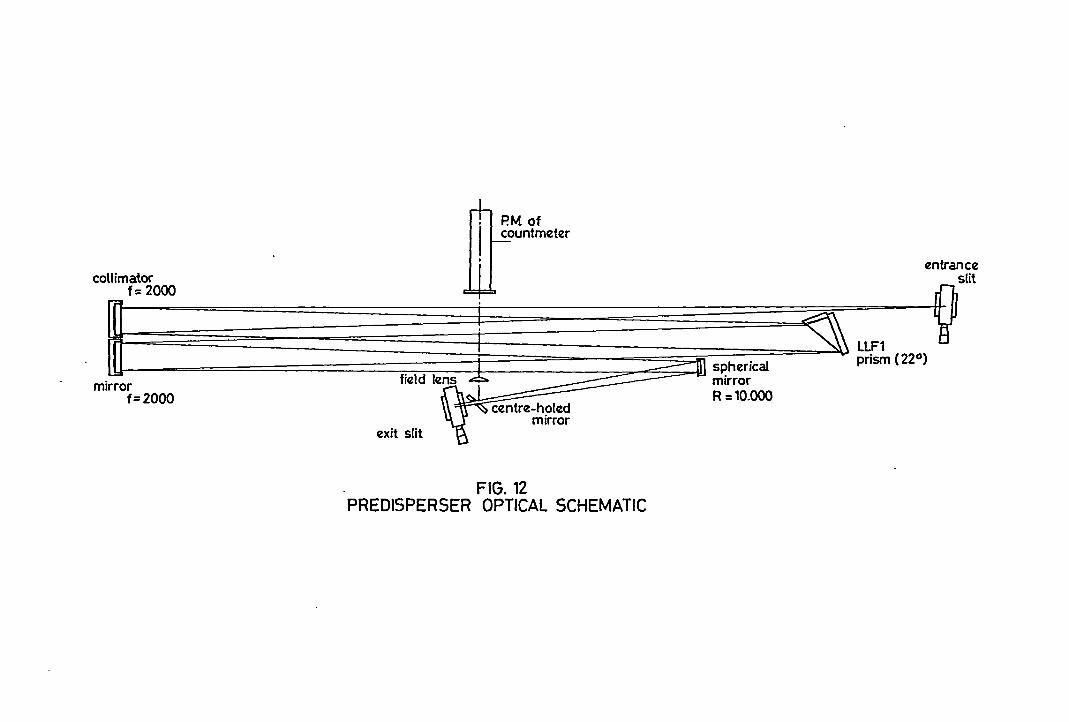
Fig. 12:
I
Fig.13:
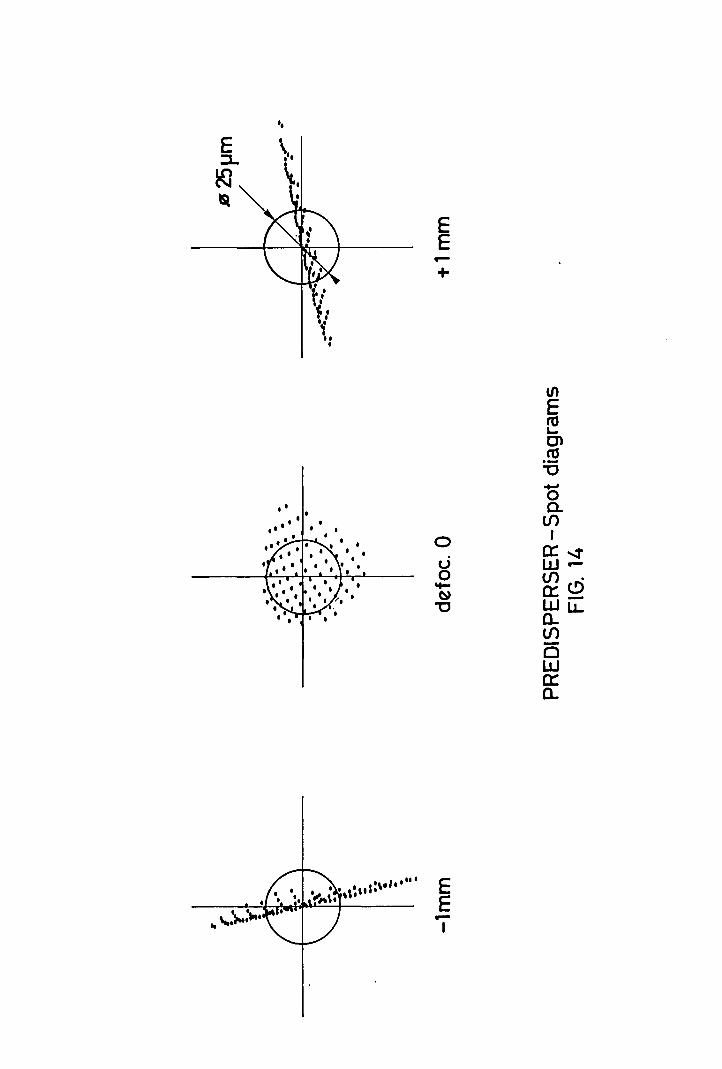
Fig. 14:
Reciprocal linear dispersion of the monochromator.
Schematic of the optical arrangement. In order to deviate
the beam back towards the slit room, an additional mirror
was necessary. This mirror is in fact a spherical mirror
(R = 10,6 meters) which acts as a field mirror. Thus no
additional element is necessary to image the pupil on the
grating •. The output aperture is slightly modified and is
f/29. The split into red and blue paths is obtained by
exchanging collimators mounted on a 4-position turret
(normally only two are used). From there, the two paths
are superposed and each optical element is duplicated:
there are two prisms, two camera mirrors, two field mirrors
and two slits. The two field mirrors are oriented in such
a way that the beams converge at the same place on the
spectrometer collimators (Fig. 1).
Prisn glass transparency for the average thickness
(double pass).
Spot diagrams showing the theoretical optical quality of the
monochromator. Inclination of astigmatic line is compensated
in the spectrometer.
- 11 -
Control: Exit slits are identical to the entrance slit and controlled
by the computer in the same way. The exit slit width is calculated by
the computer according to the following:
k is a coefficient experimentally determined which makes sure that
no light outside the spectral range makes its way through. This
coefficient takes account of the monochromator quality, of the prism
positioning accuracy and of different misalignment and defocusing
effects.
The two prisms are set on the same rotating table which is
controlled by a lead screw driven by a OC torque motor and a linear
encoder (Fig. 15). The position of the encoder is experimentally
determined for several reference wavelengths and the control program
interpolates between those positions to determine the prism position
corresponding to the requested central wavelength.
Position of collimator turret is read by the computer from
position indicators.
4. SPECTROMETER - SCANNER
4.1 Principle
The quality of echelle gratings has improved considerably during
the last decade. However, they are not completely ghost-free, and
it has been considered essential to have the possibility of working
with a very pure instrumental profile. This is only possible with a
double pass scanning mode in which the diffracted beam is focused on an
intermediate slit before being diffracted off once again by tl1e grating.
The ghosts and grass of the echelle are then almost completely removed,
but the efficiency of the system is low, limiting its application to
very bright objects.
- 12 -
Consequently, the spectrometer ought to be provided with a multi
channel mode which remains the basic working mode. It relies on multi
channel detectors whose best example is the spectrographic plate.
However, the instrument has been optimized for electronic detectors
whose efficiency is higher although being of limited dimensions, the
spectrum'length is correspondingly limited.
The main design parameters which have been taken into consideration
are:
a) easy switch from multichannel to scanner, and from single pass
to double pass.
b) high efficiency. Thus, limited number of optical elements.
c) no (or very limited) refractive elements to ensure a large
spectral range.
d) no necessity for adjustment in operational use (implying design
parameters should not be over-critical) •
e) should fit the coude beam position (mean height 2 meters from
ground) •
f) leave a possibility for future improvement (larger echelle grating
or mosaic of gratings) •
The optical arrangements are in practice very limited (Fig. 16):
"Czerny-Turner perpendicular" (often called Littrow): The incident
and diffracted beams are separated along a direction perpendicular
to the dispersion. The main inconvenience is that it introduces a
li~e rotation which is the visible part of the more general line
curvature. On the other hand, this is the arrangement where the
grating is considered to be the most efficient.
- 13 -
Czerny-Turner: This is the classical mounting which gives a fully
coma-corrected field and no line rotation. The efficiency of the
echelle is reduced depending on the arrangement (see annex 1) •
This arrangement can be set up in a horizontal plane thus
facilitating mechanical design and alignment. A greater mechanical
flexibility can also be expected.
Baranne: The white pupil mounting projects an image of the pupil on
the camera, thereby eliminating the vignetting and improving the
optical quality of the camera.
The "white pupil" is of little advantage if one considers that
electronic detectors have limited dimensions, and that consequently
the field of view of the camera is small and the vignetting not a very
great problem. On the other hand, the double pass scanning mode is
difficult to achieve with this arrangement, and the efficiency is
reduced by the number of optical elements which is significantly higher
than with a classical mounting. It has not been considered an
interesting solution for this particular case.
The choice between the first two arrangements is somewhat difficult
since it depends on the priority one gives to the different design
parameters. After some hesitation the Czerny-Turner arrangement was
finally selected. It offers more mechanical flexibility becau~e space
is available below and above the beams. For instance a change of the
grating size or of the detector may be more easily accomplished, and
it was considered essential that a Coude Spectrometer be kept as
flexible an instrument as possible.
There are two different ways of using the same in-plane mounting,
depending whether the diffraction angle is larger or smaller than the
incidence angle. A discussion and experimental results are given in
annex 1 and results in a preference to have the diffraction angle
smaller.
- 14 -
The two beams coming from the two exit slits of the pre-disperser
are converging at the same place on the collimator. There are two
exchangeable collimators and two camera mirrors, one for the blue, the
other for the red. Each is adjusted in such a way that the beams
follow exactly the same path up to the exit slit.
When using the double pass mode, the camera mirror is tilted and
the beam deflected towards a total reflexion prism before reaching the
intermediate slit, after which another prism deflects the beam again
on to the collimator and grating. In order to optimize the anti
reflexion coatings of the prism to the spectral range, there are, in
fact, two prisms, one blue and one red, set up on each side of the beam.
The system is entirely static, except for the collimators and the
camera mirrors, each of them having two positions (single or double
pass) .
Scanning: In order to limit the noise introduced by the atmospheric
turbulence and the guiding errors, it is essential to scan the spectrum
on the exit slit with the highest possible frequency. Considering the
mass of the grating, it would be desirable to scan a smaller optical
element. Unfortunately, the double pass requirement limits the
possibilities, and if one wants to avoid systems with 2 moving elements
which are terribly difficult to synchronise, there is no other choice
than to scan with the grating. So it is set on a turn-table which rotates
the grating to a defined position and wobble at a given amplitude and
frequency. Fig. 17 provides a schematic of the scanner mode.
Multichannel: This mode is obtained by setting a camera/detector unit
on the: diffracted beam before the scanner camera mirror. No optical
element needs to be removed or changed.
- 15 -
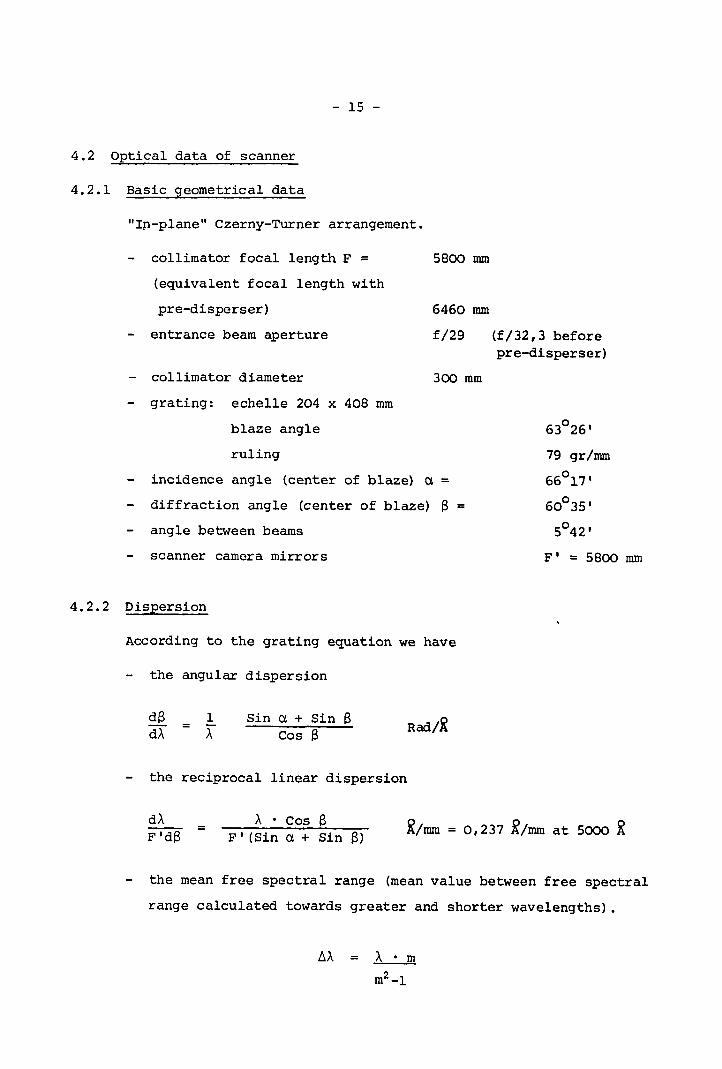
4.2 Optical data of scanner
4.2.1 Basic geometrical data
"In-plane" Czerny-Turner arrangement.
collimator focal length F =(equivalent focal length with
pre-disperser)
5800 mm
6460 mm
entrance beam aperture
collimator diameter
f/29
300 mm
(f I 32,3 beforepre-disperser)
grating: echelle 204 x 408 mm
blaze angle
ruling
incidence angle (center of blaze) ~ =diffraction angle (center of blaze) ß =angle between beams
scanner camera mirrors
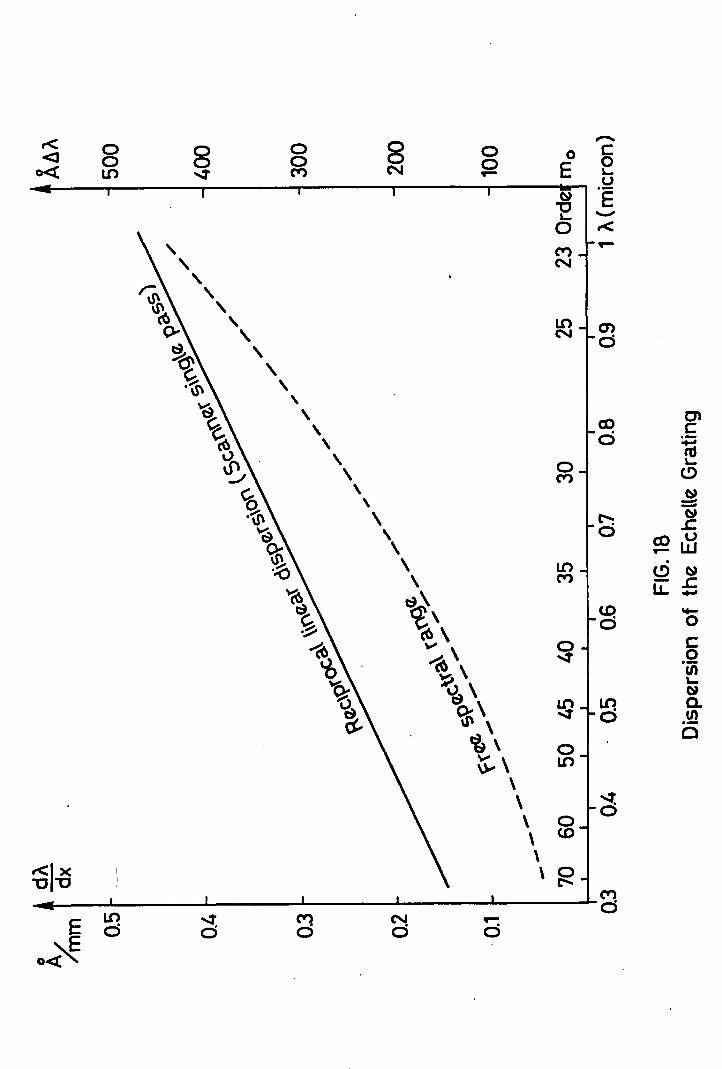
4.2.2 Dispersion
According to the grating equation we have
the angular dispersion
630 26'
79 grimm
660 17'
60°35'
50 42'
F' = 5800 mm
dß 1dA = r Sin ~ + Sin ß
Cos ß
the reciprocal linear dispersion
dAF'dß
=A • Cos ß
F' (Sin ~ + Sin ß) R/mm = 0,237 R/mm at 5000 R
the mean free spectral range (mean value between free spectral
range calculated towards greater and shorter wavelengths) •
- 16 -
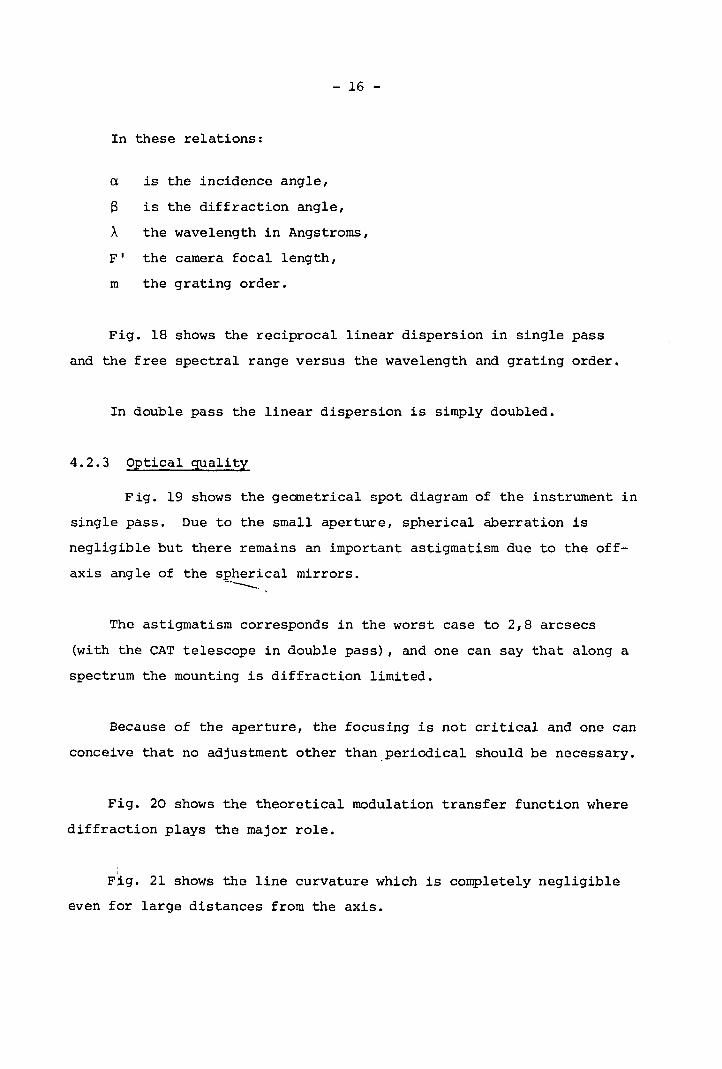
In these relations:
a is the incidence angle,
ß is the diffraction angle,
A the wave1ength in Angstroms,
F I the camera foca1 1ength,
m the grating order.
Fig. 18 shows the reciproca1 linear dispersion in single pass
and the free spectra1 range versus the wave1ength and grating order.
In double pass the linear dispersion is simp1y doubled.
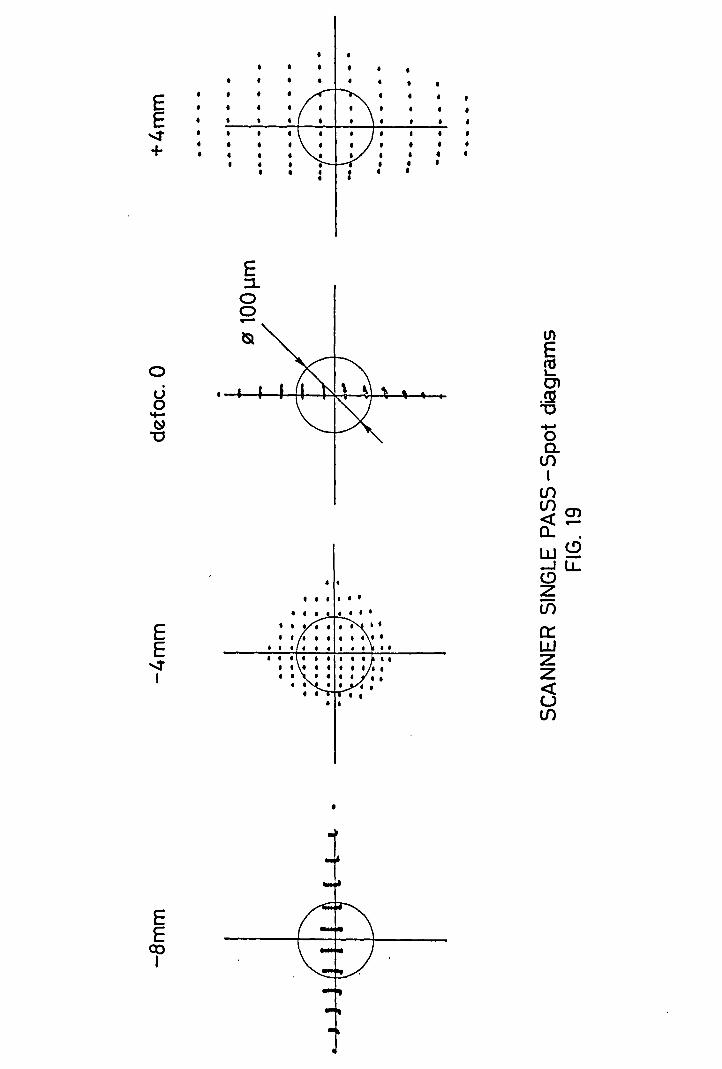
4.2.3 Optical qua1ity
Fig. 19 shows the geametrica1 spot diagram of the instrument in
single pass. Due to the smal1 aperture, spherica1 aberration is
neg1igib1e but there remains an important astigmatism due to the off-
axis angle of the spherica1 mirrors.----.The astigmatism corresponds in the worst case to 2,8 arcsecs
(with the CAT te1escope in double pass), and one can say that a10ng a
spectrum the mounting is diffraction 1imited.
Because of the aperture, the focusing is not critical and one can
conceive that no adjustment other than.periodica1 shou1d be necessary.
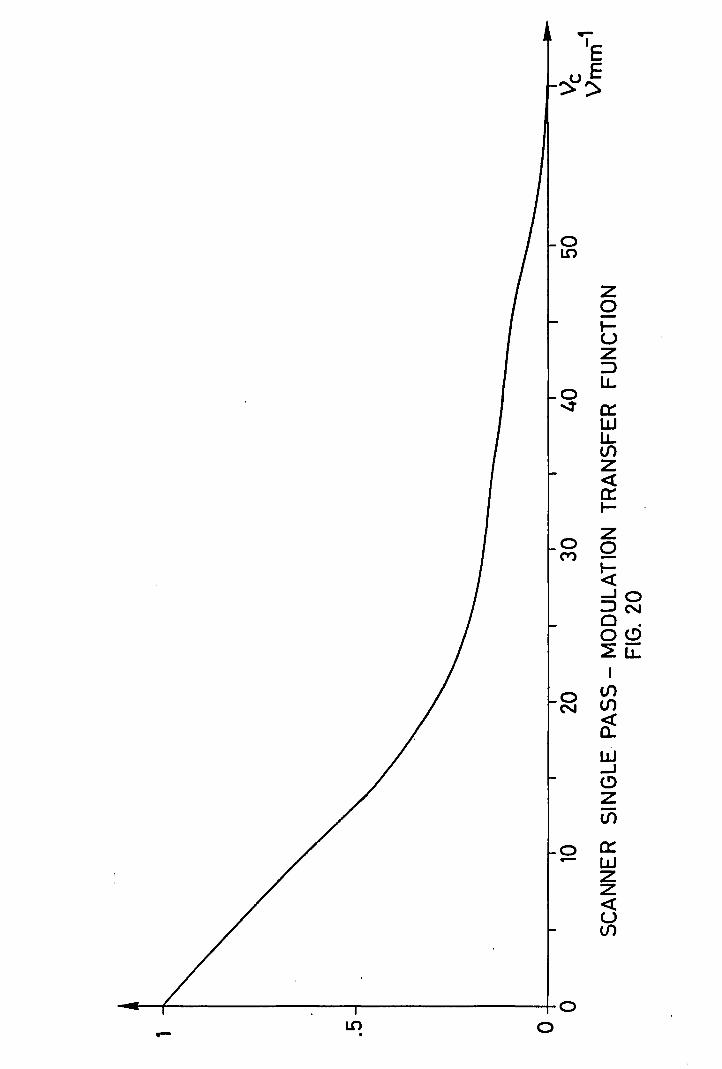
Fig. 20 shows the theoretica1 modulation transfer function where
diffraction p1ays the major ro1e.
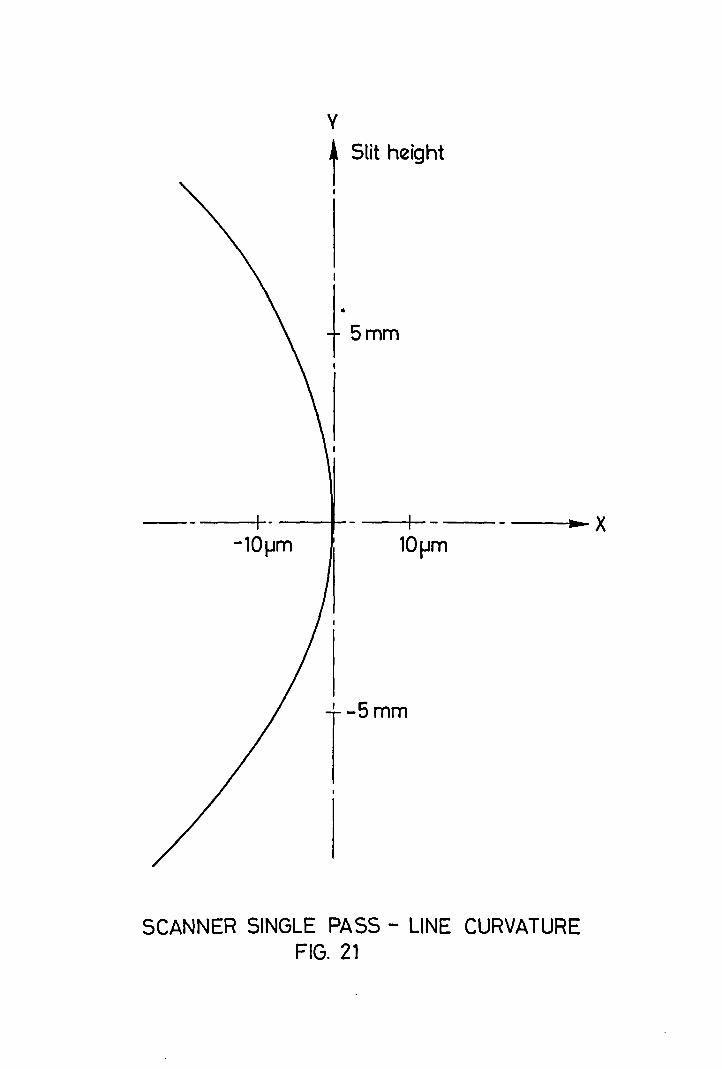
F~g. 21 shows the 1ine curvature which is complete1y neg1igible
even for 1arge distances from the axis.
- 17 -
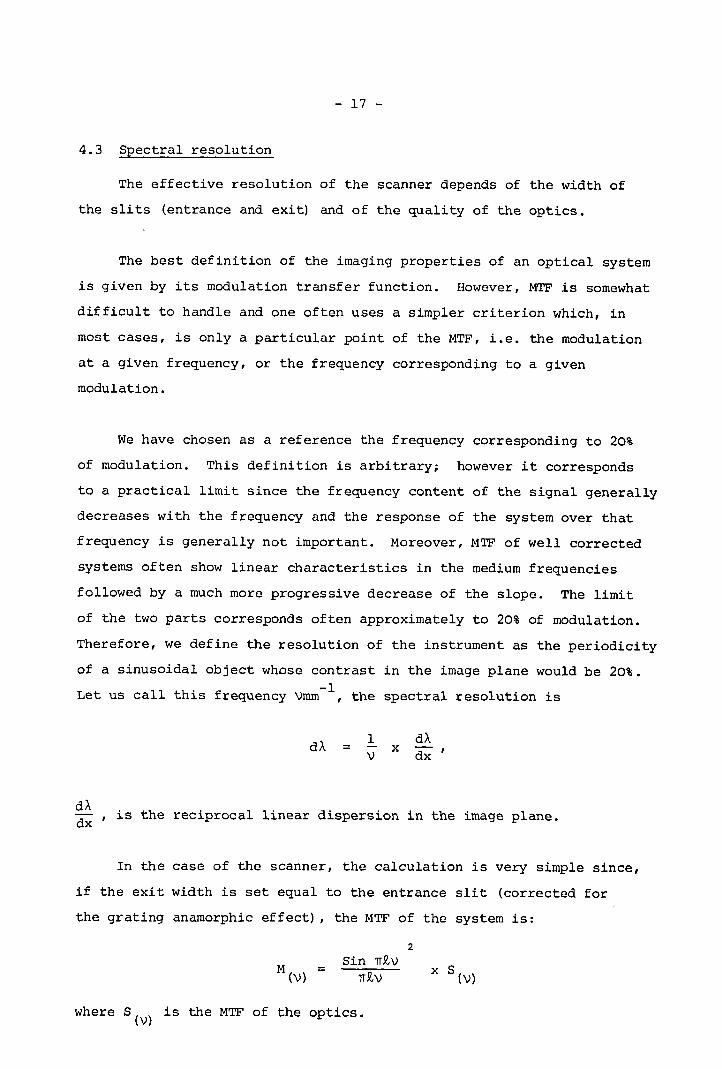
4.3 Spectral resolution
The effective resolution of the scanner depends of the width of
the slits (entrance and exit) and of the quality of the optics.
The best definition of the imaging properties of an optical system
is given by its modulation transfer function. However, MTF is somewhat
difficult to handle and one often uses a simpler criterion which, in
most cases, is only a particular point of the MTF, i.e. the modulation
at a given frequency, or the frequency corresponding to a given
modulation.
We have chosen as a reference the frequency corresponding to 20%
of modulation. This definition is arbitrary; however it corresponds
to a practical limit since the frequency content of the signal generally
decreases with the frequency and the response of the system over that
frequency is generally not important. Moreover, MTF of well corrected
systems often show linear characteristics in the medium frequencies
followed by a much more progressive decrease of the slope. The limit
of the two parts corresponds often approximately to 20% of modulation.
Therefore, we define the resolution of the instrument as the periodicity
of a sinusoidal object whose contrast in the image plane would be 20%.-1Let us call this frequency Vmm , the spectral resolution is
dA = 1V
xdAdx
dAdx ' is the reciprocal linear dispersion in the image plane.
In the case of the scanner, the calculation is very simple since,
if the exit width is set equal to the entrance slit (corrected for
the grating anamorphic effect), the MTF of the system is:
2
Sin TI~V
TI~V
where S(V) is the MTF of the optics.
- 18 -
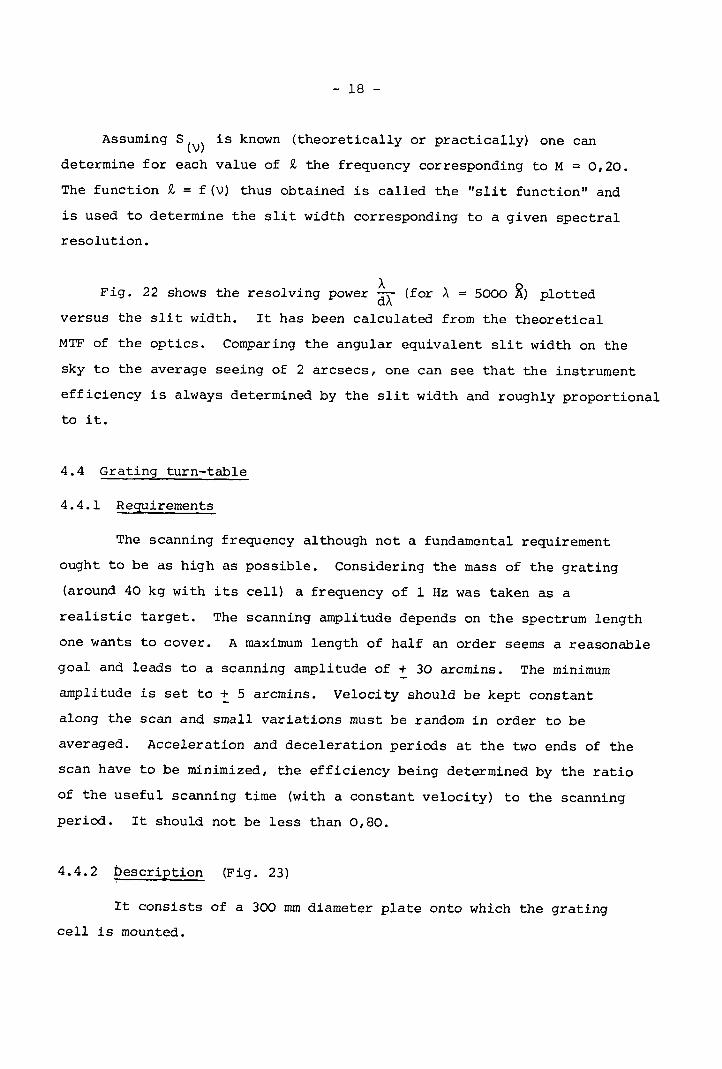
Assuming S(V) is known (theoretica11y or practica11y) one can
determine for each va1ue of ~ the frequency corresponding to M = 0,20.
The function ~ = f(V) thus obtained is ca11ed the "slit function" and
is used to determine the slit width corresponding to a given spectral
resolution.
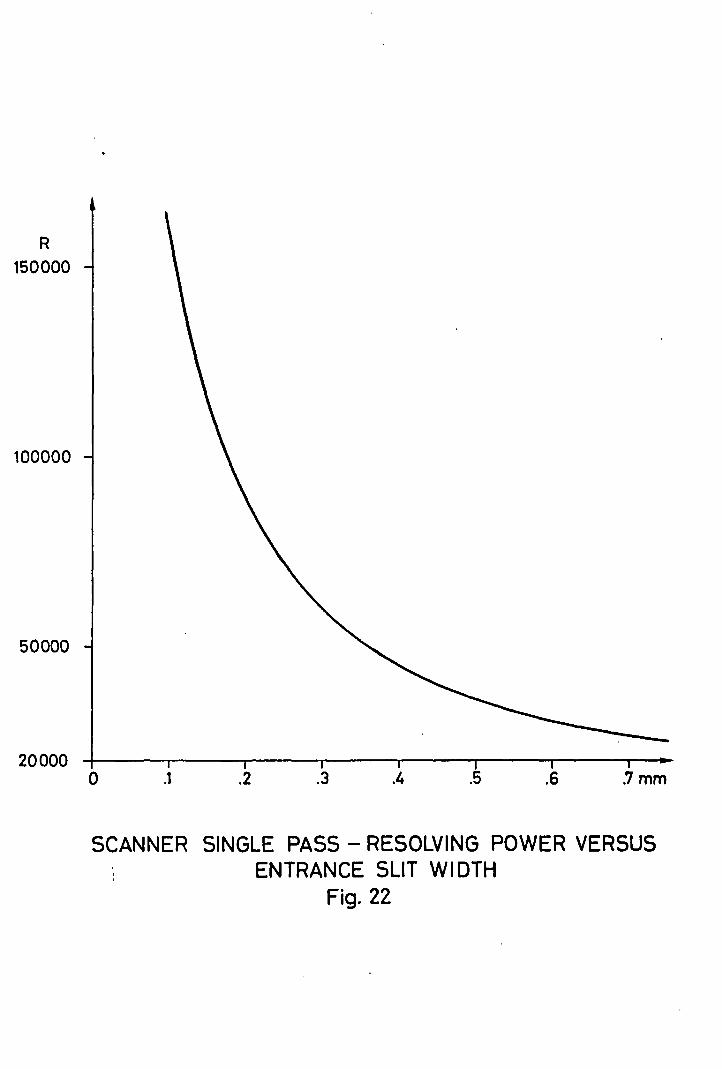
Fig. 22 shows the resolving power ~A (for A = 5000~) plotted
versus the slit width. It has been calculated from the theoretical
MTF of the optics. Comparing the angular equivalent slit width on the
sky to the average seeing of 2 arcsecs, one can see that the instrument
efficiency is a1ways determined by the slit width and rough1y proportional
to it.
4.4 Grating turn-table
4.4.1 Requirements
The scanning frequency although not a fundamental requirement
ought to be as high as possible. Considering the mass of the grating
(around 40 kg with its cell) a frequency of 1 Hz was taken as a
realistic target. The scanning amplitude depends on the spectrum length
one wants to cover. A maximum length of half an order seems a reasonable
goal and leads to a scanning amplitude of ! 30 arcmins. The minimum
amplitude is set to + 5 arcmins. Velocity should be kept constant
along the scan and small variations must be random in order to be
averaged. Acceleration and deceleration periods at the two ends of the
scan have to be minimized, the efficiency being determined by the ratio
of the usefu1 scanning time (with a constant velocity) to the scanning
period. It should not be less than 0,80.
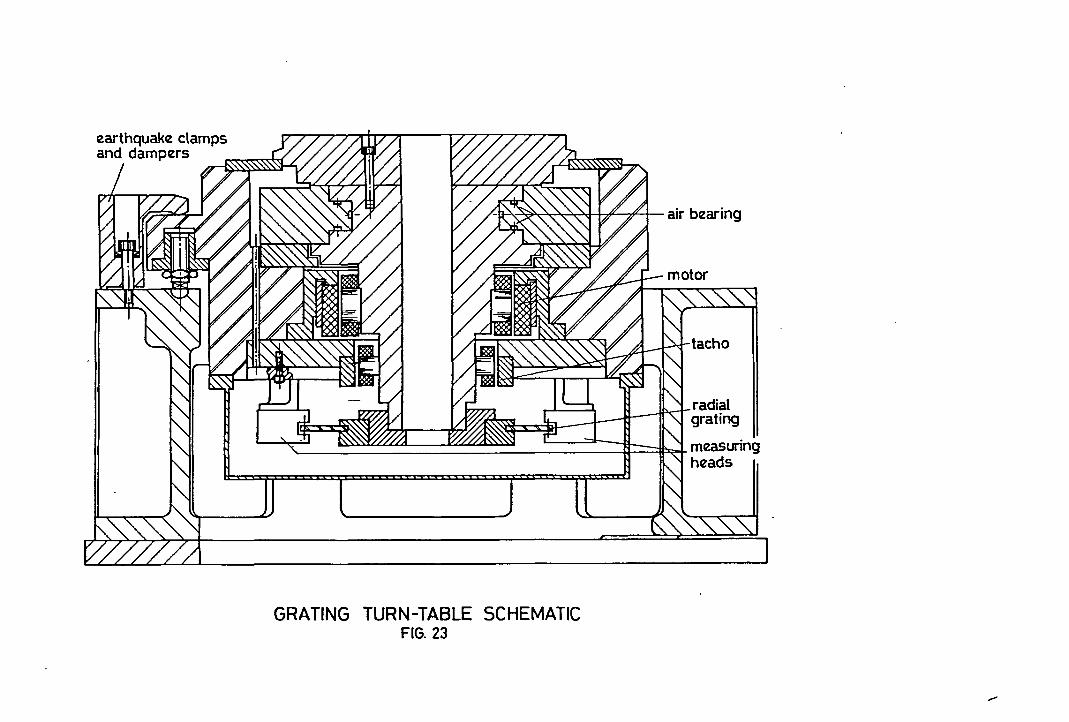
4.4.2 bescription (Fig. 23)
It consists of a 300 mm diameter plate onto which the grating
cell is mounted.

- 19 -
High precision air bearings provide support for the platen
consisting of an opposed thrust bearing and a journal bearing. These
air bearings, in addition to providing a very low axial and radial
run-out, ensure that operation is completely 'rumble' free and
virtually frictionless making very small increments possible.
The drive system for the table consists of a De motor and tacho
generator mounted directly onto the spindle and provides a stepless,
gear-free assemb1y. This avoids mechanical irregu1arities and al10ws
for precise contro1 of rotation in either a c10ckwise or counter
clockwise direction.
Exhaust air is contained within the table thus avoiding turbulence
effects on the optical paths. This exhaust air provides coo1ing for
the motor and reading heads.
The table position is measured with a radial Moire fringe grating
system with 64,800 1ines per revolution. Twin reading heads are fitted
1800
apart to provide compensation for errors due _to grat.~.!l.9>.....
The reading heads give a fringe sub-division ratio of 200, which
corresponds to aresolution of 0.1 arcsec. An absolute datum reference
point is included.
The position counter operates in binary code. A microprocessor
is used to convert the binary reading into a display of angular position
in degrees, minutes and seconds.
The microprocessor, which is a 16 bit high speed bipolar unit also
generates the position servo error signal, generates the scanning
function and delivers synchro signals which are used to sample the
signal from the detector.
- 20 -
A linear OC servo amplifier is used to drive the directly-mounted
OC torque motor. Servo stability is ensured by the use of a directly
mounted OC tachogenerator.
4.4.3 Operation
The control panel allows selection of the on-line or off-line
mode. The off-line mode permits initialising and positioning of the
table to the absolute datum point, positioning to any pre-selected
position and scanning to any frequency and amplitude. Lights indicate
the detection of a failure (air failure, datum loss, lamp off etc.) •
When the on-line mode is selected, the control panel operation is
inhibited, but still provides indication of the different parameters
(position, scan etc.). The signals at the CAMAC interface are as
follows:
Input: Position
Control
(1 bit corresponds to 0,1 arcsec) •
fault - on-line - datum loss - scan
acknowledge - position acknowledge.
End of data pulse.
Measuring pulse.
Output: Central position request
Amplitude
Frequency
Interval between measuring pulses
Auto-datum
Move to position
Scan
Enable data pulses
- 21 -
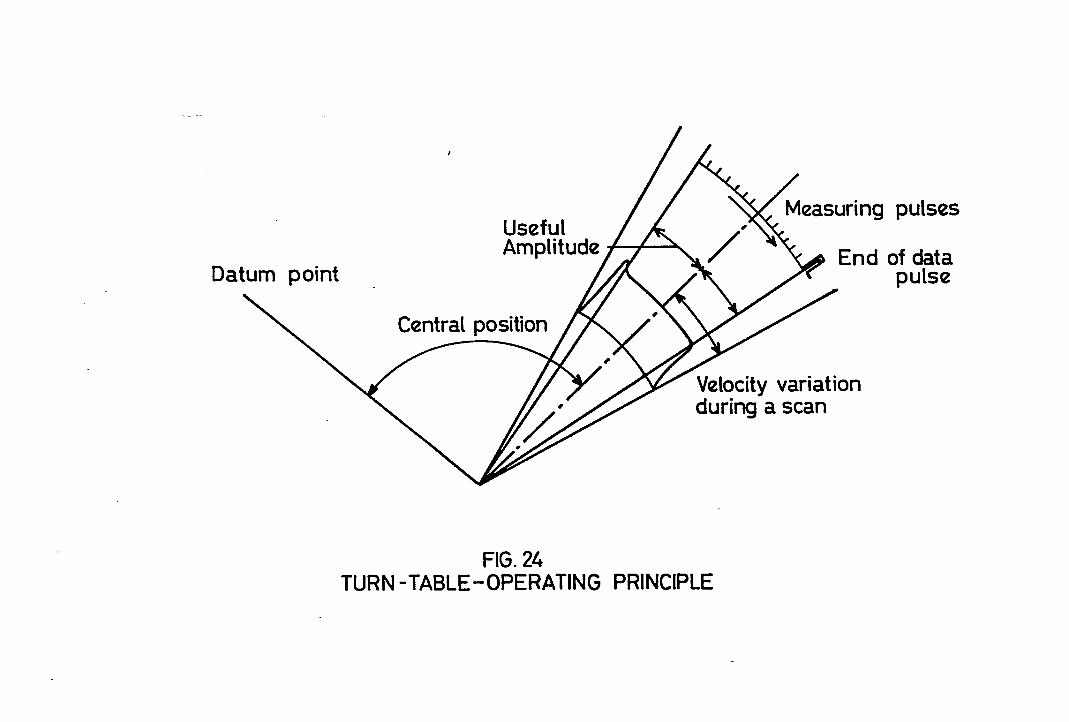
The amplitude used is the usefu1 amplitude in which velocity is
considered constant. It i8 divided by the int~rval between two
measuring pulses to obtain the number of channels. At the end of a
scan an "end of data pulse" is generated and allows a software control
of the procedure (Fig. 24). All the parameters are generated by the
software from the observation requests introduced by the observer
4.4.4 Performances
The turn-table was one of the first parts of the instrument to
be contracted and delivered. The final performances obtained are
slight1y different from the initial exp~ctations. The scanning
frequency appears to be limited not by the servo itself but by thermal
drift of the central position when the heat dissipation inside the table
becomes too important. It also appears that the angular measuring
device introduces a periodic error of 20 arcsecs periodicity and of
maximum va1ue + 0,3 arcsec. The effect of this error on the pixel
position is negligible but the angular width of channels for a high
sampling rate varies considerably; this is the equivalent of having
a different integration time for each pixel. This effect is not
completely eliminated by a prior calibration because random noise due
to velocity variations and very slight variations of the measuring
device are still present. The solution found was to use the measuring
pulses in two ways. Firstly for sampling the PM signal, secondly for
sampling a reference signal given by a clock. The division of the two
signals gives a photometric signal corrected for both velocity variations
and encoder errors.
The different figures summarize the performances:
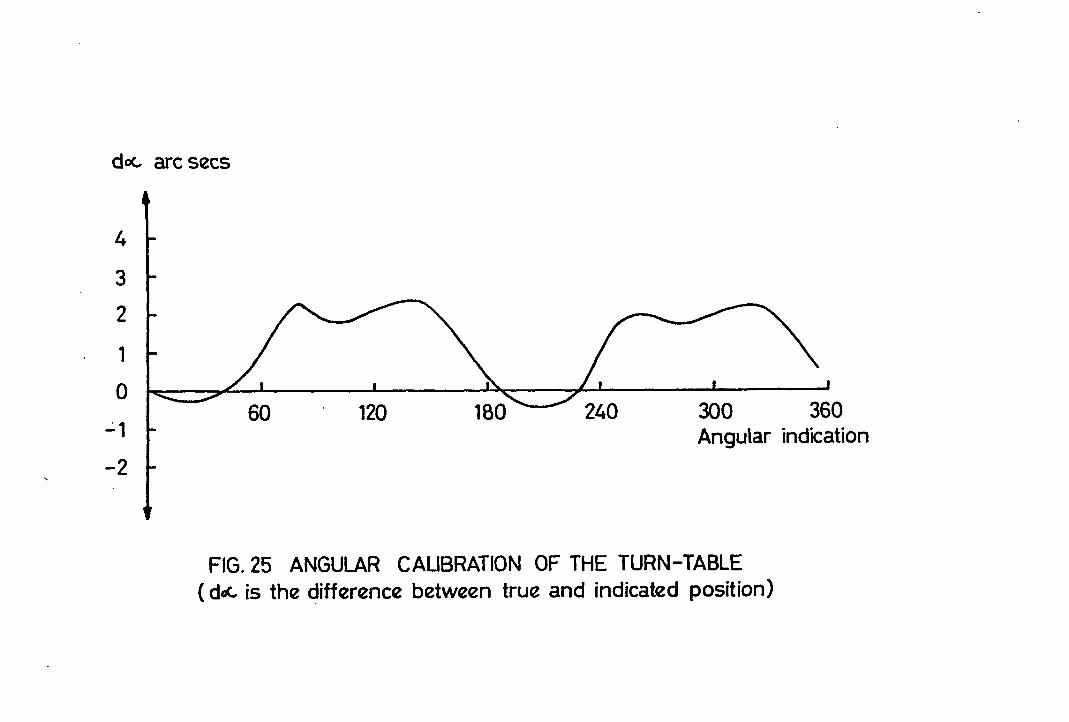
Fig. 25
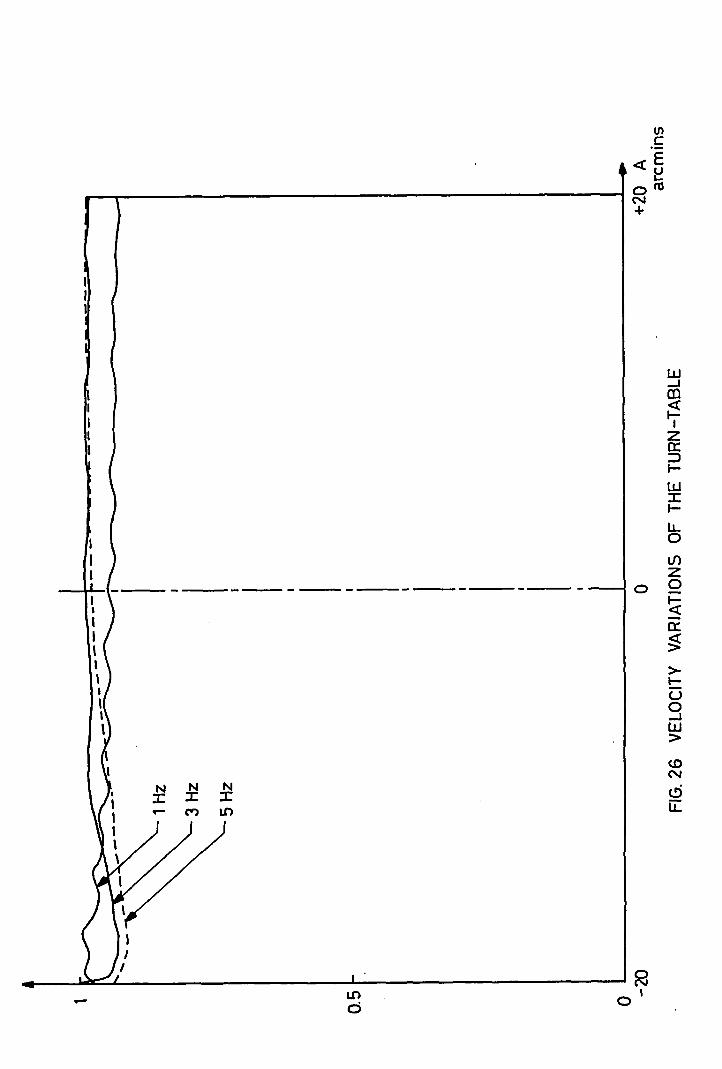
Fig. 26
is the macro calibration of the turn-table over
360 degrees;
shows the velocity variations at 1, 3, 5 Hz for a
scanning amplitude of + 20 arcmins;
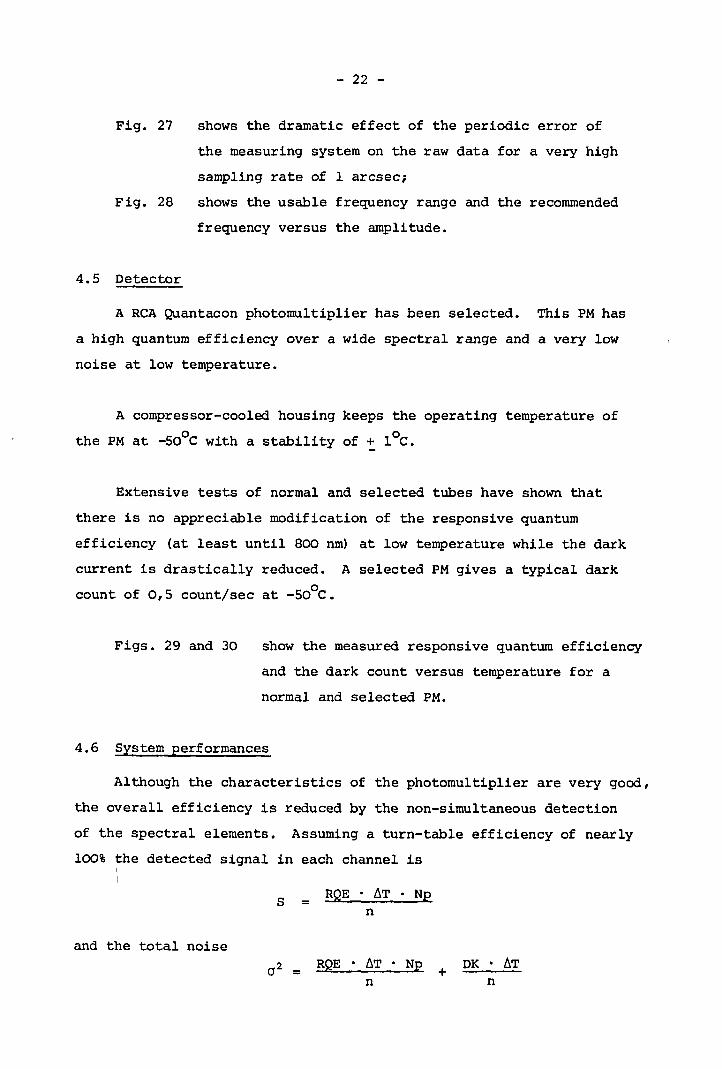
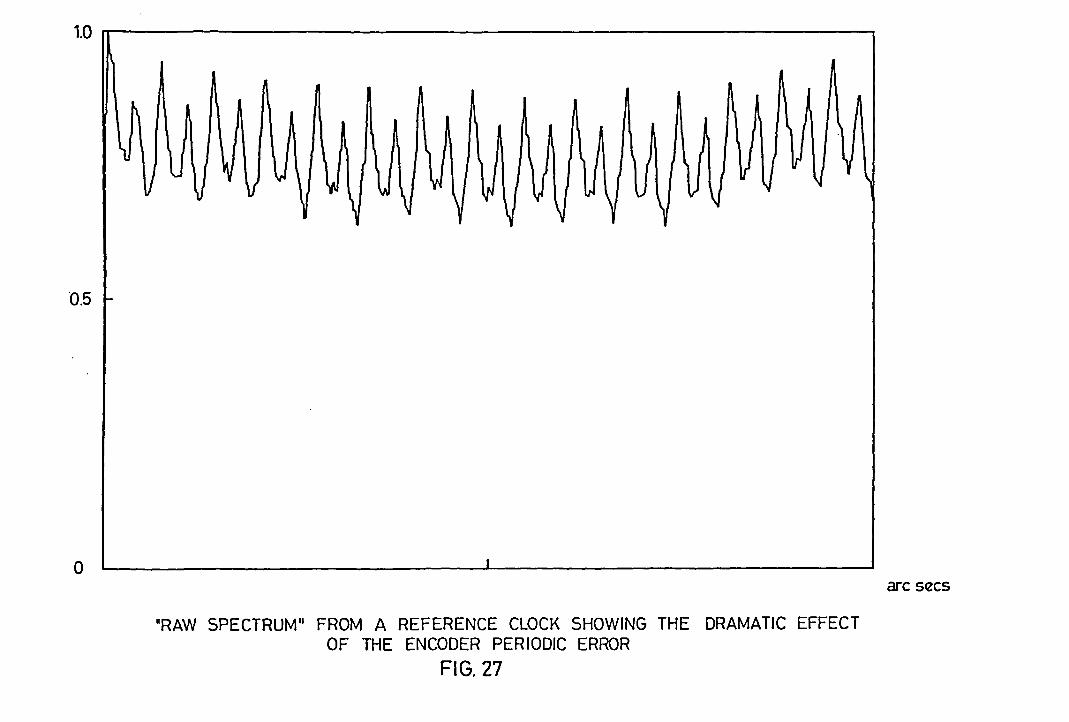
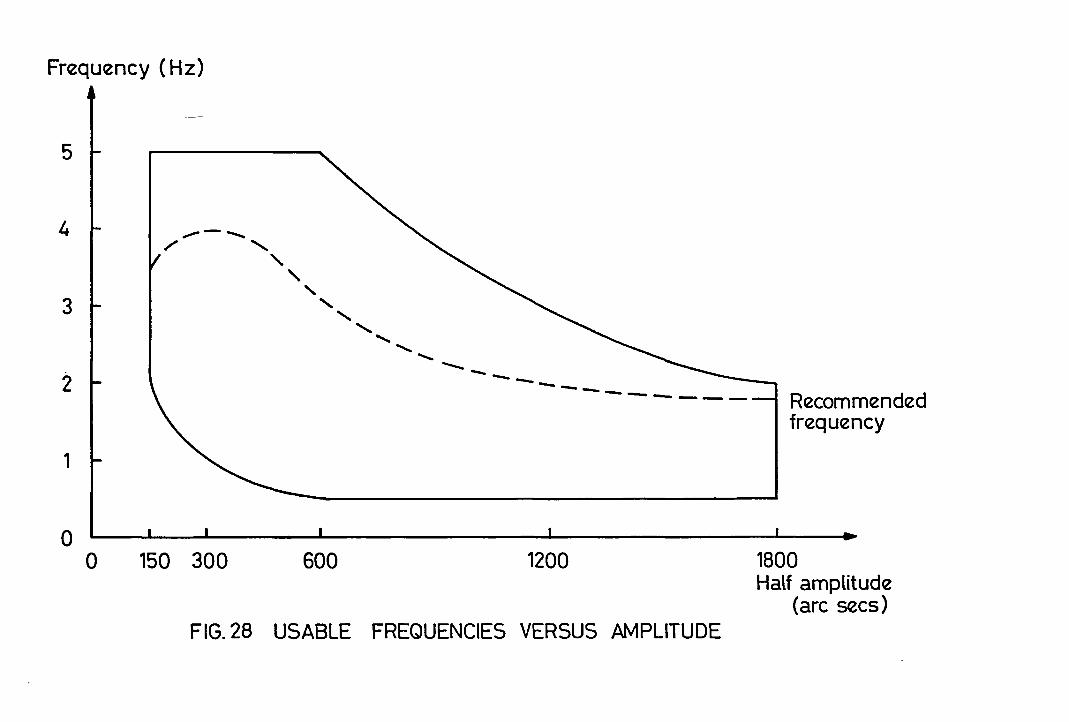
Fig. 27
Fig. 28
4.5 Detector
- 22 -
shows the dramatic effect of the periodic error of
the measuring system on the raw data for a very high
sampling rate of 1 arcsec;
shows the usable frequency range and the recommended
frequency versus the amplitude.
A RCA Quantacon photomultiplier has been selected. This PM has
a high quantum efficiency over a wide spectral range and a very low
noise at low temperature.
A compressor-cooled housing keeps the operating temperature of
the PM at _50oC with astability of + lOC.
Extensive tests of normal and selected tubes have shown that
there is no appreciable modification of the responsive quantum
efficiency (at least until 800 nm) at low temperature while the dark
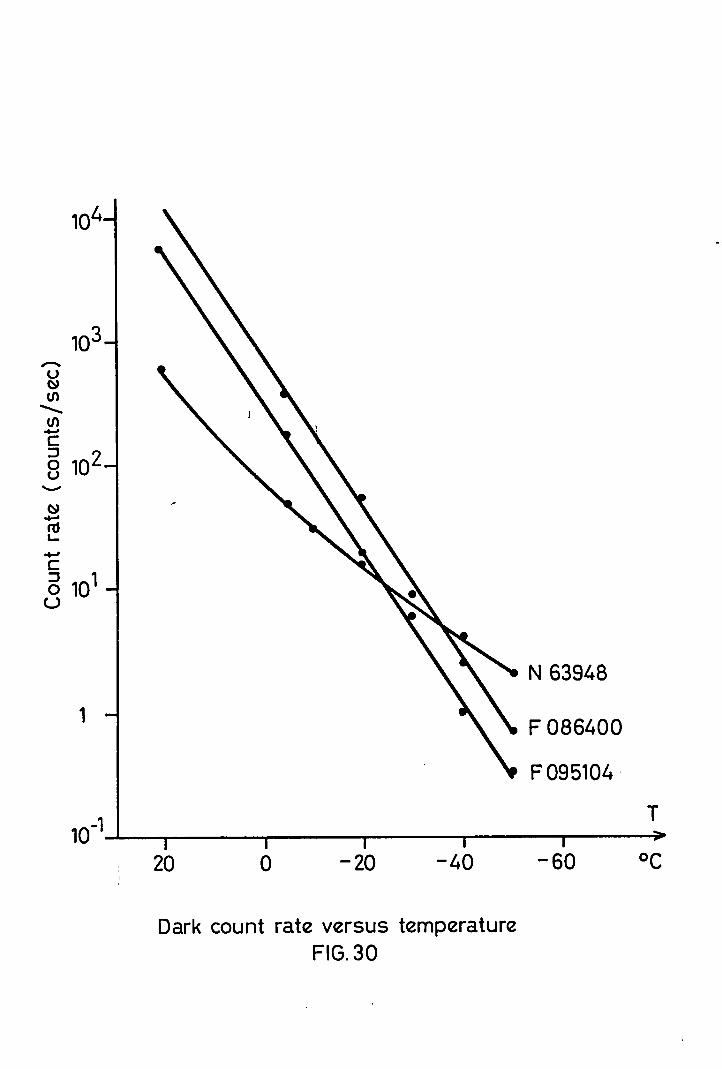
current is drastically reduced. A selected PM gives a typical dark
count of 0,5 count/sec at -SOoC.
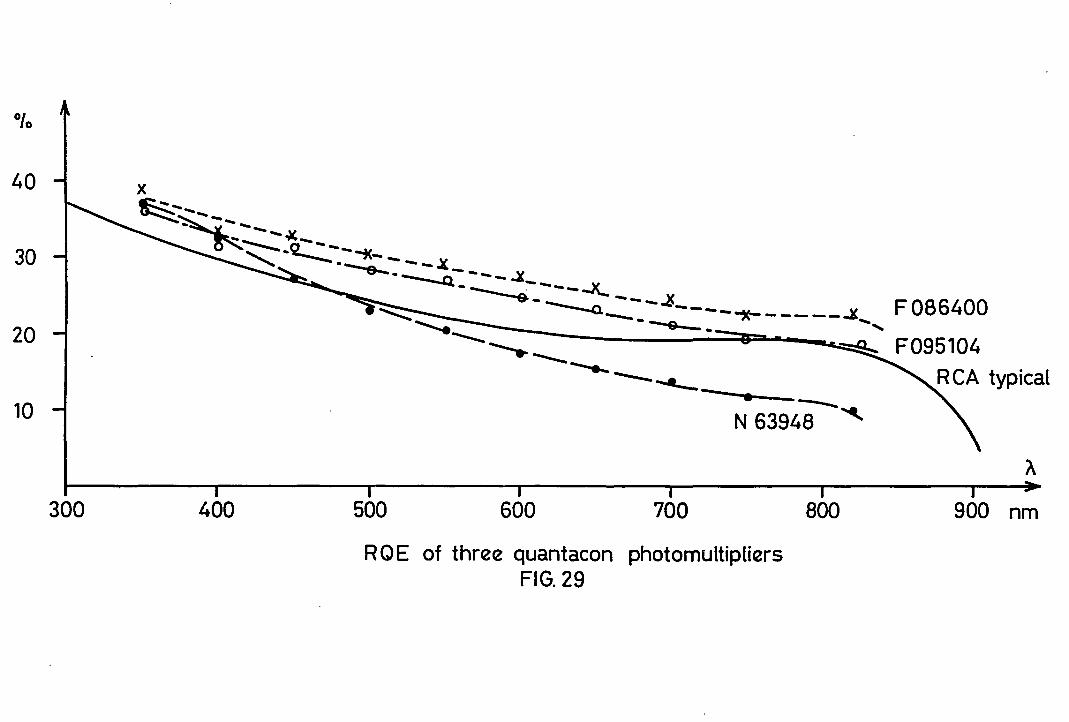
Figs. 29 and 30 show the measured responsive quantum efficiency
and the dark count versus temperature for a
normal and selected PM.
4.6 System performances
Although the characteristics of the photomultiplier are very good,
the overall efficiency is reduced by the non-simultaneous detection
of the spectral elements. Assuming a turn-table efficiency of nearly
100% the detected signal in each channel is
S =RQE • ~T • Np
n
and the total noise2 RQE· ~T • Np DK • ~Ta = - +
n n
- 23 -
where
RQE is the relative quantum efficiency;
!Y.T is the total integration time (exposure) ;
Np the photon flux;
n the number of channels;
DK is the dark count.
Fig. 41 gives the signal to noise ratio corresponding to 500
channels and one hour of integration compared with other detectors.
One should note that efficiency in double pass 1s approximately
the same as in single pass: the dispersion being twice as high it is
possible (for the same final resolution) to widen the slit, but since
the beam passes a second time on the mirrors and the grating, this
does not result in any gain.
5. MULTICHANNEL MODE
5.1 Choice of the detector
The astronomical programmes envisaged with the CES (2) require
a high spectral purity, i.e. an instrumental profile as far as possible
free of ghosts and wings, as weIl as a high sensitivity.
Although severa1 types of detectors may be considered, our choice
was oriented towards array and intensified array detectors whose
usefulness in this kind of work has been remarkably demonstrated by(3) (4)
R. Tull at the MdDonald Observatory •
Two multichannel detectors are therefore foreseen: one Digicon
and one Reticon. Both will use basically the same array (1872 diodes,
15 x 7oo~) and will fit equa11y the instrument. It might well be that
in the near future CCD arrays could supersede both of these detectors,
but the pixel size being nearly the same, no modification of the basic
instrument will be necessary.
- 24 -
The 1872 diode array is a modified version of the dual Reticon
936 diodes. The two rows of diodes of the standard array are too
close to each other to take full advantage of the two arrays. Hence
it is preferable to use a single array with twice the height and twice
the number of diodes. The loss introduced by the non-simultaneous
observation of the background is partly recovered by the increase of
the detector resolution because the same final spectral resolution is
obtained with a wider entrance slit.
5.2 Optimization of the camera aperture
The classical rule of thumb to optimize spectrographs consists of
matching the projected slit width with the detector resolution. Although
this method does give good results to determine roughly the spectro
graph characteristics, it does not say anything about the real resolution
which could be expressed in terms of MTF or full width at half maximum
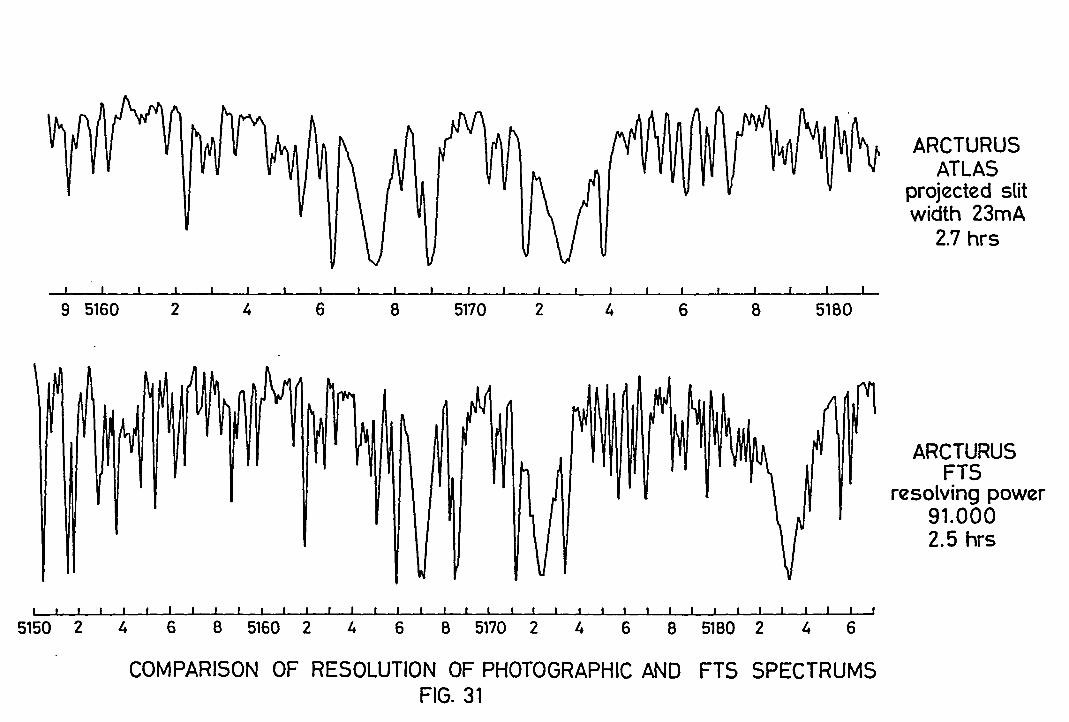
of the instrumental profile. This is demonstrated in Fig. 31 which
compares photographie and FTS spectrum of Acturus: despite the projected
slit width about half the resolution of the FTS spectrum, much more
detail appears on the latter.
Therefore, the projected slit width is not a correct definition
of the resolution. Modulation transfer function may be seen as clumsy
by the astronomer but it is very convenient for the designer, because
final MTF can simply be obtained by multiplying MTF of slit, optics
and detector, and moreover the instrumental profile can be easily
calculated from the MTF.
As for the scanner (see 4.3), our criterion of resolution is the
frequency corresponding to a modulation of 20%.I
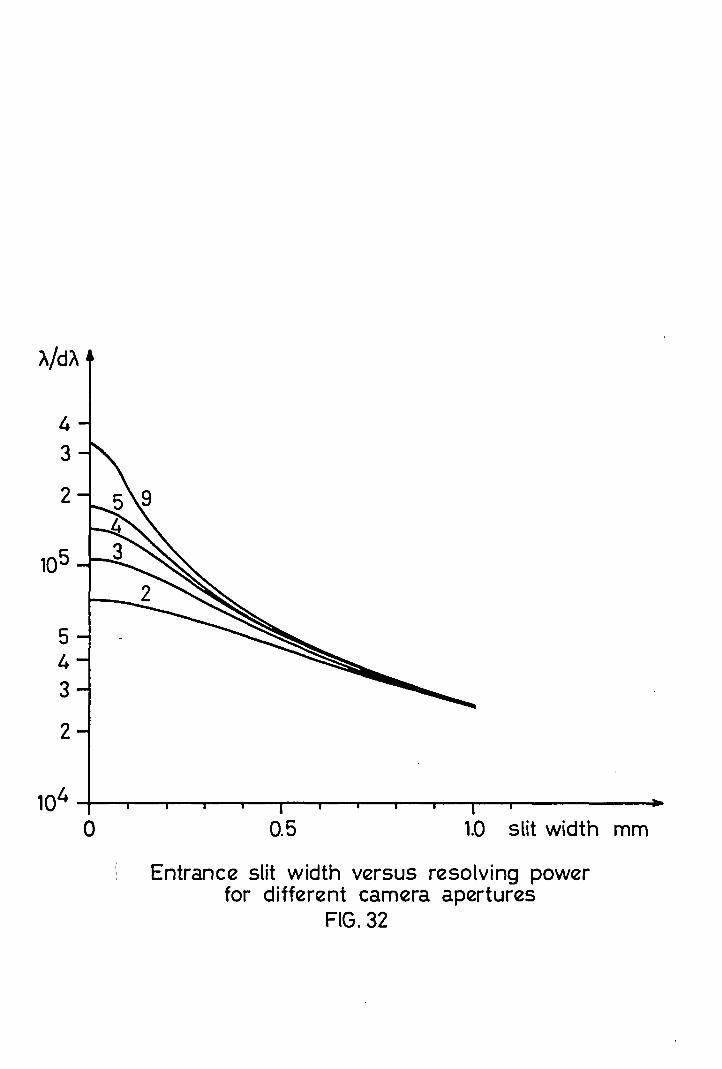
For a given detector and a given camera focal length, one can
compute the resulting MTF for different slit widths. The MTF of the
optics is approximated in that case to a linear function whose contrast
is 50% for 40 lines/mrn. Detector resolution is assumed to be determined
by pixel size. The curves of Fig. 32 show how the resolution varies
- 25 -
with the slit width for different camera apertures. When the slit
becomes narrow, the resolution is entirely determined by optics and
detector whilst the slit influence predominates when it becomes larger.
With an array detector (or when sampling an analog signal) one should
pay attention to a possible aliasing at low frequencies caused by the
repetitive structure of the detector. Because the optical MTF is
generally steeply and continuously decreasing and is not that far from
the perfectly adapted filter, this effect can generally be ignored as
long as limiting frequency, as defined above, is kept below or around
the Nyquist frequency (equal to half the detector pixel frequency) .
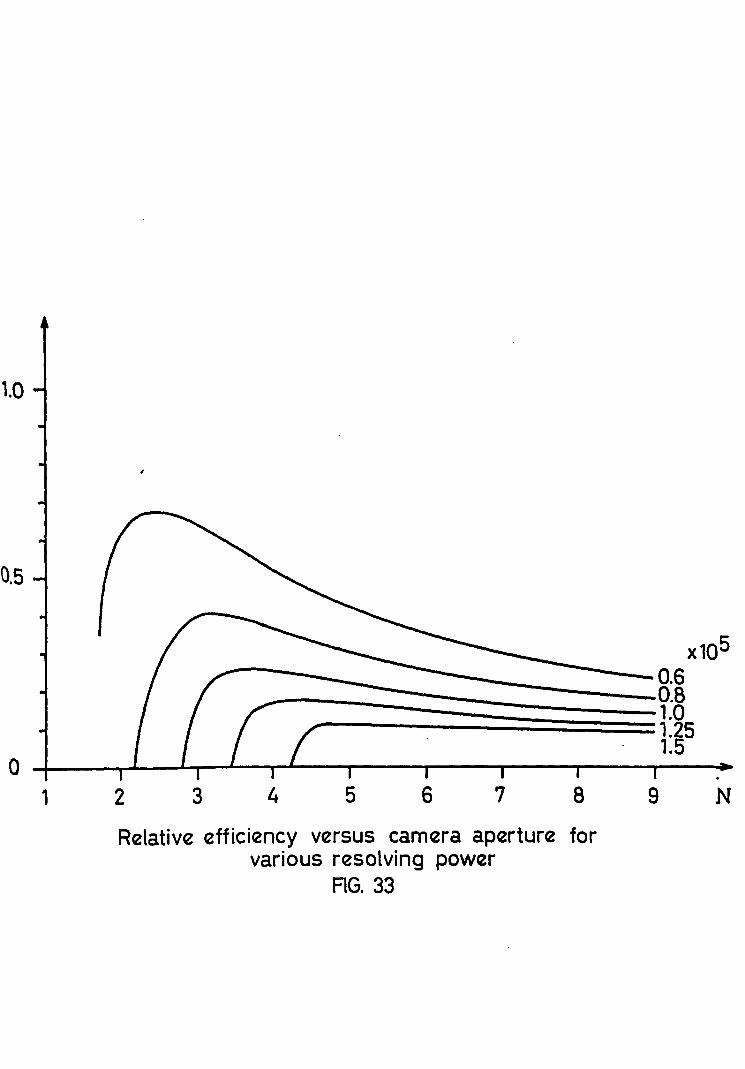
It is also possible to use these curves to determine the camera
best adapted to a given resolving power. If one defines a relative
factor of luminosity as being the ratio of the slit width to the camera
aperture (this factor is proportional to the number of photons collected
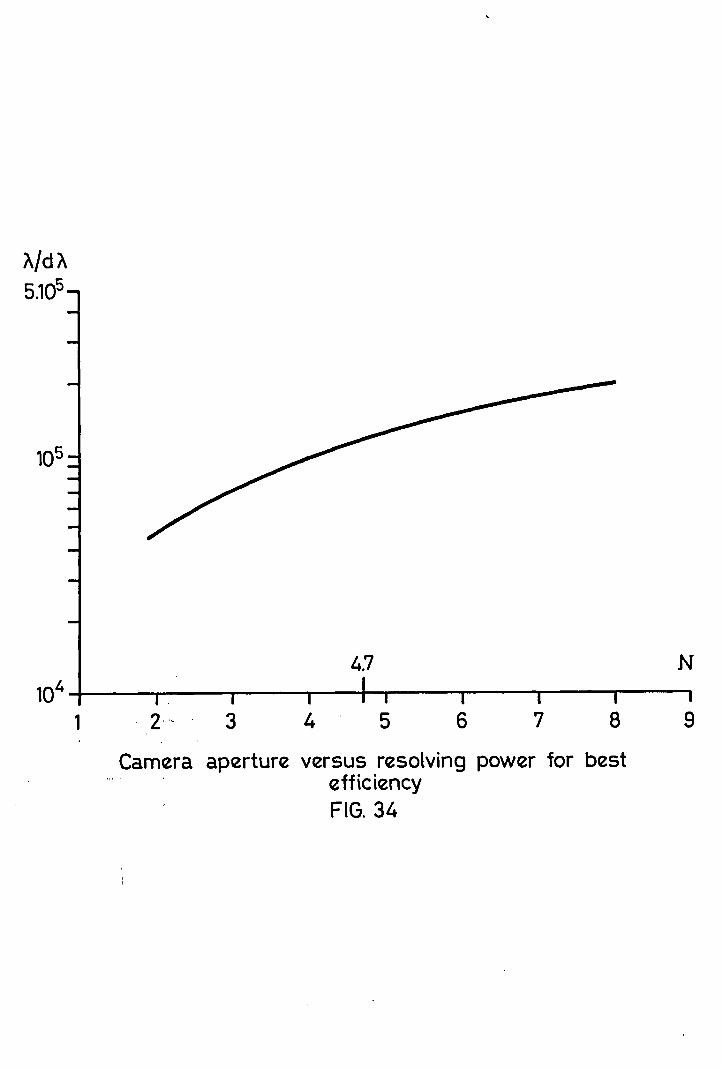
by one pixel), one obtains the curves of Fig. 33 from which the most
adapted aperture for a given resolving power can be easily determined
(Fig. 34).
A relative aperture of fiS has been selected to give a good
efficiency for resolving power of 70 to 120'000. At a R.P. of 100'000
the projected slit width corresponds to 42 m~.
5.3 Camera
A relative aperture of fiS with q field of 30 mm does not lead
to a complex design; nevertheless, a simple spherical mirror is
inadequate and a corrector must be added.
An off-axis Schmidt system would have the advantage of not having
a central occultation but would be a very expensive item. A MAKSUTOV
system with a Newton focus has therefore been selected. All surfaces
being spherical, the price is kept low and the central occultation is
only worrying with an image slicer in which the loss is limited to 9%.
- 26 -
After final optimization the real aperture of the camera becomes
4.7, the focal length 942 mm, and reciprocal linear dispersion 1,46 ~/mm.
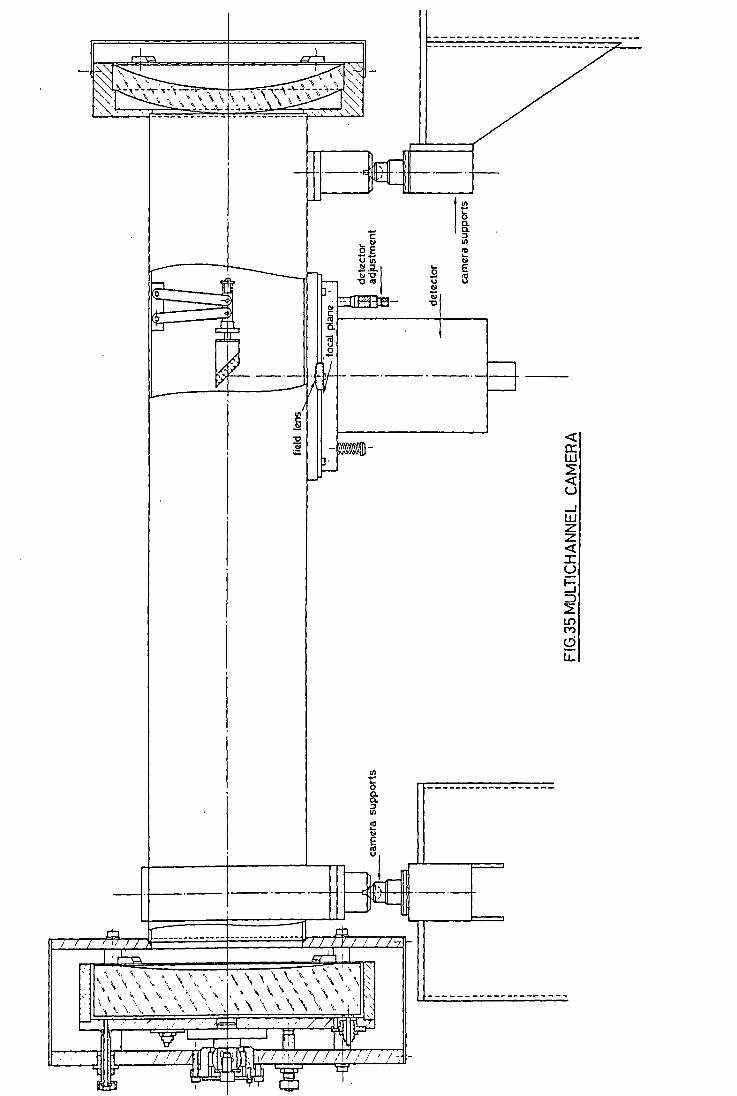
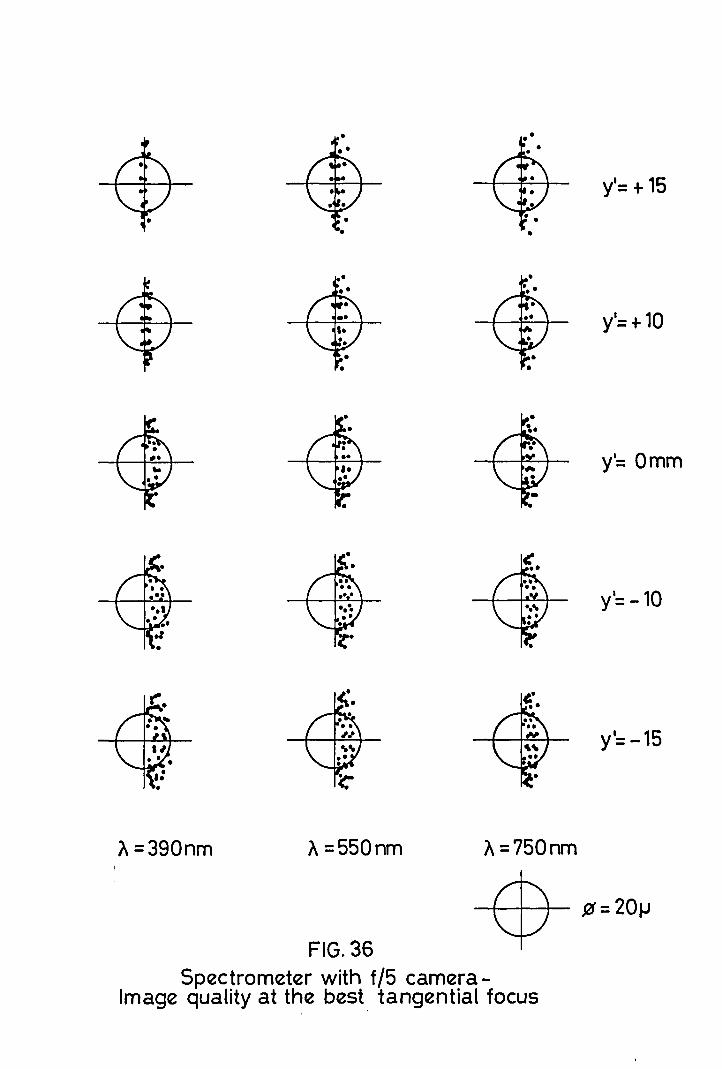
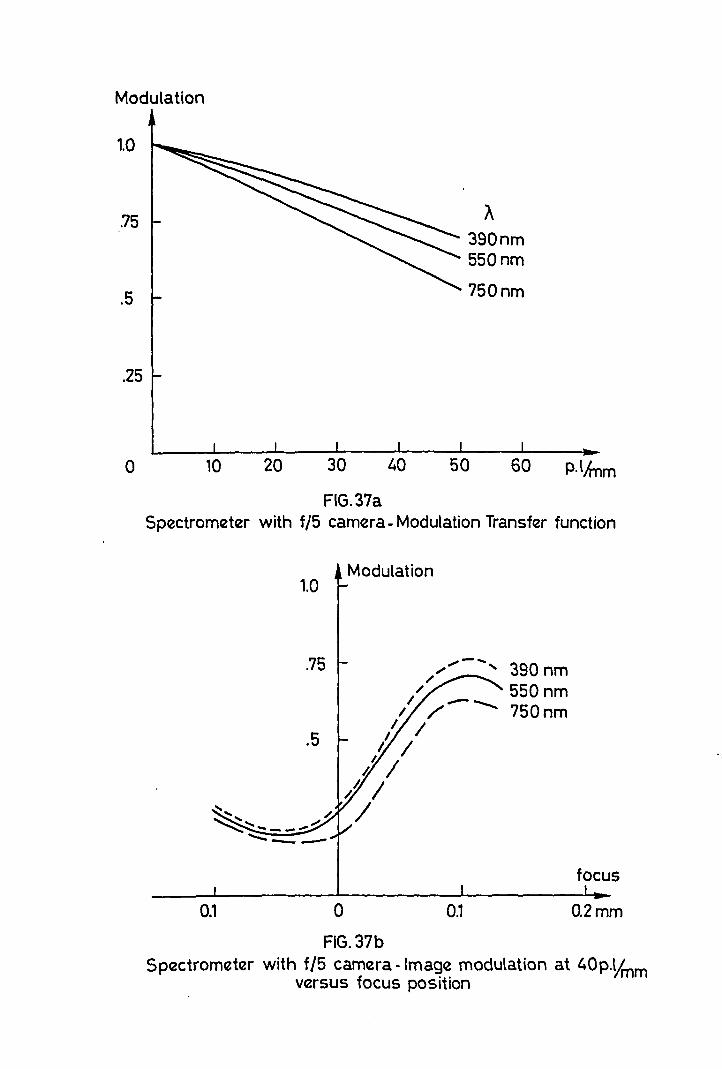
Fig. 35
Fig. 36
Fig. 37
shows the optical and mechanical scheme of the camera.
illustrates the optical quality. The spot diagrams
are computed taking account of the complete instrument.
Astigmatism is introduced by the off-axis angle of the
collimator.
(a and b) shows the MTF of the spectrometer for different
wavelengths and its variation with the focusing.
The camera is manually set up on two pillars located between the
grating and the scanner camera mirror. The detector is hung under the
camera with a 3-point attachment allowing orientation and focusing of
the detector.
,The camera and the detector can easily be removed and replaced
by another one. In the first phase only one camera will be built.
Optical elements will be coated with aluminium and single layer anti-
reflexion coating. It is a wide-band camera and two cameras with
specific coatings for blue and red bands would be more efficient by
about 25%.
5.4 Digicon
5.4.1 Description
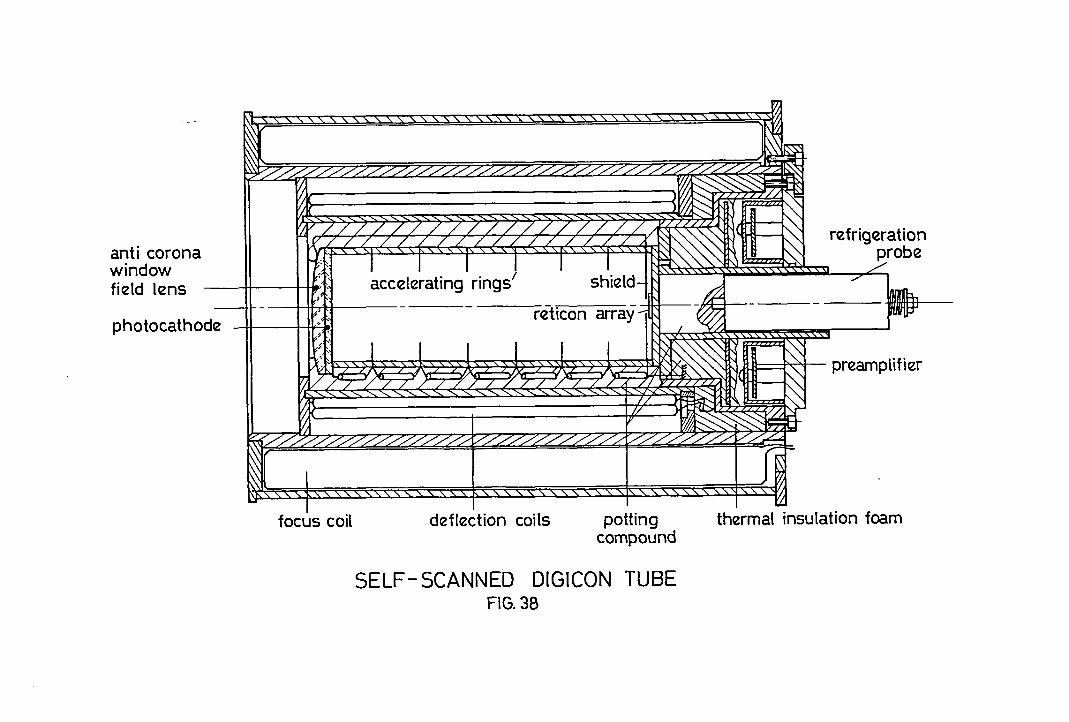
The Digicon tube (Fig. 38) is a magnetically focused one-stage
intensifier where detection is achieved by a diode array working in
EBS mode. If an important number of channels is required, the diode
array ~annot have a parallel output and therefore practically excludes!
a pure photon counting process. Nevertheless, the performances of this
type of detector are not notably different from those of a photon
counting system, with the considerable advantage of greater simplicity.
- 27 -
The Digicon selected for the CES has one Reticon diode array of
1872 diodes 15 x 700~ and a S-20 photocathode. The camera field lens
is cemented on the front window, to reduce light losses and possible
ghost images.
The accelerating potential is 20 to 30 kV and focusing achieved
by a coil. Orthogonal deflection coils produce perpendicular magnetic
fields which allow deflexion of the electronic image along and
perpendicular to the array.
In order to limit the thermal leakage of the diodes, the array isocooled down to -80 c, thus allowing integration times of up to 60 seconds.
Cooling is achieved through a closed loop refrigerator with direct
expansion of coolant in the refrigeration probe.
Pre-amplifiers are set directly in the back of the tube, thus
limiting the length of the wires to the array.
Analog circuitry including video processors, clock drivers and
digitizer are contained in an "analog chassis" located near the detector.
All the digital control circuitry and power supplies are located in a
remote chassis outside the coude room. The electronics is interfaced
on a standard input/output CAMAC module; data are sent to the computer
through a Direct Memory Access channel immediately after a read-out
request.
5.4.2 Predicted Digicon performances
Photocathode has approximately an S 20 response. Dark emission
of this type,of pho~ocathode is reported to be 100 p.e./sec/cm2, which
corresponds to 10-4 p.e./sec/pixel, in practice a negligible value.

- 28 -
Major noise contribution is the read-out noise which can be
limited with very good amplifiers to 1000 e-h/read-out/pixel RMS.
Typical gain of the tube being 3000, this corresponds to 0,3 p.e/
read-out or 1,5 ph/read-out/pixel.
Another important noise contribution is the thermal leakage of
the diodes, which is the equivalent of a dark emission. At a temperatureoof -80 C the normal leakage of a Reticon array may be considered
negligible for integration times of several minutes. Unfortunately,
the leakage current increases considerably when the diodes are exposed
to an electron bombardment. Leakage current 10 to 50 times above(3)
the initial value has been reported but good performances can be
retrieved through a special annealing procedure which must be done
from time to time depending of the electron dose received by the array.
A reasonable average value of leakage is 16'000 electrons/sec. If
one takes only into consideration the major contributions, noise is
described by the equation:
0 2= (RQE) . Np n 6t + 2 . nOR 2
GNL+ 2 . n x 6tG2
where RQE responsive quantum efficiency
Np = photon flux
6t = elementary integration time on target
n = number of cycles
0R = read-out noise
NL = thermal leakage
G = tooe gain
A cycle is assumed to be composed of one integration 6t on the
object ~d one identical integration on the background. The back
ground 1s primarily composed of the detector fixed pattern signal
and possibly sky background.
- 29 -
With an integration time of 30 seconds, one hour of observation,
and a RQE of 20%, a S/N of 10 would be obtained with a photon flux
of 0,32 ph./sec/pixel.
5With a resolving power of 10 and an expected instrument/telescope
efficiency of 0,01 (which takes account of a seeing disc of 2 arcsecs),
this would correspond with the 3.6 m telescope to a star of magnitude 12.
5.5 Reticon
5.5.1 Description
The detector itself is weIl known and has been used in astronomy
for several years (4) (5) (6) (7) (8). The Reticon system used with the
CES has been primarily developed by ESO for near infra-red spectroscopy.
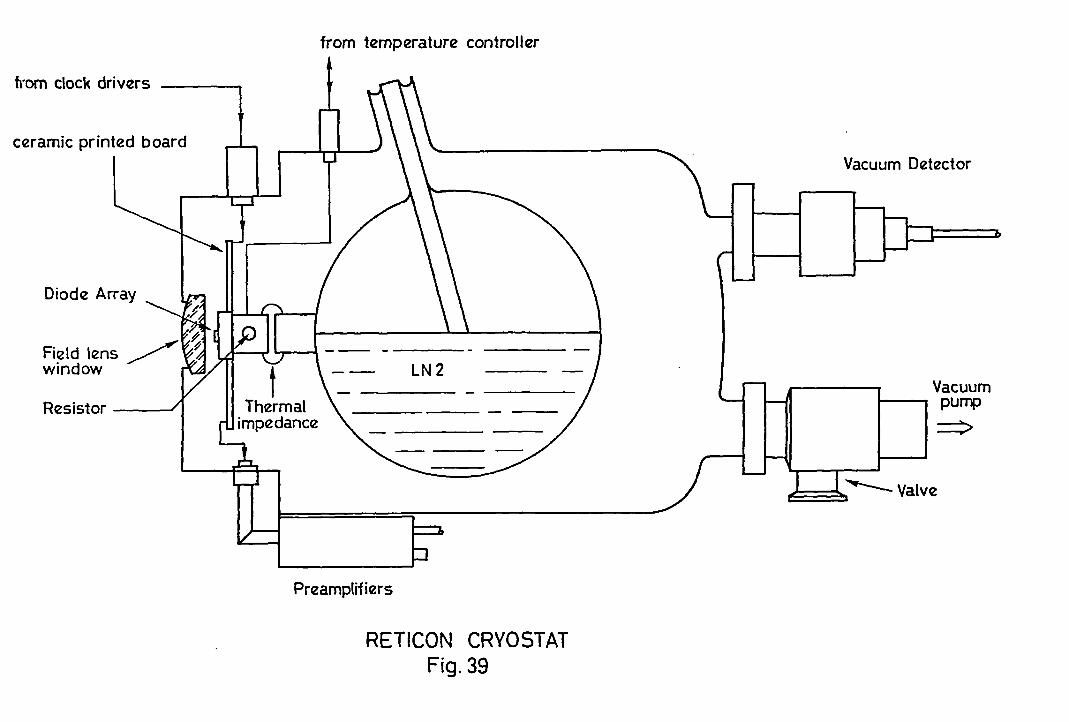
Mechanical schematic is shown by Fig. 39. The cooling, down
to -130oC, is achieved by a liquid nitrogen cryostat, array temperature
is regulated with a resistor. Vacuum ensures thermal insulation
and protects against moisture. The analog electronics is located
around the cryostat in order to limit the length of wires.
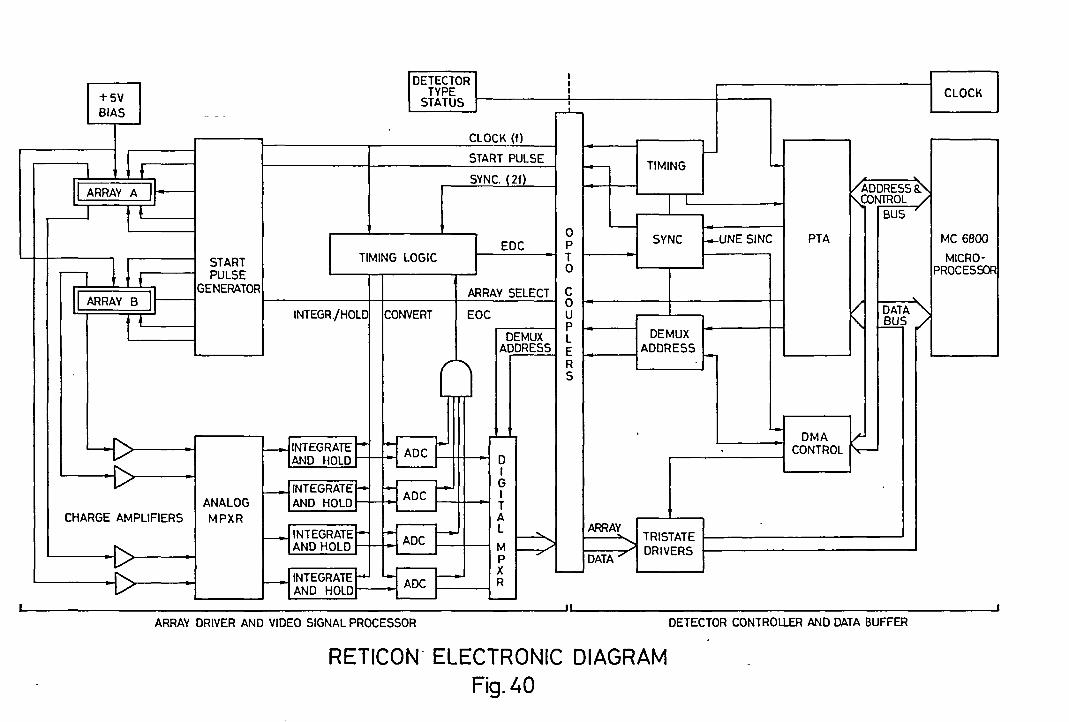
Fig. 40 shows the diagram of the electronics. It can cope with
double arrays as weIl as single arrays of up to 4 video lines. Charge
amplifiers are from ORTEC and a microprocessor ensures local control
and interfacing with the computer.
5.5.2 Performances
Contrary to the Digicon, the Reticon performances are almost
entirely determined by the read-out noise. A careful adjustment of
electronics gives, like for the Digicon, an RMS read-out noise of
1000 e-h/pixel/read-out but because there is no amplification it
corresponds to approximately 2500 ph/pixel/read-out if one takes an
averaged RQE of 40%.
- 30 -
Thermal leakage is less than 1 e-h/sec at a temperature of
-130oC and practically negligible for normal exposures.
The noise then becomes:
0 2 = RQE· Np . n . 6t + 2 . n . OR 2
Considering the high value of R, one will try to have only one
exposure, then n would equal 1. Ideally one should make one exposure
on the background and one on the object with the same integration
time. In fact, one can compromise, if the sky background is negligible,
with one exposure of a few minutes to record the detector fixed pattern
signal, which will be latter subtracted from the object signal. Care
should be taken that the detector parameters remain stable.
Fig. 41 shows the signal to noise ratio of the Reticon compared
with the scanner and the Digicon; for one hour exposure time, a5 0 (4)
resolving power of 10 and A = 4500 A. As shown by Tull ,the choice
of the detector depends primarily on the object; with a bright object
the Reticon becomes more efficient than the Digicon because of its
higher quantum efficiency.
6. CONTROL AND INSTRUMENT OPERATION
The schematic of the instrument control system is shown in
Fig. 42. The design is aimed at facilitating the maintenance of both
hardware and software. To that effect, the control is divided into
functions assumed by physically independent modules; most of them
are standard ESO design or already commercially available. In a
similar way software intelligence is distributed at different levels
depending on the degree of interdependence and of the timing of thei
functions.
- 31 -
1. The Centra1 Coude Instrumentation Computer (HP21MXE) is used for
data storage and processing and works under RTE system. Standard
software routines may be used such as the ESO Image Handling and
Processing Software (IHAP) which is now a standard system
imp1emented at La Si1la on severa1 instruments. It may be used
during observation with the current observation or the result of a
previous observation. Peripherals are one disk, one magnetic tape
unit and one printer-plotter.
2. The stand-a1one instrument computer. This is again an HP21MXE
computer dedicated to the instrument and working under BCS, whose
duty is to ensure data acquisition and macro-contro1 of the
instrument. A CAMAC system is used as an interface with the
instrument.
3. Local contro1 is generally achieved by micro-processors performing
specific tasks. For instance, the turn-table, the Reticon'and the
Digicon have their own micro4Processors while motors (both DC and
stepping motors are used) are controlled with micro-processors
10cated in CAMAC modules. One module may control up to 4 DC motors
and 4 stepping motors. The power stages as weIl as PM pre-amplifiers
and HV power supplies are located in a NIM module.
The computer terminal is located in the control room and cons~sts
of one alphanumeric display and one graphie display; a printer-plotter
serves as graphie hard copy and observation log: the graphie display
content is printed at any time, by pressing a key.
In addition a touch-sensitive transparent panel is set on the
standard display. This panel possesses 16 software keys triggered
by a simple finger touch; the display identifies the function
corresponding to the touch.
- 32 -
The program can dedicate each key to different functions with
practically no limitation. This leaves only a few hardware functions
to be controlled from the instrument control panel.
The touch sensitive panel is only used to select functions;
numerical parameters are entered with the keyboard through a "form
filling" technique. With a conventional terminal, it is possible
to operate character-by-character as a completely interactive mode
or by sending at once a complete block of data. This second transmission
mode, called "form-filling", allows a user's dialogue which is both
powerful and convenient and is used as support of the keyboard
utilisation.
A form is a set of text lines displayed together on the screen
and divided in two parts:
the text fields (defined as protected fields) provide a clear
identification or a general comment. These fields are not
transmitted to the computer.
the data fields (defined as unprotected fields) are filled in by
the user in the normal mode with the keyboard. The cursor indicates
which field is selected.
After reaching the end of a data field, the cursor moves auto
matically to the beginning of the next data field; the "TAB" key
can also be used to move the cursor from one field to the next one.
The characters typed on the keyboard are not transmitted to the
computer as soon as they are typed. So the user can fill the form"
completely, check and if necessary correct the values before sending
"the screen" into the computer by pressing the "ENTER" key.
- 33 -
As soon as the data flow (i.e. the ASCII character string) has
been received and parsed by the computer, each parameter is checked:
valid character: for example, no letters in a numerical field.
valu~ within the range defined at the creation of the FORM.
If an error is detected, a message is displayed at the bottom of
the screen and the cursor is automatically positioned at the beginning
of the data field containing an error.
A"HELP" command is available for the user resulting in a self
teaching dialog with the computer. The character "?" typed in a data
field will result in a short description of the parameter to be
displayed on the screen.
As an example, Fig. 43 shows a touch panel form used for
manipulating buffers (star, background, calibration). Fig. 44 shows
a form used to set the Digicon parameters.
The different forms used are schematically illustrated by
Fig. 45. They are subdivided in three phases.
instrument setting: setting of wavelength, resolution, spectrum
length, scanning frequency, etc.
detector setting: integration time, exposure time, dweIl cycle, etc.
The form corresponding to the detector is automatically selected.
observation control: a first form is used for general commands:
start, stop, abort, etc. A second form is used to select the
buffer to be displayed: star, background, star minus background,
calibrated spectrum, etc. The third form controls the graphic
display: roll, zoom, etc.

- 34 -
Another set of forms is used to introduce the fixed parameters
of the instrument. Those are:
grating paramete~s: ruling frequency, limits of orders.
turn-table parameters: offset angle; maximum, minimum and
optimum scan frequencies for several amplitudes.
prism calibrations: prism position for several reference wavelengths
from which the actual position is determined.
slit function: for the different modes and detectors.
Thus the interface between the observer and the instrument is
quite versatile and easy to operate and the necessary know-how to
operate the instrument is reduced to aminimum.
* * *
- 35 -
A N N E X 1
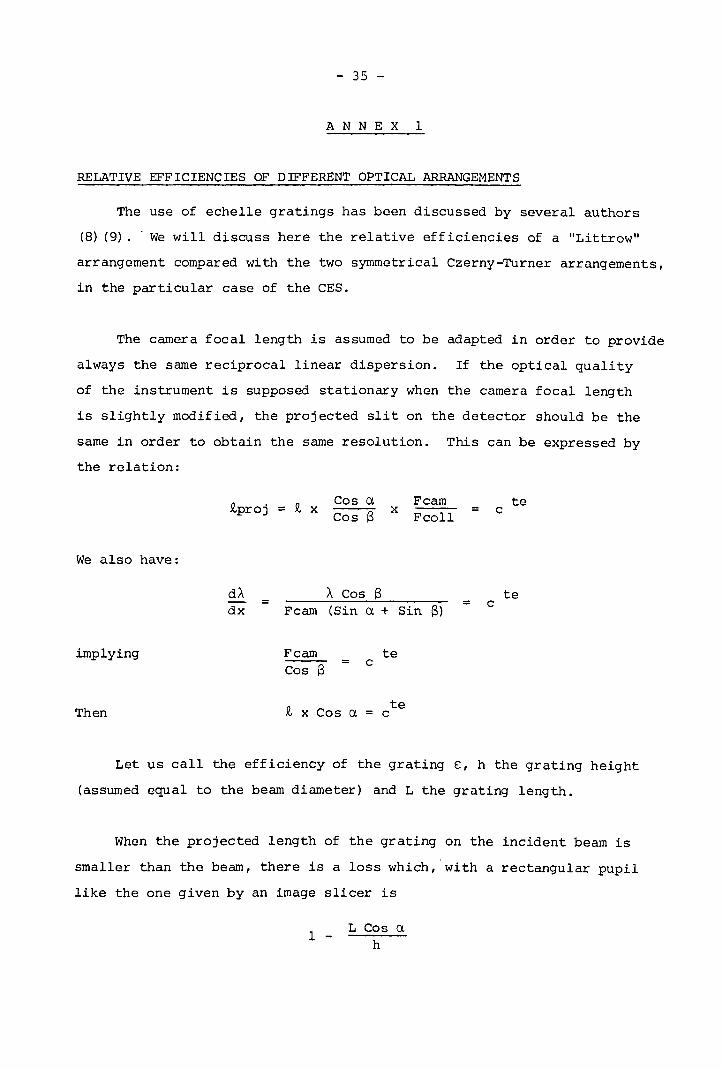
RELATIVE EFFICIENCIES OF DIFFERENT OPTICAL ARRANGEMENTS
The use of eehelle gratings has been diseussed by several authors
(8) (9) .. We will discuss here the relative effieieneies of a "Littrow"
arrangement eompared with the two sYmmetrieal Czerny-Turner arrangements,
in the partieular ease of the CES.
The eamera foeal length is assumed to be adapted in order to provide
always the same reciproeal linear dispersion. If the optieal quality
of the instrument is supposed stationary when the eamera foeal length
is slightly modified, the projeeted slit on the deteetor should be the
same in order to obtain the same resolution. This can be expressed by
the relation:
We also have:
.R.proj = .R. xCos aCos ß x
FeamFeoll e
te
implying
Then
dA A Cos ß te- = = edx Feam (Sin a + Sin ß)
Feam te= e
Cos ß
.R. x Cos ate
e
Let us eall the effieieney of the grating E, h the grating height
(assumed equal to the beam diameter) and L the grating length.
When the projected length of the grating on the incident beam is
smaller than the beam, there is a loss which,with a reetangular pupil
like the one given by an image slieer is
1 -L Cos a
h
- 36 -
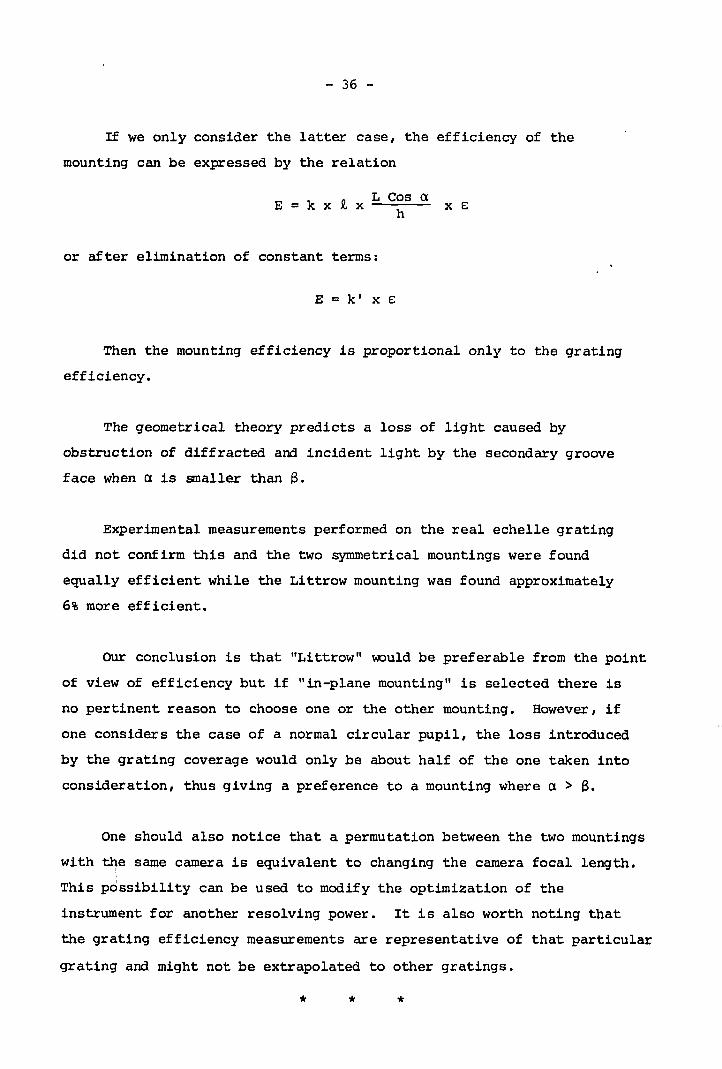
If we only consider the latter case, the efficiency of the
mounting can be expressed by the relation
E = k x ~ x L Cos ah
or after elimination of constant terms:
E = k' x E
x E
Then the mounting efficiency is proportional only to the grating
efficiency.
The geometrical theory predicts a loss of light caused by
obstruction of diffracted and incident light by the secondary groove
face when a is smaller than ß.
Experimental measurements performed on the real echelle grating
did not confirm this and the two SYmmetrical mountings were found
equally efficient while the Littrow mounting was found approximately
6% more efficient.
Dur conclusion is that "Littrow" would be preferable from the point
of view of efficiency but if "in-plane mounting" is selected there is
no pertinent reason to choose one or the other mounting. However, if
one considers the case of anormal circular pupil, the loss introduced
by the grating coverage would only be about half of the one taken into
consideration, thus giving a preference to a mounting where a > ß.
One should also notice that apermutation between the two mountings
with tite same camera is equivalent to changing the camera focal length.
This pdssibility can be used to modify the optimization of the
instrument for another resolving power. It is also worth noting that
the grating efficiency measurements are representative of that particular
grating and might not be extrapolated to other gratings.
* * *
- 37 -
A N N E X 2
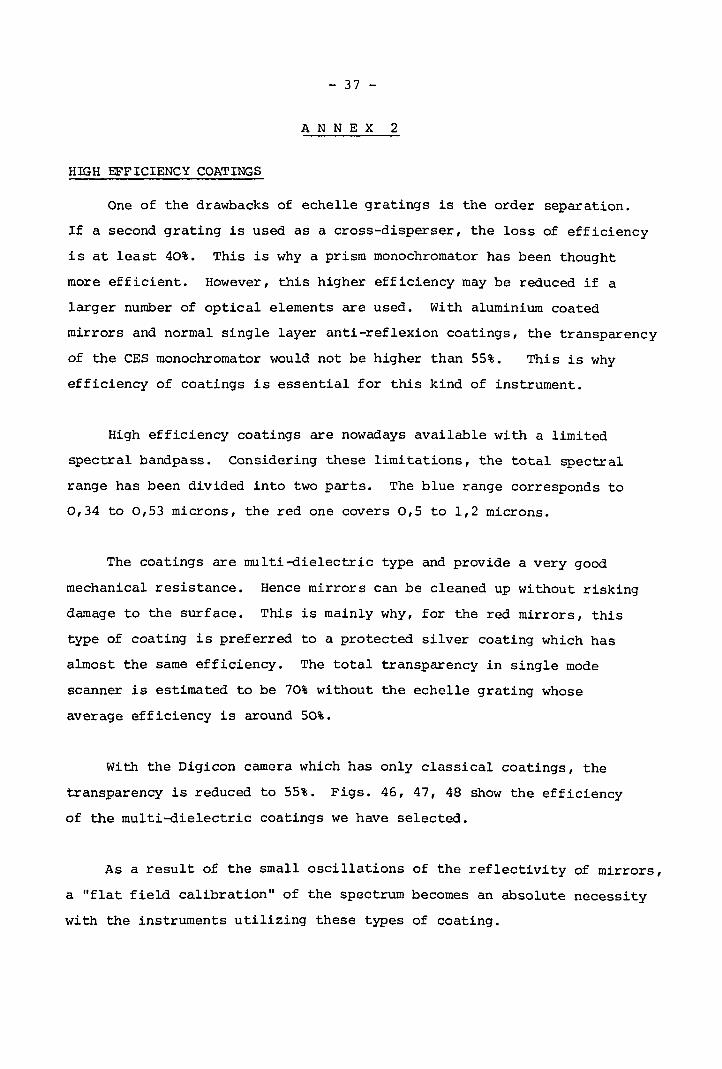
HIGH EFFICIENCY COATINGS
One of the drawbacks of echelle gratings is the order separation.
If a second grating is used as a cross-disperser, the loss of efficiency
is at least 40%. This is why a prism monochromator has been thought
more efficient. However, this higher efficiency may be reduced if a
larger number of optical elements are used. With aluminium coated
mirrors and normal single layer anti-reflexion coatings, the transparency
of the CES monochromator would not be higher than 55%. This is why
efficiency of coatings is essential for this kind of instrument.
High efficiency coatings are nowadays available with a limited
spectral bandpass • Considering these limitations, the total spectral
range has been divided into two parts. The blue range corresponds to
0,34 to 0,53 microns, the red one covers 0,5 to 1,2 microns.
The coatings are multi-dielectric type and provide a very good
mechanical resistance. Hence mirrors can be cleaned up without risking
damage to the surface. This is mainly why, for the red mirrors, this
type of coating is preferred to a protected silver coating which has
almost the same efficiency. The total transparency in single mode
scanner is estimated to be 70% without the echelle grating whose
average efficiency is around 50%.
With the Digicon camera which has only classical coatings, the
transparency is reduced to 55%. Figs. 46, 47, 48 show the efficiency
of the multi-dielectric coatings we have selected.
As a result of the small oscillations of the reflectivity of mirrors,
a "flat field calibration" of the spectrum becomes an absolute necessity
with the instruments utilizing these types of coating.

- 38 -
Nowadays, only medium size components of up to 300 mm can be
coated with sufficient uniformity. This excludes the coating of large
telescope mirrors or classical coude mirrors. A reduction of the
coude focus aperture of the 3.6 m telescope would allow the use of
smaller mirrors as proposed by E. Richardson. High efficiency mirror
coatings would then improve the efficiency of the 3.6 m telescope at
the coude by 55%. Another possibility would be to coat coude mirrors
with a protected silver layer giving the same gain but with a limitation
towards short wavelength to about 4000 R.
* * *
- 39 -
REFERENCES
(1) E.H. Richardson, ESO/CERN Conference Proceedings, 2-5 May, 1972
(2) D. Enard and J. Andersen, 4th Colloquium on Astrophysics,
Trieste, July 1978
(3) R. Tull, J. Choisser, E. Snow, Appl. opt., Vol. Nb. 5, 1975
(4) S. Vogt, R. Tull, P. Kelton, Self-scanned photodiode array,
lnt. Report, Univ. of Texas, Austin
(5) G. walker, lAU Colloquium, No. 40, Sept. 1976
(6) W. Livingston, lAU Colloquium, No. 40, Sept. 1976
(7) J.C. Geary, lAU Colloquium, No. 40, Sept. 1976
(8) M. Dennefeld, B. Guttin, P. Rossignol, ESO int. report 1979
(9) Burton and Reay, App1. Optics 1970, Vol. 9, No. 5
(10) D. Schroeder, Appl. Optics 1977, Vol. 6, No. 11
TV acquisition and
Prc-dispcrsa-guiding~'" .... ""' pathl
/"'ehe 1~"_
Entrancc
__ ~ Bc grating ll--....;:..~.._.:::::.~~ .._.. stit /
~_.-- ----'----
_._._._ ..~ ;_..:......:.""---..1 "-"':::::::~.._
._"-1 a___. ' .om.~ ..~ .._.. .._-_.. +. 3.6morCAT
_._._.Inl"-'"Grating tum-\able ! \ Exit Photomdt~ierslit
DO'btc pass system
Blult and rltdcolllmalorS and earllltrc1 mirrors,
~-=r==~ 0_" ,,",,,"f/5 ImuUi-c:haMct camcr&
COUDE ECHELLE SPECTROMETERSCHEMATIC OF THE OPTICAL ARRANGEMENT
Fig.l
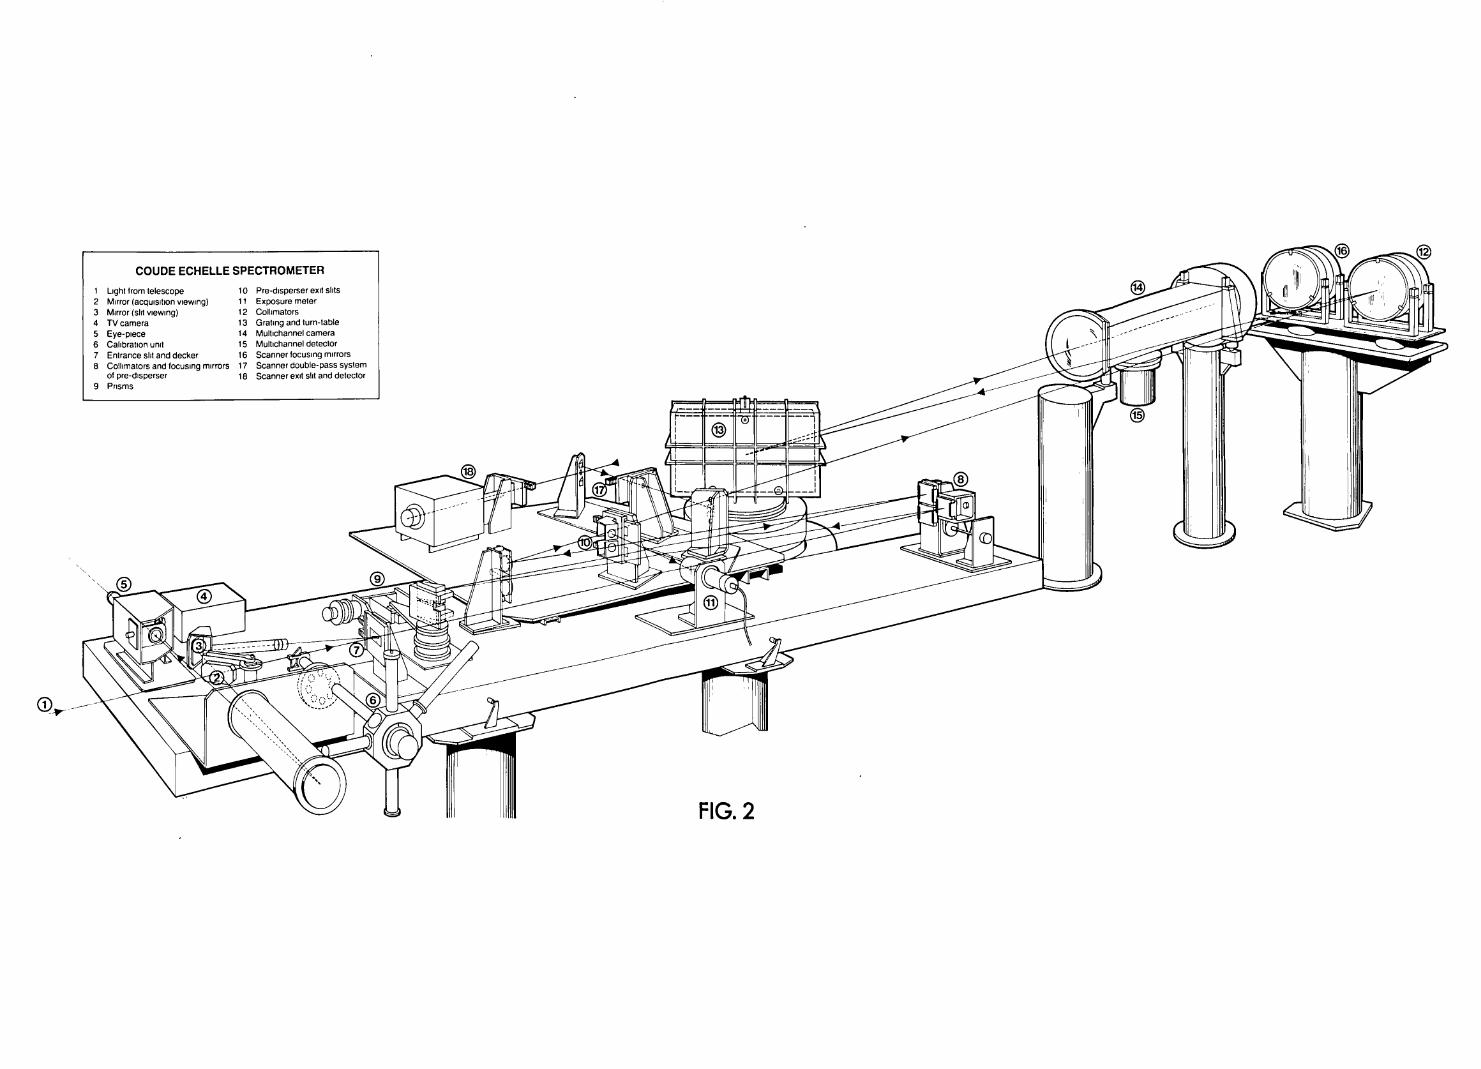
COUDE ECHELLE SPECTROMETER
1 Light trom telescope 10 Pre-dlsperser eXlt sllts2 M,rror (acqulsltlon vlewlng) 11 Exposure meter3 Mirror (sllt vlewlng) 12 Collimators4 TV camera 13 Gratlng and turn-Iable5 Eye-plece 14 Mullichannel camera6 Calibration uM 15 Mullichannel deteclor7 Enlrance sill and decker 16 Scanner focuslng mlrrorsB Coilimalors and focuslng mlrrors 17 Scanner double-pass system
of pre-dlsperser 1B Scanner eXil sill and deleclor9 Prlsms
FIG.2
31
IE1011I .....IIII
III1I
ff)Cl::WU:::JoWCl::
-.J
()f2t-<{U
W:r:t-C")
l.L.cn0-'=
U
~2:w:r:uff)
-.J<{UIa..o
I1
11\ I\ ~ /~ :( /I
:'I\ /\ :/ I\ :/ I\ :( /I :/
\ 1'1 /I I /I '(I , /I ,
I 'II , /I , 1\I: /~n/
Vn/1 I" ,
/' I, ,, I
/I I
: I ', I
I I I II I
'I 'I I It I
\ "':\n)I I
I I \ :11 \ :\I ~ ':11 ,I,
I 1
Turret for 2ndoptical element(doublet)
~~I---t-+ Orienlationadjuslmenl
from CAT.......
Turret forfront lens
·----{±i===!=.=t==;!!rll~ Adjustment of foot position
Bellows sealing unitwood canvas construction
towards -stit -"'11--- ---++- -+-11-- -I---+- -lIl---:+---l-t +--- ----ft --i_
SUPPORT OF FOCAL REDUCERSfig.4
::Lo<D .,....~ ---f-+-+----c;..'..:.
::L...<D .~.':' :CO---+-iH----iP.-i~~ .:..:.. ...
::LCOU') .... : :
~ ---H~,.1+-••••+..--0•• :
.'.'
0::WU::>ow0::.....J
~j'0
<.9l.L.l.L.
W::>.....JCO
r«u
::Lr--~ --~:+-i:~'~'1----~ .,;.:..
::LoLt'l<D-'1ft"l'-+-iH----C""! '••
WWC'OC =.A 070' =e
.'...
WWS'~Z =,A oCO' =e WWO=,A oo=e
E:::L.E00~ JI
JI ::::
:- 'EJI Vl
Vl
O~
:L.
§---+--+--+-- (:
::LN ••' ..c:oln.---+--+--+-.r.P-io' "
~. \. "
a:wu::>owa:-J
.c<tLOU'0
~LL.lL. O
Wa:
~u
::LCD\S---+-~~~-
ww~n~ =,1.. 0€0'=e WWO=.1.. 00=9
15
10
5
o
-5
-10
dX'mm
.40471-' .43581-'
(-7.92)
.48611-'
Blue focal reducer Chromatism of positionfig. Ga
(12.22)
l\
.65631-'
c0.-
o+J
'tn0a.....0
EUl.-
o+JrtSE
:L - ··et'--N '"": ..c .0(0IJ') <D U<.DtL:! I- .Ql
\-....
~u:J"0~\-
-rtSu0...."0~
0:
:l.-(0a)
-.:r:
-.- :L- a)IJ')('f')
~ - -.:r:.-NM
>< ('f')
"C -0 0 0 0 0('t) N - .-
I
Slit
Field mirror
.~amera
?v/_~.\\d~Coloured filters
-\.\---\:
\~, Eye Piece·
OPTICAL SCHEMATIC OF SLIT ENVIRONMENTfig.7
/ from CAT
/.///'/
./
'-~
0.
~ eil'0 ~
.s::;u
'- :t::
tl)0 ~-.!n0
:J E "fg0.'-
0 0\ ::::
.~~c: 0.'ä. 0
-tl) 0. ...CUc: tl) :§.~ tl) --0\ eil -.!:!!:t::c:
@
@
@ ~ CO.Cl.-
~
l.L.
~u eil
eil ~'0cu
,-tl)
~- üi0
(S)
eil~'0 @=iji::11
~
DECKER MASKF1G.9
-, I"II II II
I II II I
L
51 5.1.
/ 1\52 -51
52. +51
PRE-DISPERSER EXIT SLiT OUTPUTfig.10
1
0.5
700 nm600500400OL-L----..I.-----""""--------L-------I,____300
LLF1 PRISMS INTERNAL TRANSMISSIONfig.13
dAdlA-mm
250
150
50
i\
300 400 500 600 700 800 900 1000
FIG.11Reciprocal linear dispersion of predisperser
Ä
entranceslit
LLF1prism (22°)spherical
mirrorR =10.000
P.M ofcountmeter
centre-holedmirror
exit slit
mirrorf=2000
cotlimatorf= 2000
FIG.12PREDISPERSER OPTICAlSCHEMATIC
'.
~"
EE-+
o.g....~
"'C
EE-I
l/lE~ClCU.-
"'C...o0.
(/)Io:~w(/).o:~WI..L.a..(/)
CiLJJ0:a..
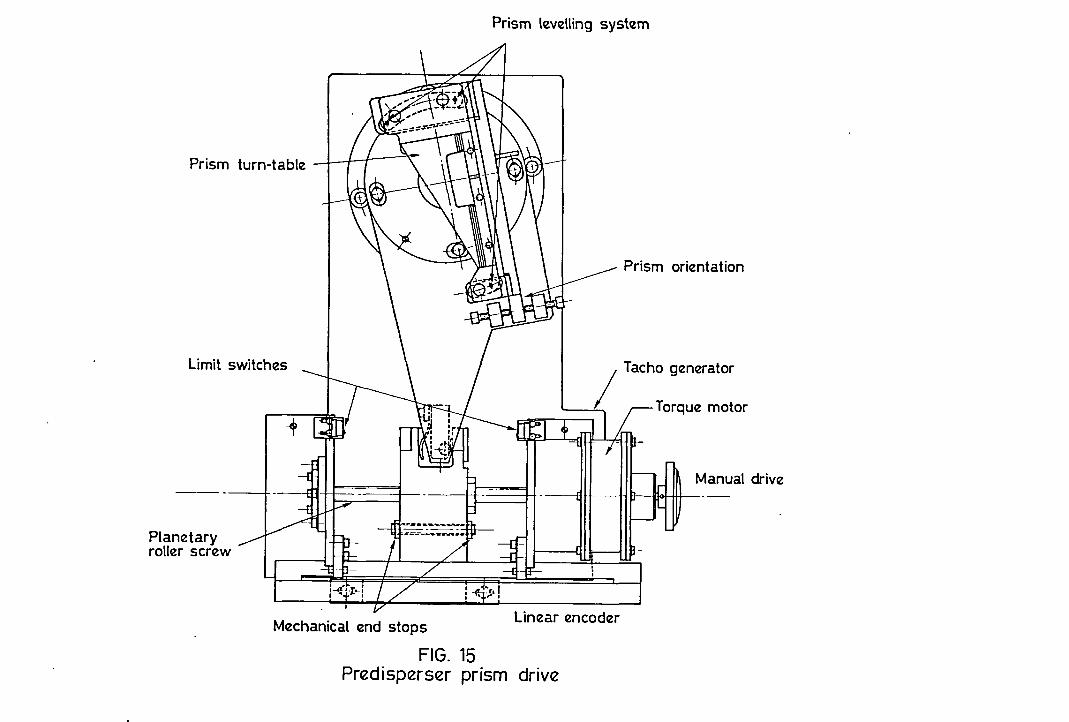
Prism level\ing system
Manual drive
Prism orientation
/
Tacho generator
I ,~Torque motor
Linear encoderMechanical end stops
FIG. 15Predispezrser prism drive
Prism turn-tabte
~
limit switches
Planetaryroller screw
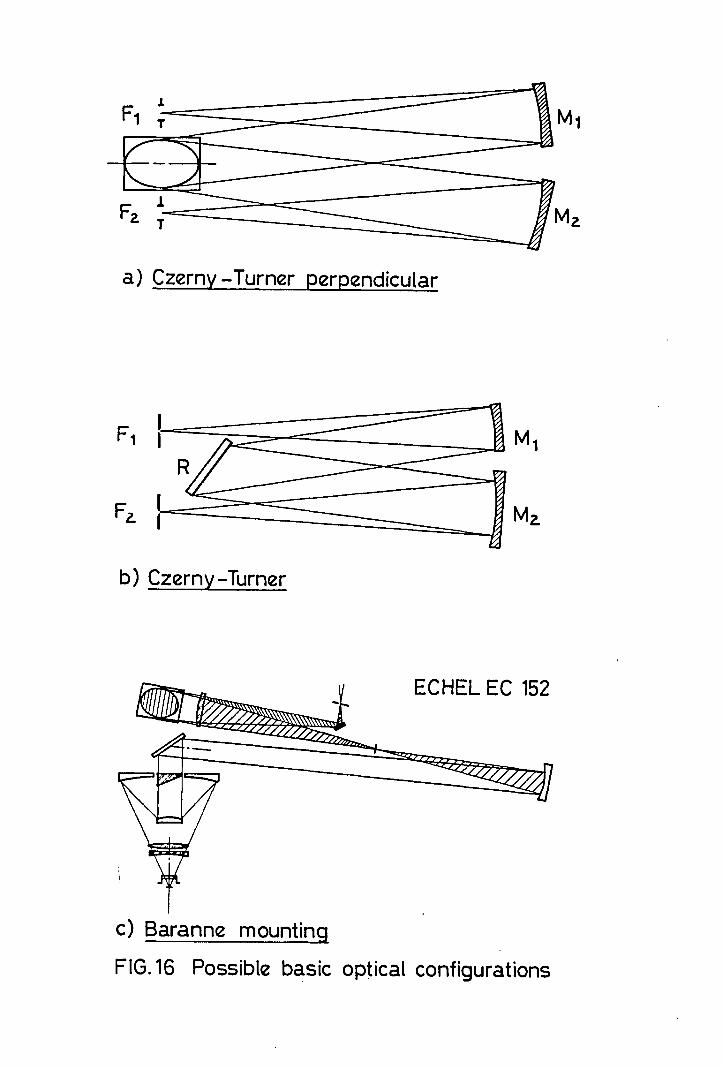
a) Czerny - Turner ~endicular
b) Czerny -Turner
ECHEL EC 152
c) Baranne mounting,
FIG.16 Possible basic optical configurations

Collimators single pass__- double pass
Entrance s\\ts
-------~Echellegrating /
00/ Intermediate slit
/ Exit slit
--=:::--- =:::--- :::::0--
- - .:::::::--=--=-=:::::"...
---- :::::----.
----------=~~~~~----- -----. -- ~ ---
J::>,
blue
Camera mirrors( 2 positions forsingle and doublepass)
COUDE ECHELLE SPECTROMETERSCANNING MODE
Fig.17
t< 8~
0 8 0 0 C<J 0 0 00 0
~ lt) ~ ('f") N - E '-u~ 'E'0'-
.....,0 t<,(""') -, N,
~,
~,,
Ln 0')0-- , N d~ \~
,,~
,~
\ ,Cl
~ \ co C
~ \ d :;::, t1S
~ 0 '-\ ('f") (!)
Cf>\
~\ --,~ \ t': ~.r;
~ \ 0 co u~ \ - w
\ Ln,
,~~ ~
\ ('f") .r;\(6
~\U. +J
~ "l 't-
0 0,~ (6\~
y S c-16' 0
'b ~''in
~'-
~\ ~
"ö~\ ~ Ln a.
~ 0 tn,-
~\ c0
~\ lt)
\\ 't.\ 0
0
\ (D
\1<:1 x \ g'0'0
M
Ln ~ rld
E ~ -d d 0 d
o~
E ••E •....,. • • • • •
+ • • • • • • •• • • • • • •• • • • •• : • •
E:::l..oo..-
o.uo..-~"0
EE....,.I
EEcoI
••• • • • ••
• • ••• • •• •• •• •• •• ••
• •
•
.....o0-
U)I
U)U)O")«..CL •w~....Jl.L.<!)ZtnCl::wzz5tf)
- Ln.
aLn
a-
aa
zo-....uz::::>IJ..
0:WIJ..lf)Z<{0:t-
Zo-~.....Ja::>No.o<.!)~G:I
lf)lf)
~W.....J<.!)ztn0:WZZ<{Ulf)
vt Slit height
I
I ----I- lO lJm
1--10fJm
·x
r-smm
I
SCANNER SINGLE PASS - UNE CURVATUREFIG.21
R150000
100000
50000
20000o .1 .2 .3 .4 .5 .6 .7mm
SCANNER SINGLE PASS - RESOLVING POWER VERSUSENTRANCE SLiT WIDTH
Fig.22
earthquake clampsand dampers
D-,\;:"S>"\:'\:'\:'\:',j I J' ff I air bearing
GRATING TURN-TABlE SCHEMATICFIG.23
"
Datum point
UsefulAmplitude f >' ",
Measuring pulses
End of datapulse
Velocity variationduring a scan
FIG.24TURN -TABlE-OPERATING PRINCIPlE
doe., are sees
300 360Angular indication
4
3
2
1
o _120- --
~1
-2
FIG.25 ANGULAR CALIBRATION OF THE TURN-TABLE(dClC, is the ~ifferenee between true and indicated position)
Ul.~
«E
r~-------_--l~OCUN+
-
--------
LOd
LU--Im
~za::::>I-
LU:r:I-
l.L.olf)
zo 0
~-a:~
>I-Uo-JlJJ><0N
(!jLL
~0'
1.0 ii i
0.5
o
'RAW SPECTRUM" FROM A REFERENCE CLOCK SHOWING THE DRAMAT1C EFFECTOF THE ENCODER PERIODIC ERROR
FIG.27
are sees
Frequeney (Hz)
5
4
3
2
1
,...- ......../ """, "-
" ........ ...... ....... .......
......... ------------ Reeommendedfrequeney
oo 150 300 600 1200 1800
Half amplitude(are sees)
FIG.28 USABLE FREQUENCIES VERSUS AMPLITUDE
0/0
40
30
20
10
k",_" FOB6400-.;;::.~-. --<lt--__ -iC .x .Jl
--- ~,"''2.....:..: ·-';:':·::...ci:--- Jl::--__ ..x.... ---.JS ~__--- _.... 095104
-----....:.-. -" -. =::::B.... F RCA typical" .............--..._----- ------N 63948 ~
~
I800700600500
RQ E of three quantacon photomultipliersFIG.29
400300
'-'
Dark count rate versus temperatureFIG.30
I I I I I I I I I I I I I I I I I I I I I I I
ARCTURUSATLAS
projected stitwidth 23mA
2.7 hrs
9 5160 2 4 6 8 5170 2 4 6 8 5180
ARCTURUSFTS
resolving power91.0002.5 hrs
I I I I I I I I I I I I I I I I I I I I I I I I I I I I I I I I I I I I I I
5150 2 4 6 8 5160 2 4 6 8 5170 2 4 6 8 5180 2 4 6
COMPARISON OF RESOLUTION OF PHOTOGRAPHIC AND FTS SPECTRUMSFIG. 31
43
2
543
2
o 0.5 1.0 slit width mm
Entrance slit width versus resolving powerfor different camera apertures
FIG.32
N987654
x105
~ -_-_-_-_-:0.6
~===-~=:==~==~~~~~O.81.01.251.5
321
O~--"""'---L-.----'---r...a-_-,----r----'r------r--_--.
1.0
Q.5
Relative efficiency versus camera aperture forvarious resolving power
AG. 33
4.7 N
9876542,·· 3104 ~--_----,r----__--+--.----__--or---__----.
1
Camera aperture versus resolving power for bestefficiencyFIG.34
.-
.JI
~I
"C
~-
iJU--
«0:l1J~«u.....Jl1JZZ«J:u~:J~LOM(jlJ..
._-.-
I I
~58::::lI/l
~
~I-~ 1_ r-l-L---~I____"=-"
_.1---'-- --'-'- .f-c EI't=:::====:j:=:====::=:::;r-..u.Ji....--~ 11 .r:b.
'\ \. \, ,,~ "... ' \, .....' .. I" :'-, , \ " " '\" \ \ " ". \ \ \ \ \ \\ '\ \" , -:\ ~ , , I. \\" \'
I \ .. " \" I' '. "~i ... \ '" "\\ \ ,"' ':
\. .. \. \, .. \ '\ \ \. .... \ \ \ "\ \ \ 'I \' I '-. ':
V .' ~Ä 'm /r ~[....,.......-;-,/~,T/T"iA~r(i910]jrr;X;;J1 ?;1",.11/7;.,L,;.. I~:-'-'17....,/.L/+:k/.-!.-,-/~-I1 _
~ ~ ~ -oW ~ l:~
--------------------
• ••
y'= +15
y'=+ 10
y'= Omm
y'= -10
y'= -15
A=390nm A=550nm A=750nm
-t--t--t- ~=20~
FIG.36Spectrometer with f/5 camera-
Image quality at the best, tangential focus
Modulation
1.0
.75
.5
.25
A390nm550nm
750nm
o 10 20 30 40 50 60 p.lknm
FIG.37aSpectrometer with f/5 camera- Modulation Transfer function
Modulation1.0
390 nm550nm750nm
focus
0.1 0 0.1 0.2 mm
FIG.37bSpectrometer with f/5 camera .Ima~~ modulation at 40p.Ymm
versus focus posItIon
~>
: I I I I I"//7 /T7 TT7 ~////
anti coronawindowfield lens
photocathode
nI
\\
u
~~
refrigerationprobe
/,.,
- reticon array I -
-ä;U~=t~- preamplifier
~~
I-.;;:
focus coil deflection coils pottingcompound
thermal insulation feam
SELF-SCANNED DIGICON TUBEFIG.38
from clock drivers ,
ceramic printed board
Diode Array
Fi!Zld lens ./'wlndow ~
Resistor '
from temperature controller
Preamptifiers
RETICON CRVOSTATFig.39
Vacuum Detector
VacuumI 'pump
~
, ,~Valve,e ,
DETECTOR II
CLOCKTYPE I+5V STATUS I
BIAS~--
-
CLOCK (f)I-
I +START PULSE
t-- TIMING L-.I SYNC. (2f)
VADDRESS &."-..Il ARRAY A 11 I,,-CONTROL /
t •BUS
0 -MC 6800SYNC r--UNE SINC PTA
EDC PTIMING LOGIC T MICRO-
~ tSTART 0 PROCESg)Rn PULSE
I1 ARRAY B Il GENERATOR ARRAY SELECT C"0 V DATA "-..INTEGR'/HOLC CONVERT EOC U
f" I BUS /
t • PDEMUXDEMUX L
ADDRESS E ADDRESSl-
RS
"-OMA~
.....Y> HINTEGRATE r t1 ADC I , CONTROL
DAND HOLDJ I JI
HINTEGRAT~r :-lADC I GI
ANALOG AND HOLD I TCHARGE AMPLIFIERS MPXR AH INTEGRATEr [j ADC r- L
~AffiAY
TRISTATEM --:7'" ".l
DRIVERS.......... AND HOLD IDATA"P,,/
X '---r--..... H INTEGRAT~r L-j ADC l- RV AND HOLDJ I J '--, " '
ARRAV DRIVER AND VIDEO SIGNAL PROCESSOR
RETICON' ELECTRONIC DIAGRAMFig.40
DETECTOR CONTROLLER AND DATA BUFFER
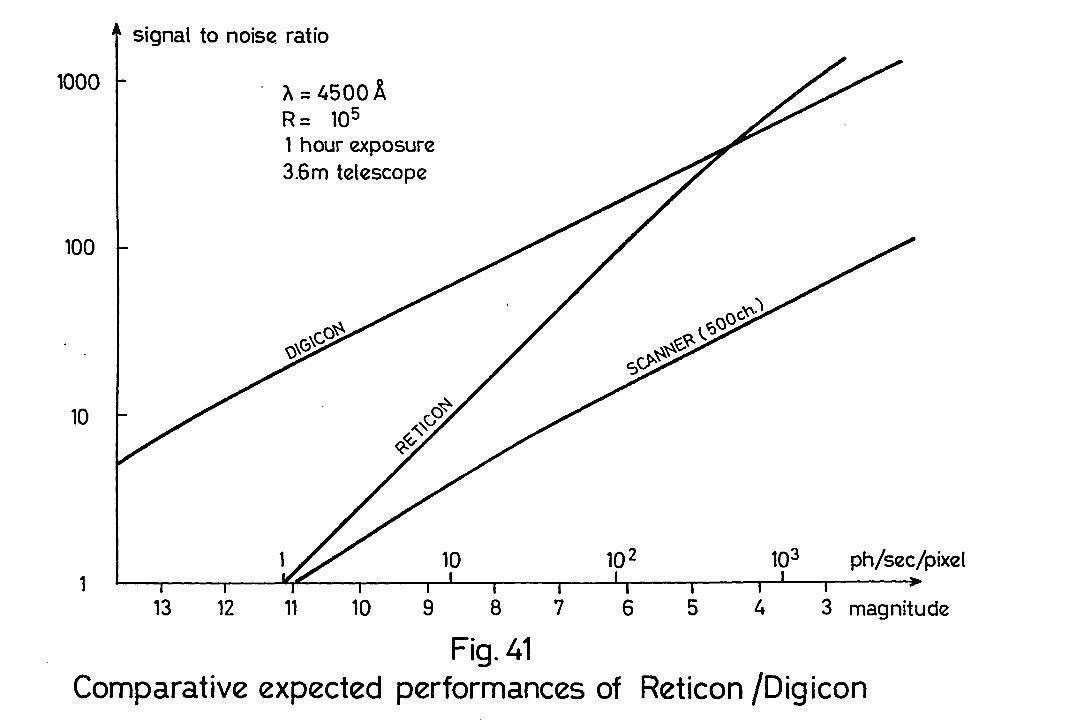
1000
100
10
1
signal to noise. ratio
A=4500AR= 105
1 hour exposure3.6m telescope
ph/sec/pixel
13 12 11 10 9 8 7 6 5 4 3 magnitude
Fig.41Comparative expected performances of Reticon /Digicon
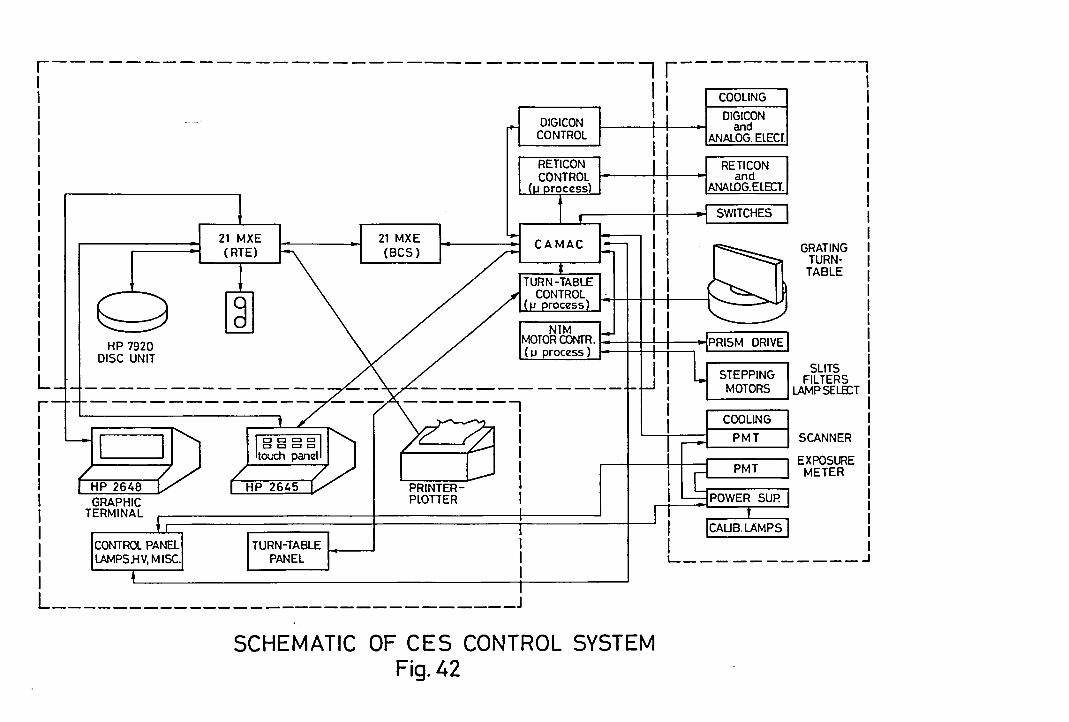
GRATINGTURNTAßLE
COOLING
DIGICONand
ANAlOG. ElECr.
SUTSFILTERS
, , LAMPSELB:T
I :
I ! I PMT I SCANNER
I I I I n T lEXPOSUREi .. METER
DIGICONCONTROL
21 MXE(BCS)
HP 7920DISC UNIT
r--------------------------------, r-----------,I II I
LrIIIIIIIII ITURN-TABLE I' II PANEL
I IL J
SCHEMATIC OF CES CONTROL SYSTEMFig.42

FIG. 43
FIG.44
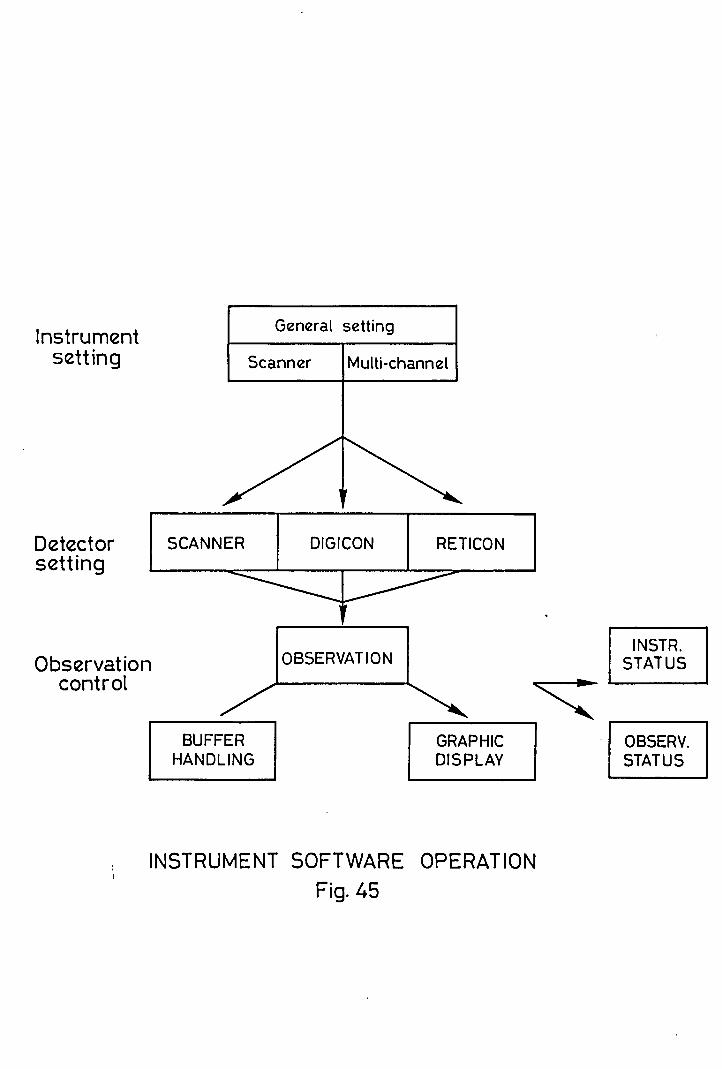
Instrumentsetting
General setting
Scanner Multi-channel
Detectorsetting
Observationcontrol
SCANNER
BUFFERHANDLING
DIGICON
OBSERVATION
RETICON
GRAPHICDISPLAY
INSTR.STATUS
OBSERV.STATUS
INSTRUMENT SOFTWARE OPERATIONFig.45
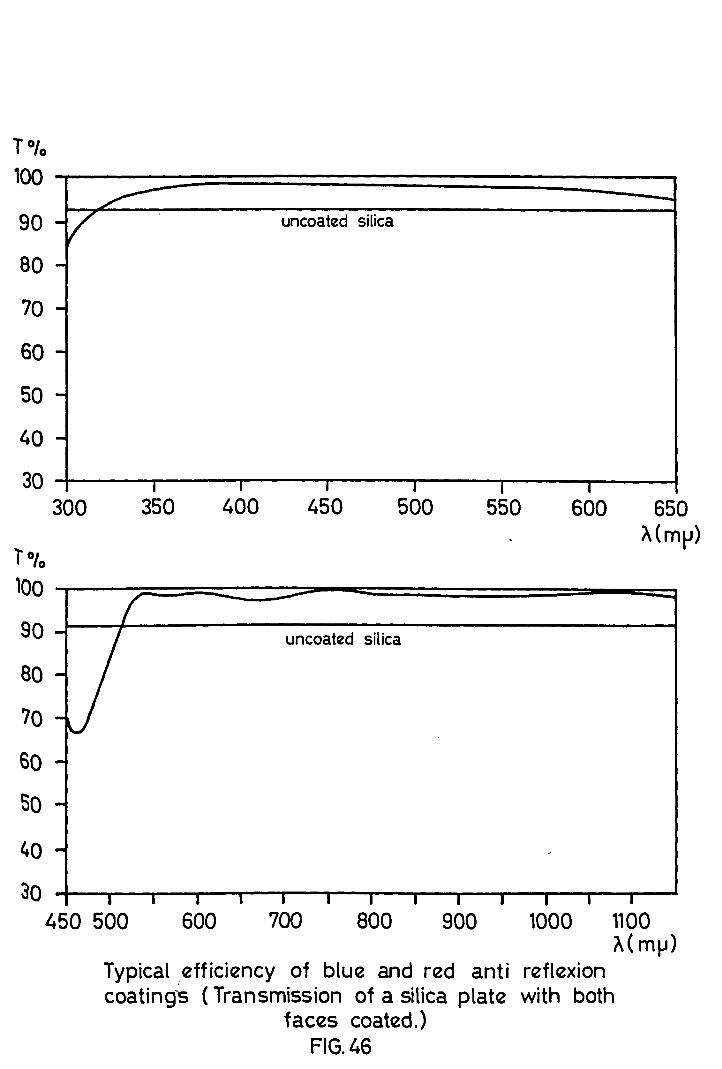
uncoated silica
TO/o
100 I-~:::::::=====================:::=l_
90 -V80 -
70 -
60
50
40 -
uncoated silica
30 -t----r-.--"T'.----,.---r-.---rt----..r-----I300 350 400 450 500 550 600 650
i\Cmp)1°10
100 .,----r=======::::==--~=======--=====l
90
80
70
60
50
40
900800700600 '000 '100A( mIJ)
Typicalefficiency of blue and red anti reflexioncoating's (Transmission of a silica plate with both
faces coated.)FIG.46
30450 500
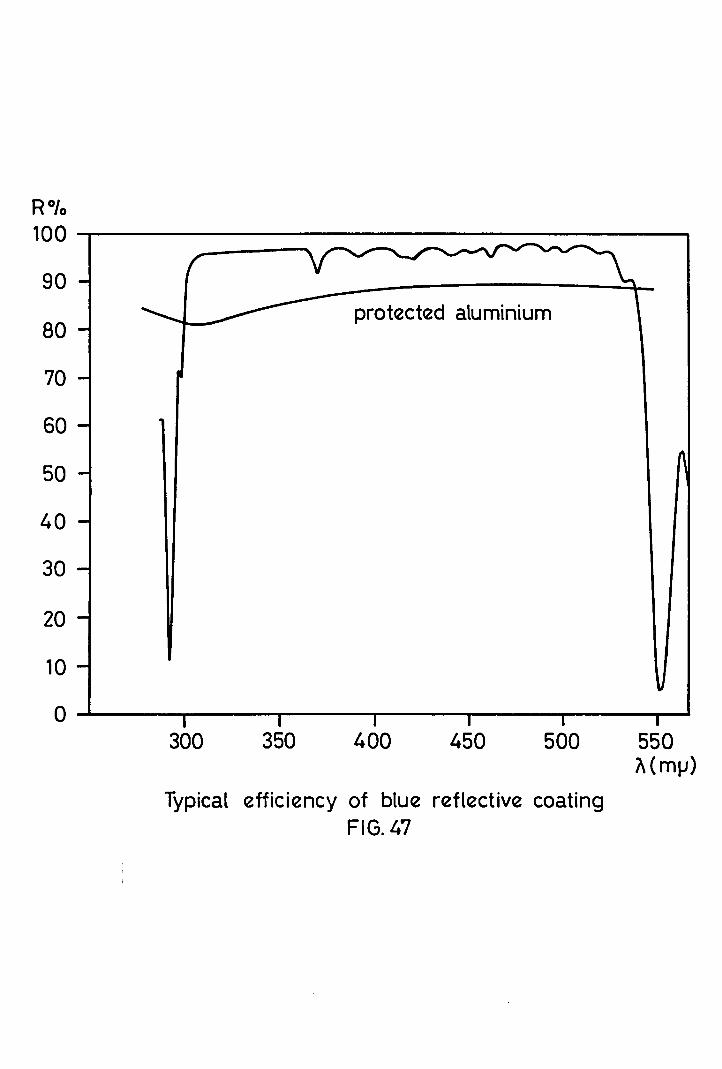
protected aluminium
20
10
O---------r------------.--------~
80
70
60
50
40
30
RO/o100 -r--------------------_90
300 350 400 450 500 550i\(m~)
Typical efficiency of blue reflective coatingFIG.47
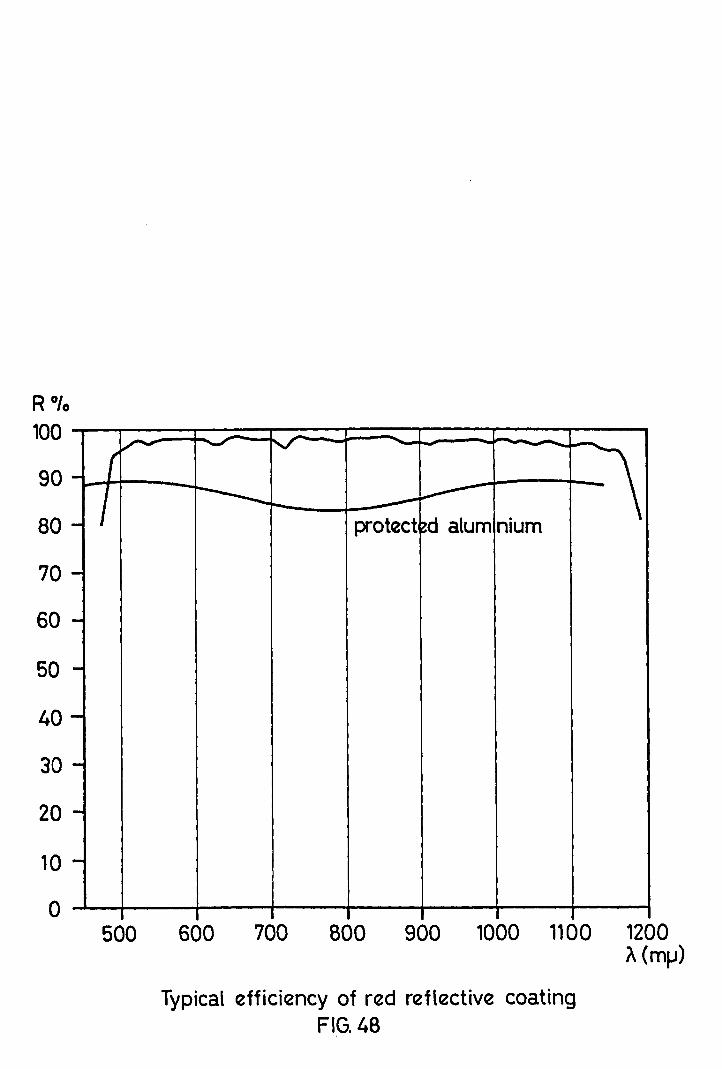
v- Y -(
~-7 r---- ..... ----~- protect~d alum nlum
-
---
-
--
40
30
20
10
o
50
R 0/0
100
90
80
70
60
500 600 700 800 900 1000 1100 1200A(mJJ)
Typical efficiency of red reflective coatingFIG.48