(d) empirical results on turbulence scaling of …eyink/turbulence/notes/chapteriiic.pdf · (d)...
TRANSCRIPT

(D) Empirical Results on Turbulence Scaling of Velocity Increments
We shall present here a selection of the empirical studies of inertial-range scaling of velocity
increments by laboratory experiment and numerical simulation. We begin with
? F. Anselmet et al.,“High-order velocity structure functions in turbulent shear
flow,” J. Fluid Mech. 140 63-89(1984)
This paper studied the longitudinal velocity structure functions
SLp (r) = h[�uL(r)]pi ⇠ CL
p `⇣Lp
and found good evidence of derivations from K41 for higher-order values of p. It was historically
important in stimulating a great deal of work to understand the exponents ⇣Lp .
34

35

? K. R. Sreenivasan et al., “Asymmetry of velocity increments in fully developed
turbulence and the scaling of low-order moments,” Phys. Rev. Lett. 77 1588-1491
(1996)
These authors considered also absolute longitudinal structure functions
SALp (r) = h|�uL(r)|pi ⇠ CAL
p `⇣ALp
and structure functions for positive and negative parts
�u±L (r) =|�uL(r)|±�uL(r)
2 � 0
so that �uL(r) = �u+L (r)� �u�L (r) and
S±p (r) = h[�u±L (r)]pi ⇠ C±L
p `⇣±Lp .
Since |h[�uL(r)]pi| h|�uL(r)|pi, it is easy to see that
⇣ALp ⇣Lp .
The paper reports evidence that
⇣Lp ⇠= ⇣ALp
⇠= ⇣�Lp < ⇣+L
p for p > 1.
VOLUME 77, NUMBER 8 P HY S I CA L REV I EW LE T T ER S 19 AUGUST 1996
FIG. 3. The ratio S2q ⇤S1
q plotted against r in log-log coordi-nates. Note that the ratio is less than unity for all r when q , 1and greater than unity when q . 1. As argued in the text, thisis consistent with ramplike structures in the velocity trace. Thebump in high-order moments is weaker for simulations data.
for all r, which is precisely Eq. (4) inferred for the ramp
model. This does not appear to be a coincidence. The
physical interpretation of Du1r is that it corresponds to
regions of acceleration while Du2r corresponds to regions
of deceleration, just as for the long and short legs of the
ramp structure, respectively.
A second point to note is that all curves for q . 1show, by and large, a decreasing trend with increasing
r. If there were power laws to these curves, one may
conclude that the scaling exponents for the plus structure
functions are larger than for the minus structure functions.
It is difficult to quantify this feature because of the
uncertainty in identifying the scaling region precisely.
Some additional information can be had by plotting the
ratios Sq⇤Sq⇤22 , S1
q ⇤Sq⇤22 , and S2
q ⇤Sq⇤22 against logr. This
is shown in Fig. 4 for q � 4. The scaling region in eachof these plots is somewhat different. However, if we use
those regions, we note that the minus exponent is almost
identically equal to that for the full structure function,
whereas the plus exponent is larger than the minus
exponent. Simulations data confirm this observation
qualitatively.
FIG. 4. The logarithm of the ratios S4⇤S22 , S2
4 ⇤S22 , and S1
4 ⇤S22
plotted against logr. These ratios appear to scale, albeit indifferent ranges of r. From top to bottom, the slopes of thestraight line fits and the least square errors are, respectively,20.099 6 0.003, 20.098 6 0.004, and 20.070 6 0.002. Thisshows that the plus exponent is larger than the minus exponent.
This conclusion is also apparent in the ESS plots;
here, one plots the qth order structure function against
the third-order structure function and determines scaling
exponents. Our experience is that ESS in this form
does not work to well for the pipe flow, consistent
with our previous experience in another shear flow
[15]. However, if the third-order structure function is
replaced by the generalized third-order structure function
(following Ref. [12]), there is much more convincing
scaling, for which the plus exponent is, as already
noted, larger than the minus exponent. Numerical data
are in agreement. We have refrained from giving the
precise exponents because the latter procedure cannot be
justified easily. It would be most desirable to confirm
these conclusions at higher Reynolds numbers. The
atmospheric data available to us (Rl � 2000, see [15]),for which the convergence is reasonably satisfactory for
the fourth order, corroborate the basic conclusion.
The results so far suggest that there is a basic difference
between the plus and minus parts of the velocity incre-
ments. The Kolmogorov law is an expression of part of
this fundamental difference. The negative part becomes
more dominant with the moment order and overwhelms
the positive part asymptotically. Two related pieces of
evidence presented in earlier work are worth recalling:
(a) The odd exponents of high-order structure functions
consistently lie above a smooth curve that can be drawn
through even-order exponents [15]; in particular, they are
different for the classical and generalized structure func-
tions (Table I, Ref. [4]). (b) The ratio j⌅Dunr ⇥j⇤⌅jDur jn⇥
is comparable to unity for large odd n (Table II, Ref. [4]).
Whether the emphasis on these differences will lead us to a
better theoretical understanding of inertial scaling remains
to be seen.
1490
36

VOLUME 77, NUMBER 8 P HY S I CA L REV I EW LE T T ER S 19 AUGUST 1996
FIG. 5. (a) Low-order scaling exponents for generalized struc-ture functions compared with q!3 as well as with outcomes ofthe intermittency models of [19] and [21]. The inset shows thescaling of the generalized structure function of order 0.5. Thefull line is for the model of Ref. [21]. (b) Comparison of theplus and minus exponents with those of generalized structurefunctions.As already remarked, the present work reveals somecorrespondence with the ramp model for the velocity,and draws attention to a change in behavior of thestructure functions at q ! 1. This naturally suggests apotential connection to the work recently carried out forrandomly forced Burger’s equation [16], for turbulencewithout pressure [17], and for passive scalars advectedby a rapidly varying velocity field [18]; these papersshow that the scaling exponents transition from a regularbehavior for small q to an anomalous behavior forlarge q. While there have been many measurements ofexponents for large q, no such measurements exist forlow q below unity. Here, we have obtained low-orderscaling exponents (q as low as 0.25) for Sq"r# as well asthe positive and negative structure functions. Figure 5(a)shows the simulations data. The inset is an example of theplots from which these exponents have been determined.Both experiment and simulations yield nearly identicalresults. The exponents vary linearly with q for low-order moments, but are measurably different from q!3expected from Kolmogorov’s universality [1]. Instead,they agree well with the refined similarity hypothesis [19]if one takes a value of 0.25 for the intermittency exponent[20], and with the intermittency model of Ref. [21]. Inthe limit q ! 0, the intermittency models just consideredyield exponents about 10% different from q!3.
The fact that some intermittency models agree with mea-sured exponents for q both below and above unity suggeststhat the exponents possess no transitional behavior envis-aged in Refs. [16–18]. This is so even though the plusand minus structure functions themselves show a changein behavior at q ! 1 (see Fig. 3). Figure 5(b) shows thatthe exponents for the generalized structure functions arenot too different from those for the plus and minus struc-ture functions (although, in general, the minus exponentsare the largest and the plus exponents are the smallest).We have benefited enormously from discussions withVadim Borue, Leo Kadanoff, Robert Kraichnan, MarkNelkin, Evgeny Novikov, Sasha Polyakov, GustavoStolovitzky, Akiva Yaglom, and Victor Yakhot. Thework was supported by the Air Force Office of ScientificResearch, and K.R.S. was supported at the Institute forAdvanced Study by the Sloan Foundation.[1] A. N. Kolmogorov, C.R. Acad. Sci. USSR 30, 299 (1941).[2] The inertial range is intermediate between the dissipativeand the large scale turbulence.[3] A. N. Kolmogorov, C.R. Acad. Sci. USSR 32, 16 (1941).[4] S. I. Vainshtein and K. R. Sreenivasan, Phys. Rev. Lett.73, 3085 (1994).[5] S. I. Vainshtein, K.R. Sreenivasan, R. T. Pierrehumbert,V. Kashyap, and A. Juneja, Phys. Rev. E 50, 1823 (1994).[6] H. G. E. Hentschel and I. Procaccia, Physica D 8, 435(1983).[7] Briefly, "q 2 1#Dq is the scaling exponent for the qthpower of a measure distributed on a set.[8] S. Chen and X. Shan, Comput. Phys. 6, 643 (1992).[9] F. Anselmet, Y. Gagne, E. J. Hopfinger, and R.A. Anto-nia, J. Fluid Mech. 140, 63 (1984).[10] J. Laufer, NACA Tech. Rep. 1174 (1954).[11] The basis for the procedure is the Kolmogorov equation[3] derived for globally homogeneous and isotropic tur-bulence. It appears that the requirement of global homo-geneity can be relaxed [see, U. Frisch, Turbulence: TheLegacy of A.N. Kolmogorov (Cambridge University Press,Cambridge, 1995), Sect. 6.2], but the effects of stronganisotropy remain unclear.[12] R. Benzi, S. Ciliberto, R. Tripiccione, C. Baudet, F.Massaioli, and S. Succi, Phys. Rev. E 48, R29 (1993).[13] N. Cao, S. Chen, and Z.-S. She, Phys. Rev. Lett. 76, 3711(1996).[14] A. S. Monin and A.M. Yaglom, Statistical Fluid Mechan-ics: Mechanics of Turbulence (M.I.T. Press, Cambridge,MA, 1975), Vol. 2.[15] G. Stolovitzky and K.R. Sreenivasan, Phys. Rev. E 48,R33 (1993).[16] A. Chekhlov and V. Yakhot, Phys. Rev. E 52, 5681(1995).[17] A. Polyakov, Phys. Rev. E 52, 6138 (1995).[18] V. Yakhot, Phys. Rev. E (to be published).[19] A. N. Kolmogorov, J. Fluid Mech. 13, 82 (1962).[20] K. R. Sreenivasan and P. Kailasnath, Phys. Fluids A 5,512 (1993).[21] Z.-S. She and E. Leveque, Phys. Rev. Lett. 72, 336 (1994).1491
37

? S. Chen, et al., “Refined similarity hypothesis for transverse structure functions
in fluid turbulence,” Phys. Rev. Lett. 79, 2253-2256(1997).
This paper is one of several papers around 1997 ( see references therein) that studied di↵erences
in scaling of longitudinal and transverse velocity structure functions
h[�uT (r)]pi ⇠ CTp `
⇣Tp .
The paper reports evidence that
⇣Tp < ⇣Lp .
VOLUME 79, NUMBER 12 P HY S I CA L REV I EW LE T T ER S 22 SEPTEMBER 1997
FIG. 1. Flatness of velocity increments, SL4 !r"#SL
2 !r"2 and
ST4 !r"#ST
2 !r"2, as functions of r .
structure functions. We employ the numerical data from
simulations of isotropic turbulence, carried out using 5123
mesh points in a periodic box; a statistically steady state
was obtained by forcing low Fourier modes. For details,
see the paper cited first in [8]. The Taylor microscale
Reynolds number Rl ! 216, which is close to the limit ofthe current computational capability. Averages over ten
large-eddy turnover times were used in the data analysis.
Figure 1 shows the flatnesses of longitudinal and trans-
verse velocity increments as functions of r . For all val-ues of r except perhaps those comparable to the box size,the velocity increment along the transverse direction has a
larger flatness, suggesting that the transverse velocity in-
crement is more intermittent [14]. This shows that signifi-
cantly more averaging is required for transverse quantities
than for longitudinal quantities.
In Fig 2, the transverse structure functions STp !r" are
plotted as functions of r for p ! 2, 4, 6, 8, 10. An inertial-range power-law scaling can be identified for 0.2 # r #0.6 (the whole box size being 2p). This is also the scalingrange determined [16] from Kolmogorov’s 4#5 law for thethird-order structure function [17].
The exponents z Tp , determined by least-squares fits
within the inertial range just mentioned, are plotted in
Fig. 3. The use of the extended self-similarity (ESS)
technique [18] yields very similar results [19]. The re-
sults for z Lp , obtained earlier [20], have also been plot-
ted for comparison. These results demonstrate that while
both exponents show considerable anomaly due to inter-
mittency effects (as evidenced by the deviation from the
dotted line given by K41), the transverse exponents are
systematically smaller than the longitudinal ones for p .3. Typical scaling exponents for ST
p are z T2 ! 0.71 6
0.04, z T4 ! 1.25 6 0.067, z T
6 ! 1.63 6 0.079, and z T8 !
1.87 6 0.078. While the longitudinal exponents agree
quite well with existing scaling models [9,10,21], the dif-
ference between the transverse exponents and the models
FIG. 2. The transverse structure functions STp !r" as functions
of r for p ! 2, 4, . . . , 10.
increases with p. For brevity, we show only a comparisonwith the log-Poisson model [10], which is typical.
If the scaling exponents for longitudinal and transverse
structure functions are different, it is clear that Eq. (1), now
known to be valid for the former, cannot be valid for the
latter; some modification will therefore be required. One
possibility suggests itself from kinematic considerations.
Recall from the second reference of [6] that RSH may
be expected because the longitudinal velocity increment
dur is an integral over the separation distance r of thevelocity derivative ≠u#≠x, whose square is one of
the components of the energy dissipation. In a similar
way, the transverse structure function dyr is the integral
of ≠y#≠x, which is one of the two terms of the vorticitycomponent vz ! ≠y#≠x 2 ≠u#≠y. It is reasonable to
FIG. 3. Numerical results for the transverse scaling expo-nents, z T
p and z Lp , as functions of p. The dotted line is for
the normal scaling relation (K41) and the dashed line is for thelog-Poisson model [10].
2254
38

A more recent systematic study of this issue is contained in
? T. Gotoh et al., “Velocity fields statistics in homogeneous steady turbulence ob-
tained using a high-resolution direct numerical simulation,” Phys. Fluids, 14 1065-
1081(2002)
pressure structure function !("rp)2#!!(p(x"r)#p(x))2#through the Poisson kernel.43,71,75,76 This relation may serve
as a constraint among the three structure functions at the
fourth order, but it is not restrictive in the sense that there is
no direct relation between S4L , S4
T , and S2,2M .54,72,77,78 Nelkin
argued that the pressure spectrum can be expressed in terms
of the dissipation spectrum E$(k)!4%k2F &!$x$x"r#' , theenstrophy spectrum E((k)!4%k2F &!(x(x"r#' , and thespectrum of the product of the enstrophy and dissipation
EM(k)!4%k2F &!$x(x"r#' . He suggested that the three ex-ponents are equal in the limit of high Reynolds
numbers.71,76,87 However, the exponents in the spectra &forexample, )$ in E$(k)!C$$2k#1(kL)#)$
' are not necessar-ily equal to those of S4
L(r), S4T(r), or S2,2
M (r). The former are
the spectra of the dissipation range quantities, while the latter
are the fourth order correlations of inertial range quantities.
The DNS values of the scaling exponents are *4T!1.27,
*2,2M !1.28, and *4
L!1.29 for R+!460 which are obtained byaveraging over the scaling range. The difference between
these values is within 3%. Figures 33 and 34 show the varia-
tion of the fourth order scaling exponents with separation
distance for two Reynolds numbers. At the high end of the r
range, the difference between the exponents is less. Although
it is again difficult to draw definite conclusions from the
figures, it seems that the differences between the three scal-
ing exponents decrease with the Reynolds number.71
For higher order moments p$4, there are no simpleequations to directly relate the longitudinal and transverse
structure functions. A dynamical equation relates different
types of structure functions at various orders.54,72,77,78 L’vov
et al. have pointed from the view point of the irreducible
representation of the rotation symmetry group that the longi-
tudinal and transverse structure functions must have the
same asymptotic scaling exponents for infinite Reynolds
number, but different exponents can be observed when the
scaling range is not long enough.39 He et al. discussed that
the scaling exponents for locally averaged enstrophy and dis-
sipation are equal for infinite Reynolds number, but may be
different for finite Reynolds number.40 From this argument,
they suggested that the scaling exponents for the longitudinal
and transverse structure functions are also equal at infinite
Reynolds numbers. Zhou and Antonia suggested that the dif-
ference ,*p!*pL#*p
T vanishes at sufficiently large Reynolds
numbers.37 However, the present data indicate that the differ-
ence ,*p for R+!381 and 460 is larger than the value ,*pextrapolated from the experimental data. The exponents in
Table III and Fig. 32 are average values over the entire scal-
ing range and indicate *pT%*p
L for p$4. The overall trend ofthe local scaling exponents within the scaling range suggests
that the rate of the increase of *pT with respect to the order is
slower than that of *pL &fact -6.'. Although the asymptotic
state is beyond the scope of the present DNS study, the above
observations and facts suggest that *pT is smaller than *p
L
when p$4. If some portion of this difference at higher or-ders arises from the insufficient degree of isotropy, a longer
time average would provide insights into this problem. If
other portion of the difference comes from the insufficient
length of the scaling range, it is necessary to extend farther
the scaling range even when we use the invariant scalar func-
FIG. 32. Variation of the scaling exponents *pL and *p
T when R+!460. Sym-bols are the results of the present DNS, star: *p
L , circle: *pT . SL, MF, AA,
and K62 are the curves by She and Leveque model -Ref. 70., Yakhot’s meanfield theory -Ref. 72., Arimitsu and Arimitsu’s generalized entropy theorywith )!0.25, and K62 with )!0.25, respectively.
FIG. 33. Comparison of the fourth order *2,2M . R+!381. A horizontal line
indicates 1.28.
FIG. 34. Comparison of the fourth order scaling exponents *4L , *4
T , and
*2,2M . R+!460. A horizontal line indicates 1.28.
1077Phys. Fluids, Vol. 14, No. 3, March 2002 Velocity field statistics in homogeneous
Downloaded 07 Jul 2007 to 128.220.254.4. Redistribution subject to AIP license or copyright, see http://pof.aip.org/pof/copyright.jsp
39
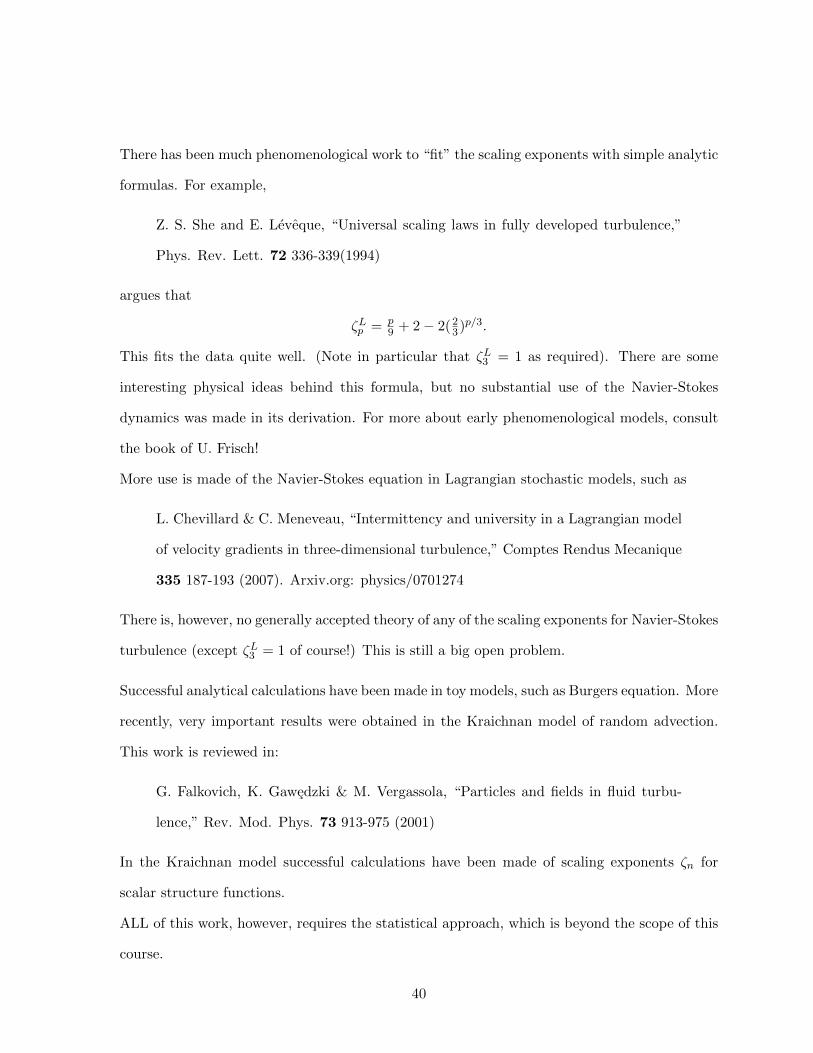
There has been much phenomenological work to “fit” the scaling exponents with simple analytic
formulas. For example,
Z. S. She and E. Leveque, “Universal scaling laws in fully developed turbulence,”
Phys. Rev. Lett. 72 336-339(1994)
argues that
⇣Lp = p9 + 2� 2(23)
p/3.
This fits the data quite well. (Note in particular that ⇣L3 = 1 as required). There are some
interesting physical ideas behind this formula, but no substantial use of the Navier-Stokes
dynamics was made in its derivation. For more about early phenomenological models, consult
the book of U. Frisch!
More use is made of the Navier-Stokes equation in Lagrangian stochastic models, such as
L. Chevillard & C. Meneveau, “Intermittency and university in a Lagrangian model
of velocity gradients in three-dimensional turbulence,” Comptes Rendus Mecanique
335 187-193 (2007). Arxiv.org: physics/0701274
There is, however, no generally accepted theory of any of the scaling exponents for Navier-Stokes
turbulence (except ⇣L3 = 1 of course!) This is still a big open problem.
Successful analytical calculations have been made in toy models, such as Burgers equation. More
recently, very important results were obtained in the Kraichnan model of random advection.
This work is reviewed in:
G. Falkovich, K. Gawedzki & M. Vergassola, “Particles and fields in fluid turbu-
lence,” Rev. Mod. Phys. 73 913-975 (2001)
In the Kraichnan model successful calculations have been made of scaling exponents ⇣n for
scalar structure functions.
ALL of this work, however, requires the statistical approach, which is beyond the scope of this
course.
40

(E) The Multifractal Model
We shall now return to an important general explanation/picture of anomalous scaling, the
multifractal model. This framework does not provide a quantitative prediction for scaling
exponents, but it does yield some predictions about the relation of the ⇣p’s to other measurable
quantities, as well as some useful insights.
Local Holder Exponents & Fractal Dimensions
IWe have defined earlier the notion of Holder continuity with an exponent h at point x.
However, we have not defined the notion of the Holder exponent h(x). Ideally, this should
mean something like
|�u(r,x)| ⇠ urms(`L)
h , with h = h(x) when `⌧ L,
or, more precisely, that
limr!0ln |�u(r,x)|ln(r/L) = h ⌘ h(x)
However, this limit need not exist! Thus, we must follow a similar strategy as far as for the
global scaling exponent ⇣p and define
h(x) := h(x) = lim infr!0ln |�u(r;x)|ln(r/L) .
This is the maximal Holder (regularity) exponent of u at x, i.e. u is Holder continuous with
exponent h = h(x) � " at x for any " > 0, but not with exponent h = h(x)+ for any " > 0.
Note that the limit supremum
h(x) = lim supr!0ln |�u(r;x)|ln(r/L) .
instead defines a local singularity exponent: For any " > 0 there exists a � > 0 such that when
` < � then |�(r;x)| > (r/L)h(x)+" for all r < ` and |�(r;x)| < (r/L)h(x)�" for some r < `.
Just as for the global scaling exponents ⇣p, we employ definitions like those above under the
assumption that viscosity ⌫ ! 0 first (before r ! 0). Otherwise, we are interested in the value
of h defined by an intermediate asymptotics for some range of length-scales ⌘h(x) ⌧ `⌧ L. A
little later we shall present some heuristic estimates of the size of ⌘h(x).
The above definitions are adequate for 0 < h < 1, but not otherwise. For h > 1, we say that u
41

is Holder continuous at x with exponent h if u is k-times continuously di↵erentiable
k = JhK = integer part of h
and if
rku 2 Cs(x), s = ((h)) = h� JhK = fractional part of h.
But, for this definition, if h > 1, then
�u(r;x) = (r ·r)u(x⇤), x⇤ between x and x+ r
=) �u(`;x) = O(`)
Hence, (first-order) increments do not distinguish di↵erent values of h! There are various
alternatives that allow one to define Holder exponents for h outside the range 0 < h < 1.
One alternative is to consider higher-order increments �ku(r), defined iteratively by
�1u(r;x) = �u(r;x) = u(x+ r)� u(x)
�ku(r;x) = �k�1u(r;x+ r)� �k�1
u(r;x), k � 2
For example,
�2u(r;x) = u(x+ 2r) + u(x)� 2u(x+ r),
or, perhaps the more symmetrical choice,
���+u(r;x) = u(x+ r) + u(x� r)� 2u(x),
by a combination of a forward di↵erence �+u(r;x) = u(x+r)�u(x) and a backward di↵erence
��u(r;x) = u(x)� u(x� r). It then turns out that, for all h > 0,
u 2 Ch(x) () �ku(r;x) = O(`h) for k � JhK.
Another possibility is to use wavelet coe�cients. Suppose that ⌫ for ⌫ = 1, · · · , 2d � 1, are
“mother wavelets” and � an associated “scale function” which generate an orthonormal basis
in L2(Rd), as
Nn⌫(x) = 2dN/2 ⌫(2Nx� n)
and
�0,n(x) = �(x� n),
42

N 2 N, the scale index
n 2 Zd, the position index
⌫ = 1, · · · , 2d � 1, the degeneracy index
We may then expand each component of u as
ui(x) =P
n
B(i)n
�0,n(x) +P
Nn⌫ A(i)Nn⌫ Nn⌫(x)
with
B(i)n
= hui,�0,ni, A(i)Nn⌫ = hui, Nn⌫i
the wavelet coe�cients of ui. It is known that the wavelet coe�cients give “almost” a charac-
terization of Ch(x). That is,
u 2 Ch(x) =) sup{i,n,⌫: supp( Nn⌫)3x} |A(i)Nn⌫ | = O(2�N( d2+h)), 8N � 1
and, conversely,
sup{i,n,⌫: supp( Nn⌫)3x}
|A(i)Nn⌫ | = O(2�N( d2+h)), 8N � 1
=) �u(r;x) = O(|r|h ln( 2
|r|)).
Here it is assumed that 0 < h < 1 and that ⌫ are C1 and compactly supported. The similar
statement applies for any h > 0, with �u ! �ku for k = JsK, if one assumes also that ⌫ 2 Ck+1,
such that ⌫ has all moments of order less than k + 1 vanishing, i.e.Rddx Pk(x) ⌫(x) = 0
for any polynomial Pk(x) of degree k. One can therefore also define
h(x) = lim infN!1
sup{i,n,⌫:supp( Nn⌫)3x} log2[2Nd/2|A(i)
Nn⌫ |]�N
This definition has advantages because it also extends to negative Holder singularities. One
could intuitively expect that a power-law blow-up, like
|u(x+ r)| ⇠ (r/L)h for r ⌧ L with h < 0
43

would correspond to u 2 Ch(x), i.e. u belonging to a negative Holder class at x. It can be
shown that this is true if one defines Ch(x) to consist of u such that
sup{i,n,⌫: supp( Nn⌫)3x}
|A(i)Nn⌫ | = O(2�N( d2+h))
for h > �d. This doesn’t exactly coincide with the standard definition of Holder continuity for
h > 0, but the maximal Holder exponents h(x) are the same.
References
For characterization of Holder spaces (and, more generally, Besov spaces) by di↵erences, see
H. Triebel, Theory of Function Spaces (Birkhauser, 1983), Section 2.5.10-12.
For characterization of Holder spaces (and, more generally, Besov spaces) by wavelet coe�cients,
see
I. Daubechies, Ten Lectures on Wavelets (SIAM, Philadelphia, 1992), Chapter 9.
M. Frazier, B. Jawerth & G. Weiss, Littlewood-Paley Theory and the Study of Func-
tion Spaces (American Mathematical Society, Providence, RI, 1991), Ch. 7.
For a discussion of negative Holder singularities, defined by means of wavelet coe�cients, see
S. Ja↵ard, “Multifractal formulation for functions, Parts I, II,” SIAM J. Math.
Annal., 28(4) 944-970, 971-998(1997).
G. L. Eyink, “Besov spaces and the multifractal hypothesis,” J. Stat. Phys. 78
353-375 (1995).
Last remark: One can similarly define (assuming 0 < h < 1)
hL(x) = lim infr!0
ln |�uL(r;x)|ln(r/L)
= longitudinal Holder exponent of u at point x
hT (x) = lim infr!0
ln |�uT (r;x)|ln(r/L)
= transverse Holder exponent of u at point x
Since |�u(r)|2 = |�uL(r)|2 + (d� 1)|�uT (r)|2, it is easy to see that h(x) = min{hL(x), hT (x)}.
44

Fractal Dimensions
We now consider some of the notions of non-integer dimensionality for sets S ⇢ Rd. We
first consider the so-called box-counting dimension DB(S) (also known as packing dimension,
Minkowski-Bouligand dimension, or simply fractal dimension). If S ⇢ Rd is bounded, let
Nk(S) = numbers of hypercubes in a regular grid of sidelength 2�k which intersect S
Figure 1. Illustration of the box-counting method
Define
DB(S) = lim supk!1
1
klog2Nk(S) = upper fractal dimension
DB(S) = lim infk!1
1
klog2Nk(S) = lower fractal dimension
so that DB(S) DB(S).
If DB(S) = DB(S) = DB, then we say that S has fractal dimension DB and, in that case,
Nk(S) ⇠ 2kDB(S).
Notice that the total number of boxes per unit volume grows as
Nk ⇠ 2kd.
Hence, the fraction of boxes intersecting S goes as
Nk(S)Nk
⇠ 2�k(d�DB(S)) ⇠ 2�k·B(S)
45

where
0 B(S) = d�DB(S) = fractal codimension of S.
Remark: Rather than boxes of sidelength 2�k, decreasing by factors of 2, one can use any
factor � > 1 and sidelengths ��k. In that case, Nk(S) ⇠ �kDB(S) with the same value DB(S),
independent of the � selected.
Example: Consider the middle-thirds Cantor set K = \Kn:
Figure 1. Iterative construction of the Cantor set
Choosing � = 3, we get (by direct counting)
Nk(K) = 2k
so that
DB(K) = limk!1
log3Nk(K)
k
= limk!1
log3(2k)
k
= limk!1
k · log3(2)k
= log3(2) =ln 2
ln 3.= 0.6309 · · ·
There are many other important notions of fractal dimensionality, e.g. Hausdor↵ dimension
DH(S). A full discussion of DH(S) requires measure theory, but, essentially, the di↵erence is
that it involves covering the set with balls of size 2�k and not just = 2k, so that the number
46

of balls required is always fewer (and could be much fewer). For example, a countable set has
Hausdor↵ measure 0, but such sets may be everywhere dense with box-counting dimension d!
The set Q of rational numbers is an example of this type. Thus,
DH(S) DB(S) DB(S).
For a complete discussion of all these matters, see
K. Falconer, Fractal Geometry, Mathematical Foundations and Applications. (John
Wiley & Sons, 1990)
Parisi-Frisch Multifractal Model
We now consider the heuristic explanation given by
G. Parisi & U. Frisch, “On the singularity structure of fully developed turbulence,”
in: Turbulence and Predictability in Geophysical Fluid Dynamics. Proc. Internatl.
School of Physics ‘E. Fermi’, 1983, Varenna, Italy, 84-87, eds. M. Ghil, R. Benzi
and G. Parisi. (North-Holland, Amsterdam, 1985)
for the anomalous scaling of structure functions. We assume that the local Holder exponents
h(x) of the velocity u obtained for ⌫ ! 0 all lie in some range [hmin, hmax] with 0 < hmin and
hmax < 1. We then set
S(h) = {x : h(x) = h}and
D(h) = D(S(h)).Since the argument is just heuristic, we do not state here whether we specify D = DB, DH or
some other fractal dimension! Now, by definition of S(h),|�u(r;x)| ⇠ u0(
rL)
h
if x is within distance r of the set S(h). The fraction of space on which that occurs can be
estimated as
Fraction(x : dist(x,S(h)) ⇠ r) ⇠ ( rL)(h)
47
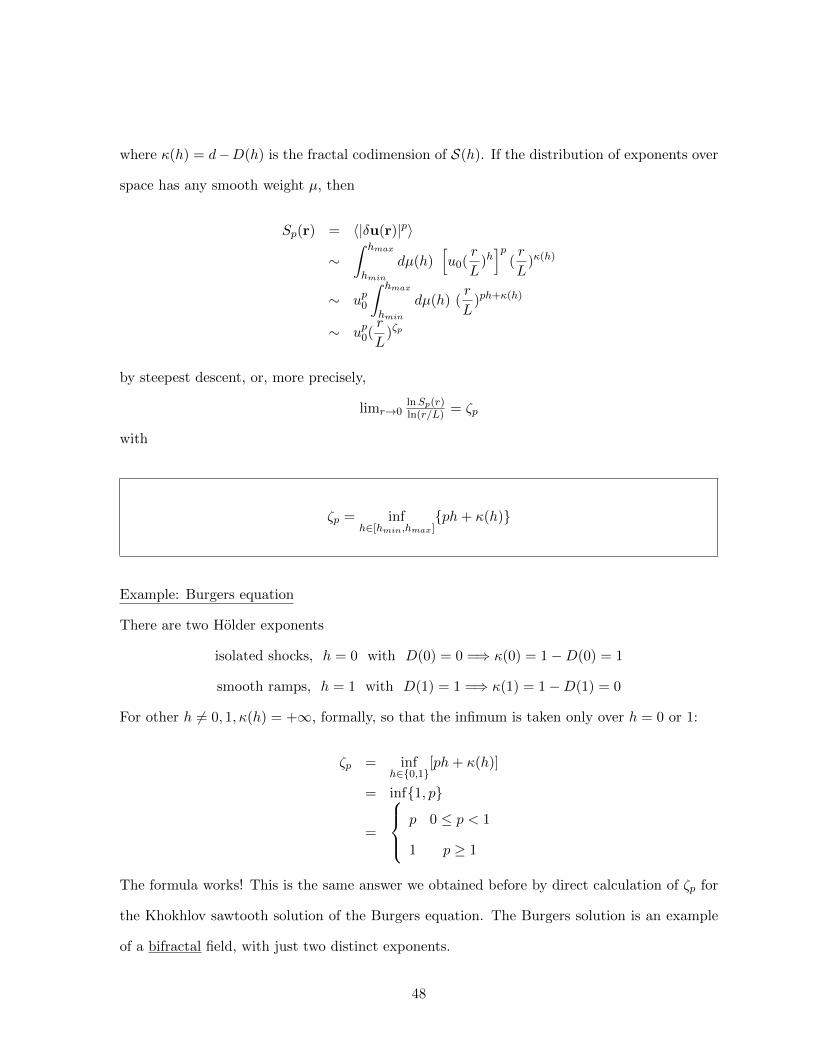
where (h) = d�D(h) is the fractal codimension of S(h). If the distribution of exponents over
space has any smooth weight µ, then
Sp(r) = h|�u(r)|pi⇠
Z hmax
hmin
dµ(h)hu0(
r
L)hip
(r
L)(h)
⇠ up0
Z hmax
hmin
dµ(h) (r
L)ph+(h)
⇠ up0(r
L)⇣p
by steepest descent, or, more precisely,
limr!0lnSp(r)ln(r/L) = ⇣p
with
⇣p = infh2[hmin,hmax]
{ph+ (h)}
Example: Burgers equation
There are two Holder exponents
isolated shocks, h = 0 with D(0) = 0 =) (0) = 1�D(0) = 1
smooth ramps, h = 1 with D(1) = 1 =) (1) = 1�D(1) = 0
For other h 6= 0, 1,(h) = +1, formally, so that the infimum is taken only over h = 0 or 1:
⇣p = infh2{0,1}
[ph+ (h)]
= inf{1, p}
=
8><
>:
p 0 p < 1
1 p � 1
The formula works! This is the same answer we obtained before by direct calculation of ⇣p for
the Khokhlov sawtooth solution of the Burgers equation. The Burgers solution is an example
of a bifractal field, with just two distinct exponents.
48

Going back to the general theory, the relation between ⇣p and (h)
⇣p = infh{ph+ (h)}
is an example of a Legendre transform. E.g. see R. T. Rockafellar, Convex Analysis (Princeton
University Press, 1970) for more discussion. If (h) is strictly convex (i.e. D(h) is strictly
concave), then the infimum is uniquely achieved for each p at the point h⇤(p) where
0 =@
@h{ph+ (h)}|h=h⇤(p) = p+ 0(h⇤(p))
=) 0(h⇤(p)) = �p.
Since p⇤(h) := �0(h) is decreasing in h ( by strict convexity of (h)), the inverse function is
defined by h⇤(p) = inf{h : p⇤(h) < p} and also decreasing in p. Then
⇣p = infh{ph+ (h)} = ph⇤(p) + (h⇤(p)).
But note that, in that case,
d⇣pdp
= h⇤(p) + [p+ 0(h⇤(p))]| {z }=0
dh⇤(p)
dp
= h⇤(p) !
There is a pleasing symmetry that
p⇤(h) = �ddh(h) & h⇤(p) =
d⇣pdp
Furthermore,
(h⇤(p)) = ⇣p � ph⇤(p)
=) (h) = ⇣p⇤(h) � p⇤(h)h
Note that ⇣p � ph is concave in p and that
ddp [⇣p � ph] = h⇤(p)� h = 0
precisely when h⇤(p) = h or p = p⇤(h). Thus,
(h) = ⇣p⇤(h) � p⇤(h)h
49

= suph{⇣p � ph} !
The nice symmetry
⇣p = infh{ph+ (h)} & (h) = sup
h{⇣p � ph}
is an example of Legendre duality. If (h) is not convex, then it can be shown that (h) =
supp{⇣p � ph} is the convex hull of (h). See Rockafellar (1970).
It was proposed by Parisi-Frisch (1985) to use this inversion formula to extract the (presumed
universal) function (h) from the data, or, equivalently,
D(h) = infp{ph+ (d� ⇣p)},
the so-called multifractal dimension spectrum. Notice that the domain I = [hmin, hmax] of the
concave function D(h) is just the range of possible slopes of ⇣p, since h = d⇣p/dp.
This program has been carried out, although the method based on structure functions and their
scaling exponents ⇣p has not proved the most accurate or robust method to determine D(h).
E.g., a wavelet-transform maximum modulus method has been used instead. See
J. F. Muzy, E. Bacry, and A. Arneodo, “Multifractal formalism for fractal signals:
The structure-function approach versus the wavelet-transform modulus-maxima method,”
Phys. Rev. E 47 875–884 (1993)
and, for the application to empirical analysis of turbulence,
P. Kestener & A. Arneodo, “Generalizing the wavelet-based multifractal formalism
to random vector fields: Application to three-dimensional turbulence velocity and
vorticity data,” Phys. Rev. Lett. 93 044501(2004)
50

They obtain D(h) spectra of both velocity and vorticity, using data from a 2563 DNS at
Re� = 140. They obtain a most probable h⇤ = h⇤(0) of about 0.34 ± 0.02, just a little bigger
than the K41 value h = 1/3 :
!!q" # $C0 $ C1q$ C2q2=2;
D!h" # C0 $ !h% C1"2=2C2:(7)
Both fields are found singular almost everywhere: Cv0 #
$!v!q# 0" #Dv!q# 0" # 3:02& 0:02 and C!0 # 3:01&
0:02. The most frequent Holder exponent h!q # 0" #$C1 [corresponding to the maximum of D!h"] takes thevalue $Cv
1 ’ $C!1 % 1 # 0:34& 0:02. Indeed, this esti-
mate is much closer to the K41 prediction h # 1=3 [1]than previous experimental measurements (h #0:39& 0:02) based on the analysis of longitudinal veloc-ity fluctuations [19]. Consistent estimates are obtained forC2 [which characterizes the width of D!h"]: Cv
2 #0:049& 0:003 and C!
2 # 0:055& 0:004. Note that thesevalues are much larger than the experimental estimateC2 # 0:025& 0:003 derived for 1D longitudinal velocityincrement statistics [19]. Actually they are comparable tothe value C2 # 0:040 extracted from experimental trans-verse velocity increments [19(b)].
To conclude, we have generalized the WTMM methodto vector-valued random fields. Preliminary applicationsto DNS turbulence data have revealed the existence of anintimate relationship between the velocity and vorticity3D statistics that turn out to be significantly more inter-mittent than previously estimated from 1D longitudinal
velocity increments statistics. This new methodologylooks very promising to many extents. Thanks to theSVD, one can focus on fluctuations that are locally con-fined in 2D (mini"i # 0) or in 1D (the two smallest "i arezero) and then simultaneously proceed to a multifractaland structural analysis of turbulent flows. The investiga-tion along this line of vorticity sheets and vorticity fila-ments in DNS is in current progress.
We are very grateful to E. Leveque for allowing us tohave access to his DNS data and to the CNRS under GDRturbulence.
[1] U. Frisch, Turbulence (Cambridge University Press,Cambridge, 1995).
[2] B. B. Mandelbrot, J. Fluid Mech. 62, 331 (1974).[3] C. Meneveau and K. R. Sreenivasan, J. Fluid Mech. 224,
429 (1991).[4] G. Parisi and U. Frisch, in Turbulence and Predictability
in Geophysical Fluid Dynamics and Climate Dynamics,edited by M. Ghil et al. (North-Holland, Amsterdam,1985), p. 84.
[5] E. Aurell et al., J. Fluid Mech. 238, 467 (1992).[6] J. F. Muzy, E. Bacry, and A. Arneodo, Phys. Rev. E 47,
875 (1993); Int. J. Bifurcation Chaos 4, 245 (1994); A.Arneodo, E. Bacry, and J. F. Muzy, Physica (Amsterdam)213A, 232 (1995).
[7] A. Arneodo et al., Ondelettes, Multifractales etTurbulences: de l’ADN aux Croissances Cristallines(Diderot Editeur, Art et Sciences, Paris, 1995).
[8] The Science of Disasters: Climate Disruptions, HeartAttacks and Market Crashes, edited by A. Bunde, J.Kropp, and H. Schellnhuber (Springer-Verlag, Berlin,2002).
[9] A. Arneodo, N. Decoster, and S. G. Roux, Eur. Phys. J. B15, 567 (2000); N. Decoster, S. G. Roux, and A. Arneodo,Eur. Phys. J. B 15, 739 (2000).
[10] A. Arneodo, N. Decoster, and S. G. Roux, Phys. Rev. Lett.83, 1255 (1999); S. G. Roux, A. Arneodo, and N.Decoster, Eur. Phys. J. B 15, 765 (2000).
[11] A. Arneodo et al., Adv. Imaging Electron Phys. 126, 1(2003).
[12] P. Kestener et al., Image Anal. Stereol. 20, 169 (2001).[13] P. Kestener and A. Arneodo, Phys. Rev. Lett. 91, 194501
(2003).[14] P. Kestener, Ph.D. thesis, University of Bordeaux I, 2003.[15] K. J. Falconer and T. C. O’Neil, Proc. R. Soc. London A
452, 1433 (1996).[16] G. H. Golub and C.V. Loan, Matrix Computations (John
Hopkins University Press, Baltimore, 1989), 2nd ed.[17] Note that if hi!r0" are the Holder exponents of the d
scalar components Vi!r0" of V, then h!r0" # minihi!r0".[18] We recall the relationship h # #$ d, between the Holder
exponent h and the singularity exponent # generallyobtained by BC techniques [D!#$ d" # f!#"].
[19] (a) A. Arneodo, S. Manneville, and J. F. Muzy, Eur.Phys. J. B 1, 129 (1998); (b) Y. Malecot et al., Eur.Phys. J. B 16, 549 (2000); (c) J. Delour, J. F. Muzy, andA. Arneodo, Eur. Phys. J. B 23, 243 (2001).
FIG. 4. Multifractal analysis of Leveque DNS velocity (!)and vorticity (') fields (d # 3, 18 snapshots) using the ten-sorial 3D WTMM method; the symbols (") correspond to asimilar analysis of vector-valued fractional Brownian motions,BH#1=3. (a) log2Z!q; a" vs log2a; (b) h!!q; a" vs log2a andhv!q; a" $ log2a vs log2a; the solid and dashed lines correspondto linear regression fits over 21:5"W & a & 23:9"W . (c) !v!q",!!!q", and !B1=3 !q" vs q; (d) Dv!h% 1", D!!h" vs h; the dashedlines correspond to log-normal regression fits with the parame-ter values Cv
2 # 0:049 and C!2 # 0:055; the dotted line is the
experimental singularity spectrum (C$vk2 # 0:025) for 1D lon-
gitudinal velocity increments [19].
VOLUME 93, NUMBER 4 P H Y S I C A L R E V I E W L E T T E R S week ending23 JULY 2004
044501-4 044501-4
Note, finally, that one can define multifractal spectra of other quantities, such as longitudinal
velocity increments
DL(h) = dim{x : hL(x) = h}or transverse velocity increments
DT (h) = dim{x : hT (x) = h}.But I’m not aware of any experimental/numerical results on these. We’ve seen that p = 0
corresponds to the “most probable” exponent h⇤ with
D(h⇤) = 0 · h⇤ + (d� ⇣0) = d.
The exponents with h < h⇤ correspond to p > 0, while those with h > h⇤ correspond to negative
p < 0. It is possible, but can be quite tricky, to study structure functions of negative order p.
An alternative approach based on so-called inverse structure functions is useful here:
M. H. Jensen, “Multiscaling and structure functions in turbulence: an alternative
approach,” Phys. Rev. Lett. 83 76-79 (1999)
51