d ecological relationships unit guide - physicslocker index · 2013-09-16 · this worksheet may...
TRANSCRIPT

Sheet 1 of 1© Harcourt Education Ltd 2004 Catalyst 2This worksheet may have been altered from the original on the CD-ROM.
D Unit guideEcological relationships
Where this unit fits in Prior learningThis unit builds on: unit 7C Environment and feeding relationships and unit 7D Variation and classification. Itdraws on unit 8C Microbes and disease.
The concepts in this unit are: identification of plants by group, modelling of feeding relationships, interdependence ofliving things in a community.
This unit leads onto:unit 9D Plants for food. It also provides a foundation for work in key stage 4 on energytransfer through an ecosystem and its relationship to food production.
To make good progress, pupils starting this unit needto know that: • different living things live in different habitats • animals and plants are adapted to survive in a
habitat and describe examples • feeding relationships can be represented by food
chains and food webs • organisms can be classified into plants and animals
and the main taxonomic groups.
Framework yearly teaching objectives – Interdependence • Identify some of the main taxonomic groups of plants and describe some common features • Explain that energy is transferred between organisms in food chains and webs; use this to:
— relate the abundance and distribution of organisms to the resources available within a habitat — begin representation of this using pyramids of numbers.
Expectations from the QCA Scheme of Work At the end of this unit …
… most pupils will … … some pupils will not have madeso much progress and will …
… some pupils will haveprogressed further and will …
in terms of scientific enquiry NC Programme of Study Sc1 2d, e, f, g, h, i, j, k, l, m
• suggest what data should be collected to investigate a habitat andchoose appropriate apparatus and techniques to make measurements andobservations
• use a sampling technique to collect data to compare populations inhabitats
• use ICT to collect, store and present information in a variety of ways.
• collect data to investigate aquestion about a habitat usingappropriate apparatus and techniques
• use ICT to collect, store and present information.
• plan how to collect reliabledata, taking into account thefact that variables cannotreadily be controlled.
in terms of life processes and living things NC Programme of Study Sc2, 4b, 5a, b, c, d, e
• classify some plant specimens into the main taxonomic groups of plants • identify and name organisms found in a particular habitat and describe
how they are adapted to the environmental conditions, explaining howthe adaptations help survival
• relate the abundance and distribution of organisms to the resourcesavailable within a habitat and begin to represent this using pyramids ofnumbers.
• name some organisms found in ahabitat and describe how they areadapted to environmentalconditions
• recognise that the abundance anddistribution of organisms isdifferent in different habitats.
• explain how pyramids ofnumbers represent feedingrelationships in a habitat.
Suggested lesson allocation (see individual lesson planning guides)Direct route
D1 Plant groups
D2 A place to live
D3 Home alone?
D4 Populations
D5 Special daisies –Think about ratiosand sampling
Extra lessons (not in pupil book)
D2–5 Fieldwork: Studying two different habitats Review and assess progress(distributedappropriately)
Misconceptions‘Water, carbon dioxide and light are plant foods.’‘Plant roots take in food from the soil.’
Health and safety (see activity notes to inform risk assessment)Risk assessments are required for any hazardous activity. In this unit pupils carry out fieldwork outside the school and handle a variety of livingthings. Refer to school and LEA guidelines for fieldwork visits. Wash hands after handling animals. Pooter mouthpieces should be disinfected eachtime they are used. Wipe benches with disinfectant.
D-F-Unit Guides.qxd 25-Nov-03 9:08 AM Page 1

Sheet 1 of 1© Harcourt Education Ltd 2004 Catalyst 2This worksheet may have been altered from the original on the CD-ROM.
D1Lesson planning
guidePlant groups
Suggested alternative starter activities (5–10 minutes)
Introduce the unit
Unit map for EcologicalRelationships.
Learning objectivesi Plants are classified into four groups by looking at how they reproduce, their leaves and how they transport water. ii The features of flowering plants, mosses, ferns and conifers.
Scientific enquiryiii Draw conclusions from their observations of plant specimens. (Framework YTO Sc1 8f)
Learning outcomes
Share learningobjectives
• Find out how plants canbe classified into groups.
• Observe specimens ofdifferent plant groups tosee how they are adaptedfor survival.
• Be able to drawconclusions from evidence.(Sc1)
Problem solving
• Pupils describe features ofexamples of differentcommon plants andsuggest ideas for groupingthem together.
Word game
• Recap classification ofanimals into vertebratesand invertebrates fromYear 7.
Capture interest
• Show a range of commonliving plants. Pupilssuggest where and inwhat kind ofenvironmental conditionsthey might be found.
Suggested alternative plenary activities (5–10 minutes)
Review learning
Pupils play ‘What am I?’ foreach type of plant group.
Sharing responses
Pupils feedback on theirobservations from ActivityD1a.
Group feedback
In groups, pupils discusswhat adaptations arerequired in Activity D1b.
Word game
Pupils play ‘Where do Ilive?’
Looking ahead
Pupils research the namesof different people whohave had solo adventures ofexploration.
Suggested alternative main activitiesActivity
Textbook D1
Activity D1a Practical
Activity D1b Paper
Activity D1c CatalystInteractive Presentations 2
Learningobjectivesee above
i and ii
i and iii
i
ii
Description
Teacher-led explanation and questioning OR pupils work individually,in pairs or in small groups through the in-text questions and thenonto the end-of-spread questions if time allows.
Grouping plants Pupils observe specimens of a moss, fern, a brightlycoloured flowering plant, a grass and a conifer using theirobservations to draw conclusions.
Plant habitats Pupils look at plant habitats such as rainforest,alpine, temperate, windy seacoast and say what the conditions arethat plants will need to adapt to.
Interactive support version of Activity D1a.
Approx. timing
20 min
10 min
10 min
10 min
Target group
C H E S
R/G G R S
✔
✔
✔
Key wordsflowering plants, reproduce, cuticle, spores, ferns, fronds, mosses,conifers, cones, veins, red only: vascular
Out-of-lesson learningHomework D1 Textbook D1 end-of-spread questions Activity D1b Internet/library search for information about different plant groups
Most pupils will …
• recognise that plants are subdivided intogroups based on characteristics such asvascular tissue and seed or spore bearingreproduction
• explain why mosses are found in damp places • classify some plant specimens into the main
taxonomic groups of plants describing theirfeatures.
Some pupils, making less progress will …
• classify some plant specimens into the maintaxonomic groups of plants describing onefeature of each group
• explain why mosses are found in damp places.
Some pupils, making more progress will …
• recognise a range of key differences betweeneach group and will be able to makecomparisons and generalisations enablingthem to classify a range of living, preservedand photographic material.
D-F-Unit Guides.qxd 25-Nov-03 9:08 AM Page 2

Sheet 1 of 1© Harcourt Education Ltd 2004 Catalyst 2This worksheet may have been altered from the original on the CD-ROM.
D2Lesson planning
guideA place to live
Suggested alternative starter activities (5–10 minutes)
Recap last lesson
Word search of differentplants and their habitats
Learning objectivesi A habitat provides all the things plants and animals need to carry out the life processes and also gives them shelter. ii Different habitats have different environmental conditions. iii Plants and animals have adaptations to help them survive in their habitat.
Scientific enquiryiv Draw conclusions. (Framework YTO Sc1 8f)
Learning outcomes
Share learningobjectives
• Find out aboutenvironmental conditionsin different habitats.
• Find out how plants andanimals are adapted forsurvival.
• Be able to measureenvironmental conditions.(Sc1)
Problem solving
Give examples of humansput into the wrong habitat.Pupils identify the potentialproblems and suggest howhumans could survive.
Brainstorming
Pupils discuss whatconditions to measure fordifferent environments andhow to measure them.
Capture interest
Introduce the book JimShekhdar – Bold man of thesea. He was the first personever to row single handed10 000 miles across thePacific ocean.
Suggested alternative plenary activities (5–10 minutes)
Review learning
Pupils match differentadaptations to differenthabitats.
Sharing responses
Pupils discuss whatenvironmental conditionscould be measured in theArctic and Antarctic.
Group feedback
In groups, pupils feedbackon adaptations fromActivity D2a.
Word game
Pupils play ‘Dear diary’writing a day in animaginary diary of someonetrekking to the North Poleand the problems they needto adapt to.
Looking ahead
Pupils research why thereare more rabbits thaneagles in the UK.
Suggested alternative main activitiesActivity
Textbook D2
Activity D2a Paper
Learningobjectivesee above
i, ii and iii
i, ii, iii andiv
Description
Teacher-led explanation and questioning OR pupils work individually,in pairs or in small groups through the in-text questions and thenonto the end-of-spread questions if time allows.
Different habitats Pupils look at stimulus pictures of habitats andask pupils what types of animal live there and their adaptations. Ask pupils why animals differ.
Approx. timing
20 min
15 min
Target group
C H E S
R/G G R S
✔
Key wordshabitat, environment, ecosystem, adaptations, pond dipping, red only: datalogger
Out-of-lesson learningHomework D2 Textbook D2 end-of-spread questions Activity D2a
Most pupils will …
• identify organisms likely to be found in ahabitat
• suggest how organisms living in differenthabitats obtain the essentials for life andreproduction.
Some pupils, making less progress will …
• identify organisms likely to be found in ahabitat
• state how one or two organisms are adapted toliving in a particular habitat.
Some pupils, making more progress will …
• explain how road building can affect both theecosystem and different habitats
• evaluate strategies for protecting theenvironment.
D-F-Unit Guides.qxd 25-Nov-03 9:08 AM Page 3
Sheet 1 of 1© Harcourt Education Ltd 2004 Catalyst 2This worksheet may have been altered from the original on the CD-ROM.
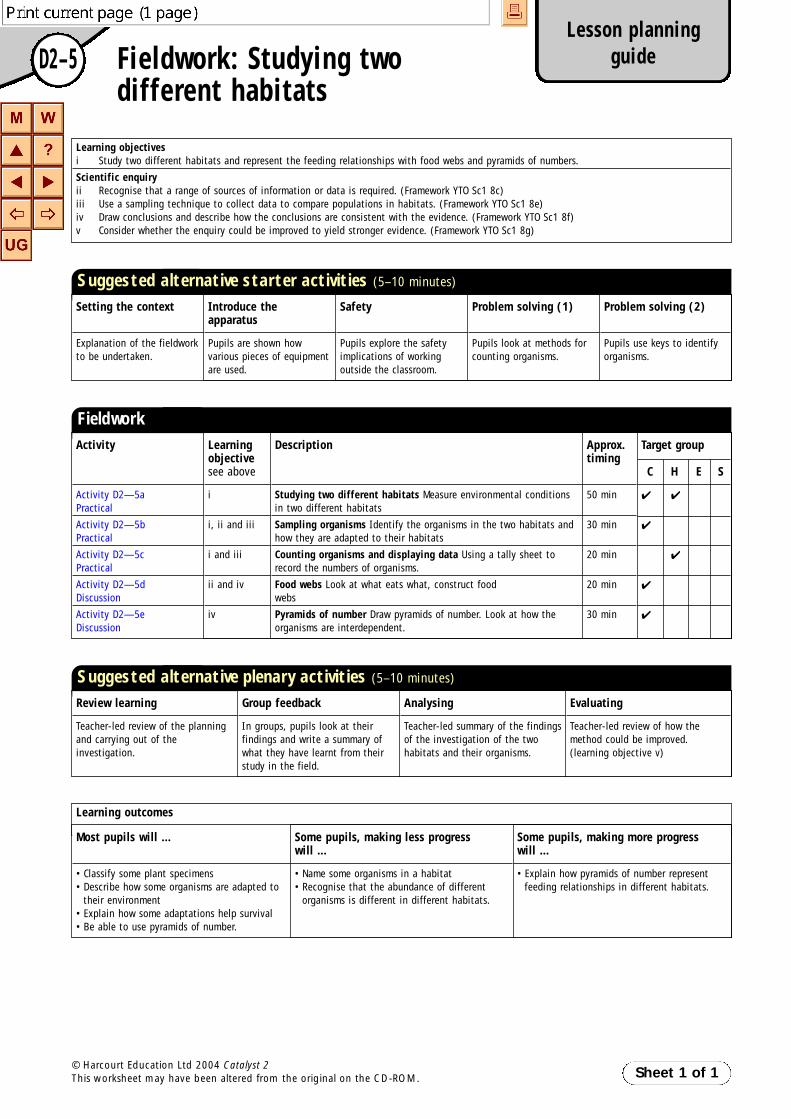
D2–5Lesson planning
guideFieldwork: Studying twodifferent habitats
Suggested alternative starter activities (5–10 minutes)
Setting the context
Explanation of the fieldworkto be undertaken.
Learning objectivesi Study two different habitats and represent the feeding relationships with food webs and pyramids of numbers.
Scientific enquiryii Recognise that a range of sources of information or data is required. (Framework YTO Sc1 8c) iii Use a sampling technique to collect data to compare populations in habitats. (Framework YTO Sc1 8e) iv Draw conclusions and describe how the conclusions are consistent with the evidence. (Framework YTO Sc1 8f) v Consider whether the enquiry could be improved to yield stronger evidence. (Framework YTO Sc1 8g)
Learning outcomes
Introduce the apparatus
Pupils are shown howvarious pieces of equipmentare used.
Safety
Pupils explore the safetyimplications of workingoutside the classroom.
Problem solving (1)
Pupils look at methods forcounting organisms.
Problem solving (2)
Pupils use keys to identifyorganisms.
Suggested alternative plenary activities (5–10 minutes)
Review learning
Teacher-led review of the planningand carrying out of theinvestigation.
Group feedback
In groups, pupils look at theirfindings and write a summary ofwhat they have learnt from theirstudy in the field.
Analysing
Teacher-led summary of the findingsof the investigation of the twohabitats and their organisms.
Evaluating
Teacher-led review of how themethod could be improved.(learning objective v)
FieldworkActivity
Activity D2—5aPractical
Activity D2—5b Practical
Activity D2—5c Practical
Activity D2—5d Discussion
Activity D2—5e Discussion
Learningobjectivesee above
i
i, ii and iii
i and iii
ii and iv
iv
Description
Studying two different habitats Measure environmental conditionsin two different habitats
Sampling organisms Identify the organisms in the two habitats andhow they are adapted to their habitats
Counting organisms and displaying data Using a tally sheet torecord the numbers of organisms.
Food webs Look at what eats what, construct food webs
Pyramids of number Draw pyramids of number. Look at how theorganisms are interdependent.
Approx. timing
50 min
30 min
20 min
20 min
30 min
Target group
C H E S
✔ ✔
✔
✔
✔
✔
Most pupils will …
• Classify some plant specimens • Describe how some organisms are adapted to
their environment• Explain how some adaptations help survival• Be able to use pyramids of number.
Some pupils, making less progress will …
• Name some organisms in a habitat• Recognise that the abundance of different
organisms is different in different habitats.
Some pupils, making more progress will …
• Explain how pyramids of number representfeeding relationships in different habitats.
D-F-Unit Guides.qxd 25-Nov-03 9:08 AM Page 4

Sheet 1 of 1© Harcourt Education Ltd 2004 Catalyst 2This worksheet may have been altered from the original on the CD-ROM.
D3Lesson planning
guideHome alone?
Suggested alternative starter activities (5–10 minutes)
Recap last lesson
Describe a habitat and askpupils to identify it.
Learning objectivesi A pyramid of numbers describes the numbers of producers, herbivores and carnivores in a habitat. ii Plants benefit from the waste products and the decay of other organisms.
Scientific enquiryiii Make predictions about the effect of environmental factors on plant and animal populations (Extension)
(Framework YTO Sc1 7b)
Learning outcomes
Share learning objectives
• Find out about pyramidsof numbers.
• Find out about theproducers, herbivores andcarnivores in a food web.
Problem solving
Making a food web.
Word game
Pupils answer a series oftrue or false questions.
Capture interest
Show pupils an owl pelletand the type ofmaterial/bones it contains.Catalyst InteractivePresentations 2
Suggested alternative plenary activities (5–10 minutes)
Review learning
Show pupils odd-shapedpyramids of numbers andask pupils to explain theirshape.
Sharing responses
Pupils share their answersto questions in ActivityD3b.
Group feedback
Each group feeds back theirdata from Activity D3a tobuild a pyramid of numbersfor the whole class.
Brainstorming
Pupils imagine that lifeexists on Mars andbrainstorm problems thatcould occur to an ecosystemif people land on Mars.
Looking ahead
Pupils research graphsshowing populationnumbers for differentorganisms.
Suggested alternative main activitiesActivity
Textbook D3
Activity D3a Practical/ICT
Activity D3b Paper
Learningobjectivesee above
i and ii
i
ii and iii
Description
Teacher-led explanation and questioning OR pupils work individually, in pairs or in small groups through the in-text questions and then onto the end-of-spread questions if time allows.
Leaf litter Pupils collect leaf litter and look for invertebrates in it.They identify and count the organisms and build up a pyramid ofnumbers using the combined class results. The extension activityuses a spreadsheet to draw the pyramid of numbers.
Interdependence Show a foodweb and ask about interdependenceand how changes will affect other parts of it.
Approx. timing
20 min
40 min
10 min
Target group
C H E S
R/G G R S
✔ ✔
✔ (✔ )
Key wordsfood chain, food web, pyramid of numbers, decomposer
Out-of-lesson learningHomework D3 Textbook D3 end-of-spread questions Activity D3b Invite an ecologist in to talk to pupils Visit a local habitats nature centre/reserve Watch wildlife programmes/videos Read fiction that focuses on the natural environment, e.g. Watership Down
Most pupils will …
• describe how a food web shows the feedingrelationships within a environment and beginto represent this using pyramids of numbers
• describe ways in which plants depend onother organisms.
Some pupils, making less progress will …
• describe how a food web shows the feedingrelationships within a environment
• describe ways in which plants depend on otherorganisms.
Some pupils, making more progress will …
• explain how pyramids of numbers representfeeding relationships in a habitat
• interpret odd shaped pyramids of numbers.
D-F-Unit Guides.qxd 25-Nov-03 9:08 AM Page 5

Sheet 1 of 1© Harcourt Education Ltd 2004 Catalyst 2This worksheet may have been altered from the original on the CD-ROM.
D4Lesson planning
guidePopulations
Suggested alternative starter activities (5–10 minutes)
Recap last lesson
Pupils link a food chain toa pyramid of numbers, byidentifying different trophiclevels.
Learning objectivesi A population is the number of individuals of a species living in a habitat. ii Competition for resources such as food water and space, predation and disease all affect the size of a population. iii Feeding relationships within a habitat are interconnected.
Scientific enquiryiv Use ICT to model population changes. (Framework YTO Sc1 8d)
Learning outcomes
Share learning objectives
• Find out how competitionaffects the populations in ahabitat.
• Find out how feedingrelationships areinterconnected.
• Be able to use ICT to modelpopulation changes. (Sc1)
Brainstorming
Show graph of worldpopulation. Brainstormwhy it just keeps ongoing up.
Word game
Check progress using awordsearch of words used inthis unit.
Capture interest
Show picture of lion eatinga zebra. Ask pupils whythere are not more zebras.Catalyst InteractivePresentations 2
Suggested alternative plenary activities (5–10 minutes)
Review learning
Pupils play ‘true or false’game about theinterdependence ofpopulations.
Sharing responses
Pupils share ideas aboutwhy the graph for thehuman population keeps ongoing up.
Group feedback
In groups, pupils discusstheir answers for ActivityD4b.
Word game
Pupils play ‘Hang the rabbit’to reinforce vocabulary andspelling of key words.
Looking ahead
Pupils revise andconsolidate knowledge fromthe unit.
Suggested alternative main activitiesActivity
Textbook D4
Activity D4a Paper
Activity D4b Paper
Activity D4c Catalyst Interactive Presentations 2
Learningobjectivesee above
i, ii and iii
i
i
i and iv
Description
Teacher-led explanation and questioning OR pupils work individually,in pairs or in small groups through the in-text questions and thenonto the end-of-spread questions if time allows.
Squirrel competition How red and grey squirrels compete.
Population cycles Graph of cycling population to interpret.
Population change Foxes and rabbits ICT simulation of populationchanges.
Approx. timing
20 min
10 min
10 min
10 min
Target group
C H E S
R/G G R S
✔ ✔
✔
✔ ✔ ✔
Key wordspopulation, competition, interdependent, red only: predation
Out-of-lesson learningHomework D4 Textbook D4 end-of-spread questions Activity D4a, b Visit different habitats/sanctuaries/nature reserves
Most pupils will …
• relate the abundance and distribution oforganisms to the resources available within ahabitat
• predict how changing the size of onepopulation will affect the number of otherspecies
• present data from simulations and makepredictions from patterns in these.
Some pupils, making less progress will …
• state the factors that affect the abundance ofdifferent organisms in habitat
• predict how changing the size of onepopulation will affect the number of otherspecies
• present data from simulations and makepredictions from patterns in these.
Some pupils, making more progress will …
• draw and interpret a graph to show how apopulation changes.
D-F-Unit Guides.qxd 25-Nov-03 9:08 AM Page 6

Sheet 1 of 1© Harcourt Education Ltd 2004 Catalyst 2This worksheet may have been altered from the original on the CD-ROM.
D5Lesson planning
guideSpecial daisies – Think aboutratios and sampling
Suggested alternative starter activities (5–10 minutes)
Bridging to the unit
Pupils work out what changes tothe environment do to differentpopulations.
Learning objectivesi The problems associated with sampling to build a case to save a plant thought to be rare to build a petrol station.The structure of this lesson is based around the CASE approach. The starter activities give concrete preparation. The main activities move away from theconcrete towards a challenging situation, where pupils need to think. The extended plenary gives pupils time to discuss what they have learnt, to negotiatea method to commit to paper and express their ideas verbally to the rest of the class.
Scientific enquiryii Ratio and scale. iii Random sampling.
Learning outcomes
Setting the context
Pupils brainstorm what informationwe need to know in order to savea rare species.
Concrete preparation (1)
Pupils discover why sampling isused.
Concrete preparation (2)
Pupils work out ratios of daisies torabbits.
Suggested alternative plenary activities (5–10 minutes)
Group feedback
Pupils feedback the number of objects found in Activity D5a to determinea class average.
Bridging to other topics
Pupils brainstorm how the sampling method may be used on a large scaleto determine the number of organisms in a habitat.
Suggested alternative main activitiesActivity
Textbook D5
Activity D5a Practical
Learningobjectivesee above
i, ii and iii
i
Description
Teacher-led explanation and questioning OR pupils work individually,in pairs or in small groups through the in-text questions and thenonto the end-of-spread questions if time allows.
Sampling Pupils use brass tacks and trays of sand to find out aboutquadrat sampling.
Approx. timing
30 min
30 min
Target group
C H E S
R/G G R S
✔
Key wordsrandom samples, quadrat, ratio
Out-of-lesson learningTextbook D5 end-of-spread questions
Most pupils will …
• apply the concepts of scale and ratio using amap
• reflect upon the idea of random samplingusing quadrats
• analyse results to estimate the number of raredaisies in the field
• discuss the accuracy and reliability of theresults.
Some pupils, making less progress will …
• discuss the idea of random sampling usingquadrats
• with help analyse the results to estimate thenumber of rare daisies in the field.
Some pupils, making more progress will …
• resolve cognitive conflict arising when thenumber of daisy plants in the whole field hasto be estimated based on sampling
• discuss the merits of a larger sample size andsuggest what other information might beneeded to decide whether a plant is rare.
D-F-Unit Guides.qxd 25-Nov-03 9:08 AM Page 7

D Unit mapEcological relationships
Sheet 1 of 1© Harcourt Education Ltd 2004 Catalyst 2This worksheet may have been altered from the original on the CD-ROM.
Copy the unit map and use these words to help you complete it.You may add words of your own too.
carnivorescompetitionconifersconsumerscuticlecycle Rdecomposersecosystemenvironmentfernsflowering plantshabitatherbivoresinterdependent
mossespond dippingpopulationpredationpreyproducersquadratresourcessampleseedssensorssporesvein
Ecologicalrelationships
Sampling Environmentalconditions
Adaptation
Pyramids of number and food webs
Population andcompetition
Grouping plants
Unitmaps.qxd 12-Nov-03 8:56 AM Page 4
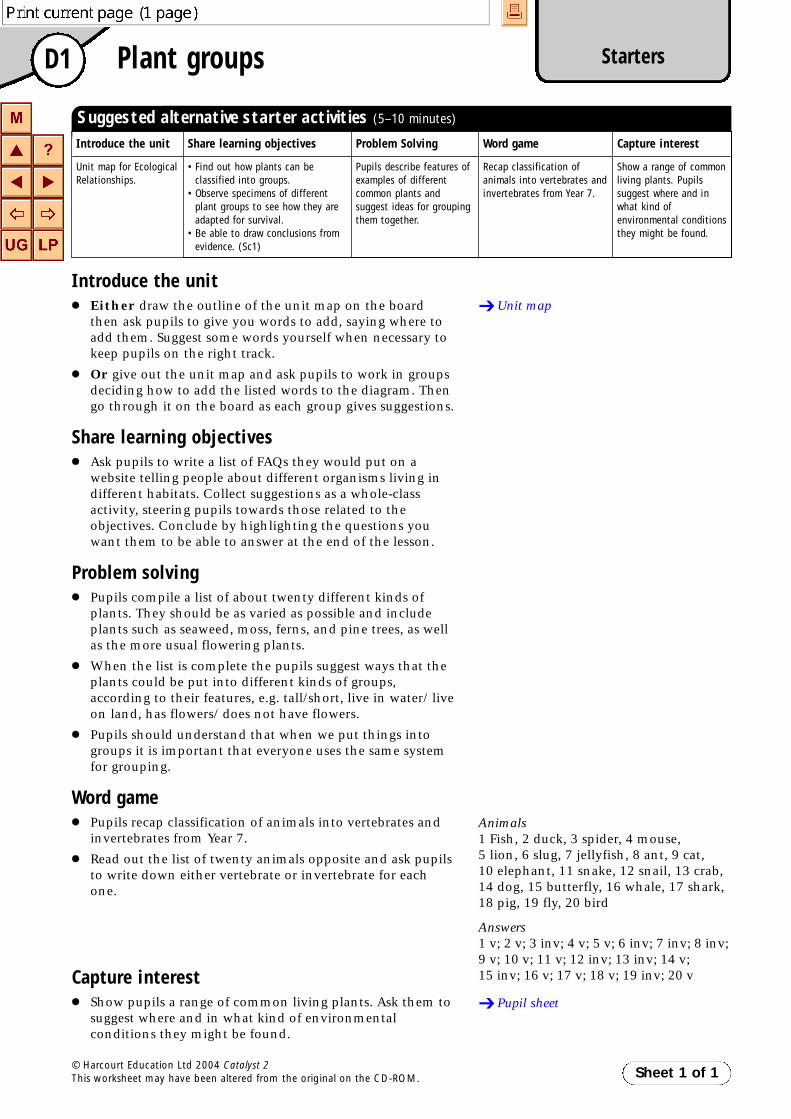
D1 StartersPlant groups
Introduce the unit●● Either draw the outline of the unit map on the board
then ask pupils to give you words to add, saying where toadd them. Suggest some words yourself when necessary tokeep pupils on the right track.
●● Or give out the unit map and ask pupils to work in groupsdeciding how to add the listed words to the diagram. Thengo through it on the board as each group gives suggestions.
Share learning objectives●● Ask pupils to write a list of FAQs they would put on a
website telling people about different organisms living indifferent habitats. Collect suggestions as a whole-classactivity, steering pupils towards those related to theobjectives. Conclude by highlighting the questions youwant them to be able to answer at the end of the lesson.
Problem solving●● Pupils compile a list of about twenty different kinds of
plants. They should be as varied as possible and includeplants such as seaweed, moss, ferns, and pine trees, as wellas the more usual flowering plants.
●● When the list is complete the pupils suggest ways that theplants could be put into different kinds of groups,according to their features, e.g. tall/short, live in water/ liveon land, has flowers/ does not have flowers.
●● Pupils should understand that when we put things intogroups it is important that everyone uses the same systemfor grouping.
Word game●● Pupils recap classification of animals into vertebrates and
invertebrates from Year 7.●● Read out the list of twenty animals opposite and ask pupils
to write down either vertebrate or invertebrate for eachone.
Capture interest●● Show pupils a range of common living plants. Ask them to
suggest where and in what kind of environmentalconditions they might be found.
➔ Unit map
Animals1 Fish, 2 duck, 3 spider, 4 mouse,5 lion, 6 slug, 7 jellyfish, 8 ant, 9 cat,10 elephant, 11 snake, 12 snail, 13 crab,14 dog, 15 butterfly, 16 whale, 17 shark,18 pig, 19 fly, 20 bird
Answers1 v; 2 v; 3 inv; 4 v; 5 v; 6 inv; 7 inv; 8 inv;9 v; 10 v; 11 v; 12 inv; 13 inv; 14 v;15 inv; 16 v; 17 v; 18 v; 19 inv; 20 v
➔ Pupil sheet
Sheet 1 of 1© Harcourt Education Ltd 2004 Catalyst 2This worksheet may have been altered from the original on the CD-ROM.
Suggested alternative starter activities (5–10 minutes)
Introduce the unit
Unit map for EcologicalRelationships.
Share learning objectives
• Find out how plants can beclassified into groups.
• Observe specimens of differentplant groups to see how they areadapted for survival.
• Be able to draw conclusions fromevidence. (Sc1)
Problem Solving
Pupils describe features ofexamples of differentcommon plants andsuggest ideas for groupingthem together.
Word game
Recap classification ofanimals into vertebrates andinvertebrates from Year 7.
Capture interest
Show a range of commonliving plants. Pupilssuggest where and inwhat kind ofenvironmental conditionsthey might be found.
D-Starters.qxd 29-Oct-03 6:48 PM Page 1

D1 StartersPlant groups
Capture interest
Look at the pictures of different plants.
For each plant, write a list of the different environmental conditionsin which the plant may be found.
The first one has been done for you.
Sheet 1 of 1© Harcourt Education Ltd 2004 Catalyst 2This worksheet may have been altered from the original on the CD-ROM.
Orchid
Cactus Seaweed
Pine forest
Grows in warm andhumid conditions.Found in tropicalrainforests.Does not like cold anddry places.
D-Starters.qxd 29-Oct-03 6:49 PM Page 2

D2 StartersA place to live
Recap last lesson● Ask pupils to complete the wordsearch on the pupil
sheet.● Ring the words on a copy of the pupil sheet and show it
as an OHT for them to check their answers. Use thewords on it to introduce the lesson.
Share learning objectives● Ask pupils to write a list of FAQs they would put on a
website telling people about how animal and plants areadapted to their environment. Collect suggestions as awhole-class activity, steering pupils towards thoserelated to the objectives. Conclude by highlighting thequestions you want them to be able to answer at theend of the lesson.
Problem solving● Give pupils three different extreme habitats and ask
them to suggest how humans who have been strandedin these habitats might be able to survive. Discuss theirideas.
Brainstorming● Give pupils two different habitats and ask what
conditions they could measure and how they couldmake the measurements.
Capture interest● Pupils are introduced to the book Bold Man of the Sea
by Jim Shekhdar, Hodder and Stoughton, ISBN 0 34082170 1. The book tells the story of Jim Shekhdar whowas the first man ever to row single handed over 10000miles across the Pacific Ocean.
● Pupils read an extract from the book presented on thepupil sheet and answer a question about how headapted to survive the long expedition.
➔ Pupil sheet
Habitat/AnswersTropical island – finding fresh water, meansof fishing, building shelter from palmleaves, etc.Adrift at sea – using a solar still to get freshwater, how to catch fish, protection fromsunburn or other weather extremes.Arctic tundra – building ice shelter/cave,catching food, etc.
Habitat/AnswersStream – answers include temperature witha thermometer, light intensity at pondsurface with a light meter, depth with ameter rule, flow rate by timing how long aball takes to float 100m downstream, pH ofwater with pH meter, etc.Woodland – answers include light intensity,height of canopy with a clinometer, pH ofsoil with soil testing kit etc.
➔ Pupil sheet
Sheet 1 of 1© Harcourt Education Ltd 2004 Catalyst 2This worksheet may have been altered from the original on the CD-ROM.
Suggested alternative starter activities (5–10 minutes)
Recap last lesson
Word search ofdifferent plants andtheir habitats
Share learning objectives
• Find out about environmentalconditions in different habitats.
• Find out how plants and animalsare adapted for survival.
• Be able to measure environmentalconditions. (Sc1)
Problem solving
Give examples of humansput into the wronghabitat. Pupils identifythe potential problemsand suggest how humanscould survive.
Brainstorming
Pupils discuss whatconditions to measure fordifferent environments andhow to measure them.
Capture interest
Introduce the book JimShekhdar – Bold Man of theSea. He was the first personever to row single handed10,000 miles across thePacific ocean.
D-Starters.qxd 29-Oct-03 6:49 PM Page 3

D2 StartersA place to live
Recap last lesson
Copy the words below and match each of the organisms with its habitat.
See how many of the words you can find in the wordsearch.
Sheet 1 of 1
Sheet 1 of 1
© Harcourt Education Ltd 2004 Catalyst 2This worksheet may have been altered from the original on the CD-ROM.
StartersD2 A place to live
© Harcourt Education Ltd 2004 Catalyst 2This worksheet may have been altered from the original on the CD-ROM.
cactusdesert
polar
orchidlichen
sea seaweed
tropical
A F P L R A L O P
O V I S D W A R T
B U X E I C C U N
L F M A H A I B E
S A R W C C P I H
D E S E R T O G C
Y J A E O U R M I
E K A D P S T A L
Recap last lesson
Copy the words below and match each of the organisms with its habitat.
See how many of the words you can find in the wordsearch.
A F P L R A L O P
O V I S D W A R T
B U X E I C C U N
L F M A H A I B E
S A R W C C P I H
D E S E R T O G C
Y J A E O U R M I
E K A D P S T A L
cactusdesert
polar
orchidlichen
sea seaweed
tropical
D-Starters.qxd 29-Oct-03 6:49 PM Page 4

D2 StartersA place to live
Capture interest
Read the following extract and then answer the question.
Sheet 1 of 1© Harcourt Education Ltd 2004 Catalyst 2This worksheet may have been altered from the original on the CD-ROM.
1 Make a list of all the ways that Jim Shekhdar adapted so that he could survive thelong sea voyage.
‘I have no doubt that my nine month voyage across the Pacific significantly
improved my general state of health. My medical report card would read as
follows:
Head: frequently bumped when climbing in and out of the cabin, often cut
and grazed due to lack of protective hair, once gashed deep enough to be
dripping blood over the deck, sporadically burned by pitiless sun if the owner
carelessly neglected to wear his floppy hat while rowing.
Shoulders and chest: similarly singed when the owner rowed without a T-
shirt on sunny days, or even when he rowed with a torn shirt, resulting in a
scorched red stripe across the back.
Hands: initially wore gloves while rowing on the Atlantic, but eventually
discarded them because they succeeded only in changing the position of the
unavoidable blisters; never wore gloves on the Pacific; since hands appeared to
be constantly damp and soft, resembling wet paper, blisters generally burst
early and disappeared leaving a small dent in the flesh.
Wrists: generally fine, but once accidentally slammed against hatch of the
cabin, most probably fracturing a small bone in the process: treated with a
tightly bound crepe bandage and bravely borne for two weeks.
Bowels: a stable diet including copious amounts of dried prunes and apricots,
ensured I could set my watch by regular activity.
Backside: a combination of orthopaedic cushion and the Concept II training
seat proved successful in avoiding blisters.
Feet: subjects of special care because owner was ever mindful of the ocean
rower, Joe le Guen, who had injured his feet and ultimately had ten toes
amputated after being rescued; Quayside deck shoes, veterans of the Atlantic
crossing, performed magnificently again, until one was lost in the waves of
the dramatic arrival at North Stradbroke Island.’
Extract from Bold Man of the Sea by Jim Shekhdar,Hodder and Stoughton, 2001
D-Starters.qxd 29-Oct-03 6:49 PM Page 5

D3 StartersHome alone?
Recap last lesson● Pupils play ‘Name this habitat’ game. Read out a
description of a habitat from the teacher sheet.
● Pupils get three points if they get the correct habitatafter the first clue. Each time give a bit moreinformation and reduce the number of points gained.At the end of the game, the pupil with the highestnumber of points wins.
Share learning objectives● Ask pupils to write a list of FAQs they would put on a
website telling people about food webs and pyramids ofnumber. Collect suggestions as a whole-class activity,steering pupils towards those related to the objectives.Conclude by highlighting the questions you want themto be able to answer at the end of the lesson.
Problem solving● Pupils make a food web.
Word game● Read out the statements about feeding relationships on
the teacher sheet and ask pupils to decide if thestatements are true or false.
Capture interest● Show pupils some owl pellets. Place the pellets in water
in a Petri dish and gently stir them. The pellets thenbreak up and the bones of the creature from the owl’slast meal can then be clearly identified. This may be:shrews, mice, voles, rabbits, birds, large beetles, frog.
➔ Teacher sheet
➔ Pupil sheet
➔ Teacher sheet
➔ Catalyst Interactive Presentations 2
Sheet 1 of 1© Harcourt Education Ltd 2004 Catalyst 2This worksheet may have been altered from the original on the CD-ROM.
Suggested alternative starter activities (5–10 minutes)
Recap last lesson
Describe a habitat andask pupils to identify it.
Share learning objectives
• Find out about pyramids ofnumber.
• Find out about the producers,herbivores and carnivores in afood web.
Problem solving
Making a food web.
Word game
Pupils answer a series oftrue or false questions.
Capture interest
Show pupils an owl pellet andthe type of material/bones itcontains.Catalyst InteractivePresentations 2
D-Starters.qxd 29-Oct-03 6:49 PM Page 6

D3 StartersHome alone?
Recap last lessonTeacher sheet
Read out each clue one at a time.
Polar
Clue 1 Not many plants or animals live there. 3Clue 2 No liquid water. 2Clue 3 Very cold. 1
Tropical rainforest
Clue 1 Lots of water. 3Clue 2 Very warm. 2Clue 3 Lots of different animals and plants live there. 1
Desert
Clue 1 Not many animals and plants live there. 3Clue 2 Can be very hot and very cold in a 24 hour period. 2Clue 3 Very little water. 1
Stream
Clue 1 Lots of water. 3Clue 2 Water is quite shallow. 2Clue 3 The water flows downhill. 1
Pine forest
Clue 1 Not much light. 3Clue 2 Lots of similar plants. 2Clue 3 Christmas trees live there. 1
Sheet 1 of 1© Harcourt Education Ltd 2004 Catalyst 2This worksheet may have been altered from the original on the CD-ROM.
D-Starters.qxd 29-Oct-03 6:49 PM Page 7

D3 StartersHome alone?
Problem solving
Cut out the boxes and the arrows.
Decide what eats what and rearrange the boxes and the arrows into a food web.
When you are sure you have the organisms in the correct places, paste the boxes andarrows on to a sheet of white paper.
Sheet 1 of 1
Sheet 1 of 1
© Harcourt Education Ltd 2004 Catalyst 2This worksheet may have been altered from the original on the CD-ROM.
StartersD3 Home alone?
Problem solving
Cut out the boxes and the arrows.
Decide what eats what and rearrange the boxes and the arrows into a food web.
When you are sure you have the organisms in the correct places, paste the boxes andarrows on to a sheet of white paper.
© Harcourt Education Ltd 2004 Catalyst 2This worksheet may have been altered from the original on the CD-ROM.
D-Starters.qxd 29-Oct-03 6:49 PM Page 8

D3 StartersHome alone?
Word gameTeacher sheet
Read out the questions below and ask pupils to answer true or false.
1 There are always more carnivores than herbivores in a food chain. [False]
2 Pyramids of number show how many organisms are present ina food chain. [True]
3 Producers eat other organisms. [False]
4 Herbivores eat meat. [False]
5 Carnivores eat herbivores. [True]
6 Available energy decreases as it passes along the food chain. [True]
7 When organisms die and rot, nutrients are recycled to other organisms. [True]
8 Food webs are just very long food chains. [False]
9 Populations just keep on increasing unless something stops themfrom increasing. [True]
Sheet 1 of 1© Harcourt Education Ltd 2004 Catalyst 2This worksheet may have been altered from the original on the CD-ROM.
D-Starters.qxd 29-Oct-03 6:49 PM Page 9

D4 StartersPopulations
Recap last lesson● Pupils are presented with a series of food chains and
pyramids of number and they have to link the food chainto the correct pyramid.
Share learning objectives● Ask pupils to write a list of FAQs they would put on a
website telling people about competition and predation.Collect suggestions as a whole-class activity, steeringpupils towards those related to the objectives. Concludeby highlighting the questions you want them to be able toanswer at the end of the lesson.
Brainstorming● Show the graph as an OHT.
● Ask pupils to brainstorm why the human population justkeeps on increasing.
● If there is time, discuss the possible consequences.
● Do not talk about the suggested answers, as this will bedone in the plenary.
Word game● Ask pupils to complete the wordsearch on the pupil sheet.
● Ring the words on a copy of the pupil sheet and show it asan OHT for them to check their answers. Use the wordson it to introduce the lesson.
Capture interest● Show a video clip of a lion eating a zebra.
● Ask pupils ‘Why are there not more zebras?’ Answer –they are eaten by lions.
● Ask pupils ‘Why are there not more lions?’ Answer –numbers are limited by food available. If they eat all thezebras, they may starve.
➔ Pupil sheet
AnswersXB; YC; ZA
➔ Pupil sheet
➔ Pupil sheet
➔ Catalyst Interactive Presentations 2
Sheet 1 of 1© Harcourt Education Ltd 2004 Catalyst 2This worksheet may have been altered from the original on the CD-ROM.
Suggested alternative starter activities (5–10 minutes)
Recap last lesson
Pupils link a food chainto a pyramid of number,by identifying differenttrophic levels.
Share learning objectives
• Find out how competition affects the populations in ahabitat.
• Find out how feedingrelationships are interconnected.
• Be able to use ICT to modelpopulation changes. (Sc1)
Brainstorming
Show graph of worldpopulation. Brainstormwhy it just keeps on goingup.
Word game
Check progress using awordsearch of words usedin this unit.
Capture interest
Show picture of a lioneating a zebra. Ask pupils why there are notmore zebras.Catalyst InteractivePresentations 2
D-Starters.qxd 29-Oct-03 6:49 PM Page 10
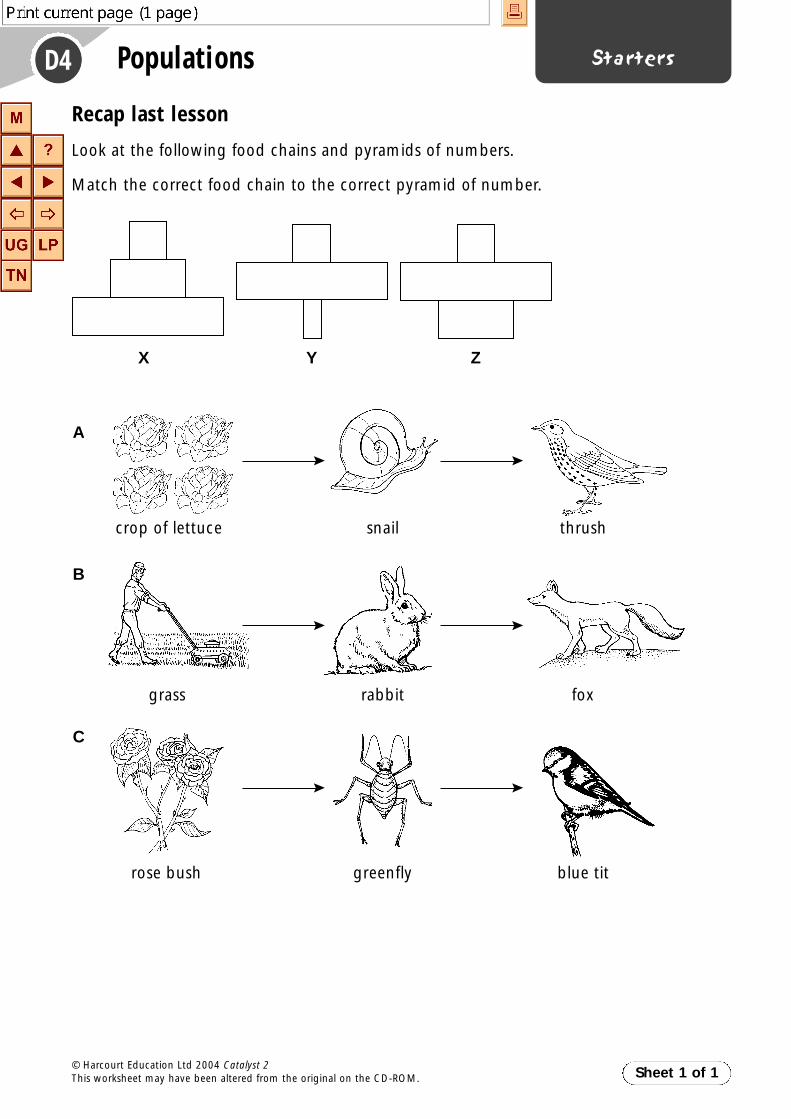
D4 StartersPopulations
Recap last lesson
Look at the following food chains and pyramids of numbers.
Match the correct food chain to the correct pyramid of number.
Sheet 1 of 1© Harcourt Education Ltd 2004 Catalyst 2This worksheet may have been altered from the original on the CD-ROM.
X Y Z
crop of lettuce snail thrush
grass rabbit fox
rose bush greenfly blue tit
A
B
C
D-Starters.qxd 29-Oct-03 6:49 PM Page 11

D4 StartersPopulations
Brainstorming
Sheet 1 of 1© Harcourt Education Ltd 2004 Catalyst 2This worksheet may have been altered from the original on the CD-ROM.
Pop
ulat
ion
Time
Growth of human population
D-Starters.qxd 29-Oct-03 6:49 PM Page 12

D4 StartersPopulations
Word game
All these words may be used when studying environments. See how many of them you can find in the wordsearch.
Sheet 1 of 1© Harcourt Education Ltd 2004 Catalyst 2This worksheet may have been altered from the original on the CD-ROM.
N H E R B I V O R E
O C D I M A R Y P S
I O S P E C I E S R
T N O N A S S O M E
A I L C R T W I A M
L F L O W E R A S U
U E B S B E F V S S
P R E Y N C O Q P N
O D T A T I B A H O
P R Y H G D O O F C
conifer fern flower food
habitat herbivore population prey
pyramid species web mass
consumers
D-Starters.qxd 29-Oct-03 6:49 PM Page 13

D5 StartersSpecial daisies – Think about
Bridging to the unit● Pupils work out what changes to the environment do to
different populations.
● Pupils may realise that most changes will have anadverse effect on the pink daisy population.
Setting the context● Pupils brainstorm what information we need to know in
order to save a rare species.
Concrete preparation (1)● Pupils try to come up with a way of estimating how
many daisies are on the sheet without counting themall. They discover why sampling is used. Pupils shouldrealise that it is much harder to count real daisies in areal field.
Concrete preparation (2)● Pupils work out ratios of rabbits to daisies using data
provided on a pupil sheet.
➔ Pupil sheet
Answers1 reduce; 2 reduce; 3 increase; 4 reduce;5 reduce; 6 reduce
Answersnumbers of individuals in the population;if the population is increasing ordecreasing; type of food eaten; how theyreproduce; what diseases they catch; whatfeeds on them
➔ Pupil sheet
AnswerUse a tally, tick each daisy when it iscounted, sampling.
➔ Pupil sheet
Sheet 1 of 1© Harcourt Education Ltd 2004 Catalyst 2This worksheet may have been altered from the original on the CD-ROM.
Suggested alternative starter activities (5–10 minutes)
Bridging to the unit
Pupils work out what changes tothe environment do to differentpopulations.
Setting the context
Pupils brainstorm whatinformation we need to know inorder to save a rare species.
Concrete preparation (1)
Pupils discover why sampling isused.
Concrete preparation (2)
Pupils work out ratios of daisies torabbits.
D-Starters.qxd 29-Oct-03 6:49 PM Page 14

D5 StartersSpecial daisies
Bridging to the unit
Pupils Joan and Lydia think they have found a rare variety of daisy growing among the ordinary daisies in a field. The daisy has a bright pink tinge to its petals and grows well in moist conditions.
Look at each of the following statements and decide how each one would affect the population of pink daisies.
1 A herbivore is introduced into the field that has good colour vision.2 The farmer clears out ditches at the side of the field to drain the land.3 The farmer fences the field to keep rabbits off the land.4 The grass in the field is allowed to grow very tall.5 A large number of trees are planted in the field.6 The farmer sprays the field with a general purpose weedkiller.
Sheet 1 of 1
Sheet 1 of 1
© Harcourt Education Ltd 2004 Catalyst 2This worksheet may have been altered from the original on the CD-ROM.
StartersD5 Special daisies
Bridging to the unit
Pupils Joan and Lydia think they have found a rare variety of daisy growing among the ordinary daisies in a field. The daisy has a bright pink tinge to its petals and grows well in moist conditions.
Look at each of the following statements and decide how each one would affect the population of pink daisies.
1 A herbivore is introduced into the field that has good colour vision.2 The farmer clears out ditches at the side of the field to drain the land.3 The farmer fences the field to keep rabbits off the land.4 The grass in the field is allowed to grow very tall.5 A large number of trees are planted in the field.6 The farmer sprays the field with a general purpose weedkiller.
© Harcourt Education Ltd 2004 Catalyst 2This worksheet may have been altered from the original on the CD-ROM.
D-Starters.qxd 29-Oct-03 6:49 PM Page 15

D5 StartersSpecial daisies
Concrete preparation (1)
Sometimes it is very difficult to count all of the organisms in an area.Look at the field of daisies.
Can you think of an easy way to estimate how many daisies are inthe field, without counting every one of them?
Sheet 1 of 1© Harcourt Education Ltd 2004 Catalyst 2This worksheet may have been altered from the original on the CD-ROM.
D-Starters.qxd 29-Oct-03 6:49 PM Page 16
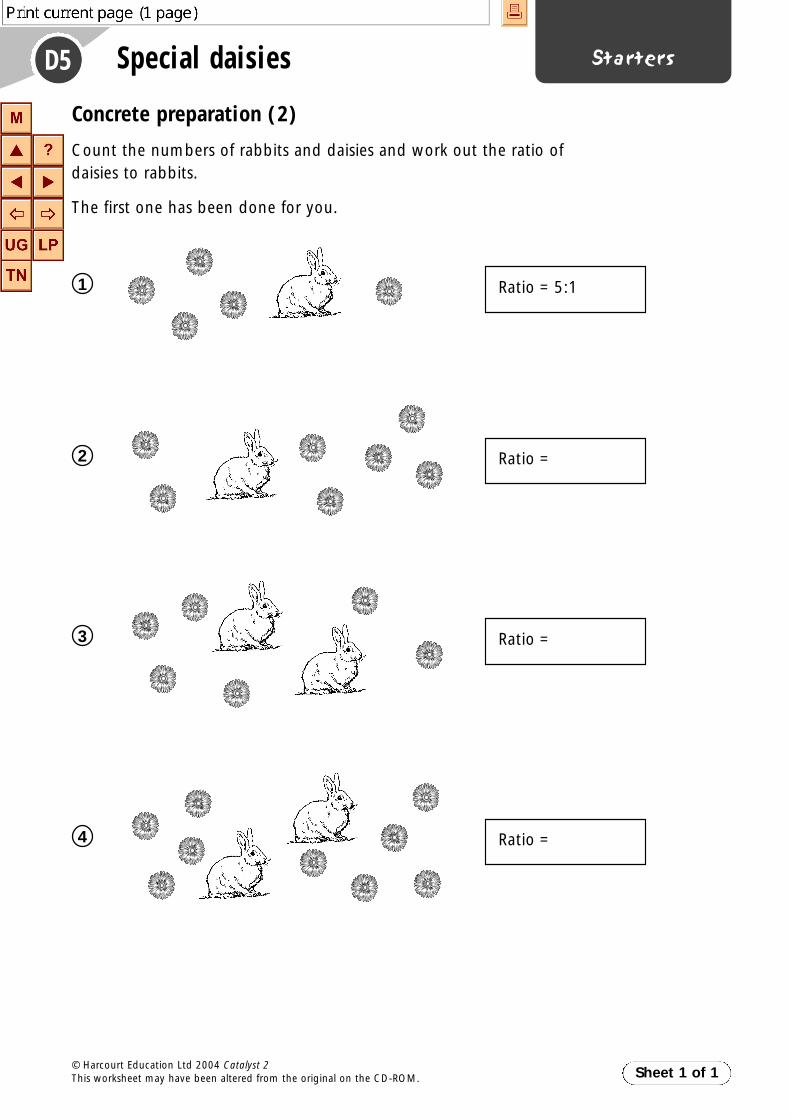
D5 StartersSpecial daisies
Concrete preparation (2)
Count the numbers of rabbits and daisies and work out the ratio ofdaisies to rabbits.
The first one has been done for you.
Sheet 1 of 1© Harcourt Education Ltd 2004 Catalyst 2This worksheet may have been altered from the original on the CD-ROM.
Ratio = 5:11
Ratio = 2
Ratio = 3
Ratio = 4
D-Starters.qxd 29-Oct-03 6:49 PM Page 17

D2–5 StartersFieldwork
Setting the context● Pupils should be told that they are going to look at two
different habitats, collect data, and compare the differentorganisms that they find in order to work out therelationships between them.
Introduce the apparatus● Pupils should be introduced to the equipment listed on
the activity sheet but time may need to be spentexplaining to pupils how to use a light meter and howthe data logger works and the kind of data that it canstore.
Safety● Ask pupils to work in pairs to list the hazards involved
in this investigation.
● Pupils then decide how to minimise the dangerpresented by each hazard.
● Pairs report back to a class discussion during which afinal set of safety procedures is listed on the board.
Problem solving (1)● Pupils look at suitable methods for counting a variety
of organisms in a habitat.
Problem solving (2)● Pupils learn to use a simple key as a method of
identifying organisms.
➔ Pupil sheet
➔ Pupil sheet
Sheet 1 of 1© Harcourt Education Ltd 2004 Catalyst 2This worksheet may have been altered from the original on the CD-ROM.
Suggested alternative starter activities (5–10 minutes)
Setting the context
Explanation of the fieldworkto be undertaken.
Introduce the apparatus
Pupils are shown how variouspieces of equipment are used.
Safety
Pupils explore the safetyimplications of workingoutside the classroom.
Problem solving (1)
Pupils look at methods forcounting organisms.
Problem solving (2)
Pupils use keys to identifyorganisms.
D-Starters.qxd 29-Oct-03 6:49 PM Page 18
D2-5 StartersFieldwork
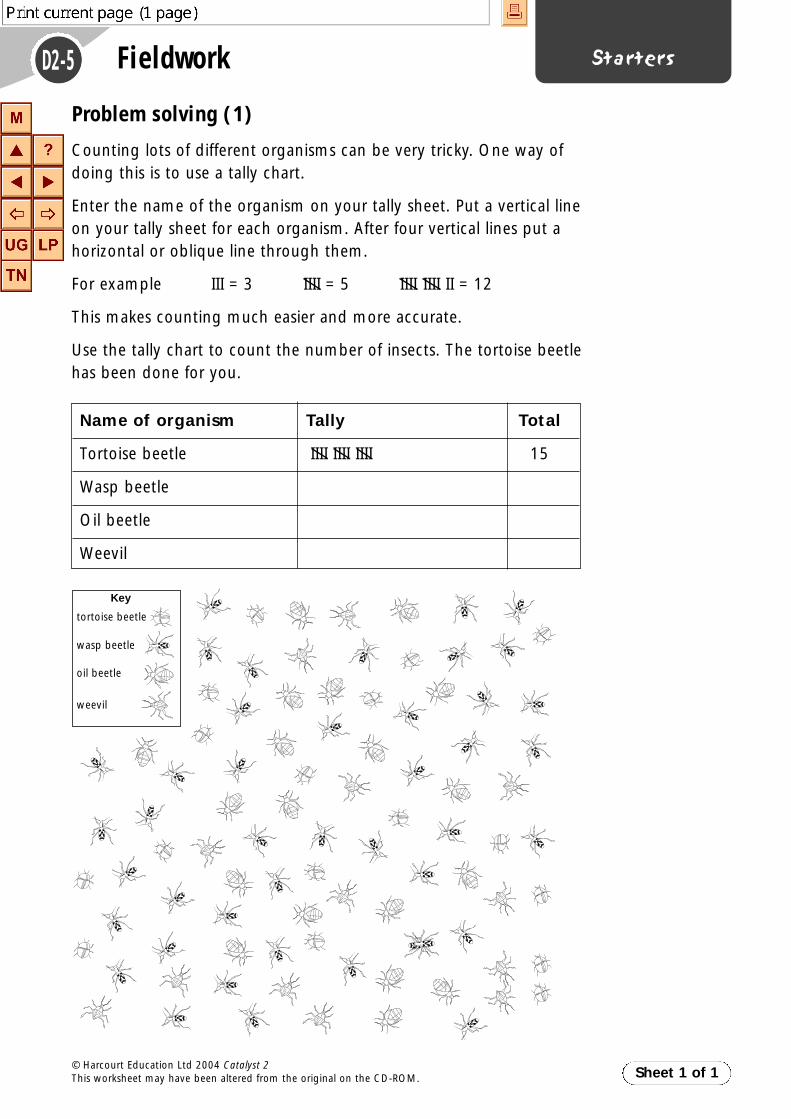
Problem solving (1)
Counting lots of different organisms can be very tricky. One way of doing this is to use a tally chart.
Enter the name of the organism on your tally sheet. Put a vertical line on your tally sheet for each organism. After four vertical lines put a horizontal or oblique line through them.
For example III = 3 IIII = 5 IIII IIII II = 12
This makes counting much easier and more accurate.
Use the tally chart to count the number of insects. The tortoise beetle has been done for you.
Sheet 1 of 1© Harcourt Education Ltd 2004 Catalyst 2This worksheet may have been altered from the original on the CD-ROM.
Name of organism Tally Total
Tortoise beetle IIII IIII IIII 15
Wasp beetle
Oil beetle
Weevil
Key
tortoise beetle
wasp beetle
oil beetle
weevil
D-Starters.qxd 29-Oct-03 6:49 PM Page 19

D2-5 StartersFieldwork
Problem solving (2)
One way to identify organisms is to try and find their picture in abook. This can take a very long time and does not guaranteesuccess.
A much better way to identify organisms is to use a key.
Use the following key to identify the organisms in the habitat shownabove.
KKeeyy
1 Has legs............................................................................................... go to 2
Has no legs........................................................................................ sslluugg
2 Has six legs........................................................................................ go to 3
Has eight legs .................................................................................. ssppiiddeerr
3 All legs nearly the same length.............................................. go to 4
Back legs much longer ............................................................... go to 5
4 Has wings........................................................................................... ddaammsseell ffllyy
Has no wings ................................................................................... beeeettllee
5 Shorter body .................................................................................... ccrriicckkeett
Longer body .................................................................................... ggrraasssshhooppppeerr
A is a B is a
C is a D is a
E is a F is a
Sheet 1 of 1© Harcourt Education Ltd 2004 Catalyst 2This worksheet may have been altered from the original on the CD-ROM.
D-Starters.qxd 29-Oct-03 6:49 PM Page 20

D1aTeacher
activity notesGrouping plants
Running the activityGroups of pupils may share the different specimens and answer the questions onthe pupil sheet in the appropriate order.
Expected outcomesPupils should understand that grouping plants and animals makes it easier toidentify them and that grouping is based upon evolutionary relationships betweenthem and not unconnected facts such as colour. This is why a buttercup and adaffodil are not grouped together even though they are both yellow.
Safety notesPupils should be warned not to taste any of the plant material as it may beharmful. No plants known to be poisonous or skin irritants should be chosen forthe activity.
ICT opportunitiesPupils could search the Internet for finding out the difference between a spore anda seed.
Answers1 Small/tiny with no stalk, i.e. attached directly to the stem.
2 To reproduce.
3 Damp places because it has thin leaves that would quickly dry out and poorlydeveloped ‘roots’ to absorb water from the soil.
4 Neither has flowers.
5 Ferns have larger leaves and are much tougher in structure. This means theylose less water and can live in drier places than mosses.
6 To attract insects for pollination.
7 They are extremely successful plants.
8 By the wind – they are not brightly coloured as they do not have to attractinsects for pollination.
9 They do not have flowers. Their leaves are spine shaped.
10 The leaf shape reduces the surface area for water loss. The leaves also have athick waxy layer to prevent water loss.
Sheet 1 of 1© Harcourt Education Ltd 2004 Catalyst 2This worksheet may have been altered from the original on the CD-ROM.
Type Purpose DifferentiationPractical Pupils observe specimens of moss, fern, brightly coloured flowering plant, grass and
conifer, and draw conclusions.Core
D-Teachers.qxd 29-Oct-03 6:53 PM Page 1

D1aTechnician
activity notesGrouping plants
EquipmentFor each group:
● moss – collected within a few days of the practical. The moss may be kept freshby storing in a damp plastic bag. The moss should have spore capsules clearlyvisible.
● fern frond – this may be kept in stock in a dried state● flowering plant – potted geraniums would be ideal● grass – may be dried but should be mature enough to have seeds● conifer – branch with attached cones● hand lens● paper and pencils
For your informationRunning the activityGroups of pupils may share the different specimens and answers the questions onthe pupil sheet in the appropriate order.
Expected outcomesPupils should understand that grouping plants and animals makes it easier toidentify them and that grouping is based upon evolutionary relationships betweenthem and not unconnected facts such as colour. This is why a buttercup and adaffodil are not grouped together even though they are both yellow.
Safety notesPupils should be warned not to taste any of the plant material as it may beharmful. No plants known to be poisonous or skin irritants should be chosen forthe activity.
Sheet 1 of 1© Harcourt Education Ltd 2004 Catalyst 2This worksheet may have been altered from the original on the CD-ROM.
Type Purpose DifferentiationPractical Pupils observe specimens of moss, fern, brightly coloured flowering plant, grass and conifer,
and draw conclusions.Core
D-Technician.qxd 29-Oct-03 6:54 PM Page 1
D1aActivity
CoreGrouping plants
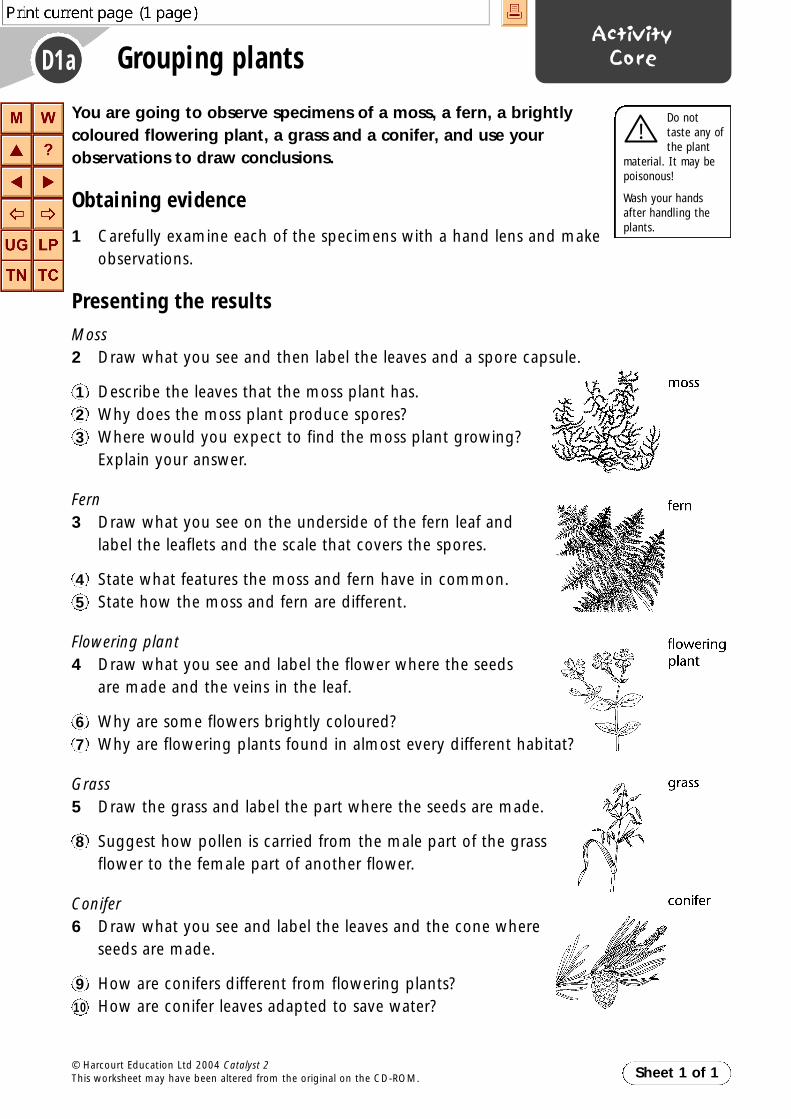
You are going to observe specimens of a moss, a fern, a brightlycoloured flowering plant, a grass and a conifer, and use yourobservations to draw conclusions.
Obtaining evidence
1 Carefully examine each of the specimens with a hand lens and makeobservations.
Presenting the resultsMoss2 Draw what you see and then label the leaves and a spore capsule.
1 Describe the leaves that the moss plant has.2 Why does the moss plant produce spores?3 Where would you expect to find the moss plant growing?
Explain your answer.
Fern3 Draw what you see on the underside of the fern leaf and
label the leaflets and the scale that covers the spores.
4 State what features the moss and fern have in common.5 State how the moss and fern are different.
Flowering plant4 Draw what you see and label the flower where the seeds
are made and the veins in the leaf.
6 Why are some flowers brightly coloured?7 Why are flowering plants found in almost every different habitat?
Grass5 Draw the grass and label the part where the seeds are made.
8 Suggest how pollen is carried from the male part of the grassflower to the female part of another flower.
Conifer6 Draw what you see and label the leaves and the cone where
seeds are made.
9 How are conifers different from flowering plants?10 How are conifer leaves adapted to save water?
Sheet 1 of 1© Harcourt Education Ltd 2004 Catalyst 2This worksheet may have been altered from the original on the CD-ROM.
Do nottaste any ofthe plant
material. It may bepoisonous!
Wash your hands after handling theplants.
D-Activities.qxd 29-Oct-03 6:51 PM Page 1

D1bTeacher
activity notesPlant habitats
Running the activityPupils work from pupil sheet and write down the environmental conditions thatplants will need to adapt to in each habitat.
As an extension, pupils could be asked how the plants is adapted to each of theconditions.
ICT opportunitiesPupils could search the Internet for other kinds of habitats.
AnswersAlpine
1 cold2 windy3 Lots of light.4 Covered by snow and ice in winter.
Desert
1 hot2 little water3 Poor soil structure.4 Not much competition from other plants but very vulnerable to being eaten by
animals.
Windy sea coast
1 windy2 salty3 Damage by high seas.4 Poor soil structure.
Sheet 1 of 1© Harcourt Education Ltd 2004 Catalyst 2This worksheet may have been altered from the original on the CD-ROM.
Type Purpose DifferentiationPaper Pupils look at plant habitats and describe what environmental conditions the plants
will need to adapt to.Core
D-Teachers.qxd 29-Oct-03 6:53 PM Page 2
D1bActivity
CorePlant habitats
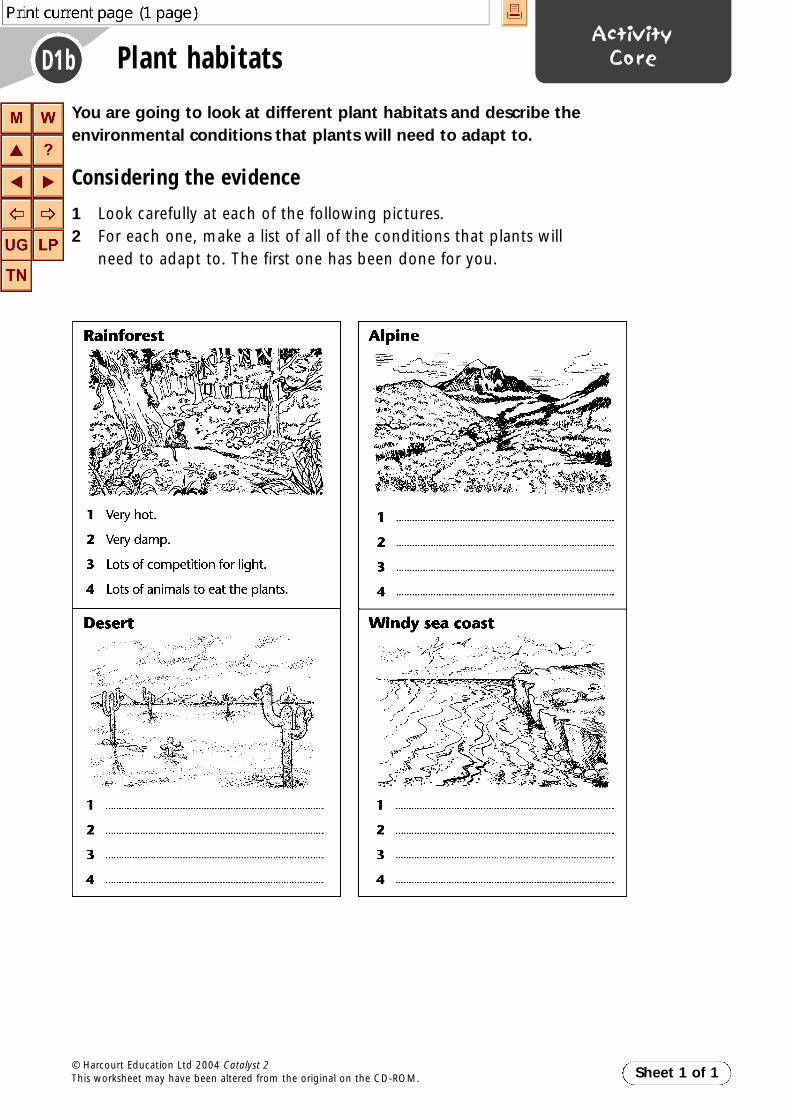
You are going to look at different plant habitats and describe theenvironmental conditions that plants will need to adapt to.
Considering the evidence
1 Look carefully at each of the following pictures.2 For each one, make a list of all of the conditions that plants will
need to adapt to. The first one has been done for you.
Sheet 1 of 1© Harcourt Education Ltd 2004 Catalyst 2This worksheet may have been altered from the original on the CD-ROM.
D-Activities.qxd 29-Oct-03 6:51 PM Page 2

D2aTeacher
activity notesDifferent habitats
Running the activityCore: Pupils are provided with D2 activity and D2 resource sheet and asked tocomplete the questions. Pupils who have difficulty can use Resource 2.
Other relevant materialsD2a Resource 1D2a Resource 2
ICT opportunitiesPupils could search the Internet for other habitats and find how animals areadapted to them.
Answers1 The Antarctic is much colder than the Arctic and penguins are adapted to
withstand extreme cold by having thick fat insulation, protecting their youngfrom the cold ice surface and huddling in a pack to keep warm.
2 The tern flies from the Arctic to the Antarctic and back to take advantage of thesummer conditions when food is available. It has powerful flight muscles andfood storage abilities to withstand the extreme distances that it has to fly eachyear.
3 It is a carnivore and catches its prey using camouflage by having a white coat inthe winter and a darker coat in the summer.
4 The Arctic fox can withstand the cold of the Arctic but the Antarctic is too coldas it lacks the thick insulation of the seals and penguins.
Sheet 1 of 1© Harcourt Education Ltd 2004 Catalyst 2This worksheet may have been altered from the original on the CD-ROM.
Type Purpose DifferentiationPaper Pupils look at stimulus pictures of habitats and determine how different animals are
adapted to live there.CoreResource 1Resource 2
D-Teachers.qxd 29-Oct-03 6:53 PM Page 3
D2aActivity
CoreDifferent habitats
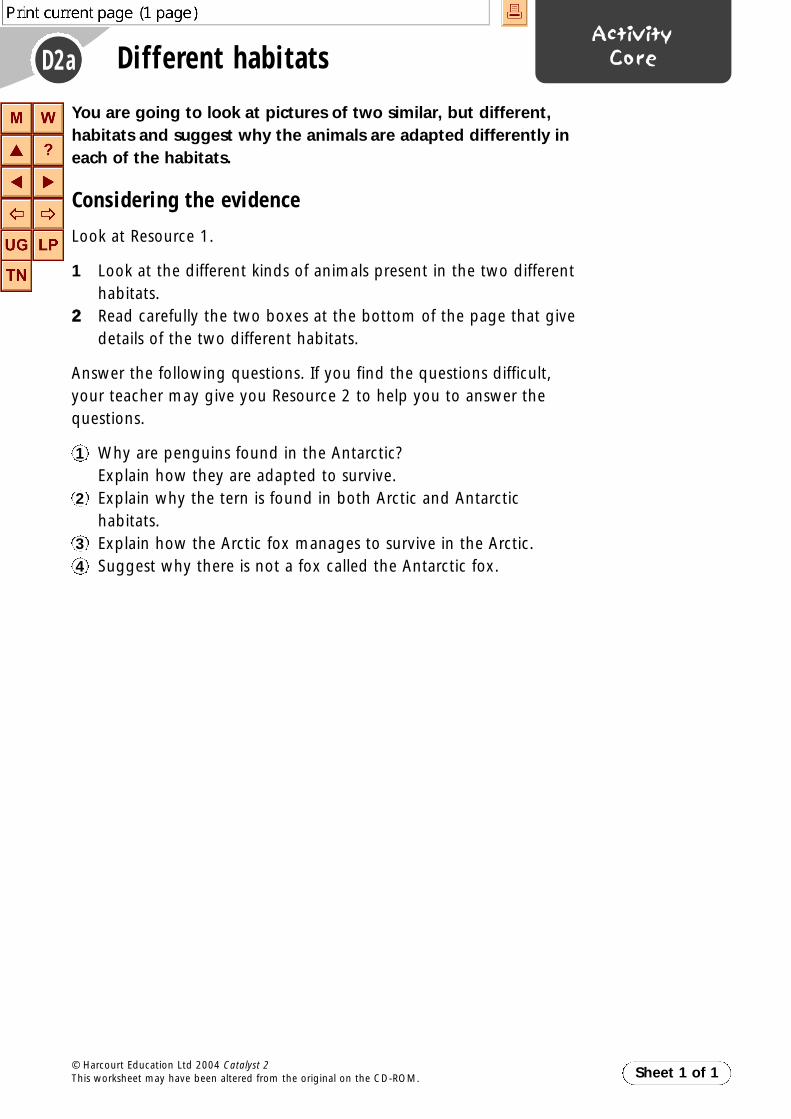
You are going to look at pictures of two similar, but different,habitats and suggest why the animals are adapted differently ineach of the habitats.
Considering the evidence
Look at Resource 1.
1 Look at the different kinds of animals present in the two differenthabitats.
22 Read carefully the two boxes at the bottom of the page that givedetails of the two different habitats.
Answer the following questions. If you find the questions difficult,your teacher may give you Resource 2 to help you to answer thequestions.
1 Why are penguins found in the Antarctic?Explain how they are adapted to survive.
2 Explain why the tern is found in both Arctic and Antarctichabitats.
3 Explain how the Arctic fox manages to survive in the Arctic.4 Suggest why there is not a fox called the Antarctic fox.
Sheet 1 of 1© Harcourt Education Ltd 2004 Catalyst 2This worksheet may have been altered from the original on the CD-ROM.
D-Activities.qxd 29-Oct-03 6:51 PM Page 3

D2aActivity
Resource 1Different habitats
Sheet 1 of 1© Harcourt Education Ltd 2004 Catalyst 2This worksheet may have been altered from the original on the CD-ROM.
Pola
rA
nta
rcti
cA
rcti
c
Loca
tion
:A
nta
rcti
cM
ean
tem
pera
ture
Janu
ary:
−30
to −
25°C
Mea
n te
mpe
ratu
re Ju
ly:
−45
to −
40°C
Tem
pera
ture
var
iatio
n ov
er 2
4h:
diffi
cult
to ju
dge
due
to h
igh
win
dsan
d st
rong
sun
light
Ann
ual s
now
fall:
50 m
m (
inla
nd)
to 5
00 m
m (
coas
t)
Latit
ude:
80°S
The
grea
ter
the
latit
ude,
nor
th (
N)
or s
outh
(S)
, the
big
ger
the
diffe
renc
ein
day
leng
th b
etw
een
win
ter
and
sum
mer
.
Loca
tion
:A
rcti
cM
ean
tem
pera
ture
Janu
ary:
−30
to −
30°C
Mea
n te
mpe
ratu
re Ju
ly:
−10
to −
5°C
Tem
pera
ture
var
iatio
n ov
er 2
4h:
8°C
max
Ann
ual s
now
fall:
100
to 2
00 m
mLa
titud
e:80
°NTh
e gr
eate
r th
e la
titud
e, n
orth
(N
) or
sou
th (
S), t
he b
igge
r th
e di
ffere
nce
in d
ay le
ngth
bet
wee
n w
inte
r an
d su
mm
er.
1
You
wou
ld n
ot s
ee a
ll th
ese
orga
nism
s at
the
sam
e tim
e.
2
6
5
4
3
Org
anis
ms
1em
pero
r pe
ngui
n2
crab
-eat
er s
eal
3ad
elie
pen
guin
4sk
ua5
shea
thbi
ll6
Ant
arct
ic t
ern
Org
anis
ms
1ki
ng e
ider
2rin
ged
seal
3po
lar
bear
4A
rctic
fox
5de
veki
e6
razo
rbill
7A
rctic
ter
nYo
u w
ould
not
see
all
thes
e or
gani
sms
at t
he s
ame
time.
123
4
7
6
5
D-Activities.qxd 29-Oct-03 6:51 PM Page 4

D2aActivity
Resource 2Different habitats
Use the information below to help you answer the questions onthe activity sheet.
Considering the evidencePenguinsPenguins have thick layers of fat to protect them from the cold.
Penguins are birds. They lay eggs but protect them from the cold byholding the eggs next to their bodies away from the ice.
Penguins huddle together in large groups and take turns being onthe outside of the group where it is much colder.
TernsTerns are birds. They are very good at flying. They can fly from theArctic to the Antarctic every year.
They prefer cool places to live with lots of food so they can build upfat reserves for their long flights.
Arctic foxThe Arctic fox has a thick coat to insulate it from the cold.
It has less fat than penguins and seals.
It has a white coat in the winter and a darker coat in the summerwhen some of the ice and snow melts.
Sheet 1 of 1© Harcourt Education Ltd 2004 Catalyst 2This worksheet may have been altered from the original on the CD-ROM.
D-Activities.qxd 29-Oct-03 6:51 PM Page 5

D3aTeacher
activity notesLeaf litter
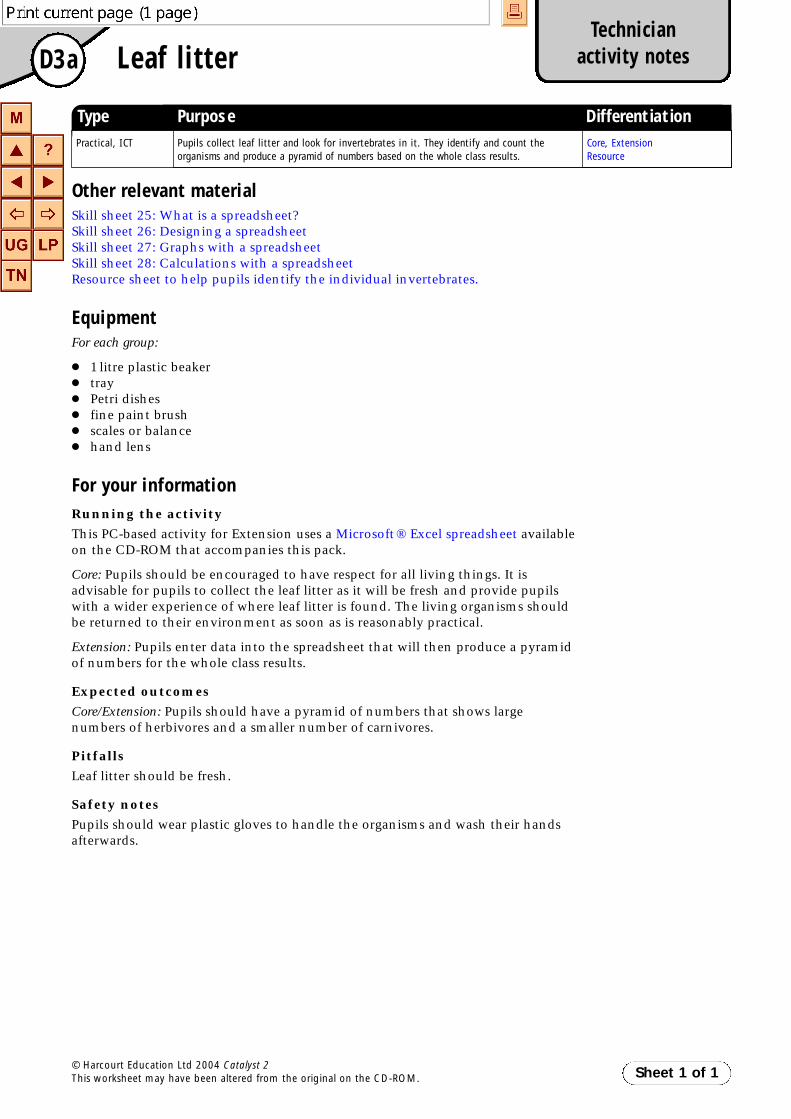
Running the activityThis PC-based activity for Extension uses a Microsoft® Excel spreadsheet availableon the CD-ROM that accompanies this pack.
Core:
Pupils should be encouraged to have respect for all living things. It is advisable forpupils to collect the leaf litter as it will be fresh and provide pupils with a widerexperience of where leaf litter is found. The living organisms should be returned totheir environment as soon as is reasonably practical.
Extension:
Pupils enter data into the spreadsheet that will then produce a pyramid of numbersfor the whole class results.
Other relevant materialSkill sheet 25: What is a spreadsheet?Skill sheet 26: Designing a spreadsheetSkill sheet 27: Graphs with a spreadsheetSkill sheet 28: Calculations with a spreadsheetResource sheet to help pupils identify the individual invertebrates.
Expected outcomesCore/Extension: Pupils should have a pyramid of numbers that shows large numbers ofherbivores and a smaller number of carnivores.
PitfallsLeaf litter should be fresh.
Safety notesPupils should wear plastic gloves to handle the organisms and wash their handsafterwards.
AnswersCore/Extension:1 Answers will vary but there should be more herbivores than carnivores.
2 Answers will vary but there should be fewer carnivores than herbivores.
3 To make it easier to count and identify. So that the carnivoresdid not eat the herbivores.
4 Answers will vary but should be basically the shape shown onthe right. Energy is lost as it passes along the food chain so lessavailable for carnivores.
5 To average out inaccurate results.
6 Take more readings. Make better identifications of herbivores and carnivores.
7 Data collected and entered into spreadsheets can easily and quickly be convertedinto a variety of graphical forms.
Sheet 1 of 1© Harcourt Education Ltd 2004 Catalyst 2This worksheet may have been altered from the original on the CD-ROM.
Type Purpose DifferentiationPractical, ICT Pupils collect leaf litter and look for invertebrates in it. They identify and count the
organisms and produce a pyramid of numbers based on the whole class results.Core, Extension Resource
D-Teachers.qxd 29-Oct-03 6:53 PM Page 4
D3aTechnician
activity notesLeaf litter
Other relevant materialSkill sheet 25: What is a spreadsheet?Skill sheet 26: Designing a spreadsheetSkill sheet 27: Graphs with a spreadsheetSkill sheet 28: Calculations with a spreadsheetResource sheet to help pupils identify the individual invertebrates.
EquipmentFor each group:
● 1litre plastic beaker● tray● Petri dishes● fine paint brush● scales or balance● hand lens
For your informationRunning the activityThis PC-based activity for Extension uses a Microsoft® Excel spreadsheet availableon the CD-ROM that accompanies this pack.
Core: Pupils should be encouraged to have respect for all living things. It isadvisable for pupils to collect the leaf litter as it will be fresh and provide pupilswith a wider experience of where leaf litter is found. The living organisms shouldbe returned to their environment as soon as is reasonably practical.
Extension: Pupils enter data into the spreadsheet that will then produce a pyramidof numbers for the whole class results.
Expected outcomesCore/Extension: Pupils should have a pyramid of numbers that shows largenumbers of herbivores and a smaller number of carnivores.
PitfallsLeaf litter should be fresh.
Safety notesPupils should wear plastic gloves to handle the organisms and wash their handsafterwards.
Sheet 1 of 1© Harcourt Education Ltd 2004 Catalyst 2This worksheet may have been altered from the original on the CD-ROM.
Type Purpose DifferentiationPractical, ICT Pupils collect leaf litter and look for invertebrates in it. They identify and count the
organisms and produce a pyramid of numbers based on the whole class results.Core, ExtensionResource
D-Technician.qxd 29-Oct-03 6:54 PM Page 2

Leaf litter is the partly decomposed leaves that have fallen fromtrees. There are many different animals in it. In this activity, youwill collect some leaf litter and look for living things in it.
Equipment
● Tray to collect leaf litter● Fine paint brush● Petri dishes
Obtaining evidence
1 With your teacher, collect some leaf litter and place it inyour tray.
2 Search for small invertebrates in your leaf litter.Use the fine paint brush to transfer them carefully to a Petri dish.
3 Put different species of invertebrates into different Petri dishes.4 Count how many of each invertebrate there are.5 Use the Resource sheet, keys and reference books to find out their names and decide
whether they are carnivores or herbivores.6 When you have finished, return the organisms to the leaf litter. Your teacher will
ensure that they are returned safely to their environment.
Presenting the results
7 Draw a table with these headings and complete it.
8 Draw a second table and enter the results for the class.
Considering the evidence
1 What is the total number of herbivores?2 What is the total number of carnivores?3 Suggest why the animals were put into separate dishes at the start of the investigation.4 Draw a pyramid of numbers for the class data. Explain the shape of your pyramid.
Evaluating
5 Explain why it was more reliable to use data for the whole class rather than from justone group.
6 Explain how you could improve the reliability of your results even further.
D3aActivity
CoreLeaf litter
Sheet 1 of 1© Harcourt Education Ltd 2004 Catalyst 2This worksheet may have been altered from the original on the CD-ROM.
Wear plasticgloves tohandle the
organisms in the leaflitter. Handle allliving things withcare. Wash yourhands afterwards.
Name of invertebrate Number found Herbivore or carnivore
D-Activities.qxd 29-Oct-03 6:51 PM Page 6
D3aActivity
ExtensionLeaf litter
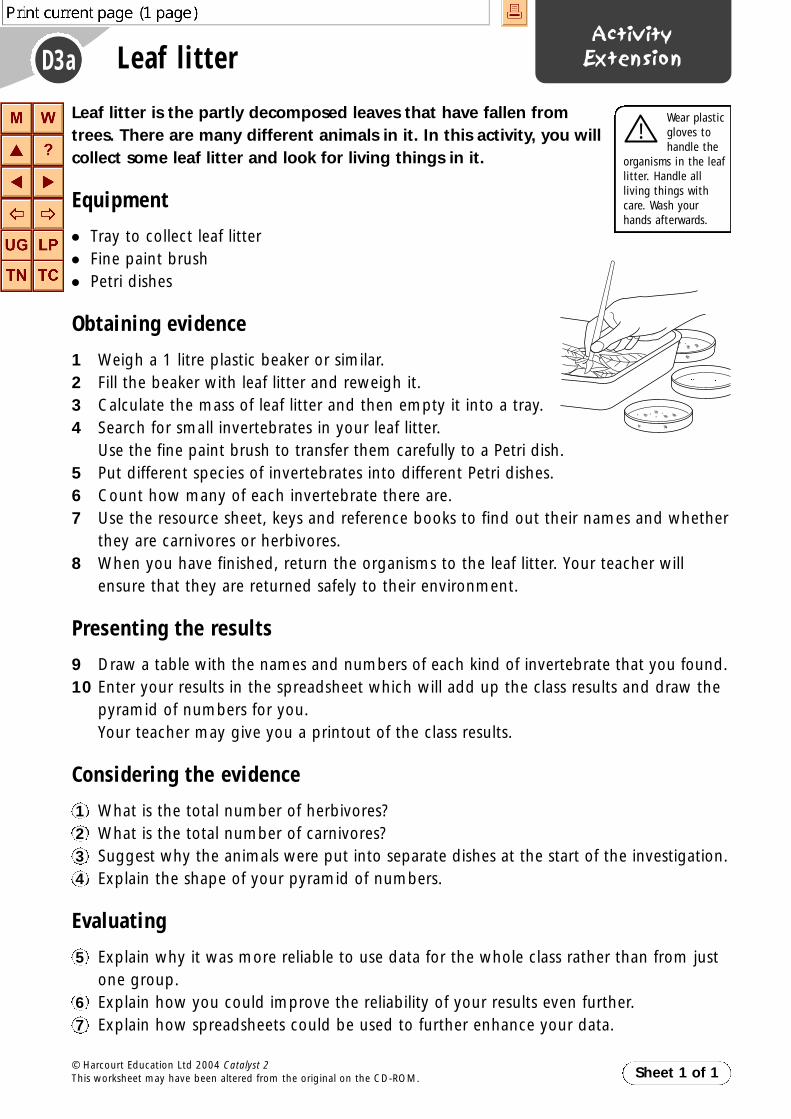
Leaf litter is the partly decomposed leaves that have fallen fromtrees. There are many different animals in it. In this activity, you willcollect some leaf litter and look for living things in it.
Equipment
● Tray to collect leaf litter● Fine paint brush● Petri dishes
Obtaining evidence
1 Weigh a 1 litre plastic beaker or similar.2 Fill the beaker with leaf litter and reweigh it.3 Calculate the mass of leaf litter and then empty it into a tray.4 Search for small invertebrates in your leaf litter.
Use the fine paint brush to transfer them carefully to a Petri dish.5 Put different species of invertebrates into different Petri dishes.6 Count how many of each invertebrate there are.7 Use the resource sheet, keys and reference books to find out their names and whether
they are carnivores or herbivores.8 When you have finished, return the organisms to the leaf litter. Your teacher will
ensure that they are returned safely to their environment.
Presenting the results
9 Draw a table with the names and numbers of each kind of invertebrate that you found.10 Enter your results in the spreadsheet which will add up the class results and draw the
pyramid of numbers for you.Your teacher may give you a printout of the class results.
Considering the evidence
1 What is the total number of herbivores?2 What is the total number of carnivores?3 Suggest why the animals were put into separate dishes at the start of the investigation.4 Explain the shape of your pyramid of numbers.
Evaluating
5 Explain why it was more reliable to use data for the whole class rather than from justone group.
6 Explain how you could improve the reliability of your results even further.7 Explain how spreadsheets could be used to further enhance your data.
Sheet 1 of 1© Harcourt Education Ltd 2004 Catalyst 2This worksheet may have been altered from the original on the CD-ROM.
Wear plasticgloves tohandle the
organisms in the leaflitter. Handle allliving things withcare. Wash yourhands afterwards.
D-Activities.qxd 29-Oct-03 6:51 PM Page 7
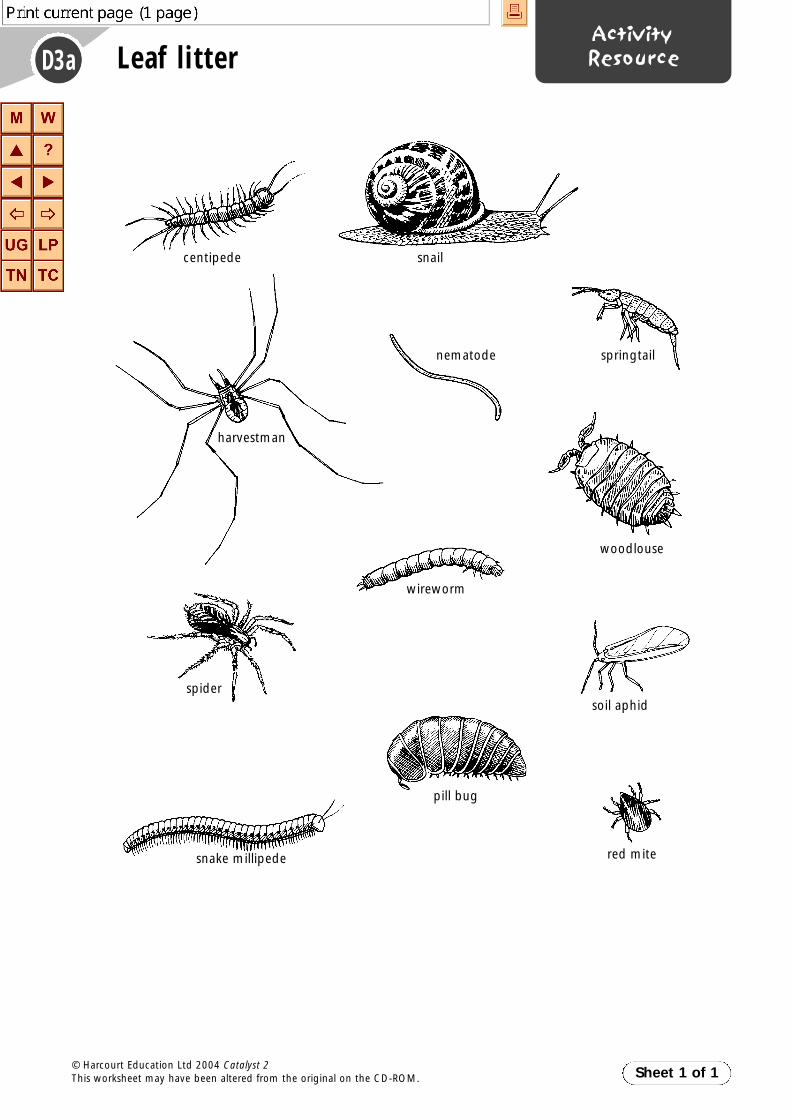
D3aActivityResourceLeaf litter
centipede snail
springtailnematode
harvestman
spider
wireworm
woodlouse
soil aphid
red mite
pill bug
snake millipede
Sheet 1 of 1© Harcourt Education Ltd 2004 Catalyst 2This worksheet may have been altered from the original on the CD-ROM.
D-Activities.qxd 29-Oct-03 6:51 PM Page 8

D3bTeacher
activity notesInterdependence
Running the activityPupils answer the questions on the work sheet.
ICT opportunitiesPupils could search the Internet for how changes affect other food webs.
AnswersCore:1 The number of slugs will decrease.
2 The number of hedgehogs will decrease because they have less food.
3 The number of beetles will increase because of less competition for food.
4 Bird population will decrease because there are fewer snails to feed on. Howevermore able pupils may argue that there are more beetles so bird population willbe unaffected.
Extension:5 In wet conditions the number of slugs will increase producing more hedgehogs,
less beetles and initially more birds as they have more slugs and snails to feedupon. Reverse happens when summers are drier.
6 Global warming leads to more greenfly, therefore more birds and less snails.This will lead to less food for hedgehogs.
Sheet 1 of 1© Harcourt Education Ltd 2004 Catalyst 2This worksheet may have been altered from the original on the CD-ROM.
Type Purpose DifferentiationPaper Pupils are shown a food web and asked questions about interdependence and how
changes affect the structure of the web.Core (Extension)
D-Teachers.qxd 29-Oct-03 6:53 PM Page 5

D3bActivity
CoreInterdependence
You are going to examine how changes in the environment canaffect the organisms in a food web.
Considering the evidence
Look at the picture of a food web and then answer the followingquestions.
A gardener finds slugs have been eating her lettuces. She puts downslug pellets to kill the slugs.
1 Explain what this may do to the number of slugs.2 Explain what effect this may have on the number of hedgehogs.3 Explain what may happen to the number of beetles.4 Slug pellets also kill snails. Explain what effect this may have on
the bird population.
5 Slugs thrive in wet conditions. Explain the effect of increasedrainfall and drier summers on the food web.
6 More greenfly survive in mild winters. Explain the effect of globalwarming on the food web.
Sheet 1 of 1© Harcourt Education Ltd 2004 Catalyst 2This worksheet may have been altered from the original on the CD-ROM.
bird
greenfly
grass
snail
lettuce
slug
hedgehog
beetle
Extension
D-Activities.qxd 29-Oct-03 6:51 PM Page 9
D4aTeacher
activity notesSquirrel competition
Running the activityPupils analyse data and then answer a series of questions on the activity sheet.
AnswersCore:1 Grey squirrels were introduced into Britain at this time and started to compete
with red squirrels.
2 Hazelnuts
3 Adapted to live in deciduous woodland.
4 Grey squirrels are more successful in deciduous woodland but red squirrels arebetter adapted to coniferous woodland than the greys.
5 Coniferous woodland is being cut down.
6 Protect areas of coniferous woodland.
Help:1 food, hazelnuts, acorns, acorns, digest, cones, cut, habitat
Sheet 1 of 1© Harcourt Education Ltd 2004 Catalyst 2This worksheet may have been altered from the original on the CD-ROM.
Type Purpose DifferentiationPaper Pupils analyse information about red and grey squirrels. Core, Help
D-Teachers.qxd 29-Oct-03 6:53 PM Page 6

D4aActivity
CoreSquirrel competition
Sheet 1 of 1© Harcourt Education Ltd 2004 Catalyst 2This worksheet may have been altered from the original on the CD-ROM.
Some species compete with each other for the same food. Thespecies that is most successful at getting the food will usuallyoutnumber the other species.
In this activity, you are going to analyse some data about redsquirrels and grey squirrels.
The numbers of red squirrels in Britain are falling. They compete withgrey squirrels for the same food in deciduous woodland. Coniferouswoodlands are being cut down.
Considering the evidence
1 Suggest why the number of red squirrels started to go down inBritain approximately 100 years ago.
2 Which type of food have the grey squirrels competed for with thered squirrels?
3 Suggest another reason why the grey squirrels have been moresuccessful in the deciduous woodland.
4 Red squirrels used to be found in both deciduous woodland andconiferous forests. Suggest why they are now found only inconiferous forests.
5 Suggest another reason why the red squirrel population isdeclining.
6 Suggest what can be done to save the red squirrel fromextinction in Britain.
Red Squirrel
Geographical spread: Common only inCumbria, Northumberland and Scotland. Small populations in East Anglia, Wales, Isle ofWight and Dorset.Diet: Feeds mainly on conifer seed andhazelnuts (cannot digest acorns properly).Habitat: Coniferous woodland, spending mostof their time in the trees.
Grey Squirrel
Geographical spread: Common in Britain sinceintroduced from the USA over 100 years ago.Diet: Feeds mainly on hazelnuts and acorns.Habitat: Deciduous woodland, living in thetrees but also foraging on the ground.
D-Activities.qxd 29-Oct-03 6:52 PM Page 10

D4aActivity
HelpSquirrel competition
Some species compete with each other for the same food. The species that is most successful at getting the food will usually outnumber the other species.
You are going to look at some data about red squirrels and grey squirrels.
The numbers of red squirrels in Britain are falling. They compete with grey squirrels for the same food in deciduous woodland. Coniferous woodlands are being cut down.
Considering the evidence
1 Explain why there are more grey squirrels than red squirrels.Choose words from this list to fill in the gaps.You may use a word more than once.
Grey squirrels and red squirrels compete for . They
both eat but only grey squirrels eat .
When all of the hazelnuts have gone, the grey squirrels can eat the
. Red squirrels cannot acorns
properly. This is why red squirrels are not found in deciduous
woodland. They can eat the seeds from pine , but
coniferous forests are being down, destroying their
.
Sheet 1 of 1© Harcourt Education Ltd 2004 Catalyst 2This worksheet may have been altered from the original on the CD-ROM.
Red Squirrel
Geographical spread: Common only inCumbria, Northumberland and Scotland. Small populations in East Anglia, Wales, Isle ofWight and Dorset.Diet: Feeds mainly on conifer seed andhazelnuts (cannot digest acorns properly).Habitat: Coniferous woodland, spending mostof their time in the trees.
Grey Squirrel
Geographical spread: Common in Britain sinceintroduced from the USA over 100 years ago.Diet: Feeds mainly on hazelnuts and acorns.Habitat: Deciduous woodland, living in thetrees but also foraging on the ground.
acorns cones cut digest food habitat hazelnuts
D-Activities.qxd 29-Oct-03 6:52 PM Page 11

D4bTeacher
activity notesPopulation cycles
Running the activityPupils answer questions on population cycling based on data in a food chain and agraph.
ICT opportunitiesPupils could search the Internet for other examples of population cycling.
Answers1 Wooks
2 Gimbuls
3 Gimbuls being eaten by wooks faster than they can breed so the populationdeclines.
4 It was declining as it is being eaten by the gimbuls.
5 It will increase as more food becomes available.
6 Fewer wooks were eating them so they could breed faster than they were beingeaten.
7 Wooks increase. Gimbuls increase then fall.
Sheet 1 of 1© Harcourt Education Ltd 2004 Catalyst 2This worksheet may have been altered from the original on the CD-ROM.
Type Purpose DifferentiationPaper Pupils look at a food chain and a graph and consider how the population of two
organisms are interdependent and follow each other in cycles.Extension
D-Teachers.qxd 29-Oct-03 6:53 PM Page 7

D4bActivity
ExtensionPopulation cycles
You are going to look at the way two interdependentpopulations can affect each other.
Read again about gimbuls and wooks on the moon Onkar on pages42– 43 of the textbook.
Considering the evidence
Look at the following food chain.
1 Which organism in the food chain is a predator?2 Which organism in the food chain is a herbivore.3 From the graph, suggest why the gimbul
population changes between year 30090and year 30095.
4 Suggest what was happening to the redzetta population between year 30089 andyear 30090. Explain your answer.
5 Suggest what will happen to the wookpopulation after year 30097. Explain youranswer.
6 Explain why the gimbul populationincreased after year 30096.
7 The graph shows the populations arecycling up and down. If the environmentalconditions do not change, predict what will happen to bothpopulations in the next three years.
Sheet 1 of 1© Harcourt Education Ltd 2004 Catalyst 2This worksheet may have been altered from the original on the CD-ROM.
Pop
ulat
ion
30089 30090 30091 30092 30093 30094 30095 30096
gimbuls
wooks
D-Activities.qxd 29-Oct-03 6:52 PM Page 12

D5aTeacher
activity notesSampling
Running the activityPupils are given a tray of sand in which are hidden 50 small steel/iron tacks.
The pupils place a ten by ten wire frame grid over the tray of sand. Pupils thenrandomly choose one of the squares and use a magnet to find any of the tacks thatare in that square. The pupils remove the tacks, keep a tally and move on to nineother randomly chosen squares. They then answer a series of questions on theactivity sheet.
Expected outcomesPupils determine that there are about 50 objects hidden in the sand.
PitfallsCheck the pupils understand what they have to do before they start. If they startextracting tacks from all over the tray, it will be too late to stop them and obtainaccurate results.
Safety notesEnsure that sand is not flicked into pupils’ eyes.
Answers1 100
2 Answers will vary but should be approximately 50.
3 It evens out variations (or words to that effect).
4 Pool results with rest of class.
Sheet 1 of 1© Harcourt Education Ltd 2004 Catalyst 2This worksheet may have been altered from the original on the CD-ROM.
Type Purpose DifferentiationPractical Pupils use a sampling technique to determine the number of small steel tacks hidden in
a tray of sand.Core
D-Teachers.qxd 29-Oct-03 6:53 PM Page 8

D5aTechnician
activity notesSampling
EquipmentFor each group:
● large tray of sand to a minimum depth of 15mm● 10×10 stiff wire grid made to fit over the top of the sand tray, providing 100
sampling quadrat squares. The outer wire frame can be made from stiff plasticcovered coat-hanger wire. Once this frame has been made, thinner nichromewire can be used to make the grid. The wire should be secured to the mainframe using superglue. This will prevent the wire from sliding along the frame.
● 50 magnetic tacks hidden at random in the sand. They must not be visiblefrom the surface of the sand.
● magnet
For your informationRunning the activityPupils are given a tray of sand in which is hidden 50 small steel/iron tacks.
The pupils place a ten by ten wire frame grid over the tray of sand. Pupils thenrandomly determine one of the squares and use a magnet to find any of the tacksthat happen by chance to be in that square. The pupils remove the tacks, keep atally and move on to nine other randomly determined squares. They then answera series of questions on the activity sheet.
Expected outcomesPupils determine that there are about 50 objects hidden in the sand.
PitfallsCheck the pupils understand what they have to do before they start. If they startextracting tacks from all over the tray, it will be too late to stop them and obtainaccurate results.
Safety notesEnsure that sand is not flicked into pupils’ eyes.
Sheet 1 of 1© Harcourt Education Ltd 2004 Catalyst 2This worksheet may have been altered from the original on the CD-ROM.
A B C D E F G H I J
1
2
3
4
5
6
7
8
9
10
Type Purpose DifferentiationPractical Pupils use a sampling technique to determine the number of small steel tacks hidden in
a tray of sand.Core
D-Technician.qxd 29-Oct-03 6:54 PM Page 3

D5aActivity
CoreSampling
You are going to carry out an investigation to find out how todetermine the number of organisms in a specific area of a habitat.
Equipment
● Tray of sand ● Wire frame quadrat ● Magnet ● Text book
Obtaining evidence
1 Place the wire frame quadrat over the tray of sand. It gives a grid from which you canget coordinates for particular squares of the sand tray. You are going to investigateone of the squares in the grid.
2 Determine the coordinates of the square you will investigate by randomly openingyour text book at any page. Read the words on the first line until you come to a wordstarting with any letter A to J. This is the letter for the coordinate.
3 Look at the page number; if it isless than 11 this is your numberfor the coordinate. If it is morethan 10 add the digits together.Repeat this process until you havea number less than 11.
4 Place the magnet above thecorrect square in your grid andmove the magnet around withinthat square. Remove any objectsthat are attracted to the magnetand make a note of the number ofhidden objects. You may find thatthere are no hidden objects in thatsquare.
5 Be careful not to remove objectsfrom any other square of the grid.
6 Repeat steps 2 to 5 with nine other squares.
Considering the evidence
1 Calculate how many squares in total are in the grid.2 Calculate how many objects in total you think are hidden in the sand. Explain how
you obtained your answer.3 Explain why taking ten samples was more accurate than taking just one.
Evaluating
4 Explain how you could make your results even more accurate.
Sheet 1 of 1© Harcourt Education Ltd 2004 Catalyst 2This worksheet may have been altered from the original on the CD-ROM.
Make suresand is notflicked into
people’s eyes.
A B C D E F G H I J
1
2
3
4
5
6
7
8
9
10
D-Activities.qxd 29-Oct-03 6:52 PM Page 13

D2–5Teacher
activity notesFieldwork
IntroductionThis unit involves studying two different habitats. The choice of habitats studiedwill obviously vary depending upon the location of the school and what habitatsare available locally. However the five steps listed below should apply to whicheverhabitat is chosen for study. There are activity sheets to support each step listedbelow.
a Studying environmental factors: pupils note the environmental factors in thehabitat being studied. These could include temperature, pH, light levels,oxygen content, water content (dry/damp/wet), flow rate.
b Collecting and identifying organisms: pupils catch or look at the animals andplants in the habitat and attempt to identify them.
c Counting organisms and displaying data: pupils count the numbers of eachorganism present.
d Food webs: pupils draw food webs of the habitat.
e Pyramids of numbers: pupils produce a pyramid of numbers for one of the foodwebs.
Running the activityField trips nearly always require more time than is available. If this is a problem, itcan be minimised by having pupils working in groups, with each group studying adifferent environmental factor. They should be encouraged to take notes anddescribe the habitat they are studying, as well as taking readings using athermometer, light meter, pH meter, etc. Group data can then be shared back inthe lab. However it is preferable for each group to collect all their own data.
Pupils should then catch/observe and note all of the organisms found. Plantmaterial should be identified in situ and not removed. Animal material such asbeetles may need to be caught in order to be identified. However this is anexcellent opportunity to teach pupils respect for the environment and theorganisms living in it. All animals collected should be disturbed as little as possibleand returned to the environment after identification.
Identification is carried out using appropriate keys or teacher/pupil knowledge.The number of organisms for each species are then counted and entered onto theappropriate pupil sheet. If keys are to be used, pupils will need appropriatetraining in their use.
Once the data has been collected, the field trip is complete and the pupils shouldreturn to the classroom to process the data. This involves drawing food webs forthe organisms studied, which often requires considerable help from the teacher asit is rarely obvious in the field as to ‘what is eating what’. However the followingpoints should help:
● There are nearly always more herbivores than carnivores.● Look at the mouthparts. Do they look like they are adapted for catching prey?● Keep the naming simple. It is easier to call all beetles ‘beetles’ than it is to
identify each individual species.
Sheet 1 of 2© Harcourt Education Ltd 2004 Catalyst 2This worksheet may have been altered from the original on the CD-ROM.
Type Purpose DifferentiationPractical
Practical
Practical
Practical
Discussion
Discussion
a Studying the environmental conditions in two different habitats: a river or pond anda wood or grassland.
b Sampling organisms in a pond or river.
b Sampling organisms in grassland or a wood.
c Counting organisms
d Food webs
e Pyramids of number
Core, HelpResource 1
Core
Core
Help
CoreResource 2
Core
D-Teachers.qxd 29-Oct-03 6:53 PM Page 9

D2–5Teacher
activity notesFieldwork (continued)
The pupils then use the data to produce a pyramid of numbers. Pyramids ofnumbers usually get smaller towards the top of the pyramid. However this is notalways true. For example, ants feeding on greenfly, who in turn are feeding on alarge single plant, will produce a pyramid with a very small base. Pyramids ofbiomass produce a more accurate representation of the food web.
Other relevant materialKeys available from the Field Studies Council at the following address:
FSC Publications, Preston Montford, Shrewsbury, SY4 1HW
Expected outcomesPupils should learn a variety of methods for sampling and measuringenvironmental factors and organisms within the environment. They should beable to understand how the organisms are adapted to their environment and therelationships between the organisms, and be able to display this relationshipgraphically in the form of food webs and pyramids of numbers.
PitfallsHealth and Safety issues need to be carefully monitored.
Safety notesActivities that involve pupils being taken out of school require careful planning.This is particularly true of field trips where practical activities are involved. Allschools should now have clear documentation for schools trips and this should beread and adhered to.
However the following points needs particular consideration.
● Ensure the policy for taking trips is read, understood and followed by everyonetaking part.
● Visit the site first, before taking pupils. It will enable you to carry out a riskassessment.
● Carry out risk assessments for each activity – these are not as difficult as theysound, but should be specific for the activity undertaken. You should attemptto identify each potential risk, and a course of action to take should theincident happen.
● Make sure you have a fully charged mobile phone.
● Never exceed the appropriate pupil–teacher ratio.
● Have a qualified first-aider and first-aid kit with you.
● Ensure small cuts etc. are covered with waterproof plasters before any pond-dipping takes place.
● Use disposable gloves if pupils cannot wash their hands before they eat ordrink.
Sheet 2 of 2© Harcourt Education Ltd 2004 Catalyst 2This worksheet may have been altered from the original on the CD-ROM.
D-Teachers.qxd 29-Oct-03 6:53 PM Page 10
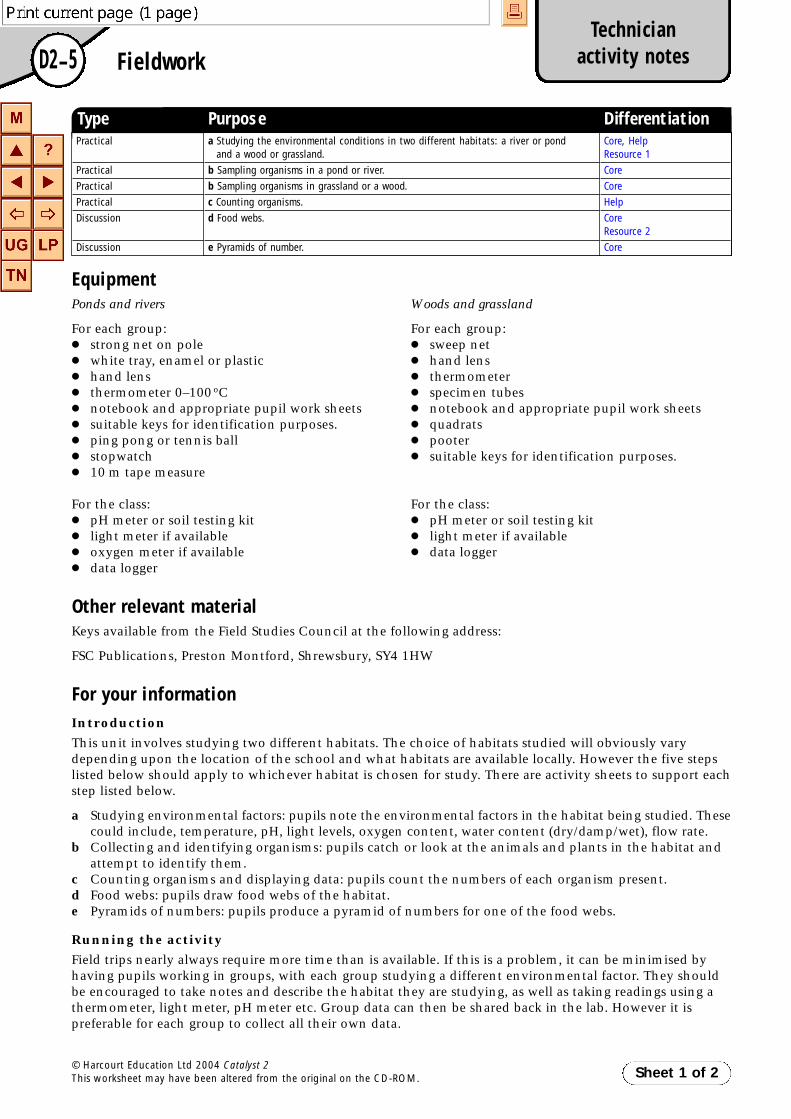
D2–5Technician
activity notesFieldwork
EquipmentPonds and rivers Woods and grassland
For each group: For each group:● strong net on pole ● sweep net● white tray, enamel or plastic ● hand lens● hand lens ● thermometer● thermometer 0–100oC ● specimen tubes● notebook and appropriate pupil work sheets ● notebook and appropriate pupil work sheets● suitable keys for identification purposes. ● quadrats● ping pong or tennis ball ● pooter● stopwatch ● suitable keys for identification purposes.● 10 m tape measure
For the class: For the class:● pH meter or soil testing kit ● pH meter or soil testing kit● light meter if available ● light meter if available● oxygen meter if available ● data logger● data logger
Other relevant materialKeys available from the Field Studies Council at the following address:
FSC Publications, Preston Montford, Shrewsbury, SY4 1HW
For your informationIntroductionThis unit involves studying two different habitats. The choice of habitats studied will obviously varydepending upon the location of the school and what habitats are available locally. However the five stepslisted below should apply to whichever habitat is chosen for study. There are activity sheets to support eachstep listed below.
a Studying environmental factors: pupils note the environmental factors in the habitat being studied. Thesecould include, temperature, pH, light levels, oxygen content, water content (dry/damp/wet), flow rate.
b Collecting and identifying organisms: pupils catch or look at the animals and plants in the habitat andattempt to identify them.
c Counting organisms and displaying data: pupils count the numbers of each organism present.d Food webs: pupils draw food webs of the habitat.e Pyramids of numbers: pupils produce a pyramid of numbers for one of the food webs.
Running the activityField trips nearly always require more time than is available. If this is a problem, it can be minimised byhaving pupils working in groups, with each group studying a different environmental factor. They shouldbe encouraged to take notes and describe the habitat they are studying, as well as taking readings using athermometer, light meter, pH meter etc. Group data can then be shared back in the lab. However it ispreferable for each group to collect all their own data.
Sheet 1 of 2© Harcourt Education Ltd 2004 Catalyst 2This worksheet may have been altered from the original on the CD-ROM.
Type Purpose DifferentiationPractical
Practical
Practical
Practical
Discussion
Discussion
a Studying the environmental conditions in two different habitats: a river or pond and a wood or grassland.
b Sampling organisms in a pond or river.
b Sampling organisms in grassland or a wood.
c Counting organisms.
d Food webs.
e Pyramids of number.
Core, HelpResource 1
Core
Core
Help
CoreResource 2
Core
D-Technician.qxd 29-Oct-03 6:54 PM Page 4

D2–5Technician
activity notesFieldwork (continued)
Pupils should then catch/observe and note all of the organisms found. Plant materialshould be identified in situ and not removed. Animal material such as beetles may need tobe caught in order to be identified. However this is an excellent opportunity to teach pupilsrespect for the environment and the organisms living in it. All animals collected should bedisturbed as little as possible and returned to the environment after identification.
Identification is carried out using appropriate keys or teacher/pupil knowledge. The numberof organisms, for each species are then counted and entered on to the appropriate pupilsheet. If keys are to be used, pupils will need appropriate training in their use.
Once the data has been collected, the field trip is complete and the pupils should return tothe classroom to process the data. This involves drawing food webs for the organismsstudied, which often requires considerable help from the teacher as it is rarely obvious inthe field as to ‘what is eating what’. However the following points should help:
● There are nearly always more herbivores than carnivores.
● Look at the mouthparts. Do they look like they are adapted for catching prey?
● Keep the naming simple. It is easier to call all beetles ‘beetles’ than it is to identify eachindividual species.
The pupils then use the data to produce a pyramid of numbers. Pyramids of numbersusually get smaller towards the top of the pyramid. However this is not always true. Forexample, ants feeding on greenfly, who in turn are feeding on a large single plant, willproduce a pyramid with a very small base. Pyramids of biomass produce a more accuraterepresentation of the food web.
Expected outcomesPupils should learn a variety of methods for sampling and measuring environmental factorsand organism within the environment. They should be able to understand how theorganisms are adapted to their environment and the relationships between the organisms,and be able to display this relationship graphically in the form of food webs and pyramidsof numbers.
PitfallsHealth and Safety issues need to be carefully monitored.
Safety notesActivities that involve pupils being taken out of school require careful planning. This isparticularly true of field trips where practical activities are involved. All schools should nowhave clear documentation for schools trips and this should be read and adhered to.
However the following points needs particular consideration.
● Ensure the policy for taking trips is read, understood and followed by everyone takingpart.
● Visit the site first, before taking pupils. It will enable you to carry out a risk assessment.
● Carry out risk assessments for each activity – these are not as difficult as they sound, butshould be specific for the activity undertaken. You should attempt to identify eachpotential risk, and a course of action to take should the incident happen.
● Make sure you have a fully charged mobile phone.
● Never exceed the appropriate pupil–teacher ratio.
● Have a qualified first-aider and first-aid kit with you.
● Ensure small cuts etc. are covered with waterproof plasters before any pond-dippingtakes place.
● Use a disposable gloves if pupils cannot wash their hands before they eat or drink.
Sheet 2 of 2© Harcourt Education Ltd 2004 Catalyst 2This worksheet may have been altered from the original on the CD-ROM.
D-Technician.qxd 29-Oct-03 6:54 PM Page 5

D2–5aActivity
CoreFieldwork – Studying twodifferent habitats
You are going to study the environmental conditions of twodifferent habitats. The habitats you are going to look at are apond or river and a wood or grassland.
Equipment
● notebook and pencil ● oxygen meter● thermometer ● data storage device● pH meter or soil testing kit ● ping pong or tennis ball● screw top jar containing some distilled water, pH 7 ● stopwatch● light meter ● 10m tape measure
Planning and predicting
1 List all of the environmental conditions that you think will affect theorganisms that grow in the two habitats.
2 Decide which of these conditions you will measure.3 Choose one of these conditions and predict how it will vary in the two
different habitats.4 Write a plan for your method including the equipment you will use.
Obtaining evidence
5 Check your plan with your teacher before you start.
Presenting the results
6 Draw a table to record your results from the two different habitats.
Considering the evidence
When you have collected your data, answer the following questions.
1 What differences did you find between the two habitats?2 What similarities did you find between the two habitats?
Evaluating
3 Explain one way that you could have improved the collection ofenvironmental data from the two habitats.
Sheet 1 of 1© Harcourt Education Ltd 2004 Catalyst 2This worksheet may have been altered from the original on the CD-ROM.
Wash yourhands afterhandling
living material.
D-Activities.qxd 29-Oct-03 6:52 PM Page 14

D2–5aActivity
Help
Sheet 1 of 1© Harcourt Education Ltd 2004 Catalyst 2This worksheet may have been altered from the original on the CD-ROM.
Fieldwork – Studying twodifferent habitats
You are going to study the environmental conditions of twodifferent habitats. The habitats you are going to look at are apond or river and a wood or grassland.
Equipment
● notebook and pencil ● oxygen meter● thermometer ● data storage device● pH meter or soil testing kit ● ping pong or tennis ball● screw top jar containing some distilled water, pH 7 ● stopwatch● light meter ● 10m tape measure
Obtaining evidence
1 Your teacher will take you to study a habitat. Follow the instructions on Resource 1 on how to measure the environmental conditions.
2 As you collect your data, fill in the table.
Considering the evidence
3 When you have collected your data complete the sentences below.
1 The light intensity in the wood/grassland was than by the pond/river.
This was because
The pH of the soil was and the pH of the river was .
The air temperature changed during the day, but the river temperature .
This was because .
Wash yourhands afterhandling
living material.
Grassland or wood Pond or river
tteemmppeerraattuurree
lliigghhtt iinntteennssiittyy
ppHH ooff ssooiill oorr wwaatteerr
ooxxyyggeenn ccoonntteenntt (not applicable)
ffllooww rraattee (not applicable)
D-Activities.qxd 29-Oct-03 6:52 PM Page 15

D2–5aActivity
Resource 1
Sheet 1 of 1© Harcourt Education Ltd 2004 Catalyst 2This worksheet may have been altered from the original on the CD-ROM.
Fieldwork – Studying twodifferent habitats
Use this sheet to help you measure the environmental conditions of two differenthabitats.
● TTeemmppeerraattuurree –– use a thermometer to record the air temperature or water temperatureas appropriate.
● LLiigghhtt –– if you have a light meter, use it to measure the amount of light. Your teacherwill explain how to use it. If you do not have a light meter, try to estimate how brightit is by choosing from the following scale:
● WWeettnneessss –– obviously a pond or river will be very wet, but for other habitats, choosefrom the following scale:
● OOxxyyggeenn lleevveellss –– for ponds and rivers only.Use the oxygen probe to measure the oxygen level of the water at the top, middle andbottom of the river or pond.
● ppHH –– Use the pH meter or test kit to measure the pH of the water and the pH of thesoil. To find the pH of the soil you may need to add some soil to distilled water in ascrew top jar. Shake well, allow to settle, then test the pH of the water.
● DDaattaa llooggggeerr –– if you have a data logger you can use it to measure the temperaturechanges of the water over a period of time, or the changes in light intensity over aperiod of time. Your teacher will explain how to use it.
● FFllooww rraattee –– place the ping pong or tennis ball in the water and time how long it takesto travel 10 metres. Calculate the flow rate by dividing the number 10 by the numberof seconds the journey took. For example, if the ball travelled 10 metres in 40 seconds:
flow rate = 10/40 = 0.25 metres per second (m/s)
very bright full sunshine
bright sun behind patchy cloud or overhead trees
dull sun obscured by full cloud or thick tree cover
gloomy overcast sky, raining or dense tree cover
very wet water visible on the ground
damp ground moist, but no standing water
dry no visible sign of any water
D-Activities.qxd 29-Oct-03 6:52 PM Page 16

D2–5bActivity
CoreFieldwork – Sampling organismsin a pond or river
You are going to identify, sample and count the organisms foundin a pond or river.
Equipment
● notebook and pencil● strong net on a pole● white tray● hand lens● suitable keys to identify the organisms
Before you start
Remember that that this environment belongs to the organisms thatlive in it. Do not uproot plants, and any animals that are caughtshould be handled carefully and returned to their environment assoon as possible.
Collecting
1 Draw up a table to record the number of eachorganism you find.
2 Half fill your white tray with water.3 Carefully place your net sideways into the
pond or river so that it is half in the water andhalf out. Move it slowly sideways so that itcollects any organisms on or near the surface.
4 Take the net out of the water and turn it inside out. Wash it outin the white tray. Any organisms will be washed into the tray.
Identifying
5 Look at the organisms carefully, using a hand lens. There are twoways you can identify them.
● Look at photographs until you have found the organism youare looking for. This can sometimes take a long time as thereare many different organisms.
● Use a key. This is a way of dividing the organisms up intogroups. It is not quite so easy to do but it is much quicker.
Your teacher will decide which of these two methods you aregoing to use and explain how to do it.
Sheet 1 of 2© Harcourt Education Ltd 2004 Catalyst 2This worksheet may have been altered from the original on the CD-ROM.
Wash yourhands afterhandling
living material.
D-Activities.qxd 29-Oct-03 6:52 PM Page 17

D2–5bActivity
CoreFieldwork – Sampling organisms in apond or river (continued)
6 Once you have identified an organism, make a note of the nameof it in your table. Record an estimate of the number you havefound.
7 Make a separate list of the organisms that you have found and,for each one, explain how you think it is adapted to its habitat.
Observing
8 Try to observe ‘what eats what’. This can sometimes be verydifficult as your field trip only lasts for a short time and animalsare not likely to eat when they have been disturbed. If you dosee what an animal is feeding on, make a note of it in yournotebook.
Further sampling
9 When you have identified and counted the organisms andrecorded your observations, carefully return the organisms to theriver or pond. Rinse the tray and half fill it with clean water.
10 Repeat the collecting process with the net close to the bottom ofthe river or pond. Be careful when moving the net sideways oryou will end up with a net full of mud. If that does happen, washyour net out and either wait for the water to clear or move toanother location.
11 Identify, count and observe the organisms you find.
12 Return all organisms to their environment.
Sheet 2 of 2© Harcourt Education Ltd 2004 Catalyst 2This worksheet may have been altered from the original on the CD-ROM.
D-Activities.qxd 29-Oct-03 6:52 PM Page 18

D2–5bActivity
CoreFieldwork – Sampling organismsin grassland or a wood
You are going to identify, sample and count the organisms foundin grassland or a wood.
Equipment
● notebook and pencil● sweep net on a pole● hand lens● specimen tubes● quadrat● pooter● suitable keys to identify the organisms
Before you start
Remember that that this environment belongs to the organisms thatlive in it. Do not uproot plants. Any animals that are caught shouldbe handled carefully and returned to their environment as soon aspossible.
Collecting
1 Draw up a table to record the number of each organism youfind.
2 Your teacher will give you a quadrat. You should place thequadrat on the ground randomly, rather than by choosing whereyou put it. This can be achieved by dropping the quadrat overyour shoulder so you cannot see where it will land. Anothermethod is to mark out a string square on the ground10m × 10m. You can then use a random number sequencebetween 1 and 100 to determine the position of your quadrat.
3 The plants that are inside the quadrat represent your collectedsample. You will identify them shortly.
4 You should now collect any small animals that you can findwithin the quadrat. You will probably think that there are none,but if you look carefully you will be surprised how many you find.
To collect the animals, use your pooter. It should be used carefullyso as not to damage any of the animals.
Sheet 1 of 2© Harcourt Education Ltd 2004 Catalyst 2This worksheet may have been altered from the original on the CD-ROM.
Wash yourhands afterhandling
living material.
D-Activities.qxd 29-Oct-03 6:52 PM Page 19
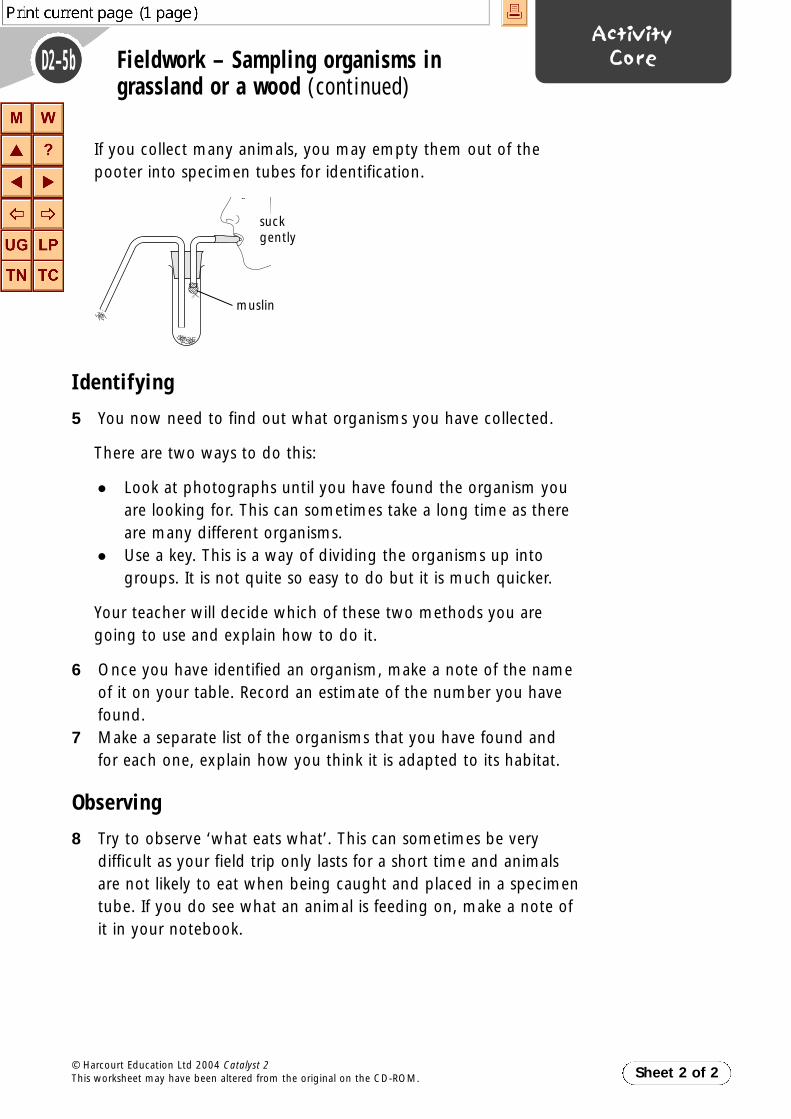
D2–5bActivity
CoreFieldwork – Sampling organisms ingrassland or a wood (continued)
If you collect many animals, you may empty them out of thepooter into specimen tubes for identification.
Identifying
5 You now need to find out what organisms you have collected.
There are two ways to do this:
● Look at photographs until you have found the organism youare looking for. This can sometimes take a long time as thereare many different organisms.
● Use a key. This is a way of dividing the organisms up intogroups. It is not quite so easy to do but it is much quicker.
Your teacher will decide which of these two methods you aregoing to use and explain how to do it.
6 Once you have identified an organism, make a note of the nameof it on your table. Record an estimate of the number you havefound.
7 Make a separate list of the organisms that you have found andfor each one, explain how you think it is adapted to its habitat.
Observing
8 Try to observe ‘what eats what’. This can sometimes be verydifficult as your field trip only lasts for a short time and animalsare not likely to eat when being caught and placed in a specimentube. If you do see what an animal is feeding on, make a note ofit in your notebook.
Sheet 2 of 2© Harcourt Education Ltd 2004 Catalyst 2This worksheet may have been altered from the original on the CD-ROM.
suckgently
muslin
D-Activities.qxd 29-Oct-03 6:52 PM Page 20

D2–5cActivity
HelpFieldwork – Counting organismsand displaying data
You are going to determine the number of organisms in a habitatand display the results.
Equipment
Notebook and pencil
1 Make a tally sheet like the one below, or your teacher may giveyou a tally sheet to use.
2 Enter the name of the organism on your tally sheet.3 Count the number of organisms by using a tally. Put a vertical line
on your tally sheet for each organism. After four vertical linesplace a horizontal or oblique line through them.
For example
III = 3 IIII = 5 IIII IIII II = 12
This makes counting much easier and more accurate.
Tally sheet
Name of location
Type of location Date
Sheet 1 of 1© Harcourt Education Ltd 2004 Catalyst 2This worksheet may have been altered from the original on the CD-ROM.
Name of organism Tally Total
Wash yourhands afterhandling
living material.
D-Activities.qxd 29-Oct-03 6:52 PM Page 21
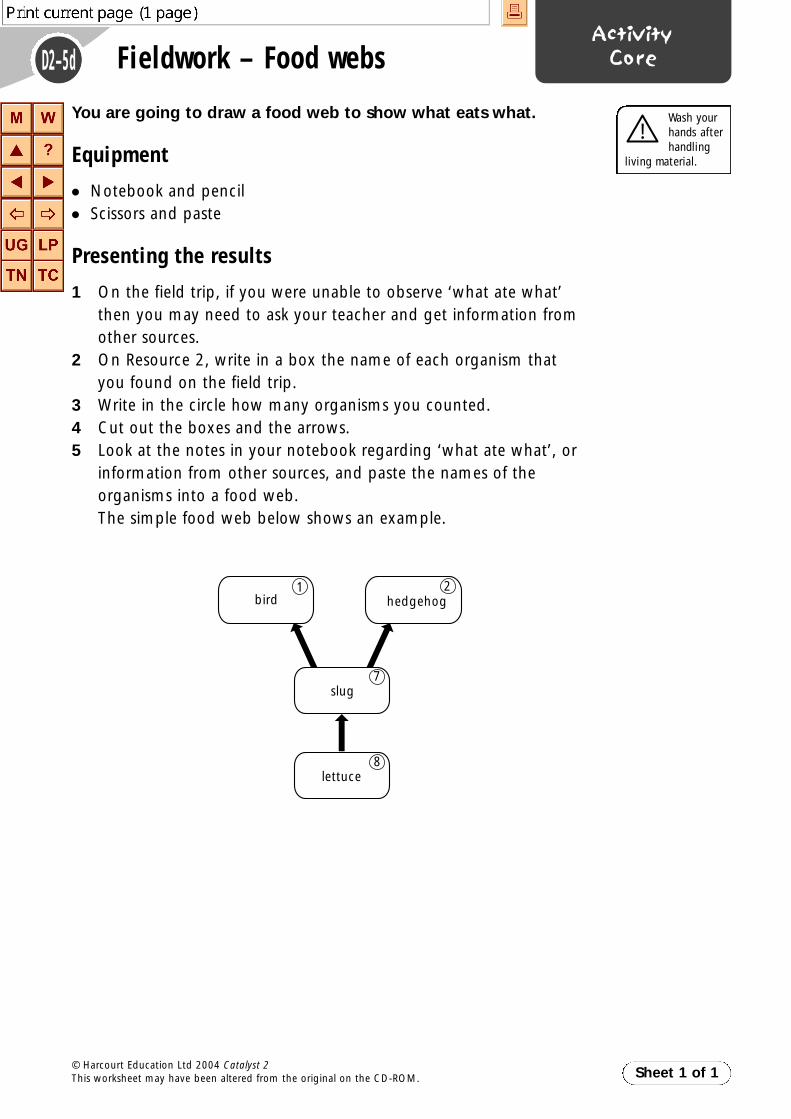
D2–5dActivity
CoreFieldwork – Food webs
You are going to draw a food web to show what eats what.
Equipment
● Notebook and pencil● Scissors and paste
Presenting the results
1 On the field trip, if you were unable to observe ‘what ate what’then you may need to ask your teacher and get information fromother sources.
2 On Resource 2, write in a box the name of each organism thatyou found on the field trip.
3 Write in the circle how many organisms you counted.4 Cut out the boxes and the arrows.5 Look at the notes in your notebook regarding ‘what ate what’, or
information from other sources, and paste the names of theorganisms into a food web.The simple food web below shows an example.
Sheet 1 of 1© Harcourt Education Ltd 2004 Catalyst 2This worksheet may have been altered from the original on the CD-ROM.
Wash yourhands afterhandling
living material.
8lettuce
7slug
1bird
2hedgehog
D-Activities.qxd 29-Oct-03 6:52 PM Page 22

D2–5dActivity
Resource 2Fieldwork – Food webs
Use this sheet to help you make a food web.
Write the name of the organism on the dotted line, and the numberof organisms you found on the field trip in the circle.
Sheet 1 of 1© Harcourt Education Ltd 2004 Catalyst 2This worksheet may have been altered from the original on the CD-ROM.
D-Activities.qxd 29-Oct-03 6:52 PM Page 23

D2–5eActivity
CoreFieldwork – Pyramids of numbers
You are going to determine the relationship between the organismsfound in the two habitats by making a pyramid of numbers.
Equipment
● food web from last lesson● graph paper● scissors and paste
Presenting the results
1 Choose a food chain from the food web that you made last lesson.The chain should be as long as possible. It should start from thebottom of the web and go from arrow to arrow.
For example
2 Now convert the food chain into a pyramid of numbers. On a sheet ofgraph paper, draw a box for each organism in your food chain.
The size of the box is very important. All the boxes should be the sameheight (2cm) but the width of the boxes will vary.
Look at the numbers of organisms that you found on your field trip.
The width of each box should be proportional to the number oforganisms found. This means that if there were twice as many slugs ashedgehogs, the slug box should be twice as wide as the hedgehog box.
Use an appropriate scale for the width, such as 1cm = one organism or0.5cm = one organism. You may need to choose your own scale to suitthe number of organisms you have.
3 When you have drawn your boxes, cut them out and paste them oneabove the other to form a pyramid. It is important that you keep themin the same order as the food chain.
Sheet 1 of 1© Harcourt Education Ltd 2004 Catalyst 2This worksheet may have been altered from the original on the CD-ROM.
food web food chain
8lettuce
8lettuce
7slug
7slug
1bird
2hedgehog
2hedgehog
D-Activities.qxd 29-Oct-03 6:52 PM Page 24

D1 PlenariesPlant groups
Review learning● Ask pupils ‘What am I?’ for each type of plant group and
give only yes or no answers to their questions. The firstperson to correctly identify the plant group wins onepoint. If a pupil guesses incorrectly they are out of thegame. The pupil with most points at end of the game isthe winner.
Sharing responses● Pupils give feedback on their observations of a range of
different plant groups.
Group feedback● In groups, pupils discuss the adaptations required by each
plant to live in its habitat.
Word game● Ask pupils ‘Where do I live?’ for each plant. Pupils
identify the habitat of a plant based on a description ofthe plant given from the teacher sheet.
Looking aheadPupils are asked to research the names of different peoplewho have had solo adventures of exploration. This couldinclude people who have trekked to the North Pole or hadsolo sea voyages. They should find out what they needed totake with them to help them survive the harsh environment.
Plant groupsMoss, fern, conifer, flowering plant, grass.
➔ Teacher sheet
Sheet 1 of 1© Harcourt Education Ltd 2004 Catalyst 2This worksheet may have been altered from the original on the CD-ROM.
Suggested alternative plenary activities (5–10 minutes)
Review learning
Pupils play ‘What am I?’ foreach type of plant group.
Sharing responses
Pupils feedback on theirobservations from Activity D1a.
Group feedback
In groups, pupils discusswhat adaptations arerequired in Activity D1b.
Word game
Pupils play ‘Where do Ilive?’
Looking ahead
Pupils research the names ofdifferent people who have hadsolo adventures of exploration.
D-Plenaries.qxd 29-Oct-03 6:52 PM Page 1

D1 PlenariesPlant groups
Word gameTeacher sheetRead each description in turn.
Where do I live?I am very small and grow close to the ground. I flower during the summer whendays are long and nights are short. I can withstand grazing by animals and coldtemperatures.
AnswerTundra/Arctic
Where do I live?I am lush with large leaves and very big bright flowers. I grow very quickly andcan even grow all year round. I am in intense competition with other plants forlight. I am even able to produce poisons so that I will not be eaten by all thedifferent animals that live here.
AnswerTropical rain forest
Where do I live?I have large fleshy stems and sharp thorns instead of leaves. My roots go deep intothe ground and spread out sideway for long distances. I grow very slowly and wasquite old before I was able to produce a flower.
AnswerDesert
Where do I live?I like to live in shady places. I am not able to produce flowers or seeds butreproduce by making spores. I do not have leaves but instead produce fronds thatare green and allow me to photosynthesise.
AnswerWoods and forests or crevices in the ground
Sheet 1 of 1© Harcourt Education Ltd 2004 Catalyst 2This worksheet may have been altered from the original on the CD-ROM.
D-Plenaries.qxd 29-Oct-03 6:52 PM Page 2

D2 PlenariesA place to live
Review learning● Pupils are asked to relate different adaptations to
different habitats.
Sharing responses● Pupils discuss what environmental conditions could
be measured in the Arctic and Antarctic. Answerscould include temperature, day length, snowfalldepth.
Group feedback● In groups, pupils feedback how different animals are
adapted to life in the Arctic and Antarctic.
Word game● Pupils play ‘Dear diary’ writing a day in an imaginary
diary of someone trekking to the North Pole and theproblems they need to adapt to. If necessary writehints opposite on the board to get them started.
● Ask volunteers to read out their diary.
Looking ahead● Pupils research why there are more rabbits than
eagles in the UK on the Internet and in books.
➔ Pupil sheet
AnswersA lives in ice burrowsB swims on top of the waterC climbs up and down tree trunksD flies and catches insectsE lives in rock pools
HintsHaving to carry everything.Shelter at night.Liquid water freezes.How to cook food.Keeping warm and dry.
AnswersRabbits are herbivores and there are usuallymore herbivores than carnivores such aseagles. This can happen because rabbits canreproduce more quickly than eagles.
Sheet 1 of 1© Harcourt Education Ltd 2004 Catalyst 2This worksheet may have been altered from the original on the CD-ROM.
Suggested alternative plenary activities (5–10 minutes)
Review learning
Pupils match differentadaptations to differenthabitats.
Sharing responses
Pupils discuss whatenvironmental conditionscould be measured in theArctic and Antarctic.
Group feedback
In groups, pupilsfeedback on adaptationsfrom Activity D2a.
Word game
Pupils play ‘Dear diary’ writing a dayin an imaginary diary of someonetrekking to the North Pole and theproblems they need to adapt to.
Looking ahead
Pupils research why thereare more rabbits thaneagles in the UK.
D-Plenaries.qxd 29-Oct-03 6:52 PM Page 3

D2 PlenariesA place to live
Review learning
You work in a museum. One day in the basement, you find a largewooden box containing preserved animals. None of them arelabelled.
You write a description of each animal in your notebook as A to Ebelow.
In the box you find the following piece of paper.
Match the animal, A, B, C, D and E with its appropriate habitat.
Sheet 1 of 1© Harcourt Education Ltd 2004 Catalyst 2This worksheet may have been altered from the original on the CD-ROM.
Animal A
Small with fur onbody.
Animal B
Thin, smooth skin withlarge webbed feet. Bodycovered in feathers.
Animal D
Body covered in feathers.Small light body with asharp pointed beak.
Animal E
Has gills that stick outfrom a hard outer shell.
Animal C
Has strange claws on feet.Two pointing forwardsand two pointingbackwards.
……climbs up and down tree
trunks in a tropical rain forest.
……lives in ice burrows in the
cold tundra regions.
……lives in rock pools on sandy
beeches.
……swims on the top of the water
in ponds and rivers.
……flies and catches insects on
the wing.
D-Plenaries.qxd 29-Oct-03 6:52 PM Page 4

D3 PlenariesHome alone?
Review learning Show pupils odd shaped pyramids of number and ask
them to explain their shape.
Sharing responses Pupils discuss their answers as to how the food web will
change when the environment changes.
Summarise their ideas on the board.
Group feedback Each group feeds back data from Activity D3a to build a
pyramid of number for the whole class.
Discuss why it is more reliable to use data from thewhole class than just one group.
Brainstorming Pupils imagine that life exists on Mars and brainstorm
problems that could occur to an ecosystem if peopleland on Mars.
Looking ahead Pupils research graphs showing population numbers for
different organisms from books and the Internet.
They should discover that initially populations increasebut then some factor (lack of food, disease, etc.) causesthe graph to level off or start to fall.
Ô Pupil sheet
Explanation1 rose bush – greenfly – blue tits 2 slugs – hedgehogs – fleas
IdeasThe introduction of new species to competewith indigenous ones, especiallymicroorganisms, and pollution.
Examplesyeast when added to malt and sugar toproduce beer; two different but relatedorganisms such as lions and zebras
Sheet 1 of 1© Harcourt Education Ltd 2004 Catalyst 2This worksheet may have been altered from the original on the CD-ROM.
Suggested alternative plenary activities (5–10 minutes)
Review learning
Show pupils odd-shapedpyramids of number and askpupils to explain their shape.
Sharing responses
Pupils share theiranswers to questions inActivity D3b.
Group feedback
Each group feeds back theirdata from Activity D3a tobuild a pyramid of numberfor the whole class.
Brainstorming
Pupils imagine that life exists onMars and brainstorm problemsthat could occur to an ecosystemif people land on Mars.
Looking ahead
Pupils research graphsshowing populationnumbers for differentorganisms.
D-Plenaries.qxd 29-Oct-03 6:52 PM Page 5
●
●
●
●
●
●
●
●

D3 PlenariesHome alone?
Review learning
Suggest reasons for the odd shapes of the pyramids of number.
Sheet 1 of 1© Harcourt Education Ltd 2004 Catalyst 2This worksheet may have been altered from the original on the CD-ROM.
Sheet 1 of 1
PlenariesD3 Home alone?
© Harcourt Education Ltd 2004 Catalyst 2This worksheet may have been altered from the original on the CD-ROM.
Review learning
Suggest reasons for the odd shapes of the pyramids of number.
Sheet 1 of 1
PlenariesD3 Home alone?
© Harcourt Education Ltd 2004 Catalyst 2This worksheet may have been altered from the original on the CD-ROM.
Review learning
Suggest reasons for the odd shapes of the pyramids of number.
D-Plenaries.qxd 29-Oct-03 6:52 PM Page 6

D4 PlenariesPopulations
Review learning Pupils play ‘true or false’ game about the
interdependence of populations.
Share responses Pupils should see from the Starter activity that the
human population graph is different from that of otherorganisms.
They share ideas about why the graph for the humanpopulation is different and is continuing to rise.
Group feedback In groups, pupils discuss their answers to Activity D4b.
Pupils should realise that the grey squirrel hasoutcompeted the red because for example it can eatacorns. The red is now limited to conifer forests becauseit can feed on conifer seed.
Word game Pupils play ‘Hang the rabbit’ to reinforce vocabulary and
spelling of key words. The game is the same as‘hangman’ but uses a rabbit to contextualise the activity.
Looking back Pupils revise and consolidate knowledge from the unit.
They can use the Unit map, Pupil checklist, or the Testyourself questions.
Ô Pupil sheet
Answers1 true; 2 false; 3 false; 4 false; 5 true; 6 true;7 true; 8 false; 9 true
Answers
The population keeps on growing because -no predators; adapted to live in all kinds ofhabitat due to new materials etc.; cropsdeveloped to survive; medicine to helpagainst disease. Pupils might suggest otherideas such as: it cannot go on foreverwithout levelling out; war, disease orfamine could cause the population tocrash.
Key wordsconsumer; competition; pyramid; trophiclevels; population
Ô Unit map
Ô Pupil checklist
Ô Test yourself
Sheet 1 of 1© Harcourt Education Ltd 2004 Catalyst 2This worksheet may have been altered from the original on the CD-ROM.
Suggested alternative plenary activities (5–10 minutes)
Review learning
Pupils play ‘true or false’game about theinterdependence ofpopulations.
Sharing responses
Pupils share ideas aboutwhy the graph for thehuman population keeps ongoing up.
Group feedback
In groups, pupils discusstheir answers for ActivityD4b.
Word game
Pupils play ‘Hang the rabbit’to reinforce vocabulary andspelling of key words.
Looking back
Pupils revise andconsolidate knowledge fromthe unit.
D-Plenaries.qxd 29-Oct-03 6:52 PM Page 7
●
●
●
●
●
●
●

D4 PlenariesPopulations
Review learning
Decide if the following statements are true or false.
1 There are usually more herbivores than carnivores. [True/False]2 There are always more consumers than producers. [True/False]3 The number of herbivores has no effect on the number of
carnivores. [True/False]4 Pyramids of number are always larger at the bottom. [True/False]5 Pyramids of number are usually larger at the bottom. [True/False]6 Pyramids of number tend to get smaller at the top. [True/False]7 If the number of herbivores drops the number of carnivores will
drop at a later date. [True/False]8 Changes to the number of one organism in a food web do
not affect other organisms if they do not feed upon it. [True/False]9 Changes to one part of a food web can affect many other parts
of the food web. [True/False]
Sheet 1 of 1
Sheet 1 of 1
© Harcourt Education Ltd 2004 Catalyst 2This worksheet may have been altered from the original on the CD-ROM.
PlenariesD4 Populations
Review learning
Decide if the following statements are true or false.
1 There are usually more herbivores than carnivores. [True/False]2 There are always more consumers than producers. [True/False]3 The number of herbivores has no effect on the number of
carnivores. [True/False]4 Pyramids of number are always larger at the bottom. [True/False]5 Pyramids of number are usually larger at the bottom. [True/False]6 Pyramids of number tend to get smaller at the top. [True/False]7 If the number of herbivores drops the number of carnivores will
drop at a later date. [True/False]8 Changes to the number of one organism in a food web do
not affect other organisms if they do not feed upon it. [True/False]9 Changes to one part of a food web can affect many other parts
of the food web. [True/False]
© Harcourt Education Ltd 2004 Catalyst 2This worksheet may have been altered from the original on the CD-ROM.
D-Plenaries.qxd 29-Oct-03 6:52 PM Page 8

D5 PlenariesSpecial daisies – Think about
Group feedback Pupils feedback the number of objects found, in order to
determine a class average.
Pupils should understand that this produces a morerealistic figure than the individual group figures. Theycan then be told the actual number of objects placed inthe sand to determine which group obtained the mostaccurate result.
Bridging to other topics Pupils brainstorm how the sampling method may be
used on a large scale to determine the number oforganisms in a habitat and the problems that may arise.
IdeasThe use of 0.5m quadrats, how to samplerandomly in the field using a table ofrandomly generated numbers, difficultiesencountered such as plants occupyingseveral layers in a quadrat resulting ingreater than 100% coverage. For examplemoss could cover 80% of the quadrat, butgrass growing up and above it could occupy50% of the quadrat making a total of 130%
Sheet 1 of 1© Harcourt Education Ltd 2004 Catalyst 2This worksheet may have been altered from the original on the CD-ROM.
Suggested alternative plenary activities (5–10 minutes)
Group feedback
Pupils feedback the number of objectsfound in Activity D5a to determine aclass average.
Bridging to other topics
Pupils brainstorm how the sampling methodmay be used on a large scale to determinethe number of organisms in a habitat.
D-Plenaries.qxd 29-Oct-03 6:52 PM Page 9
●
●
●

D2–5 PlenariesFieldwork
Review learning Pupils review the way they planned and carried out the
investigation.
Group feedback In groups, pupils look at the food webs and pyramids of
number from their investigation and write a summaryof what they have learnt from their study in the field.
Analysing Lead a discussion summarising the findings of the two
habitats and their organisms.
Class results could be pooled together to produce amore accurate pyramid of number.
Evaluating Pupils brainstorm ideas about how to improve the
investigation.
Summarise the suggestions on the board.
AnswersBeing able to measure the light intensity atdifferent depths in the pond or river,comparing plant growth at the differentdepths.
Sheet 1 of 1© Harcourt Education Ltd 2004 Catalyst 2This worksheet may have been altered from the original on the CD-ROM.
Suggested alternative plenary activities (5–10 minutes)
Review learning
Teacher-led review of the planningand carrying out of theinvestigation.
Group feedback
In groups, pupils look at theirfindings and write a summary ofwhat they have learnt from theirstudy in the field.
Analysing
Teacher-led summary of thefindings of the investigation of thetwo habitats and their organisms.
Evaluating
Teacher-led review of how themethod could be improved.
D-Plenaries.qxd 29-Oct-03 6:52 PM Page 10
●
●
●
●
●
●

D1 SpecialsPlant groups
1 Match the words to the descriptions.
a A waterproof, waxy coating on leaves.
b Large tough fern leaves.
c To make more living things.
d These carry water inside the leaves.
e Made by flowering plants and conifers for reproduction.
f Made by mosses and ferns for reproduction.
g Made by conifers to hold seeds.
2 Use ✓ and ✗ to fill in this table about the four plant groups.
Sheet 1 of 2© Harcourt Education Ltd 2004 Catalyst 2This worksheet may have been altered from the original on the CD-ROM.
reproduce
conesseedsspores
frondsveinscuticle
Flowering Conifers Ferns Mossesplants
Make seedsinside flowers
Make seedsinside cones
Make spores
Have a waxycuticle
Have veins intheir leaves
D-Specials.qxd 29-Oct-03 6:02 PM Page 1

D1 SpecialsPlant groups (continued)
3 Use these words to answer the questions.
a I am a tiny plant and I look like aspringy cushion. I make spores toreproduce. My leaves are very smalland they do not have a cuticle. I needto live in wet places.
What am I?
b I belong to a group of plants thatincludes grasses and many trees. Ireproduce by making seeds insideflowers. I have leaves with cuticles. Theleaves have veins inside them.
What am I?
c I have big, tough leaves called fronds.My leaves have veins to carry water. Ireproduce using spores. I like to growin damp, cool, shady woodland.
What am I?
d I am a tree with a large trunk and largeroots. My leaves are thin and likeneedles. My leaves have a cuticle andveins. I make seeds inside cones. I canlive in very cold, frozen places.
What am I?
Sheet 2 of 2© Harcourt Education Ltd 2004 Catalyst 2This worksheet may have been altered from the original on the CD-ROM.
fern flowering plant moss conifer
D-Specials.qxd 29-Oct-03 6:02 PM Page 2

D2 SpecialsA place to live
1 Match the words to the descriptions.
a A habitat together with all the living things in it,
the soil, air, and climate.
b The place where a plant or animal lives.
c Features that help a plant or an animal survive in
different habitats.
d The surroundings in a habitat.
2 Where do each of these animals live? Put the name of the animal in the table opposite its habitat.
Sheet 1 of 2© Harcourt Education Ltd 2004 Catalyst 2This worksheet may have been altered from the original on the CD-ROM.
ecosystemhabitat environmentadaptations
lion ladybird zebra
trout shark whalescorpion
greenfly
Habitat Animals
garden,
ocean,
river
desert
African grassland,
D-Specials.qxd 29-Oct-03 6:03 PM Page 3

D2 SpecialsA place to live (continued)
3 What are the adaptations of these animals?
a Zebras have stripes to help them:hide from predators be seen clearly by predators to look nice and tidy.
b Cheetahs have very long legs to help them:run slowly run very quickly walk easily.
4 Draw lines to match the animal to its adaptation.Then match the adaptation to how it helps theanimal.
Sheet 2 of 2© Harcourt Education Ltd 2004 Catalyst 2This worksheet may have been altered from the original on the CD-ROM.
Animal Adaptation How it helps
zebra cheetah
rabbit
shark
barnacle
sparrow
a hard shell
light bonesand feathers
a streamlined body
flat grindingteeth
These help it grind upthe plants it eats.
This helps it swim quickly through water.
These help it fly easily.
Protects it from animalsthat want to eat it.
Tick the boxes to show the
right answers.
D-Specials.qxd 29-Oct-03 6:04 PM Page 4

D3 SpecialsHome alone?
1 Draw lines to match the words to their descriptions.
Sheet 1 of 2© Harcourt Education Ltd 2004 Catalyst 2This worksheet may have been altered from the original on the CD-ROM.
food chain
producer
consumer
herbivore
carnivore
pyramid ofnumbers
decomposers
food web
Bacteria and fungi that break down and feed on waste products
and dead plants and animals.
Animals that eat only plants.
This shows what eats what.
This is made by linking lots of food chains together.
Plants that make food.
Animals that eat food.
Animals that eat other animals.
This shows the numbers ofproducers and consumers
in a food chain.
D-Specials.qxd 29-Oct-03 6:04 PM Page 5

D3 SpecialsHome alone? (continued)
2 Here are two food chains and their pyramids ofnumbers. Use them to help you answer the questions.
a What do slugs eat?
b Use some of the words on the right to complete the sentences.
i There are slugs than lettuces.
ii The producers are always at the of the pyramids.
iii Producers are always .
iv There are more than owls.
c Name two consumers from the food chains.
and .
d Name two predators from the food chains.
and .
e Name a herbivore from the food chains.
f Name a carnivore from the food chains.
© Harcourt Education Ltd 2004 Catalyst 2This worksheet may have been altered from the original on the CD-ROM.
thrush
slugs
lettuces tree
insects
mice
owl
Sheet 2 of 2
more
mice
animals
fewer
bottom
middle
plants
top
D-Specials.qxd 29-Oct-03 6:06 PM Page 6

D4 SpecialsPopulations
1 Living things in a habitat compete for resources. Lookat this list of things.
Colour in all the things that they compete for.
2 Write true or false for each sentence.
a Plants compete for light and water.
b Animals do not compete against each other for
food.
c The winners of the competition for food have
small populations.
d The number of living things in a habitat is called
the population.
e Only the weakest animals escape predation.
Sheet 1 of 2© Harcourt Education Ltd 2004 Catalyst 2This worksheet may have been altered from the original on the CD-ROM.
food clean water air
crowds
space diseases
dirty water
D-Specials.qxd 29-Oct-03 6:06 PM Page 7

D4 SpecialsPopulations (continued)
3 Use this food web to help you answer the questions.
a Name the animals that eat the seeds and nuts.
b Name all the animals that eat mice.
c Name two animals that compete for the samefood.
d Name two predators in the food web.
e Colour the herbivores in green. Colour the carnivores in red.
Sheet 2 of 2© Harcourt Education Ltd 2004 Catalyst 2This worksheet may have been altered from the original on the CD-ROM.
small birds
beetles
grass
seeds and nuts from trees and plants
squirrels
moles
worms
dead leaves
owl
rabbits
fox
mice
D-Specials.qxd 29-Oct-03 6:12 PM Page 8

D5 SpecialsSpecial daisies
1 Here is a picture of some plants in a garden lawn.
a Fill in this table about the populations in the lawn.
b Which plant has the biggest population?
2 This table gives the population of daisies in the lawn overfive years. Use the table to complete the sentences.
a The daisy population was the biggest in .
b The daisy population was 2 in .
c The daisy population was the same in
and .
3 Many things can affect the daisy population. Match thewords to the reasons why they are needed.
Sheet 1 of 2© Harcourt Education Ltd 2004 Catalyst 2This worksheet may have been altered from the original on the CD-ROM.
sunshine weedkillersrainfall
Plant grass plants daisies dandelions clover
Population
Year 1988 1989 1990 1991 1992
Daisy population 2 1 3 6 3
Plants needenergy from thisto make food.
Plantsneed water
to grow.
These are used tokill unwanted plants
like daisies.
= daisy
= clover
= grass plant
= dandelion
Key
D-Specials.qxd 29-Oct-03 6:12 PM Page 9

D5 SpecialsSpecial daisies (continued)
4 Anne and Jean used a quadrat to find out how many daisy plants were on the school playing fields. They threw the quadrat over their shoulders withoutlooking where it landed. They did this three times in all.
a What is a quadrat?
A wooden stool that has four legs, each one metre long.
A wooden frame that is one metre long on all four sides.
A four-legged version of a tripod.
b Why should you throw it randomly, rather thanchoose where to place it?
So I pick different places by chance.
So I don’t choose places that look empty of daisies so it makes it easier for me to count them.
Because it’s more fun to throw it over myshoulder.
c Why should you do several throws with a quadrat, not just one?
To make me work harder in my lessons.
To get a worse idea of how many daisies there are on the field.
To get a better idea of how many daisies there are on the field.
Sheet 2 of 2© Harcourt Education Ltd 2004 Catalyst 2This worksheet may have been altered from the original on the CD-ROM.
Tick the boxes to show the
right answers.
D-Specials.qxd 29-Oct-03 6:12 PM Page 10

D1 Plant groups1 a cuticle c reproduce e seeds g cones
b fronds d veins f spores2
3 a moss c fernb flowering plant d conifer
D2 A place to live1 a ecosystem c adaptations
b habitat d environment2
3 a Hide from predators.b Run very quickly.
4 rabbit – Flat grinding teeth, these help it grindup the plants it eats.shark – A streamlined body, this helps it swimquickly through water.barnacle – A hard shell, protects it from animalsthat want to eat it.sparrow – Light bones and feathers, these helpit fly easily.
D3 Home alone?1 food chain – This shows what eats what.
producer – Plants that make food.consumer – Animals that eat food.herbivore – Animals that eat only plants.carnivore – Animals that eat other animals.pyramid of numbers – This shows the numbersof producers and consumers in a food chain.food web – This is made by linking lots of foodchains together.decomposers – Bacteria and fungi that breakdown and feed on waste products and deadplants and animals.
2 a lettucesb i fewer iii plants
ii bottom iv micec Any two from: thrush, slugs, owl, mice or
insectsd Any two from: thrush, owl or micee Slugs or insects.f Thrush or owl or mice.
D4 Populations1 Coloured in – food, clean water, air, space2 a true c true e false
b false d true3 a mice, squirrels, small birds
b fox, owlc Beetles and worms or small birds and
squirrels, etc.d Two from: fox, owl, mice, moles, small birds.e Coloured green – rabbits, beetles, worms,
squirrelsColoured red – fox, owl, moles
D5 Special daisies1 a
b Grass plants.2 a 1991 b 1988 c 1990, 19923 rainfall – Plants need water to grow.
sunshine – Plants need energy from this tomake food.weedkillers – These are used to kill unwantedplants like daisies.
4 a A wooden frame that is one metre long onall four sides.
b So I pick different places by chance.c To get a better idea of how many daisies
there are on the field.
D Specials answersEcological relationships
Sheet 1 of 1© Harcourt Education Ltd 2004 Catalyst 2This worksheet may have been altered from the original on the CD-ROM.
Flowering Conifers Ferns Mossesplants
Make seeds inside flowers. ✓ ✗ ✗ ✗
Make seeds inside cones. ✗ ✓ ✗ ✗
Make spores. ✗ ✗ ✓ ✓
Have a waxy cuticle. ✓ ✓ ✓ ✗
Have veins in their leaves. ✓ ✓ ✓ ✗
Plant grass plants daisies dandelions clover
Population 9 6 3 5
Habitat Animals
garden ladybird, greenfly
ocean shark, whale
river trout
desert scorpion
African grassland lion, zebra
Spe Answers.qxd 25-Nov-03 9:03 AM Page 4
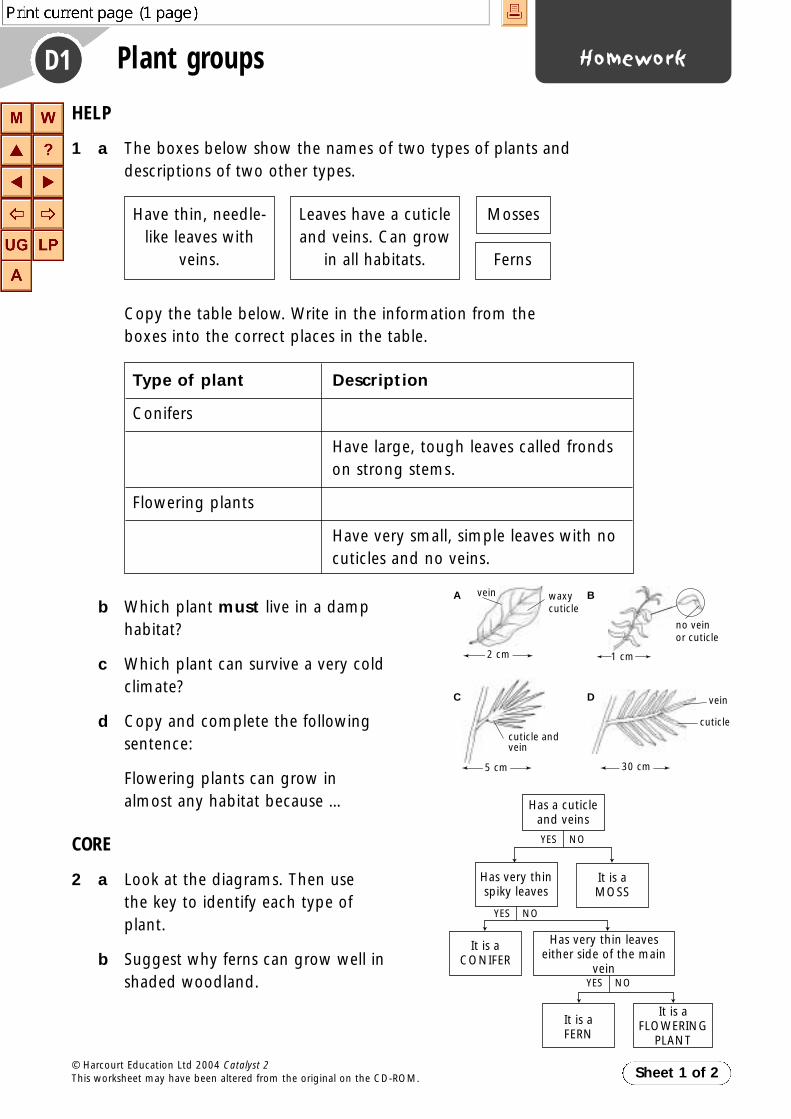
D1 HomeworkPlant groups
HELP
1 a The boxes below show the names of two types of plants anddescriptions of two other types.
Copy the table below. Write in the information from theboxes into the correct places in the table.
b Which plant must live in a damphabitat?
c Which plant can survive a very coldclimate?
d Copy and complete the followingsentence:
Flowering plants can grow in almost any habitat because …
CORE
2 a Look at the diagrams. Then use the key to identify each type ofplant.
b Suggest why ferns can grow well inshaded woodland.
Sheet 1 of 2© Harcourt Education Ltd 2004 Catalyst 2This worksheet may have been altered from the original on the CD-ROM.
Have thin, needle-like leaves with
veins.
Leaves have a cuticleand veins. Can grow
in all habitats.
Mosses
Ferns
Type of plant Description
Conifers
Have large, tough leaves called frondson strong stems.
Flowering plants
Have very small, simple leaves with nocuticles and no veins.
Has a cuticleand veins
Has very thinspiky leaves
It is aMOSS
It is aCONIFER
It is aFERN
It is aFLOWERING
PLANT
YES NO
YES NO
YES NO
vein waxycuticle
vein
cuticlecuticle andvein
A B
C D
no veinor cuticle
2 cm
5 cm 30 cm
1 cm
Has very thin leaveseither side of the main
vein
D-Homework.qxd 29-Oct-03 5:45 PM Page 1

D1 HomeworkPlant groups (continued)
EXTENSION
3 The description below is of a plant called hemlock water dropwort.
a What information tells you that this is a vascular plant?b Suggest a reason why the plant needs very well-defined veins.c Most members of the carrot family are much shorter than hemlock
water dropwort. Suggest a reason why this plant needs to grow closeto ponds or streams.
d What is the advantage, to the plant, of being very poisonous?e What information suggests that the hemlock water dropwort is a
flowering plant?f How might the spikes on the plant’s seeds be helpful?
4 Mushrooms and toadstools belong to a special group called fungi. Theyare saprophytes, which means that they get their nutrients directly fromdead and decaying plant material in the soil. They do not have leaves.They do not have flowers, as they reproduce through spores.
Broomrapes are another type of plant that has no leaves but they doproduce flowers and seeds. These are parasitic plants that obtain all thenutrients they require from the root systems of other plants, upon whichthey grow. For example, the common broomrape has roots that penetratethe root system of clover and daisy plants and draws up food from them.
a Why do saprophytes and parasitic broomrapes not need green leaves?b Oxtongue broomrape is only found in a few sites around the chalk cliffs
of southern England. Oxtongue is a yellow-flowered plant that alsogrows only in southern England.Suggest a reason why the oxtongue broomrape is classified as a veryrare plant in the UK.
Sheet 2 of 2© Harcourt Education Ltd 2004 Catalyst 2This worksheet may have been altered from the original on the CD-ROM.
Hemlock water dropwort
This is a substantial, very poisonous plant that smells strongly of parsley and
is a member of the carrot family. It grows up to 2.5metres tall, in clumps,
near ponds, ditches and other sources of fresh water.
Its stems are hollow for over half their height and both the stems and the
leaves have many very obvious veins. Its leaves are frond-like and are held
away from the main stem on strong, veined stalks.
It forms large seeding heads, up to 100cm across, from July through to
August. Its seeds are contained in a fruit that is covered in spikes.
D-Homework.qxd 29-Oct-03 5:45 PM Page 2

D2 HomeworkA place to live
HELP
1 Link together the following words with their definitions to make threecorrect sentences.
2 The diagram shows a mole. Moles live mostly intunnels underground, eating worms and grubs. Theyhave a very good sense of smell and very pooreyesight. Their whiskers can sense vibrations in thesoil. Moles do come out above ground but thisusually happens after dark.
a Write down two ways in which moles are adaptedto help them live underground.
b i Suggest one way that moles have adapted, which makes it hardfor them to survive above ground.
ii Suggest why this adaptation is not really a problem for moles.
CORE
3 Fish have gills. Tadpoles have gills but, when they turn into frogs, thegills are replaced with lungs. Apple snails, which live in and around ponds,have both gills and lungs. Grass snakes have only lungs.
a Explain why fish and tadpoles must have gills.
b i Explain why frogs and snakes need lungs.ii Frogs mate in the water. The male clings onto the female’s back. What
problem might lungs cause for female frogs during the breeding season?
c What advantage do apple snails have, over fish and frogs, by possessingboth lungs and gills?
d i In what conditions will apple snails survive when fish would die?ii In what conditions would apple snails survive when snakes might die?
Sheet 1 of 2© Harcourt Education Ltd 2004 Catalyst 2This worksheet may have been altered from the original on the CD-ROM.
A habitat
An environment
An ecosystem
is the surroundings, like the air,soil and moisture, in a habitat.
is the habitat together with everything thatit provides and everything that lives in it.
is the place where a plantor an animal lives.
D-Homework.qxd 29-Oct-03 5:45 PM Page 3

D2 HomeworkA place to live (continued)
EXTENSION
4 Banded snails live in woods, hedgerows and grassland. They are all members of thesame species but they have a wide range of shell colours. The tables show the rangeof shell colours found in banded snails. The two columns are not linked to each other.
Banded snails are a favourite food of several types of birds. They break open the shellson stones to get at the snail inside.
The habitats of these snails change throughout the year. Forests are usually fairly darkplaces. Hedgerows are much lighter but the light levels are not constant. The twigsand branches form shadows across the habitat and the colours change from brown togreen during the spring, then back to brown during the autumn. Grassland containsbare patches, green patches and shaded patches that vary throughout the year.
a Suggest reasons why dark coloured snails with no bands are the most commontype found in forests.
b Hedgerows contain mostly snails withbands. There are more of the snails withgreen shells and dark bands eaten in thewinter and more with dark shells andgreen bands eaten in the summer.Suggest why this happens.
c In grassland, there are about equalnumbers of all the possible shell types.Suggest why no one type of shell is aparticular advantage over the whole year.
d Sketch a graph showing the likelynumber of green-shelled snails caught bybirds at different times of the year in ahedgerow. Copy the axes shown here.
Sheet 2 of 2© Harcourt Education Ltd 2004 Catalyst 2This worksheet may have been altered from the original on the CD-ROM.
High
LowSpring SpringSummer Autumn Winter
Num
ber
of g
reen
-she
lled
snai
ls c
augh
t ea
ch d
ay
Basic shell colour
Yellow
Brown
Green
Type of banding
Dark bands on a light coloured shell
Light bands on a dark coloured shell
No bands with a light coloured shell, orNo bands with a dark coloured shell, orOne or two broad bands across the main colour, orSeveral narrow bands across the main colour
D-Homework.qxd 29-Oct-03 5:45 PM Page 4

D3 HomeworkHome alone?
HELP
1 a Copy and complete the following sentences:i In the food web, the
producers are ...ii In the food web, the
consumers are ...iii In the food web, the
carnivores are ...iv The herbivores are ...
b i Write down three of the food chains that you can find in the food web.
ii There is something missing from the beginning of each food chain that is not shown on the food web. What is it?
c What would happen to the number of bluetits if the number ofcaterpillars suddenly decreased?
CORE
2 a In the food web above, one food chain begins with the grass andthen goes to the rabbit.i Draw the shape you would expect for the pyramid of numbers
for this food chain.ii What will always be in the bottom layer of a pyramid of numbers?iii Describe what might happen to the number of foxes if the farmer
ploughs his field and begins to grow plants that rabbits cannoteat.
b i How might the pyramid of numbers for the whole food webchange if there is a drought and the grass does not grow?
ii How and why might this affect the number of owls?iii What might happen to the number of field mice if the number of
caterpillars suddenly decreased?
grass
rabbit fieldmouse
fox
caterpillar
oak leaf
bluetit
owl
Sheet 1 of 2© Harcourt Education Ltd 2004 Catalyst 2This worksheet may have been altered from the original on the CD-ROM.
D-Homework.qxd 29-Oct-03 5:47 PM Page 5

D3 HomeworkHome alone? (continued)
EXTENSION
3 The pyramid of numbers for a blackberry bush, that provides foodfor the insects eaten by a robin, is drawn below.
a What is represented by the bottom layer in the pyramid?
b i In what way is the bottom layer similar to the top layer?ii In what way are the top and bottom layers different?
c How would the pyramid change, if it began from a whole hedgerowof blackberry bushes, rather than a single one?
4 A food chain that can be found in ornamental gardens is shown below:
The rose garden has about one thousand roses in it.
a Draw the pyramid of numbers that you would expect to obtain if youcounted the number of all the members of the food chain. (Hint: you caneasily get over one thousand greenfly on each rose bush!)
b i Bluetits also eat greenfly. What would happen to the pyramid ofnumbers if two or three families of bluetits were feeding theirchicks on greenfly from the rose garden?
ii Greenfly are also affected by cold weather, which they do not survivewell. What would happen to the pyramid of numbers if there was anunseasonable cold spell, lasting for about a week?
c i Some years ago there seemed to be an exceptionally high number ofladybirds. Newspapers reported that the promenade at Skegness wascompletely covered in them. Suggest how the weather, in the monthor so before this event, might have helped to create this massiveincrease in ladybird numbers.
ii After a couple of weeks, the ladybirds seemed to disappear.What could be a reason why they did not survive for longer?
Sheet 2 of 2© Harcourt Education Ltd 2004 Catalyst 2This worksheet may have been altered from the original on the CD-ROM.
Rose plant Greenfly Ladybirds Blackbird
D-Homework.qxd 29-Oct-03 5:47 PM Page 6

D4 HomeworkPopulations
HELP
1 Look at the food chain below.
a What will happen to the population of crabs if the algae begin togrow well and spread out?
b If another predator begins to eat a lot of crabs, what will happento the population of oystercatchers?
c Apart from lack of food, what could be another reason for thepopulation of snails to fall?
2 The graph shows the population of algae,over a twelve-month period, in a harbourin Cornwall.
a Why did the population of algaeincrease between March andSeptember?
b How could this have affected thechances of the oystercatcherssuccessfully rearing their chicks, whichhatch in June?
c When was the population of algae at its lowest?
d When would the population of crabs probably be at its highest?
CORE
3 a Lack of clean water often causes a decrease in the humanpopulation in developing countries. Explain why clean water isso important to these people.
b Blue Peter runs a fund-raising campaign every year. A recentcampaign was to raise money for African villages to build a well.It only costs a few hundred pounds to build a well in Africa.Suggest why it is better to build a well than to treat anywaterborne illnesses with drugs, when they happen.
Sheet 1 of 2© Harcourt Education Ltd 2004 Catalyst 2This worksheet may have been altered from the original on the CD-ROM.
Algae Snails Crabs Oystercatchers
J F M A M J J A S O N D
Month of the year
High
Low
Pop
ulat
ion
of a
lgae
in h
arbo
ur
D-Homework.qxd 29-Oct-03 5:49 PM Page 7

D4 HomeworkPopulations (continued)
4 In Africa, antelope are hunted by many different predators.
a Why is it very important for antelope babies to be able to run withina few hours of being born?
b Why can lion cubs survive, when they need constant care from theirmothers for several weeks after they are born?
c i What would happen to an antelope population if it developed aninherited disease, which meant that the babies could not walk forseveral days after birth?
ii How would such a disease affect predators, such as cheetahs, atfirst and then after a longer time?
EXTENSION
5 The graph shows the relationship between the population of the lynx andthe hare. The data was gathered in Canada between 1845 and 1935.
a Which animal is the predator and which is the prey?
b i Describe how the population of the lynx is related to thepopulation of the hare.
ii Explain why this relationship should occur.
c Explain why the graph for the hare always rises higher than themaximum population of the lynx.
d Explain why the hare population has never completely died out, eventhough the lynx ruthlessly hunts them.
e Between 1905 and 1935, the maximum and minimum numbers ofhare and lynx were more or less the same in each cycle. What doesthis suggest about the climatic conditions during these years?
Sheet 2 of 2© Harcourt Education Ltd 2004 Catalyst 2This worksheet may have been altered from the original on the CD-ROM.
160180
140120100806040200
1925 19351915190518951885YearN
umbe
r of
the
indi
vidu
als
(tho
usan
ds)
1875186518551845
lynxKey
hare
D-Homework.qxd 29-Oct-03 5:49 PM Page 8

D1Homework
mark schemePlant groups
Sheet 1 of 3© Harcourt Education Ltd 2004 Catalyst 2This worksheet may have been altered from the original on the CD-ROM.
HELPQuestion Answer Mark
1 a Missing information is: Have thin, needle-like leaves with veins. 1Ferns 1Leaves have a cuticle and veins. Can grow in all habitats. 1Mosses 1
b Mosses. 1
c Conifers. 1
d Flowering plants can grow in almost any habitat because they have a goodwater transport system and a cuticle. 1Underscores show the pupil response.
Total for Help 7
COREQuestion Answer Mark
2 a A – Flowering plant.B – Moss.C – Conifer.D – Fern. 3All correct = 3 marks. Deduct 1 for each error up to a maximum of 3 marks.
b They have large leafy fronds 1so there is a large surface to catch what sunlight there is 1so they can photosynthesise enough to survive in the shade. 1
Total for Core 6
EXTENSIONQuestion Answer Mark
3 a It contains many obvious veins. 1
b It needs to get water a long way up the stem. 1
c So it can get enough water to supply the leaves. 1
d Reduces the chances of animals eating it. 1
e It produces seeds. 1
f They might catch on animal’s fur 1and be spread over a wide area. 1
4 a They do not need to photosynthesise 1because they get all their food from other plants/material. 1
b The broomrape can only grow where there is oxtongue 1and will only do so if its seeds happen to fall where there is an oxtongue plant 1growing.
Total for Extension 11
D-Homework.qxd 29-Oct-03 5:49 PM Page 9
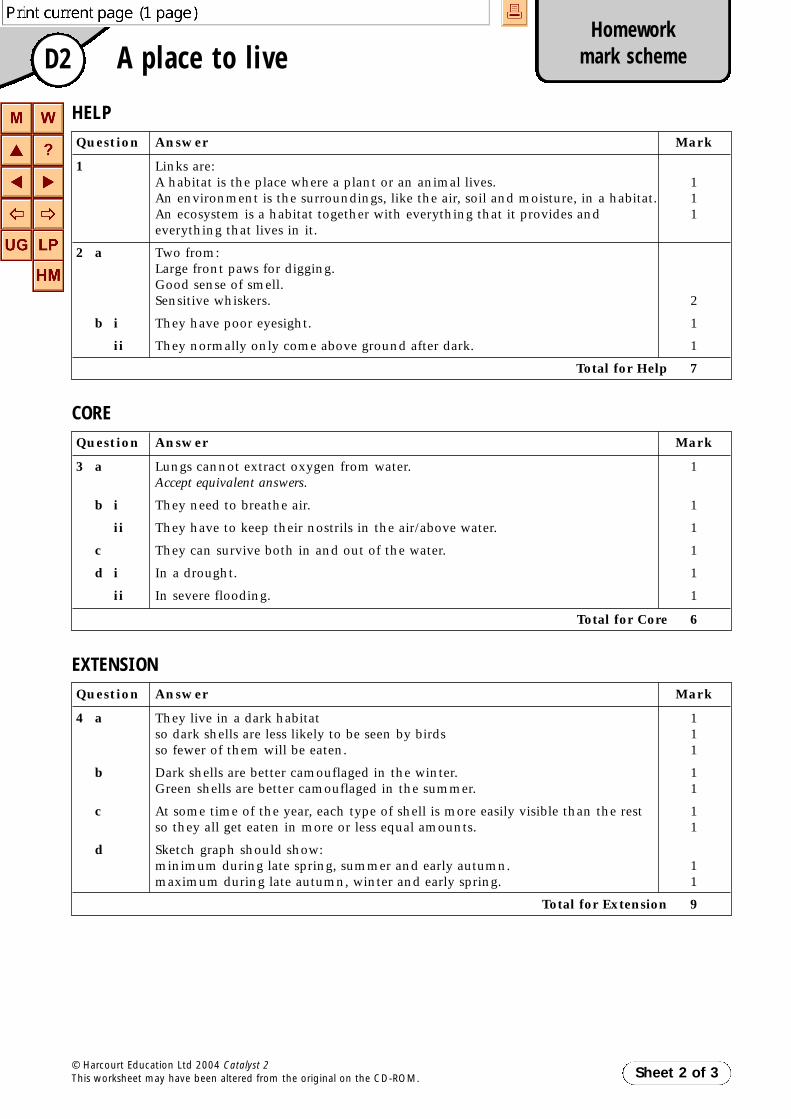
D2Homework
mark schemeA place to live
Sheet 2 of 3© Harcourt Education Ltd 2004 Catalyst 2This worksheet may have been altered from the original on the CD-ROM.
HELPQuestion Answer Mark
1 Links are:A habitat is the place where a plant or an animal lives. 1An environment is the surroundings, like the air, soil and moisture, in a habitat. 1An ecosystem is a habitat together with everything that it provides and 1everything that lives in it.
2 a Two from:Large front paws for digging.Good sense of smell.Sensitive whiskers. 2
b i They have poor eyesight. 1
ii They normally only come above ground after dark. 1
Total for Help 7
COREQuestion Answer Mark
3 a Lungs cannot extract oxygen from water. 1Accept equivalent answers.
b i They need to breathe air. 1
ii They have to keep their nostrils in the air/above water. 1
c They can survive both in and out of the water. 1
d i In a drought. 1
ii In severe flooding. 1
Total for Core 6
EXTENSIONQuestion Answer Mark
4 a They live in a dark habitat 1so dark shells are less likely to be seen by birds 1so fewer of them will be eaten. 1
b Dark shells are better camouflaged in the winter. 1Green shells are better camouflaged in the summer. 1
c At some time of the year, each type of shell is more easily visible than the rest 1so they all get eaten in more or less equal amounts. 1
d Sketch graph should show:minimum during late spring, summer and early autumn. 1maximum during late autumn, winter and early spring. 1
Total for Extension 9
D-Homework.qxd 29-Oct-03 5:49 PM Page 10

D3Homework
mark schemeHome alone?
Sheet 3 of 3© Harcourt Education Ltd 2004 Catalyst 2This worksheet may have been altered from the original on the CD-ROM.
HELPQuestion Answer Mark
1 a i In the food web the producers are grass and an oak leaf. 1Underscores show the pupil response.
ii In the food web the consumers are the rabbit, field mouse, caterpillar, bluetit; 1and the fox and owl. 1
iii In the food web the carnivores are the bluetit; the owl and the fox. 2
iv The herbivores are the rabbit, the field mouse and the caterpillar. 1
b i Three from: Grass → rabbit → fox; Grass → field mouse → fox;Grass → field mouse → owl; Oak leaf → caterpillar → bluetit → owl 3
ii The Sun. 1
c It would go down. 1
Total for Help 11
COREQuestion Answer Mark
2 a i Pyramid must have bottom layer largest then decreasing up the pyramid. 2
ii Producers 1
iii Number will go down. 1
b i All the layers would get narrower. 1
ii There would be fewer owls; as there is less food for them to prey upon. 2
iii It would decrease. 1
Total for Core 8
EXTENSION
Question Answer Mark
3 a A producer/the blackberry bush 1
b i Only contains one organism. 1
ii The bottom one is a much larger organism. 1
c Bottom layer would be much wider. Middle layers would be wider. Top layermight not change at all. One mark for each correct answer. 3
4 a Bottom layer second widest. Second layer up the widest. Third layer upsubstantially narrower than the second layer up. Top layer very narrow. 3Award 3 marks if pupil gives a reasonable representation. Deduct 1 mark foreach major error up to a maximum of 3 marks.
b i The number of greenfly would be less; the number of ladybirds would be less; the top row would be wider; and would be labelled blackbirds and bluetits. 4Accept other equivalent answers.
ii The greenfly row and the ladybirds row would be smaller. 1
c i The weather had been warm; so greenfly had survived in large numbers; providing plenty of food for the ladybirds to develop. One mark for each 3correct answer.
ii They ate so many greenfly that the greenfly numbers dropped suddenly 1leaving the ladybirds with nothing to eat. 1
Total for Extension 19
D-Homework.qxd 29-Oct-03 5:49 PM Page 11

D4Homework
mark schemePopulations
Sheet 4 of 4© Harcourt Education Ltd 2004 Catalyst 2This worksheet may have been altered from the original on the CD-ROM.
HELPQuestion Answer Mark
1 a It will increase. 1
b It will decrease. 1
c They get a disease or another predator eats them as well. 1
2 a Better growing conditions. Accept ‘more light’. 1
b It would improve their chances of success. 1
c In February. 1
d Accept answers between August and October. 1
Total for Help 7
COREQuestion Answer Mark
3 a It helps to prevent waterborne disease from killing them. 1
b Drugs are more expensive 1and will not prevent the problem from returning. 1
4 a So they can escape from predators. 1
b (Fierce) Parents protect them. 1
c i It would decrease. 1
ii Numbers would go up at first 1then decrease as antelope numbers became low. 1
Total for Core 8
EXTENSIONQuestion Answer Mark
5 a Predator = lynx; prey = hare. 1
b i Population of lynx rises just after the population of hares rises. 1
ii More hares means that lynx can feed their offspring better 1so more offspring survive. 1
c Each lynx needs several hares to survive. 1
d Some hares escape or are never found. 1
e They were fairly steady/no major changes in the basic climate. 1Accept other equivalent answers.
Total for Extension 7
D-Homework.qxd 29-Oct-03 5:49 PM Page 12

D Test yourselfEcological relationships
1 Complete the sentences by crossing out the wrong words.
a Conifers are very large/small plants. They do/do not haveflowers and they reproduce using seeds/spores which are foundinside fruits/cones.
b Mosses are very large/small plants. They do/do not haveflowers and they reproduce using seeds/spores. They live indamp/dry places.
c Ferns have leaves called fronds. They do/do not have flowersand they reproduce using seeds/spores. They live in damp/dryplaces.
d Flowering plants reproduce by producing seeds/spores. Theplants are found in many/few types of habitat.
2 Draw lines to join each habitat with the environmental factors youcould measure.
soil grassland river
water acidity wind temperature moisture light oxygenspeed speed
3 Complete these sentences about how organisms are adapted to theirenvironment. Choose from the words below.
a Barnacles themselves to rocks to stop them being
washed away.
b Freshwater shrimps do not get washed away by fast-flowing
rivers because they hide under .
c Plants do not get washed away by water moving because they
have strong .
4 Complete the sentences by crossing out the wrong words.
The population size of daisies in a field can be obtained by using aquadrat/light meter. The number of daisies in a small area isguessed/counted and this number is used to estimate/countthe number of daisies in the whole field.
Sheet 1 of 2© Harcourt Education Ltd 2004 Catalyst 2This worksheet may have been altered from the original on the CD-ROM.
cement roots stones muscles
Test-Qust.qxd 22-Oct-03 3:57 PM Page 7

D Test yourselfEcological relationships (continued)
5 a Name three resources that all living things compete for.
1 2 3
b Explain how these resources can affect the number of organisms
within a single population.
c Name a non-environmental factor that can also affect population size.
6 Look at the food web.
a Name:
i a producer
ii a primary consumer
iii a secondary consumer.
b What happens to the numberof organisms as you go alongany food chain in the food web?Underline the correct answer:
increases decreases stays the same.
c If one organism is removed from afood web, what will happen to
i the number of organisms before it?
ii the number of organisms after it?
7 Match each food chain to the best pyramid of numbers by writing A or Bnext to the correct pyramid.
A lettuce (1000), rabbits (100), fox (1)B rose bush (1), greenfly (10 000), bluetits (2)
Sheet 2 of 2© Harcourt Education Ltd 2004 Catalyst 2This worksheet may have been altered from the original on the CD-ROM.
bird
greenfly
grass
snail
lettuce
beetle
slug
hedgehog
Test-Qust.qxd 22-Oct-03 3:58 PM Page 8

DTest yourself
AnswersEcological relationships
1 Complete the sentences by crossing out the wrong words.
a Conifers are very large/small plants. They do/do not haveflowers and they reproduce using seeds/spores which arefound inside fruits/cones.
b Mosses are very large/small plants. They do/do not haveflowers and they reproduce using seeds/spores. They live indamp/dry places.
c Ferns have leaves called fronds. They do/do not have flowersand they reproduce using seeds/spores. They live indamp/dry places.
d Flowering plants reproduce by producing seeds/spores. Theplants are found in many/few types of habitat.
2 Draw lines to join each habitat with the environmental factors youcould measure.
soil grassland river
water acidity wind temperature moisture light oxygenspeed speed
3 Complete these sentences about how organisms are adapted totheir environment. Choose from the words below.
a Barnacles themselves to rocks to stop them being
washed away.
b Freshwater shrimps do not get washed away by fast-flowing
rivers because they hide under .
c Plants do not get washed away by water moving because they
have strong .
4 Complete the sentences by crossing out the wrong words.
The population size of daisies in a field can be obtained by using aquadrat/light meter. The number of daisies in a small area isguessed/counted and this number is used to estimate/countthe number of daisies in the whole field.
roots
stones
cement
Sheet 1 of 2© Harcourt Education Ltd 2004 Catalyst 2This worksheet may have been altered from the original on the CD-ROM.
cement roots stones muscles
Test-Ans.qxd 22-Oct-03 4:02 PM Page 7

DTest yourself
AnswersEcological relationships (continued)
5 a Name three resources that all living things compete for.
1 2 3
b Explain how these resources can affect the number of organisms
within a single population.
c Name a non-environmental factor that can also affect population size.
6 Look at the food web.
a Name:
i a producer
ii a primary consumer
iii a secondary consumer.
b What happens to the numberof organisms as you go alongany food chain in the food web?Underline the correct answer:
increases decreasesstays the same.
c If one organism is removed from afood web, what will happen to
i the number of organisms before it?
ii the number of organisms after it?
7 Match each food chain to the best pyramid of numbers by writing A or Bnext to the correct pyramid.
A lettuce (1000), rabbits (100), fox (1)B rose bush (1), greenfly (10 000), bluetits (2)
B
A
decreases
increases
bird/hedgehog
greenfly/snail/beetle/slug
grass/lettuce
predators/disease (or other acceptable answer)
organisms to survive and reproduce.
Each factor can affect the ability of the
spacewaterfood
Sheet 2 of 2© Harcourt Education Ltd 2004 Catalyst 2This worksheet may have been altered from the original on the CD-ROM.
bird
greenfly
grass
snail
lettuce
beetle
slug
hedgehog
Test-Ans.qxd 22-Oct-03 4:03 PM Page 8

DEnd of unit test
GreenEcological relationships
1 The drawing shows leaves from different plants. Choose a leaf to match each description of an adaptation below. 3 marks
Adaptations
a has a small surface area to avoid loss of water
b has a large surface area to get as much sunlight as possible in a shady wood
c an evergreen plant which prevents its leaves from being eaten by animals
2 The staff at a garden centre want to have display areas for different kinds of plant. They decide to put the following four types of plant in four different areas:
To help them identify the different types, write out the correct type of plant for each description below. 4 marks
Descriptions
a reproduces using flowers b produces seeds inside cones
c has fronds and lives in damp places d tiny plants with no veins and no flowers
3 Bobby collected some organisms from ahabitat on a field trip. He placed them in two warm, dry specimen dishes and leftthem overnight.
The bottom two diagrams show what he found the next day.
From Bobby’s organisms:
a name one predator 1 mark
b name one prey. 1 mark
A B Coneleaf
Sheet 1 of 4© Harcourt Education Ltd 2004 Catalyst 2This worksheet may have been altered from the original on the CD-ROM.
woodlousecentipede
worm
centipede
beetle
wormdead
centipededead
woodlousegone
woodlousegone
mosses conifers flowering plantsferns
D-F-EUTest.qxd 25-Nov-03 8:43 AM Page 1

DEnd of unit test
GreenEcological relationships (continued)
In total he found:
● 30 woodlice ● 5 worms ● 2 centipedes ● 2 beetles.
c Which organism do you think the conditions in the habitat are best suited to? 1 mark
d What is the evidence for your answer to part c? 1 mark
e The next day some worms that had been left in a separate specimen dish were found dead. Why do you think this was? 1 mark
4 Jane studied the following habitats.
She collected the following three specimens, but forgot to record where she collected them from:
A shade-loving plant
B low plant adapted to windy conditions
C invertebrate that needs fresh water with high levels of oxygen.
For each specimen, state which habitat you think Jane collected it from. 3 marks
sea shore
stream
wood
moorland
field
pond
Sheet 2 of 4© Harcourt Education Ltd 2004 Catalyst 2This worksheet may have been altered from the original on the CD-ROM.
D-F-EUTest.qxd 25-Nov-03 8:44 AM Page 2

DEnd of unit test
GreenEcological relationships (continued)
5 The diagrams below show three pyramids of number. The sizes of theboxes in the pyramids represent the number of living things in a foodchain. Match each pyramid to a food chain. 3 marks
a seaweed → mussels → crabs
b oak tree → caterpillars → thrushes → foxes
c oak tree → caterpillars → robins → fleas
6 Reshma drew the following food web after studying a field.
Using only the information in the diagram, explain with reasons what will happen to:
a the number of butterflies, if more blackbirds are killed by foxes 1 mark
b the number of hawks, if more frogs are killed by a farmer’s pesticide. 1 mark
blackbird
butterfly
flower
ladybird
greenfly
hawk
frog shrew
worm
dead leaves
fox
A B C
Sheet 3 of 4© Harcourt Education Ltd 2004 Catalyst 2This worksheet may have been altered from the original on the CD-ROM.
D-F-EUTest.qxd 25-Nov-03 8:45 AM Page 3

DEnd of unit test
GreenEcological relationships (continued)
7 Colin and Jenny are investigating how many dandelions there are on the school field. They have to decide on the best method to count them. They could either count every dandelion on the field or use a quadrat to make random samples.
a Why did Colin and Jenny decide not to count every dandelion in the field? 1 mark
b Using the quadrat how could they make sure the samples were random? 1 mark
Here is a table of their results:
The field covers 5000 m2. The sample covered an area of 10 m2.
c The ratio of the sample area to the whole field is 1:500. If Colin and Jenny counted 40 dandelions in their sample how many dandelions might there be in the whole field? 1 mark
d Why is this unlikely to be the exact number of dandelions in the field? 1 mark
e How could they make their results more reliable? Choose one 1 markfrom the following list:
Sheet 4 of 4© Harcourt Education Ltd 2004 Catalyst 2This worksheet may have been altered from the original on the CD-ROM.
Throw number Number of dandelion plants
1 8
2 0
3 3
4 4
5 7
6 4
7 3
8 6
9 1
10 4
use a bigger quadrat throw more quadrats
use a tape measure
repeat each throw
D-F-EUTest.qxd 25-Nov-03 8:45 AM Page 4
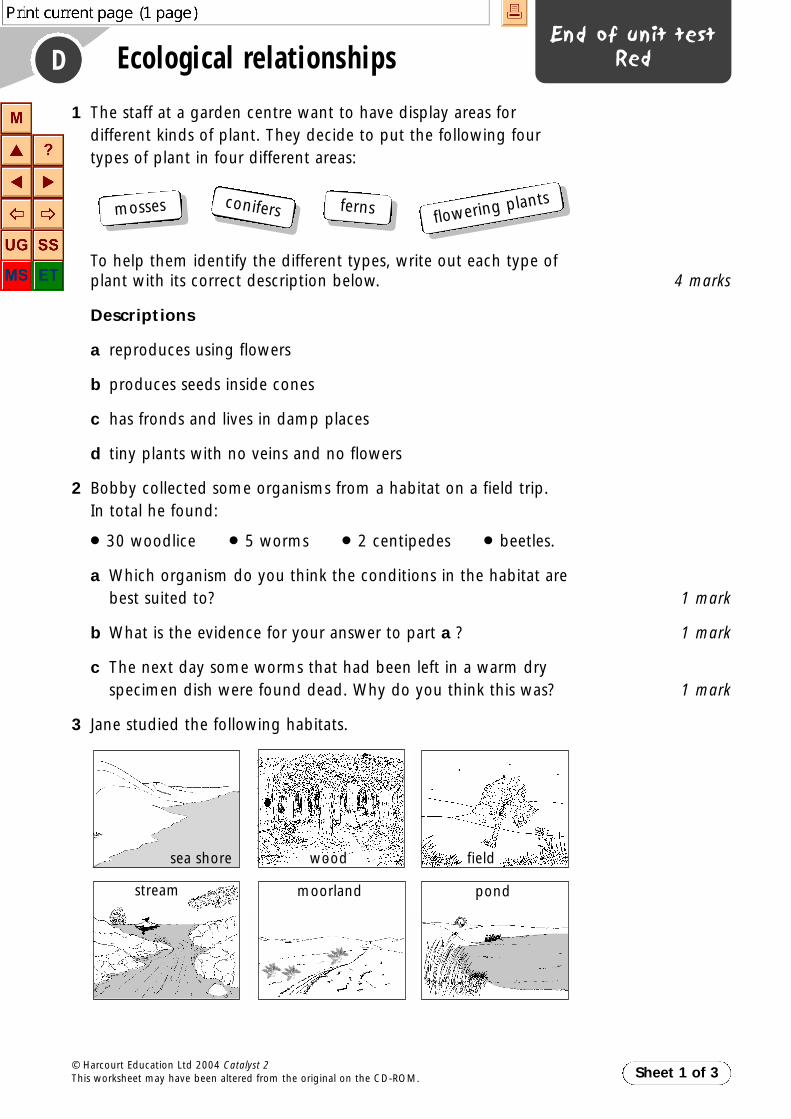
DEnd of unit test
RedEcological relationships
1 The staff at a garden centre want to have display areas for different kinds of plant. They decide to put the following four types of plant in four different areas:
To help them identify the different types, write out each type of plant with its correct description below. 4 marks
Descriptions
a reproduces using flowers
b produces seeds inside cones
c has fronds and lives in damp places
d tiny plants with no veins and no flowers
2 Bobby collected some organisms from a habitat on a field trip. In total he found:
● 30 woodlice ● 5 worms ● 2 centipedes ● beetles.
a Which organism do you think the conditions in the habitat are best suited to? 1 mark
b What is the evidence for your answer to part a ? 1 mark
c The next day some worms that had been left in a warm dry specimen dish were found dead. Why do you think this was? 1 mark
3 Jane studied the following habitats.
sea shore
stream
wood
moorland
field
pond
Sheet 1 of 3© Harcourt Education Ltd 2004 Catalyst 2This worksheet may have been altered from the original on the CD-ROM.
mosses conifers flowering plantsferns
D-F-EUTest.qxd 25-Nov-03 8:46 AM Page 5

DEnd of unit test
RedEcological relationships (continued)
She collected the following three specimens, but forgot to record where she collected them from:
A shade-loving plant
B low plant adapted to windy conditions
C invertebrate that needs water with high levels of oxygen.
For each specimen, state which habitat you think Jane collected it from. 3 marks
4 Mountain hares have fur which turns from brown to white in the winter. Brown hares have brown fur all the time. Both mountain hares and brown hares live in the hills of Derbyshire. It only occasionally snows in Derbyshire. The mountains of Scotland are home to many more mountain hares than Derbyshire. Mountain hares eat heather, which grows in mountainous areas. Brown hares mostly eat grass, which grows on low hills.
a What adaptation does the mountain hare have that helps itsurvive the winter? 1 mark
b Why does this help it survive in mountainous areas? 1 mark
c Explain why this adaptation does not help the mountain hare in Derbyshire. 1 mark
d Give one reason why there are many more mountain hares in Scotland than in Derbyshire. 1 mark
5 Reshma drew the following food web after studying a field.
blackbird
butterfly
flower
ladybird
greenfly
hawk
frog shrew
worm
dead leaves
fox
Sheet 2 of 3© Harcourt Education Ltd 2004 Catalyst 2This worksheet may have been altered from the original on the CD-ROM.
D-F-EUTest.qxd 25-Nov-03 8:46 AM Page 6

DEnd of unit test
RedEcological relationships (continued)
a Using only the information in the diagram, explain with reasons what will happen to:i the number of butterflies, if more blackbirds are killed by foxes 1 markii the number of hawks, if more frogs are killed by a farmer’s pesticide 1 markiii the number of hawks, if the number of blackbirds increases 1 markiv the number of foxes, if the number of frogs increases. 1 mark
b Reshma drew a pyramid of numbers for part of the food web.
Explain with reasons why the box for the flower is narrower than the box for greenfly. 2 marks
6 Colin and Jenny are investigating how many dandelions there are on the school field.They have to decide on the best method to count them. They could either count everydandelion on the field or use a quadrat to make random samples.
The table shows their results.
The field covers 5000 m2. The sample coveredan area of 10 m2.
a The ratio of the sample area to the whole field is 1:500. If they counted 40 dandelions in theirsample how many dandelions might there bein the whole field? 1 mark
b Why is this unlikely to be the exact numberof dandelions in the field? 1 mark
c How could they make their results more reliable?Choose one from this list: 1 mark
Colin says that they should count the yellow dandelion flowers. Jenny says they should count the plants, as most dandelion plants have more than one flower.
d What effect would Colin’s idea have on their results? 1 mark
e Jenny says that if Colin did this, any conclusions she drew would be more reliable than Colin’s. Why can she say this? 1 mark
Sheet 3 of 3© Harcourt Education Ltd 2004 Catalyst 2This worksheet may have been altered from the original on the CD-ROM.
ladybirds
greenfly
flower
use a bigger quadrat throw more quadrats
use a tape measure repeat each throw
Throw Number ofnumber dandelion plants
1 8
2 0
3 3
4 4
5 7
6 4
7 3
8 6
9 1
10 4
D-F-EUTest.qxd 25-Nov-03 8:46 AM Page 7

DEnd of unit test
mark schemeEcological relationships
Sheet 1 of 1© Harcourt Education Ltd 2004 Catalyst 2This worksheet may have been altered from the original on the CD-ROM.
Green (NC Tier 3–6)Question Answer Mark Level
1 a C 1 3
b B 1 3
c A 1 3
2 a Flowering plants 1 4
b Conifers 1 4
c Ferns 1 5
d Mosses 1 5
3 a Any one from: 1 4BeetleCentipede
b Woodlouse 1 4
c Woodlice 1 5
d It is the most abundant organism. 1 5
e Any one from: 1 5The conditions were too dry in the dish or there was no water.There was nothing for the worms to eat.
4 A wood 1 5
B moorland 1 5
C stream 1 5
5 a C 1 5
b A 1 5
c B 1 5
6 a There will be more butterflies because fewer of them will be eaten by blackbirds. 1 6
b There will be fewer hawks because there will be fewer frogs as food for hawks. 1 6
7 a Would take too long. 1 4
b Throw the quadrat over the shoulder without looking. 1 4
c 40 dandelions × 500 = 20 000 1 5
d It is an estimate based on a sample. 1 5
e Throw more quadrats. 1 5
Scores in the range of: NC Level
4–7 3
8–13 4
14–17 5
18–25 6
D-F-EUTest.qxd 25-Nov-03 8:46 AM Page 8

DEnd of unit test
mark schemeEcological relationships
Sheet 1 of 1© Harcourt Education Ltd 2004 Catalyst 2This worksheet may have been altered from the original on the CD-ROM.
Red (NC Tier 4–7)Question Answer Mark Level
1 a Flowering plants 1 4
b Conifers 1 4
c Ferns 1 5
d Mosses 1 5
2 a Woodlice 1 5
b It is the most abundant organism. 1 5
c Any one from: The conditions were too dry in the dish or there was 1 5no water. There was nothing for the worms to eat.
3 A wood B moorland C stream 3 5
4 a It changes its fur colour from brown to white. 1 5
b White camouflages it against the snow. 1 5
c It doesn’t snow very often in Derbyshire. 1 6
d Any one from: There is more heather to eat in the mountains. 1 6The mountain hare is better adapted to the snow in the mountains.
5 a i There will be more butterflies because fewer will be eaten by blackbirds. 1 6
ii There will be fewer hawks because there will be fewer frogs as food for hawks. 1 6
iii There will be fewer hawks because more butterflies will be eaten, so there will be less food for frogs, and fewer frogs for hawks to eat. 1 6
iv There will be fewer foxes because more frogs will eat more worms, leaving fewer worms for shrews, so there will be fewer shrews as food for foxes. 1 6
b There are more greenfly than flowers because a flower is large andgreenfly are much smaller 1 7therefore one large flower can support many smaller greenfly. 1 7
6 a 40 dandelions × 500 = 20 000 1 5
b It is an estimate based on a sample. 1 5
c Throw more quadrats. 1 5
d Make the estimate too high. 1 6
e Jenny’s results are more reliable. 1 6
Scores in the range of: NC Level
4–9 4
10–14 5
15–18 6
19–25 7
D-F-EUTest.qxd 25-Nov-03 8:46 AM Page 9

D Pupil checklistEcological relationships
Sheet 1 of 1© Harcourt Education Ltd 2004 Catalyst 2This worksheet may have been altered from the original on the CD-ROM.
Learning outcomes I can do I can do I need to this very this quite do more well well work on this
I can classify some plants into theirgroups.
I can explain why some organisms arefound in particular environments.
I can explain how some organisms areadapted to a habitat.
I can use a food web to describe feedingrelationships.
I can explain what a pyramid of numbershows.
I can explain how decomposers recyclewaste and dead bodies.
I can predict how changing the size ofone population will affect other membersof a food web.
I can carry out random sampling.
I can compare the conditions in twohabitats.
I can identify organisms likely to be foundin a habitat.
I can draw food webs and pyramids ofnumber.
Pupil checklist.qxd 12-Nov-03 8:56 AM Page 4

D GlossaryEcological relationships
Sheet 1 of 2© Harcourt Education Ltd 2004 Catalyst 2This worksheet may have been altered from the original on the CD-ROM.
Word
adaptations
competition
cones
conifers
cuticle
datalogger R
decomposer
ecosystem
environment
ferns
flowering plants
food chain
food web
fronds
habitat
interdependent
mosses
pond dipping
population
predation R
pyramid of numbers
quadrat
random samples
ratio
reproduce
spores
Definition
To make more organisms of the same species.
Structures used for reproduction in mosses and ferns.
A waterproof layer on the surface of some leaves.
In plants – tube-like structures that carries water, mineralsalts and food around the plant.
Having veins. R
Plants that reproduce from seeds made in flowers and havevarious shapes of leaf.
Plants that reproduce from seeds in cones and have thin,needle-like leaves.
In plants – structures that contain the seeds in conifers.
Plants that reproduce from spores and have leaves calledfronds.
The large tough leaves of ferns.
Small plants that look like a springy cushion. They reproducefrom spores and have very small leaves.
A place where an organism lives, that provides all the thingsthe organism needs to carry out the life processes.
The surroundings in a habitat.
An area such as a forest or a pond, including all the livingthings in it and also its soil, air and climate.
Having features that help a living thing to survive in aparticular place.
Equipment with sensors to measure different variables overtime, e.g. temperature. R
A technique to find out what organisms live in different partsof a pond.
A diagram that shows how the organisms in an ecosystemfeed on each other.
A drawing of the number of organisms at each level ofa food chain.
Glossary.qxd 12-Nov-03 8:24 AM Page 8

D GlossaryEcological relationships (continued)
Sheet 2 of 2© Harcourt Education Ltd 2004 Catalyst 2This worksheet may have been altered from the original on the CD-ROM.
Word
vascular R
veins
Definition
Lots of food chains linked together to show the feedingrelationships in an ecosystem.
An organism that feeds on the dead bodies of plants andanimals.
The number of organisms of a particular species living in ahabitat.
The struggle between organisms in a habitat for scarceresources, e.g. food, water, space.
The hunting of a prey animal by another animal(a predator). R
Dependent on each other.
A way of showing a scale factor. For example, a scale of 1:10means you have to multiply your number or measurementby 10 to get the real measurement.
Taking samples from different places without choosing theplaces deliberately.
A square wooden frame measuring one metre on all foursides.
Glossary.qxd 12-Nov-03 8:24 AM Page 9

D Key wordsEcological relationships
adaptations
competition
cones
conifers
cuticle
datalogger R
decomposer
ecosystem
environment
ferns
flowering plants
food chain
food web
fronds
habitat
interdependent
mosses
pond dipping
population
predation R
pyramid of numbers
quadrat
random samples
ratio
reproduce
spores
vascular R
veins
adaptations
competition
cones
conifers
cuticle
datalogger R
decomposer
ecosystem
environment
ferns
flowering plants
food chain
food web
fronds
habitat
interdependent
mosses
pond dipping
population
predation R
pyramid of numbers
quadrat
random samples
ratio
reproduce
spores
vascular R
veins
Sheet 1 of 1
Sheet 1 of 1
© Harcourt Education Ltd 2004 Catalyst 2This worksheet may have been altered from the original on the CD-ROM.
Key wordsD Ecological relationships
© Harcourt Education Ltd 2004 Catalyst 2This worksheet may have been altered from the original on the CD-ROM.
Keywords.qxd 12-Nov-03 8:28 AM Page 4

Sheet 1 of 3© Harcourt Education Ltd 2004 Catalyst 2This worksheet may have been altered from the original on the CD-ROM.
D Book answersEcological relationships
D1 Plant groupsGreena Flowers attract insects to pollinate them. After
this the seeds are formed and are held in theseed case.
b Mosses grow better in damp places.c i Left to right: flowering plants, conifers,
mosses, fernsii
1 The flowering plants are the only group ofplants that have flowers. Like the conifers,they reproduce by making seeds. The mossesdry out easily and so are found in wet places.
2 A coniferous forest.3 Flowering plants. They are the largest group and
can grow in dry climates where other plantswould fail.
Reda Efficient systems for reproduction and water
transport mean that flowering plants can growin a wide variety of habitats. They can grow indry places where many other plants would die.
b i mossesii ferns
iii conifersiv Flowering plants.
1 Mosses grow well in damp places. They woulddry out in the middle of a field.
2 a Ferns and mosses reproduce by making small,light spores.
b Ferns and mosses make spores forreproduction. Flowering plants and conifersreproduce by making seeds.
3 a The pollen from conifers can travel longdistances to pollinate other trees. Floweringplants depend on insects to move pollen toother flowers.
b Much of the pollen blown by the wind fallson the ground and on water instead ofpollinating other trees.
4 A coniferous forest. Conifers can live in verycold, frozen climates.
5 See the Green book, page 37, for a key based onhow plants reproduce. The following key isbased on vascular and non-vascular plants.
D2 A place to liveGreena Temperature range, wet or dry, light or dark.b They investigated what organisms could live in
different parts of the pond.c They have a red substance in their blood that
joins with oxygen.d Barnacles cement themselves to rocks so they
are not washed away.1 The air is polluted with dust and engine
emissions. The temperatures vary greatly fromfreezing to very hot. There is very little food foranimals except what visitors give them. There isvery little space for animals because there aremany people, cars and lorries.
2 habitat – Place where a plant or animal lives.adaptation – Plants and animals having featuresthat help them to survive.ecosystem – Area with living things togetherwith the soil, air and climate.
3 Individual answers.
Reda Individual answers.b They might have measured the temperature of
the water at different places in the pond. Theymight have measured how light or dark it was atdifferent places around the pond.
c They wanted to find out how the animals livingon the rocky shore were adapted to survive theforce of the waves when the tide comes in.
1 The air is polluted with dust and engineemissions. The temperatures vary greatly fromfreezing to very hot. There is very little food foranimals except what visitors give them. There isvery little space for animals because there aremany people, cars and lorries.
2 a A frog needs a habitat where it is always wet.A woodpecker needs to be able to fly in theair. The frog could not live in air alone. Thewoodpecker would drown in water.
b Being able to sense vibrations so that it cantell when a bird is walking on the groundabove it.
3 They help by planting trees and bushes.
plants
havecones
haveflowers
smallleaves
have no veins have veins totransport water
floweringplants
conifers ferns mosses
largeleavesplants
havecones
haveflowers
smallleaves
have no veins have veins totransport water
floweringplants
conifers ferns mosses
largeleaves
Book Answers.qxd 25-Nov-03 8:40 AM Page 10

Sheet 2 of 3© Harcourt Education Ltd 2004 Catalyst 2This worksheet may have been altered from the original on the CD-ROM.
D Book answersEcological relationships (continued)
D3 Home alone?Greena Any one of: seals, seagulls, large fish, octopusb i seaweed
ii musselsiii crab
c They get fewer.d four
seaweed → winkle → crab → sealseaweed → winkle → crab → seagullseaweed → mussel → crab → sealseaweed → mussel → crab → seagull
e i The crab population would decrease.ii The winkle population would increase.
1 A food web has lots of food chains linkedtogether. If you count the number oforganisms, producers and consumers in afood chain, you can build a pyramid. Thenumber of consumers decreases as you go upthe pyramid.
2 The chain has to start with a producer or elsethere would be no food for the consumersfurther up the chain.
3 Bacteria and fungi feed on the waste productsand dead bodies of plants and animals. Theybreak them down to useful nutrients that plantsneed.
Reda i seaweed
ii musselsiii crab
b The oak tree is so large that it can support manyconsumers on the pyramid level above it.
c four plant plankton → animal plankton →pilchard → humanplant plankton → animal plankton →herring → humanplant plankton → mussel → crab → humanplant plankton → mussel → human
d Humans who eat mussels reduce the number ofmussels available for crabs, so the number ofcrabs will decline. By reducing the number ofmussels in the web, there will be more plantplankton available for the animal plankton toconsume. This in turn causes the herring andpilchard numbers to increase.
1 a Individual answers.b Individual answers.
2 The chain has to start with a producer or elsethere would be no food for the consumersfurther up the chain.
3 The number of deer increased.
4 Bacteria and fungi that break down dead bodiesof plants and animals are called decomposers.They are important as they put nutrients intothe soil for plants to grow.
D4 PopulationsGreena Grass and seeds of the zetta plant, water and dry
vegetation.b There was not enough food because of the great
increase in the number of gimbuls.c gimbulsd wookse After 25 weeks.f the predators, lack of enough food, increase in
the number of gimbuls, disease1 The size of a population is affected by
competition. Animals compete for theresources they need, such as food, water andspace.
2 a The luhans only come out at night becausetheir skin is very sensitive to light.
b Because there were so many gimbuls.c The number of luhans will decrease.
Reda i The gimbul population decreased because
they became the main food supply for thewook.
ii The weaker gimbuls became easy prey forthe wook.
iii The wook population decreased.b
c Appropriate labelling of the graph: populationgrowth fast – between weeks 15 and 20;population growth begins to slow down –between weeks 20 and 25; number of gimbulsbeing born equals the number of gimbulsdying – between weeks 35 and 40.
1 Too large a population for the food available willcause a decrease in the population; too littlespace for a given population will cause a decreasein the population; too little water for a givenpopulation will cause the population to decrease.
Time in weeks
Numberof
gimbuls
Number of gimbulsbeing born equals thenumber of gimbuls dying.
Population growth begins to slowdown.Population
growth fast.
25 30 35 40201510500
20
40
60
80
100
Book Answers.qxd 25-Nov-03 8:40 AM Page 11

Sheet 3 of 3© Harcourt Education Ltd 2004 Catalyst 2This worksheet may have been altered from the original on the CD-ROM.
D Book answersEcological relationships (continued)
2 a Gimbuls are prey.b Wook are predators.
3 The gimbuls feed on grass and the seeds of thered zetta plant. They drink water from puddles.
4 The luhans only come out at night because theirskin is very sensitive to light.
5 There were so many gimbuls that they becamethe main food for the wook. There weren’tenough resources – food, water and space – tosupport the greatly increased gimbulpopulation.
6 Individual answers.7 grass and seeds → gimbul → wook → luhan
D5 Special daisiesGreena 22.5mm (accept between 22mm and 23mm).b 22.5m (accept between 22m and 23m).c It would take too long.d So that she wouldn’t be influenced by what she
saw. She wanted her throw to be random.e 3600f No. This is an approximate number.
1 a Not very accurate.b Throw the quadrat more times. Take more
samples. Include the area near the riverwhere there are moist conditions and wherethe special daisies like to grow.
Reda 22.5mm (accept between 22mm and 23mm).b 22.5m (accept between 22m and 23m).c It would take too long.d She threw the quadrat over her shoulder
without looking where it would land.e 10 square metres.f 3600g No. This is an approximate number.h 16i 20:4000 or 2:400 or 1:200.j 32001 a Not very accurate.
b Throw the quadrat more times. Take moresamples. Include the area near the riverwhere there are moist conditions and wherethe special daisies like to grow.
2 No. You would have to know what theoccurrence of the plant was in all of the country.
Book Answers.qxd 25-Nov-03 8:40 AM Page 12