czech technical university in prague - cvut.cz · a tool in matlab supporting evaluation according...
TRANSCRIPT

CZECH TECHNICAL UNIVERSITY IN PRAGUE
Faculty of Electrical Engineering
Department of Cybernetics
Prague
Daily activity monitoring using a device with accelerometers
Master’s Thesis
Study Programme: Biomedical Engineering and Informatics
Branch of study: Biomedical Engineering
Thesis advisor: Ing. Jaromír Doležal Ph.D.
Bc. Barbora Farkašová


Czech Technical University in Prague Faculty of Electrical Engineering
Department of Cybernetics
DIPLOMA THESIS ASSIGNMENT
Student: Bc. Barbora F a r k a š o v á
Study programme: Biomedical Engineering and Informatics
Specialisation: Biomedical Engineering
Title of Diploma Thesis: Daily Activity Monitoring Using a Device with Accelerometers
Guidelines: 1. Perform literature and existing device research with respect to various wearable device positioning. 2. Propose suitable solutions of measuring wearable device positioning. 3. Design suitable experiments and an experimental protocol to verify individual solutions of measuring wearable device positioning. 4. Assemble measuring board, conduct experiments for selected variants and analyze measured data. 5. Compare achieved results and interpret individual solutions of measuring wearable device positioning usability.
Bibliography/Sources: [1] BRAVO, J., CHEN, L., NUGENT, C., PECCHIA, L.: Ambient Assisted Living and Daily Activities: 6th International Work-Conference, IWAAL 2014, Belfast, UK, December 2-5, 2014, Proceedings. New York: Springer International Publishing, 2014. ISBN 978-3-319-13104-7. [2] FREEDLAND, K., JENNINGS, J.R., LLABRE, M.M., MANUCK, S.B., STEPTOE, A., SUSMAN, E.J.: Handbook of Behavioral Medicine: Methods and Applications. New York: Springer International Publishing, 2010. ISBN 978-0-387-09487-8. [3] GUTMAN, G., SIXSMITH, A.: Technologies for Active Aging. New York: Springer International Publishing, 2013. ISBN 978-1-4419-8347-3. [4] LAAKE, Petter, Haakon Breien BENESTAD a Bjørn Reino OLSEN: Research methodology in the medical and biological sciences. Boston: Elsevier/AP, c2007. ISBN 978-0-12-373874-5. [5] LUQUE, A., NIHTIANOV, S.: Smart Sensors and MEMS: Intelligent Devices and Microsystems for Industrial Applications. Cambridge: Woodhead Publishing Limited, 2014. ISBN 978-0-85709-502-2. Diploma Thesis Supervisor: Ing. Jaromír Doležal, Ph.D.
Valid until: the end of the summer semester of academic year 2015/2016
L.S.
doc. Dr. Ing. Jan Kybic Head of Department
prof. Ing. Pavel Ripka, CSc. Dean
Prague, February 25, 2015


České vysoké učení technické v Praze Fakulta elektrotechnická
Katedra kybernetiky
ZADÁNÍ DIPLOMOVÉ PRÁCE
Student: Bc. Barbora F a r k a š o v á
Studijní program: Biomedicínské inženýrství a informatika (magisterský)
Obor: Biomedicínské inženýrství
Název tématu: Monitorování denní aktivity pomocí zařízení s akcelerometry
Pokyny pro vypracování: 1. Proveďte rešerši literatury a existujících zařízení se zaměřením na různé umístění nositelného zařízení. 2. Navrhněte vhodné varianty umístění nositelného měřicího zařízení. 3. Navrhněte vhodné typy experimentu a experimentální protokol pro ověření užitečnosti jednotlivých variant umístění nositelného měřicího zařízení. 4. Sestavte měřící přípravek, proveďte experimenty pro vybrané varianty a analyzujte naměřená data. 5. Srovnejte dosažené výsledky a vyhodnoťte vhodnost jednotlivých variant řešení. Seznam odborné literatury: [1] BRAVO, J., CHEN, L., NUGENT, C., PECCHIA, L.: Ambient Assisted Living and Daily Activities: 6th International Work-Conference, IWAAL 2014, Belfast, UK, December 2-5, 2014, Proceedings. New York: Springer International Publishing, 2014. ISBN 978-3-319-13104-7. [2] FREEDLAND, K., JENNINGS, J.R., LLABRE, M.M., MANUCK, S.B., STEPTOE, A., SUSMAN, E.J.: Handbook of Behavioral Medicine: Methods and Applications. New York: Springer International Publishing, 2010. ISBN 978-0-387-09487-8. [3] GUTMAN, G., SIXSMITH, A.: Technologies for Active Aging. New York: Springer International Publishing, 2013. ISBN 978-1-4419-8347-3. [4] LAAKE, Petter, Haakon Breien BENESTAD a Bjørn Reino OLSEN: Research methodology in the medical and biological sciences. Boston: Elsevier/AP, c2007. ISBN 978-0-12-373874-5. [5] LUQUE, A., NIHTIANOV, S.: Smart Sensors and MEMS: Intelligent Devices and Microsystems for Industrial Applications. Cambridge: Woodhead Publishing Limited, 2014. ISBN 978-0-85709-502-2.
Vedoucí diplomové práce: Ing. Jaromír Doležal, Ph.D.
Platnost zadání: do konce letního semestru 2015/2016
L.S.
doc. Dr. Ing. Jan Kybic vedoucí katedry
prof. Ing. Pavel Ripka, CSc. děkan
V Praze dne 25. 2. 2015


STATUTARY DECLARATION, PROHLÁŠENÍ AUTORA PRÁCE
STATUTORY DECLARATION
I declare that I have developed and written the enclosed Master Thesis completely by
myself, and I quoted all sources in accordance to Methodological guideline of adherence
to ethical principles in the preparation of university theses.
In Prague ……………………………. ………………………………………………………….
Signature of author
PROHLÁŠENÍ AUTORA PRÁCE
Prohlašuji, že jsem předloženou práci vypracovala samostatně a že jsem uvedla veškeré
použité informační zdroje v souladu s Metodickým pokynem o dodržování etických
principů při přípravě vysokoškolských závěrečných prací.
V Praze dne ……………………………. ………………………………………………………….
Podpis autora práce

Daily activity monitoring using a device with accelerometers

ACKNOWLEDGMENTS
ACKNOWLEDGMENTS
Foremost, I would like to express my sincere gratitude to my advisor Ing. Jaromír Doležal
Ph.D. for the continuous support of my master thesis, for his motivation, enthusiasm,
knowledge, patience and confidence in me.
Besides my advisor, I would like to thank Ing. Jan Havlík, Ph.D. for his insightful comments.
Last but not the least, I would like to thank my family for their encouragement, care and
willingness to participate on my experiments.

Daily activity monitoring using a device with accelerometers
11 TABLE OF CONTENTS
TABLE OF CONTENTS
STATUTORY DECLARATION ................................................................................................... 7
PROHLÁŠENÍ AUTORA PRÁCE ................................................................................................ 7
ACKNOWLEDGMENTS ........................................................................................................... 9
TABLE OF CONTENTS ........................................................................................................... 11
ANOTATION .......................................................................................................................... 15
ANOTACE .............................................................................................................................. 17
KEYWORDS ........................................................................................................................... 19
KLÍČOVÁ SLOVA .................................................................................................................... 19
1 INTRODUCTION ........................................................................................................... 21
2 THEORETICAL PART ..................................................................................................... 23
2.1 LITERATURE REVIEW ............................................................................................ 24
2.1.1 POPULATION AGING ..................................................................................... 24
2.1.2 OPPORTUNITIES IN AN EXPLOITATION OF ASSISTIVE TECHNOLOGIES ...... 26
2.1.3 ELIGIBLE PATIENTS FOR MONITORING ........................................................ 27
2.1.4 TECHNICAL SOLUTION FOR DAILY MONITORING ....................................... 29
2.2 GYROSCOPE AND ACCELEROMETER ................................................................... 42
2.2.1 GYROSCOPE ................................................................................................... 42
2.2.2 ACCELEROMETER .......................................................................................... 43
2.2.3 MEMS ACCELEROMETERS ............................................................................ 44
3 PRACTICAL PART .......................................................................................................... 45
3.1 MEASURING BOARD ............................................................................................. 46

12 Daily activity monitoring using a device with accelerometers
3.1.1 ASSEMBLING OF A MEASURING BOARD ..................................................... 46
3.1.2 MOTION PROCESSING UNIT MPU-6050 ...................................................... 49
3.1.3 BLUETOOTH MODUL HC-06 ......................................................................... 49
3.2 SOLUTIONS OF MEASURING WEARABLE DEVICE POSITIONING ........................ 50
3.2.1 SENSOR PLACED ON A HEAD ........................................................................ 51
3.2.2 SENSOR PLACED ON AN ARM ...................................................................... 51
3.2.3 SENSOR PLACED ON A TRUNK LIKE A BRACELET ........................................ 51
3.2.4 SENSOR PLACED ON A WRIST LIKE A WATCH ............................................. 52
3.2.5 SENSOR PLACED ON A HIP ON A BELT ......................................................... 52
3.2.6 SENSOR PLACED ON A THIGH ...................................................................... 52
3.2.7 SENSOR PLACED ON AN OUTER KNEE ......................................................... 53
3.2.8 SENSOR PLACED AROUND AN ANKLE .......................................................... 53
3.3 EXPERIMENTS TO VERIFY MEASURING WEARABLE DEVICE POSITIONING ....... 54
3.3.1 EXPERIMENTS WITH A CHAIR ...................................................................... 55
3.3.2 EXPERIMENTS WITH A BED .......................................................................... 56
3.3.3 GAIT EXPERIMENTS ...................................................................................... 59
3.4 DATA PREPROCESSING IN MATLAB ..................................................................... 63
3.5 METHODOLOGY OF A SIGNAL EVALUATION USABILITY ..................................... 64
4 RESULTS ....................................................................................................................... 67
4.1 EXPERIMENTAL MEASURING ............................................................................... 68
4.1.1 RESULTS OF THE EXPERIMENT CHAIR – SIT DOWN .................................... 68
4.1.2 EVALUATION OF RESULTS OF THE EXPERIMENT CHAIR – SIT DOWN ........ 74
4.1.3 RESULTS OF THE EXPERIMENT BED – GET UP ............................................. 75
4.1.4 EVALUATION OF RESULTS OF THE EXPERIMENT BED – GET UP ................ 81
4.1.5 RESULTS OF THE EXPERIMENT GAIT – SLOW WALK ................................... 83
4.1.6 EVALUATION OF RESULTS OF THE EXPERIMENT GAIT – SLOW WALK ....... 88
4.1.7 EVALUATION OF RESULTS OF ALL EXPERIMENTS ....................................... 89

13 TABLE OF CONTENTS
4.2 VERIFICATION OF EXPERIMENTAL MEASURING ................................................. 90
4.2.1 VERIFICATION OF RESULTS OF THE EXPERIMENT CHAIR – SIT DOWN ...... 90
4.2.2 VERIFICATION OF RESULTS OF THE EXPERIMENT BED – GET UP ............... 91
4.2.3 VERIFICATION OF RESULTS OF THE EXPERIMENT GAIT – SLOW WALK ..... 94
4.3 EVALUATION OF THE BEST POSITION OF A WEARABLE DEVICE ........................ 96
4.4 PRACTICAL MEASURING ....................................................................................... 98
4.4.1 SENIORS‘ DAILY ACTIVITIES MONITORING .................................................. 98
4.4.2 BLIND RECORD OF A PATIENT’S DAILY ACTIVITIES MONITORING ............ 100
5 CONCLUSION ............................................................................................................. 103
6 LIST OF ABBREVIATIONS ........................................................................................... 107
7 LIST OF PICTURES ...................................................................................................... 109
8 LIST OF TABLES .......................................................................................................... 111
9 LIST OF REFERENCES ................................................................................................. 113
10 LIST OF REFERENCES of pictures .............................................................................. 119
11 LIST OF ELECTRONIC APPENDIX ................................................................................ 121
12 LIST OF APPENDICES .................................................................................................. 123

14 Daily activity monitoring using a device with accelerometers

15 ANOTATION, ANOTACE
15
ANOTATION
The main goal of this thesis Daily activity monitoring using a device with accelerometers
is to choose the best variant of wearable device positioning for senior’s daily activities
monitoring. Population is aging and considering this fact we can expect lot of changes in
approach of the worldwide health system. It is of the utmost importance that seniors
could remain at home as long as possible otherwise the healthcare will be costly. Thus
the technical solution that will be able to monitor daily activities of seniors is needed.
The very wearable device with accelerometer was constructed. Assembling of measuring
board is described. Principal components are Motion Processing Unit MPU-6050 and
Bluetooth HC-06, both for Arduino platform. Experiments and experimental protocols to
verify individual solutions of measuring wearable device positioning were designed. The
three main exercises were Chair, Bed and Gait. Each of them contains two or more
experimental protocols which are described in detail.
A tool in Matlab supporting evaluation according the developed methodology was
designed. This tool helps with assessing of particular phases and markers in a given type
of experiment. This method is subjective because of a hand-operated marking. Multiple-
criteria decision analysis was used for evaluation.
First of all the experimental measuring with healthy participant was performed. Second
part of experimental measuring was verification of experimental measuring with another
healthy participant. The evaluation of the best position of a wearable device was done by
the developed methodology.
Then the practical measuring with three seniors was performed. Seniors’ movement was
different considering the experimental measuring when participants were strictly
directed by experimental protocols.

16 Daily activity monitoring using a device with accelerometers
The most interesting part of the measuring was analysis of the blind record for the final
evaluation of suitability of the chosen wearable device positioning. The participant was
freely moving in his own home environment. After the measurement was done it was
evaluated without a knowledge of what exactly participant was doing during that time.
Every movements and their phases were detectable in a signal of the blind record.
Evaluation of the blind measuring was as successful. According to all these results the
wearable device positioning on an arm is the best choice for daily activities monitoring.
17 ANOTATION, ANOTACE
17
ANOTACE
Hlavním cílem této diplomové práce Monitorování denní aktivity pomocí zařízení s
akcelerometry je výběr nejlepší varianty umístění takového zařízení. Populace stárne a
vzhledem k tomuto faktu můžeme očekávat různé změny ve světovém zdravotnickém
systému. Velký důraz je kladen na seniory a jejich co nejdelší pobyt v jejich domácím
prostředí. V opačném případě by zdravotní péče jako taková byla nákladnější. Vyvstává
potřeba technického řešení, které by bylo schopno monitorovat denní aktivitu seniorů.
Bylo zkonstruováno zařízení s akcelerometrem a také vytvořena jeho dokumentace.
Hlavními součástkami jsou Motion Processing Unit MPU-6050 a Bluetooth HC-06. Byly
vytvořeny experimenty a experimentální protokoly k verifikaci individuálních umístění
zařízení. Třemi hlavními experimenty jsou experimenty se židlí, s postelí a při chůzi. Každý
z těchto experimentů obsahuje dva či více experimentálních protokolů, které jsou
detailně popsány.
Zpracování dat v Matlabu a metodologie vyhodnocení užitečnosti signálu byla založena
na vytvořených funkcích, které umožňují získat naměřená data ze senzoru MPU-6050 a
dále provést jejich předzpracování.
Metodologie pro vyhodnocení signálů je založena na nástroji, který byl vytvořen v
Matlabu. Tento nástroj pomáhá se zhodnocením určitých fází a značek pro specifický typ
experimentu. Tato metoda je subjektivní díky ručnímu označování těchto fází. Pro
vyhodnocení výsledků byla použita vícekriteriální analýza kombinovaná s váženou lineární
funkcí.
Všechna data byla analyzována. Nejprve bylo provedeno experimentální měření se
zdravým účastníkem. Druhou částí experimentálního měření bylo měření verifikační s
dalším zdravým jedincem. Tyto výsledky byly porovnány s ohledem na vhodnost umístění
zařízení.
18 Daily activity monitoring using a device with accelerometers
Po obou těchto měřeních bylo vybráno nejvhodnější umístění zařízení pomocí vytvořené
metodologie. Rozsah výsledných hodnot pro každý experiment byl přepočítán a
normalizován. Následně byl určen součet výsledků pro každé umístění a poté tyto
výsledky porovnány. Na základě provedeného experimentálního měření bylo jako
nejvhodnější umístění vybráno umístění zařízení na paži jedince.
Poté bylo provedeno praktické měření. V jeho první části byli pozorováni a měřeni senioři
během tří hlavních experimentů, přičemž nebyli obeznámeni s předchozím
experimentálním měřením. Pohyb seniorů byl odlišný od experimentálního měření, které
bylo striktně řízeno experimentálními protokoly. Nicméně hlavní značky a fáze pohybů
byly dobře či částečně detekovatelné.
Nejzajímavější částí měření byla analýza slepého záznamu pro konečné zhodnocení
vhodnosti vybraného umístění zařízení, kdy se první zdravý účastník volně pohyboval ve
svém domácím prostředí. Po skončení měření byl výsledek analyzován bez znalosti, které
úkony účastník během záznamu prováděl. Každý pohyb a jeho fáze byla ve slepém signálu
detekovatelná a takovéto měření může být tedy označeno jako úspěšné. Vzhledem ke
všem těmto dosaženým výsledkům se umístění zařízení na paži jedince jeví jako
nejvhodnější pro monitorování jeho denní aktivity.

19 KEYWORDS, KLÍČOVÁ SLOVA
19
KEYWORDS
Accelerometers, aging, daily activity, fall, gait, monitoring
KLÍČOVÁ SLOVA
Akcelerometry, stárnutí, denní aktivita, pád, chůze, monitorování

20 Daily activity monitoring using a device with accelerometers

21 INTRODUCTION
21
1 INTRODUCTION
One of the main theme for United Nations Department of Economic and Social Affairs,
Population Division (UN DESA PD), is monitoring of the global population aging. It is now
a well-established fact. [38]
Following this worldwide situation a need of a new approach to world healthcare system
arises. At present, it is quite clear that if we want to limit the costs of health and long-
term care, we have to make better use of modern technology [47] namely for prediction.
The analysis of social service [48][49][50] suggests that it is also important to take into
account more technical and expert and aspects.
The institutional care comes to be costly so there is a need that seniors could remain at
home as long as possible. They can freely move in their own home environment which
could be equipped with some system for monitoring. So their home could become to be
an intelligent building by usage of telemedicine. Such systems could be helpful to
prediction of dangerous states or for individual analysis of senior’s behavior.
This thesis focuses to daily activities monitoring by device with accelerometer.
Experimental protocols based on initial behavior analysis during the senior’s daily routine
will be designed. The experimental and verification measuring will be provided with two
healthy participants without any history of orthopedic injury or conditions likely to affect
their nature movement. For practical measuring three seniors were chosen.
Through measuring of movements the most suitable wearable device positioning will be
selected as the best placement of sensor for daily activities monitoring.

22 Daily activity monitoring using a device with accelerometers

23 THEORETICAL PART
23
2 THEORETICAL PART
The idea of such a device which could be easily worn during all daily activities is based on
a future needs of rapidly aging society. The first chapter of a theoretical part 2.1.1
discusses a population aging, its expectations and impact on the world economy. Assistive
technologies are on the increase in present and this situation brings opportunities in their
exploitation. The second chapter 2.1.2 presents assistive technologies which could be
used for instrumented assessments of physical functioning that are feasible for home
monitoring as a much debated topic. Chapters 2.1.3 and 2.1.4 describe possible technical
solutions of daily monitoring for old people and who actually these eligible patients could
be.
At first place it is necessary to perform literature and existing device research with respect
to various wearable device positioning. Both for commercial devices which have been
already placed on the market 2.1.4.1 and also for existing projects 2.1.4.2.
Since the device has to use accelerometers the knowledge about its working principle
(2.2.2) is required. For a study a motion processing unit MPU-6050 was chosen. This unit
combines a 3-axis gyroscope and a 3-axis accelerometer. So a principle of gyroscope is
explained in a chapter 2.2.1.
24 Daily activity monitoring using a device with accelerometers
2.1 LITERATURE REVIEW
There were mentioned some of interesting topics in an introduction chapter and on the
following pages they will be discussed more deeply. The first part investigates population
aging problem (2.1.1) which leads to the discussion about opportunities in an exploitation
of assistive technologies (2.1.2) and possible technical solution for old people daily
monitoring (2.1.4) and who actually these eligible patients are (2.1.3).
The main goal of this theoretical part of literature review is to become familiar with
commercial devices which have been already placed on the market (2.1.4.1) but also with
existing projects (2.1.4.2). The most important there are the synoptic tables (TABLE 2),
(TABLE 3) and a charts (PIC. 1) and (PIC. 13) referring to a positioning of sensors which have
been used.
2.1.1 POPULATION AGING
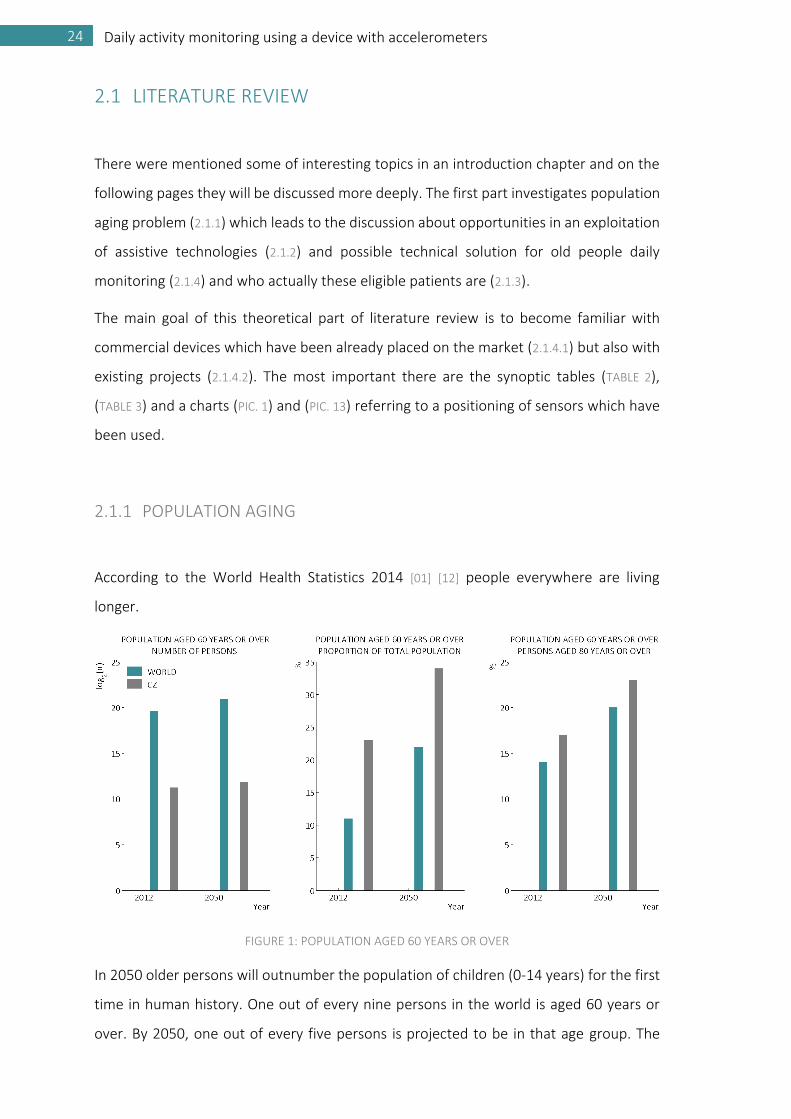
According to the World Health Statistics 2014 [01] [12] people everywhere are living
longer.
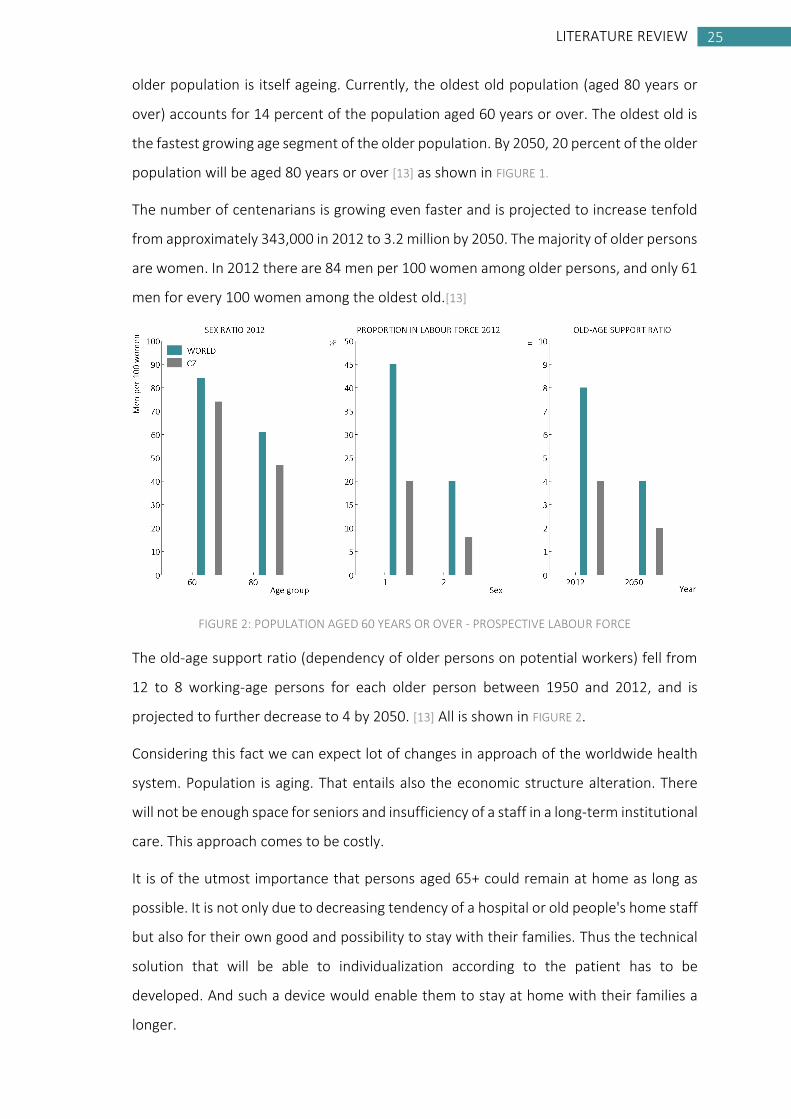
FIGURE 1: POPULATION AGED 60 YEARS OR OVER
In 2050 older persons will outnumber the population of children (0-14 years) for the first
time in human history. One out of every nine persons in the world is aged 60 years or
over. By 2050, one out of every five persons is projected to be in that age group. The
25 LITERATURE REVIEW
25
older population is itself ageing. Currently, the oldest old population (aged 80 years or
over) accounts for 14 percent of the population aged 60 years or over. The oldest old is
the fastest growing age segment of the older population. By 2050, 20 percent of the older
population will be aged 80 years or over [13] as shown in FIGURE 1.
The number of centenarians is growing even faster and is projected to increase tenfold
from approximately 343,000 in 2012 to 3.2 million by 2050. The majority of older persons
are women. In 2012 there are 84 men per 100 women among older persons, and only 61
men for every 100 women among the oldest old.[13]
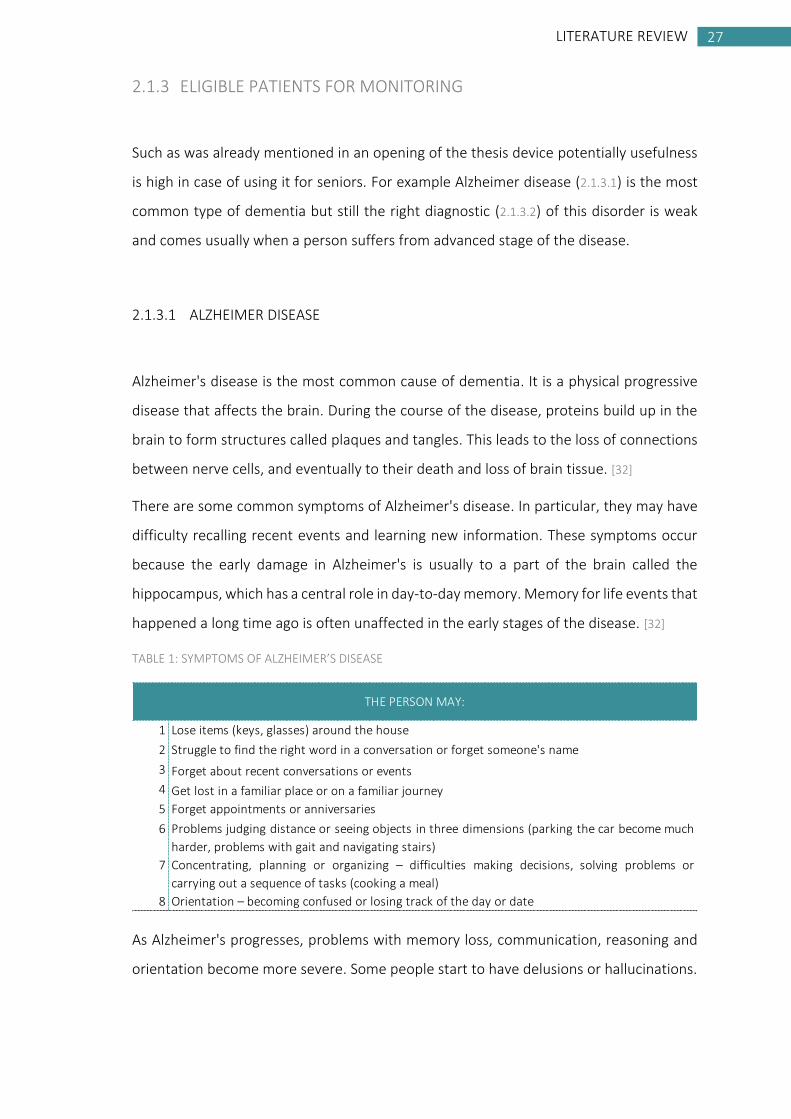
FIGURE 2: POPULATION AGED 60 YEARS OR OVER - PROSPECTIVE LABOUR FORCE
The old-age support ratio (dependency of older persons on potential workers) fell from
12 to 8 working-age persons for each older person between 1950 and 2012, and is
projected to further decrease to 4 by 2050. [13] All is shown in FIGURE 2.
Considering this fact we can expect lot of changes in approach of the worldwide health
system. Population is aging. That entails also the economic structure alteration. There
will not be enough space for seniors and insufficiency of a staff in a long-term institutional
care. This approach comes to be costly.
It is of the utmost importance that persons aged 65+ could remain at home as long as
possible. It is not only due to decreasing tendency of a hospital or old people's home staff
but also for their own good and possibility to stay with their families. Thus the technical
solution that will be able to individualization according to the patient has to be
developed. And such a device would enable them to stay at home with their families a
longer.

26 Daily activity monitoring using a device with accelerometers
2.1.2 OPPORTUNITIES IN AN EXPLOITATION OF ASSISTIVE TECHNOLOGIES
Assistive technology is one of many opportunities that are necessary to reduce the
disabling influence of many environments. Technology is a ubiquitous part of our
everyday lives, which for the most part, makes our daily tasks simpler to do. [35]
For an early diagnosis several different clinical tests exist, such as the Timed Get-up-and-
go, the Berg Balance Scale, and the Tinetti Balance Scale. Those tests can be used to
predict the risk of falling. Falls are a major problem. Factors that augment the risk of
falling are muscular weakness [27], previous fall [28] and balance problems, visual,
vestibular, or proprioceptive problems [29].
But unfortunately those tests are not able to identify progressive changes in fall risk.
However, these measures have never been integrated into a home-based test. [30]
More recently, gait has been used as a biometric trait for identification purposes. [31] The
hypotheses related to gait analysis are generally very restrictive: fixed camera, gait at a
constant velocity, a frontoparallel approach in relation to the camera, all of the subjects
visible, constant luminosity, absence of distractions, and so forth.
It has to be said that instrumented assessments of physical functioning that are feasible
for home monitoring have not been adequately resolved and it is a much debated topic.
In these days lot of devices have been invented which are used for a real time position
reporting (GPS location, fall detection, entering/leaving geo-fences reporting) and also
for an emergency call by SOS button. The indoor navigation systems are slowly becoming
commonplace. But there is still a gap in the global market. We already know how to
prevent to a fall, how to detect a fall but what we really want to determine, is how to
predict fall or early diagnose a disease just by an observation of potential patient in his
own home environment. And this is an opportunity in an exploitation of assistive
technologies to use small and lowcost sensors to get and process data which would have
been leading us to a novel results about the patient's daily activities in his own
environment.
27 LITERATURE REVIEW
27
2.1.3 ELIGIBLE PATIENTS FOR MONITORING
Such as was already mentioned in an opening of the thesis device potentially usefulness
is high in case of using it for seniors. For example Alzheimer disease (2.1.3.1) is the most
common type of dementia but still the right diagnostic (2.1.3.2) of this disorder is weak
and comes usually when a person suffers from advanced stage of the disease.
2.1.3.1 ALZHEIMER DISEASE
Alzheimer's disease is the most common cause of dementia. It is a physical progressive
disease that affects the brain. During the course of the disease, proteins build up in the
brain to form structures called plaques and tangles. This leads to the loss of connections
between nerve cells, and eventually to their death and loss of brain tissue. [32]
There are some common symptoms of Alzheimer's disease. In particular, they may have
difficulty recalling recent events and learning new information. These symptoms occur
because the early damage in Alzheimer's is usually to a part of the brain called the
hippocampus, which has a central role in day-to-day memory. Memory for life events that
happened a long time ago is often unaffected in the early stages of the disease. [32]
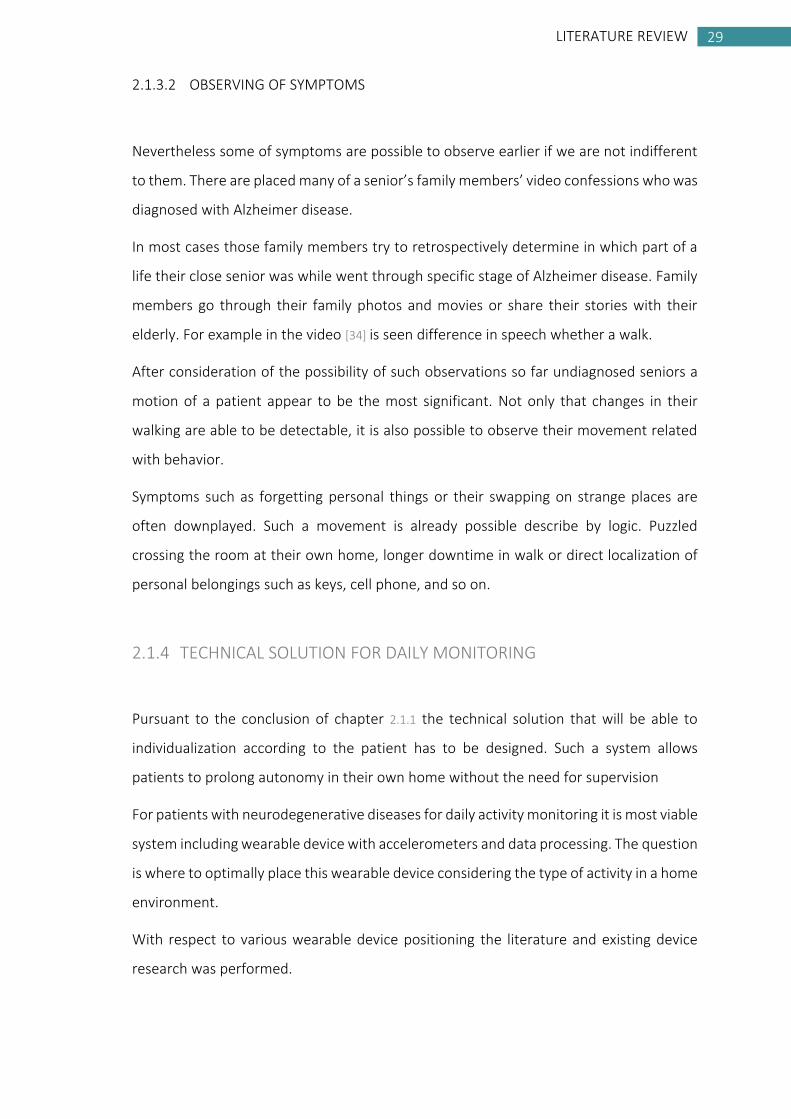
TABLE 1: SYMPTOMS OF ALZHEIMER’S DISEASE
As Alzheimer's progresses, problems with memory loss, communication, reasoning and
orientation become more severe. Some people start to have delusions or hallucinations.
1 Lose items (keys, glasses) around the house
2 Struggle to find the right word in a conversation or forget someone's name
3 Forget about recent conversations or events
4 Get lost in a familiar place or on a familiar journey
5 Forget appointments or anniversaries
6 Problems judging distance or seeing objects in three dimensions (parking the car become much
harder, problems with gait and navigating stairs)
7 Concentrating, planning or organizing – difficulties making decisions, solving problems or
carrying out a sequence of tasks (cooking a meal)
8 Orientation – becoming confused or losing track of the day or date
THE PERSON MAY:

28 Daily activity monitoring using a device with accelerometers
In the later stages of Alzheimer's disease someone may become much less aware of what
is happening around them. They may have difficulties eating or walking without help, and
become increasingly frail. Eventually, the person will need help with all their daily
activities. On average, people with Alzheimer's disease live for eight to ten years after the
first symptoms. [32]
An early diagnosis has many benefits: it provides an explanation for the person's
symptoms; it gives access to treatment, advice and support; and it allows them to prepare
for the future and plan ahead. There is no single test for Alzheimer's disease but there is
a standard procedure:
The doctor will first need to rule out conditions such as infections, vitamin and
thyroid deficiencies (from a blood test), depression and side effects of medication.
The doctor will also talk to the person, and where possible someone who knows
them well, about their medical history and how their symptoms are affecting their
life. Then the doctor may ask the person to do some tests of mental abilities.
The doctor can generally refer the person to a specialist. This could be an old-age
psychiatrist, a geriatrician, a neurologist, or a general adult psychiatrist.
The person may undergo a brain scan, which can show whether certain changes
have taken place in the brain. The most widely used are CT (computerized
tomography) and MRI (magnetic resonance imaging).
DSM-IV Criteria for the Diagnosis of Alzheimer’s Disease is placed in the attachment.
There is currently no cure for Alzheimer's disease, but there is a lot that can be done to
enable someone to live well with the condition. This will involve drug and non-drug care,
support and activities. There are drug treatments for Alzheimer's disease that can
temporarily alleviate some symptoms or slow down their progression in some people.
The drug may help with memory problems, improve concentration and motivation, and
help with aspects of daily living such as cooking, shopping or hobbies. [32]
29 LITERATURE REVIEW
29
2.1.3.2 OBSERVING OF SYMPTOMS
Nevertheless some of symptoms are possible to observe earlier if we are not indifferent
to them. There are placed many of a senior’s family members’ video confessions who was
diagnosed with Alzheimer disease.
In most cases those family members try to retrospectively determine in which part of a
life their close senior was while went through specific stage of Alzheimer disease. Family
members go through their family photos and movies or share their stories with their
elderly. For example in the video [34] is seen difference in speech whether a walk.
After consideration of the possibility of such observations so far undiagnosed seniors a
motion of a patient appear to be the most significant. Not only that changes in their
walking are able to be detectable, it is also possible to observe their movement related
with behavior.
Symptoms such as forgetting personal things or their swapping on strange places are
often downplayed. Such a movement is already possible describe by logic. Puzzled
crossing the room at their own home, longer downtime in walk or direct localization of
personal belongings such as keys, cell phone, and so on.
2.1.4 TECHNICAL SOLUTION FOR DAILY MONITORING
Pursuant to the conclusion of chapter 2.1.1 the technical solution that will be able to
individualization according to the patient has to be designed. Such a system allows
patients to prolong autonomy in their own home without the need for supervision
For patients with neurodegenerative diseases for daily activity monitoring it is most viable
system including wearable device with accelerometers and data processing. The question
is where to optimally place this wearable device considering the type of activity in a home
environment.
With respect to various wearable device positioning the literature and existing device
research was performed.
30 Daily activity monitoring using a device with accelerometers
2.1.4.1 COMMERCIAL PRODUCTS
A great majority of falls in ageing people result from a combination of factors. The aging
process itself is one of these factors. Other contributing factors include chronic health
problems (diseases of heart, problems in eyes, poor vision, muscle weakness, dementia,
arthritis etc.), physical and functional impairments (lower extremity weakness, balance
disorders), medications and alcohol abuse, and hazards and obstacles in the home (poor
lighting, lack of bathroom safety equipment, loose carpets). [23] Currently, an automated
method for accurately recording falls is not available.
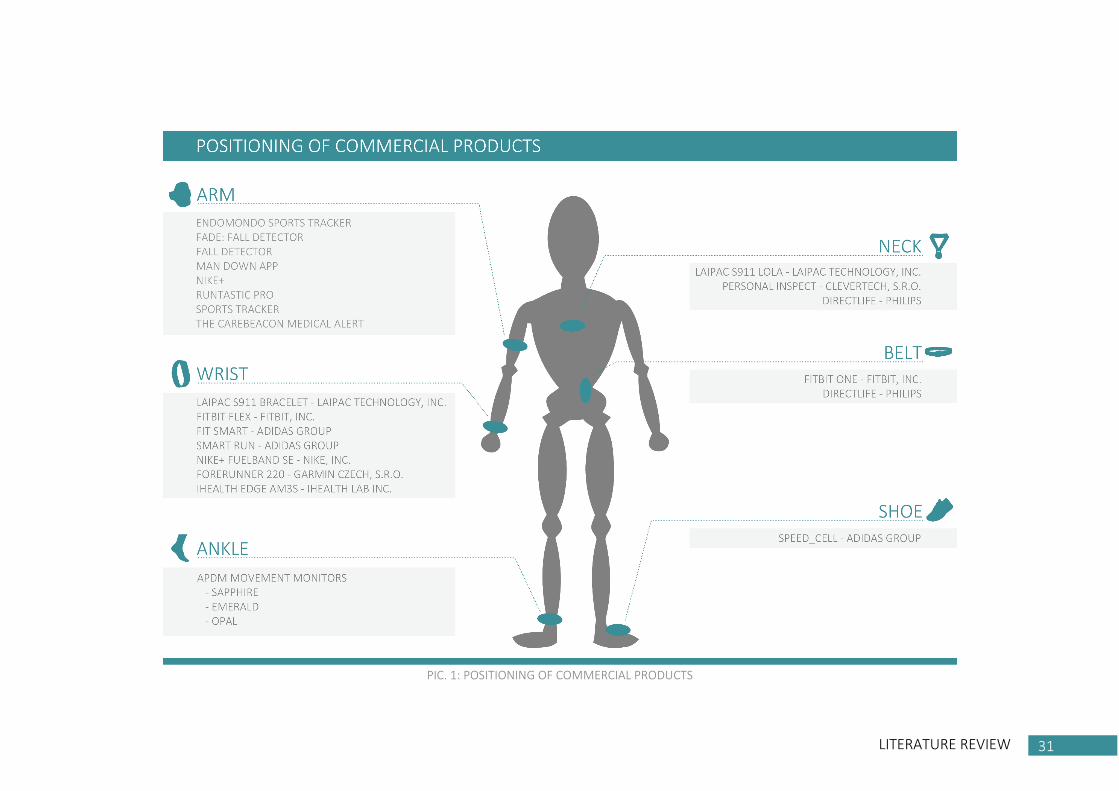
On the market there are lot of various devices but ultimately are all very similar. Six
existing devices were selected for comparison their functions, usability, construction,
price and positioning. Data collation is shown in a synoptic table (TABLE 2) and in a chart
below. (PIC. 1)
31 LITERATURE REVIEW
PIC. 1: POSITIONING OF COMMERCIAL PRODUCTS
32 Daily activity monitoring using a device with accelerometers
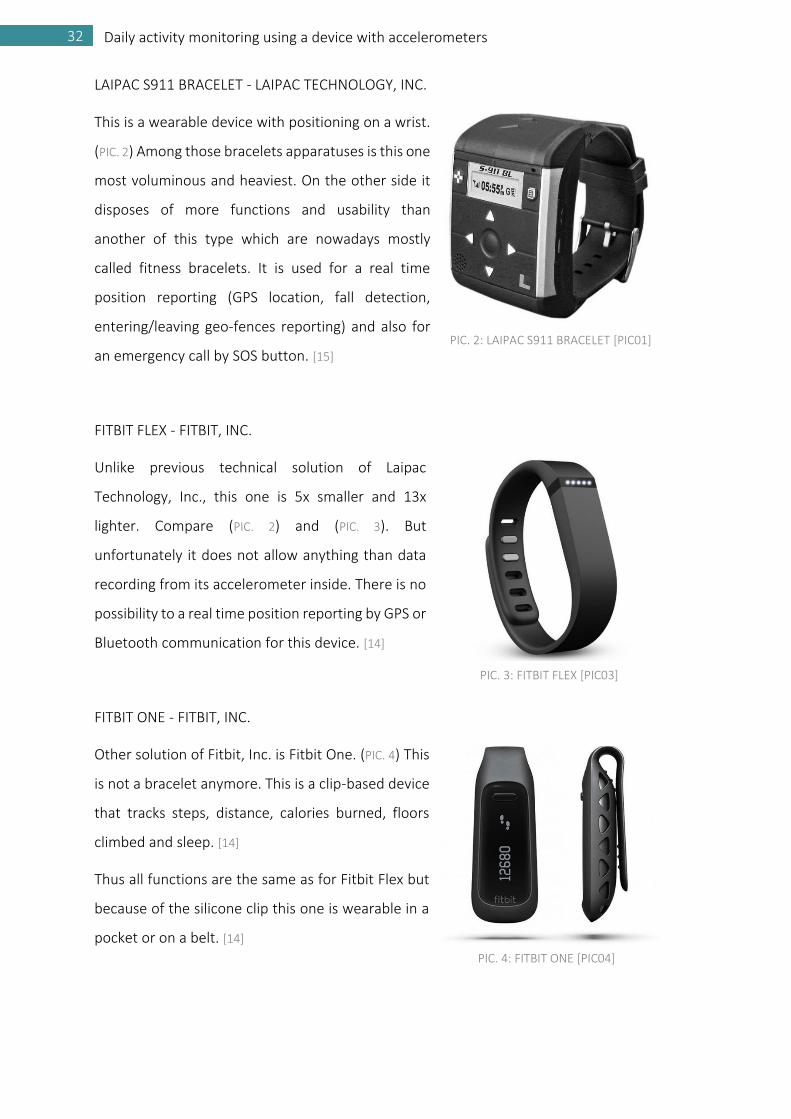
LAIPAC S911 BRACELET - LAIPAC TECHNOLOGY, INC.
This is a wearable device with positioning on a wrist.
(PIC. 2) Among those bracelets apparatuses is this one
most voluminous and heaviest. On the other side it
disposes of more functions and usability than
another of this type which are nowadays mostly
called fitness bracelets. It is used for a real time
position reporting (GPS location, fall detection,
entering/leaving geo-fences reporting) and also for
an emergency call by SOS button. [15]
FITBIT FLEX - FITBIT, INC.
Unlike previous technical solution of Laipac
Technology, Inc., this one is 5x smaller and 13x
lighter. Compare (PIC. 2) and (PIC. 3). But
unfortunately it does not allow anything than data
recording from its accelerometer inside. There is no
possibility to a real time position reporting by GPS or
Bluetooth communication for this device. [14]
FITBIT ONE - FITBIT, INC.
Other solution of Fitbit, Inc. is Fitbit One. (PIC. 4) This
is not a bracelet anymore. This is a clip-based device
that tracks steps, distance, calories burned, floors
climbed and sleep. [14]
Thus all functions are the same as for Fitbit Flex but
because of the silicone clip this one is wearable in a
pocket or on a belt. [14]
PIC. 2: LAIPAC S911 BRACELET [PIC01]
PIC. 3: FITBIT FLEX [PIC03]
PIC. 4: FITBIT ONE [PIC04]
33 LITERATURE REVIEW
33 LITERATURE REVIEW
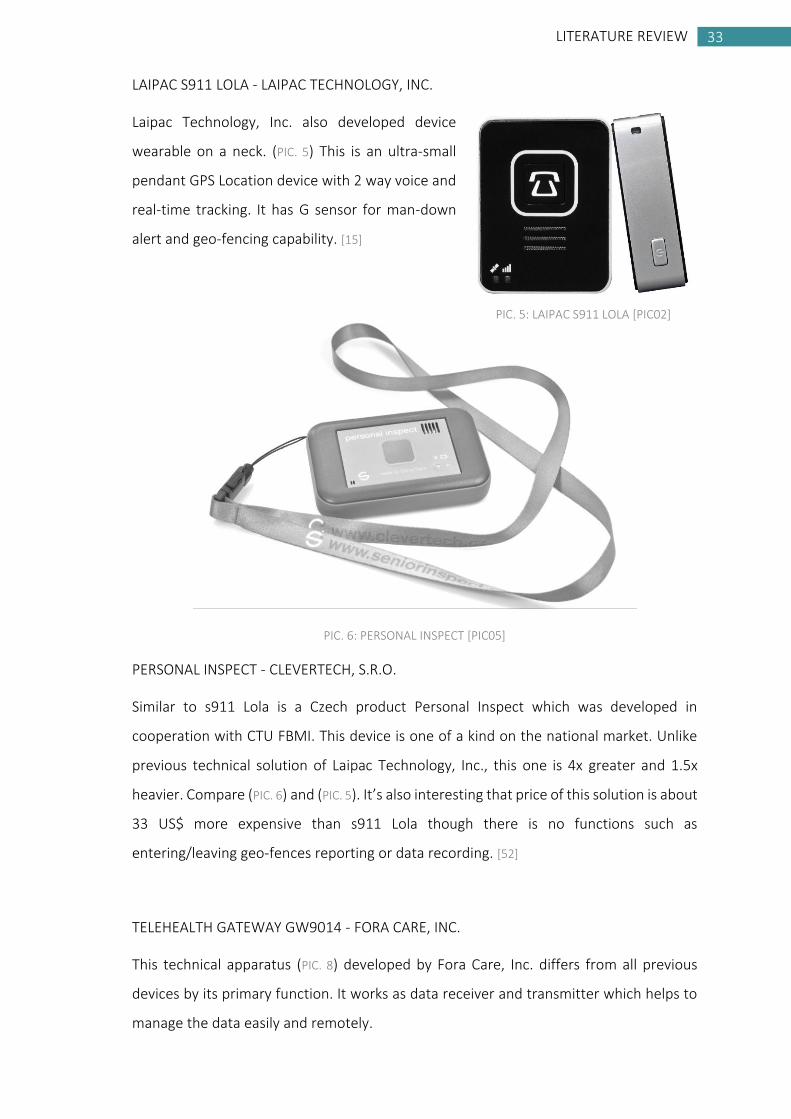
LAIPAC S911 LOLA - LAIPAC TECHNOLOGY, INC.
Laipac Technology, Inc. also developed device
wearable on a neck. (PIC. 5) This is an ultra-small
pendant GPS Location device with 2 way voice and
real-time tracking. It has G sensor for man-down
alert and geo-fencing capability. [15]
PIC. 6: PERSONAL INSPECT [PIC05]
PERSONAL INSPECT - CLEVERTECH, S.R.O.
Similar to s911 Lola is a Czech product Personal Inspect which was developed in
cooperation with CTU FBMI. This device is one of a kind on the national market. Unlike
previous technical solution of Laipac Technology, Inc., this one is 4x greater and 1.5x
heavier. Compare (PIC. 6) and (PIC. 5). It’s also interesting that price of this solution is about
33 US$ more expensive than s911 Lola though there is no functions such as
entering/leaving geo-fences reporting or data recording. [52]
TELEHEALTH GATEWAY GW9014 - FORA CARE, INC.
This technical apparatus (PIC. 8) developed by Fora Care, Inc. differs from all previous
devices by its primary function. It works as data receiver and transmitter which helps to
manage the data easily and remotely.
PIC. 5: LAIPAC S911 LOLA [PIC02]

34 Daily activity monitoring using a device with accelerometers
By using this product data can be monitored and analyzed effectively through the
connection to the server [16] as can be seen in the PIC. 7. Bluetooth (GW9014B)/RS232
(GW9014A)/Ethernet/Dial-Up is used here.
PIC. 8: TELEHEALTH GATEWAY GW9014 [PIC06]
PIC. 7: FORA CARE SOLUTION [PIC06]

35 LITERATURE REVIEW
TABLE 2: COMPARISON OF SELECTED EXISTING TECHNICAL SOLUTIONS
TABLE 3: TECHNICAL SPECIFICATION OF SELECTED EXISTING DEVICES
ID PRODUCT NAME MANUFACTURER PROPORTIONS WEIGHT PRICE POSITIONING DATA COMMUNICATION/TRANSMISSION
1 Laipac s911 Bracelet Laipac Technology, Inc. 5.0 x 4.4 x 1.5 cm 110.0 g 223.53 US$ Wrist GSM/GPRS Quad-band 850/900/1800/1900MHz
2 Laipac s911 Lola Laipac Technology, Inc. 5.4 x 4.0 x 1.6 cm 44.3 g 156.94 US$ Neck GSM/SMS/GPRS/2 Way Voice
3 TeleHealth Gateway GW9014 Fora Care, Inc. 17.0 x 12.0 x 3.0 cm 221.8 g 159.99 US$ - Bluetooth (GW9014B)/Ethernet/Dial-Up
99.99 US$ - RS232 (GW9014A)/Ethernet/Dial-Up
4 Fitbit Flex Fitbit, Inc. 20.8 x 1.5 x 1.0 cm 8.5 g 99 US$ Wrist Bluetooth 4.0
5 Fitbit One Fitbit, Inc. 4.8 x 1.9 x 0.9 cm 9.0 g 99 US$ Belt Bluetooth 4.0
6 Personal Inspect CleverTech, s.r.o 8.4 x 0.5 x 0.2 cm 65.0 g 190.38 US$ Neck GSM Quad-band 850/900/1800/1900MHz
GPS LOCATION FALL DETECTION REAL TIME POSITION
REPORTING
ENTERING/LEAVING GEO-FENCES
REPORTING
DATA RECORDING CONFIGURATION SOS BUTTON STATUS
INDICATION
1 Laipac s911 Bracelet o o o o o o o o
2 Laipac s911 Lola o o o o o ‐ o o
3 TeleHealth Gateway GW9014 ‐ ‐ ‐ ‐ ‐ o ‐ o
4 Fitbit Flex ‐ ‐ ‐ ‐ o ‐ ‐ o
5 Fitbit One ‐ ‐ ‐ ‐ o ‐ ‐ o
6 Personal Inspect o o o ‐ ‐ ‐ o o
FUNCTIONS
ID PRODUCT NAME
MICROPHONE SPEAKER VIBRATIONS BATTERY POWER GYROSCOPE ACCELEROMETER DISPLAY USB PORT MEMORY
o o ‐ o o ‐ o o o o
o o o o ‐ ‐ o ‐ ‐ o
‐ ‐ ‐ o o ‐ ‐ ‐ ‐ ‐
‐ ‐ o o o o o ‐ o o
‐ ‐ o o o o o o o o
o o ‐ o o ‐ o ‐ ‐ ‐
HARDWARE

36 Daily activity monitoring using a device with accelerometers
2.1.4.2 EXISTING PROJECTS RESEARCH
In these days the lot of companies, laboratories or universities are trying to design and
develop a new technology for seniors monitoring. The devices should allow detection and
possibly prediction of dangerous states of the client such as for example falls. List of such
projects is shown below.
Existing research projects aim to provide a thematic network focusing on the issue of
promoting healthy, independent living for older adults (e.g. FARSEEING [17]) and focusing
on falls prevention (e.g. ProFouND [18]).
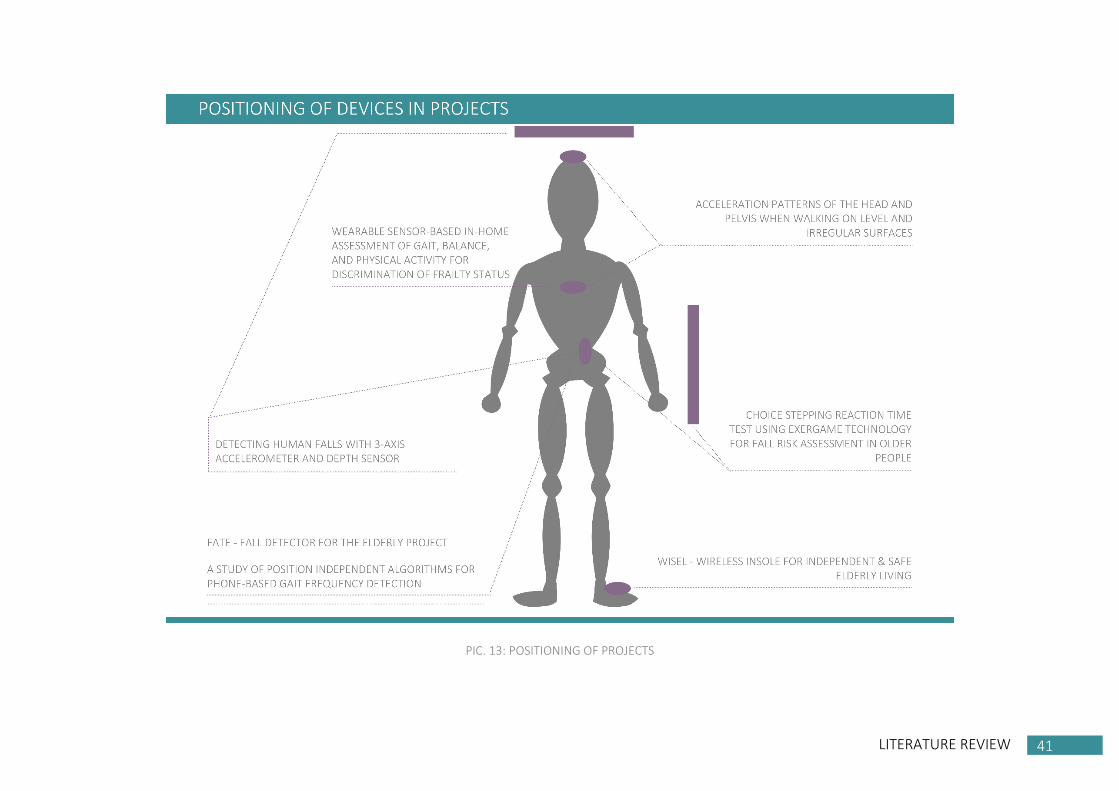
WEARABLE SENSOR-BASED IN-HOME ASSESSMENT OF GAIT, BALANCE, AND PHYSICAL
ACTIVITY FOR DISCRIMINATION OF FRAILTY STATUS
This project comes with an idea to discriminate frailty status and to discrimination
between frailty levels. Wearable sensors were used [19] such as 3-axis accelerometer in
mid-chest pocket for 48 hrs. [20]
Temporal-spatial gait parameters (speed, stride length, stride time, double support, and
variability of stride velocity) and physical activity (percentage of walking, standing, sitting,
and lying; mean duration and variability of single walking, standing, sitting, and lying
bouts) were measured. Gait speed, hip sway, and steps/day were the most sensitive
parameters for the identification of prefrailty. Stride length and double support were the
most sensitive gait parameters for discriminating between three frailty levels. [19]
DETECTING HUMAN FALLS WITH 3-AXIS ACCELEROMETER AND DEPTH SENSOR
Mr. Kepski and Mr. Kwolek presented a novel approach to fall detection applying Kinect
sensor [21] to achieve reliable fall detection in larger areas. High sensitivity and specificity
can be obtained using dense depth images acquired by a ceiling mounted Kinect and
executing the proposed algorithms for lying pose detection and motion analysis. [21]
37 LITERATURE REVIEW
37 LITERATURE REVIEW
CHOICE STEPPING REACTION TIME TEST USING EXERGAME TECHNOLOGY FOR FALL RISK
ASSESSMENT IN OLDER PEOPLE
Stepping is a common task to avoid a fall and stepping reaction time has been associated
with recurrent falls in older people. [22]
Spatial and temporal measurements of the lower and upper body were derived from a
low-cost and portable 3D-depth sensor Microsoft Kinect and 3D-accelerometer. Fallers
had a slower stepping reaction and a slower reaction of their upper compared to non-
fallers. It took fallers significantly longer than non- fallers to recover their balance after
initiating the step. Researcher were able to identify significant differences between
performances by fallers and non-fallers. [22]
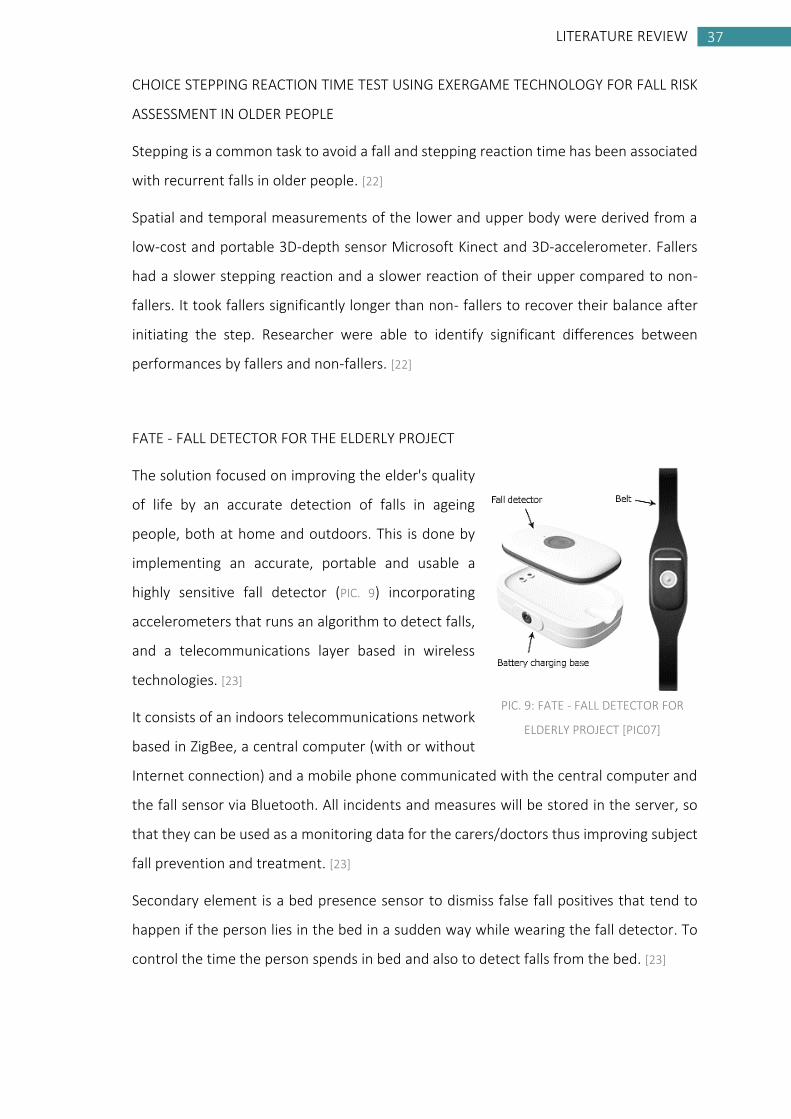
FATE - FALL DETECTOR FOR THE ELDERLY PROJECT
The solution focused on improving the elder's quality
of life by an accurate detection of falls in ageing
people, both at home and outdoors. This is done by
implementing an accurate, portable and usable a
highly sensitive fall detector (PIC. 9) incorporating
accelerometers that runs an algorithm to detect falls,
and a telecommunications layer based in wireless
technologies. [23]
It consists of an indoors telecommunications network
based in ZigBee, a central computer (with or without
Internet connection) and a mobile phone communicated with the central computer and
the fall sensor via Bluetooth. All incidents and measures will be stored in the server, so
that they can be used as a monitoring data for the carers/doctors thus improving subject
fall prevention and treatment. [23]
Secondary element is a bed presence sensor to dismiss false fall positives that tend to
happen if the person lies in the bed in a sudden way while wearing the fall detector. To
control the time the person spends in bed and also to detect falls from the bed. [23]
PIC. 9: FATE - FALL DETECTOR FOR
ELDERLY PROJECT [PIC07]

38 Daily activity monitoring using a device with accelerometers
WISEL - WIRELESS INSOLE FOR INDEPENDENT & SAFE ELDERLY LIVING
The main goal of WIISEL is to develop a flexible research tool to collect and analyze gait
data from real users and correlate parameters related with the risk of falls from the
elderly population. The potential utility is enabling the early identification of functional
mobility decline in performance (i.e. assessment of motor fluctuations and disease
progression) and enabling fall detection in the home setting. [24]
PIC. 10: WISEL TECHNICAL SOLUTION [PIC08]
The WIISEL tool will consist of a combination of a flexible software platform together with
wearable insole device collecting data related with gait. Risk of falls will be assessed based
on multiple gait parameters and gait pattern
recognition. Thanks to a wireless system and
several sensors embedded into the insole, the data
captured by the movement of the foot are sent
first to a mobile device and later to a server, so that
the evolution of a patient can be monitored
remotely in terms of gait, fall risk, activity and
mobility. (PIC. 10) [24]
The main progress of the work till May 2013 was that the final design maximizes battery
duration, comfort and usability. [24]
During the period since May 2013 till November 2013 first insoles prototypes (PIC. 11)
have been developed, which include 14 sensors in each insole, a combined 3-axis
accelerometer and 3-axis gyroscope to monitor the chosen spatial and temporal
parameters as fall risk indicators. As for the data analysis, the feasibility of the pattern
recognition algorithm has been confirmed and a data analysis and prediction framework
has been designed and developed. [24]
And today’s situation is really interesting for a market because the WIISEL insole system
was successfully tested by elderly in Ireland and Israel. [24]
PIC. 11: WISEL INSOLES PROTOTYPES [PIC08]

39 LITERATURE REVIEW
39 LITERATURE REVIEW
A STUDY OF POSITION INDEPENDENT ALGORITHMS FOR PHONE-BASED GAIT FREQUENCY
DETECTION
The main issue with smartphone-based gait frequency estimation algorithms is how to
adjust for variations in orientation and location of the phone on the human body.
Researchers use sensor data collected from volunteers walking with a smartphone
exploiting kinematic sensors and test two different methods of extracting step frequency:
time domain peak counting and spectral analysis. [25]
This study suggests a hybrid approach where both time-domain and spectral approaches
be used together to complement each other’s shortcomings. [25]
ACCELERATION PATTERNS OF THE HEAD AND PELVIS WHEN WALKING ON LEVEL AND
IRREGULAR SURFACES
The aim of this study was to evaluate acceleration patterns at the head and pelvis while
subjects walked on a level and an irregular walking surface, to develop an understanding
of how the postural control system responds to challenging walking conditions. Linear
accelerations of the body were measured along three orthogonal axes using two tri-axial
piezo-resistant accelerometers. [44]
The head accelerometer was mounted on the
top of a lightweight foam bicycle helmet. The
pelvis accelerometer was affixed to a plate
firmly strapped onto the subject with a belt at
the level of the sacrum. (PIC. 12) The
accelerometers were connected to a light-
weight laptop computer via a data acquisition
card interface and both were housed in a small
backpack. The entire apparatus weighed 2.5 kg.
The shoe sole hardness [45] and heel height [46]
influence balance performance and footwear
also influences walking speed. To control for this potential confounding influence, all
subjects were provided with standard Oxford-style lace-up shoes with a suede upper and
nitrile rubber sole. [44]
PIC. 12: WALKING ON IRREGULAR SURFACE
[PIC09]

40 Daily activity monitoring using a device with accelerometers
A 20 m long walkway consisted of 5 mm-pile artificial grass underlain with two layers of
20 mm-thick soft foam rubber and 20 mm thick wooden blocks of varying sizes and
shapes in an arbitrary manner was constructed to provide a partially yielding, irregular
walking surface. Head and pelvis accelerations were sampled at 200 Hz. [44]
The following variables were then calculated. Walking velocity (m/s), cadence
(steps/min), average step length (cm), walk ratio, acceleration root mean square (RMS),
acceleration amplitude variability and harmonic ratio. [44]
When walking on the irregular surface, significantly greater accelerations were evident at
the pelvis in all three directions. [44]
41 LITERATURE REVIEW
PIC. 13: POSITIONING OF PROJECTS
42 Daily activity monitoring using a device with accelerometers
2.2 GYROSCOPE AND ACCELEROMETER
The most important for a practical part of the thesis is a knowledge of gyroscope and
accelerometer principles. Gyroscope detects a rotational motion, more precisely steady
rotational motion and is specified in the chapter 2.2.1. On the other side, an
accelerometer measures a value of deflection of an internal MEMS structure such a result
of acceleration and its principle is explained in the chapter 2.2.2. The overview about
MEMS technology comes below in the chapter 2.2.3.
2.2.1 GYROSCOPE
Gyroscope is a device for measuring orientation. It uses the principle of preserving
angular momentum.
Gyroscopes exist on several operating principles such as the mechanic, electronic,
microchip-packaged MEMS gyroscope devices found in consumer electronic devices,
solid-state ring lasers, fiber optic gyroscopes, and the extremely sensitive quantum
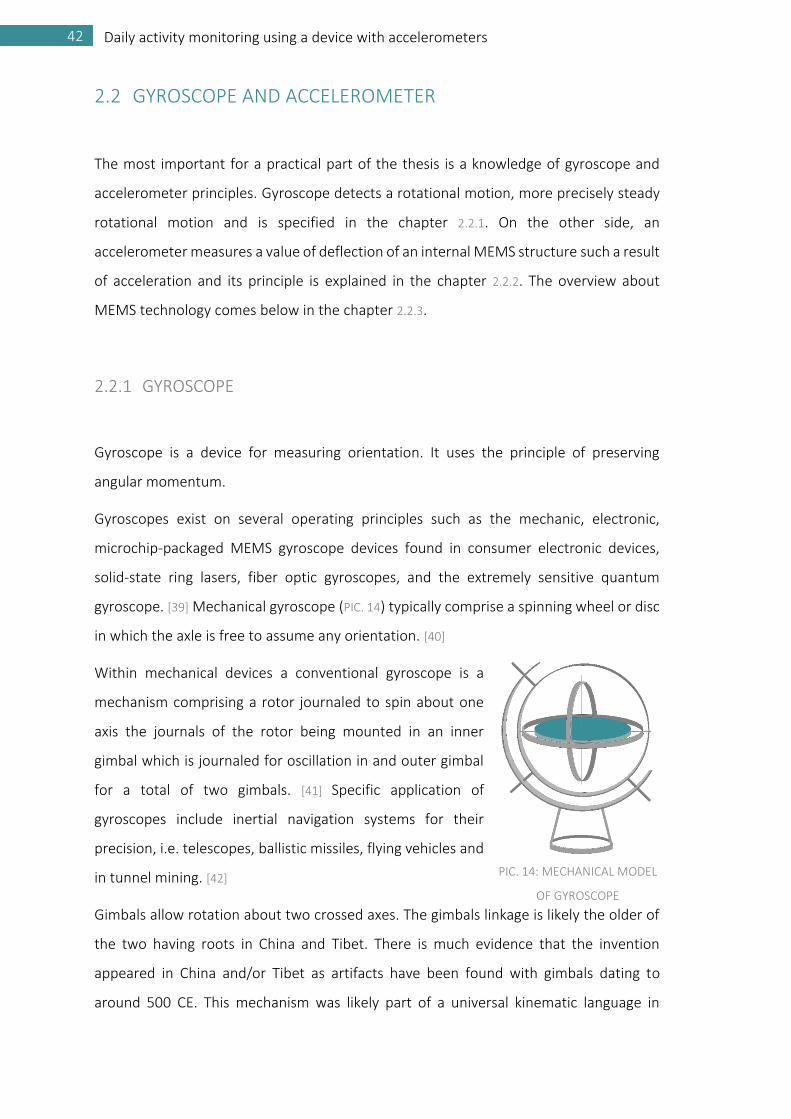
gyroscope. [39] Mechanical gyroscope (PIC. 14) typically comprise a spinning wheel or disc
in which the axle is free to assume any orientation. [40]
Within mechanical devices a conventional gyroscope is a
mechanism comprising a rotor journaled to spin about one
axis the journals of the rotor being mounted in an inner
gimbal which is journaled for oscillation in and outer gimbal
for a total of two gimbals. [41] Specific application of
gyroscopes include inertial navigation systems for their
precision, i.e. telescopes, ballistic missiles, flying vehicles and
in tunnel mining. [42]
Gimbals allow rotation about two crossed axes. The gimbals linkage is likely the older of
the two having roots in China and Tibet. There is much evidence that the invention
appeared in China and/or Tibet as artifacts have been found with gimbals dating to
around 500 CE. This mechanism was likely part of a universal kinematic language in
PIC. 14: MECHANICAL MODEL
OF GYROSCOPE
43 GYROSCOPE AND ACCELEROMETER
43 LITERATURE REVIEW
several parts of the world and may not have a unique inventor but the most speculated
is Leonardo da Vinci. [43]
The outer gimbal is mounted so as to pivot about an axis in its own plane determined by
the support. The inner gimbal is mounted in the gyroscope frame so as to pivot about an
axis in its own plane that is always perpendicular to the pivotal axis of the gyroscope
frame. The axle of the spinning wheel defines the spin axis.
2.2.2 ACCELEROMETER
Accelerometers are used for acceleration measuring, vibrations and mechanical impacts
(pulse load). Acceleration is defined as the first derivation of velocity and the second
derivation of movement in time (2.1)
𝑎 =d𝑣
d𝑡=
d2𝑥
d𝑡2 (2.1)
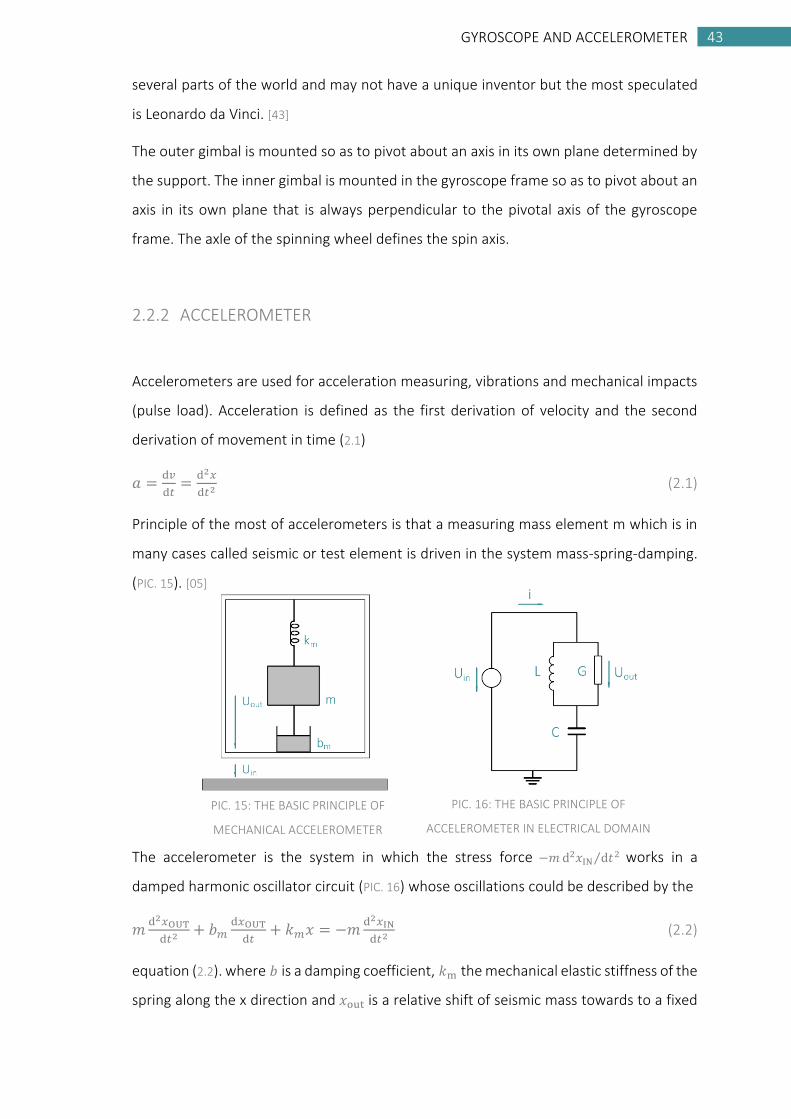
Principle of the most of accelerometers is that a measuring mass element m which is in
many cases called seismic or test element is driven in the system mass-spring-damping.
(PIC. 15). [05]
The accelerometer is the system in which the stress force −𝑚d2𝑥IN d𝑡2⁄ works in a
damped harmonic oscillator circuit (PIC. 16) whose oscillations could be described by the
𝑚d2𝑥OUT
d𝑡2+ 𝑏𝑚
d𝑥OUT
d𝑡+ 𝑘𝑚𝑥 = −𝑚
d2𝑥IN
d𝑡2 (2.2)
equation (2.2). where 𝑏 is a damping coefficient, 𝑘m the mechanical elastic stiffness of the
spring along the x direction and 𝑥out is a relative shift of seismic mass towards to a fixed
PIC. 15: THE BASIC PRINCIPLE OF
MECHANICAL ACCELEROMETER
PIC. 16: THE BASIC PRINCIPLE OF
ACCELEROMETER IN ELECTRICAL DOMAIN
44 Daily activity monitoring using a device with accelerometers
frame. When an acceleration conditions are constant than the shift 𝑥out is directly
proportional to an input acceleration d2𝑥in d𝑡2⁄ ,it could be said that
𝑥OUT =𝑚
𝑘𝑚
d2𝑥IN
d𝑡2 (2.3)
In electrical domain (PIC. 16) a voltage is equal to a velocity and a transfer function could
be formulated in a form (2.4) where 𝑍LG is a complex impedance of parallel combination
of an inductance-conductivity and 𝑋C expresses a capacitance. Majority of
accelerometers works on a principle of transfer a test element to electrical signal. [05]
𝑈OUT
𝑈IN=
𝑍LG
𝑋C+𝑍LG (2.4)
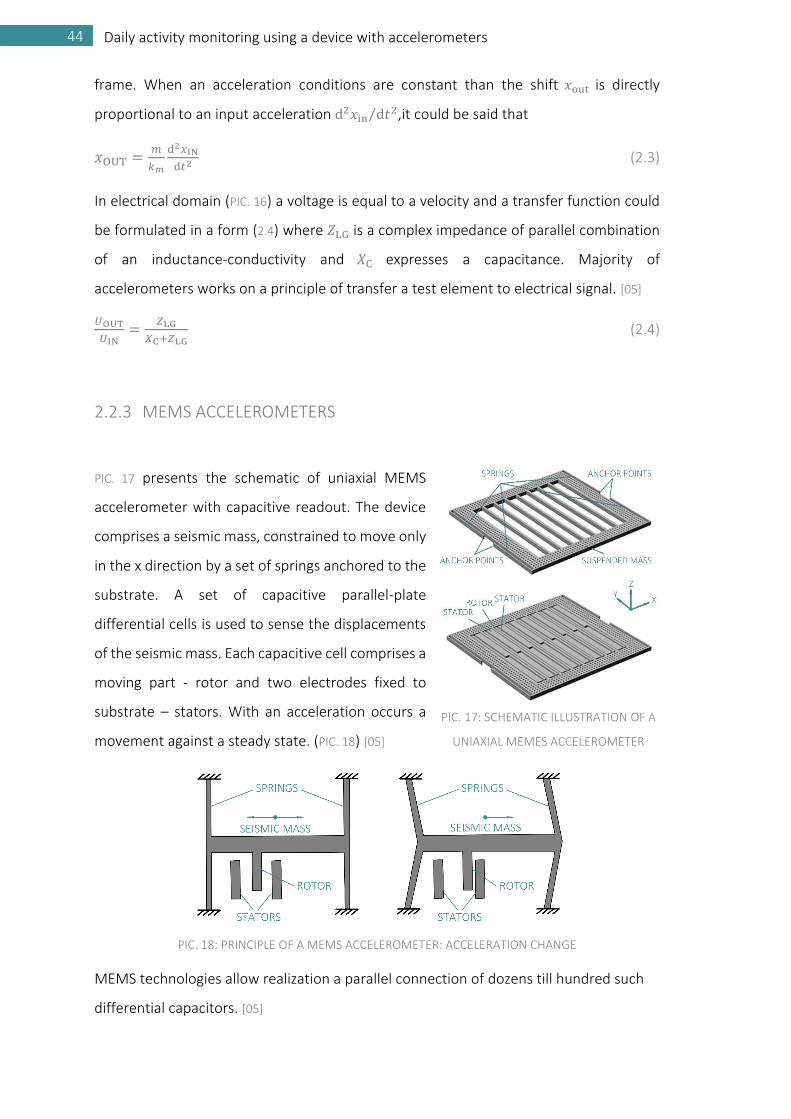
2.2.3 MEMS ACCELEROMETERS
PIC. 17 presents the schematic of uniaxial MEMS
accelerometer with capacitive readout. The device
comprises a seismic mass, constrained to move only
in the x direction by a set of springs anchored to the
substrate. A set of capacitive parallel-plate
differential cells is used to sense the displacements
of the seismic mass. Each capacitive cell comprises a
moving part - rotor and two electrodes fixed to
substrate – stators. With an acceleration occurs a
movement against a steady state. (PIC. 18) [05]
PIC. 18: PRINCIPLE OF A MEMS ACCELEROMETER: ACCELERATION CHANGE
MEMS technologies allow realization a parallel connection of dozens till hundred such
differential capacitors. [05]
PIC. 17: SCHEMATIC ILLUSTRATION OF A
UNIAXIAL MEMES ACCELEROMETER

45 PRACTICAL PART
45 LITERATURE REVIEW
3 PRACTICAL PART
This chapter describes the practical part. The measuring board assembling will be
presented here in 3.1. The documentation for assembling of this measuring board is a part
of this chapter, as well as detailed information about main components. These are
Motion Processing Unit MPU-6050 (3.1.2) and Bluetooth Modul HC-06 (3.1.3). For a
practical usability for the wearable device, the measuring board was covered with a black
plastic box and fixed to a black armband.
Solutions of measuring wearable device positioning will be presented in the chapter 3.2.
Following the literature review the best positions for device were selected. The final set
of placements contains caudal head arm, trunk, wrist, thigh, hip, knee and ankle. In
subheads of this chapter the pros and cons of projected use of sensors will be presented.
In the chapter 3.3 experiments and an experimental protocol to verify individual solutions
of measuring wearable device positioning are explained. The three main exercises are
Chair, Bed and Gait. Each of them contains two or more experimental protocols, which
will be presented in this chapter.
Data preprocessing in Matlab and the methodology of a signal evaluation usability could
be find in chapters 3.4 and 3.5.
46 Daily activity monitoring using a device with accelerometers
3.1 MEASURING BOARD
For experiments to verify individual solutions of measuring wearable device positioning
the very device had to be constructed. Requirements for the device were accuracy,
wearability, size and weight. Actually its size was something for discussion because this
device is only for laboratory purpose so the minimalism was not the main aim. Assembling
of measuring board is described in a chapter 3.1.1. Principal components are Motion
processing unit MPU-6050 (3.1.2) and Bluetooth Modul HC-06 (3.1.3) both from Arduino.
The documentation of a measuring board was done and it will be presented below.
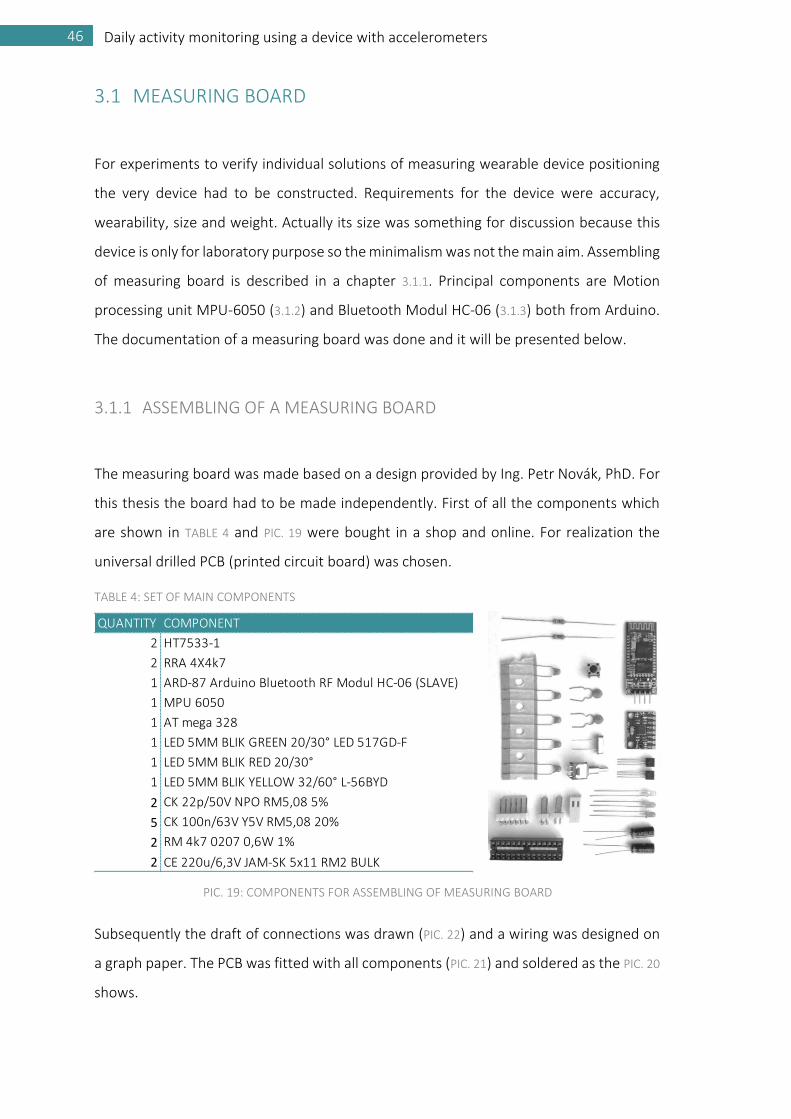
3.1.1 ASSEMBLING OF A MEASURING BOARD
The measuring board was made based on a design provided by Ing. Petr Novák, PhD. For
this thesis the board had to be made independently. First of all the components which
are shown in TABLE 4 and PIC. 19 were bought in a shop and online. For realization the
universal drilled PCB (printed circuit board) was chosen.
TABLE 4: SET OF MAIN COMPONENTS
Subsequently the draft of connections was drawn (PIC. 22) and a wiring was designed on
a graph paper. The PCB was fitted with all components (PIC. 21) and soldered as the PIC. 20
shows.
QUANTITY COMPONENT
2 HT7533-1
2 RRA 4X4k7
1 ARD-87 Arduino Bluetooth RF Modul HC-06 (SLAVE)
1 MPU 6050
1 AT mega 328
1 LED 5MM BLIK GREEN 20/30° LED 517GD-F
1 LED 5MM BLIK RED 20/30°
1 LED 5MM BLIK YELLOW 32/60° L-56BYD
2 CK 22p/50V NPO RM5,08 5%
5 CK 100n/63V Y5V RM5,08 20%
2 RM 4k7 0207 0,6W 1%
2 CE 220u/6,3V JAM-SK 5x11 RM2 BULK
PIC. 19: COMPONENTS FOR ASSEMBLING OF MEASURING BOARD

47 MEASURING BOARD
47 LITERATURE REVIEW
The measuring board is primarily powered by 4 AA batteries but there is a connector for
an adapter too. For measuring of acceleration the motion processing unit MPU-6050 was
selected and its functions are described in the next chapter 3.1.2. For data transmission
the Arduino Bluetooth Modul HC-06 (TABLE 4) (PIC. 19) was used.
PIC. 22: DRAFT OF CONNECTIONS
҉҉
҉―
――
҉҉
҉҉
҉҉
҉҉
҉҉
҉҉
҉
҉|
҉҉
҉―
――
―҉
҉҉
|҉
҉҉
҉҉
҉҉
҉|
|҉
҉
҉|
|҉
҉
҉|
|҉
҉―
――
҉҉
҉|
||
҉҉
――
҉҉
҉҉
҉҉
҉|
|҉
҉―
――
҉҉
||
҉҉
҉―
҉҉
҉҉
҉
҉҉
҉҉
҉҉
҉҉
҉҉
҉҉
҉҉
҉ ҉ ҉
҉҉
҉҉
҉҉
҉҉
҉҉
҉҉
҉҉
҉
҉҉
҉҉
҉҉
҉҉
҉
|҉
҉҉
҉҉
҉҉
҉҉
҉҉
҉҉
҉
PIC. 20: PCB SOLDERED PIC. 21: PCB FITTED WITH ALL COMPONENTS

48 Daily activity monitoring using a device with accelerometers
For a user friendly data access the Sensors Base Application was used [51]. This application
allows to add and edit patient’s cards. After a successfully set, the measuring start or stop
simply by pressing a button. Then the record is paired with selected patient and the data
are obtained in two separated files. These files are then loaded to Matlab (Matrix
Laboratory) (3.4).
PIC. 23: MEASURING BOARD
For a practical usability the measuring board (PIC. 23) was covered with a black plastic box
and fixed to a black armband (PIC. 24). The armband is equipped with a velcro fastener.
PIC. 24: MEASURING WEARABLE DEVICE

49 MEASURING BOARD
49 LITERATURE REVIEW
3.1.2 MOTION PROCESSING UNIT MPU-6050
The MPU Device provides integrated 6-axis motion processor solution that eliminates the
package-level gyroscope and accelerometer cross-axis misalignment associated with
discrete solutions. The device combines a 3-axis gyroscope and a 3-axis accelerometer on
the same silicon die together with an onboard Digital Motion Processor (DMP) capable of
processing complex 9-axis sensor fusion algorithms using the field-proven and
proprietary MotionFusion engine. [37]
For precision tracking of both fast and slow motions, the MPU-6050 features a user-
programmable gyroscope full-scale range of ±250, ±500, ±1000, and ±2000°/sec (dps).
The parts also have a user-programmable accelerometer full-scale range of ±2g, ±4g, ±8g,
and ±16g. [37]
3.1.3 BLUETOOTH MODUL HC-06
This module permits any microcontroller with a standard RS232 serial port to
communicate with a PC or a Smartphone equipped with a Bluetooth Master module. Its
main specifications are: [36]
Bluetooth number: JY-MCU-HC-06, surface mount with
Integrated antenna
Operating Voltage: 5 volt, reduced to 3.3 volts, @ 8 ma.
Default baud rate: 9600 bps.
Default pin: 1234
Default name: BlueBolt.
Class: 2, with up to 10 meter coverage.

50 Daily activity monitoring using a device with accelerometers
3.2 SOLUTIONS OF MEASURING WEARABLE DEVICE POSITIONING
Following the literature review the best positions for device placement are trunk, hip and
a shoe. But the approach in these projects is not similar to this thesis so another possible
positions have to be examined.
The final set of placements contains caudal head, arm, trunk, wrist, thigh, hip, knee and
ankle. In subheads below the pros and cons of projected use of sensors placed on a
various body parts are presented. These thoughts are clearly structured into the TABLE 5.
These are thoughts that will be examined and evaluated by experimental measuring. (4.1)
TABLE 5: PROJECTED USE OF SENSORS PLACED ON VARIOUS BODY PARTS (O PROS, - CONS)
FALL
DETECTION
CADENCE
MONITORING
BALANCE
MONITORING
SITTING
UP/DOWN ON
A BED
SITTING
UP/DOWN ON
A CHAIR
HEAD o ‐ o o o
ARM o ‐ ‐ ‐ o
TRUNK o ‐ o o o
WRIST ‐ ‐ ‐ ‐ ‐
HIP o ‐ o ‐ o
THIGH o o o ‐ o
KNEE ‐ o ‐ ‐ ‐
ANKLE ‐ o ‐ ‐ ‐
POSITION

51 SOLUTIONS OF MEASURING WEARABLE DEVICE POSITIONING
51 LITERATURE REVIEW
3.2.1 SENSOR PLACED ON A HEAD
The greatest use of a sensor placed on a head (PIC. 25) is for balance
examination. It should be helpful for fall detection because of its
height place. But there is not a center of gravity on a head so this
position has a weakness. With this position is possible to measure
a person who is sitting/getting up on/of a bed. With the sensor on
a head it is not a potentiality to measure steps parameters.
3.2.2 SENSOR PLACED ON AN ARM
This position is not determined for a precise measuring of fractional
movements of participants due to its interferences caused by arm
movement when walking. On the other side a sensor placed on an arm
(PIC. 26) should be used for a long-term measuring such as walking,
running or riding a bike. This solution is highly used by commercial
sport-testers which probably have a high sampling rate but they don’t
use all samples in the end. This positioning is also well applicable for a
fall detection for its high place.
3.2.3 SENSOR PLACED ON A TRUNK LIKE A BRACELET
Sensor which is placed on a trunk like a bracelet is one of the best
positions on upper body. The sensor is closer to a center of
gravity then a head but the bracelet movement causes
inaccuracies. The better way is a fixed bracelet (PIC. 27) when
movements are suppressed. This placement is useable for a fall
detection, sitting up/down on a bed measurement, sitting
up/down on a chair measurement, long-term measuring, but the
walking and cadence (stride length) measuring should be
problematic.
PIC. 25: SENSOR PLACED
ON A HEAD
PIC. 26: SENSOR
PLACED ON AN ARM
PIC. 27: SENSOR PLACED
ON A TRUNK
52 Daily activity monitoring using a device with accelerometers
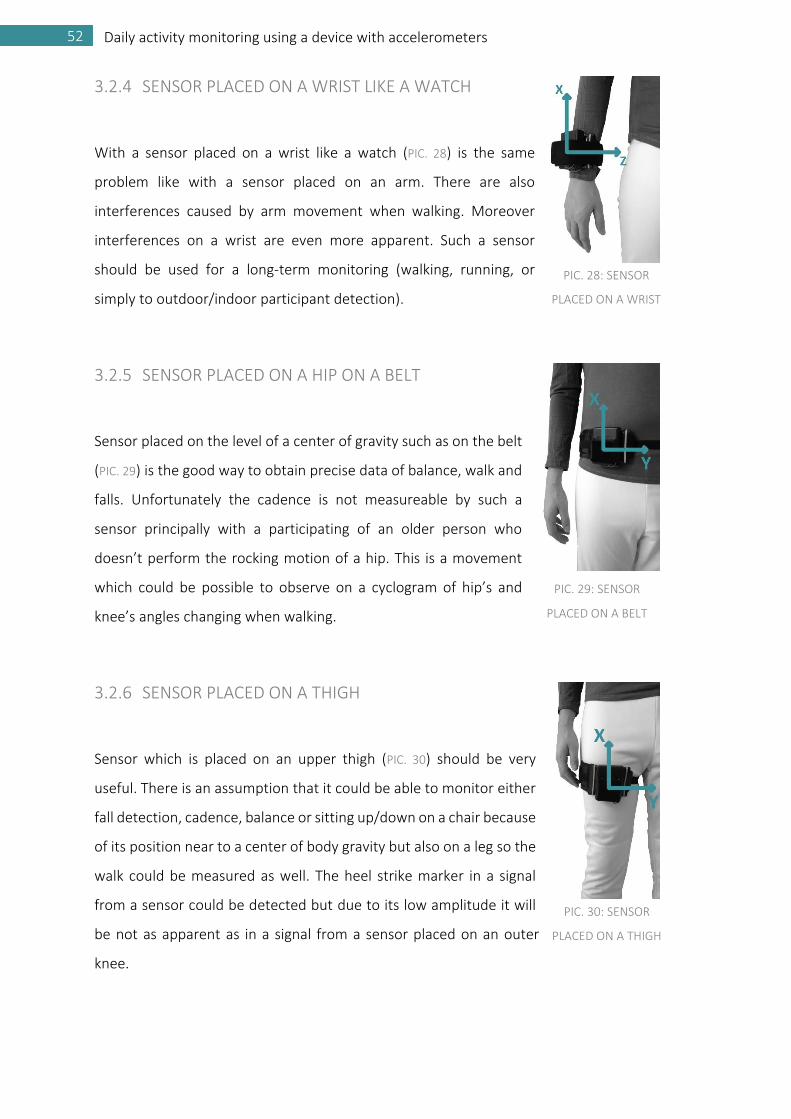
3.2.4 SENSOR PLACED ON A WRIST LIKE A WATCH
With a sensor placed on a wrist like a watch (PIC. 28) is the same
problem like with a sensor placed on an arm. There are also
interferences caused by arm movement when walking. Moreover
interferences on a wrist are even more apparent. Such a sensor
should be used for a long-term monitoring (walking, running, or
simply to outdoor/indoor participant detection).
3.2.5 SENSOR PLACED ON A HIP ON A BELT
Sensor placed on the level of a center of gravity such as on the belt
(PIC. 29) is the good way to obtain precise data of balance, walk and
falls. Unfortunately the cadence is not measureable by such a
sensor principally with a participating of an older person who
doesn’t perform the rocking motion of a hip. This is a movement
which could be possible to observe on a cyclogram of hip’s and
knee’s angles changing when walking.
3.2.6 SENSOR PLACED ON A THIGH
Sensor which is placed on an upper thigh (PIC. 30) should be very
useful. There is an assumption that it could be able to monitor either
fall detection, cadence, balance or sitting up/down on a chair because
of its position near to a center of body gravity but also on a leg so the
walk could be measured as well. The heel strike marker in a signal
from a sensor could be detected but due to its low amplitude it will
be not as apparent as in a signal from a sensor placed on an outer
knee.
PIC. 28: SENSOR
PLACED ON A WRIST
PIC. 29: SENSOR
PLACED ON A BELT
PIC. 30: SENSOR
PLACED ON A THIGH

53 SOLUTIONS OF MEASURING WEARABLE DEVICE POSITIONING
53 LITERATURE REVIEW
3.2.7 SENSOR PLACED ON AN OUTER KNEE
Sensor which is placed on an outer knee (PIC. 31) helps to monitor
everything about a participant’s gait. Measuring of angles of a knee in
time gives us a clear vision about a gait velocity, acceleration and
cadence so the sensor based on accelerometer is predestinated for
gait monitoring. On the other side such a sensor is not determined for
fall detection considering its quite low position.
3.2.8 SENSOR PLACED AROUND AN ANKLE
With a sensor placed around an ankle (PIC. 32) is the same problem
like with a sensor placed on an outer knee with a fall detection,
balance or sitting up/down on a chair. But for the cadence
monitoring it could be the best way.
PIC. 31: SENSOR PLACED
ON AN OUTER KNEE
PIC. 32: SENSOR PLACED
AROUND AN ANKLE

54 Daily activity monitoring using a device with accelerometers
3.3 EXPERIMENTS TO VERIFY MEASURING WEARABLE DEVICE POSITIONING
The series of observations and measurements were performed to compare and verify
individual solutions of measuring wearable device positioning. The participants were
studied in their own home environments. First of all the short exercises were rehearsed
with the participant and then measured with the device on the specific parts of their
body. Selected parts were caudal head, arm, trunk, wrist, hip, knee and ankle.
For measuring the short exercises the set of experimental protocols was created and their
procedure is described below (TABLE 6). About 2 sec extra steady was measured between
each phase of an exercise for a following data processing and recognizing phases among
themselves.
TABLE 6: EXPERIMENTAL PROTOCOLS
EXERCISE EXERCISE TYPE EXPERIMENTAL PROTOCOL
CHAIR SIT DOWNThe subject stands still above a chair and after a while sits down on a
chair
STAND UPThe subject sits still on a chair and after a while stands up above a
chair
BED LIE DOWNThe subject stands still above a bed and after a while sits on a bed,
puts down his feet on the bed and lies down on the bed
GET UPThe subject lies still on a bed on his back and after a while sits up on
a bed, puts down his feet on the floor and stands up above the bed
GAIT SLOW WALKThe subject stands still and after a while walks slow straight 5 m and
stops
SLOW WALK
WITH A TURN
The subject stands still and after a while walks slow straight 5 m,
turns on a place and walks slow back again
NORMAL WALKThe subject stands still and after a while walks straight 5 m and
stops
NORMAL WALK
WITH A TURN
The subject stands still and after a while walks straight 5 m, turns on
a place and walks back again
SWIFT WALKThe subject stands still and after a while walks swift straight 5 m and
stops
SWIFT WALK
WITH A TURN
The subject stands still and after a while walks swift straight 5 m,
turns on a place and walks swift back again
WALK UPSTAIRS The subject stands still and after a while walks up 12 stairs and stops
WALK
DOWNSTAIRS
The subject stands still and after a while walks down 12 stairs and
stops

55 EXPERIMENTS TO VERIFY MEASURING WEARABLE DEVICE POSITIONING
55 LITERATURE REVIEW
3.3.1 EXPERIMENTS WITH A CHAIR
These experiments should simulate the most perform activity from all seniors’ daily
activities. From such as experiments it is possible to obtain data about senior’s motion
during sitting down (3.3.1.1) or standing up (3.3.1.2). It’s possible to find very markers in a
measured signal corresponding to phase of a movement.
3.3.1.1 CHAIR – SIT DOWN
Although the sitting down (PIC. 33) sounds like a quite simple motion
it could be divided into few phases. These phases could be detected
in a signal dependently on sensor positioning on a participant’s body
and its rotation in space. Following markers will be used in evaluation
of measured signals. (4)
B BEGINNING Beginning of a movement which is easily
detectable in a signal by sudden change of
an acceleration amplitude
T TILT Tilt of a trunk is causing the braking, in signal
could be seen as a stopping of an
acceleration amplitude changing and its
contiguous record which is steady in amplitude
D DECELERATION Deceleration of a movement is a next marker which could be
detectable by a recurrence of change of an acceleration
S SHAKE Shake of a body following after a seating is a quick change of an
acceleration in both directions, it could be seen as a peak with
a small amplitude
E END End of a movement which is easily detectable in a signal by
sudden change of an acceleration amplitude
PIC. 33: CHAIR - SIT
DOWN
56 Daily activity monitoring using a device with accelerometers
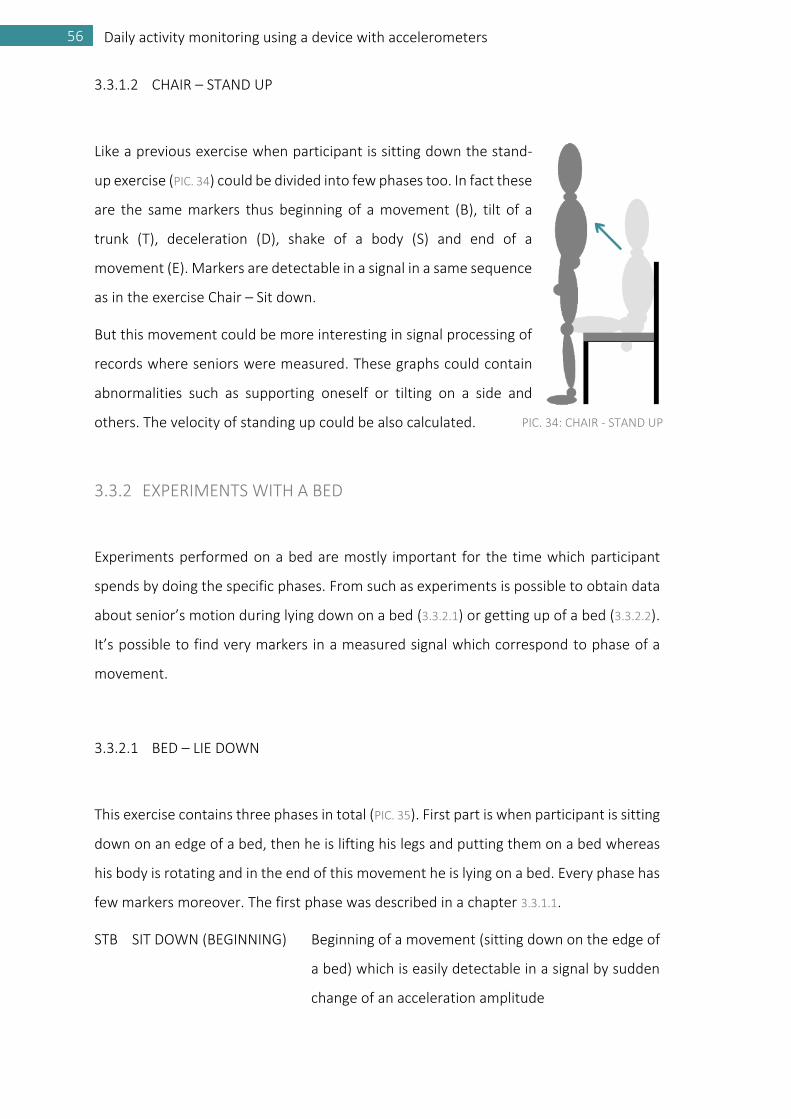
3.3.1.2 CHAIR – STAND UP
Like a previous exercise when participant is sitting down the stand-
up exercise (PIC. 34) could be divided into few phases too. In fact these
are the same markers thus beginning of a movement (B), tilt of a
trunk (T), deceleration (D), shake of a body (S) and end of a
movement (E). Markers are detectable in a signal in a same sequence
as in the exercise Chair – Sit down.
But this movement could be more interesting in signal processing of
records where seniors were measured. These graphs could contain
abnormalities such as supporting oneself or tilting on a side and
others. The velocity of standing up could be also calculated.
3.3.2 EXPERIMENTS WITH A BED
Experiments performed on a bed are mostly important for the time which participant
spends by doing the specific phases. From such as experiments is possible to obtain data
about senior’s motion during lying down on a bed (3.3.2.1) or getting up of a bed (3.3.2.2).
It’s possible to find very markers in a measured signal which correspond to phase of a
movement.
3.3.2.1 BED – LIE DOWN
This exercise contains three phases in total (PIC. 35). First part is when participant is sitting
down on an edge of a bed, then he is lifting his legs and putting them on a bed whereas
his body is rotating and in the end of this movement he is lying on a bed. Every phase has
few markers moreover. The first phase was described in a chapter 3.3.1.1.
STB SIT DOWN (BEGINNING) Beginning of a movement (sitting down on the edge of
a bed) which is easily detectable in a signal by sudden
change of an acceleration amplitude
PIC. 34: CHAIR - STAND UP

57 EXPERIMENTS TO VERIFY MEASURING WEARABLE DEVICE POSITIONING
57 LITERATURE REVIEW
T TILT Tilt of a trunk is causing the braking, in signal could be
seen as a stopping of an acceleration amplitude
changing and its contiguous record which is steady in
amplitude
D DECELERATION Deceleration of a movement is a next marker which
could be detectable by a recurrence of change of an
acceleration
S SHAKE Shake of body following after a seating is a quick
change of an acceleration in both directions, it could
be seen as a peak with a small amplitude
STE SIT DOWN (END) End of a movement (sitting down on the edge of a bed)
which is easily detectable in signal by sudden change of
an acceleration amplitude
PIC. 35: LIE DOWN ON A BED
Second phase contains a specific set of motions which could be detectable in a processed
signal. When a movement starts the legs are lifted from a floor, trunk is leaned back, legs
are bent in knees and all the body is rotated around its own axis to 90°. In the end of this
movement the legs strike on a bed.
LB LEGS (BEGINNING) Beginning of a movement (legs putting on a bed) which is
detectable in signal by sudden change of an acceleration
amplitude
O HEEL AND TOE OFF Heel and toe are lifting and starting to rotate demarcating
by a sharp pulse in a signal right after a beginning of a

58 Daily activity monitoring using a device with accelerometers
movement for sensor placed on upper part of a body it is
caused by muscles clenching during this motion so the
pulse is not so sharp
TE TURN END End of a turn occurs in 1 or 2 seconds after a heel and toe
lifting, in a signal it could be seen as a stopping of changing
of an acceleration amplitude
HS HEEL STRIKE Heel strike on a bed is a next marker which could be
detectable by a recurrence of change of an acceleration as
a quick peak
LE LEGS (END) End of a movement (legs putting on a bed) which is
detectable in signal by sudden change of an acceleration
amplitude
The last phase is quite simple in this type of bed exercise. When participant is lying on a
bed his muscles are clenching to slow down the movement so back and head are put
down softly.
SB LIE DOWN (BEGINNING) Beginning of a movement (lying on a bed) which is
detectable in signal by sudden change of an acceleration
amplitude
M MUSCLES Muscles clenching is a next step which marks start of an
abdominal muscles clenching during a deceleration of a
lying on a bed, in a signal is easily distinguishable as a
quick oscillation of an acceleration amplitude
SE LIE DOWN (END) End of a movement (lying on a bed) which is easily
detectable in signal by sudden change of an acceleration
amplitude
3.3.2.2 BED – GET UP
Like a previous exercise when participant is lying down on a bed, the get up exercise could
be divided into three phases too. In fact these are the same markers which are detectable
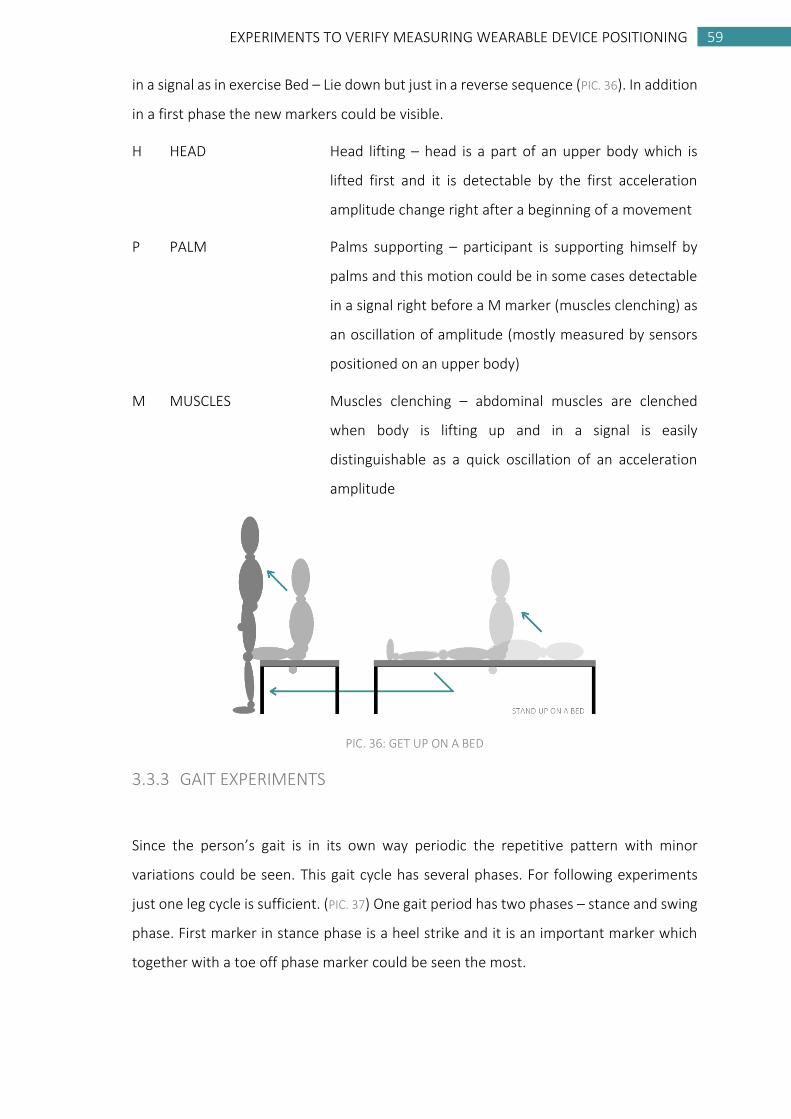
59 EXPERIMENTS TO VERIFY MEASURING WEARABLE DEVICE POSITIONING
59 LITERATURE REVIEW
in a signal as in exercise Bed – Lie down but just in a reverse sequence (PIC. 36). In addition
in a first phase the new markers could be visible.
H HEAD Head lifting – head is a part of an upper body which is
lifted first and it is detectable by the first acceleration
amplitude change right after a beginning of a movement
P PALM Palms supporting – participant is supporting himself by
palms and this motion could be in some cases detectable
in a signal right before a M marker (muscles clenching) as
an oscillation of amplitude (mostly measured by sensors
positioned on an upper body)
M MUSCLES Muscles clenching – abdominal muscles are clenched
when body is lifting up and in a signal is easily
distinguishable as a quick oscillation of an acceleration
amplitude
PIC. 36: GET UP ON A BED
3.3.3 GAIT EXPERIMENTS
Since the person’s gait is in its own way periodic the repetitive pattern with minor
variations could be seen. This gait cycle has several phases. For following experiments
just one leg cycle is sufficient. (PIC. 37) One gait period has two phases – stance and swing
phase. First marker in stance phase is a heel strike and it is an important marker which
together with a toe off phase marker could be seen the most.

60 Daily activity monitoring using a device with accelerometers
Experiments for gait comprise slow, normal and swift walk (3.3.3.1), slow, normal and swift
walk with a turn (3.3.3.2) and walk downstairs (3.3.3.3) and upstairs (3.3.3.4).
PIC. 37: GAIT CYCLE
3.3.3.1 SLOW / NORMAL / SWIFT WALK
This is a simple exercise when participant walks for four meters on a flat floor and then
he stops. (PIC. 38) Three stages of a walk velocity (slow, normal and swift) will be
measuared. The tempo is determined by participant.
H HEEL STRIKE Moment when heel strikes on a floor and an acceleration
amplitude changes itself the very first time during this
movement
F FOOT FLAT Foot is its entire surface in a contact with a floor which is
distinguishable as immediate change of an acceleration
amplitude in signal
M MIDSTANCE Foot is its entire surface in a contact with a floor and a body
weight is transferred to this side which could be seen as a
deceleration in a signal
O HEEL AND TOE OFF Heel and toe lifting from a floor is very important marker
which could be detectable almost in every gait measurement
record as a quick and high peak

61 EXPERIMENTS TO VERIFY MEASURING WEARABLE DEVICE POSITIONING
61 LITERATURE REVIEW
S SWING PHASE Phase when a foot is not in any contact with a floor and
acceleration is quite steady – the amplitude is very low in
comparison with another phases of gait
PIC. 38: 4 METERS SLOW / NORMAL / SWIFT WALK
3.3.3.2 SLOW / NORMAL / SWIFT WALK WITH A TURN
This is a same exercise as a previous one but with a turn at the end of a lane which a PIC.
39 shows. In this exercise same markers like in previous one (heel strike (H), foot flat (F),
midstance (M), heel and toe off (O) and swing phase (S)) could be measured. The new
ones are:
TB TURN (BEGINNING) Beginning of a movement (turn around) which is
detectable in a signal by sudden change of an
acceleration amplitude
TE TURN (END) End of a movement (turn around) which is also
detectable in a signal by sudden change of an
acceleration amplitude
PIC. 39: 4 METERS SLOW / NORMAL / SWIFT WALK WITH A TURN

62 Daily activity monitoring using a device with accelerometers
3.3.3.3 WALK DOWNSTAIRS
This is a simple exercise when participant
stands still and after a while walks
downstairs and stops. (PIC. 40) The tempo
is determined by participant. Detectable
markers are the same as for previous
exercise Gait – Slow walk. But the marker
O (heel and toe off) there is more visible.
3.3.3.4 WALK UPSTAIRS
This is a simple exercise when participant
stands still and after a while walks
UPSTAIRS and stops. (PIC. 41) The tempo is
determined by participant. Detectable
markers are the same as for previous
exercise Gait – Slow walk. But the marker
H (heel strike) there is more visible.
PIC. 40: WALK DOWNSTAIRS
PIC. 41: WALK UPSTAIRS

63 DATA PREPROCESSING IN MATLAB
63 LITERATURE REVIEW
3.4 DATA PREPROCESSING IN MATLAB
The first step of data preprocessing is data obtaining from the sensor Motion Processing
Units MPU-6050. The measured data from sensor’s UniversalStorage are accessible from
Matlab (Matrix Laboratory).
Access to the database is easily mediated by the Matlab function data_input which was
written. The input of this function is a record name. In a code segment below the function
calling is shown.
record = double('PAT_chair_up_s_01');
[acc, gyro, ax, ay, az, wx, wy, wz] = data_input(record);
The function calls the database, sets a profil and selects the patient with the chosen
record. Then obtains accelerometer’s and gyroscops’ values and stores them to variables
acc and gyro. The output of this function are data from accelerometer and gyroscope
which are separated into the independent variables ax, ay, az, wx, wy, wz which
correspond to particular axis and are filtered by a median filter of the third order.
TABLE 7: THE ACCELEROMETER'S SENSITIVITY PER LSB
Here it is necessary to convert the raw data given by the accelerometer into the
acceleration in meters per second. Due to the lowest sensitivity setup (TABLE 7) the full
scale range is 2g and sensitivity is 16384 LSB/g. For recalculation the function raw2clean
was writen and it was used for each axis separately. The output of this function are data
of acceleration in m.s-2.
MS2ax = raw2clean(fsr,sens,ax);
MS2ay = raw2clean(fsr,sens,ay);
MS2az = raw2clean(fsr,sens,az);
ASF_SEL FULL SCALE RANGE LSB SENSITIVITY
0 ±2g 16384 LSB/g
1 ±4g 8192 LSB/g
2 ±8g 4096 LSB/g
3 ±16g 2048 LSB/g

64 Daily activity monitoring using a device with accelerometers
3.5 METHODOLOGY OF A SIGNAL EVALUATION USABILITY
Since data of acceleration in m.s-2 were obtained by preprocessing in Matlab (3.4) it was
possible to make graphs of acceleration signals. After a proper analysis of figures with
consideration of movements in experiments the markers mentioned in the chapter 3.3
were adopted and described.
A tool in Matlab supporting evaluation according the developed methodology was
designed. This tool helps with assessing of particular phases and markers in a specific type
of experiment. For example for a gait analyze the ginput_G() function is called for all of
three axes. The inputs of this function are a color matrix map for a markers‘ colors, a
number 0, 20 or 40 which has to be attributed to an axis for a one plot figure of three
signals with their own amplitude axis and one common time axis.
XY_x = ginput_G(map, 40, 1);
XY_y = ginput_G(map, 20, -1);
XY_z = ginput_G(map, 0, 1);
The ginput_G() function contains an information about all possible markers which could
be obtained by a gait measuring by the wearable device. After a calling this function, the
crosshairs raised in the current axes helps to identify markers in the figure by positioning
the cursor with the mouse. When the marking is done the matrix of all values is saved.
TABLE 8: WEIGHTS OF MARKERS FOR THE MAIN EXPERIMENTS
This method is purely subjective because of a hand-operated marking. Multiple-criteria
decision analysis was used for evaluation. This MCDA problem is represented in the
criterion space which is combined by a weighted linear function (TABLE 8). The highest
weights are assigned to markers H (Heel Strike) and O (Heel and Toe Off) which are
MARKER FOR GAIT - SLOW WALK H F M O S
WEIGHT 0.3 0.2 0.1 0.3 0.1
MARKER FOR CHAIR - SIT DOWN B T D S E
WEIGHT 0.3 0.1 0.2 0.1 0.3
MARKER FOR BED - GET UP SB H M P SE
WEIGHT 0.08 0.051667 0.07 0.051667 0.08
LB O TE HS LE
0.08 0.051667 0.07 0.051667 0.08
STB T D S STE
0.08 0.051667 0.07 0.051667 0.08
65 METHODOLOGY OF A SIGNAL EVALUATION USABILITY
65 LITERATURE REVIEW
predicative about cadence. Particular weights are shown in a chapter 4 in tables TABLE 9,
TABLE 10 and TABLE 11.
Sum of weights for one experiment is equal to one. The most important markers have
the highest values of weights. These are markers for beginning and for the end of a
movement or of phase of a movement.
After marking of specific graph was done, the evaluation was performed by values 0, 1, 2
and 3. Zero for markers which are not visible, 1 for such markers whose indications are
visible, 2 for a partly visible markers and the number 3 for markers which are clearly
visible. Total sum of weighted values for markers in a one axis is then calculated. The
maximal total sum across all axes is choose to represent a suitability of a wearable device
positioning for the specific movement.

66 Daily activity monitoring using a device with accelerometers

67 RESULTS
67 LITERATURE REVIEW
4 RESULTS
In this chapter the measured data will be analyzed. First of all the experimental measuring
with healthy participant was performed (4.1). Following the experimental protocols all the
experiments were conducted. The goal of this experimental measuring is to find
particular markers or phases of movements and assess which position of a wear able
device is the most suitable for monitoring daily activities.
Second part of this chapter is the subhead Verification of experimental measuring (4.2).
Another one healthy participant was measured for the most predicative experiments.
These are Chair – Sit down, Bed – Get up and Gait – Slow walk. These results will be
compared with results from figures for the first participant in reference to suitability
wearable device positioning.
After both measuring the evaluation of the best position of a wearable device (4.3) has to
be done. Then the practical measuring (4.4) could be performed. There will be presented
results for seniors’ daily activities monitoring in chapter 4.4.1 and in the next chapter 4.4.2
the blind record will be analyzed.

68 Daily activity monitoring using a device with accelerometers
4.1 EXPERIMENTAL MEASURING
Following the experimental protocols (TABLE 6) the experiments where performed. For
each experiment all 8 positions of sensor (3.2) were used. The goal of this experimental
measuring is to find particular markers or phases of movements and assess which
position of a wear able device is the most suitable for monitoring daily activities.
The main phases and markers for every exercise where predicted in a chapter 3.3.
Marker’s presence has to be verified by experimental measuring. Participant of all
experiments in this chapter was a man, 25 years old, 178 cm height and 68 kg weight,
healthy, no problems with a musculoskeletal system, no problems with a stability or
spatial orientation.
Three the most important experiments were chosen for evaluation. These experiments
are Chair – Sit down (4.1.1), Bed – Get up (4.1.3) and Gait - Slow walk (4.1.5).
4.1.1 RESULTS OF THE EXPERIMENT CHAIR – SIT DOWN
As was already written in a chapter 3.5, the experiment Chair – Sit down was evaluated
based on subjective visibility of specific markers which are beginning of the movement
(B), tilt of a trunk (T), deceleration (D), shake (S) and end of the movement (E) (3.3.1.1).
Score from zero to three was written down to the TABLE 9, then its total sum was
calculated and the maximal value in axes was chosen as a criteria for the best positioning
selection. Following this methodology suitability of wearable device positioning will be
presented here for comparison in TABLE 9.
The set of placements contains caudal head, arm, trunk, wrist, thigh, hip, knee and ankle.
Sensors placed on an upper body have a more predicative value then the rest of sensors
caused by steady position of participant’s legs and motions of a body during sitting down.
Detected phases in a signal depend on a sensor positioning on a participant's body and
its rotation in space. There is almost none rotation during the sitting down in one axis.
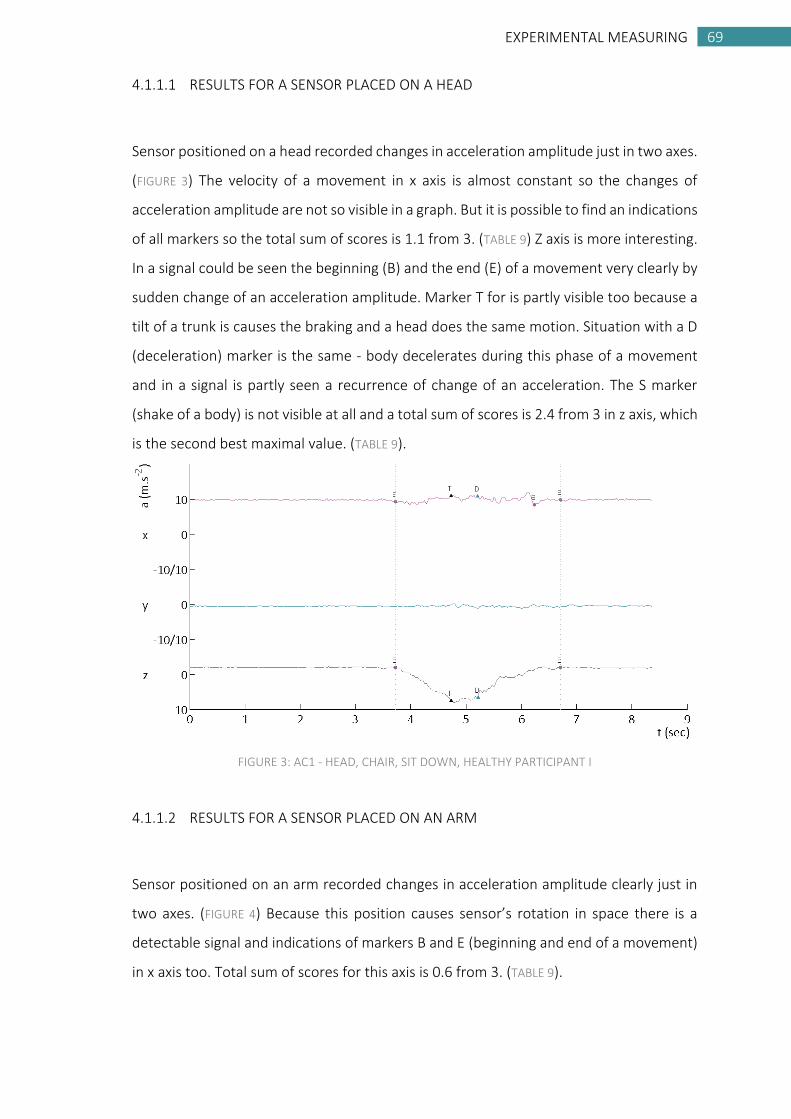
69 EXPERIMENTAL MEASURING
69 LITERATURE REVIEW
4.1.1.1 RESULTS FOR A SENSOR PLACED ON A HEAD
Sensor positioned on a head recorded changes in acceleration amplitude just in two axes.
(FIGURE 3) The velocity of a movement in x axis is almost constant so the changes of
acceleration amplitude are not so visible in a graph. But it is possible to find an indications
of all markers so the total sum of scores is 1.1 from 3. (TABLE 9) Z axis is more interesting.
In a signal could be seen the beginning (B) and the end (E) of a movement very clearly by
sudden change of an acceleration amplitude. Marker T for is partly visible too because a
tilt of a trunk is causes the braking and a head does the same motion. Situation with a D
(deceleration) marker is the same - body decelerates during this phase of a movement
and in a signal is partly seen a recurrence of change of an acceleration. The S marker
(shake of a body) is not visible at all and a total sum of scores is 2.4 from 3 in z axis, which
is the second best maximal value. (TABLE 9).
FIGURE 3: AC1 - HEAD, CHAIR, SIT DOWN, HEALTHY PARTICIPANT I
4.1.1.2 RESULTS FOR A SENSOR PLACED ON AN ARM
Sensor positioned on an arm recorded changes in acceleration amplitude clearly just in
two axes. (FIGURE 4) Because this position causes sensor’s rotation in space there is a
detectable signal and indications of markers B and E (beginning and end of a movement)
in x axis too. Total sum of scores for this axis is 0.6 from 3. (TABLE 9).
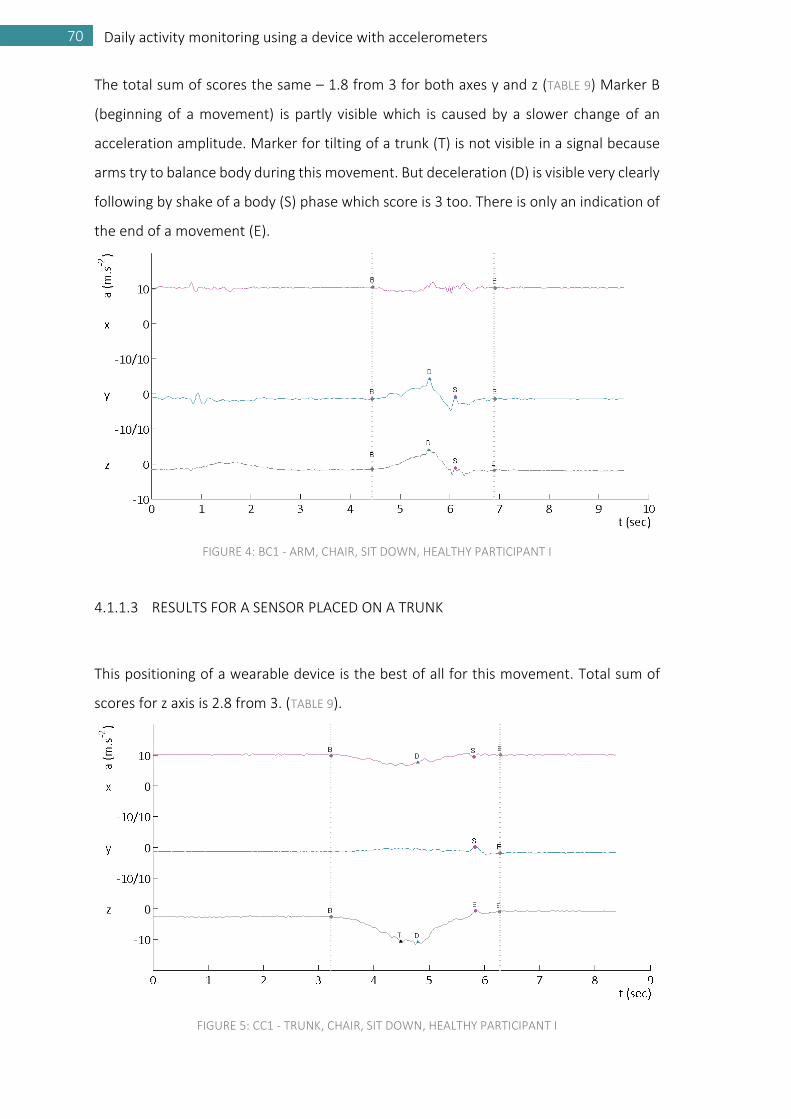
70 Daily activity monitoring using a device with accelerometers
The total sum of scores the same – 1.8 from 3 for both axes y and z (TABLE 9) Marker B
(beginning of a movement) is partly visible which is caused by a slower change of an
acceleration amplitude. Marker for tilting of a trunk (T) is not visible in a signal because
arms try to balance body during this movement. But deceleration (D) is visible very clearly
following by shake of a body (S) phase which score is 3 too. There is only an indication of
the end of a movement (E).
FIGURE 4: BC1 - ARM, CHAIR, SIT DOWN, HEALTHY PARTICIPANT I
4.1.1.3 RESULTS FOR A SENSOR PLACED ON A TRUNK
This positioning of a wearable device is the best of all for this movement. Total sum of
scores for z axis is 2.8 from 3. (TABLE 9).
FIGURE 5: CC1 - TRUNK, CHAIR, SIT DOWN, HEALTHY PARTICIPANT I

71 EXPERIMENTAL MEASURING
71 LITERATURE REVIEW
Substantiation of changes in acceleration amplitude are the same as for a signal obtained
from a sensor placed on a head. Since the second marker T is about a tilt of a trunk and
deceleration (D) is almost immediate it has to be the highest value for the sum of these
markers’ scores. FIGURE 5 shows measuring results of acceleration of sensor which was
fixed on a trunk.
4.1.1.4 RESULTS FOR A SENSOR PLACED ON A WRIST
Sensor positioned on a wrist didn't show changes in acceleration amplitude clearly in any
of axes because this position causes sensor’s rotation in space. Interferences in motions
are much more apparent than in a signal from a sensor placed on an arm. The indication
of a marker B (beginning of a movement) is visible only in x axis (FIGURE 6). Total sum of
scores is only 0.9 from 3, which is the second worst maximal value. (TABLE 9).
FIGURE 6: DC1 - WRIST, CHAIR, SIT DOWN, HEALTHY PARTICIPANT I
4.1.1.5 RESULTS FOR A SENSOR PLACED ON A HIP ON A BELT
Sensor placed on a hip on a belt rotates around y axis during the movement so the T (tilt
of a trunk) and D (deceleration) markers could be visible in x a z axes. (FIGURE 7) Changes
in acceleration amplitude are smaller than in signals from sensors placed on a head or on
a trunk. Total sum of scores is only 1.2 from 3. (TABLE 9).

72 Daily activity monitoring using a device with accelerometers
FIGURE 7: HC1 - BELT, CHAIR, SIT DOWN, HEALTHY PARTICIPANT I
4.1.1.6 RESULTS FOR A SENSOR PLACED ON A THIGH
The signal from a sensor placed on a thigh is different due to sensor’s rotation about y
axis during the sitting movement. Legs are bent in knees and position of a thigh is changed
near to 90°. It is not possible to detect a tilt of a trunk (T) in a signal for this sensor
positioning. (FIGURE 8) Total sum of scores is only 1.9 from 3. (TABLE 9).
FIGURE 8: GC1 - THIGH, CHAIR, SIT DOWN, HEALTHY PARTICIPANT I

73 EXPERIMENTAL MEASURING
73 LITERATURE REVIEW
4.1.1.7 RESULTS FOR A SENSOR PLACED ON A KNEE
Participant’s legs are in a steady position during all the movement, so there is no
detectable marker in a signal but the beginning (B) and end (E) of it. (FIGURE 9) The total
sum of scores is only 0.6 from 3. (TABLE 9).
FIGURE 9: EC1 - KNEE, CHAIR, SIT DOWN, HEALTHY PARTICIPANT I
4.1.1.8 RESULTS FOR A SENSOR PLACED ON AN ANKLE
This is a same situation as for a sensor placed on a knee and it could be seen in a FIGURE
10. The total sum of scores is only 0.6 from 3 and together with scores of a sensor placed
on a knee, this is the worst total sum of scores at all. (TABLE 9).
FIGURE 10: FC1 - ANKLE, CHAIR, SIT DOWN, HEALTHY PARTICIPANT I

74 Daily activity monitoring using a device with accelerometers
4.1.2 EVALUATION OF RESULTS OF THE EXPERIMENT CHAIR – SIT DOWN
Results of the experiment Chair – Sit down confirm propositions which were stated in a
chapter 3.2. For this movement the best of all positioning of a wearable device is on a
trunk. Total sum of scores for z axis is 2.8 from 3. (TABLE 9). As was mentioned in chapters
4.1.1.7 and 4.1.1.8, the total sum of scores for sensor placed on an outer knee or on an
ankle is only 0.6 from 3. (TABLE 9) So for this movement these are the worst positions for
a wearable device. All results are shown in a TABLE 9 for comparison. The best and the
worst variants are highlighted here.
TABLE 9: RESULTS OF THE EXPERIMENT CHAIR - SIT DOWN, HEALTHY PARTICIPANT I, THE BEST POSITION
IS HIGHLIGHTED BY GREEN COLOR, THE WORST POSITION IS HIGHLIGHTED BY GREY COLOR
AXIS B T D S E TOTAL
WEIGHT 0.3 0.1 0.2 0.1 0.3 1
X 1 1 1 2 1 1.1
Y 0 0 0 0 0 0
Z 3 2 2 0 3 2.4
X 1 0 0 0 1 0.6
Y 2 0 3 3 1 1.8
Z 2 0 3 3 1 1.8
X 1 0 1 1 1 0.9
Y 0 0 0 3 1 0.6
Z 3 2 3 2 3 2.8
X 1 1 1 0 1 0.9
Y 0 1 1 0 2 0.9
Z 0 0 1 0 1 0.5
X 1 0 0 0 1 0.6
Y 1 1 1 0 2 1.2
Z 2 1 1 0 1 1.2
X 2 0 2 1 2 1.7
Y 2 0 1 1 1 1.2
Z 3 0 3 1 1 1.9
X 1 0 0 0 0 0.3
Y 1 0 0 0 1 0.6
Z 1 0 0 0 1 0.6
X 0 0 0 0 0 0
Y 1 0 0 0 1 0.6
Z 1 0 0 0 1 0.6
SUITABLE
2.40
1.80
2.80
0.90
1.20
1.90
0.60
0.60
KNEE
ANKLE
POSITION
HEAD
ARM
TRUNK
WRIST
HIP
THIGH
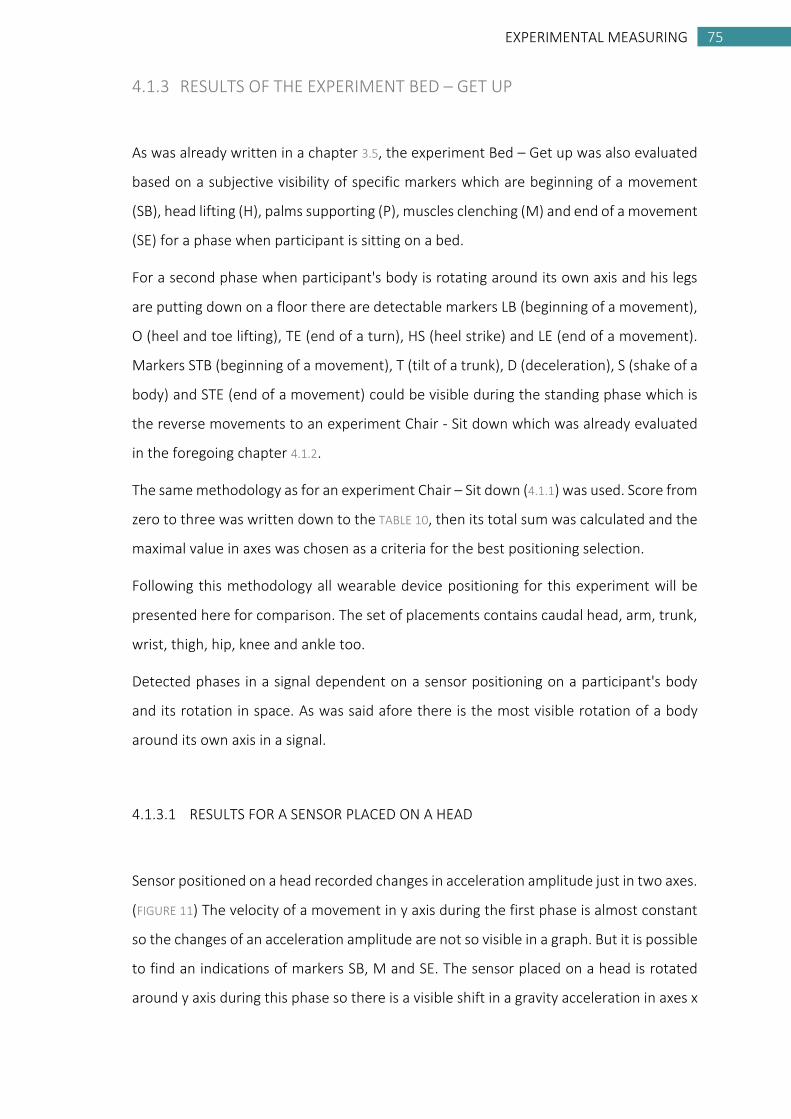
75 EXPERIMENTAL MEASURING
75 LITERATURE REVIEW
4.1.3 RESULTS OF THE EXPERIMENT BED – GET UP
As was already written in a chapter 3.5, the experiment Bed – Get up was also evaluated
based on a subjective visibility of specific markers which are beginning of a movement
(SB), head lifting (H), palms supporting (P), muscles clenching (M) and end of a movement
(SE) for a phase when participant is sitting on a bed.
For a second phase when participant's body is rotating around its own axis and his legs
are putting down on a floor there are detectable markers LB (beginning of a movement),
O (heel and toe lifting), TE (end of a turn), HS (heel strike) and LE (end of a movement).
Markers STB (beginning of a movement), T (tilt of a trunk), D (deceleration), S (shake of a
body) and STE (end of a movement) could be visible during the standing phase which is
the reverse movements to an experiment Chair - Sit down which was already evaluated
in the foregoing chapter 4.1.2.
The same methodology as for an experiment Chair – Sit down (4.1.1) was used. Score from
zero to three was written down to the TABLE 10, then its total sum was calculated and the
maximal value in axes was chosen as a criteria for the best positioning selection.
Following this methodology all wearable device positioning for this experiment will be
presented here for comparison. The set of placements contains caudal head, arm, trunk,
wrist, thigh, hip, knee and ankle too.
Detected phases in a signal dependent on a sensor positioning on a participant's body
and its rotation in space. As was said afore there is the most visible rotation of a body
around its own axis in a signal.
4.1.3.1 RESULTS FOR A SENSOR PLACED ON A HEAD
Sensor positioned on a head recorded changes in acceleration amplitude just in two axes.
(FIGURE 11) The velocity of a movement in y axis during the first phase is almost constant
so the changes of an acceleration amplitude are not so visible in a graph. But it is possible
to find an indications of markers SB, M and SE. The sensor placed on a head is rotated
around y axis during this phase so there is a visible shift in a gravity acceleration in axes x
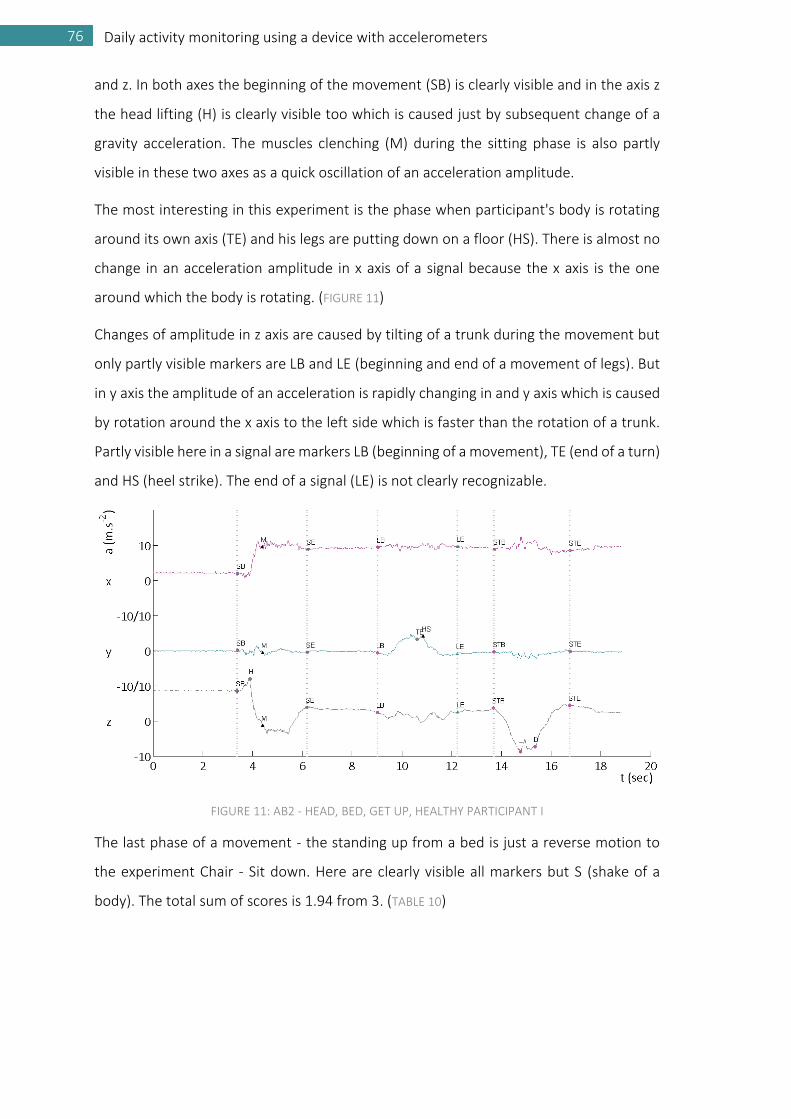
76 Daily activity monitoring using a device with accelerometers
and z. In both axes the beginning of the movement (SB) is clearly visible and in the axis z
the head lifting (H) is clearly visible too which is caused just by subsequent change of a
gravity acceleration. The muscles clenching (M) during the sitting phase is also partly
visible in these two axes as a quick oscillation of an acceleration amplitude.
The most interesting in this experiment is the phase when participant's body is rotating
around its own axis (TE) and his legs are putting down on a floor (HS). There is almost no
change in an acceleration amplitude in x axis of a signal because the x axis is the one
around which the body is rotating. (FIGURE 11)
Changes of amplitude in z axis are caused by tilting of a trunk during the movement but
only partly visible markers are LB and LE (beginning and end of a movement of legs). But
in y axis the amplitude of an acceleration is rapidly changing in and y axis which is caused
by rotation around the x axis to the left side which is faster than the rotation of a trunk.
Partly visible here in a signal are markers LB (beginning of a movement), TE (end of a turn)
and HS (heel strike). The end of a signal (LE) is not clearly recognizable.
FIGURE 11: AB2 - HEAD, BED, GET UP, HEALTHY PARTICIPANT I
The last phase of a movement - the standing up from a bed is just a reverse motion to
the experiment Chair - Sit down. Here are clearly visible all markers but S (shake of a
body). The total sum of scores is 1.94 from 3. (TABLE 10)
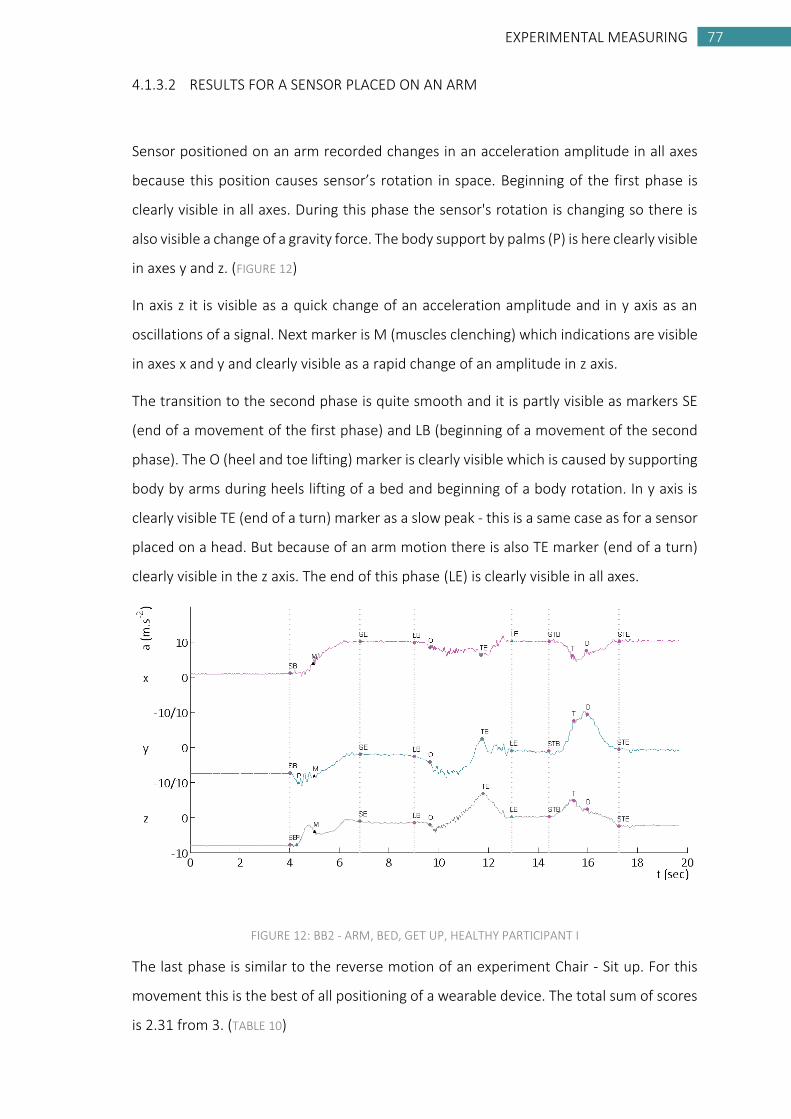
77 EXPERIMENTAL MEASURING
77 LITERATURE REVIEW
4.1.3.2 RESULTS FOR A SENSOR PLACED ON AN ARM
Sensor positioned on an arm recorded changes in an acceleration amplitude in all axes
because this position causes sensor’s rotation in space. Beginning of the first phase is
clearly visible in all axes. During this phase the sensor's rotation is changing so there is
also visible a change of a gravity force. The body support by palms (P) is here clearly visible
in axes y and z. (FIGURE 12)
In axis z it is visible as a quick change of an acceleration amplitude and in y axis as an
oscillations of a signal. Next marker is M (muscles clenching) which indications are visible
in axes x and y and clearly visible as a rapid change of an amplitude in z axis.
The transition to the second phase is quite smooth and it is partly visible as markers SE
(end of a movement of the first phase) and LB (beginning of a movement of the second
phase). The O (heel and toe lifting) marker is clearly visible which is caused by supporting
body by arms during heels lifting of a bed and beginning of a body rotation. In y axis is
clearly visible TE (end of a turn) marker as a slow peak - this is a same case as for a sensor
placed on a head. But because of an arm motion there is also TE marker (end of a turn)
clearly visible in the z axis. The end of this phase (LE) is clearly visible in all axes.
FIGURE 12: BB2 - ARM, BED, GET UP, HEALTHY PARTICIPANT I
The last phase is similar to the reverse motion of an experiment Chair - Sit up. For this
movement this is the best of all positioning of a wearable device. The total sum of scores
is 2.31 from 3. (TABLE 10)
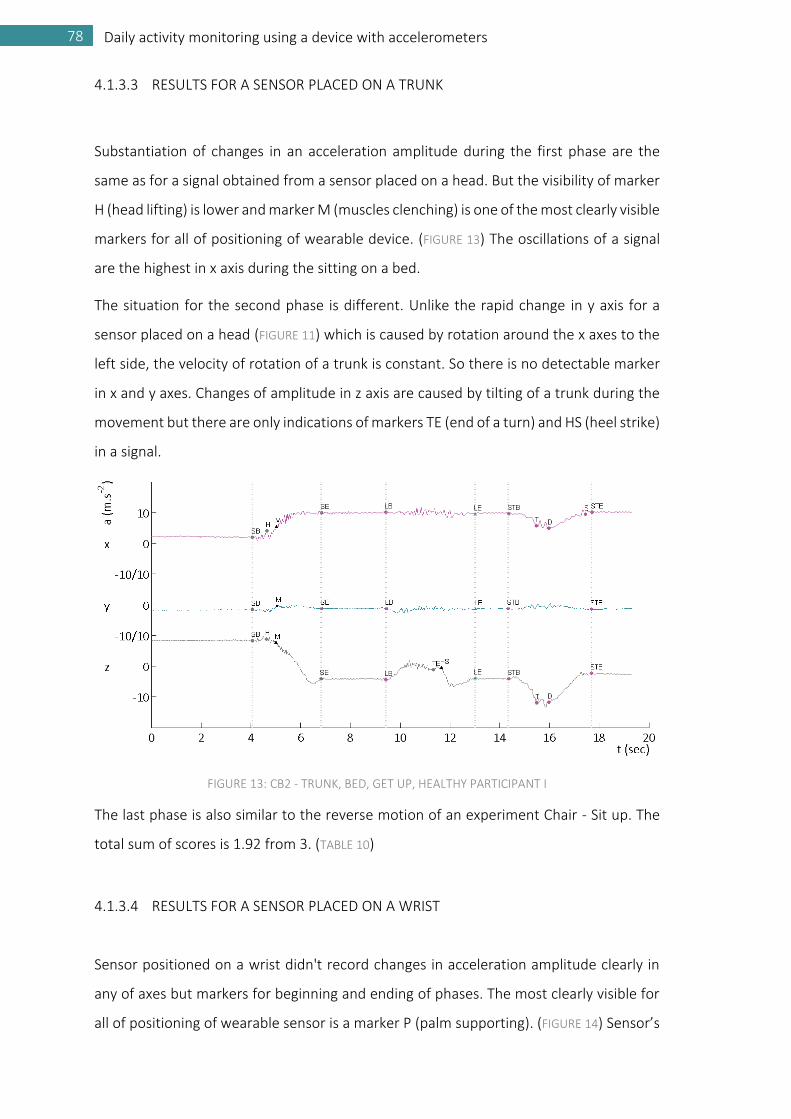
78 Daily activity monitoring using a device with accelerometers
4.1.3.3 RESULTS FOR A SENSOR PLACED ON A TRUNK
Substantiation of changes in an acceleration amplitude during the first phase are the
same as for a signal obtained from a sensor placed on a head. But the visibility of marker
H (head lifting) is lower and marker M (muscles clenching) is one of the most clearly visible
markers for all of positioning of wearable device. (FIGURE 13) The oscillations of a signal
are the highest in x axis during the sitting on a bed.
The situation for the second phase is different. Unlike the rapid change in y axis for a
sensor placed on a head (FIGURE 11) which is caused by rotation around the x axes to the
left side, the velocity of rotation of a trunk is constant. So there is no detectable marker
in x and y axes. Changes of amplitude in z axis are caused by tilting of a trunk during the
movement but there are only indications of markers TE (end of a turn) and HS (heel strike)
in a signal.
FIGURE 13: CB2 - TRUNK, BED, GET UP, HEALTHY PARTICIPANT I
The last phase is also similar to the reverse motion of an experiment Chair - Sit up. The
total sum of scores is 1.92 from 3. (TABLE 10)
4.1.3.4 RESULTS FOR A SENSOR PLACED ON A WRIST
Sensor positioned on a wrist didn't record changes in acceleration amplitude clearly in
any of axes but markers for beginning and ending of phases. The most clearly visible for
all of positioning of wearable sensor is a marker P (palm supporting). (FIGURE 14) Sensor’s
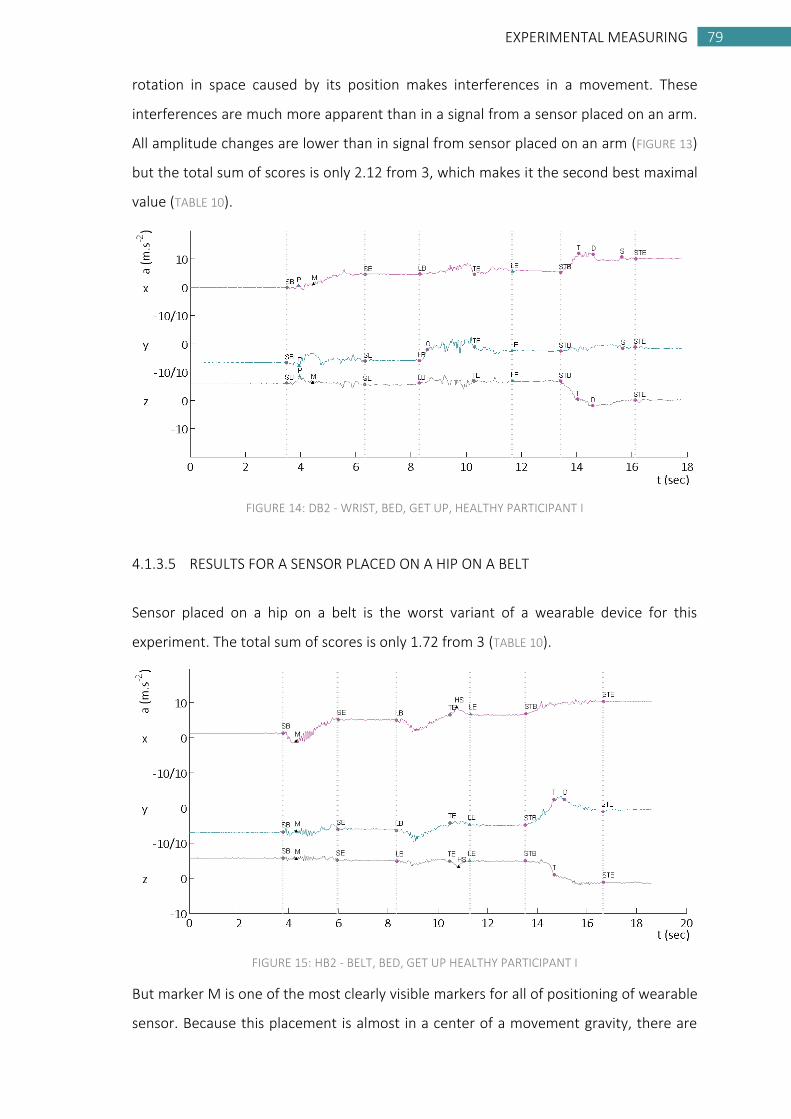
79 EXPERIMENTAL MEASURING
79 LITERATURE REVIEW
rotation in space caused by its position makes interferences in a movement. These
interferences are much more apparent than in a signal from a sensor placed on an arm.
All amplitude changes are lower than in signal from sensor placed on an arm (FIGURE 13)
but the total sum of scores is only 2.12 from 3, which makes it the second best maximal
value (TABLE 10).
FIGURE 14: DB2 - WRIST, BED, GET UP, HEALTHY PARTICIPANT I
4.1.3.5 RESULTS FOR A SENSOR PLACED ON A HIP ON A BELT
Sensor placed on a hip on a belt is the worst variant of a wearable device for this
experiment. The total sum of scores is only 1.72 from 3 (TABLE 10).
FIGURE 15: HB2 - BELT, BED, GET UP HEALTHY PARTICIPANT I
But marker M is one of the most clearly visible markers for all of positioning of wearable
sensor. Because this placement is almost in a center of a movement gravity, there are
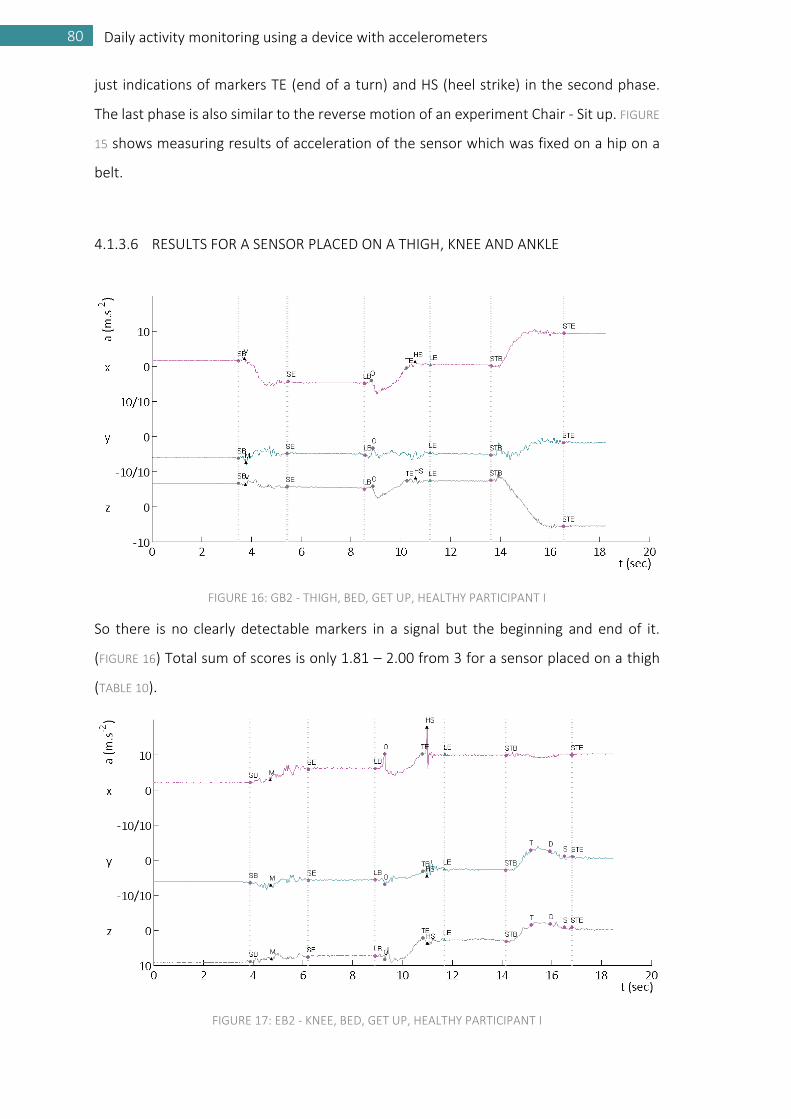
80 Daily activity monitoring using a device with accelerometers
just indications of markers TE (end of a turn) and HS (heel strike) in the second phase.
The last phase is also similar to the reverse motion of an experiment Chair - Sit up. FIGURE
15 shows measuring results of acceleration of the sensor which was fixed on a hip on a
belt.
4.1.3.6 RESULTS FOR A SENSOR PLACED ON A THIGH, KNEE AND ANKLE
FIGURE 16: GB2 - THIGH, BED, GET UP, HEALTHY PARTICIPANT I
So there is no clearly detectable markers in a signal but the beginning and end of it.
(FIGURE 16) Total sum of scores is only 1.81 – 2.00 from 3 for a sensor placed on a thigh
(TABLE 10).
FIGURE 17: EB2 - KNEE, BED, GET UP, HEALTHY PARTICIPANT I

81 EXPERIMENTAL MEASURING
81 LITERATURE REVIEW
For a sensor placed on a knee the total score is 2.00 from 3 (TABLE 10)(FIGURE 17). For a
sensor placed on a knee the total score is 2.00 from 3 (TABLE 10)(FIGURE 17). For a sensor
placed on an ankle the total score is 1.82 from 3 (TABLE 10) (FIGURE 18).
FIGURE 18: FB2 - ANKLE, BED, GET UP, HEALTHY PARTICIPANT I
4.1.4 EVALUATION OF RESULTS OF THE EXPERIMENT BED – GET UP
Results of the experiment Bed – Get up confirm presumptions which were stated in a
chapter 3.2. For this movement the best of all positioning of a wearable device is on an
arm. Total sum of scores for z axis is 2.31 from 3 (TABLE 10). As was mentioned in the
chapter 4.1.3.5, the total sum of scores for sensor placed on a hip on a belt is only 1.72
from 3 (TABLE 10). So for this movement this is the worst position for a wearable device.
All results are shown in a TABLE 10 for comparison. The best and the worst variants are
highlighted here.
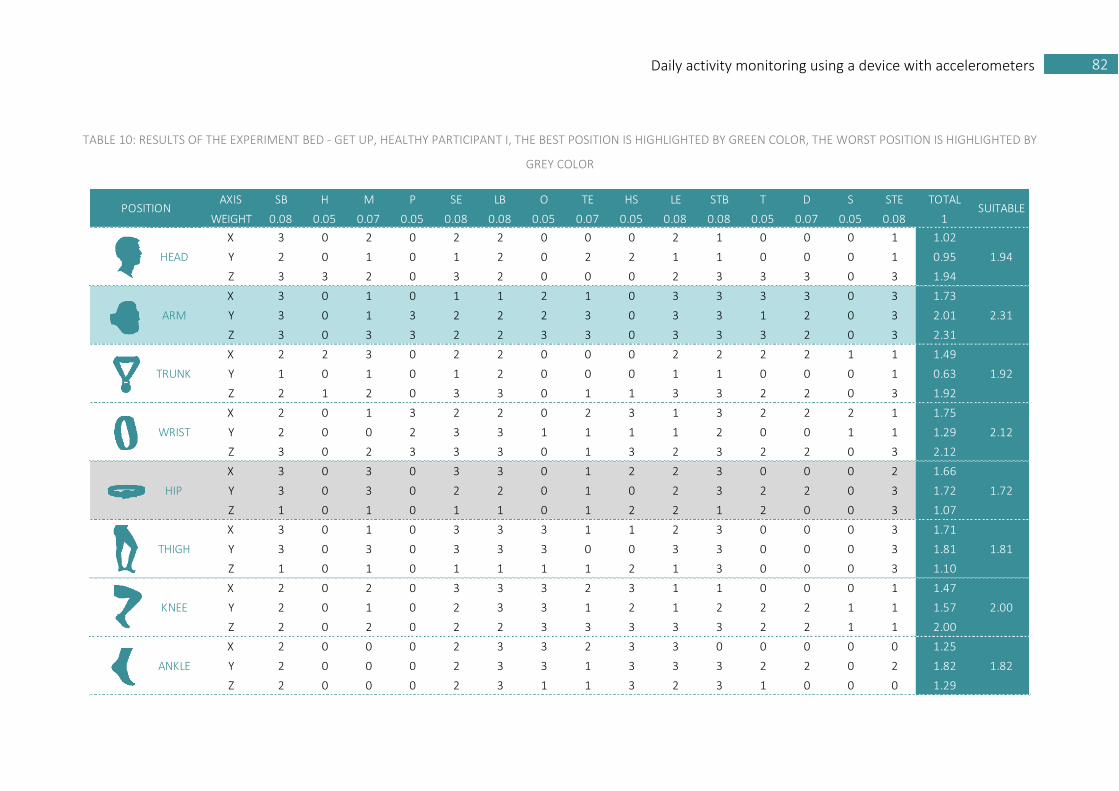
82 Daily activity monitoring using a device with accelerometers
TABLE 10: RESULTS OF THE EXPERIMENT BED - GET UP, HEALTHY PARTICIPANT I, THE BEST POSITION IS HIGHLIGHTED BY GREEN COLOR, THE WORST POSITION IS HIGHLIGHTED BY
GREY COLOR
AXIS SB H M P SE LB O TE HS LE STB T D S STE TOTAL
WEIGHT 0.08 0.05 0.07 0.05 0.08 0.08 0.05 0.07 0.05 0.08 0.08 0.05 0.07 0.05 0.08 1
X 3 0 2 0 2 2 0 0 0 2 1 0 0 0 1 1.02
Y 2 0 1 0 1 2 0 2 2 1 1 0 0 0 1 0.95
Z 3 3 2 0 3 2 0 0 0 2 3 3 3 0 3 1.94
X 3 0 1 0 1 1 2 1 0 3 3 3 3 0 3 1.73
Y 3 0 1 3 2 2 2 3 0 3 3 1 2 0 3 2.01
Z 3 0 3 3 2 2 3 3 0 3 3 3 2 0 3 2.31
X 2 2 3 0 2 2 0 0 0 2 2 2 2 1 1 1.49
Y 1 0 1 0 1 2 0 0 0 1 1 0 0 0 1 0.63
Z 2 1 2 0 3 3 0 1 1 3 3 2 2 0 3 1.92
X 2 0 1 3 2 2 0 2 3 1 3 2 2 2 1 1.75
Y 2 0 0 2 3 3 1 1 1 1 2 0 0 1 1 1.29
Z 3 0 2 3 3 3 0 1 3 2 3 2 2 0 3 2.12
X 3 0 3 0 3 3 0 1 2 2 3 0 0 0 2 1.66
Y 3 0 3 0 2 2 0 1 0 2 3 2 2 0 3 1.72
Z 1 0 1 0 1 1 0 1 2 2 1 2 0 0 3 1.07
X 3 0 1 0 3 3 3 1 1 2 3 0 0 0 3 1.71
Y 3 0 3 0 3 3 3 0 0 3 3 0 0 0 3 1.81
Z 1 0 1 0 1 1 1 1 2 1 3 0 0 0 3 1.10
X 2 0 2 0 3 3 3 2 3 1 1 0 0 0 1 1.47
Y 2 0 1 0 2 3 3 1 2 1 2 2 2 1 1 1.57
Z 2 0 2 0 2 2 3 3 3 3 3 2 2 1 1 2.00
X 2 0 0 0 2 3 3 2 3 3 0 0 0 0 0 1.25
Y 2 0 0 0 2 3 3 1 3 3 3 2 2 0 2 1.82
Z 2 0 0 0 2 3 1 1 3 2 3 1 0 0 0 1.29
POSITION SUITABLE
KNEE
ANKLE
1.94
2.31
1.92
2.12
1.72
1.81
2.00
1.82
HEAD
ARM
TRUNK
WRIST
HIP
THIGH
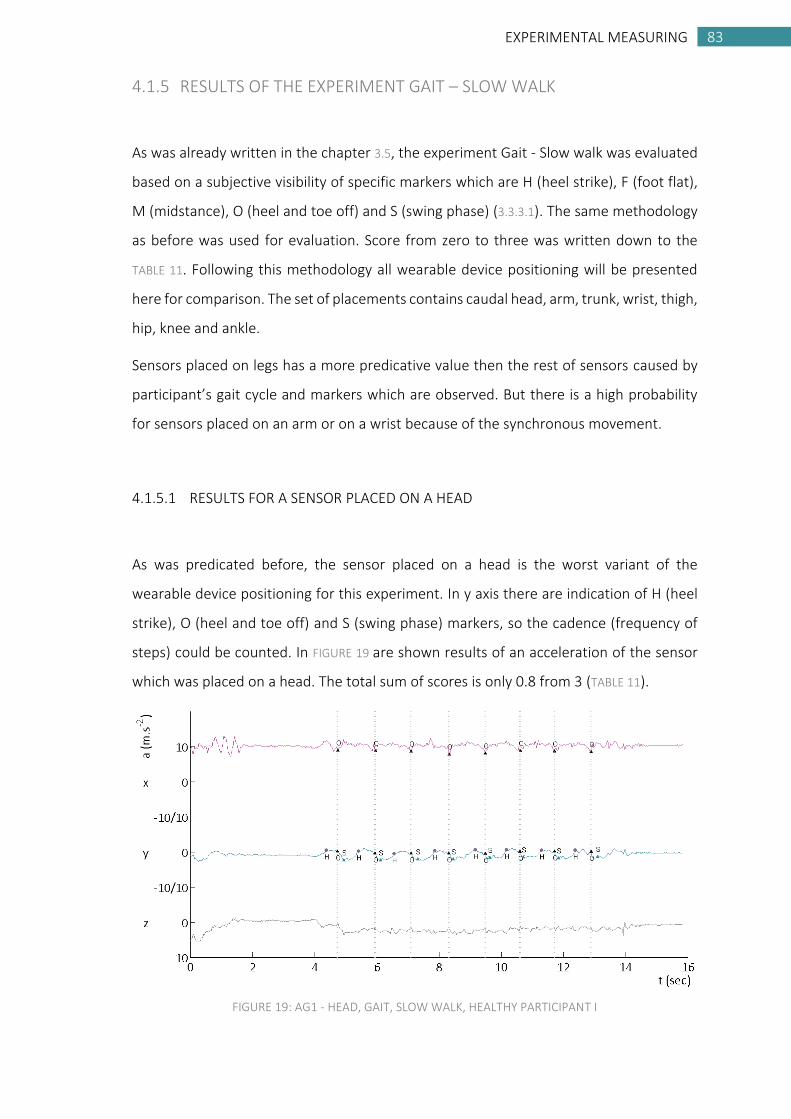
83 EXPERIMENTAL MEASURING
83 LITERATURE REVIEW
4.1.5 RESULTS OF THE EXPERIMENT GAIT – SLOW WALK
As was already written in the chapter 3.5, the experiment Gait - Slow walk was evaluated
based on a subjective visibility of specific markers which are H (heel strike), F (foot flat),
M (midstance), O (heel and toe off) and S (swing phase) (3.3.3.1). The same methodology
as before was used for evaluation. Score from zero to three was written down to the
TABLE 11. Following this methodology all wearable device positioning will be presented
here for comparison. The set of placements contains caudal head, arm, trunk, wrist, thigh,
hip, knee and ankle.
Sensors placed on legs has a more predicative value then the rest of sensors caused by
participant’s gait cycle and markers which are observed. But there is a high probability
for sensors placed on an arm or on a wrist because of the synchronous movement.
4.1.5.1 RESULTS FOR A SENSOR PLACED ON A HEAD
As was predicated before, the sensor placed on a head is the worst variant of the
wearable device positioning for this experiment. In y axis there are indication of H (heel
strike), O (heel and toe off) and S (swing phase) markers, so the cadence (frequency of
steps) could be counted. In FIGURE 19 are shown results of an acceleration of the sensor
which was placed on a head. The total sum of scores is only 0.8 from 3 (TABLE 11).
FIGURE 19: AG1 - HEAD, GAIT, SLOW WALK, HEALTHY PARTICIPANT I

84 Daily activity monitoring using a device with accelerometers
4.1.5.2 RESULTS FOR A SENSOR PLACED ON AN ARM
For a sensor placed on an arm there are partly visible markers H (heel strike) an O (heel
and toe off) in x axis (FIGURE 20). For a gait monitoring the most important is an
information about gait velocity, cadence (frequency of steps) and stride length. All of
these information could be obtained from such a signal because of the synchronous
movement of arms and legs. The total sum of scores is 1.2 from 3 (TABLE 11).
FIGURE 20: BG1 - ARM, GAIT, SLOW WALK, HEALTHY PARTICIPANT I
4.1.5.3 RESULTS FOR A SENSOR PLACED ON A TRUNK
FIGURE 21: CG1 - TRUNK, GAIT, SLOW WALK, HEALTHY PARTICIPANT I
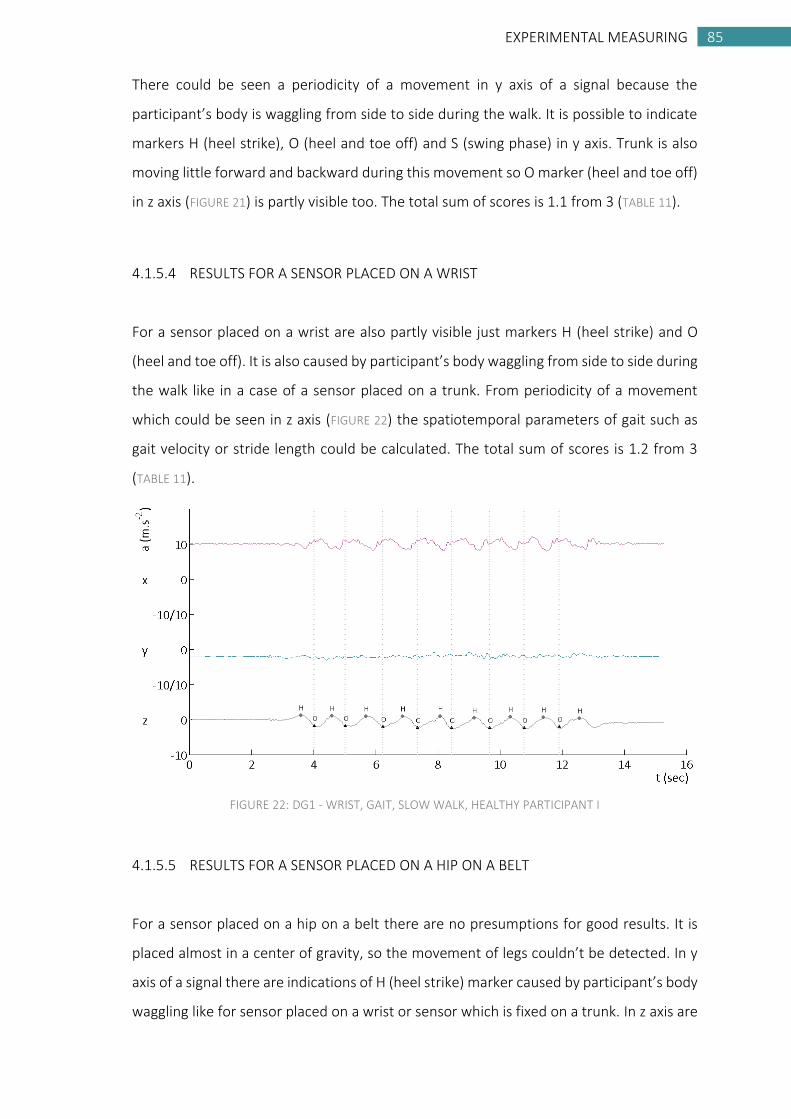
85 EXPERIMENTAL MEASURING
85 LITERATURE REVIEW
There could be seen a periodicity of a movement in y axis of a signal because the
participant’s body is waggling from side to side during the walk. It is possible to indicate
markers H (heel strike), O (heel and toe off) and S (swing phase) in y axis. Trunk is also
moving little forward and backward during this movement so O marker (heel and toe off)
in z axis (FIGURE 21) is partly visible too. The total sum of scores is 1.1 from 3 (TABLE 11).
4.1.5.4 RESULTS FOR A SENSOR PLACED ON A WRIST
For a sensor placed on a wrist are also partly visible just markers H (heel strike) and O
(heel and toe off). It is also caused by participant’s body waggling from side to side during
the walk like in a case of a sensor placed on a trunk. From periodicity of a movement
which could be seen in z axis (FIGURE 22) the spatiotemporal parameters of gait such as
gait velocity or stride length could be calculated. The total sum of scores is 1.2 from 3
(TABLE 11).
FIGURE 22: DG1 - WRIST, GAIT, SLOW WALK, HEALTHY PARTICIPANT I
4.1.5.5 RESULTS FOR A SENSOR PLACED ON A HIP ON A BELT
For a sensor placed on a hip on a belt there are no presumptions for good results. It is
placed almost in a center of gravity, so the movement of legs couldn’t be detected. In y
axis of a signal there are indications of H (heel strike) marker caused by participant’s body
waggling like for sensor placed on a wrist or sensor which is fixed on a trunk. In z axis are
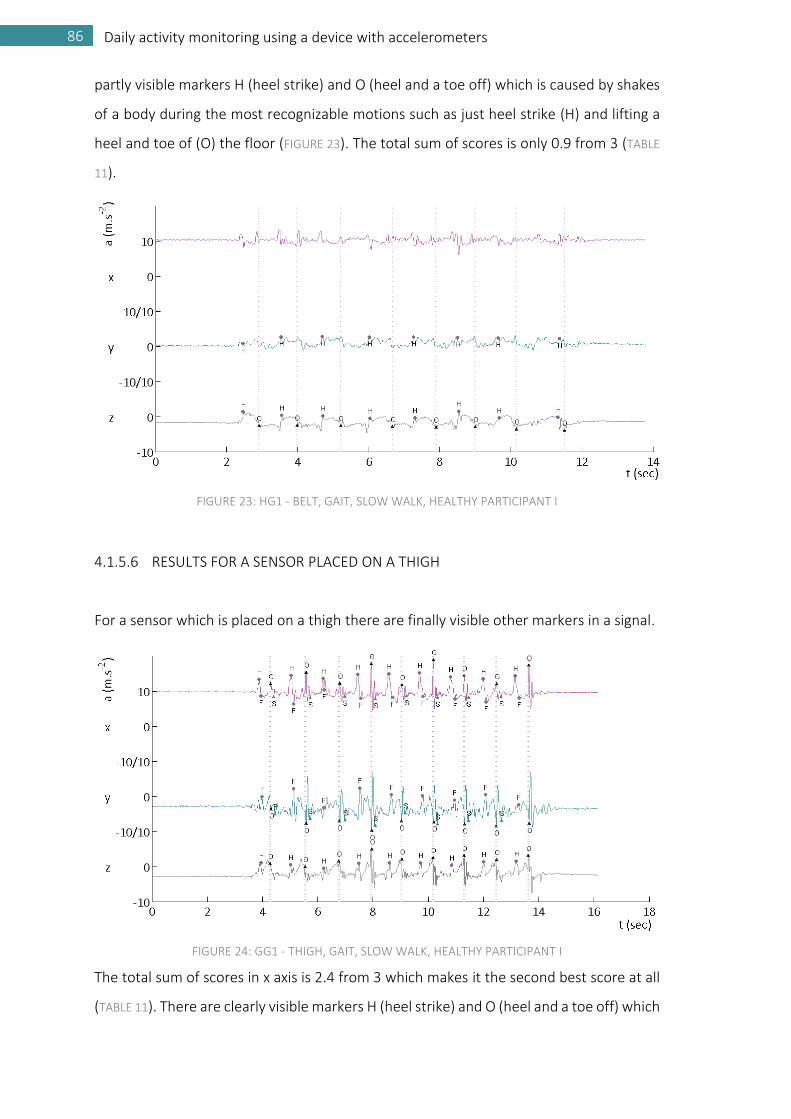
86 Daily activity monitoring using a device with accelerometers
partly visible markers H (heel strike) and O (heel and a toe off) which is caused by shakes
of a body during the most recognizable motions such as just heel strike (H) and lifting a
heel and toe of (O) the floor (FIGURE 23). The total sum of scores is only 0.9 from 3 (TABLE
11).
FIGURE 23: HG1 - BELT, GAIT, SLOW WALK, HEALTHY PARTICIPANT I
4.1.5.6 RESULTS FOR A SENSOR PLACED ON A THIGH
For a sensor which is placed on a thigh there are finally visible other markers in a signal.
FIGURE 24: GG1 - THIGH, GAIT, SLOW WALK, HEALTHY PARTICIPANT I
The total sum of scores in x axis is 2.4 from 3 which makes it the second best score at all
(TABLE 11). There are clearly visible markers H (heel strike) and O (heel and a toe off) which
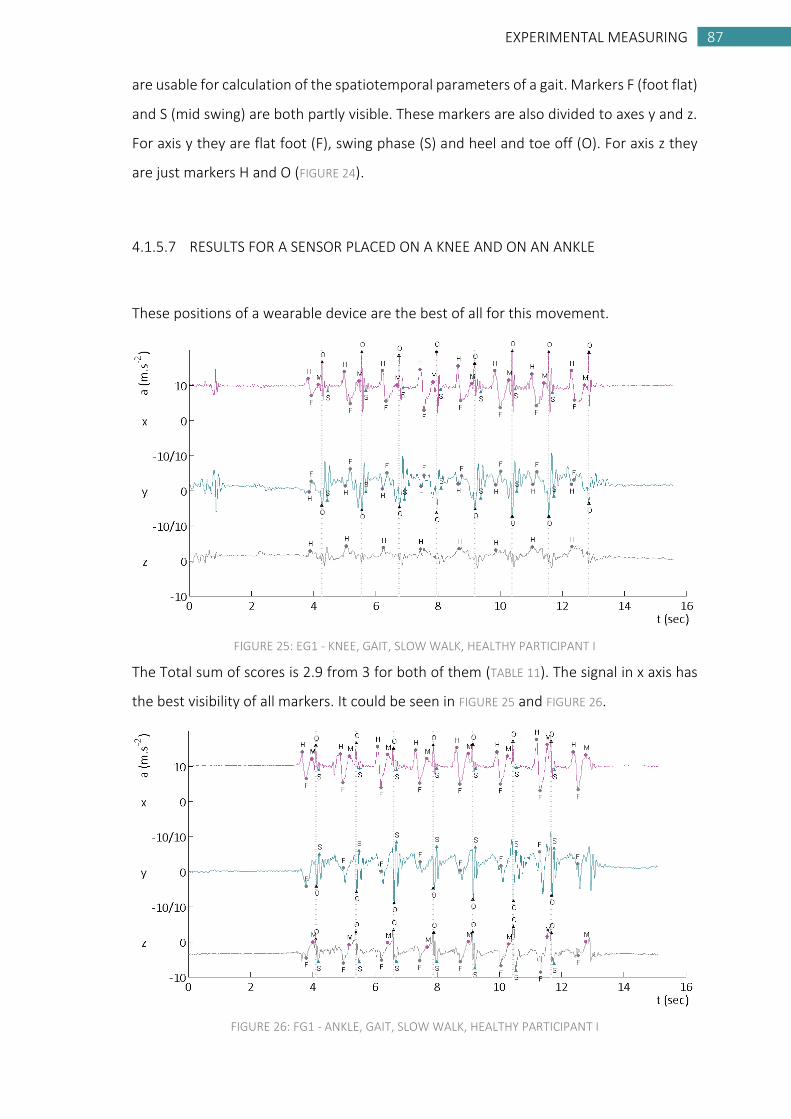
87 EXPERIMENTAL MEASURING
87 LITERATURE REVIEW
are usable for calculation of the spatiotemporal parameters of a gait. Markers F (foot flat)
and S (mid swing) are both partly visible. These markers are also divided to axes y and z.
For axis y they are flat foot (F), swing phase (S) and heel and toe off (O). For axis z they
are just markers H and O (FIGURE 24).
4.1.5.7 RESULTS FOR A SENSOR PLACED ON A KNEE AND ON AN ANKLE
These positions of a wearable device are the best of all for this movement.
FIGURE 25: EG1 - KNEE, GAIT, SLOW WALK, HEALTHY PARTICIPANT I
The Total sum of scores is 2.9 from 3 for both of them (TABLE 11). The signal in x axis has
the best visibility of all markers. It could be seen in FIGURE 25 and FIGURE 26.
FIGURE 26: FG1 - ANKLE, GAIT, SLOW WALK, HEALTHY PARTICIPANT I

88 Daily activity monitoring using a device with accelerometers
The O marker has the most rapid and the highest amplitude of acceleration caused by
quick motion in an ankle joint during this phase of a walk. This marker is also the best one
for calculation of the spatiotemporal parameters of gait.
4.1.6 EVALUATION OF RESULTS OF THE EXPERIMENT GAIT – SLOW WALK
Results of the experiment Gait – Slow walk confirm propositions which were stated in a
chapter 3.2. For this movement the best of all positioning of a wearable device are on
knee and on an ankle. Total sum of scores for x axis is 2.9 from 3 (TABLE 11). As was
mentioned in the chapter 4.1.5.1, the total sum of scores for sensor placed on a head is
only 0.8 from 3 (TABLE 11). So for this movement this is the worst position for a wearable
device. All results are shown in a TABLE 11 for comparison. The best and the worst variants
are highlighted here.
TABLE 11: RESULTS OF THE EXPERIMENT GAIT - SLOW WALK, HEALTHY PARTICIPANT I, THE BEST
POSITION IS HIGHLIGHTED BY GREEN COLOR, THE WORST POSITION IS HIGHLIGHTED BY GREY COLOR
AXIS H F M O S TOTAL
WEIGHT 0.3 0.2 0.1 0.3 0.1 1
X 0 0 0 1 0 0.3
Y 1 0 0 1 2 0.8
Z 0 0 0 0 0 0
X 2 0 0 2 0 1.2
Y 0 0 0 0 0 0
Z 0 0 0 0 0 0
X 0 0 0 0 0 0
Y 2 0 0 1 2 1.1
Z 0 0 0 2 0 0.6
X 0 0 0 0 0 0
Y 0 0 0 0 0 0
Z 2 0 0 2 0 1.2
X 0 0 0 0 0 0
Y 1 0 0 0 0 0.3
Z 2 0 0 1 0 0.9
X 3 2 0 3 2 2.4
Y 0 3 0 3 3 1.8
Z 3 0 0 2 0 1.5
X 3 3 3 3 2 2.9
Y 2 2 0 3 3 2.2
Z 2 0 0 0 0 0.6
X 3 3 3 3 2 2.9
Y 0 1 0 3 3 1.4
Z 0 3 1 3 2 1.8
0.90
2.40
2.90
2.90
KNEE
ANKLE
HIP
THIGH
SUITABLE
0.80
1.20
1.10
1.20
POSITION
HEAD
ARM
TRUNK
WRIST
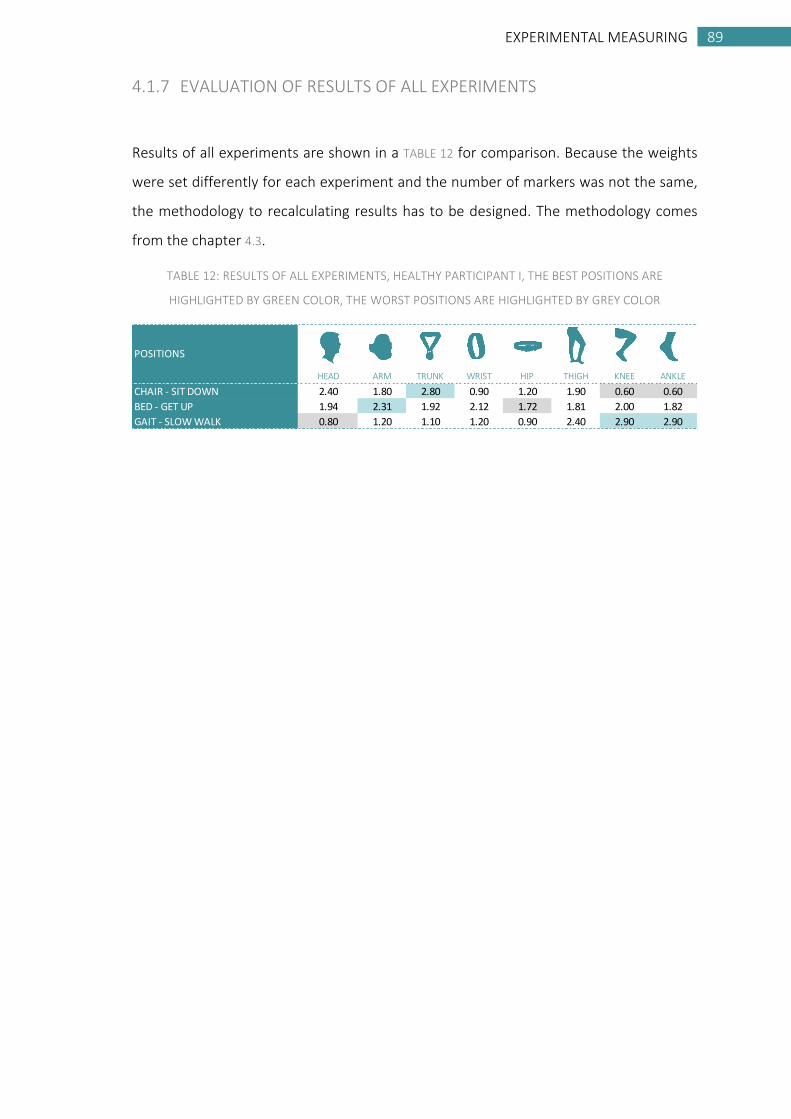
89 EXPERIMENTAL MEASURING
89 LITERATURE REVIEW
4.1.7 EVALUATION OF RESULTS OF ALL EXPERIMENTS
Results of all experiments are shown in a TABLE 12 for comparison. Because the weights
were set differently for each experiment and the number of markers was not the same,
the methodology to recalculating results has to be designed. The methodology comes
from the chapter 4.3.
TABLE 12: RESULTS OF ALL EXPERIMENTS, HEALTHY PARTICIPANT I, THE BEST POSITIONS ARE
HIGHLIGHTED BY GREEN COLOR, THE WORST POSITIONS ARE HIGHLIGHTED BY GREY COLOR
HEAD ARM TRUNK WRIST HIP THIGH KNEE ANKLE
CHAIR - SIT DOWN 2.40 1.80 2.80 0.90 1.20 1.90 0.60 0.60
BED - GET UP 1.94 2.31 1.92 2.12 1.72 1.81 2.00 1.82
GAIT - SLOW WALK 0.80 1.20 1.10 1.20 0.90 2.40 2.90 2.90
POSITIONS
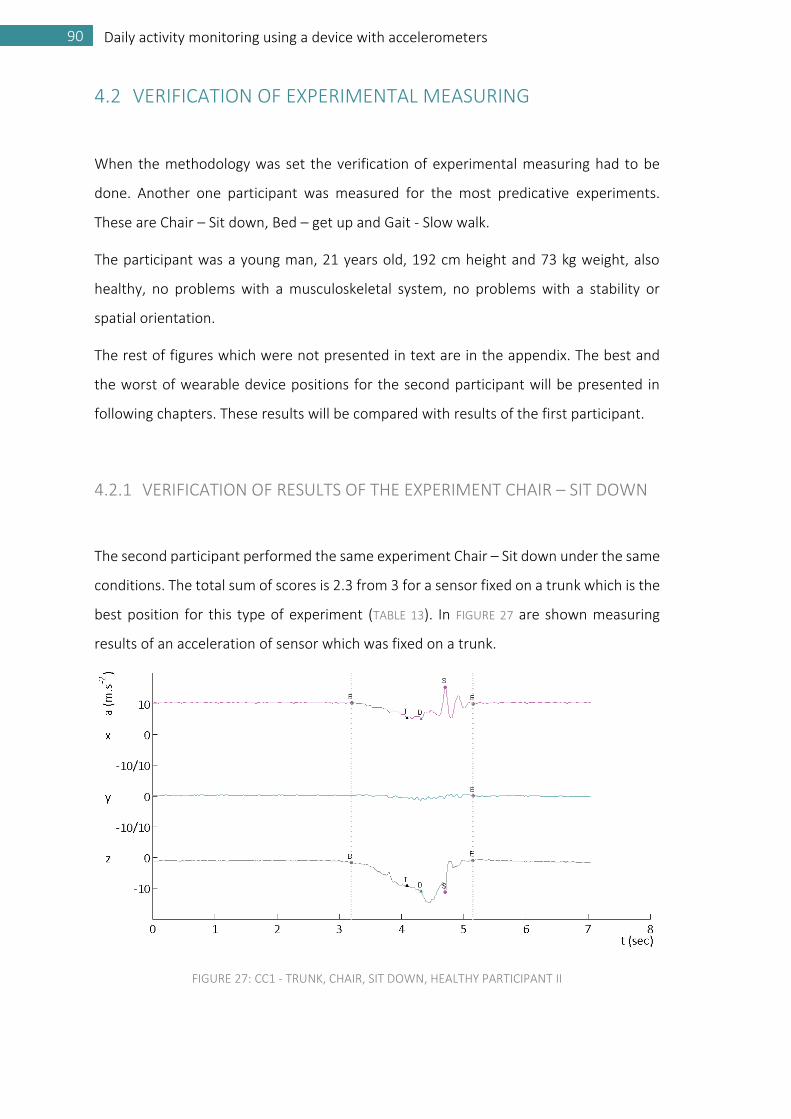
90 Daily activity monitoring using a device with accelerometers
4.2 VERIFICATION OF EXPERIMENTAL MEASURING
When the methodology was set the verification of experimental measuring had to be
done. Another one participant was measured for the most predicative experiments.
These are Chair – Sit down, Bed – get up and Gait - Slow walk.
The participant was a young man, 21 years old, 192 cm height and 73 kg weight, also
healthy, no problems with a musculoskeletal system, no problems with a stability or
spatial orientation.
The rest of figures which were not presented in text are in the appendix. The best and
the worst of wearable device positions for the second participant will be presented in
following chapters. These results will be compared with results of the first participant.
4.2.1 VERIFICATION OF RESULTS OF THE EXPERIMENT CHAIR – SIT DOWN
The second participant performed the same experiment Chair – Sit down under the same
conditions. The total sum of scores is 2.3 from 3 for a sensor fixed on a trunk which is the
best position for this type of experiment (TABLE 13). In FIGURE 27 are shown measuring
results of an acceleration of sensor which was fixed on a trunk.
FIGURE 27: CC1 - TRUNK, CHAIR, SIT DOWN, HEALTHY PARTICIPANT II
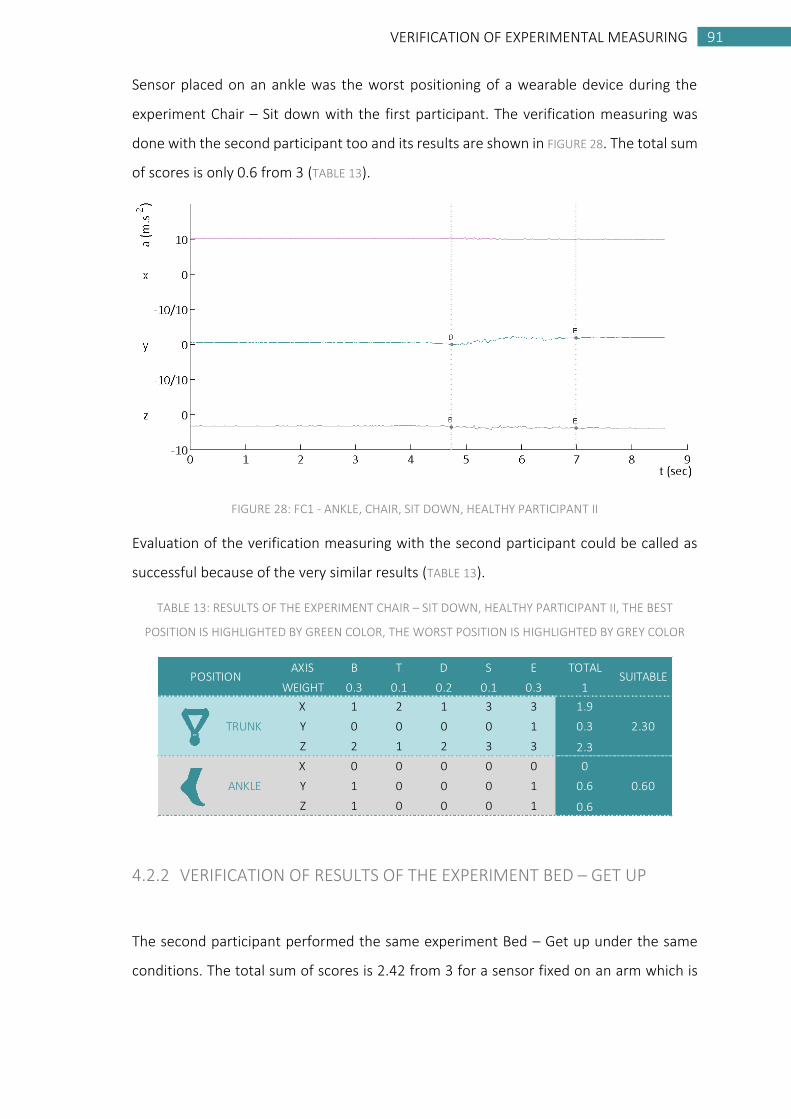
91 VERIFICATION OF EXPERIMENTAL MEASURING
91 LITERATURE REVIEW
Sensor placed on an ankle was the worst positioning of a wearable device during the
experiment Chair – Sit down with the first participant. The verification measuring was
done with the second participant too and its results are shown in FIGURE 28. The total sum
of scores is only 0.6 from 3 (TABLE 13).
FIGURE 28: FC1 - ANKLE, CHAIR, SIT DOWN, HEALTHY PARTICIPANT II
Evaluation of the verification measuring with the second participant could be called as
successful because of the very similar results (TABLE 13).
TABLE 13: RESULTS OF THE EXPERIMENT CHAIR – SIT DOWN, HEALTHY PARTICIPANT II, THE BEST
POSITION IS HIGHLIGHTED BY GREEN COLOR, THE WORST POSITION IS HIGHLIGHTED BY GREY COLOR
4.2.2 VERIFICATION OF RESULTS OF THE EXPERIMENT BED – GET UP
The second participant performed the same experiment Bed – Get up under the same
conditions. The total sum of scores is 2.42 from 3 for a sensor fixed on an arm which is
AXIS B T D S E TOTAL
WEIGHT 0.3 0.1 0.2 0.1 0.3 1
X 1 2 1 3 3 1.9
Y 0 0 0 0 1 0.3
Z 2 1 2 3 3 2.3
X 0 0 0 0 0 0
Y 1 0 0 0 1 0.6
Z 1 0 0 0 1 0.6
ANKLE 0.60
POSITION SUITABLE
TRUNK 2.30
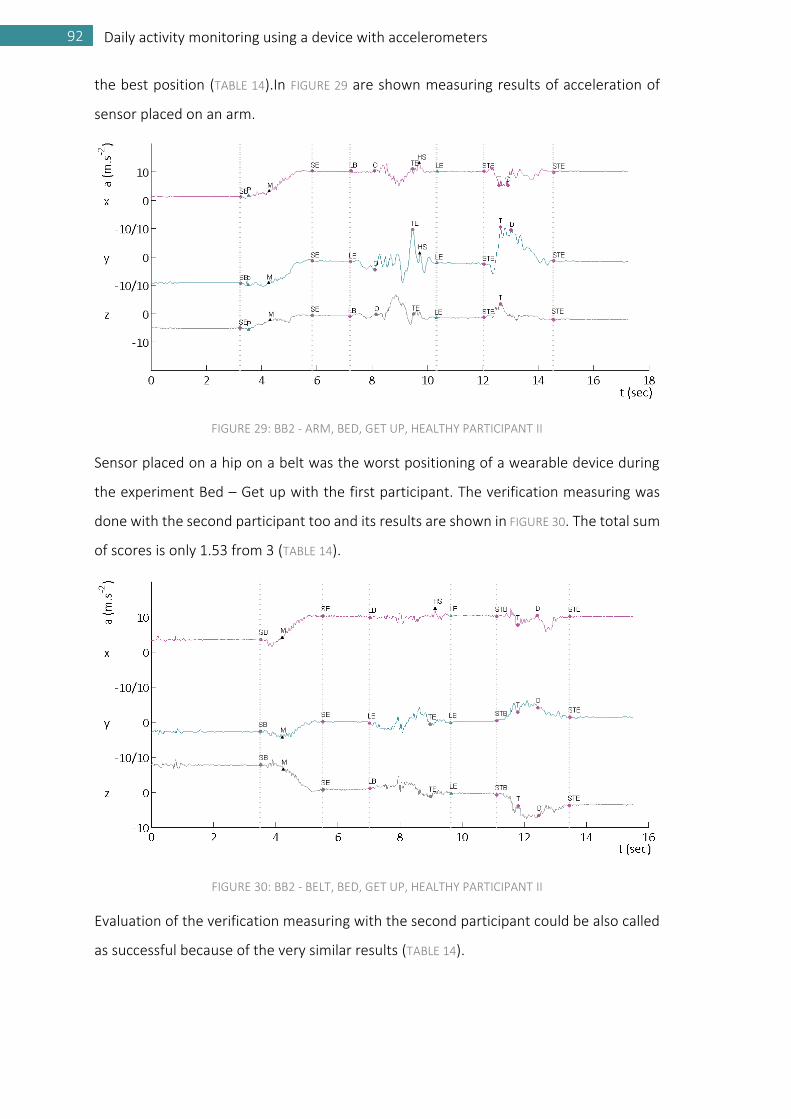
92 Daily activity monitoring using a device with accelerometers
the best position (TABLE 14).In FIGURE 29 are shown measuring results of acceleration of
sensor placed on an arm.
FIGURE 29: BB2 - ARM, BED, GET UP, HEALTHY PARTICIPANT II
Sensor placed on a hip on a belt was the worst positioning of a wearable device during
the experiment Bed – Get up with the first participant. The verification measuring was
done with the second participant too and its results are shown in FIGURE 30. The total sum
of scores is only 1.53 from 3 (TABLE 14).
FIGURE 30: BB2 - BELT, BED, GET UP, HEALTHY PARTICIPANT II
Evaluation of the verification measuring with the second participant could be also called
as successful because of the very similar results (TABLE 14).

93 VERIFICATION OF EXPERIMENTAL MEASURING
TABLE 14: RESULTS OF THE EXPERIMENT BED – GET UP, HEALTHY PARTICIPANT II, THE BEST POSITION IS HIGHLIGHTED BY GREEN COLOR, THE WORST POSITION IS HIGHLIGHTED BY
GREY COLOR
AXIS SB H M P SE LB O TE HS LE STB T D S STE TOTAL
WEIGHT 0.08 0.05 0.07 0.05 0.08 0.08 0.05 0.07 0.05 0.08 0.08 0.05 0.07 0.05 0.08 1
X 3 0 2 1 3 2 3 1 3 2 3 3 3 0 3 2.22
Y 3 0 2 2 3 2 3 3 3 3 3 3 2 0 3 2.42
Z 3 0 2 1 3 2 2 2 0 3 3 3 0 0 2 1.87
X 3 0 2 0 3 2 0 0 2 2 2 2 2 0 1 1.53
Y 3 0 2 0 2 3 0 1 0 1 3 2 1 0 1 1.42
Z 3 0 2 0 3 2 0 1 0 1 3 2 1 0 2 1.50
HIP 1.53
POSITION SUITABLE
ARM 2.42
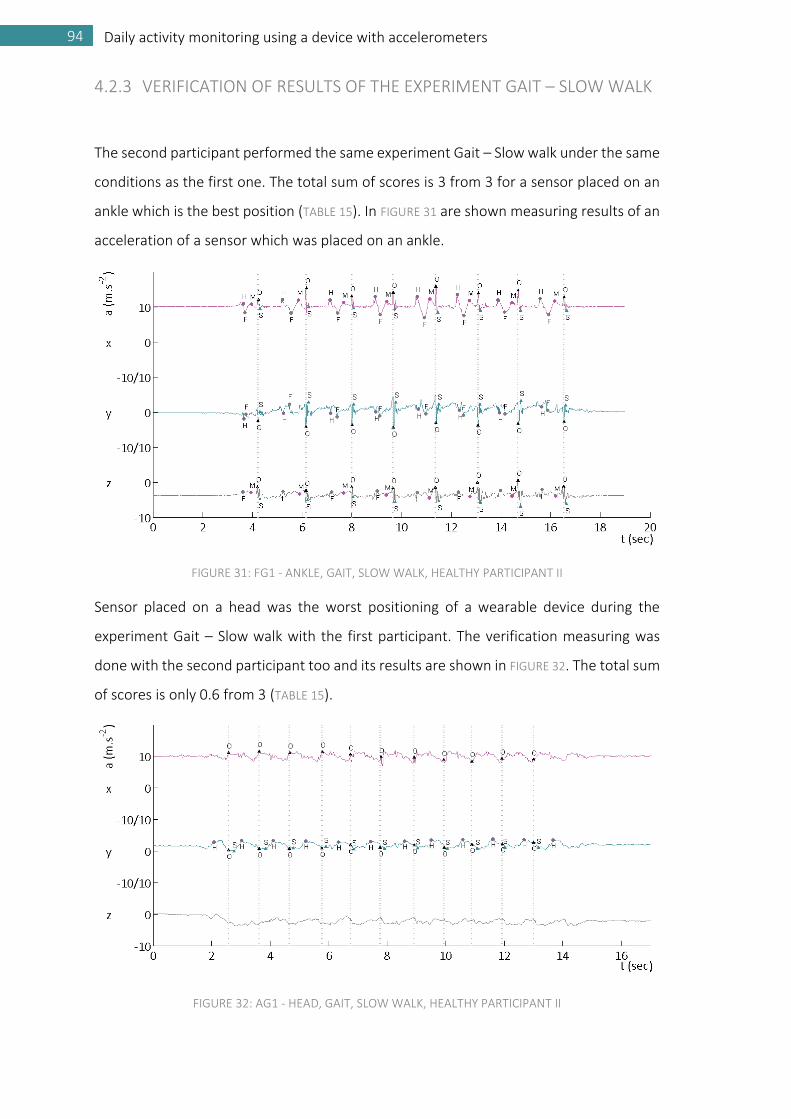
94 Daily activity monitoring using a device with accelerometers
4.2.3 VERIFICATION OF RESULTS OF THE EXPERIMENT GAIT – SLOW WALK
The second participant performed the same experiment Gait – Slow walk under the same
conditions as the first one. The total sum of scores is 3 from 3 for a sensor placed on an
ankle which is the best position (TABLE 15). In FIGURE 31 are shown measuring results of an
acceleration of a sensor which was placed on an ankle.
FIGURE 31: FG1 - ANKLE, GAIT, SLOW WALK, HEALTHY PARTICIPANT II
Sensor placed on a head was the worst positioning of a wearable device during the
experiment Gait – Slow walk with the first participant. The verification measuring was
done with the second participant too and its results are shown in FIGURE 32. The total sum
of scores is only 0.6 from 3 (TABLE 15).
FIGURE 32: AG1 - HEAD, GAIT, SLOW WALK, HEALTHY PARTICIPANT II
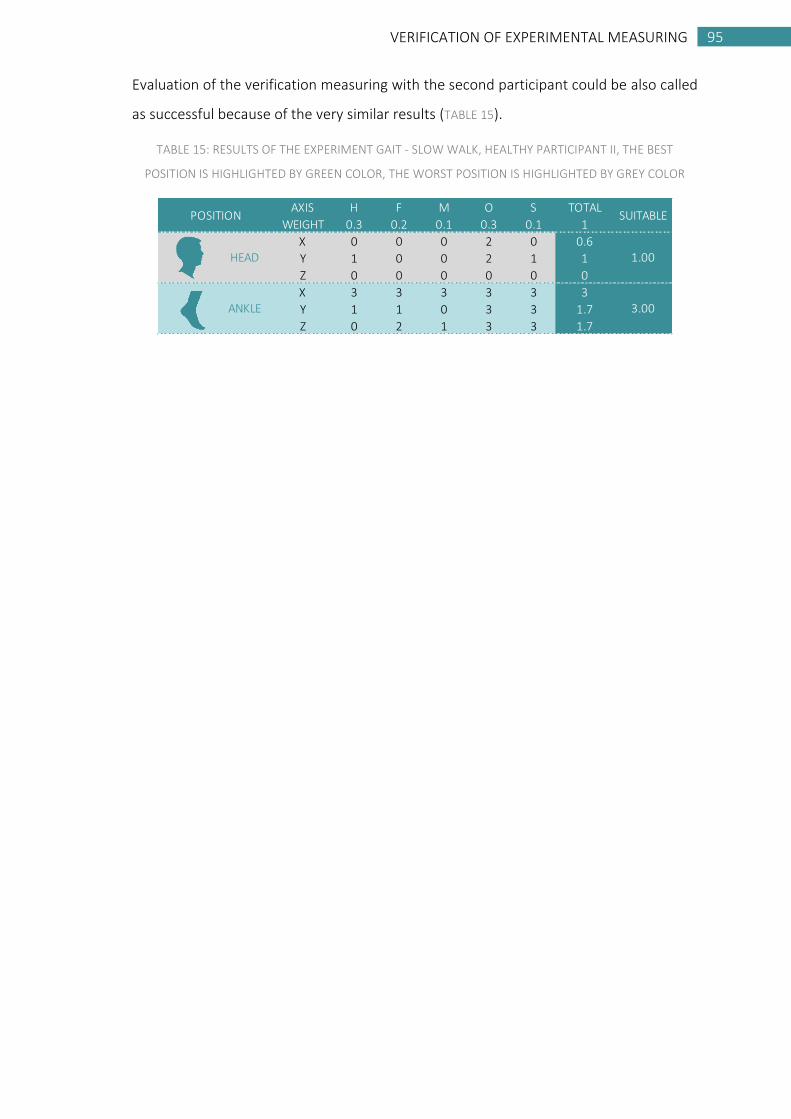
95 VERIFICATION OF EXPERIMENTAL MEASURING
95
Evaluation of the verification measuring with the second participant could be also called
as successful because of the very similar results (TABLE 15).
TABLE 15: RESULTS OF THE EXPERIMENT GAIT - SLOW WALK, HEALTHY PARTICIPANT II, THE BEST
POSITION IS HIGHLIGHTED BY GREEN COLOR, THE WORST POSITION IS HIGHLIGHTED BY GREY COLOR
AXIS H F M O S TOTAL
WEIGHT 0.3 0.2 0.1 0.3 0.1 1
X 0 0 0 2 0 0.6
Y 1 0 0 2 1 1
Z 0 0 0 0 0 0
X 3 3 3 3 3 3
Y 1 1 0 3 3 1.7
Z 0 2 1 3 3 1.7
ANKLE 3.00
POSITION SUITABLE
HEAD 1.00
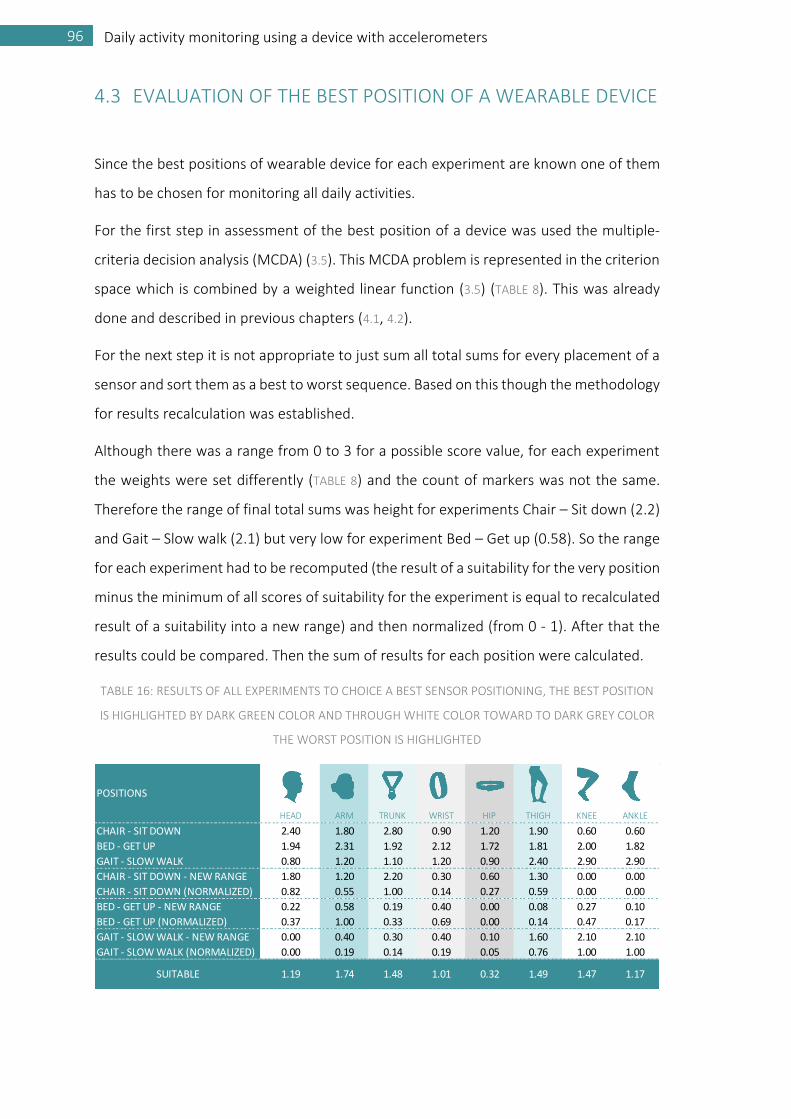
96 Daily activity monitoring using a device with accelerometers
4.3 EVALUATION OF THE BEST POSITION OF A WEARABLE DEVICE
Since the best positions of wearable device for each experiment are known one of them
has to be chosen for monitoring all daily activities.
For the first step in assessment of the best position of a device was used the multiple-
criteria decision analysis (MCDA) (3.5). This MCDA problem is represented in the criterion
space which is combined by a weighted linear function (3.5) (TABLE 8). This was already
done and described in previous chapters (4.1, 4.2).
For the next step it is not appropriate to just sum all total sums for every placement of a
sensor and sort them as a best to worst sequence. Based on this though the methodology
for results recalculation was established.
Although there was a range from 0 to 3 for a possible score value, for each experiment
the weights were set differently (TABLE 8) and the count of markers was not the same.
Therefore the range of final total sums was height for experiments Chair – Sit down (2.2)
and Gait – Slow walk (2.1) but very low for experiment Bed – Get up (0.58). So the range
for each experiment had to be recomputed (the result of a suitability for the very position
minus the minimum of all scores of suitability for the experiment is equal to recalculated
result of a suitability into a new range) and then normalized (from 0 - 1). After that the
results could be compared. Then the sum of results for each position were calculated.
TABLE 16: RESULTS OF ALL EXPERIMENTS TO CHOICE A BEST SENSOR POSITIONING, THE BEST POSITION
IS HIGHLIGHTED BY DARK GREEN COLOR AND THROUGH WHITE COLOR TOWARD TO DARK GREY COLOR
THE WORST POSITION IS HIGHLIGHTED
HEAD ARM TRUNK WRIST HIP THIGH KNEE ANKLE
CHAIR - SIT DOWN 2.40 1.80 2.80 0.90 1.20 1.90 0.60 0.60
BED - GET UP 1.94 2.31 1.92 2.12 1.72 1.81 2.00 1.82
GAIT - SLOW WALK 0.80 1.20 1.10 1.20 0.90 2.40 2.90 2.90
CHAIR - SIT DOWN - NEW RANGE 1.80 1.20 2.20 0.30 0.60 1.30 0.00 0.00
CHAIR - SIT DOWN (NORMALIZED) 0.82 0.55 1.00 0.14 0.27 0.59 0.00 0.00
BED - GET UP - NEW RANGE 0.22 0.58 0.19 0.40 0.00 0.08 0.27 0.10
BED - GET UP (NORMALIZED) 0.37 1.00 0.33 0.69 0.00 0.14 0.47 0.17
GAIT - SLOW WALK - NEW RANGE 0.00 0.40 0.30 0.40 0.10 1.60 2.10 2.10
GAIT - SLOW WALK (NORMALIZED) 0.00 0.19 0.14 0.19 0.05 0.76 1.00 1.00
1.47 1.17
POSITIONS
1.19 1.74 1.48 1.01 0.32 1.49SUITABLE
97 EVALUATION OF THE BEST POSITION OF A WEARABLE DEVICE
97
All values, calculations and results are shown in TABLE 16. Following the experimental
measurement (4.1) wearable device placed on an arm was found the most suitable for
daily activity monitoring with the highest score 1.74. On the other side the worst position
for all daily activities is a sensor placed on a wrist like a watch with the lowest score 1.01.
The best position is highlighted by dark green color and through white color toward dark
grey color the worst position is highlighted in TABLE 16

98 Daily activity monitoring using a device with accelerometers
4.4 PRACTICAL MEASURING
Since all experiments has been evaluated and the best wearable device positioning has
been chosen, the daily activities could be monitored in practice. There will be presented
results for seniors’ daily activities monitoring in chapter 4.4.1. In the next chapter 4.4.2 the
blind record will be analyzed. The best positioning of a wearable measuring device from
4.3 will be used.
4.4.1 SENIORS‘ DAILY ACTIVITIES MONITORING
In this monitoring three seniors were observed and measured during three experiments.
The wearable measuring device which was placed on a seniors’ arm wasn’t
uncomfortable for any of them. They told that wearing the device is like a measuring of
a blood pressure which they do three times per day but much more comfortable. After a
while they did used to it and they didn't apperceive it. They were not acquainted with
previous experimental measuring. There were just ask for sit down on a chair, get up of
a bed and walk for four meters distance. So they did it their own way.
Senior number 1 was a man, 83 years old, 158 cm height and 76 kg weight, nonsmoker,
after two cardio operations, now with a cardio stimulator. Problems with gait velocity,
short stride length, problems with stability.
Senior number 2 was a woman, 79 years old, 161 cm height and 67 kg weight, nonsmoker,
back pain and knee pain suffering, partial problems with stability.
Senior number 3 was a man, 61 years old, 182 cm height and 76 kg weight, smoker, after
multiple fractures of ribs and of the ankle. In the time of a measuring he has toe fracture
on the right foot.
The rest of figures which were not presented in text are in the appendix. In following part
the interesting results from figures will be presented. Foregoing figures contain various
abnormalities that will be described.
The first movement was experiment Chair – Sit down. In FIGURE 33 is shown also the phase
before a movement. This is a senior’s body staying in front of a chair and turning around
its own axis to finally sit down. This is an abnormality which could be seen in signals in

99 PRACTICAL MEASURING
99
practice. But the main movement is still detectable. There are clearly visible markers B
(beginning of a movement), D (deceleration), S (shake of a body) and E (end of a
movement) and partly visible marker T (tilt of a trunk) in both x and y axes.
FIGURE 33: BC1 - ARM, CHAIR, SIT DOWN, SENIOR I
Results of the second movement during the experiment Bed – Get up are shown in FIGURE
34. Despite of any lags between phases of the movement all main markers are clearly
visible too. The most difficult phase for this senior was getting up of the bed considering
the velocity of the movement. The point of deceleration (D) is clearly visible in each axis.
Because of the low velocity of the last phase of this movement, the marker S (shake of a
body) is not visible in any axis but y.
FIGURE 34: BB2 - ARM, BED, GET UP, SENIOR I
The last measuring was an experiment Gait – Slow walk. There are clearly visible markers
H (heel strike), F (foot flat), O (heel and toe off) and S (swing phase) in a signal. There
could be seen longer stride length in x and z axes of a signal in FIGURE 35.

100 Daily activity monitoring using a device with accelerometers
FIGURE 35: BG1 - ARM, GAIT, SLOW WALK, SENIOR III
4.4.2 BLIND RECORD OF A PATIENT’S DAILY ACTIVITIES MONITORING
For the final evaluation of suitability of the chosen wearable device positioning the blind
record was measured. The participant was freely moving in his own home environment.
After the measurement was done it was evaluated without a knowledge of what exactly
participant was doing during that time. Results of the evaluation are shown in FIGURE 36.
FIGURE 36: DAILY ACTIVITIES MONITORING (WITH MARKERS), HEALTHY PARTICIPANT I, GAIT EXERCISES
ARE HIGHLIGHTED BY GREEN COLOR, CHAIR EXERCISES ARE HIGHLIGHTED BY PURPLE COLOR AND BED
EXERCISES ARE HIGHLIGHTED BY GREY COLOR
Every movements and their phases were detectable in a signal of the blind record. There
is a slow walk in first 10 s, then there is a steady state of participant and two steps towards
the chair. After 20 s of record there is clearly visible that participant is sitting down, sitting
101 PRACTICAL MEASURING
101
steady and after another 20 s is standing up. The next part of a signal is a normal walk
with a turn followed by slow walk when participant’s body is tilted to the side which could
be detectable as a change of an acceleration amplitude. In a time 100 s after a beginning
of a signal there are visible few steps towards the bed. Next what is clearly visible is that
participant is lying down on a bed, he is lying there for an almost 15 s and then he is
getting up of a bed again. After that there are visible two steps towards the chair and Sit
down movement.

102 Daily activity monitoring using a device with accelerometers
103 CONCLUSION
103
5 CONCLUSION
The thesis deals with daily activity monitoring using a device with accelerometers and
was performed based on the official task with 5 points of the instructions.
According to the first point of the task instructions the literature review was performed.
For patients with neurodegenerative diseases for daily activity monitoring the most viable
system includes accelerometers. The literature review was mainly focused on already
existing devices but also to selected current projects over the World.
Suitable solutions of measuring wearable device positioning were presented in the
chapter 3.2 as a second point of the task instructions. In order to verify individual solutions
of measuring wearable device positioning the very device was constructed by which was
fulfilled the fourth point of the task instructions. Assembling of measuring board was
described in the chapter 3.1.
Experiments and experimental protocols to verify individual solutions of measuring were
designed as the third point of the official task and they were explained in detail in the
chapter 3.3. Final set of wearable device positioning were caudal head, arm, trunk, wrist,
thigh, hip, knee and ankle (3.2). The three main exercises were Chair, Bed and Gait. Each
of them contains two or more experimental protocols, which were presented in the
chapters 3.3.1, 3.3.2 and 3.3.3. Data preprocessing in Matlab and the methodology of a
signal evaluation usability could be found in chapters 3.4 and 3.5. A tool in Matlab
supporting evaluation according the developed methodology was designed. This tool
helps with assessing of particular phases and markers in a specific type of experiment.
This method is purely subjective because of a hand-operated marking. Multiple-criteria
decision analysis was used for evaluation. This MCDA problem is represented in the
criterion space which is combined by a weighted linear function which was explained in
detail in the chapter 3.5.

104 Daily activity monitoring using a device with accelerometers
First of all the experimental measuring with healthy participant was performed (4.1). The
goal was to find particular markers or phases of movements and assess which position of
a wearable device is the most suitable for monitoring daily activities. Second part of
measuring was verification of experimental measuring (4.2) with another one healthy
participant. Evaluation of the verification measuring with the second participant was
successful because of the very similar results. After both measuring the evaluation of the
best position of a wearable device was done by the developed methodology in the
chapter 4.3.
The most suitable for daily activity monitoring is a wearable device placed on an arm with
the highest score 1.74. The worst position is on a wrist with the lowest score 1.01. The
best position is highlighted by dark green color and through white color toward dark grey
color the worst position is highlighted in TABLE 17.
TABLE 17: RESULTS OF ALL EXPERIMENTS TO CHOICE A BEST SENSOR POSITIONING, THE BEST POSITION
IS HIGHLIGHTED BY DARK GREEN COLOR AND THROUGH WHITE COLOR TOWARD TO DARK GREY COLOR
THE WORST POSITION IS HIGHLIGHTED
Then the practical measuring (4.4) was performed. There were presented results for
seniors’ daily activities monitoring in the chapter 4.4.1 and the blind record was analyzed
in the next chapter 4.4.2
Then the practical measuring with three seniors was performed. The wearable measuring
device which was placed on a seniors’ arm wasn’t uncomfortable for any of them. They
were not acquainted with previous experimental measuring. There were just ask for sit
down on a chair, get up of a bed and walk for four meters distance. Seniors’ movement
was different considering the experimental measuring that was strictly directed by
HEAD ARM TRUNK WRIST HIP THIGH KNEE ANKLE
CHAIR - SIT DOWN 2.40 1.80 2.80 0.90 1.20 1.90 0.60 0.60
BED - GET UP 1.94 2.31 1.92 2.12 1.72 1.81 2.00 1.82
GAIT - SLOW WALK 0.80 1.20 1.10 1.20 0.90 2.40 2.90 2.90
CHAIR - SIT DOWN - NEW RANGE 1.80 1.20 2.20 0.30 0.60 1.30 0.00 0.00
CHAIR - SIT DOWN (NORMALIZED) 0.82 0.55 1.00 0.14 0.27 0.59 0.00 0.00
BED - GET UP - NEW RANGE 0.22 0.58 0.19 0.40 0.00 0.08 0.27 0.10
BED - GET UP (NORMALIZED) 0.37 1.00 0.33 0.69 0.00 0.14 0.47 0.17
GAIT - SLOW WALK - NEW RANGE 0.00 0.40 0.30 0.40 0.10 1.60 2.10 2.10
GAIT - SLOW WALK (NORMALIZED) 0.00 0.19 0.14 0.19 0.05 0.76 1.00 1.00
1.47 1.17
POSITIONS
1.19 1.74 1.48 1.01 0.32 1.49SUITABLE
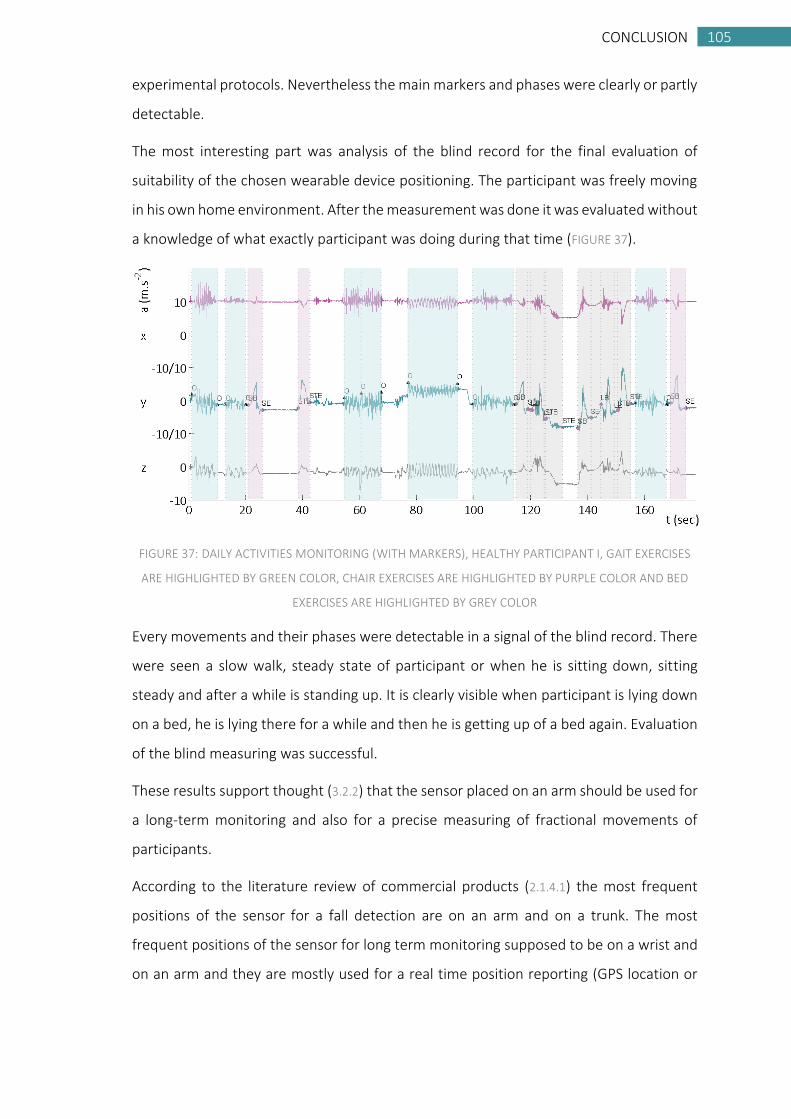
105 CONCLUSION
105
experimental protocols. Nevertheless the main markers and phases were clearly or partly
detectable.
The most interesting part was analysis of the blind record for the final evaluation of
suitability of the chosen wearable device positioning. The participant was freely moving
in his own home environment. After the measurement was done it was evaluated without
a knowledge of what exactly participant was doing during that time (FIGURE 37).
FIGURE 37: DAILY ACTIVITIES MONITORING (WITH MARKERS), HEALTHY PARTICIPANT I, GAIT EXERCISES
ARE HIGHLIGHTED BY GREEN COLOR, CHAIR EXERCISES ARE HIGHLIGHTED BY PURPLE COLOR AND BED
EXERCISES ARE HIGHLIGHTED BY GREY COLOR
Every movements and their phases were detectable in a signal of the blind record. There
were seen a slow walk, steady state of participant or when he is sitting down, sitting
steady and after a while is standing up. It is clearly visible when participant is lying down
on a bed, he is lying there for a while and then he is getting up of a bed again. Evaluation
of the blind measuring was successful.
These results support thought (3.2.2) that the sensor placed on an arm should be used for
a long-term monitoring and also for a precise measuring of fractional movements of
participants.
According to the literature review of commercial products (2.1.4.1) the most frequent
positions of the sensor for a fall detection are on an arm and on a trunk. The most
frequent positions of the sensor for long term monitoring supposed to be on a wrist and
on an arm and they are mostly used for a real time position reporting (GPS location or

106 Daily activity monitoring using a device with accelerometers
entering/leaving geo-fences reporting). None of them is determined to an indoor patient
monitoring of movements.
Regarding the project research in the chapter 2.1.4.2, no one is using a sensor placed on
an arm. They all try new approaches to the patient monitoring for example with a sensor
placed in a shoe, or on the head. Some of them are also using the second device such as
Kinect and so on. These projects mostly try to find a solution to fall detection, stability
examination or gait analyze but they focus just on one of these problems.
Contribution of this thesis Daily activity monitoring using a device with accelerometers
could be divided into few parts.
First of all the documentation for assembling of the measuring board was formed. The
simple and well-fixed sensor’s covering was designed for experimental and practical
measuring on various parts of a participant’s body. Through detailed analysis the
detectable phases of movements were introduced for typical daily activities. Visibility of
these phases and markers helped to define the best positioning of the wearable device
for patient’s daily monitoring. This position of the sensor placed on an arm became the
recommendation for another future projects which are based on monitoring of daily
activities.
From the results of measurements it could be calculated the time which senior spends by
sitting on a chair or by lying on a bed. Another usability of this measurement could be
detection of spatiotemporal parameters of gait such as gait velocity or stride length.
These could be detectable symptoms of Alzheimer’s disease or another senior’s
dementia. Such a monitoring of daily activities could be helpful for seniors to stay at home
longer with their families.

107 LIST OF ABBREVIATIONS
107
6 LIST OF ABBREVIATIONS
3D Three-Dimensional Space
B Beginning of a movement
CE Current Era
CT Computerized Tomography
CTU FBMI Czech Technical University – Faculty of Biomedical Engineering
D Deceleration of a movement
DMP Digital Motion Processor
DPS Degrees per second
DSM-IV Diagnostic and Statistical Manual of Mental Disorders, 4th Edition
E End of a movement
F Foot flat
G SENSOR Gravity sensor
GPS Global Positioning System
H Head lifting / Heel strike on a floor
HS Heel strike on a bed
LB Beginning of a movement (legs putting on/of a bed)
LE End of a movement (legs putting on/of a bed)
LSB Low Significant Bit
M Muscles clenching / Midstance
MATLAB Mathematical Laboratory

108 Daily activity monitoring using a device with accelerometers
MCDA Multiple-criteria Decision Analysis
MEMS Microelectromechanical Systems
MPU Motion Processing Unit
MRI Magnetic Resonance Imaging
O Heel and toe lifting
P Palms supporting
PC Personal Computer
PCB Printed Circuit Board
RMS Root Mean Square
S Shake following after a seating / Swing phase
SB Beginning of a movement (Lying on a bed / Sitting down on a bed)
SE End of a movement (Lying on a bed / Sitting down on a bed)
SOS The distress signal
STB Sit down / Get up beginning of a movement
STE Sit down / Get up end of a movement
T Tilt of a trunk
TB Beginning of a turn
TE End of a turn
UN DESA PD United Nations Department of Economic and Social Affairs, Population
Division

109 LIST OF PICTURES
109
7 LIST OF PICTURES
PIC. 1: POSITIONING OF COMMERCIAL PRODUCTS ........................................................... 31
PIC. 2: LAIPAC S911 BRACELET [PIC01] ............................................................................... 32
PIC. 3: FITBIT FLEX [PIC03] ................................................................................................... 32
PIC. 4: FITBIT ONE [PIC04] ................................................................................................... 32
PIC. 5: LAIPAC S911 LOLA [PIC02] ....................................................................................... 33
PIC. 6: PERSONAL INSPECT [PIC05] ..................................................................................... 33
PIC. 7: FORA CARE SOLUTION [PIC06] ................................................................................ 34
PIC. 8: TELEHEALTH GATEWAY GW9014 [PIC06] ............................................................... 34
PIC. 9: FATE - FALL DETECTOR FOR ELDERLY PROJECT [PIC07] ......................................... 37
PIC. 10: WISEL TECHNICAL SOLUTION [PIC08] ................................................................... 38
PIC. 11: WISEL INSOLES PROTOTYPES [PIC08] ................................................................... 38
PIC. 12: WALKING ON IRREGULAR SURFACE [PIC09] ......................................................... 39
PIC. 13: POSITIONING OF PROJECTS ................................................................................... 41
PIC. 14: MECHANICAL MODEL OF GYROSCOPE ................................................................. 42
PIC. 15: THE BASIC PRINCIPLE OF MECHANICAL ACCELEROMETER.................................. 43
PIC. 16: THE BASIC PRINCIPLE OF ACCELEROMETER IN ELECTRICAL DOMAIN ................ 43
PIC. 17: SCHEMATIC ILLUSTRATION OF A UNIAXIAL MEMES ACCELEROMETER .............. 44
PIC. 18: PRINCIPLE OF A MEMS ACCELEROMETER: ACCELERATION CHANGE ................. 44
PIC. 19: COMPONENTS FOR ASSEMBLING OF MEASURING BOARD ................................. 46
PIC. 20: PCB SOLDERED ....................................................................................................... 47
PIC. 21: PCB FITTED WITH ALL COMPONENTS ................................................................... 47
PIC. 22: DRAFT OF CONNECTIONS ...................................................................................... 47
PIC. 23: MEASURING BOARD ............................................................................................... 48
PIC. 24: MEASURING WEARABLE DEVICE ........................................................................... 48
PIC. 25: SENSOR PLACED ON A HEAD ................................................................................. 51
110 Daily activity monitoring using a device with accelerometers
PIC. 26: SENSOR PLACED ON AN ARM ................................................................................ 51
PIC. 27: SENSOR PLACED ON A TRUNK ............................................................................... 51
PIC. 28: SENSOR PLACED ON A WRIST ................................................................................ 52
PIC. 29: SENSOR PLACED ON A BELT .................................................................................. 52
PIC. 30: SENSOR PLACED ON A THIGH ................................................................................ 52
PIC. 31: SENSOR PLACED ON AN OUTER KNEE .................................................................. 53
PIC. 32: SENSOR PLACED AROUND AN ANKLE ................................................................... 53
PIC. 33: CHAIR - SIT DOWN ................................................................................................. 55
PIC. 34: CHAIR - STAND UP .................................................................................................. 56
PIC. 35: LIE DOWN ON A BED .............................................................................................. 57
PIC. 36: GET UP ON A BED ................................................................................................... 59
PIC. 37: GAIT CYCLE ............................................................................................................. 60
PIC. 38: 4 METERS SLOW / NORMAL / SWIFT WALK ......................................................... 61
PIC. 39: 4 METERS SLOW / NORMAL / SWIFT WALK WITH A TURN ................................. 61
PIC. 40: WALK DOWNSTAIRS ............................................................................................... 62
PIC. 41: WALK UPSTAIRS ..................................................................................................... 62

111 LIST OF TABLES
111
8 LIST OF TABLES
TABLE 1: SYMPTOMS OF ALZHEIMER’S DISEASE ............................................................... 27
TABLE 2: COMPARISON OF SELECTED EXISTING TECHNICAL SOLUTIONS ........................ 35
TABLE 3: TECHNICAL SPECIFICATION OF SELECTED EXISTING DEVICES ........................... 35
TABLE 4: SET OF MAIN COMPONENTS ............................................................................... 46
TABLE 5: PROJECTED USE OF SENSORS PLACED ON VARIOUS BODY PARTS (O PROS, -
CONS) ................................................................................................................................... 50
TABLE 6: EXPERIMENTAL PROTOCOLS ............................................................................... 54
TABLE 7: THE ACCELEROMETER'S SENSITIVITY PER LSB .................................................... 63
TABLE 8: WEIGHTS OF MARKERS FOR THE MAIN EXPERIMENTS ..................................... 64
TABLE 9: RESULTS OF THE EXPERIMENT CHAIR - SIT DOWN, HEALTHY PARTICIPANT I, THE
BEST POSITION IS HIGHLIGHTED BY GREEN COLOR, THE WORST POSITION IS
HIGHLIGHTED BY GREY COLOR ........................................................................................... 74
TABLE 10: RESULTS OF THE EXPERIMENT BED - GET UP, HEALTHY PARTICIPANT I, THE
BEST POSITION IS HIGHLIGHTED BY GREEN COLOR, THE WORST POSITION IS
HIGHLIGHTED BY GREY COLOR ........................................................................................... 82
TABLE 11: RESULTS OF THE EXPERIMENT GAIT - SLOW WALK, HEALTHY PARTICIPANT I,
THE BEST POSITION IS HIGHLIGHTED BY GREEN COLOR, THE WORST POSITION IS
HIGHLIGHTED BY GREY COLOR ........................................................................................... 88
TABLE 12: RESULTS OF ALL EXPERIMENTS, HEALTHY PARTICIPANT I, THE BEST POSITIONS
ARE HIGHLIGHTED BY GREEN COLOR, THE WORST POSITIONS ARE HIGHLIGHTED BY GREY
COLOR .................................................................................................................................. 89
TABLE 13: RESULTS OF THE EXPERIMENT CHAIR – SIT DOWN, HEALTHY PARTICIPANT II,
THE BEST POSITION IS HIGHLIGHTED BY GREEN COLOR, THE WORST POSITION IS
HIGHLIGHTED BY GREY COLOR ........................................................................................... 91

112 Daily activity monitoring using a device with accelerometers
TABLE 14: RESULTS OF THE EXPERIMENT BED – GET UP, HEALTHY PARTICIPANT II, THE
BEST POSITION IS HIGHLIGHTED BY GREEN COLOR, THE WORST POSITION IS
HIGHLIGHTED BY GREY COLOR ........................................................................................... 93
TABLE 15: RESULTS OF THE EXPERIMENT GAIT - SLOW WALK, HEALTHY PARTICIPANT II,
THE BEST POSITION IS HIGHLIGHTED BY GREEN COLOR, THE WORST POSITION IS
HIGHLIGHTED BY GREY COLOR ........................................................................................... 95
TABLE 16: RESULTS OF ALL EXPERIMENTS TO CHOICE A BEST SENSOR POSITIONING, THE
BEST POSITION IS HIGHLIGHTED BY DARK GREEN COLOR AND THROUGH WHITE COLOR
TOWARD TO DARK GREY COLOR THE WORST POSITION IS HIGHLIGHTED ...................... 96
TABLE 17: RESULTS OF ALL EXPERIMENTS TO CHOICE A BEST SENSOR POSITIONING, THE
BEST POSITION IS HIGHLIGHTED BY DARK GREEN COLOR AND THROUGH WHITE COLOR
TOWARD TO DARK GREY COLOR THE WORST POSITION IS HIGHLIGHTED .................... 104
113 LIST OF REFERENCES
113
9 LIST OF REFERENCES
[01] Bravo, J., Chen, L., Nugent, C., Pecchia, L. Ambient Assisted Living and Daily
Activities: 6th International Work-Conference, IWAAL 2014, Belfast, UK, December
2-5, 2014, Proceedings. New York: Springer International Publishing, 2014. ISBN
978-3-319-13104-7.
[02] Freedland, K., Jennings, J.R., Llabre, M.M., Manuck, S.B., Steptoe, A., Susman, E.J.
Handbook of Behavioral Medicine: Methods and Applications. New York: Springer
International Publishing, 2010. ISBN 978-0-387-09487-8.
[03] Gurková, Elena. Hodnocení kvality života. Praha: Grada Publishing a.s., 2011. ISBN
978-80-247-3625-9.
[04] Gutman, G., Sixsmith, A. Technologies for Active Aging. New York: Springer
International Publishing, 2013. ISBN 978-1-4419-8347-3.
[05] Husák, Miroslav. Mikrosenzory a mikroaktuátory. Praha: Academia, 2008. ISBN
978-80-200-1478-8.
[06] Jarošová, D. Úvod do komunitního ošetřovatelství. Praha: Grada, 2007. ISBN 80-
247-2150-3.
[07] Laake, Petter, Benestad Olsen. Research methodology in the medical and
biological sciences. Boston: Elsevier/AP, c2007. ISBN 978-0-12-373874-5.
[08] Luque, A., Nihtianov, S. Smart Sensors and MEMS: Intelligent Devices and
Microsystems for Industrial Applications. Cambridge: Woodhead Publishing
Limited, 2014. ISBN 978-0-85709-502-2.
[09] Mpofu, E., Oakland, T. Rehabilitation and Health Assessment: Applying ICF
Guidelines. New York: Springer Publishing Company, 2009. ISBN 978-0-8261-
5734-8.
114 Daily activity monitoring using a device with accelerometers
[10] Mukhopadhyay, S.C., Suryadevara, N.K. Smart Homes: Design, Implementation
and Issues. New York: Springer International Publishing, 2015. ISBN 978-3-319-
13556-4.
[11] Munzarová, M. Lékařský výzkum a etika. Praha: Grada Publishing a.s., 2005. ISBN
8024762048.
[12] World Health Statistics 2014. Geneva: World Health Organization, 2014. ISBN 978-
92-4-156471-7.
[13] Population Ageing and Development 2012 [online]. 2012. [cit. 2015-02-22].
Dostupné z:
http://www.un.org/en/development/desa/population/publications/pdf/ageing/
2012PopAgeingandDev_WallChart.pdf
[14] One. 2015. Fitbit [online]. [cit. 2015-02-24]. Dostupné z:
https://www.fitbit.com/one#i.ogzdxawpjcowpp
[15] S911 Locator "LOLA". 2013. In: Laipac Technology Inc. [online]. [cit. 2015-02-24].
Dostupné z: http://www.laipac.com/pdf/lola_hc.pdf
[16] GW9014 TeleHealth Gateway. 2012. In: ForaCare Suisse AG. [online]. [cit. 2015-
02-26]. Dostupné z:
http://www.foracare.ch/download/manual/FORA_9014_manual_EN.pdf
[17] About FARSEEING. 2015. Farseeing Research [online]. [cit. 2015-02-25]. Dostupné
z: http://farseeingresearch.eu/about-us/
[18] About the Project. 2015. ProFouND [online]. [cit. 2015-02-28]. Dostupné z:
http://profound.eu.com/about-the-project/
[19] Falls and technology related publications. 2015. Farseeing Research [online]. [cit.
2015-03-05]. Dostupné z: farseeingresearch.eu/category/resources/related-
publications/
[20] Mohler, Jane. Question about Your Project. In: Google Mail [online]. 14 March
2015, 8:17 PM [vid. 2015-03-15]. Available from the Internet for registered
participants: [email protected].
[21] Detecting human falls with 3-axis accelerometer and depth sensor. 2015. M.,
Kepski a Kwolek B. Farseeing Research [online]. [cit. 2015-03-06]. Dostupné z:
115 LIST OF REFERENCES
115
http://farseeingresearch.eu/2015/01/01/detecting-human-falls-with-3-axis-
accelerometer-and-depth-sensor/
[22] K., Delbaere, Ejupi A., Brodie M., Gschwind YJ., D. a Lord S. 2015. Choice stepping
reaction time test using exergame technology for fall risk assessment in older
people. Farseeing Research [online]. [cit. 2015-03-06]. Dostupné z:
http://farseeingresearch.eu/2015/01/01/choice-stepping-reaction-time-test-
using-exergame-technology-for-fall-risk-assessment-in-older-people/
[23] About the Project: FATE - FAll DeTector for the Elderly. 2011. Fate UPC [online].
[cit. 2015-03-06]. Dostupné z: http://fate.upc.edu/index.php
[24] WIISEL: Wireless Insole for Independent & Safe Elderly Living. 2015. Wiisel
[online]. [cit. 2015-03-06]. Dostupné z: http://www.wiisel.eu/?q=content/goals-
project
[25] A., Tarashansky, Vathsangam H. a Sukhatme GS. 2015. A study of position
independent algorithms for phone-based gait frequency detection. Farseeing
Research [online]. [cit. 2015-03-06]. Dostupné z:
http://farseeingresearch.eu/2015/01/01/a-study-of-position-independent-
algorithms-for-phone-based-gait-frequency-detection/
[26] Current Projects. 2014. Institute for Aging Research [online]. [cit. 2015-03-08].
Dostupné z: http://www.instituteforagingresearch.org/research/mobility-
falls/current-projects
[27] A. M. Tromp, S. M. F. Pluijm, J. H. Smit, D. J. H. Deeg, L. M. Bouter, And P. Lips,
“Fall-Risk Screening Test: A Prospective Study on Predictors for Falls in Community-
Dwelling Elderly,” Journal Of Clinical Epidemiology, Vol. 54, No. 8, Pp. 837–844,
2001.
[28] M. Raiche, R. Hebert, F. Prince, And H. Corriveau, “Screening Older Adults At Risk
Of Falling With The Tinetti Balance Scale,” The Lancet, Vol. 356, No. 9234, Pp.
1001–1002, 2000.
[29] J. H. J. Allum, B. R. Bloem, M. G. Carpenter, And F. Honegger, “Differential
Diagnosis Of Proprioceptive And Vestibular Deficits Using Dynamic Support-
Surface Posturography,” Gait & Posture, Vol. 14, No. 3, Pp. 217–226, 2001.
[30] Hewson D.J., Duchên J., Charpillet F. a Saboune J. 2007. The PARAChute Project:
Remote Monitoring of Posture and Gait for Fall Prevention. EURASIP Journal on

116 Daily activity monitoring using a device with accelerometers
Advances in Signal Processing [online]. [cit. 2015-03-06]. Dostupné z:
http://asp.eurasipjournals.com/content/2007/1/027421
[31] Boulgouris N. V., Plataniotis K. N., Hatzinakos D, “Gait Recognition Using Linear
Time Normalization,” Pattern Recognition, Vol. 39, No. 5, Pp. 969–979, 2006.
[32] What is Alzheimer's disease? 2015. Alzheimer's Society [online]. [cit. 2015-02-13].
Dostupné z:
http://www.alzheimers.org.uk/site/scripts/documents_info.php?documentID=1
00
[33] American Psychiatric Association: Diagnostic and Statistical Manual of Mental
Disorders, Fourth Edition, Text Revision. Washington, DC, American Psychiatric
Association, 2000.
[34] The effects of early onset Alzheimer's. 2015. YouTube [online]. [cit. 2015-02-14].
Dostupné z: https://www.youtube.com/watch?v=VwKRI2nshBk
[35] A., Cook a Polgar J. 2014. Assistive Technologies: Principles and Practice. Missouri:
Elsevier Health Sciences. ISBN 9780323291019.
[36] Bluetooth HC-06 with serial port module Easy guide. 2014. In: Punto Flotante, S.A.
[online]. [cit. 2015-04-06]. Dostupné z:
http://www.puntoflotante.net/BLUETOOTH-HC-06-WITH-SERIAL-PORT-EASY-
GUIDE.pdf
[37] MPU - 6000 and MPU - 6050 Register Map and Descriptions. 2012. In: InvenSense
Inc. [online]. [cit. 2015-04-06]. Dostupné z:
http://invensense.com/mems/gyro/documents/RM-MPU-6000A.pdf
[38] World Population Ageing 2013. 2013. In: United Nations [online]. [cit. 2015-02-
09]. Dostupné z:
http://www.un.org/en/development/desa/population/publications/pdf/ageing/
WorldPopulationAgeing2013.pdf
[39] Sun, Bohua. Waveguide gyro. In: Electronic Packaging Technology & High Density
Packaging (ICEPT-HDP), 2010 11th International Conference on. IEEE, 2010. p.
1324-1326.
[40] Pendyala, Sree Venkata Avinash; Singam, Nitin Kumar. An Intelligent Autonomous
Under Water Vehicular System for Marine Archaeological Site Exploration and
Data Acquisition. 2013. In: IIST [online]. [cit. 2015-03-21]. Dostupné z:
http://www.iisthub.com/Proceeding_Archives/PA_RDET09Feb2014/70-76.pdf.
117 LIST OF REFERENCES
117
[41] Class 74, Machine Element or Mechanism. 1994. USPTO [online]. [cit. 2015-03-
25]. Dostupné z:
http://www.uspto.gov/web/patents/classification/shadowFiles/defs074sf.htm?7
4_58&S&3J&3Q&4K&4L&4M&4N
[42] 20 Things You Didn't Know About Tunnels. 2009. Discover magazine [online]. [cit.
2015-04-11]. Dostupné z: http://discovermagazine.com/2009/may/20-things-
you-didnt-know-about-tunnels
[43] MOON, Francis C. 2007. The machines of Leonardo da Vinci and Franz Reuleaux:
kinematics of machines from the renaissance to the 20th century. Dordrecht:
Springer, xxxi, 416 s. ISBN 978-1-4020-5598-0.
[44] H., Menz a Lord S. 2003. Acceleration patterns of the head and pelvis when
walking on level and irregular surfaces. National Center for Biotechnology
Information [online]. [cit. 2015-05-06]. Dostupné z:
http://www.ncbi.nlm.nih.gov/pubmed/12855299
[45] Robbins Se, Gouw Gj, Mcclaran J. Shoe sole thickness and hardness influence
balance in older men. J Am Geriatr Soc 1992;40:1089/94.
[46] Brecht Js, Chang Mw, Price R, Lehmann J. Decreased balance performance in
cowboy boots compared with tennis shoes. Arch Phys Med Rehabil
1995;76:940/6.
[47] Wija P. Supplementary material for problematic of long-term care and healthy
aging (in Czech). Prague: UK FHS a MZ ČR, 2013.
[48] Vankova H, Holmerova I, Andel R, Veleta P, Janeckova H. Functional status and
depressive symptoms among older adults from residential care facilities in the
Czech Republic. International journal of geriatric psychiatry. 2008;23(5):466-71.
[49] Víšek P, Prusa L. Optimalization of social services . (in Czech), Prague: 2012.
[50] Průša L. Providing nursing and rehabilitation health care in residential social
services and social services in hospitals (in Czech). VÚPSV, 2009.
[51] Malaník Jakub, Bakalářská práce, Vzájemné využití MATLAB a Microsoft .NET
Framework (C#), 2013 (vedoucí: Petr Novák)
[52] Senior Inspect. 2015. Clevertech [online]. [cit. 2015-03-29]. Dostupné z:
http://www.clevertech.cz/en/senior-inspect.html

118 Daily activity monitoring using a device with accelerometers

119 LIST OF REFERENCES OF PICTURES
119
10 LIST OF REFERENCES OF PICTURES
[PIC01] S911_bracelet_locator.jpg. 2014. Asis Confex [online]. [cit. 2015-04-25].
Dostupné z:
https://asis.confex.com/asis/ansem2010/webprogram/Abstract/Session2430
5/s911_bracelet_locator.jpg
[PIC02] Lola-au-1.jpg. 2014. Shop Piperasis [online]. [cit. 2015-04-25]. Dostupné z:
http://shop.piperaris.com/media/catalog/product/cache/15/image/600x600/
9df78eab33525d08d6e5fb8d27136e95/l/o/lola-au-1.jpg
[PIC03] 61YRYwYtSJL._SL1500_.jpg. 2014. Images Amazon [online]. [cit. 2015-04-25].
Dostupné z: http://ecx.images-
amazon.com/images/I/61YRYwYtSJL._SL1500_.jpg
[PIC04] A3h4-800.jpg. 2014. Media Engadged [online]. [cit. 2015-04-25]. Dostupné z:
http://media.engadget.com/img/products/471/a3h4/a3h4-800.jpg
[PIC05] In1.jpg. 2014. Zena In [online]. [cit. 2015-05-07]. Dostupné z: http://zena-
in.cz/media/2012/04/18/in1.jpg
[PIC06] Pic-telehealth-cycle.jpg. 2012. ForaCare [online]. [cit. 2015-04-25]. Dostupné
z: http://www.foracare.ch/telehealth-solution.html
[PIC07] Sensor.jpg. 2015. Fate UPC [online]. [cit. 2015-04-25]. Dostupné z:
http://fate.upc.edu/img/sensor.png
[PIC08] Insole.jpg. 2013. Wiisel [online]. [cit. 2015-04-25]. Dostupné z:
http://www.wiisel.eu/?q=content/progress-work
[PIC09] Acceleration Patterns of the Head and Pelvis When Walking Are Associated
With Risk of Falling in Community-Dwelling Older People. 2003.
Biomedgerontology [online]. [cit. 2015-04-25]. Dostupné z:
http://biomedgerontology.oxfordjournals.org/content/58/5/M446.full.pdf+ht
ml

120 Daily activity monitoring using a device with accelerometers
121
121 LIST OF ELECTRONIC APPENDIX
11 LIST OF ELECTRONIC APPENDIX
./Masters_thesis Text of the Master’s thesis in PDF format
./Software M-files for data processing and data evaluation

122 Daily activity monitoring using a device with accelerometers

123 LIST OF APPENDICES
123
12 LIST OF APPENDICES
APPENDIX I. FIGURES FOR EXPERIMENT CHAIR – SIT DOWN, PARTICIPANT II ......... 125
APPENDIX II. FIGURES FOR EXPERIMENT BED – GET UP, PARTICIPANT II ................. 127
APPENDIX III. FIGURES FOR EXPERIMENT GAIT – SLOW WALK, PARTICIPANT II ........ 129
APPENDIX IV. FIGURES FOR ALL EXPERIMENTS CHAIR - SENIORS ............................... 131

124 Daily activity monitoring using a device with accelerometers
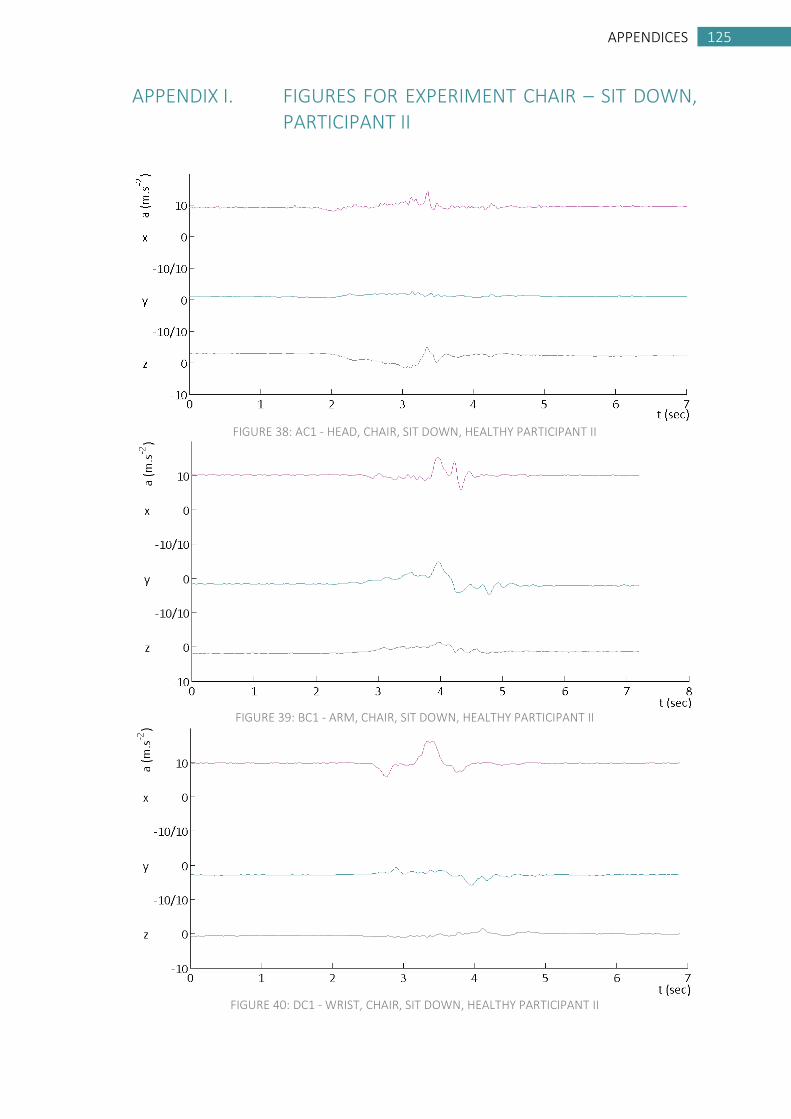
125 APPENDICES
125
APPENDIX I. FIGURES FOR EXPERIMENT CHAIR – SIT DOWN, PARTICIPANT II
FIGURE 38: AC1 - HEAD, CHAIR, SIT DOWN, HEALTHY PARTICIPANT II
FIGURE 39: BC1 - ARM, CHAIR, SIT DOWN, HEALTHY PARTICIPANT II
FIGURE 40: DC1 - WRIST, CHAIR, SIT DOWN, HEALTHY PARTICIPANT II
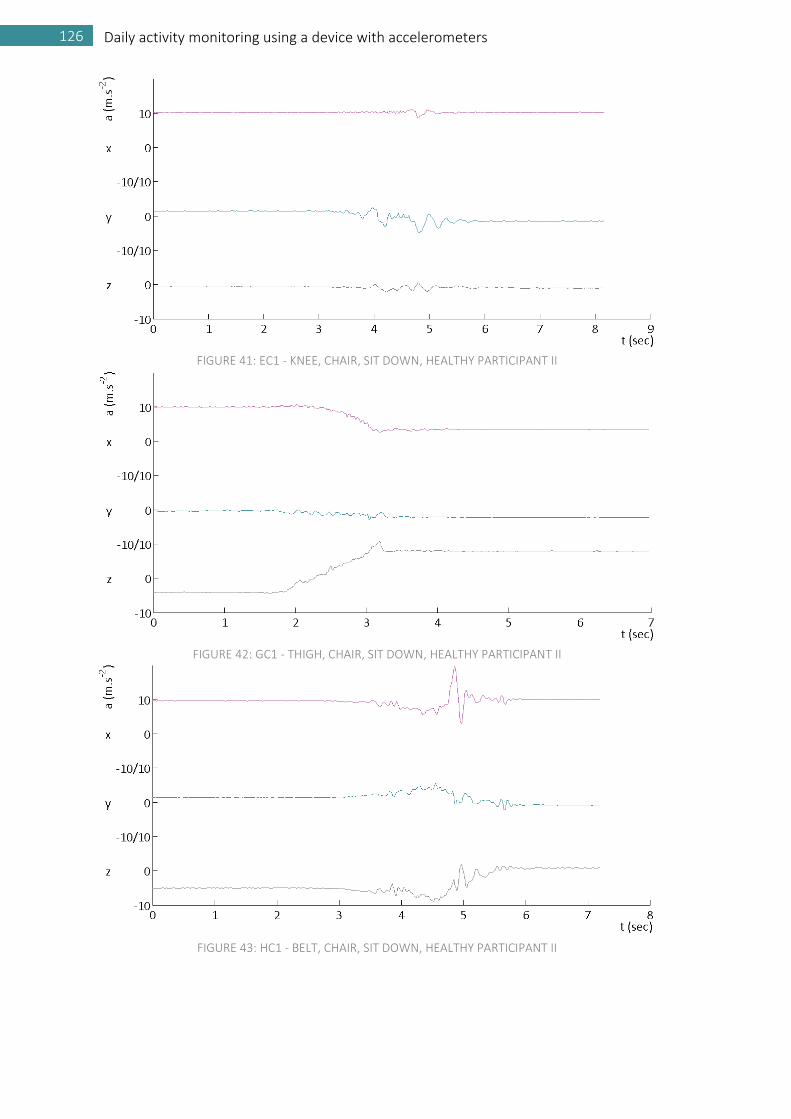
126 Daily activity monitoring using a device with accelerometers
FIGURE 41: EC1 - KNEE, CHAIR, SIT DOWN, HEALTHY PARTICIPANT II
FIGURE 42: GC1 - THIGH, CHAIR, SIT DOWN, HEALTHY PARTICIPANT II
FIGURE 43: HC1 - BELT, CHAIR, SIT DOWN, HEALTHY PARTICIPANT II

127 APPENDICES
127
APPENDIX II. FIGURES FOR EXPERIMENT BED – GET UP, PARTICIPANT II
FIGURE 44: AB2 - HEAD, BED, GET UP, HEALTHY PARTICIPANT II
FIGURE 45: CB2 - TRUNK, BED, GET UP, HEALTHY PARTICIPANT II
FIGURE 46: DB2 -WRIST, BED, GET UP, HEALTHY PARTICIPANT II

128 Daily activity monitoring using a device with accelerometers
FIGURE 47: EB2 - KNEE, BED, GET UP, HEALTHY PARTICIPANT II
FIGURE 48: FB2 - ANKLE, BED, GET UP, HEALTHY PARTICIPANT II
FIGURE 49: GB2 - THIGH, BED, GET UP, HEALTHY PARTICIPANT II

129 APPENDICES
129
APPENDIX III. FIGURES FOR EXPERIMENT GAIT – SLOW WALK, PARTICIPANT II
FIGURE 50: BG1 - ARM, GAIT, SLOW WALK, HEALTHY PARTICIPANT II
FIGURE 51: CG1 - TRUNK, GAIT, SLOW WALK, HEALTHY PARTICIPANT II
FIGURE 52: DG1 - WRIST, GAIT, SLOW WALK, HEALTHY PARTICIPANT II

130 Daily activity monitoring using a device with accelerometers
FIGURE 53: EG1 - KNEE, GAIT, SLOW WALK, HEALTHY PARTICIPANT II
FIGURE 54: GG1 - THIGH, GAIT, SLOW WALK, HEALTHY PARTICIPANT II
FIGURE 55: HG1 - BELT, GAIT, SLOW WALK, HEALTHY PARTICIPANT II
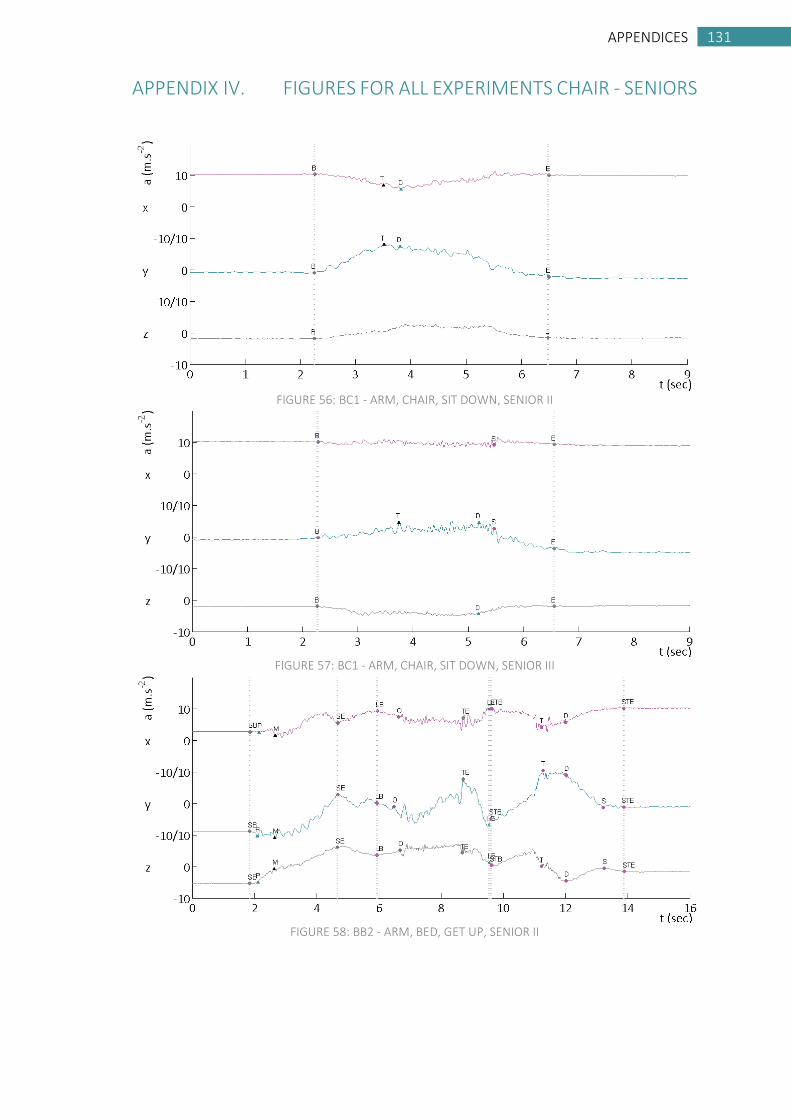
131 APPENDICES
131
APPENDIX IV. FIGURES FOR ALL EXPERIMENTS CHAIR - SENIORS
FIGURE 56: BC1 - ARM, CHAIR, SIT DOWN, SENIOR II
FIGURE 57: BC1 - ARM, CHAIR, SIT DOWN, SENIOR III
FIGURE 58: BB2 - ARM, BED, GET UP, SENIOR II

132 Daily activity monitoring using a device with accelerometers
FIGURE 59: BB2 - ARM, BED, GET UP, SENIOR III
FIGURE 60: BG1 - ARM, GAIT, SLOW WALK, SENIOR I
FIGURE 61: BG1 - ARM, GAIT, SLOW WALK, SENIOR II