cysteine scanning of cftr’s first transmembrane segment re veals · pdf...
TRANSCRIPT

Cysteine Scanning of CFTR’s First Transmembrane Segment Reveals Its Plausible Roles in Gating and Permeation
Xiaolong Gao†‡, Yonghong Bai†‡, and Tzyh-Chang Hwang†‡§*
†Dalton Cardiovascular Research Center, ‡Department of Biological Engineering, and §Department of Medical Pharmacology and Physiology, University of Missouri-Columbia, Columbia, Missouri, 65211, USA
*Correspondence: [email protected]
Tzyh-Chang Hwang
134 Research Park Dr.
Dalton Cardiovascular Research Center
Columbia, MO, 65211
USA

Supporting Material
Figure S1. Effects of changes in pH on whole-cell A107C-CFTR currents. Whole-cell current amplitudes in different pH baths were measured at +80 mV membrane potential and normalized to that of pH 6. To fit the data points, a modified Henderson-Hasselbalch equation (I (pH) = Imax/(1+10^(pH-pKa))) was used, where Imax was operationally set as 1. The fitting results in a pKa value of 7.25.
Figure S2. Alterations in permeation and gating of Q98C/Cysless channels by MTSET. Cysteine substitution of Q98 lowers the single-channel amplitude to 0.32 ± 0.01 pA (n = 10) from 0.46 ± 0.01 pA (n = 3) of the WT/Cysless channel (Fig. 3 B). The Po of Q98C/Cysless-CFTR is also decreased (0.20 ± 0.04, n = 4, 0.67 ± 0.06 for WT/Cysless, n = 2). MTSET modification increases the single-channel amplitude by 13.6% ± 2.0% (n = 4) and the Po by 167% ± 46% (n = 4).
-400 -300 -200 -100 0x10
-15
-500 -400 -300 -200 -100 0x10
-15
-500 -400 -300 -200 -100 0x10
-15
Q98C/Cysless2 s0.
2 pA
2 mM ATP
2 mM ATP+ 1 mM MTSET
2 mM ATP after DTT application
0.1 pA
200
even
ts
(A)
(A)
(A)
Single Channel Currrent Amplitude
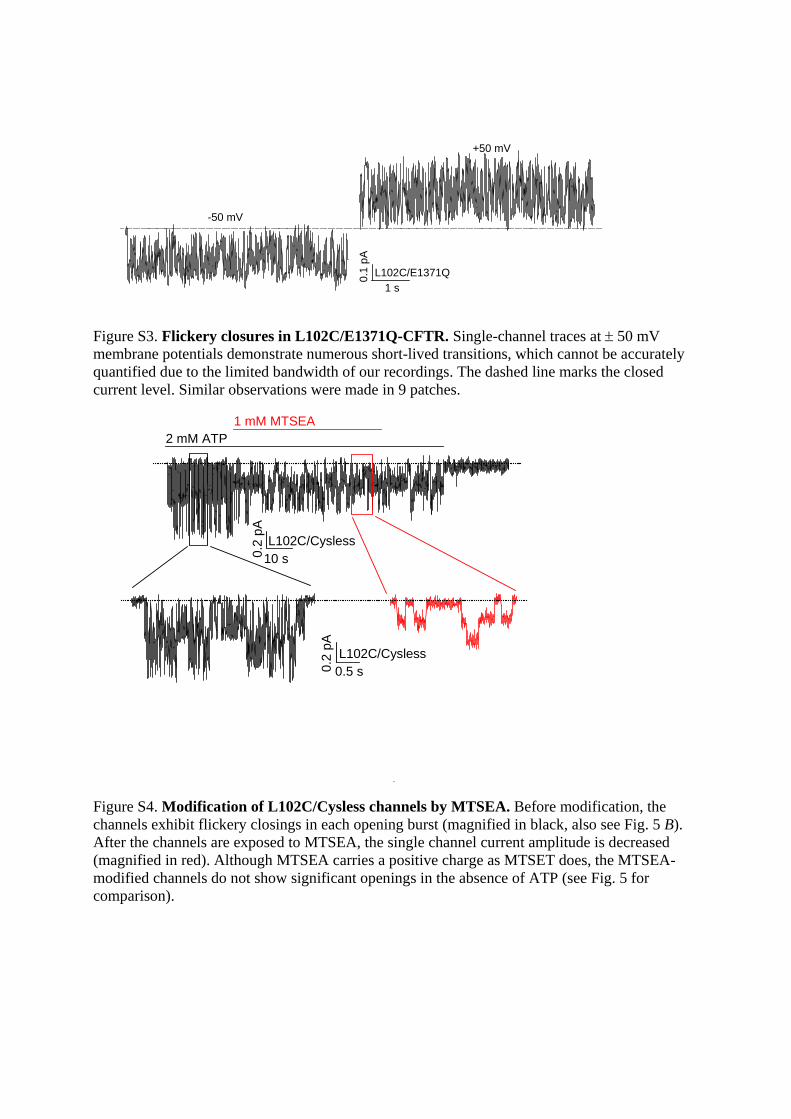
Figure S3. Flickery closures in L102C/E1371Q-CFTR. Single-channel traces at 50 mV membrane potentials demonstrate numerous short-lived transitions, which cannot be accurately quantified due to the limited bandwidth of our recordings. The dashed line marks the closed current level. Similar observations were made in 9 patches.
Figure S4. Modification of L102C/Cysless channels by MTSEA. Before modification, the channels exhibit flickery closings in each opening burst (magnified in black, also see Fig. 5 B). After the channels are exposed to MTSEA, the single channel current amplitude is decreased (magnified in red). Although MTSEA carries a positive charge as MTSET does, the MTSEA-modified channels do not show significant openings in the absence of ATP (see Fig. 5 for comparison).
1 s
0.1
pA
L102C/E1371Q
-50 mV
+50 mV
0.2
pA
10 s
0.5 s0.2
pA
2 mM ATP1 mM MTSEA
L102C/Cysless
L102C/Cysless

Figure S5. Summary of SCAM results on TM1 from different laboratories. Positions labeled with MTS (inside/outside) denote those tested as reactive to internally or externally applied MTS reagents. Positions marked by () represent residues which show no significant response to MTS reagents. Blank positions are those not tested in the corresponding study.
Hwang Linsdell (35, 47) Akabas (25)D110 Y109 MTS (outside)
S108 A107 MTS (outside)
I106 MTS (outside)
I105 R104 MTS (outside)
G103 L102 MTS (inside) MTS (inside)
L101 L100 P99 MTS (inside) Q98 MTS (inside) MTS (inside) MTS (outside)
V97 A96 K95 MTS (inside) MTS (inside) MTS (outside)
T94 V93 E92 MTS (inside) G91 MTS (outside)
L90 Y89 L88 F87 I86 G85 Y84 F83 M82 F81
TM1

Figure S6. Modification of C106 by MTSET. Whole-cell recording of I106C/Cysless-CFTR demonstrates that both MTSET (blue) and cadmium (green) could reach the 106 position from the extracellular side and cause a reduction of the whole-cell current. In this particular case, the pipette solution contained 125 mM [Cl-].
4
2
-2-100 -50 50
100 s
2 nA I106C/Cysless
1 mM MTSET
10 mM DTT1 mM Cadmium
I (nA)
V (mV)
a
b
c
b-a
c-a
Fsk

Figure S7. Modification of E92C mutant channel by MTSES. In 5 patches where MTSES was applied for an extended period of time, we continuously monitored the single-channel amplitude. If the modification does occur when the channel is closed, we expect to see a stretch of openings with a larger conductance level followed by an opening into a smaller conductance level. However, what we observed in all cases is opening into a larger conductance and an abrupt reduction of the single-channel amplitude without prior closure of the gate (blue magnified square). After that transition, subsequent openings all show smaller conductance. These results suggest that, like C95, C98 and C102, the cysteine at this position is also preferentially modified in the open state.
0.5 s
0.2
pA
50 ms0.1
pA
2 mM ATP + 1 mM MTSES
E92C/Cysless

Figure S8. Cross-section views of a homology model of CFTR based on the crystal structure of inward facing MsbA. (A) Side views of TMDs in modeled structure of CFTR show that TM1 is concealed away from the pore by other parts of the molecule in the presumed closed state of CFTR. (B) Intracellular views demonstrate that TM1 makes negligible contribution to pore-lining in this conformation.
Figure S9. Cross-section views of the crystal structure of TM287-TM288’s TMDs in the inward-facing conformation. (A) A side view of TMDs of TM287-TM288 and three cross sections demonstrate that TM1 (red) is located to the periphery of the TMD complex. (B) Intracellular view of the TMDs in TM287-TM288 and three cross sections show that TM1 (red) does not participate in lining the substrate translocation pathway. In contrast, both TM6 (green) and TM12 (blue) can be seen through the whole stretch of the pore.

Supporting References
1. Akabas, M.H., C. Kaufmann, T.A. Cook, and P. Archdeacon. 1994. Amino acid residues lining the chloride channel of the cystic fibrosis transmembrane conductance regulator. J Biol Chem. 269:14865-14868.
2. Wang, W., Y. El Hiani, and P. Linsdell. 2011. Alignment of transmembrane regions in the cystic fibrosis transmembrane conductance regulator chloride channel pore. J Gen Physiol. 138:165-178.
3. Zhou, J.J., M. Fatehi, and P. Linsdell. 2008. Identification of positive charges situated at the outer mouth of the CFTR chloride channel pore. Pflugers Archiv. 457:351-360.