cyprus - european commission€¦ · cera cyprus energy regulatory authority cba cost benefit...
TRANSCRIPT

Cyprus’
Draft Integrated National Energy and Climate Plan
for the period 2021-2030
Nicosia
January 2019
v.1.1

2 | C y p r u s ’ N E C P 2 0 2 1 - 2 0 3 0
Title of report Cyprus’ Draft Integrated national energy and climate plan for the
period 2021-2030
Contact names Theodoulos Mesimeris
George Partasides
Organisation Republic of Cyprus
Coordination/
Formatting
Nicoletta Kythreotou, Department of Environment
Authors Theodoulos Mesimeris, Department of Environment
Nicoletta Kythreotou, Department of Environment
George Partasides, Energy Service
Katerina Piripitsi, Energy Service
Christina Karapitta-Zachariadou, Energy Service
Nikolas Hadjinikolaou, Energy Service
Demetris Psyllides, Ministry of Transport, Communications and Works
Areti Christodoulou, Department of Forests
Melina Menelaou, Department of Environment
George Papageorgiou, Energy Service
Theodora Antoniou, Energy Service
Michalis Chrysaphis, Hydrocarbons Service
Christiana Vasiliou, Hydrocarbons Service
Anastasia Kalaika, Energy Service
Marios Chandriotis, Energy Service
Achilleas Sotirelis, Hydrocarbons Service
Christodoulos Ellinopoulos, Energy Service
Contact details Tel. (+357) 22 408 900
Fax. (+357) 22 774 945
Date of submission 23 January 2019
Version 1.1

3 | C y p r u s ’ N E C P 2 0 2 1 - 2 0 3 0
Preface
This document is the Draft Integrated National Energy and Climate Plan (DINECP) submitted to the
European Commission in accordance to Article 9(1) of Regulation (EU) 2018/1999 of the European
Parliament and of the Council of 11 December 2018 on the Governance of the Energy Union and
Climate Action, amending Regulations (EC) No 663/2009 and (EC) No 715/2009 of the European
Parliament and of the Council, Directives 94/22/EC, 98/70/EC, 2009/31/EC, 2009/73/EC, 2010/31/EU,
2012/27/EU and 2013/30/EU of the European Parliament and of the Council, Council Directives
2009/119/EC and (EU) 2015/652 and repealing Regulation (EU) No 525/2013 of the European
Parliament and of the Council, which has been prepared in accordance with Article 3(1) and Annex I of
the same Regulation.
The DINECP v.1.1 does not contain the necessary information on consultations (section 1.3) and the
impact assessment (chapter 5).

4 | C y p r u s ’ N E C P 2 0 2 1 - 2 0 3 0
Abbreviations
BaU Business as Usual
CO2 Carbon dioxide
CERA Cyprus Energy Regulatory Authority
CBA Cost Benefit Analysis
CBCA Cross Border Cost Allocation
CEF Connecting Europe Facility
CHC Cyprus Hydrocarbons Company
CYGAS Natural Gas Public Company (DEFA in Greek)
DEFA Natural Gas Public Company
DINECP Draft Integrated National Energy and Climate Plan
DoE Department of Environment
DSO Distribution System Operator (Electricity Authority of Cyprus)
EAC Electricity Authority of Cyprus
EIA Environmental Impact Assessment
ESR Effort Sharing Regulation - Regulation (EU) 2018/842 of the European Parliament and of the
council of 30 May 2018 on binding annual greenhouse gas emission reductions by Member
States from 2021 to 2030 contributing to climate action to meet commitments under the
Paris Agreement and amending Regulation (EU) No 525/2013
FEED Front End Engineering Design
FiT Feed-in-Tariff
FSRU Floating Storage and Regasification Unit
ETYFA Natural Gas Infrastructure Company of Cyprus
GHG Greenhouse gas emissions
IFEU The Institut für Energie- und Umweltforschung Heidelberg GmbH in Germany
INDC Intended Nationally Determined Contributions
INECP Integrated National Energy and Climate Plan
IPP Independent power producers
LNG Liquefied Natural Gas

5 | C y p r u s ’ N E C P 2 0 2 1 - 2 0 3 0
LULUCF Land Use, Land Use Change and Forestry
LULUCF Regulation- Regulation (EU) 2018/841 of the European Parliament and of the Council of 30
May 2018 on the inclusion of greenhouse gas emissions and removals from land use, land
use change and forestry in the 2030 climate and energy framework, and amending
Regulation (EU) No 525/2013 and Decision No 529/2013/EU
MARDE Ministry of Agriculture, Rural Development and Environment
MECI Ministry of Energy, Commerce and Industry
MC Ministerial Committee
MTCW Ministry of Transport, Communications and Works
MoU Memorandum of Understanding
MOF Ministry of Finance
NCA National Competent Authority, responsible for PCIs in the Republic of Cyprus (MECI)
OSS One Stop Shop 4 Energy PCIs (MECI), in the Republic of Cyprus
PAMs Policies and Measures as described by the Governance Regulation
PCI Project of Common Interest according to EU Regulation 347/2013/EC
RES Renewable Energy Sources
TDRs Transmission and Distribution Rules
TSOC Transmission System Operator Cyprus
TSRs Trade and Settlement Rules
WAM With Additional Measures
WEM With Existing Measures

6 | C y p r u s ’ N E C P 2 0 2 1 - 2 0 3 0
Contents
Part 1 General framework ................................................................................................................ 11
SECTION A: NATIONAL PLAN ............................................................................................................. 11
1. Overview and process for establishing the plan ................................................................... 12
1.1. Executive Summary ...................................................................................................... 12
1.2. Overview of current policy situation ............................................................................ 12
1.3. Consultations and involvement of national and EU entities and their outcome ......... 20
1.4. Regional cooperation in preparing the plan ................................................................. 20
2. National objectives and targets ............................................................................................ 21
2.1. Dimension Decarbonisation ......................................................................................... 21
2.1.1. GHG emissions and removals .............................................................................. 21
2.1.2. Renewable energy ............................................................................................... 23
2.2. Dimension Energy efficiency ........................................................................................ 46
2.3. Dimension Energy security ........................................................................................... 51
2.4. Dimension Internal energy market .............................................................................. 53
2.4.1. Electricity interconnectivity ................................................................................. 53
2.4.2. Energy transmission infrastructure ..................................................................... 54
2.4.3. Market integration .............................................................................................. 60
2.4.4. Energy poverty ..................................................................................................... 62
2.5. Dimension Research, innovation and competitiveness ............................................... 63
3. Policies and measures ........................................................................................................... 65
3.1. Dimension Decarbonisation ......................................................................................... 65
3.1.1. GHG emissions and removals .............................................................................. 65
3.1.2. Renewable energy ............................................................................................... 72
3.1.3. Other elements of the dimension ....................................................................... 78
3.2. Dimension Energy efficiency ........................................................................................ 78
3.3. Dimension Energy security ........................................................................................... 90
3.4. Dimension Internal energy market .............................................................................. 91
3.4.1. Electricity infrastructure ...................................................................................... 91
3.4.2. Energy transmission infrastructure ..................................................................... 92
3.4.3. Market integration .............................................................................................. 95
3.4.4. Energy Poverty ..................................................................................................... 97
3.5. Dimension Research, innovation and competitiveness ............................................... 97
Part 1 General framework .............................................................................................................. 101
SECTION B: ANALYTICAL BASIS ....................................................................................................... 101
4. Current situation and projections with existing policies and measures ............................. 102
4.1. Projected evolution of main exogenous factors influencing energy system and GHG
emission developments ........................................................................................................... 102
4.2. Dimension Decarbonisation ....................................................................................... 103
4.2.1. GHG emissions and removals ............................................................................ 103
4.2.2. Renewable energy ............................................................................................. 106
4.3. Dimension Energy efficiency ...................................................................................... 106
4.4. Dimension Energy security ......................................................................................... 108

7 | C y p r u s ’ N E C P 2 0 2 1 - 2 0 3 0
4.5. Dimension Internal energy market ............................................................................ 108
4.5.1. Electricity interconnectivity ............................................................................... 108
4.5.2. Energy transmission infrastructure ................................................................... 108
4.5.3. Electricity and gas markets, energy prices ........................................................ 109
4.6. Dimension Research, innovation and competitiveness ............................................. 109
5. Impact assessment of planned policies and measures ....................................................... 113
Part 2 List of parameters and variables to be reported in Section B of National Plans ................... 114
1. General parameters and variables ...................................................................................... 115
2. Energy balances and indicators ........................................................................................... 117
2.1. Energy supply ............................................................................................................. 117
2.2. Electricity and heat ..................................................................................................... 117
2.3. Transformation sector ................................................................................................ 117
2.4. Energy consumption ................................................................................................... 117
2.5. Prices .......................................................................................................................... 118
2.6. Investments ................................................................................................................ 118
2.7. Renewables ................................................................................................................ 118
3. GHG emissions and removals related indicators ................................................................ 119
References ................................................................................................................................... 125
Appendices .................................................................................................................................... 126
Appendix I: List of technical assistance projects completed ....................................................... 127
Appendix II: Summary table on the existing and additional polices and measures on energy
efficiency ...................................................................................................................................... 129
Appendix III: Cumulative expenses needed to achieve the WEM Scenario for the period 2021-
2030 ............................................................................................................................................. 138
Appendix IV: EU competitive programs related to energy and climate for the period 2014 - 2020
..................................................................................................................................................... 139
Appendix V: .................................................................................................................................. 147
Appendix VI .................................................................................................................................. 149
Appendix VII: Input assumptions for the first iteration of the Existing PaMs scenario ............... 151
Appendix VIII: Forecasting of Energy Prices for Cyprus Government in coordination with Cyprus
Hydrocarbon Company ................................................................................................................ 163
Appendix IX: DRAFT - JRC/IPR/2018/C.3/0034/NC - Technical support on long-term energy
modelling (LTEM) - Analysis of future scenarios for the Cyprus energy system - Existing PaMs
scenario........................................................................................................................................ 168

8 | C y p r u s ’ N E C P 2 0 2 1 - 2 0 3 0
List of Tables
Table 2.1. Existing Status of RES in Final Energy Consumption .............................................................. 24
Table 2.2. Scenarios parameters ............................................................................................................ 36
Table 2.3. Capacity projections in the electricity supply sector (MW). .................................................. 37
Table 2.4. Share of RES in Heating Sector (Reference Scenario with Measures) ................................... 38
Table 2.5. Techno-economic characteristics of technologies ................................................................. 39
Table 2.6. Techno-economic characteristics of technologies in the residential sector (JRC, 2016b) ..... 40
Table 2.7. Capacity (MW) Mix of various Renewable Energy Technologies evolution. .......................... 44
Table 2.8. Key parameters of power generation according to forecasts with an optimization model. . 49
Table 2.9. Trajectory of primary energy consumption (Mtoe) with additional measures, 2020-2030 .. 50
Table 2.10. Sectoral projections of final energy demand in 2030 .......................................................... 50
Table 3.1. Involved ministries to climate change mitigation policies and measures ............................. 66
Table 3.2. Overview of key policies affecting the national climate target to 2030 ................................ 67
Table 3.3. Electricity Generation per Technology until 2017 ................................................................. 72
Table 3.4. Renewable electricity sold at a subsidized price (GWh per year) until 2017. ....................... 72
Table 3.5. Subsidy paid to RES Producers in million Euro per Year ........................................................ 73
Table 3.6. Subsidy per renewable energy source in Cyprus for the period 2008-2017 .......................... 73
Table 3.7. Energy and climate projects funded up to now by the financing measures in Cyprus ........ 100
Table 4.1. Macroeconomic forecasts (GDP and population growth) ................................................... 102
Table 4.2. Total BaU GHG emissions aggregated by source category (Gg CO2 eq.) 2005-2040 ........... 103
Table 4.3. ETS BaU GHG emissions aggregated by source category (Gg CO2 eq.) 2005-2040 ............. 104
Table 4.4. ESR BaU GHG emissions aggregated by source category (Gg CO2 eq.) 2005-2040 ............. 104
Table 4.5. Total BaU GHG emissions for the energy sources (Gg CO2 eq.) 2005-2040 ........................ 104
Table 4.6. Total WEM GHG emissions aggregated by source category (Gg CO2 eq.) 2005-2040 ........ 105
Table 4.7. ETS WEM GHG emissions aggregated by source category (Gg CO2 eq.) 2005-2040 ........... 105
Table 4.8. ESR WEM GHG emissions aggregated by source category (Gg CO2 eq.) 2005-2040 ........... 106
Table 4.9. Current primary and final energy consumption in the economy and per sector ................ 106
Table 4.10. Sectoral energy projections for 2030 With Existing Measures .......................................... 107
Table 4.11. Monthly Seasonal Double Use Commercial and Industrial Use Low Voltage Recording (Code 30) .............................................................................................................................................. 110
Table 4.12. Monthly Seasonal Double Use Commercial and Industrial Use Medium Voltage Recording (Code 40) .............................................................................................................................................. 110
Table 4.13. Monthly Seasonal Double Use Commercial and Industrial Use High Voltage Recording (Code 50) .............................................................................................................................................. 111

9 | C y p r u s ’ N E C P 2 0 2 1 - 2 0 3 0
List of Figures
Figure 1.2. Existing Renewable Energy Share between technologies as of the end of 2016 ................. 15
Figure 1.3. Share of renewable energy in total primary energy consumption in per cent, 1990-2016 . 15
Figure 1.4. Final energy consumption by sector in ktoe, 1990-2016 ..................................................... 15
Figure 1.5. Change in average end-user energy prices in Cyprus compared to the gross disposable income for households, industry and agriculture, 1990-2014 ............................................................... 17
Figure 1.1. Structure of the national governance system for Climate and Energy ................................. 19
Figure 2.1. Existing Renewable Energy Share between technologies as of the end of 2016 ................. 25
Figure 2.2. Various Energy Pathways examined up to 2030 for Electricity Sector in IRENA Roadmap Study, Nicosia 2015 ................................................................................................................................ 26
Figure 2.3. Energy Planning methodology and steps that were followed .............................................. 26
Figure 2.4. Typical Electricity Demand throughout the year (typical year 2014) ................................... 28
Figure 2.5. Nicosia’s heating and cooling days (Zachariades and Hadjinicolaou, 2014) ......................... 29
Figure 2.6. Impact of the Variable Renewable Energy Sources on System Overall Cost. ....................... 29
Figure 2.7. Renewable Energy Sources in Final Energy Consumption in ktoe, Reference Scenario ....... 30
Figure 2.8. RES in final energy demand per Sector - With Existing Measures until 2030 ....................... 31
Figure 2.9. Total Electricity Generation with all available Technologies contribution ........................... 33
Figure 2.10. JRC Methodology Approach for RES integration study ...................................................... 34
Figure 2.11. Scenario A1, with 55% RES penetration, 17% Curtailment, Pumped Storage (non-Realistic) ................................................................................................................................................................ 35
Figure 2.12. Energy Efficiency Scenario with Additional Measures (WAM) and RES scenario with existing measures. .................................................................................................................................. 36
Figure 2.13. RES in Heating and Cooling Sector towards 2030 (PJ) (RES share in Electricity varies from 15%-26%) ................................................................................................................................................ 38
Figure 2.14. RES share in heating and Cooling Sector (with and without Electricity Contribution) ....... 39
Figure 2.15. Assumed share of annual cooling demand for each hour within each month ................... 41
Figure 2.16. Energy Mix Generation for Various fuels from 2021-2030 ................................................. 43
Figure 2.17. Breakdown of the Annualized system cost and the expected price of electricity assuming ideal market conditions. ......................................................................................................................... 44
Figure 2.18. Yearly Investment Cost per Technology from 2021-2030 .................................................. 45
Figure 2.19. Forecast of final energy and electricity demand in Cyprus (in absolute terms and related to national GDP) up to 2050 ................................................................................................................... 49
Figure 2.20. EuroAsia Interconnector Cross-Border benefits ................................................................. 54
Figure 2.21. EuroAfrica Interconnector Cross-Border benefits .............................................................. 59
Figure 3.1. Policy Decision Tree and Scenario’s With Existing Measures (WEM) and 3 possible pathways With Additional Measures (WAM) ......................................................................................... 77
Figure 3.2. Overview of policies for the household sector ..................................................................... 86
Figure 3.3. Overview of policies for the service sector........................................................................... 86

10 | C y p r u s ’ N E C P 2 0 2 1 - 2 0 3 0
Figure 3.4. Overview of policies for the industry sector ......................................................................... 87
Figure 3.5. Overview of policies for the agricultural sector ................................................................... 87
Figure 3.6. Overview of policies for the transport sector ....................................................................... 88
Figure 4.1. ESR, ETS and Total BaU GHG emissions for the period 2005-2040 (Gg CO2 eq.) ............... 104
Figure 4.2. ESR, ETS and Total Energy BaU GHG emissions for the period 2005-2040 (Gg CO2 eq.) ... 105
Figure 4.3. ESR, ETS and Total WEM GHG emissions for the period 2005-2040 (Gg CO2 eq.) ............. 106

11 | C y p r u s ’ N E C P 2 0 2 1 - 2 0 3 0
Part 1
General framework
SECTION A: NATIONAL PLAN

12 | C y p r u s ’ N E C P 2 0 2 1 - 2 0 3 0
1. Overview and process for establishing the plan
1.1. Executive Summary
This document is the Draft Integrated National Energy and Climate Plan (DINECP) for the
period 2021-2030 submitted to the European Commission in accordance to the Governance
Regulation. It presents the current policy situation in the fields of climate and energy, in
addition to several policies that have been developed, are currently under development or
are considered for the future. The achievement of the national GHG reduction target
requires considerable effort and investments, especially in the field of transport.
1.2. Overview of current policy situation
A key challenge for Cyprus is its high dependency on fossil fuels for energy – the biggest
share within the EU in fact, which makes it crucial for the country to develop both its
hydrocarbon and renewable energy sources. Cyprus is reliant on fossil fuel imports for its
electricity needs, and spends over 8% of its GDP to cover the costs.
The island also saw the biggest increase in energy demand among the EU28, growing 41%
since 1990 from 1.6 million tonnes of oil equivalent (Mtoe) to 2.3 Mtoe in 2015. However,
Cyprus is determined to find a cleaner solution until it can exploit its own reserves.
The 13% Renewable Energy Sources (RES) goal for 2020 is set to be generated by wind farms,
photovoltaic (PV) systems, solar thermal plants and biomass and biogas utilisation plants.
Latest data show that RES accounted for 8.4% of electricity production in 2016. RES power
production rose 6% in 2016, compared to 2015, mainly on increased output generated by
private photovoltaic systems. Wind farms generated almost 55% of electricity from RES in
2016, while the private-owned photovoltaic systems generation rose by approximately 15%
from 2015 to 2016. This trend is increasing and it is expected that till 2020 the increase of PV
installations that will participate to the competitive electricity market will meet or even
exceed the target of 2020 which is 288ΜW for PV Plants.
In Cyprus, electricity from renewable sources is no more promoted through subsidy since
2013 where a net metering scheme and self-consumption has been put in place. In addition
two new schemes were recently announced for RES: (1) net-billing scheme for PVs and
Biomass (CHP) plants and (2) RES plants that will participate in the competitive electricity
market.
Access of electricity from renewable energy sources to the grid shall be granted according to
the principle of non-discrimination. With regard to the use of the grid renewable energy shall
be given priority. Grid development is a matter of central planning (Transmission Grid
Development Plan 2007-2016 by the Cypriot TSO). In addition, renewable heating and
cooling (RES H&C) is promoted by support schemes offering subsidies to households and
through obligatory measures to the new buildings.
However, the country’s national grid system has certain intrinsic and technical limitations
affecting RES penetration and reliability of the energy system – such as the lack of
interconnections to the trans-European electricity networks, a limitation to the amount of
intermittent renewable energy that can be connected to the electricity system due to the

13 | C y p r u s ’ N E C P 2 0 2 1 - 2 0 3 0
unforeseen production of RES systems (Wind and PVs), and a lack of centralised storage
framework.
To tackle these problems the country is exploring ways to introduce smart grids in the
national network and is on the look-out for projects that could facilitate energy storage. In
addition various forecasting tools have been exploited from Transmission and Distribution
System operator in order to limit the reserves needed due to unpredictability of RES
Technologies. Furthermore, the EuroAsia Interconnector, which is under study, could bring
more solutions in its wake.
The island is already one of the highest users per capita in the world of solar water heaters in
households, with over 90% of households equipped with solar water heaters and over 50% of
hotels using large systems of this kind. With almost year-round sunshine, Cyprus certainly
has plenty of energy to harness, but competitive energy storing capabilities are crucial in
order to fully tap into its solar potential and facilitate better RES penetration.
There continues to be much ground to cover in terms of renewable energy production, but
international interest in developing the sector in Cyprus has been on the rise. In this respect,
the production of renewable energy is expected to experience considerable growth in
coming years, and significant investment is required in order for Cyprus to achieve its targets
– opening the field for companies with expertise in renewables.
The Cyprus Energy Regulatory Authority (CERA) has worked towards the full opening up of
the energy market and granting consumers the right to choose their own supplier – with
expectations of a full liberalisation by in 2020-2021. CERA’s proposition is a ‘net pool’ model,
where the operations of the state power company, EAC, are unbundled and the production
and supply operations separated. EAC production would then enter into bilateral agreements
with suppliers for the sale of energy at regulated prices. However, these plans have
experienced some resistance from unions, as they are seen as moves which could put
pressure to privatise the state power company.
«In respect to the supply of natural gas to Cyprus, the Council of Ministers, at its meeting in
June 2016, decided to approve the import of Liquefied Natural Gas (LNG) to Cyprus in a
manner leading to the commencement of natural gas supply preferably by the end of the
year 2020. On the basis of the results of various studies that were made, the Council of
Ministers, at its meeting on May 18th 2017, DEFA issued an invitation for tenders regarding
the long-term supply of LNG to Cyprus to satisfy electricity requirements and an invitation for
tenders for the construction and operation of the necessary infrastructure. The anticipated
time plan for the implementation of the tenders is expected to be finalized in 2019.
The electrical interconnection with Israel and Greece will be the next major challenge in the
country energy sector. Cyprus is promoting the «EuroAsia Interconnector» project as aiming
at commissioning in 2022-2023. The project will effectively contribute to the security of
energy supply and reduction in CO2 emissions by allowing the countries in the region
renewable energy sources for electricity generation.
Energy use is the largest source of GHG emissions. The following sections provide a high-level
overview of the most relevant factors. Climate policy drivers have had some impact on
changes in the national energy system to-date (for-example leading to improvements in
energy efficiency or increases in the share of renewables), although to a large extent these
have been driven by other factors. Historic trends in GHG emissions from energy-related

14 | C y p r u s ’ N E C P 2 0 2 1 - 2 0 3 0
activities are shown in later sections. However, the impacts of future climate policy in the
energy sector are likely to be far more significant, particularly as a result of the new EU
Climate and Energy package. These will lead to more sizeable shifts in energy use towards
renewables as well as an overall impact on primary and final energy consumption due to
improvements in energy efficiency; these effects should become more noticeable within
these indicators in coming years.
Total primary energy consumption in Cyprus rose over the period from 1990 despite
continued efforts to improve energy efficiency. Trends in the consumption of different
energy types within the total have changed significantly since 1990. Since 1990 there has
been a decrease of nearly 38% in the consumption of carbon intensive coal used in cement
industry.
Renewables have the most marked increase with consumption increasing by 213% from 1990
levels.
Fossil fuels continue to dominate total energy consumption and the share of renewable
energy sources remains small despite the increase in use. The overall increase in total
primary energy consumption has also acted to counteract some of the environmental
benefits from fuel switching.
The final energy needs of the economy of Cyprus for 2015 represent 73% of the country’s
primary energy consumption. There are very significant energy losses linked to the
transformation and distribution of useful energy (e.g. as electricity) to the end users. Energy
losses broadly depend on the average efficiency of conventional thermal power stations and
CHP plants and the penetration of non-thermal renewables.
Energy Supply
All the oil consumed is from imports and the trend, although cyclical since 1990, has been
upwards of 35% in 2015 since 1990. In the case of solid fuels, overall consumption has
increased by 85% between 1990 and 2004, due to the thrive of the constructing industry.
From 2004 until 2008 the consumption of solid fuel was stable, while after 2008, it decreases
substantially to reach 1990s levels.
Although the absolute amount of electricity production from renewables has increased by
more than 310 times since 2006 (Figure 1.3), renewable electricity still makes only 8.6%
contribution to total generation. Overall, the generation mix of electricity in Cyprus has
become less carbon intensive since 2008, when the first combined cycle unit for the
production of electricity entered in operation and the contribution of renewable sources
started to be significant. The increase in total electricity production was 225% from 1990 to
2015.
The share of primary energy met by renewables has increased steadily over time to around
6.07% of total primary energy consumption in 2016. The bulk of renewable energy
consumed, about 68 %, comes from solar thermal and biomass. Wind is the next biggest
contributor, providing 13% of total renewable energy). Biofuels has seen the biggest increase
- from zero 0 in 1990 to contributing around 6% of total renewable energy in 2016.

15 | C y p r u s ’ N E C P 2 0 2 1 - 2 0 3 0
Figure 1.2. Existing Renewable Energy Share between technologies as of the end of 2016
Based on 2016 figures Cyprus, as all EU countries, has a significant challenge ahead to reach
the new Renewable Energy Sources (RES) targets for 2020. The RES targets include all sources
of electricity, heat and transport fuel. Cyprus’ target is 13% of the final energy consumption
to be from renewable sources by 2020.
Figure 1.3. Share of renewable energy in total primary energy consumption in per cent, 1990-2016
Figure 1.4. Final energy consumption by sector in ktoe, 1990-2016
Energy consumption in different sectors
Solar thermal 46,76%
Biofuels 5,99%
Biomass 21,33%
Electricity from PV 8,61%
Electricity from biomass
3,03 %
Electricity from wind
13,22 %
Geothermal 1,05%
0.0
1.0
2.0
3.0
4.0
5.0
6.0
7.0
19
90
19
92
19
94
19
96
19
98
20
00
20
02
20
04
20
06
20
08
20
10
20
12
20
14
20
16
Co
ntr
ibu
tio
n o
f re
new
able
en
ergy
in t
ota
l pri
mar
en
ergy
co
nsu
mp
tio
n (
%)
0
500
1000
1500
2000
19
90
19
92
19
94
19
96
19
98
20
00
20
02
20
04
20
06
20
08
20
10
20
12
20
14
20
16
Fin
al e
ner
gy c
on
sum
pti
on
(k
toe)
Year
Services
Agriculture
Residential
Transport
Industry

16 | C y p r u s ’ N E C P 2 0 2 1 - 2 0 3 0
Final energy consumption in Cyprus increased by about 38% between 1990 and 2015. The
electricity sector has seen the biggest increase in overall energy consumption, increasing its
consumption by over 174% since 1990. The final consumption of electricity produced from
conventional fuels increased by 152% between 1990 and 2016. This is having a significant
impact on GHG emissions. The Services sector has also increased its energy consumption
markedly, by 358% since 1990, which correlates with an increasing share of GVA coming from
this sector. Households are also one of the largest consumers of final energy in the EU. Space
heating and cooling are the most significant components of household energy demand, and
can vary substantially from year to year depending on climatic conditions. In very recent
years, household energy consumption has declined partly as a result of higher fuel prices.
Final energy consumption in industry has fallen since 1990, largely as a result of a shift
towards less energy-intensive manufacturing industries, as well as the continuing transition
to a more service oriented economy.
Liberalisation of energy markets
As far as the electricity domestic market is concerned the new regulatory regime has been
established since 2004 by liberalising 35% of the market. The proportion of the liberalised
market increased from 35% to 65% from 1/1/2009, so eligible customers (those who can
choose their supplier) are all non-domestic customers. From 1/1/2014, the electricity market
in Cyprus was fully liberalized and eligible customers are all the customers. The main
objective of the liberalization process is to provide competitive prices and improved services
to all electricity customers. With respect to the further structuring of energy markets, one
major change is the EU’s Third Energy Package. Cyprus has achieved compliance on
transposition of the 3rd Energy Package.
Energy prices
The graph below shows how the average end-user prices of electricity have varied since 1990
for industry, households and agriculture in Cyprus. In addition, it illustrates how disposable
income has varied over this period, as this provides a very broad indication of how
expenditure on energy varies as a share of income. Recently EAC, after the approval of CERA,
have revised the tariff methodology with the main target to make those cost-reflective.

17 | C y p r u s ’ N E C P 2 0 2 1 - 2 0 3 0
Figure 1.5. Change in average end-user energy prices in Cyprus compared to the gross disposable income for households, industry and agriculture, 1990-2014
1.2.1. National and EU energy system and policy context of the national plan
1.2.2. Current energy and climate policies and measures relating to the five
dimensions of the Energy Union
1.2.3. Key issues of cross-border relevance
1.2.4. Administrative structure of implementing national energy and climate
policies
The institution responsible for energy issues in Cyprus is the Ministry of Energy, Commerce
and Industry, while climate change is the responsibility of the Ministry of Agriculture, Rural
Development and Environment and in particular the Department of Environment. The
Department of Environment has a team of seven officers allocated to climate issues, working
both on adaptation and mitigation issues. The Ministry of Energy, Commerce and Industry is
also responsible authority for the preparation of the National Energy and Climate Plan, with
almost all the personnel within the Department of Energy contributing to the above effort.
For the purposes of implementing the Regulation on the Governance of the Energy Union
and Climate Action [(EU) 2018/1999]1 and in particular to set out the necessary foundation
for a reliable, inclusive, cost-efficient, transparent and predictable Governance that ensures
the achievement of the 2030 and long-term objectives and targets of the Energy Union in line
with the 2015 Paris Agreement on climate change following the 21st Conference of the
Parties to the United Nations Framework Convention on Climate Change (the “Paris
1 Regulation (EU) 2018/1999 of the European Parliament and of the Council of 11 December 2018 on
the Governance of the Energy Union and Climate Action, amending Regulations (EC) No 663/2009 and (EC) No 715/2009 of the European Parliament and of the Council, Directives 94/22/EC, 98/70/EC, 2009/31/EC, 2009/73/EC, 2010/31/EU, 2012/27/EU and 2013/30/EU of the European Parliament and of the Council, Council Directives 2009/119/EC and (EU) 2015/652 and repealing Regulation (EU) No 525/2013 of the European Parliament and of the Council

18 | C y p r u s ’ N E C P 2 0 2 1 - 2 0 3 0
Agreement”), through complementary, coherent, and ambitious efforts by the Union and its
Member States, while limiting administrative complexity, a new structure for climate and
energy governance has been approved by the Council of Ministers (15/11/2017 decision no.
83.709).
The core of this new structure (see Figure 1.1), the “National Governance System for Climate
and Energy” is a Ministerial Committee, consisting of the Minister of Agriculture, Rural
Development and Environment, the Minister of Energy, Commerce and Industry, the
Minister of Finance and the Minister of Transport, Communications and Works. The
Ministerial Committee is co-chaired by the Minister of Agriculture, Rural Development and
Environment and the Minister of Energy, Commerce and Industry. This committee has to
propose the National Energy and Climate Plan (NECP) to the Council of Ministers which takes
the final decision. The proposal of the NECP is prepared by the Technical Committee, which
consists of the Permanent Secretaries of the same Ministries. The Technical Committee also
monitors the implementation of the NECP and makes proposals for its revisions when
necessary. The Technical Committee is co-chaired by the Permanent Secretary of the
Ministry of Agriculture, Rural Development and Environment and the Permanent Secretary of
the Ministry of Energy, Commerce and Industry. The Technical Committee is consulted by the
following seven Expert Working Groups: Decarbonisation, Energy Efficiency, Energy Security,
Internal Energy Market, Research, Innovation and Competitiveness, Renewable Energy and
Transport. Transport is an additional working group created due to the significant
contribution of the sector to the national emissions. Each Working Group has a coordinator.
All working groups with the exception of decarbonisation are the responsibility of the
Ministry of Energy, Commerce and Industry; decarbonisation is the responsibility of the
Department of Environment (Ministry of Agriculture, Rural Development and Environment).
The secretariat of the National Governance System for Climate and Energy is held by the
Department of Environment.

19 | C y p r u s ’ N E C P 2 0 2 1 - 2 0 3 0
Figure 1.1. Structure of the national governance system for Climate and Energy
Council of Ministers
(Decision on NECP)
Ministerial Committee
(Preparation of Proposal to the Council of Ministers on NECP)
- Minister of Agriculture, Rural Development and Environment (co-chair)
- Minister of Energy, Commerce, Industry and Tourism (co-chair)
- Minister of Finance
- Minister of Transport, Communications and Works
- Other (after invitation by the co-chairs)
Ministerial Committee
(Preparation of a Draft Proposal of NECP to the Council of Ministers - Implementation and monitoring - Suggestions for its revision)
- Permanent Secretary of the Ministry of Agriculture, Rural Development and Environment (co-chair)
- Permanent Secretary of the Ministry of Energy, Commerce, Industry and Tourism (co-chair)
- Permanent Secretary of the Ministry of Finance
- Permanent Secretary of the Ministry of Transport, Communications and Works
- Other (after invitation by the co-chairs)
Working Group 1:
Decarbonisation
- Coordinator
- Members
Working Group 2:
Energy Efficiency
- Coordinator
- Members
Working Group 3:
Energy Security
- Coordinator
- Members
Working Group 4:
Internal Energy Market
- Coordinator
- Members
Working Group 5:
Research, Innovation and Competitiveness
- Coordinator
- Members
Working Group 6: Renewable Energy
- Coordinator
- Members
Additional Working Groups
(if judged necessary by the coodinators)
House of Parliaments Information
European Commission
Secretariat of the National
Governance System:
Department of Environment

20 | C y p r u s ’ N E C P 2 0 2 1 - 2 0 3 0
1.3. Consultations and involvement of national and EU entities and
their outcome
i. Involvement of the Parliament
The House of Parliament was presented with the new national obligations related to climate
and energy and the means to achieve them in a special meeting held in June. The final NECP
will be presented to the Parliament once this is submitted to the European Commission. The
parliament will also be involved in the preparation of the NECP during the face of the public
consultation.
ii. Involvement of local and regional authorities
The local authorities have been and will be involved in the preparation of the NECP during
the face of the public consultation. Most of the working groups have presented the
information to the public where local authorities had the opportunity to discuss the various
polices and measures.
iii. Consultations with stakeholders, including social partners, and
engagement of civil society and the general public
All the relevant stakeholders, including social partners and professional organisations have
been included to the preparation of the NECP from the beginning of the process. The general
public will be involved once the final draft is ready for the final submission to the European
Commission through public presentations, hearings and discussions.
iv. Consultations with other Member States
v. Iterative process with the European Commission
1.4. Regional cooperation in preparing the plan
i. Elements subject to joint or coordinated planning with other Member
States
ii. Explanation of how regional cooperation is considered in the plan

21 | C y p r u s ’ N E C P 2 0 2 1 - 2 0 3 0
2. National objectives and targets
2.1. Dimension Decarbonisation
2.1.1. GHG emissions and removals
i. The elements set out in Article 4(a)(1)
i. the Member State's binding national target for greenhouse gas emissions and the
annual binding national limits pursuant to Regulation ESR;
The EU submitted an Intended Nationally Determined Contributions (INDC) for the Paris
Agreement in 2014 to reduce GHG emissions by 40 % compared with 1990 levels by 2030.
Because this INDC under the Paris Agreement was only submitted by the EU and its 28
Member States together (EU-28) and not by each Member State, there are no specified
INDCs under the Paris Agreement for individual Member States. For this reason, Cyprus, as
part of the EU-28, takes on a quantified economy-wide emission reduction target jointly with
all other Member States.
With the 2030 climate and energy framework, the EU is on its way to set internal rules which
will underpin the implementation of the NDC in accordance with the Paris Agreement. The
2030 climate and energy framework introduced a clear approach to achieving the 40 %
reduction of total GHG emissions from 1990 levels, which is equivalent to a 36 % reduction
compared with 2005 levels. This 36 % reduction objective is divided between two sub-
targets, where 43 % of the reduction effort is assigned to the Emission Trading System (ETS)
and 30% to non-ETS sectors, (Effort Sharing Regulation, No. 2018/842).
In the ESR, national emission reduction targets for 2030 for each Member State will be
between 0% and -40% compared to 2005. Cyprus’ binding national target for GHG according
to Regulation 2018/842 is to limit GHG at least by 24% in relation to its greenhouse gas
emissions in 2005. The modalities and procedures for monitoring and review under ESR will
be harmonised for all EU member States by the Governance [ ] Regulation.
According to Article 4, paragraph 3 of the ESR, the annual emission allocations for the years
from 2021 to 2030 in terms of tonnes of CO2 shall be adopted by the Commission through
implementing acts using the national inventory data for the years 2005 and 2016 to 2018
submitted by Member States pursuant to Article 7 of Regulation 525/20132.
2 Regulation (EU) No 525/2013 of the European Parliament and of the Council of 21 May 2013 on a
mechanism for monitoring and reporting greenhouse gas emissions and for reporting other information at national and Union level relevant to climate change and repealing Decision No 280/2004/EC

22 | C y p r u s ’ N E C P 2 0 2 1 - 2 0 3 0
ii. the Member State's commitments pursuant to Regulation LULUCF;
To ensure the contribution of the LULUCF sector to the achievement of the Union’s emission
reduction target of at least 40 % and to the long-term goal of the Paris Agreement, a robust
accounting system is needed to be applied by Member States.
For the periods from 2021 to 2025 and from 2026 to 2030, taking into account the
flexibilities provided for in Articles 12 and 13 of the LULUCF Regulation, each Member State
shall ensure that emissions do not exceed removals, calculated as the sum of total emissions
and total removals on its territory in all of the land accounting categories referred to in
Article 2.
Member States should ensure that sinks and reservoirs, including forests, are conserved and
enhanced, as appropriate, with a view to achieving the purpose of the Paris Agreement and
meeting the ambitious greenhouse gas emissions reduction targets of the Union by 2050.
Each Member State shall account for emissions and removals resulting from managed forest
land, calculated as emissions and removals in the periods from 2021 to 2025 and from 2026
to 2030 minus the value obtained by multiplying by five the forest reference level of the
Member State concerned.
Where the result of the calculation is negative in relation to a Member State’s forest
reference level, the Member State concerned shall include in its managed forest land
accounts total net removals of no more than the equivalent of 3,5 % of the emissions of that
Member State in its base year or period as specified in Annex III, multiplied by five. Net
removals resulting from the carbon pools of dead wood and harvested wood products,
except the category of paper in the land accounting category of managed forest land shall
not be subject to this limitation.
Member States shall submit to the Commission their national forestry accounting plans,
including a proposed forest reference level, by 31 December 2018 for the period from 2021
to 2025 and by 30 June 2023 for the period from 2026 to 2030.
The forest reference level shall be based on the continuation of sustainable forest
management practice, as documented in the period from 2000 to 2009 with regard to
dynamic age-related forest characteristics in national forests, using the best available data.
Maximum amount of compensation available under the managed forest land flexibility
referred to in point (B) of article 13(3) for Cyprus:
a. 0.15 for reported average removals by sinks from forest land for the period from
2000 to 2009 in million tonnes of CO 2 equivalent per year
b. 0.03 in regards to the compensation limit expressed in million tonnes of CO2
equivalent for the period from 2021 to 2030
iv. where applicable to meet the objectives and targets of the Energy Union and the
long term union greenhouse gas emissions commitments consistent with Paris
Agreement, other objectives and targets, including sector targets and adaptation
goals;

23 | C y p r u s ’ N E C P 2 0 2 1 - 2 0 3 0
ii. If applicable, other national objectives and targets consistent with the
Paris Agreement and the existing long-term strategies.
There are no other national objectives and targets consistent with the Paris Agreement and
long-term strategies in place related to climate change mitigations.
The National Adaptation Strategy and Action Plan have been in formally adopted by Cyprus’
Government in 2017 (Council of Ministers Decision no. 82.555 of 18/5/2017). A revision of
the strategy and action plan has been adopted on 5/12/2018 by the Council of Ministers. The
responsible authority for the development and implementation of the National Adaptation
Strategy and its Action Plan is the Department of Environment of the Ministry of Agriculture,
Rural Development and Environment. The responsibility for the implementation of specific
sectoral actions lies with the responsible authorities for each specific action (e.g. Department
of Agriculture for agricultural issues). Meetings with all the stakeholders are taking place at a
regular basis to assess the status of implementation of the activities included in the Action
Plan.
2.1.2. Renewable energy
The CY authorities are currently faced with major challenges in the Cypriot energy sector. The
well-functioning system of the past 40 years has outlived its performance and it is for several
reasons, mainly based on climate change policy and EU legislation, that a major shift is
necessary. The isolated location of the network and the potential domestic natural gas
resources found and expected to be found off-shore are major elements to take into
consideration while reforming the energy policy. In addition, the long investment cycle and
the often significant size of investments needed in the energy sector impact considerably the
way of (political) decision making.
Under the general quest to reduce climate change and hence the establishment of a
decarbonised economy several topics must be challenged in a symbiotic way:
1) The need to provide a safe, reliable, high-quality and effective servicing of energy needs
to the citizen on a day-to-day basis
2) The aspect of security of supply in the sense of availability of resources in potentially
challenging times in a generally unstable political region (external dependence versus
autonomy versus potential export revenues)
3) International commitments: UN Climate Change commitments as well as EU legislation
4) General economic growth aspects including sustainability, social welfare, environmental
protection
More precisely the energy sector is currently described as such:
Dominated by one vertically integrated publicly owned utility company which operates
very few, quite large power plants based on oil derivate in a relatively inflexible way
The final customer has up to date no choice of supplier, all supply is under regulated
tariff, reformation though, is in progress,
RES penetration is limited due to (1) unclear grid capabilities to accept volatile
generating units (2) public awareness, (3) forecasting tools that needed to be improved
Isolated in energy infrastructure terms

24 | C y p r u s ’ N E C P 2 0 2 1 - 2 0 3 0
Recent discoveries of some natural gas in exclusive economic zone of the Republic of
Cyprus, with a potential to increase and the perspective to establish CY as a "gas hub"
for export
The ending of emission related derogations of EU law until 2020
CY has a very high potential on future integration of decentralised RES generation which
might shift the focus of the remaining thermo-electrical generation to provide flexibility
rather than base load which is strengthened by the need to reduce the emissions
massively in this sector by 2040/50.
The current stakeholders are, besides the governmental representatives:
1. EAC: (Electricity Authority of Cyprus), vertically integrated utility with tasks attributed to
it by constitutional law
2. DEFA: (Natural Gas Public Company) publicly owned company of private law, who is
tasked to evaluate a gas solution to bring gas into CY the earliest possible, (via a
monopolistic import contracts for building of relevant infrastructure & introducing
through a contract with take or pay terms)
3. CERA: Cyprus Energy Regulator Authority deriving from EU legislative compliance needs
4. CHC: (Cyprus Hydrocarbons Company Ltd)public company tasked to market off-shore
assets for the government,
5. TSOCy: Transmission system Operator of Cyprus, publicly owned company tasked to
operate the EAC transmission system using EAC assets including EAC staff.
6. IPP: Independent Power Producers, holding regulatory licenses to build independent
power plants
7. RES producers: currently all major plants active under feed-in tariff, minor plants under
net metering and net billing. A huge potential recently showed up after opening the new
support scheme for participating within the competitive electricity market.
i. The elements set out in Article 4(a)(2)
The contribution of Cyprus to the Union’s binding target of at least 32% is very challenging
and is relying on various different parameters and assumptions.
Based on the bi-annual report that it is submitted to the EU the following existing status of
Renewable Energy Sources exists in Cyprus energy mix as of 2016.
As of the end of 2016, the following RES contribution the Sectors was recorded:
Table 2.1. Existing Status of RES in Final Energy Consumption
2015 2016
RES in Heating and Cooling 23.60% 23.72%
RES in Final Electricity Consumption 8.48% 8.64%
RES in Transport 2.45% 2.65%
Total RES in final Energy Consumption 9.27%
Indicative Target for RES 7.45%

25 | C y p r u s ’ N E C P 2 0 2 1 - 2 0 3 0
Figure 2.1. Existing Renewable Energy Share between technologies as of the end of 2016
The reference scenario of this report assumed that natural gas will become available for use
in the electricity supply sector by the end of 2020 via an LNG regasification facility. This
means that the supplied gas does not necessarily originate from the domestic gas reserves,
but could be from any potential supplier. Natural gas was allowed to gradually commence
supply of the transport sector by 2021-2022, assuming that a small transition period will be
required before the necessary infrastructure is set in place.
No electricity interconnector becomes established, while investments in new technologies
were allowed in all the sectors. A fixed 10% RES target in transport was defined for 2020,
while additional targets relating to the used of advanced biofuels and renewable electricity
were set for the period 2021-2030. The 13% renewable energy target in final energy
consumption for 2020 was developed as an overall target, meaning that the share of
renewable energy can originate either from electricity supply or the heating and cooling
sector. Emission targets were not set in this modelling exercise, since we have approached a
bottom-up methodology.
Energy Planning Scenarios
These first Energy Planning Scenarios were very well demonstrated in very early efforts done
with the support of IRENA in 2014-2015 where various energy pathways were examined for
the Electricity Sector.
Solar thermal 46,76%
Biofuels 5,99%
Biomass 21,33%
Electricity from PV 8,61%
Electricity from biomass
3,03 %
Electricity from wind
13,22 %
Geothermal 1,05%

26 | C y p r u s ’ N E C P 2 0 2 1 - 2 0 3 0
Figure 2.2. Various Energy Pathways examined up to 2030 for Electricity Sector in IRENA Roadmap
Study, Nicosia 2015
In the IRENA roadmap report3, it was demonstrated that some policy decisions (that are
depending on various externalities), can affect the penetration on Renewable Energy Sector
in the various scenarios. The Renewable Energy Roadmap for the Republic of Cyprus is based
on three complementary Sections.
Since the development of the IRENA Roadmap, there was recommendation to proceed with
additional studies. In that respect, Cyprus (with the support of SRSS), has develop a specific
open source, linear optimization model (called OSeMOSYS) in order to plan the RES
contribution in all the sectors (Electricity, Heating and Cooling and Transport).The
development of the modelling exercise is shown in the graph below:
Figure 2.3. Energy Planning methodology and steps that were followed
3 https://www.irena.org/publications/2015/Jan/Renewable-Energy-Roadmap-for-the-Republic-of-Cyprus
Energy Mix Roadmap
2030
Grid Study
Transport Study
Energy Efficiency +
H&C
Targets
& Constraints

27 | C y p r u s ’ N E C P 2 0 2 1 - 2 0 3 0
OSeMOSYS4 is an open source modelling system for long-run integrated assessment and
energy planning and is widely used by various countries and modelers.
The importance of the interlinkages between these sectors relates to the many plausible
synergies that can exist between technologies in one sector and how it affects demand in
another sector. For instance, in a theoretically more technologically advanced system in 2030
and 2050, the transmission system operator will be able to temporarily shed load from less
important services, such as cooling of a shopping centre or desalination plants, so as to cope
with potential rapid drops in generation. Similarly, the batteries in electric vehicles can
facilitate the use of higher shares of variable renewables. They might be charged when there
is an increase in generation. This, enables the grid operator to use them as demand response
and a means of electric storage from which it can draw (together with selective load
shedding) in cases of generation shortage or to smoothen out fluctuations in electricity
demand. Even though the present effort can be considered as ambitious, it was in no way a
novelty in the field.
Renewable energy offers a way for Cyprus to reduce both the cost and the environmental
impact of generating electricity at least up to a certain limit. In the wake of the recent energy
transition, turning to renewables can help to reduce fuel imports, strengthen the trade
balance and create local jobs. Cyprus Government, taking advantage of the success of solar
water heaters, with various measures and support is trying to replicate solar photovoltaics
(PV) up to the level where no other sectors of energy union will be underestimated.
Cyprus has set out to attain a higher share of renewables, and this national energy and
climate plan helps to assess optimal investment strategies in both ETS and non-ETS Sectors.
Solar Technologies will play a major role in this roadmap and in parallel with major policy
decisions in European Level, can increase even further. The NECP (national Energy and
climate plants) findings will play an important role to revise existing energy policies and
develop new ones.
The energy planning model used to quantify the possible pace and benefits of renewable
energy deployment given different conditions has been presented already to various
stakeholders and various presentations have been developed for the past few years.
A list of reports is provided in Appendix I.
The above model is an important tool for assessing future energy policies and examining
different energy pathways. It is assisting in determining the optimal penetration of
renewable energy in all sectors such as electricity supply and in identifying the technical and
economic potential for further increasing electricity production from renewable energy.
Public Consultations, Presentations and presentation in various conferences:
Various presentations and public consultations were organized, to demonstrate the results
delivered from the various scenarios:
o Conference in Nicosia, 20155 where the IRENA Roadmap was presented to public, where
more than 100 stakeholders and individuals participated. The conference was organized
in coordination with IRENA and Cyprus Government.
4 http://www.osemosys.org/
5 http://www.irena.org/publications/2015/Jan/Renewable-Energy-Roadmap-for-the-Republic-of-
Cyprus
28 | C y p r u s ’ N E C P 2 0 2 1 - 2 0 3 0
o Various Conference and Workshops within the Ministry inviting various stakeholders and
other public authorities that took place in the period 2016-20186.
o Presentation in EU Reference Scenario NECP committee about the various options and
Scenarios
o Other International conference such as
- CPS4Climate7
- ETIP-SNET (23.11.2017)
o 6th
International conference on Renewable Energy Sources and Energy efficiency,
organized in Nicosia, where a special sessions was dedicated for Energy planning
pathways and Scenarios.8
Electricity Section Major Results
Assumptions:
The Electricity Generation Section is among the most challenging sections not only in Cyprus
but in EU as a whole due to the following Reasons:
1. Island remains isolated in the Business as usual Scenario (or Reference Scenario) and this
leads to various system constraints such as:
a. Variation from year to year in production of RES. i.e. the variation in production
from both Wind and Solar from year to year varies in Cyprus and this can influence
the energy mix for a specific year up to 20% (at high penetration levels of RES). Thus
capacity credits for RES play a major role in the final Energy mix.
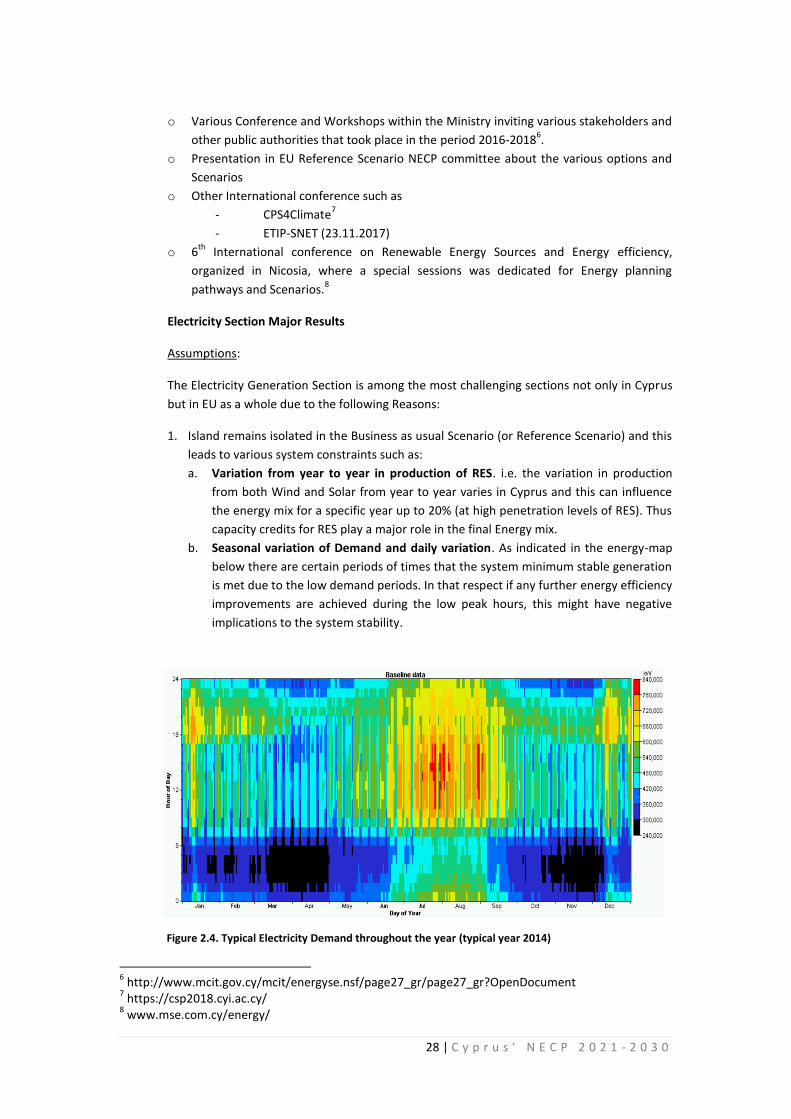
b. Seasonal variation of Demand and daily variation. As indicated in the energy-map
below there are certain periods of times that the system minimum stable generation
is met due to the low demand periods. In that respect if any further energy efficiency
improvements are achieved during the low peak hours, this might have negative
implications to the system stability.
Figure 2.4. Typical Electricity Demand throughout the year (typical year 2014)
6 http://www.mcit.gov.cy/mcit/energyse.nsf/page27_gr/page27_gr?OpenDocument
7 https://csp2018.cyi.ac.cy/
8 www.mse.com.cy/energy/

29 | C y p r u s ’ N E C P 2 0 2 1 - 2 0 3 0
c. Weather Forecast Scenarios. As seen from the graph below, there is a forecast for
the heating degrees days versus the cooling degree days. This forecast will affect
both Electricity Sector and Heating and cooling sector, since more electrification is
expected to be needed up to 2030. On the other hand, the high penetration of solar
water heaters limits the room for further development in the DHW sector since
almost the 92% of households and more than 55% of Commercial applications are
using already the above technology. As it was assumed in IDEES (EU-JRC Database)
the heating degree days (HDD) and Cooling Degree Days (CDD) are not in line with
the forecast below.
Figure 2.5. Nicosia’s heating and cooling days (Zachariades and Hadjinicolaou, 2014)
d. High Reserve Margins are required increasing the System cost up to a certain level of
RES penetration.
Figure 2.6. Impact of the Variable Renewable Energy Sources on System Overall Cost.
2. There are no Storage Plants to support the further penetration of RES targets. This leads
to various reserves margin requirements as analysed in the JRC Study for the Grid
Stability.
3. The existing baseload energy generation fleet has operating life up to 2031-2032. In that
respect no, major changes can be done in the flexibility of conventional generation
system, while most of the new units introduced to the system are inflexible Renewable
Energy Sources.

30 | C y p r u s ’ N E C P 2 0 2 1 - 2 0 3 0
4. Some old plants that are used for load flexibility and are going to be decommissioned in
the year 2024, while some De-NoX units are going to be installed in some of the existing
conventional plants.
Emission constraints should be defined taking into considerations the impact on RES
integration. In the JRC simulations, pre-defined environmental considerations (limits on
NOx, CO and SOx emissions) are adding constraints that significantly reduce the
operational flexibility of ICE and GT generators. However, higher operational flexibility
has the potential to reduce RES curtailment and reduce the fuel consumption, which
would consequently reduce emissions. In that respect, instead of defining emissions
targets for each of the conventional generators, it was suggested to define in the long
term planning of simulations only a global target for the whole generation fleet.
iii. Estimated trajectories for the sectorial share of renewable energy in final
energy consumption from 2021 to 2030 in the electricity, heating and
cooling, and transport sectors
Based on the Preliminary Results for the RES Final Energy Consumption, the following results
were obtained in the three sectors for the Scenario WEM.
Figure 2.7. Renewable Energy Sources in Final Energy Consumption in ktoe, Reference Scenario
From the above results, which will be analysed and further discussed in the sections that are
followed, it can be easily observed that an electrification of heating and cooling and
transport sector is observed during the end of the period, and the most rapid measures are
make economic sense to be implemented in the years 2029-2030. This is due to the increase
of CO2 price and Oil prices towards the end of the period. In addition, it is expected that the
evolution in technology and price reduction of batteries will contribute to this effect.
The introduction of natural gas and the stricter restrictions regarding emissions of
greenhouse gases and air pollutants that were introduced after the 2020, affected the
electricity generation, transportation, and heating and cooling sectors. Frequently, energy
planning decisions are made in a disaggregated manner. The transport sector was treated
0
50
100
150
200
2020 2021 2022 2023 2024 2025 2026 2027 2028 2029 2030
RES in Final Energy Consumption (ktoe)
Gross final consumption of RES for heating and cooling
Gross final consumption of electricity from RES
Gross final consumption of energy from RES in transport

31 | C y p r u s ’ N E C P 2 0 2 1 - 2 0 3 0
separate for the purposes of this report. However, based in JRC study9 it was obvious that in
case of an increased electric vehicle fleet (and plug-in hybrid) there were some important
outcomes.
By introducing both the EVs and PV integrated into the Medium Voltage reference grid, the
voltage levels are improved in comparison to the base case simulated when no PV are
included. The results showed that the lines are not significantly affected when the surplus
energy consumed by EVs charging is covered by the local PV system production. Also, the
results showed better performance in terms of voltage levels compared to the other voltage
regulatory methods. This voltage regulatory scheme can therefore contribute in the
improvement of the voltage levels at both low and medium voltage side.
Finally, the results showed that the introduction of PV offered positive results capable of
counterbalancing the effect of large scale EV integration.
Similarly, once domestic gas reserves become operational, demand for natural gas may not
be confined to conventional power generation. Compressed natural gas may become a viable
alternative in the transport sector. Also, even though outside the scope of this study, use of
natural gas in industry, residential heating purposes or gasification of the transport sector
are potential alternatives.
This was also highlighted in Ifeu Study for Transport10
, where the introduction of Natural Gas
in transport will lead to very interesting results. However, in the Scenario WEM this aspect
was not introduced, but it seems that once the GAS will be available for Cyprus, the
Gasification of Heavy Trucks and busses (or even bunkering), will lead to increased
decarbonization levels.
Figure 2.8. RES in final energy demand per Sector - With Existing Measures until 2030
In order to extract the above results, it should be noted that wherever data were not
available from local sources, assumptions were based on literature, PRIMES or POTEnCIA-
9http://www.mcit.gov.cy/mcit/energyse.nsf/C1028A7B5996CA7DC22580E2002621E3/$file/Cyprus_RESGRID_summary_v16.pd
f 10
http://www.mcit.gov.cy/mcit/energyse.nsf/C1028A7B5996CA7DC22580E2002621E3/$file/ifeu%20Transport%20Study.pdf
13% 15%
19%
15%
19%
26%
22% 24%
29%
3% 5%
7%
0%
5%
10%
15%
20%
25%
30%
35%
2021 2025 2030
All sectors Electricity Heating and cooling Transport (post-2020)

32 | C y p r u s ’ N E C P 2 0 2 1 - 2 0 3 0
IDEES database. It is expected that the above data will be revised in 2019 with more precise
and accurate data.
At the same time, input was drawn from other parallel studies conducted for MECIT by SRSS
(see Appendix II).
Due to the vast amount of data used in this study, the following subsections present the key
input and assumptions used to develop the model, while all of the data will be made
available separately as supplementary material to this report.
The importance of the interlinkages between these sectors relates to the many plausible
synergies that can exist between technologies in one sector and how it affects demand in
another sector. For instance, in a theoretically more technologically advanced system in
2030, the transmission system operator will be able to temporarily shed load from less
important services, such as cooling of a shopping centre or desalination plants, so as to cope
with potential rapid drops in generation. Similarly, the batteries in electric vehicles (with PV),
can facilitate the use of higher shares of variable renewables. They might be charged when
there is an increase in generation. This, enables the grid operator to use them as demand
response and a means of electric storage from which it can draw (together with selective
load shedding) in cases of generation shortage or to smoothen out fluctuations in electricity
demand.
Electricity Sector
The scenario with existing measures is dominated by natural gas-fired generation, once this
fuel becomes available (Figure 2.9). The renewable energy share in generation is limited
between 15% and 25% for the period 2021-2030. However, as gas prices and CO2 costs
increase and investment costs of renewable energy technologies decrease along the model
horizon, the share of renewable energy in generation increases in a non-linear way towards
the years of 2029-2030. As was illustrated in the corresponding IRENA and KTH work, solar
PV is the most competitive of the renewable energy technologies and, as such, this is
responsible for the increase in renewable energy. Solar PV capacity increases to a total of
614 MW by 2030 comparing with 2020 target which is 288MW. However, it should be noted
that since a policy decision is in place and all the RES technologies have to participate in the
competitive Electricity Market, the share indicated is just indicative. It should be also noted
that there is no Capacity Regulation in place in Cyprus yet and since some RES technologies
are already more competitive than Renewable Energy Sources (without taking into account
the various ancillary services), it is expected that the final energy mix it should be different.

33 | C y p r u s ’ N E C P 2 0 2 1 - 2 0 3 0
Figure 2.9. Total Electricity Generation with all available Technologies contribution
Remarks:
a. In the previous runs of the modelling system where different storage technology was
examined (i.e. Pumped Storage entering at earlier stage) indicated slightly different
penetration of Renewables.
b. As far as it concerns the existing Policy and Measures it is uncertain of how long the
net-metering scheme will last since there is an intention to switch from net-metering to
asymmetric net-billing (as it was recommended from IRENA study). This will decrease
the penetration rate of the RES in the Electricity Sector, but it is envisaged that due to
the new regulatory framework in building sector (Nearly Zero Buildings) the effect will
not be significant.
c. The delay of liberation of the competitive Market and the monopolistic electricity
Market affects the penetration of RES in electricity sector, since a capacity regulation in
not in place yet.
In developing the Electricity long term scenarios, a lot of simulations took place,
reconstructing and simulating the whole Energy System of Cyprus. The methodology
approach that was followed is described in JRC Study “for the further Integration of RES into
the System”.
-
1,000
2,000
3,000
4,000
5,000
6,000
7,000
20
21
20
22
20
23
20
24
20
25
20
26
20
27
20
28
20
29
20
30
Ge
ne
rati
on
(G
Wh
)
Gas HFO Diesel Solar PV
Solar Thermal Wind Biomass Demand

34 | C y p r u s ’ N E C P 2 0 2 1 - 2 0 3 0
Figure 2.10. JRC Methodology Approach for RES integration study
The executive summary of the Results is reported and is public available 11
. This report was
essential in order to identify various aspects of the pillars of the governance of the energy
union, such us the security of supply, demand response measures, system stability and the
possibility of better use of the desalination plants and irrigation of water. In additions
insights to other sectors such as Vehicle to Grid and storage technologies were analyzed.
The study is divided into four activities:
Activity 1 studies mainly the collection of required data needed to perform the other
activities. The main deliverable was a database with key parameters concerning distribution,
transmission and generation of power.
Activity 2, the current TSOC dynamic system model was updated to define the reference
system. Models for future components were developed and added to allow the simulation
and analysis of the power system in 2020 and 2030 for different scenarios
Activity 3 dealt with the realization of reference distribution grid models and then the
simulation of the impacts due to the large integration of PV, electric vehicles and demand
response. It should be noticed that Distributed Storage was not investigated and it was set to
be studied further in other studies.
Activity 4 dealt with the detailed modelling of unit commitment and economic dispatch of
the generation fleet, which dispatch results were used as input for the transmission model
(activity 2).
11
http://www.mcit.gov.cy/mcit/EnergySe.nsf/C1028A7B5996CA7DC22580E2002621E3/$file/Cyprus_RESGRID_summary_v16.p
df
Long term scenarios
simulation by KTH
Simulation of day-ahead
market by JRC
Selection of representative snapshots by
JRC
Transmission system
security check under N-1
events by JRC
Stakeholder workshop
Fine tuning of long term
parameters

35 | C y p r u s ’ N E C P 2 0 2 1 - 2 0 3 0
The three different Scenarios were selected in order to evaluate, among other aspects the
below:
1. The impact of high RES in order to identify the bottlenecks of the system, and
improvements needed to be done.
2. The effect of Energy Efficiency and how this can impact the stability and security of the
Grid
3. Analyze and examine the existing system parameters and improve the daily operation of
the system
4. Analyze the effect of oil prices in the daily operation of the system
Scenario A1 (Assumption: High oil and gas prices) combines baseline energy efficiency
demand with high gas and oil prices. Very high levels of RES are expected to be integrated in
the system. With high levels of intermittent renewables, several storage technologies
become also cost effective. A new CCGT (216MW, same characteristics as existing units)
became available from 2024. Gas is becoming available for power generation in 2020.
Scenario was examined in order to test the stamina and stability of the system and the Grid.
Figure 2.11. Scenario A1, with 55% RES penetration, 17% Curtailment, Pumped Storage (non-Realistic)
Scenario A2 (Lower oil or gas prices) combines baseline energy efficiency demand with low
gas and oil prices. In this scenario, the renewable energy technologies are getting
competitive up to a certain level due to price and investments needed for storage
technologies. Once the cost of Energy Storage systems is reduced towards the latest years of
the planning horizon more RES were introduced. A new CCGT unit becomes available from
2024 (due to decommission of other old gas units).
Scenario A3 (Energy saving) combines extra energy efficiency demand with BAU gas and oil
prices. With a lower demand level, there is no need to build any additional conventional
units, but more investments are needed in storage technologies, in order to maintain the
system stability.

36 | C y p r u s ’ N E C P 2 0 2 1 - 2 0 3 0
Figure 2.12. Energy Efficiency Scenario with Additional Measures (WAM) and RES scenario with
existing measures.
This scenario was the closest to the existing Scenario finally adopted as the scenario with
Existing Measures.
Table 2.2. Scenarios parameters
Scenario Unit Base A1 A2 A3
Year 2014 2020 2030 2020 2030 2020 2030
Fuel cost NG EUR/GJ 13.8 21.7 1.1 1.5 6.9 10.8
Fuel cost HFO EUR/GJ 18 28.2 11.1 15.2 18 28.2
Fuel cost diesel EUR/GJ 19.6 29.8 12.8 16.8 19.6 29.8
Vasilikos Gen* MW 836 836 836 836 836 836 836
Dhekelia Gen MW 450 450 102 450 102 450 102
Moni Gen MW 128 128 128 128 128 128 128
New CCGT unit MW 216 216
Total conventional Gen MW 1414 1414 1282 1414 1282 1414 1066
Trans. Wind MW 144 173 173 173 173 173 173
Dist. Wind MW 2 2 2 2 2 2 2
Total Wind MW 147 175 175 175 175 175 175
Trans. PV MW 0 181 310 42 42 40 40
Dist. PV MW 61 151 1167 79 438 99 234
Total PV MW 61 332 1477 121 480 139 274
CSP Tower MW 0 50 50 50 50 0 50
CSP Dish MW 0 50 50 50 50 50 50
Total CSP MW 0 100 100 100 100 50 100
Dist. Biomass MW 10 30 27 30 30 30 30
Waste MW 0 9.5 9.5 9.5 9.5 9.5 9.5
Dist. Fossil MW 19 0 0 0 0 0 0
Storage Hydro 130MW-8h Units 0 0 1 0 1 0 1

37 | C y p r u s ’ N E C P 2 0 2 1 - 2 0 3 0
Storage Li-ion 1MW-2h Units 0 11 61 0 2 23 69
Storage CSP 50MW-0.3h Units 0 1 1 1 1 1 1
Demand Response 50MW Units 0 1
Demand GWh 3925 4641 5897 4641 5897 3851 4476
Total net generation GWh 4180 4862 6178 4862 6178 4034 4689
The above data were reconsidered later after changing some assumptions to the model due
to real data. It should be noted that in the Electricity Sector there is a very huge interest for
RES Plants to participate in the open market. In that respect, more than applications of
400MW installed capacity were received so it is expected that the trend will lead to more
Renewables to the transmission system rather than in the distribution system.
The revised capacity projections that were finally adopted to the draft NECP are listed below:
Table 2.3. Capacity projections in the electricity supply sector (MW).
2020 2025 2030
Vasilikos 868 868 868
Dhekelia 460 102 102
Moni 150 150 150
New CCGT 0 216 216
New ICE 0 0 0
New ST 0 0 0
New GT 0 0 0
Light fuel oil CHP 0 85 96
Solar PV 292 292 614
Solar Thermal 0 50 50
Wind 175 175 175
Biomass 12.4 25 29
Pumped Hydro 0 0 0
Li-Ion Batteries 0 0 72
All Li-ion batteries deployed are in-front-of-the-meter facilities and have 4 hours of storage;
this results in 288 MWh of battery storage in 2030. No behind-the-meter battery storage is
deployed as this is not deemed cost-optimum under the current assumptions followed.
Furthermore, at the latter part of the modelling period, after 2030, a 130 MW (1040 MWh)
pumped-hydro facility is also developed.
The aggressive deployment of batteries and solar PV can be attributed to the reduction in
capital cost assumed over time for both of these technologies. At the same time, increasing
fuel and ETS prices make fossil-fired plants less competitive. However, the feasibility of these
results has to be scrutinized thoroughly, as during low electricity demand and high PV output
periods, a significant amount of curtailment may be observed. This curtailment is not easily
captured by a long-term energy systems model, as employed here. Hence, a separate
detailed analysis focusing on a single year in a much finer temporal resolution may be
needed to assess this proposed outlook.
d. Heating and Cooling
Information for the heating and cooling has been obtained from a separate JRC study
focusing on this sector (JRC, 2016b). Demand forecasts for heating and cooling as well as

38 | C y p r u s ’ N E C P 2 0 2 1 - 2 0 3 0
techno-economic characteristics of technology options were provided from energy efficiency
sector.
Four levels of demand were examined based on various energy efficiency PaMs.
Based on following the breakdown of technologies to be evaluated; namely residential
cooling, residential heating, cooling in all other sectors, and heating in all other sectors. The
seasonal variation in demand for heating and cooling was estimated based on historical
measurements of heating and cooling degree days.
An estimate of the demand profile within each day had to be assumed for each of the
demands. In the case of cooling, this was based on the recorded electricity demand profile of
each sector (Figure 2.13). However, analysis providing a more accurate demand profile may
be needed for future enhancements of the model.
Table 2.4. Share of RES in Heating Sector (Reference Scenario with Measures)
2021 2022 2023 2024 2025 2026 2027 2028 2029 2030
Res Share (%) 22.5 23.1 23.2 23.7 24.4 24.9 25.6 26.1 27.0 29.3
Res Share (%), without
Electricity
24.9 24.9 25 25.6 26.4 27.2 28 28.9 29.8 30.7
Figure 2.13. RES in Heating and Cooling Sector towards 2030 (PJ) (RES share in Electricity varies from 15%-26%)
0.000
5.000
10.000
15.000
20.000
25.000
30.000
35.000
2020 2021 2022 2023 2024 2025 2026 2027 2028 2029 2030
Electricity Heating oil/light fuel oil/Gas Oil Pet Coke LPG Biomass Solar
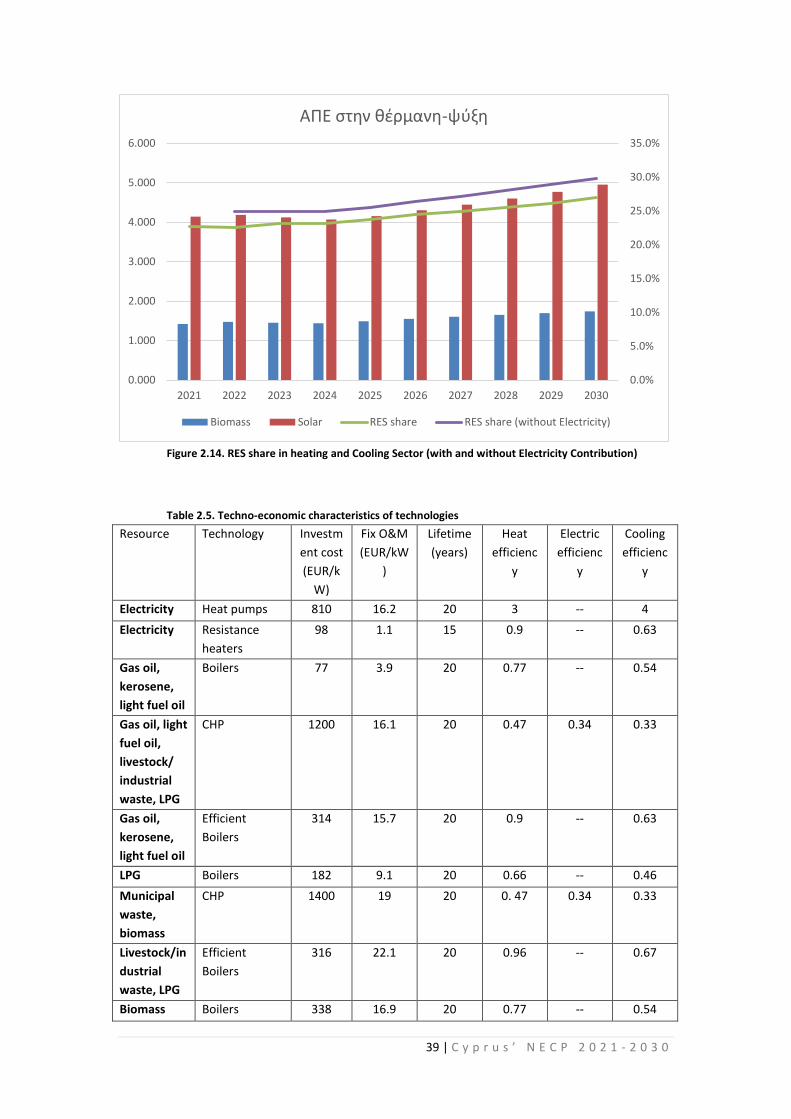
39 | C y p r u s ’ N E C P 2 0 2 1 - 2 0 3 0
Figure 2.14. RES share in heating and Cooling Sector (with and without Electricity Contribution)
Table 2.5. Techno-economic characteristics of technologies
Resource Technology Investm
ent cost
(EUR/k
W)
Fix O&M
(EUR/kW
)
Lifetime
(years)
Heat
efficienc
y
Electric
efficienc
y
Cooling
efficienc
y
Electricity Heat pumps 810 16.2 20 3 -- 4
Electricity Resistance
heaters
98 1.1 15 0.9 -- 0.63
Gas oil,
kerosene,
light fuel oil
Boilers 77 3.9 20 0.77 -- 0.54
Gas oil, light
fuel oil,
livestock/
industrial
waste, LPG
CHP 1200 16.1 20 0.47 0.34 0.33
Gas oil,
kerosene,
light fuel oil
Efficient
Boilers
314 15.7 20 0.9 -- 0.63
LPG Boilers 182 9.1 20 0.66 -- 0.46
Municipal
waste,
biomass
CHP 1400 19 20 0. 47 0.34 0.33
Livestock/in
dustrial
waste, LPG
Efficient
Boilers
316 22.1 20 0.96 -- 0.67
Biomass Boilers 338 16.9 20 0.77 -- 0.54
0.0%
5.0%
10.0%
15.0%
20.0%
25.0%
30.0%
35.0%
0.000
1.000
2.000
3.000
4.000
5.000
6.000
2021 2022 2023 2024 2025 2026 2027 2028 2029 2030
ΑΠΕ στην θέρμανη-ψύξη
Biomass Solar RES share RES share (without Electricity)

40 | C y p r u s ’ N E C P 2 0 2 1 - 2 0 3 0
Resource Technology Investm
ent cost
(EUR/k
W)
Fix O&M
(EUR/kW
)
Lifetime
(years)
Heat
efficienc
y
Electric
efficienc
y
Cooling
efficienc
y
Municipal
waste,
biomass
Efficient
Boilers
702 7.9 20 0.81 -- 0.57
Solar Solar panels 863 17.3 20 6.54 -- 4.58
Additionally, high and medium heat requirements were taken into consideration, as it was
assumed that only boilers and CHP technologies can provide heat at the required
temperatures. Similarly, data were provided from MECI regarding each technology’s
contribution in the current energy mix. This formed the basis of estimating the existing
installed capacity of each technology. Following the historical production of technologies
provided through the JRC heating and cooling study, it was assumed that only heat
pumps/split-unit heat pumps from the current stock of technologies could satisfy the cooling
demand12
. Thus, if other technologies (e.g. LPG boilers) were to provide energy for cooling,
new installations would be necessary.
Table 2.6. Techno-economic characteristics of technologies in the residential sector (JRC, 2016b)
Resource Technology Investment
cost
(EUR/kW)
Fix O&M
(EUR/kW)
Lifetime
(years)
Heat
efficiency
Electric
efficiency
Cooling
efficiency
Electricity Heat pumps 1221 9 20 3.79 -- 2.65
Electricity Resistance
heaters
176 1.9 15 0.9 -- 1
Gas oil,
kerosene,
light fuel
oil
Boilers 209 10.5 20 0.77 -- 1
Gas oil,
light fuel
oil, LPG
CHP 1500 21.4 10 0.5 0.4 0.35
Gas oil,
kerosene,
light fuel
oil
Efficient
Boilers
314 15.7 20 0.96 -- 1
LPG Boilers 182 9.1 20 0.77 -- 1
LPG Efficient
Boilers
418 20.9 20 0.96 -- 1
Biomass Boilers 487 24.4 20 0.77 -- 1
Biomass CHP 1700 27 10 0.5 0.4 0.35
Biomass Efficient
Boilers
926 23.3 20 0.85 -- 1
Solar Solar panels 1151 23 20 6.54 -- 1
The existing renewable energy share in this sector originates from use of biomass in boilers,
renewable electricity and solar thermal panels. According to JRC estimates, solar thermal
panels in Cyprus currently provide 580 GWh of useful heat demand, mainly for residential hot
12
Geothermal applications and solar cooling were not proven to be cost-competitive

41 | C y p r u s ’ N E C P 2 0 2 1 - 2 0 3 0
water use. Estimates on the annual yield of this technology in Cyprus were obtained from
international literature (IEA Solar Heating & Cooling Programme, 2014). As in the case of
other technologies in this sector, only new installations of solar thermal panels were allowed
to contribute towards meeting the cooling demand. This is because from the existing stock of
technologies, currently only heat pumps provide cooling.
Figure 2.15. Assumed share of annual cooling demand for each hour within each month
The demand profile for each of the fuels driving the heating and cooling sector could
potentially change in the future. For instance, if energy efficient heat pumps are installed, the
peak electricity demand of the hot summer days may drop, while if the use of heat pumps for
heating increases, electricity demand may rise in the winter. Further, once natural gas enters
the market and sufficient infrastructure is put in place, this fuel might take up a substantial
share in the island’s energy intensive (e.g. cement and brick) industries or be used for space
heating purposes. Even though of importance, the aspect of natural gas use in the heating
and cooling sector was not taken into consideration. This was due to the fact that
considerable investments would be required to distribute this fuel to the respective
consumers as indicated in JRC study (JRC, 2016b). Once cost estimates for a potential
domestic gas network arise in the future, this aspect can be revisited.
Similarly, the JRC heating and cooling study indicated that much waste heat could be
recovered from the thermal power plants of Vasilikos and Dhekelia and be used for district
heating for the cities of Limassol and Larnaka respectively. However, this aspect was not
taken into consideration in this version of the model, due to lack of data on what heat
network costs, timeframe and pipeline capacities would be required to utilize this waste
heat. Including this in future enhancements of this work, if the option is deemed to be
feasible and politically acceptable, is encouraged.
Heat pumps/heat pump split units are the most competitive technology, as these increase
their share substantially, displacing oil boilers and electric resistance heaters (Table 2.6).
Additionally, fuel-efficient oil boilers provide a considerable amount of heating in the
services, industrial and agricultural sectors. Solar thermal panels in these sectors also
increase their contribution by about twice their current yield, while solar thermal panels in
the residential sector stay stable at the current levels. However, in the residential sector heat
pumps/heat pump split-units take up the majority of the heating demand, as they are
0.0000
0.0020
0.0040
0.0060
0.0080
0.0100
0.0120
0.0140
0.0160
0.0180
0.0200
1 2 3 4 5 6 7 8 9 10 11 12 13 14 15 16 17 18 19 20 21 22 23 24
Shar
e o
f an
nu
al c
oo
ling
dem
and
(%
)
Apr May Jun Jul

42 | C y p r u s ’ N E C P 2 0 2 1 - 2 0 3 0
conceived to be the most cost-competitive technology. On the other hand, electric resistance
heaters are not seen as efficient or cost-competitive and are phased out. Similarly, heat
pumps/heat pump split-units take up the entire cooling demand throughout the model
horizon, as currently is the case, with minimal contribution from efficient oil boilers. It should
be clarified that the biomass CHP plants providing part of the heating demand refer to
existing and future agricultural facilities making use of biogas, both for heating purposes as
well as to generate electricity.
The outlook of this sector could potentially change substantially, if the electricity demand is
allowed to vary. For instance, even though fuel efficient oil boilers contribute to the heating
demand in services, industry and agriculture, if the level of electricity was allowed to
increase, the contribution of heat pumps/heat pump split-units would likely increase further,
since this is deemed to be the most cost-competitive option in this sector. Of course, this
would also depend on the respective scenario. In a scenario without natural gas or with high
fossil fuel prices in electricity generation, the average cost of electricity increases
considerably. In this case, other technologies may be deemed more competitive. For this
reason, it is advised that a sensitivity analysis be carried out before making any drastic policy
decisions.
The aspect of decommissioning of aging renewable energy technologies from the system
arises in this sector. As seen in the results, contribution from solar thermal panels in the
residential sector does not change over time. This is due to the assumed refurbishment that
occurs at the end of the technology’s lifetime. Even though this assumption does not
increase the technology’s cost-competitiveness in the residential sector, it affects the level of
solar panel deployment in the rest of the economy. This relates to the difference in
investment costs, as indicated in Tables 2.5 and 2.6.
Another aspect that should be raised is that of the deployment of small CHP facilities at the
final end-user level. This CHP capacity, which reaches 96 MWe in 2030, is deployed due to
the direct adoption in the model of the final energy demand projections in the Heating and
Cooling sector as provided by the Cyprus University of Technology. The model simply deems
that this is the most efficient way of consuming the fuel forcibly allocated to the system. It is
expected that if the limits on fuel use for the Heating and Cooling sector are lifted from the
model, this option will not appear to this high degree in the optimal solution. To do this,
updated demands for Heating and Cooling will need to be expressed in terms of useful
energy demand.
e. Transport Sector
Biofuels are liquid or gaseous transport fuels such as biodiesel and bioethanol which are
made from biomass. They serve as a renewable alternative to fossil fuels in the EU's
transport sector, contributing to reduction of greenhouse gas emissions and improvement
the EU's security of supply.
Each member state is obliged to fulfil two obligatory targets for road transport fuels by 2020,
setting by the relevant EU Directives, 2009/28/EC and 2009/30/EC: 10% of the energy
consumption of transport sector comes from renewable sources such as biofuels, and fuel
suppliers are required to reduce the greenhouse gas intensity of the transport fuels that they
enter in the market by 6% compared with the fuel baseline standard (greenhouse gas
emission of EU transport fuels mix in 2010). Currently, only biofuels are used in transport
sector and the percentage of biofuels to transport fuels is at 2.5% and the greenhouse gas

43 | C y p r u s ’ N E C P 2 0 2 1 - 2 0 3 0
emission reduction is at 1%. These targets will gradually be increased until 2020 in order to
meet the obligatory targets.
Taking into account the provisions of new RES Directive (recast), the RES target for transport
sector will be at the level of 10% for the period 2021-2030.
According to the results and all scenarios examined, the renewable energy targets is very
challenging and very costly to be met comparing with the other sectors. The use of second
generation biofuels, as its contribution counts double towards the achievement of the target
will be the main RES in transport sector. Further penetration of plug in hybrid vehicles and
electric vehicles contribute to meet the targets, while the use of natural gas to transport
sector will be examine later.
iv. estimated trajectories by renewable energy technology that the Member
State projects to use to achieve the overall and sectorial trajectories for
renewable energy from 2021 to 2030 including expected total gross final
energy consumption per technology and sector in Mtoe and total planned
installed capacity (divided by new capacity and repowering) per
technology and sector in MW
Most of the RES projects were licenced for 15 or 20 years with the year of operation staring
in 2005 and the majority of them after 2010. It is expected that after the expiration of their
PPA, the projects will be operated under net-billing scheme or participate directly to the
competitive electricity market.
Figure 2.16. Energy Mix Generation for Various fuels from 2021-2030
-
1,000
2,000
3,000
4,000
5,000
6,000
7,000
2021 2022 2023 2024 2025 2026 2027 2028 2029 2030
Ge
ne
rati
on
(G
Wh
)
Gas HFO Diesel Solar PV Solar Thermal Wind Biomass Dist. PV

44 | C y p r u s ’ N E C P 2 0 2 1 - 2 0 3 0
Figure 2.17. Breakdown of the Annualized system cost and the expected price of electricity assuming
ideal market conditions.
Table 2.7. Capacity (MW) Mix of various Renewable Energy Technologies evolution.
Technology (MW) 2020 2025 2030
Light fuel oil CHP 0 85 96
Solar PV* 292 292 614
Solar Thermal 0 50 50
Wind 175 175 175
Biogas 10 25 29
Li-Ion Batteries 0 0 72
RES Penetration in Electricity 17.52% 24.39%
* This will be revised and normalized over time in order to take into account the existing
policies and measures of the building Sector.
While the modelling exercise indicated that the Solar PV will be cost-optimum to be installed
towards the end of the period, it is expected that the penetration will increase due to the
competitive electricity market till to 2025 at least with up to 200 MW. This scenario will be
re-examined shortly in order to identify the Grid Stability and the required reserves needed
to support the systems at earlier stage. It should be noted that in previous modelling
exercise, high level of RES at earlier stage where Electricity demand was lower, lead to higher
level of curtailment, even with battery storage.
-
20
40
60
80
100
120
140
-
100
200
300
400
500
600
700
800
900
1,000
20
21
20
22
20
23
20
24
20
25
20
26
20
27
20
28
20
29
20
30
EUR
/MW
h
Mill
ion
EU
R
Fixed Cost Variable CostAnnualized Investment Cost CO2Average electricity cost

45 | C y p r u s ’ N E C P 2 0 2 1 - 2 0 3 0
Figure 2.18. Yearly Investment Cost per Technology from 2021-2030
Extensive strategic planning and considerable investments in infrastructure are required to
integrate indigenous energy sources in the power supply system, as well as to promote
Energy Efficiency and Alternative Transport within the island.
It should be noted that while the generation assets at Vasilikos, Cyprus’ main power station,
are currently fired with diesel and heavy fuel oil, significant investment has already taken
place to allow these assets to run on natural gas when it becomes available.
The cumulative expenses (include all the investments + fuel costs + O&M + CO2 costs)
needed to achieve the Scenario with Existing Measures for the period 2021-2030 is shown in
the Appendix III.
v. Estimated trajectories on bioenergy demand, disaggregated between heat,
electricity and transport, and on biomass supply, by feedstocks and origin
(distinguishing between domestic production and imports). For forest
biomass, an assessment of its source and impact on the LULUCF sink
vi. If applicable , other national trajectories and objectives, including long-
term or sectorial ones (e.g. , share of renewable energy in district heating,
renewable energy use in buildings, renewable energy produced by cities,
energy communities and self-consumers, energy recovered from the
sludge acquired through the treatment of wastewater)
Renewable Energy use in buildings: As of 1.1.2017, a new legislation was applied for a
minimum percentage of primary energy consumption to be covered by RES, indicating that at
least 25% of primary energy consumption to be covered by RES for new single-family homes,
3% for new multi-apartment residential buildings, and 7% for non-residential ones. It is
envisaged that the new buildings from 1.1.2021 will be nearly zero energy buildings and thus
implies that all the new buildings will be covered at least by 25% of RES. In practice more of
the systems installed over-exceed this capacity since it make more sense with the existing
net-metering scheme to cover almost 100% of Energy needs of each individual household,
assuming that there is enough space on the roof to install such system.

46 | C y p r u s ’ N E C P 2 0 2 1 - 2 0 3 0
Installation of solar water heater for the production of hot water, especially in residential
buildings, is very popular and is expected to continue and enhanced in the future by
introducing new innovative technologies.
Regarding district heating or cooling several studies where done13
, while the studies initially
showed that there was a technical potential after the impact assessment results and further
analysis performed by another study it was shown that the economic potential does not exist
for such systems. Moreover as it was discussed during the concerted action for RES, it seems
that in some regions in other MS, that already have district heating networks, consumers
tend to prefer other more efficient options such as the use of heat pumps. This indicates that
the economic potential is going towards the heat-pumps and not to district heating and
cooling. Hence more actions shall be taken regarding the use of more RES in the
electrification of heating and cooling sector (e.g. use of PV).
Especially in the case of Cyprus where:
- The heating degrees days have been reduced
- the cooling needs are increased
- no waste cooling exists, it is seeming that such network will be difficult to implemented in
the near future and make economic sense.
2.2. Dimension Energy efficiency
i. The elements set out in Article 4(b)
The indicative national energy efficiency contribution to achieving the Union's binding energy
efficiency target of 30% in 2030 as referred to in Article 1(1) and Article 3(4) of Directive
2012/27/EU [version as amended in accordance with proposal COM(2016)761], based on
either primary or final energy consumption, primary or final energy savings, or energy
intensity; expressed in terms of absolute level of primary energy consumption and final
energy consumption in 2020 and 2030, with a linear trajectory for that contribution from
2021 onwards; including the underlying methodology and the conversion factors used.
1. Projections of Final Energy Demand
In preparation of the National Energy and Climate Plan of Cyprus, long-term forecasts of final
energy demand were updated. Compared to the previous projections, which were published
in 2017 and were also used in the 4th National Energy Efficiency Action Plan of Cyprus, the
current projections of energy consumption have taken into account the following updates:
• The updated energy balance of year 2015 and the more recent energy balances of years
2016 and 2017.
• The updated macroeconomic forecasts of the Ministry of Finance of Cyprus, which were
published in September 2018. According to these, a stronger economic growth is
foreseen up to 2030. For example, GDP in year 2020 is expected to reach 21.7 billion
Euros (at 2010 prices), whereas the macroeconomic forecast that was used in 2017
reported a GDP of 20.2 billion Euros (at 2010 prices) in 2020.
• The Euro - US dollar exchange rate assumed by the European Commission.
13
http://www.mcit.gov.cy/mcit/EnergySe.nsf/All/52DA7EEECDF7D532C225828D00203A1B?OpenDocument

47 | C y p r u s ’ N E C P 2 0 2 1 - 2 0 3 0
• The forecast of energy consumption in transport, which was based on a technical
assistance study carried out by the German firm ifeu and had been used in the 4th
NEEAP, was adapted to the latest official transport fuel consumption data of year 2017.
• The latest developments regarding the use of natural gas for power generation.
According to the 4th NEEAP, this was expected to happen by the end of 2018, whereas
current projections show natural gas penetration happening in the last quarter of year
2020.
Based on the above, the current update leads to an increase in projected final energy
consumption in 2020 which is mainly due to:
a) the higher than previously expected energy consumption in 2016-2017; and
b) the stronger macroeconomic growth forecast for years 2018-2020.
Final energy demand in all sectors is expected to increase faster according to our latest
projections, mainly because of the stronger economic growth foreseen, despite a higher
increase in energy prices because crude oil prices are expected to reach somewhat higher
levels than those of the 4th NEEAP.
Figure 2.19 displays the projected evolution of final energy and electricity demand according
to the two scenarios. Policies adopted in the Scenario with Additional Measures can help
accelerate improvements in energy intensity and thus stabilise total final energy demand in
the 2030s. Electricity demand, however, is still projected to increase because the further
electrification of the economy counterbalances energy efficiency improvements; stronger
measures would be needed in order to revert the increasing trend of electricity consumption.
2. Projections of Primary Energy Demand
The updated outlook of primary energy demand in Cyprus, combines the final energy
demand projections described in the previous section with projections for the power
generation sector which were conducted in the frame of the JRC study that was performed
for MECI.
The Scenario with Additional Measures of this study was combined with power generation
scenario, but taking into account a delay in the arrival of natural gas in Cyprus, it is foreseen
to be used in power plants only in the last quarter of 2020. This is in line with what is
considered by the government of Cyprus as a realistic policy option by the time of this writing
(November 2018).

48 | C y p r u s ’ N E C P 2 0 2 1 - 2 0 3 0
0
500
1000
1500
2000
2500
3000
2010 2015 2020 2025 2030 2035 2040 2045 2050
Final Energy Demand in Cyprus (ktoe)
Existing Measures Additional Measures
0
1000
2000
3000
4000
5000
6000
7000
8000
9000
1960 1970 1980 1990 2000 2010 2020 2030 2040 2050
Final Electricity Demand in Cyprus (million kWh)
Actual data Existing Measures Additional Measures
0
20
40
60
80
100
120
2010 2015 2020 2025 2030 2035 2040 2045 2050
Final Energy Intensity in Cyprus (toe/MEuro'2010)
Existing Measures Additional Measures
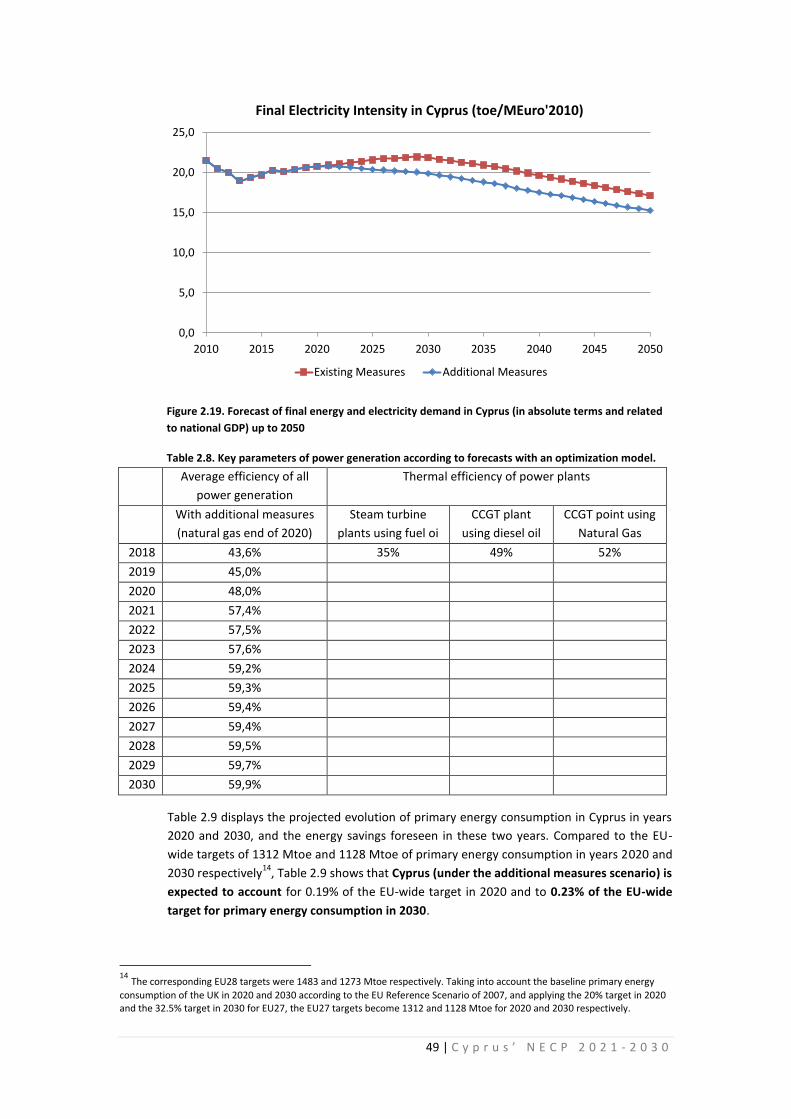
49 | C y p r u s ’ N E C P 2 0 2 1 - 2 0 3 0
Figure 2.19. Forecast of final energy and electricity demand in Cyprus (in absolute terms and related
to national GDP) up to 2050
Table 2.8. Key parameters of power generation according to forecasts with an optimization model.
Average efficiency of all
power generation
Thermal efficiency of power plants
With additional measures
(natural gas end of 2020)
Steam turbine
plants using fuel oi
CCGT plant
using diesel oil
CCGT point using
Natural Gas
2018 43,6% 35% 49% 52%
2019 45,0%
2020 48,0%
2021 57,4%
2022 57,5%
2023 57,6%
2024 59,2%
2025 59,3%
2026 59,4%
2027 59,4%
2028 59,5%
2029 59,7%
2030 59,9%
Table 2.9 displays the projected evolution of primary energy consumption in Cyprus in years
2020 and 2030, and the energy savings foreseen in these two years. Compared to the EU-
wide targets of 1312 Mtoe and 1128 Mtoe of primary energy consumption in years 2020 and
2030 respectively14
, Table 2.9 shows that Cyprus (under the additional measures scenario) is
expected to account for 0.19% of the EU-wide target in 2020 and to 0.23% of the EU-wide
target for primary energy consumption in 2030.
14
The corresponding EU28 targets were 1483 and 1273 Mtoe respectively. Taking into account the baseline primary energy
consumption of the UK in 2020 and 2030 according to the EU Reference Scenario of 2007, and applying the 20% target in 2020 and the 32.5% target in 2030 for EU27, the EU27 targets become 1312 and 1128 Mtoe for 2020 and 2030 respectively.
0,0
5,0
10,0
15,0
20,0
25,0
2010 2015 2020 2025 2030 2035 2040 2045 2050
Final Electricity Intensity in Cyprus (toe/MEuro'2010)
Existing Measures Additional Measures

50 | C y p r u s ’ N E C P 2 0 2 1 - 2 0 3 0
In the additional measures scenario, the projections for primary energy consumption of
Cyprus for 2020 and 2030 are lower than the respective projections for Cyprus in the 2007
EU Reference Scenario (the projection for Cyprus in 2007 EU Reference Scenario was 2.8
Mtoe for 2020 and 2.9 Mtoe for 2030). It can be concluded that the forecast for national
primary energy consumption no more than 2.6 Mtoe in 2030 is lower of about 9.5% than
respective projection for Cyprus primary energy consumption in 2030 as was projected in
the 2007 Reference Scenario.
A reduction of 9.5% results in having primary energy consumption for Cyprus in 2030, no
more than of 2,6 Mtoe, which means reducing the primary energy consumption of the
country about 300Ktoe compared to what is has been projected in the 2007 EU Reference
Scenario. Table 2.10 provides the sectoral energy demand forecasts in year 2030.
Table 2.9. Trajectory of primary energy consumption (Mtoe) with additional measures, 2020-2030
2020 2021 2022 2023 2024 2025 2026 2027 2028 2029 2030
Primary
energy
consumption
(Mtoe)
2.5 2.4 2.4 2.5 2.5 2.5 2.5 2.5 2.5 2.6 2.6
Table 2.10. Sectoral projections of final energy demand in 2030
Sectoral projections of final energy demand in 2030 (Mtoe)
With Additional
Measures
Primary Energy Consumption 2,6
Total final energy consumption 2,2
Final energy consumption – industry 0,3
Final energy consumption - households 0,4
Final energy consumption - agriculture 0,05
Final energy consumption - transport 1,1
Final energy consumption - services 0.3
Moreover, the “energy efficiency first” principle, has been considered in the preparation of
the DINECP. In the development of the national scenario “with additional measures”, energy
efficiency measures were prioritized. Therefore, the most cost-effective measures energy
efficiency measures are included in it, instead of other measures, aiming to contribute in
reaching the national energy and climate obligations for 2030.
ii. Cumulative amount of energy savings to be achieved over the period 2021-
2030 under Article 7 on energy saving obligations of Directive 2012/27/EU
[version as amended in accordance with proposal COM(2016)761],
The first estimation shows that the cumulative target of the period 2021-2030 will be
between 235,000-238,000 toe. Given that no official data are available at the moment for
the national final energy consumption of the years 2017 and 2018, the national cumulative
target of the period 2021-2030 will be recalculated in 2019 and will be included in the final
national NECP of 2019.

51 | C y p r u s ’ N E C P 2 0 2 1 - 2 0 3 0
iii. Objectives for the long-term renovation of the national stock of residential
and commercial buildings (both public and private)
Most of the existing building stock has a relatively poor energy performance, as the majority
(94% for residential sector and 83% for tertiary sector), was built before the implementation
of minimum energy performance requirements. Implementation of energy efficiency
measures in existing buildings has been mobilized mainly through financial incentives. The
Long-term Renovation Strategy (LTRS) which was initially issued in 2014 and revised in 2017
contains existing policies and measures in the building sector, as well as projections for the
building stock up to 2030. The LTRS examines how possible adjustments in regulatory
measures and incentives in renovation could reduce even further energy consumption of
building by 2030. LTRS will be revised for second time until April 2020, according to the
requirements set by Directive 2018/844/EU. During the development of the new LTRS
measurable progress indicators will be set according to the energy efficiency targets set by
Directive 2012/27/EU, and with a view to the long-term 2050 goal of reducing greenhouse
gas emissions.
iv. The total floor area to be renovated or equivalent annual energy savings to
be achieved from 2021 to 2030 under Article 5 on the exemplary role of
public bodies' buildings of Directive 2012/27/EU
Article 5 of Directive 2012/27/EU allows Member States, in place of the requirement to
renovate annually 3% of the total area of buildings owned and used by central government
authorities, to choose an alternative approach including other cost-effective energy-saving
measures in selected privately-owned public buildings (including, but not limited to, deep
renovations and measures to change the behaviour of users) in order to achieve by 2020 an
equivalent amount of energy savings.
Since the alternative approach gives more flexibility in implementing cost-effective energy
saving measures as appropriate, Cyprus has chosen this alternative approach. It has been
estimated that annual energy savings of 3,316 GWh have to be achieved for the period 2014
– 2020. A report has been submitted to European Commission which lists and quantifies the
measures that will be taken. The same approach will be followed for the period 2021 – 2030,
though the annual energy saving target might need to be recalculated depending on possible
modification of public building stock.
v. If applicable, other national objectives, including long-term targets or
strategies and sectorial targets. National objectives in areas such as energy
efficiency in the transport sector and with regard to heating and cooling
Not applicable
2.3. Dimension Energy security

52 | C y p r u s ’ N E C P 2 0 2 1 - 2 0 3 0
i. The elements set out in Article 4(c)
i bis. National objectives with regard to increasing: the diversification of energy
sources and supply from third countries; , for the purpose of increasing the
resilience of regional and national energy systems;
Cyprus is a small isolated energy system, with high dependency on oil products for its energy
needs. More than 90% of Cyprus energy inland consumption is from oil products and the rest
is from renewables. The introduction of natural gas via LNG imports and the development
of the necessary infrastructure by the end of 2020, will end the current energy isolation and
diversify Cyprus’ energy sources.
Most of the imported energy sources are from neighbouring countries, e.g. most of the oil
products are imported from Greece and Israel. Due to the small amounts that are imported,
the possibility to diversify the energy supply from third countries is very limited.
In the frame of the Government’s decision of relocation of the oil products terminals and
other facilities from the seafront of Larnaca area and the development of the necessary
infrastructure for the import of natural gas, the New Energy and Industrial Area of Vasilikos
was established on November of 2014. Oil companies are now building their own terminals
at Vasilicos Area, while Cyprus Organization for the Storage and Management of Oil Stocks
(KODAP), the Central Stockholding Entity of Cyprus established by “The Maintenance of Oil
Stocks Law of 2003” (N.149(I)/2003)”, is planning to build its own oil storage terminal in
order to relocate its own oil stocks in Cyprus, as well as, to reduce the annual storage cost.
Regarding the coping with constrained or interrupted supply of an energy sources, in the
case of oil products, KODAP is responsible for the maintenance of the national emergency oil
stocks equivalent to 90 days of net imports. In the event of a major supply disruption, the
Minister of Energy, Commerce, and Industry may implement the emergency procedures and
measures provided by the law, including the release of emergency oil stocks.
In the case of constrained or interrupted supply of electricity, TSOC submits to CERA
whenever it is considered necessary an updated action plan for the restoration of the
electrical system after power blackout. The Action Plan includes among other issues the
steps/actions to be taken by the TSOC and the Power Plants themselves, the critical support
staff, alert mechanisms, means of communication and any other possible actions for the
implementation of the Plan. The Action Plan is in force since 2014 and since then several
revisions have been made. It is expected that in 2019 the TSOC will submit to CERA revised
version of the Action Plan. Additionally, in order to improve the quality of supply and taking
into account CEER's recommendations to harmonise Electricity Continuity of Supply (CoS)
indicators, data collection procedures and the methodology to calculate the value of CoS as
well as other major aspects such as voltage quality and commercial quality, CERA is in the
process of taking the decision on preparing such indicators with external assistance.

53 | C y p r u s ’ N E C P 2 0 2 1 - 2 0 3 0
ii. If applicable, national objectives with regard to reducing energy import
dependency from third countries, for the purpose of increasing the
resilience of regional and national energy systems;
It is not applicable.
iv. National objectives with regard to increasing the flexibility of the national
energy system, in particular by means of deploying domestic energy
sources, demand response and energy storage.
The use of indigenous sources of energy, such as hydrocarbon deposits and RES will
contribute to increasing the flexibility of the national energy system and ensuring the
security of energy supply. The promotion of RES and objectives regarding demand response
and energy storage are included in section 2.1.2 and 2.4.3, respectively.
Regarding indigenous hydrocarbon deposits offshore Cyprus, the Aphrodite natural gas field
contractor and the Republic of Cyprus are in discussions to finalize and agree on the
Aphrodite Development and Production Plan. Natural gas production from the Aphrodite
field is expected to begin in four to five years after the approval of the proposed
Development and Production Plan (DPP) and the issue of the Exploitation License. The
Aphrodite field gas, according to the proposed DPP, is going to be transmitted to Egypt,
mainly to Idku LNG Terminal for liquefaction and re-export as well as for the domestic
market. Moreover, in February 2018, the ENI / Total joint venture completed the first
exploratory well "Calypso 1" in Block 6, which resulted in a gas discovery. The ExxonMobil/
Qatar Petroleum Consortium proceeds with its plans for two exploration wells in Block 10 in
late 2018 -early 2019.
2.4. Dimension Internal energy market
2.4.1. Electricity interconnectivity
i. The level of electricity interconnectivity that the Member State aims for in
2030 in consideration of the electricity interconnection target for 2030 of
at least 15%, with a strategy with the level from 2021 onwards defined in
close cooperation with affected Member States, taking into account the
2020 interconnection target of 10% and the following indicators of the
urgency of action:
EuroAsia Interconnector (Project Of Common Interest 3.10.1, 3.10.2, 3.10.3) is considered as
an additional measure. It is a cross border interconnector between Greek, Cypriot, and Israeli
power grids via the world's longest submarine HVDC power. HVDC onshore converter
stations with a total capacity of 2000MW will be located at each connection point. It is also a
priority Electricity Highway Interconnector Project. The Interconnector is an energy highway
bridging Asia and Europe. This Project of Common Interest is also related to:
- Energy Security Dimension as it promotes diversification of routes and ends the energy
isolation of Cyprus.
- Decarbonization Dimension because electricity imports will preferably come from
natural gas or renewable sources which contribute to the reduction of greenhouse
emissions.

54 | C y p r u s ’ N E C P 2 0 2 1 - 2 0 3 0
However, the implementation of the project is subjected to underway discussions between
the European Commission, the Greek and Cypriot authorities. The final decision will be taken
in the near future.
Figure 2.20. EuroAsia Interconnector Cross-Border benefits
2.4.2. Energy transmission infrastructure
i. Key electricity and gas transmission infrastructure projects, and, where
relevant, modernisation projects, that are necessary for the achievement of
objectives and targets under the five dimensions of the Energy Union
Strategy.
Key electricity transmission infrastructure projects
The T-TYNDP includes the construction of new transmission substations and the upgrading of
existing transmission substations to enhance energy security and improve the efficiency of
the system operations through remote control and system data acquisition. Thirty-six related
projects in a total of a budget of 139.5 million Euros are listed in the T-TYNDP. The financing
of these projects will be done through the national budget of the Transmission System
Owner (the Electricity Authority of Cyprus).
Similarly, 28 projects are included in the T-TYNDP regarding the construction of new and the
upgrading of existing transmission lines (Overhead and Underground Cables). The primary
aim of these projects is to increase power transfers between vital energy centres on the
island, as well as increase the fault level capacity of the system, therefore increasing system
security and resilience. The total budget for these projects is 128 million Euros and will be
funded through the national budget of the Transmission System Owner (the Electricity
Authority of Cyprus).
The ability of the system to manage and control non-critical loads such as Chillers, Storage
Heaters and Water Pumps through tariffs will be upgraded through the replacement of the
existing 66kV with a 132 kV Ripple Control System with increased load management and
control functionalities. The new Ripple Control System will aid at reducing peak load during

55 | C y p r u s ’ N E C P 2 0 2 1 - 2 0 3 0
resource scarcity or high system marginal cost conditions (e.g. summer peak, winter peak) by
reducing the need to add to the system a high fuel cost (diesel) generation set. Better
management of non-critical loads will also reduce the cost of purchasing CO2 emission rights
and for maintaining high levels of reserve requirements during peak load conditions. The cost
of this project is estimated at 4.2 million Euros and will be financed through the national
budget of the Transmission System Owner (the Electricity Authority of Cyprus). Completion
date is estimated latest by 2020.
The T-TYNDP foresees the installation of 2x75MVAr 132kV Variable Shunt Reactors to
manage increased capacitive reactive power, due to the increasing undergrounding of O/H
HV Lines. Installation of reactors (inductors) is expected to reduce system losses and avoid
over-voltages caused by capacitive reactance. The cost of this project is estimated at 3.1
million Euros and will be financed through the national budget of the Transmission System
Owner (the Electricity Authority of Cyprus). Completion date is estimated end of 2018, early
2019.
Modernization Projects
The commitment of Cyprus to promote the transformation of the traditional vertically and
centrally organised electricity system to an electricity system that will be able to
accommodate non-dispatchable decentralised generation is reflected in the T-TYNDP
financial commitment. A budget of ca. 112 million Euros will be dedicated to investing in
modernisation projects up to the year 2027, which is equivalent to an expenditure of 130
Euros per capita. In particular:
1. Installation of Advanced Metering Infrastructure (AMI) and Smart Meters to enable
optimization and control of the distribution system, increase the penetration of
distributed renewable sources, enable aggregation of RES, demand response and
storage, increase direct final customer participation in all market stages (active
customers). The deployment of advanced metering infrastructure (AMI) includes the
roll-out of 400 000 smart meters. The AMI contributes to increased system observability,
load and generation forecasting accuracy, accurate system analysis and planning, load
management alternative to ripple control, optimisation of the operation of the
distribution system, supervisory control and data acquisition of PV systems and so forth.
The major functionality of the AMI is the metering data requisition moreover, control
through head end systems (no billing). The total budget of the project is estimated at 75-
80 million euros and will be realised in 7 phases, each involving the installation of 57143
smart meters. Each phase ends in January starting from year 2021 (end of phase 1) to
January 2027 (end of year 2027). The financing of this project will be through the
national budget of the distribution system owner.
2. Installation of a Meter Data Management System (MDMS) to facilitate independent and
efficient Meter and Customer Information Management. Competitive market operation
and customer participation require the installation of an MDMS system for the central
data management of the Advanced Metering Infrastructure (AMI). The MDMS shall
provide integration with the Meter Data Collection Systems and other utility information
systems (SCADA, GIS) and functionalities such as Data Warehousing and Management,
Meter Operations, Data Validation-Editing-Estimation (VEE). Third-party (suppliers, MO)
connection to Meter Management through the External Information System (EIS), to
implement the energy market provisions related to the provision of the metering data of
individual customers to their Suppliers as well as the aggregated invoices to the Energy

56 | C y p r u s ’ N E C P 2 0 2 1 - 2 0 3 0
Suppliers in the market. MDMS also allows the DSO to operate as an independent entity
in a multi-energy supplier market and to facilitate DSOs main business processes. The
total budget of the project is estimated at ca. 19 million Euros and is expected to be
completed by 2021. The financing of this project will be through the national budget of
the Distribution System Owner.
3. Installation of a Distribution SCADA/ADMS for the automation of the Distribution System
Control and Data Acquisition and the Management of the Distribution System at the
Medium Voltage Level. The project includes the design, engineering, supply, installation,
configuration, testing and commissioning of a Supervisory Control and Data Acquisition /
Advanced Distribution Management System (SCADA/ADMS) and its integration with the
GIS and Transmission SCADA/EMS System operated by the Cyprus TSO. The SCADA
communicates with 175 RTUs installed at MV Level equipment. The ADMS shall provide,
among other things, applications for Power Flow, Switching Order Management, Short
Circuit Analysis, Short-Term Load and Generation Forecasting, RES Management and
Curtailment, Emergency Load Shedding and restoration, Cyclic Load Shedding and
restoration, Outage Management System, Power Quality Monitoring. The total budget of
the project is estimated at 9.2 million Euros and is expected to be completed by 2022.
The financing of this project will be through the national budget of the Distribution
System Owner.
Key gas transmission infrastructure projects
Cyprus, has an energy isolated system. Its geographic position and the small market size,
make it difficult for investors to invest (for financial reasons). Currently, Cyprus' energy
system is heavily depended on conventional fossil fuels, approximately account 90 %.
1. The EastMed pipeline (Project of Common Interest no. 7.3.1), promoted by IGI-Poseidon
S.A. aims at connecting the European market with the gas resources of the Eastern
Mediterranean region. This Project of Common Interest is also related to:
- Energy Security Dimension as it promotes diversification of sources and routes, ends
the isolation of Cyprus and Crete, supports new gas production in the E.
Mediterranean, including EU indigenous sources, facilitates gas exchanges in S.E.
Europe,
- Energy Efficiency Dimension as natural gas is more efficient fuel than the other fossil
fuels and
- Decarbonization Dimension because of the import of natural gas in Cyprus fuel
market which has lower emissions than conventional fuels.
The EastMed pipeline will have an initial capacity of up to approximately 10 Bcm/year. In a
second phase, the pipeline’s capacity may expand up to 20 Bcm/y. It is an approximately
1900 km off-shore-pipeline divided into the five following sections: 1) offshore in the
Levantine basin to Cyprus; 2) Cyprus-Crete; 3) Crete-Peloponnese; 4) Peloponnese-W.
Greece; 5) W. Greece-Thesprotia. From there, at Florovouni, it will connect to the off-shore
section of the Poseidon pipeline enabling the direct flow of gas to Italy and beyond in the
European continent. Moreover, via the potential connection with the Greece-Bulgaria
Interconnector, the EastMed pipeline can also allow the Levantine gas to reach the Balkan
markets while the metering & regulating station at Megalopoli provides a connection to the
Greek gas transmission system.

57 | C y p r u s ’ N E C P 2 0 2 1 - 2 0 3 0
In 2013, the EastMed pipeline received a CEF grant of 2 million € to cover 50% of the costs
for the execution of the Pre-FEED (Front-End-Engineering Design) studies, namely technical
feasibility studies, reconnaissance marine survey, as well as economic, financial and
competitiveness studies. The objective of the Action was to provide the necessary
information to producers and downstream gas market operators, allowing the assessment
and possible selection of the project, as preferred export option, for part of the Levantine
Basin gas resources, ensuring a new reliable source of supply via a diversified route.
The Action (implementation schedule May 2015 to March 2018) contributed to enhancing
the maturity of the project with a detailed and complete technical and economic assessment,
enabling the project promoter to provide reliable data to the upstream producers and to
downstream operators for the selection of the PCI as preferred export route.
The results of the Action, which clarified that the project was technically feasible and
economically viable, allowed the project promoter to proceed to the FEED phase. This is also
being supported by CEF with a grant of 34.5 million €. The main objective of the new Action
is to carry out the studies required to provide the necessary technical inputs for starting the
implementation phase of the PCI. The Action will build on the results of the Pre-FEED analysis
and include the main remaining steps, leading to the Final Investment Decision for the PCI. In
particular, the Action entails detailed design (FEED) and marine survey activities, including all
the engineering details for project implementation, as well as permitting activities in Cyprus
and Greece, which are expected to be completed by the 31/12/2020.
Tendering is underway regarding the provision of Front End Engineering Design services
related to the offshore and onshore pipeline sections as well as Front End Engineering Design
services related to the facilities (Compressor and metering stations) of the EastMed pipeline.
The successful completion of the Action, (implementation schedule May 2018 to December
2021) will lead to the identification of the project routing, the definition of the project costs
and the technical specifications required for tendering the construction phase of the project,
and will result in the submission of the Environment Impact Assessment (EIA) application to
obtain the relevant permits from the competent authorities in Cyprus and Greece, paving the
way to start the construction and operation of the EastMed Pipeline.
With regard to the EastMed pipeline’s Implementation schedule, following the completion of
the FEED phase, FID may be taken during 2021. This would allow construction to start in 2021
and to be completed by end of 2024. Commercial operation could start in 2025. IGI Poseidon
will be finalizing the notification of the EastMed project to the national Competent Authority,
with regard to establishing the start of the permit granting process, in due course, pursuant
to Article 10 of Regulation 347/2013.
Apart from the endorsement of the EastMed as an EU PCI and the afore-mentioned CEF
grants, the successful development of the pipeline has also benefitted from the support
received from the concerned national governments. In this regard, in December 2017 the
governments of Cyprus, Greece, Israel and Italy signed a Memorandum of Understanding
underlining their support for the project and mandating a high-level group, composed of
senior national officials, to prepare an Intergovernmental Agreement which should be signed
by the end of 2018.
The planned budget for this project is around 5 billion Euros.

58 | C y p r u s ’ N E C P 2 0 2 1 - 2 0 3 0
2. CyprusGas2EU (Project of Common Interest no. 7.3.5 former 7.3.2) promoted by Ministry
of Energy, Commerce and Industry (MECI) aims at introducing Natural Gas via LNG imports to
the island of Cyprus in order to end the current energy isolation of Cyprus, by establishing
the required infrastructure.
In October 2018, a tender was announced by ETYFA (Natural Gas Infrastructure Company of
Cyprus) for the construction of a LNG Import Terminal in Vasilikos Bay. The target date for
the completion of the entire LNG imports and infrastructure development project and the
commencement of the supply of natural gas to the domestic market of Cyprus is by the end
of year 2021.
The infrastructure project consists of (a) a Floating Storage and Regasification Unit (FSRU) (b)
a jetty for the permanent berthing of the FSRU, and (c) Onshore natural gas infrastructure
and related construction components for gas delivery to the Vasilikos power station and
potentially other gas consumers.
. All necessary technical designs for this activity are secured and are already under execution
through the CEF funded CYnergy action (2016-EU-SA-0009).
This Project of Common Interest is also related to:
- Energy Security Dimension as it is removing internal bottlenecks in the Trans-European
Networks of Energy (TEN-E), it is ending the energy isolation of Cyprus and allowing
transmission of natural gas from Eastern Mediterranean,
- Energy Efficiency Dimension as natural gas is more efficient fuel than the other fossil
fuels and
- Decarbonization Dimension because LNG has lower emissions than conventional fuels.
The capital cost of the Project is estimated to be around €300 million, which will be financed
through a combination of a grant from the EU CEF (Connecting Europe Facility) of up to €101
million (project was approved by CEF in January 2018), debt financing (e.g. EIB, etc.) and
possibly an equity investment by the Electricity Authority of Cyprus (EAC).
ii. If applicable, main infrastructure projects envisaged other than Projects of
Common Interest (PCIs)
1. EuroAfrica Interconnector is an interconnector between Greek, Cypriot, and Egypt power
grids via submarine power cable. The Interconnector is an energy highway bridging Africa
and Europe. It will have a capacity to transmit 2,000 megawatts of electricity in either
direction. The indicative cost for the 1,707-km interconnector is 4 billion €.
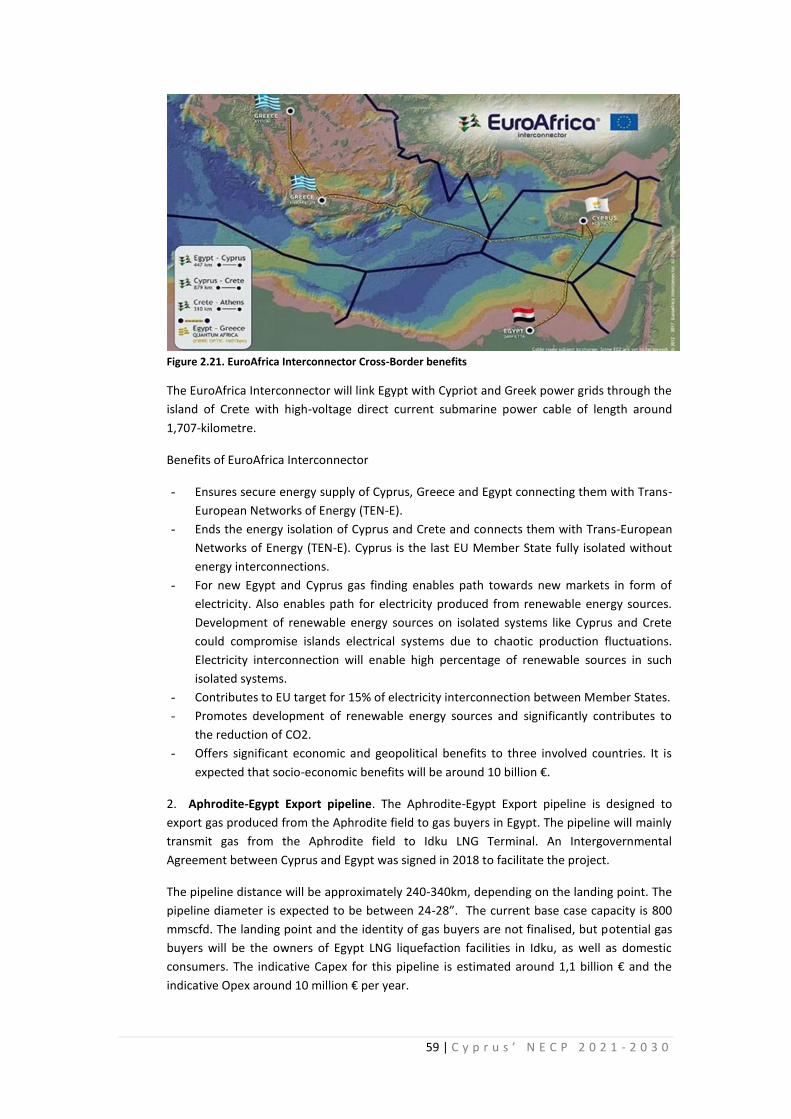
59 | C y p r u s ’ N E C P 2 0 2 1 - 2 0 3 0
Figure 2.21. EuroAfrica Interconnector Cross-Border benefits
The EuroAfrica Interconnector will link Egypt with Cypriot and Greek power grids through the
island of Crete with high-voltage direct current submarine power cable of length around
1,707-kilometre.
Benefits of EuroAfrica Interconnector
- Ensures secure energy supply of Cyprus, Greece and Egypt connecting them with Trans-
European Networks of Energy (TEN-E).
- Ends the energy isolation of Cyprus and Crete and connects them with Trans-European
Networks of Energy (TEN-E). Cyprus is the last EU Member State fully isolated without
energy interconnections.
- For new Egypt and Cyprus gas finding enables path towards new markets in form of
electricity. Also enables path for electricity produced from renewable energy sources.
Development of renewable energy sources on isolated systems like Cyprus and Crete
could compromise islands electrical systems due to chaotic production fluctuations.
Electricity interconnection will enable high percentage of renewable sources in such
isolated systems.
- Contributes to EU target for 15% of electricity interconnection between Member States.
- Promotes development of renewable energy sources and significantly contributes to
the reduction of CO2.
- Offers significant economic and geopolitical benefits to three involved countries. It is
expected that socio-economic benefits will be around 10 billion €.
2. Aphrodite-Egypt Export pipeline. The Aphrodite-Egypt Export pipeline is designed to
export gas produced from the Aphrodite field to gas buyers in Egypt. The pipeline will mainly
transmit gas from the Aphrodite field to Idku LNG Terminal. An Intergovernmental
Agreement between Cyprus and Egypt was signed in 2018 to facilitate the project.
The pipeline distance will be approximately 240-340km, depending on the landing point. The
pipeline diameter is expected to be between 24-28”. The current base case capacity is 800
mmscfd. The landing point and the identity of gas buyers are not finalised, but potential gas
buyers will be the owners of Egypt LNG liquefaction facilities in Idku, as well as domestic
consumers. The indicative Capex for this pipeline is estimated around 1,1 billion € and the
indicative Opex around 10 million € per year.

60 | C y p r u s ’ N E C P 2 0 2 1 - 2 0 3 0
2.4.3. Market integration
i. National objectives related to other aspects of the internal energy market
such as increasing system flexibility, in particular related to the promotion
of competitively determined electricity prices in line with relevant sectoral
legislation, market integration and coupling, aimed at increasing the
tradeable capacity of existing interconnectors, smart grids, aggregation,
demand response, storage, distributed generation, mechanisms for
dispatching, re-dispatching and curtailment, and real-time price signals ,
including a timeframe for when the objectives shall be met;
Promotion of competitively determined electricity prices - Increase system flexibility
1. Revise the regulatory framework to increase the use of flexibility in distribution networks
and facilitate the market development of flexibility services with the objective of providing
solutions alternative to system expansion. Subject to the final provisions of the recast
Electricity Directive, allow the DSO to procure flexibility services, including congestion
management in their service area, especially from distributed generation, demand response
or storage and market participants (including those engaged in aggregation). The
specifications for the flexibility services shall be defined by the DSO in close cooperation with
CERA and the Cyprus TSO. The local flexibility markets shall be operated by the Market
Operator in close cooperation with the DSO. Preliminary timeframe for this Target is year
2020.
2. Remove market barriers in wholesale and retail markets to demand response and ensure
that independent aggregators can compete on a level playing field. Revise the regulatory
framework to define the technical modalities for the participation of Demand Response in
the electricity market, including the provision of balancing energy and ancillary services.
Demand Response should be able to participate in the wholesale electricity markets
(Forward and Day Ahead) as well as the Balancing Market and the ancillary services market
by their technical requirements for participation in these markets and the capabilities of
demand response. The Demand Response service shall be provided via Demand Service
Providers and shall include the participation of aggregated loads. The implementation shall
be based on "Supplier Compensation", either via the uncorrected or corrected model.
Preliminary timeframe for this Target is year 2022.
3. Revise the regulatory framework to expand aggregation. Currently, Market Rules allow for
the aggregation of RES-only generation and the size of the aggregated capacity is limited in
the range of a minimum 1MW up to a maximum of 20 MW. Subject to the final provisions of
the recast Electricity Directive, Market Rules will be revised to allow the aggregation of
sources of generation irrespective of the primary type of fuel or technology, of storage
systems as well as of the supply side (demand response). Aggregators shall be able to
participate at the wholesale energy market as well as the reserve and balancing markets.
Preliminary timeframe for this Target is year 2022.
4. Revise the regulatory framework to enable the participation of storage in the electricity
market. The provision of storage services should be market-based and competitive. Storage
services shall be critical to the provision of flexibility services. Subject to the final provisions
of the recast Electricity Directive, generators, aggregators and (self) consumers will be
allowed to own and operate storage systems and, therefore, buy on the Day-Ahead Market

61 | C y p r u s ’ N E C P 2 0 2 1 - 2 0 3 0
the energy to be stored, as well as to sell the stored energy on the Forward and Day-Ahead
Markets. Producers, aggregators and (self) consumers should be allowed to participate with
storage systems also to the Balancing Market. These systems may offer to the system
dynamic performance which is qualitatively superior to conventional generation. Specific
products for high-performance ancillary services could be defined (e.g. fast primary
regulation, synthetic inertia.), to be provided by storage systems and remunerated according
to a “pay-for-performance” scheme. Cyprus TSO to set up products for the participation of
energy storage, such as the provision of non-conventional ancillary services (e.g. synthetic
inertia, fast primary regulation). Preliminary timeframe for this Target is year 2021.
5. Introduction of dynamic-pricing retail contracts. Subject to the final provisions of the
recast Electricity Directive, Dynamic pricing retail contracts will be introduced gradually as
the installation of smart meters is roll out and the competitive electricity market becomes
operational. Cyprus shall provide the necessary regulatory framework to ensure that final
customers who have a smart meter installed can request to conclude a dynamic electricity
contract from a supplier that has more than 200 000 final customers. Suppliers with less than
200 000 final customers will not be obliged to offer dynamic-pricing retail contracts.
Preliminary timeframe for this Target is 2024-2025.
ia. If applicable, national objectives related to the non-discriminatory
participation of renewable energy, demand response and storage,
including via aggregation, in all energy markets including a timeframe for
when the objectives should be met;
1. Amendment of Priority Dispatch of RES and HECHP. Amendment of the TSRs to provide for
a correct interpretation of the concept of priority dispatch for RES and HECHP. Day-ahead
and upward balancing offers by RES and HECHP should be cleared before offers of other
sources with the same price; thus, RES and HECHP shall have priority only if they offer the
same price as other sources. Preliminary timeframe for this Target is year 2019.
2. Technical Biding Limits of RES and HECHP in the Balancing Market. The Regulator to permit
the submission of a Negative Priced Downward Offers in the Balancing Market, to provide an
incentive to RES to participate in downward balancing. Preliminary timeframe for this Target
is year 2019.
ib. If applicable, national objectives with regard to ensuring that consumers
participate in the energy system and benefit from self-generation and new
technologies, including smart meters;
As mentioned in Section 2.4.2, Cyprus intends to install Advanced Metering Infrastructure
(AMI) and Smart Meters to enable optimization and control of the distribution system,
increase the penetration of distributed renewable sources, enable aggregation of RES,
demand response and storage, increase direct final customer participation in all market
stages (active customers). The deployment of advanced metering infrastructure (AMI)
includes the roll-out of 400 000 smart meters.

62 | C y p r u s ’ N E C P 2 0 2 1 - 2 0 3 0
ii. National objectives with regard to ensuring electricity system adequacy, as
well as for the flexibility of the energy system with regard to renewable
energy production, including a timeframe for when the objectives shall be
met
Introduce a strategic (contingency) reserve mechanism to address short-term capacity
adequacy concerns. Subject to the final provisions of the recast Electricity Regulation, the
amended Trade and Settlement Rules introduce a strategic (contingency) reserve
mechanism. Units participating in this mechanism will be held outside the electricity market
and will be dispatched in case day-ahead and intraday markets have failed to clear and the
Cyprus TSO has exhausted all balancing resources. The TSO shall conduct Yearly Auctions for
the procurement of Contingency Reserve. The Contingency Reserve will be technology-
neutral, i.e. will allow the participation of DR, Storage and RES with the necessary technical
capability. Preliminary timeframe for this Target is year 2020.
iii. If applicable, national objectives to protect energy consumers and improve
the competitiveness of the retail energy sector
1. Introduction of Independent Comparison Tools including websites for smaller customers to
assess the merits of different energy offers available on the market. Subject to the final
provisions of the recast Electricity Directive, provide at least one independent comparison
tool to small customers (households and microenterprises with an expected yearly
consumption of below 100 000 kWh) in order to assess the merits of different energy offers
available on the market. The comparison tool will provide clear, concise and comprehensive
information by including the available offers in the whole market. The information given will
be trustworthy, impartial and transparent. The comparison tool will be operated by a
national authority or by a private company. Preliminary timeframe for this Target is 2020-
2021.
2. Right of customers to switch suppliers within a maximum of three weeks. Subject to the
final provisions of the recast Electricity Directive, amend national legislation to provide the
right to customers with the right of switching suppliers within a maximum of three weeks. By
no later than 2027, the technical process of switching supplier shall take no longer than 24
hours and shall be possible on any working day. Preliminary timeframe for this target is 2020-
2021.
3. Target regarding introduction of Energy Communities (see Article 16 of proposed recast
Electricity Directive). Subject to the final provisions of the recast Electricity Directive, amend
national legislation to provide a framework for the activation of energy communities, ensure
fair treatment, a level playing field and a well-defined catalogue of rights and obligation, such
as the freedom of contracting, supplier switching rules, distribution system operator
responsibilities, network charges and balancing obligation. The rights and obligations should
apply according to the roles undertaken such as the roles of final customers, generators,
suppliers, distribution system operators. Access to an energy community’s network should
be granted on fair and cost-reflective terms. Preliminary timeframe for this Target is 2020-
2021.
2.4.4. Energy poverty
Based on the provisions of Directive 2009/72/EC that «each Member State shall define the
concept of vulnerable customers which may refer to energy poverty and, inter alia, to the

63 | C y p r u s ’ N E C P 2 0 2 1 - 2 0 3 0
prohibition of disconnection of electricity to such customers in critical times...» the definition
of energy poverty which was transposed in the Electricity Law is:
«Energy poverty may relate to the situation of customers who may be in a difficult position
because of their low income as indicated by their tax statements in conjunction with their
professional status, marital status and specific health conditions and therefore, are unable to
respond to the costs for the reasonable needs of the supply of electricity, as these costs
represent a significant proportion of their disposable income».
The total number of beneficiaries who fall within the definition of energy poverty is 27000
representing approximately 3,1% of the total population and are eligible to apply and benefit
from all the existing measures such as:
(a) reduced prices on electricity tariffs (special electricity tariff 08) which is based on a
Ministerial Decision
(b) financial incentives (depending on the available budget) for installing a net-metering
Photovoltaic system
(c) financial incentives (depending on the available budget) for upgrading the energy
efficiency of their houses
(d) safeguarding the continuous supply of electricity, during critical periods, to those
vulnerable consumers that uninterrupted power supply is essential for reasons related to
their health
The above-mentioned number of beneficiaries who fall within the definition of energy
poverty is not considered significant and thus, no national indicative objective to reduce
energy poverty will be included in the Cyprus integrated national energy and climate plan.
It is noted that the number of vulnerable consumers who fall within the definition of energy
poverty and have applied and benefited so far (September 2018) from the above measures is
12888 representing 1,5% of the total population.
2.5. Dimension Research, innovation and competitiveness
i. National objectives and funding targets for public and, where available,
private research and innovation relating to the Energy Union including, if
appropriate, a timeframe for when the objectives shall be met;
The objective in research and innovation is the best possible production of research work
and innovative products and services that will help increase energy efficiency, energy
security, and renewable energy and tackle climate change. The research and innovation
related to energy and climate should at the same time add value to businesses and provide
useful insights for policy makers. In 2016 Cyprus has spent 95m Euros in research and
innovation which constitutes 0, 5% of the Gross National Product (GNP). The national target
is that investments in research and innovation will rise up to 1,5% of GNP in the near future,
which means an annual spending of 285m Euros. Considering the abovementioned, as well
as the investments that have to be done up to 2030 to reach national targets, annual
spending in research and innovation related energy and climate, for 2020 – 2030, has to be
raised to 15m Euros, while currently it doesn’t exceed 5m Euros.

64 | C y p r u s ’ N E C P 2 0 2 1 - 2 0 3 0
The Cabinet of Ministers decision of the 9th of October 2018 (Decision No. 85.833) has set
new Governance System of Research and Innovation. Energy and climate issues will be
examined and developed in this new framework and is expected to be a priority.
ii. Where available, national 2050 objectives related to the promotion of
clean energy technologies and, if appropriate, national objectives including
long-term targets for the deployment of low-carbon technologies, including
for decarbonising energy- and carbon-intensive industrial sectors and, if
applicable, for related carbon transport and storage infrastructure
The Working Group for Research, Innovation and Competitiveness is operating as a
consultation forum between the public sector, the private sector and academia to identify
priority areas of research and innovation that simultaneously will respond to the national
targets for decarbonization and the market needs. The Working Group is taking into account
the Strategic Energy and Technology Plan (SET-Plan), the Cyprus Smart Specialization
Strategy the feedback by the other Working Groups in the framework of NECP, and how
Cyprus could be positioned in the global market of research and innovation. The priority
areas will be set by the end of 2019.
iii. If applicable, National objectives with regard to competitiveness
Dependence on the import of petroleum products and extremely low performance in terms
of endogenous energy sources create a framework of reduced security in the continuous
supply of energy, and exposure of the economy to fluctuations of global oil price. The high
cost of supplying petroleum products significantly increases the cost of energy production.
Thus, energy costs are passed on to consumers with adverse social impacts and act as a
brake on growth, as it negatively affects the competitiveness of products and services.
Additionally, Cyprus electricity grid has no energy interconnections with other countries.
Isolation of the grid, and seasonality of demand caused by tourist industry, poses
unfavourable conditions to ensure adequate reserve power generation capacity.
Responding to the challenges is the decoupling of economic activity from the use of fossil
fuels by increasing energy efficiency first and then maximizing the use of RES. Development
of innovative technologies and energy saving systems in the built environment, transport and
other sectors will contribute towards this goal.

65 | C y p r u s ’ N E C P 2 0 2 1 - 2 0 3 0
3. Policies and measures
3.1. Dimension Decarbonisation
3.1.1. GHG emissions and removals
The majority of scholars today agree on the growing influence of the economy and society on
the earth's climate through activities such as fossil fuel burning, rainforest deforestation and
livestock farming. Recognizing the impact of human activities on the climate, the
international community agreed at the Rio Summit in Rio de Janeiro in 1992 with the United
Nations Framework Convention on Climate Change. Cyprus ratified the Convention in 1997.
The objective of the Convention is to stabilize concentrations of greenhouse gases in the
atmosphere at levels that prevent dangerous impacts on the climate from human activities.
In 1997 the Kyoto Protocol was adopted, which set legally binding greenhouse gas emission
limit values for the period 2008-2012. Cyprus has ratified the Kyoto Protocol as a state
without obligations to reduce or limit emissions. In 2012, at the Climate Change Summit held
in Doha, Qatar, the second binding period of the Protocol (2013-2020) was agreed. As part of
the EU's commitments (20% reduction in greenhouse gas emissions by 2020 compared to
1990), the Republic of Cyprus also assumed the national targets for a 21% reduction in
greenhouse gas emissions by 2020 relative to 2020 with 2005 from electricity, cement and
ceramics, and 5% in other sectors such as agriculture, transport, waste, etc., compared to
2005 levels.
Wanting to prepare for the post-2020 international negotiations, EU leaders agreed in
October 2014 to reduce greenhouse gas emissions by at least 40% by 2030 compared to
1990. This target for Cyprus corresponds to a reduction of greenhouse gas emissions by 42%
by 2030 compared to 2005 by electricity, cement and ceramics industries (ETS sectors), and
24% in other sectors such as agriculture, transport, waste, etc. (non-ETS sectors), compared
to 2005 levels.
The culmination of the collective efforts that took place in recent years to reduce greenhouse
gas emissions and hence to tackle climate change effectively by the global community is the
historic agreement reached in Paris in December 2015 at the 21st Session of the Parties to
the United Nations Framework Convention on Climate Change. The Paris Agreement entered
into force on 4 November 2016. Cyprus completed the ratification process of the Paris
Agreement on 4 January 2017.
The effects of climate change are becoming increasingly felt both in Europe and globally.
These are expected to be particularly serious for Cyprus, as climate change is already
evident; over the last 100 years there has been an increase in average temperature and a
decrease in average annual rainfall. The effects of climate change will not only continue but
will also increase over the next decades.
In view of the above, Cyprus is faced with the challenge of developing its economy in a way
that reduces greenhouse gas emissions, while taking appropriate measures and actions to
adapt to climate change.

66 | C y p r u s ’ N E C P 2 0 2 1 - 2 0 3 0
Climate change is a horizontal issue requiring the involvement and activation of almost all
Ministries of Cyprus, including the Ministry of Agriculture, Rural Development and
Environment, the Ministry of Energy, Trade, Industry and Tourism, the Ministry of Foreign
Affairs, the Ministry of Transport, Communications and Works, the Ministry of Labour,
Welfare and Social Insurance, the Energy Regulatory Authority and the Local Authorities. As a
result, the role of the Environment Department of the Ministry of Agriculture, Rural
Development and Environment as a national coordinator is upgraded and strengthened.
Additionally, an important factor in the effort is the continuous improvement of the
institutional framework.
Climate change mitigation is one of the main targets identified in the Cypriot strategy for
sustainable development launched by MARDE in 200715
. The objective of the strategy is the
development of a set of principles for the formulation of an action plan in line with
international challenges, and in accordance with EU policy directions and adjusted to the
specific national circumstances.
Strategic planning
In February 2014, the House of Parliament voted the Law on Fiscal Responsibility and Budget
Systems (FRBSL) no. 20(I)/2014, which covers a wide range of issues related to Management
of Public Finance. The goal was to introduce new principles for budgeting that strengthen the
flexibility of economic operators and the transparency of the use of state resources,
achieving measurable results. In this context, ministries have been asked to implement new
procedures for the preparation of a medium-term strategy plan and budgeting on the basis
of those activities to achieve their objectives.
The importance of climate change mitigation (and adaptation) for Cyprus is highlighted
through its inclusion as the first target of the strategic plan of the Department of
Environment and as one of the strategic goals of the Ministry of Agriculture, Rural
Development and Environment16
.
National Policies and measures
Given that Cyprus was a non-Annex I party to the UNFCCC until 2013, national policies and
measures for the reduction of greenhouse gas emissions have been developed for the first
time in 2007 for the implementation of EU Decision 280/200417
. Ever since, policies and
measures are reviewed, revised and updated every 2 years. The involved ministries are
presented in Table 3.1. The sections that follow present the policies and measures by sector.
Table 3.1. Involved ministries to climate change mitigation policies and measures
Ministry Issues
Ministry of Agriculture, Rural Development and Environment Agriculture
Forestry
Land use
Waste
15
http://www.un.org/esa/agenda21/natlinfo/countr/cyprus/nsds_2007en.pdf 16
http://www.moa.gov.cy/moa/agriculture.nsf/Stratigikos%20Sxediasmos%202016-2018%20EL%20-%20YpOik%20150901.pdf 17
Decision No 280/2004/EC of the European Parliament and of the Council of 11 February 2004 concerning a mechanism for monitoring Community greenhouse gas emissions and for implementing the Kyoto Protocol

67 | C y p r u s ’ N E C P 2 0 2 1 - 2 0 3 0
Ministry of Energy, Trade, Industry and Tourism Energy
Ministry of Transport, Communications and Works Transport
Ministry of Finance National budgets
Ministry of Interior Land use
i. Policies and measures to achieve the target set under Regulation [ESR] as
referred to in 2.1.1 and policies and measures to comply with Regulation
[LULUCF ], covering all key emitting sectors and sectors for the
enhancement of removals, with an outlook to the long-term vision and goal
to become a low emission economy and achieving a balance between
emissions and removals in accordance with the Paris Agreement
Several policies and measures affecting the abovementioned objectives originate at the EU
level, such as the fuel quality directive, emission performance standards for new vehicles, the
regulation on fluorinated greenhouse gases, the landfill directive and the common
agricultural policy. These are not described further here.
Further, several policies and measures targeting renewable energy and energy efficiency
affect the reduction of greenhouse gas emissions in Cyprus. An overview of key policies
affecting the national climate target to 2030 is presented in Table 3.2.
Several additional measures are under examination, especially for the transport sector
which are anticipated, to have considerable contribution to the reduction of greenhouse
gas emissions. These measures will be included in the final submission of the NECP.
Table 3.2. Overview of key policies affecting the national climate target to 2030
Cross sectoral Information
Energy Renewable Energy penetration
Energy Efficiency (including transport measures)
Natural gas in electricity production
Industry F-gases recovery
Agriculture Promotion of anaerobic digestion for the treatment of animal waste
Waste Reduction of waste to solid waste disposal sites from sorting at production
level
Reduction of organics to landfills
Increase of amount of organic wastes treated by composting
Promotion of anaerobic digestion for the treatment of the organic fraction
of the municipal solid waste
Biogas recovery from old sold waste disposal sites (deep unmanaged)
ENERGY
Please refer to sections 3.1.2, 3.2, 3.3 and 3.4.
INDUSTRY
The New EU F-gas Regulation adopted in 2014 and applies from 1 January 2015, aims among
others in preventing emissions of F-gases from existing equipment by requiring leakage
checks, proper serving and recovery of the gases at the end of the equipment's life. For the

68 | C y p r u s ’ N E C P 2 0 2 1 - 2 0 3 0
full implementation of this regulation in Cyprus a proper recovery system needs to be setup
and used in Cyprus. Given the high GWP of the F-gases, and their increasing contribution to
the national emissions, it is considered crucial for proper recovery to be implemented within
the following years.
Under provisions of Art. 9 of Regulation 517/2014/EC, on fluorinated greenhouse gases,
without prejudice to existing Union legislation, Member States shall encourage the
development of producer responsibility schemes for the recovery of fluorinated greenhouse
gases and their recycling, reclamation or destruction. Cyprus has recently adopted and
harmonized the above Regulation into Cypriot Law 62(I)/2016 and 46(I)/2017. The next step
is to forward a national Law regarding a producer’s responsibility scheme. The main provision
of this Law will follow the “polluter pays” principle and each producer will have to participate
in an appropriate scheme for management of f-gases that have been recovered for any
reason.
At the same time, under the provisions of the same scheme, certified technicians will be
encouraged to return to the scheme any fluorinated gases the have recovered, for a pre-
decided profit.
Box 4.8. Key information
Competent authority
Department of Environment, Ministry of Agriculture, Rural Development and Environment
Other involved authorities
-
Type
Legislative, compulsory
National legislation
Fluorinated greenhouse gases Law (No. 62(I)/2016 and 46(I)/2017)
Relevant EU legislation
Regulation on fluorinated greenhouse gases 517/2014
Measures towards attainment
- Implementation of “polluter pays” principle; each producer will have to participate in an
appropriate scheme for management of f-gases that have been recovered
AGRICULTURE
Anaerobic digestion technology may help to address two congressional concerns that
have some measure of interdependence: development of clean energy sources and
reduction of greenhouse gas emissions. Anaerobic digestion, as a way of converting
biomass to energy, has been practiced for hundreds of years. It is a technology that helps
to reduce waste, generate energy and cut down on carbon emissions. The general
performance of anaerobic digesters and the diversity of wastes which they can treat have
been increasing steadily as a result of new reactor design, operating conditions, or the
use of specialised microbial consortia, during the last decades. In Cyprus there are
currently operating more than 10 anaerobic digesters, of which the majority is at large
animal farms. All available studies show that there is a great potential in Cyprus to further
promote anaerobic digestion for the treatment of waste with high organic content.
Even though anaerobic digestion is not clearly stated in the European or national
legislation, the technology is preferred by large animal farms to comply with the terms

69 | C y p r u s ’ N E C P 2 0 2 1 - 2 0 3 0
stated on the wastewater and air emissions permits. The technology is strongly promoted
by the Department of Environment, especially for the large installations that fall under
the Industrial Emissions directive. Relevant national legislation that encourages the
promotion of anaerobic digestion is (a) the Control of Water Pollution (Waste Water
Disposal) Regulations 2003, Κ.Δ.Π. 772/2003; (b) the Control of Water Pollution (Sensitive
Areas for urban waste water discharges) Κ.Δ.Π. 111/2004. It is a voluntary measure which
is expected to increase. Therefore it is considered important to further promote the use
of anaerobic digestion for the treatment of animal waste.
WASTE
With the EU Landfill Directive being the main guiding force, in combination to the
improvement of the infrastructure of the country, Cyprus has developed and
implementing during the recent years the National Municipal Waste Management Plan of
2015-2021 which is currently undergoing a major revision18
. The implementation of the
strategy is the responsibility of the Department of Environment.
The National Municipal Waste Management Plan of 2015-2021 (MWMP) contains
quantitative and qualitative targets and enumerates specific measures and actions to be
taken in order for the EU targets to be reached. One of the quantitative target is that no
more than 95,000 tonnes of biodegradable waste to be disposed in landfills (represents
the 35% target of the 1999/31/EC directive). Also the Legal Measures will be focused on
the:
- Development of local waste prevention and management schemes
- Mandatory obligation for establishing separate collection systems by local
authorities,
- Establishment of extended producer responsibility (EPR) in streams other than
packaging waste,
- Establishment of a landfill tax/levy,
- Banning the disposal of certain waste streams from entering into landfills (e.g. green
waste, high calorific value waste, etc.)
The adaptations of the strategy that are envisaged:
a) One Sanitary Landfill and one Residual Sanitary Landfill (supplementing MBT unit at
Koshi) were constructed and operated (both meet the requirements of directive
99/31/EC). The MBT unit was constructed and operated from 01/04/2010 serving
Larnaca - Ammochostos districts. The Plant was designed in a way that a high
separation of recycled and biodegradable material is achieved. Another I.W.M.P
(Integrated Waste Management Plant) serving Limassol district is expected to be
operated by the year 2018.
b) The construction of the Green Point Network (22 collection points for the depositing
of various waste streams out of households – bulky waste, green, textile, furniture,
WEEE, etc.) is competed. The 4 Green Points, serving Paphos district are operated and
the rest expected to be operated by 2018.
c) Separate collection at source was promoted at households, from the existing
collective system for the packing waste serving also and all types of paper, created
under the packaging directive while the competent authority promotes the separate
18
The final plan is expected to be available at the end of 2019

70 | C y p r u s ’ N E C P 2 0 2 1 - 2 0 3 0
collection from other household streams such as other organic waste e.g. food and
green waste.
d) The construction works for the rehabilitation/restoration of the old non approved
landfills, which are closed at Paphos and Larnaca - Ammochostos districts, were
completed. The preparation of studies/documents regarding the rehabilitation/
restoration of the 20 non sanitary landfills of Nicosia district and the 44 sanitary
landfills of Limassol district will be completed within 2018 and after that the
construction works will begin.
A comprehensive study was undertaken in 2005 for the elaboration of a Strategic Plan, an
Environmental study and a Feasibility study for the restoration and management of
landfills. The purpose of the study was to record all landfills, assess their status and level
of risk, create a restoration priority list based on pollution risk assessments, and
undertake the appropriate environmental studies as well as feasibility studies for the
restoration of the prioritised landfills. These studies were a necessary step for the
restoration of all landfills recorded.
Two (2) landfills are still active in Cyprus but arrangements are made in order to be closed
and restored. According to recent data, these two landfills are fed with approximately
155,000 ton and 200,000 ton of municipality waste each year respectively (reference year
2012).
Sixty two (62) non sanitary landfills are planned to be restored appropriately within the
following years. According to the preliminary study contacted in 2005, these landfills
contain approximately 597,269 m3 of solid waste excluding 2 major landfills that have not
been closed yet.
Fifty three (53) landfills have been restored the last five years and are being monitored.
During their restoration a total of 4,902,000 m3 of solid waste were reallocated and
properly buried using composite liners and leakage collection systems.
The key features of the strategy that have been included in the GHG reduction Policies
and Measures are the following:
- Reduction of waste to solid waste disposal sites from sorting at production level
- Reduction of organics to landfills
- Increase of amount of organic wastes treated by composting
- Promotion of anaerobic digestion for the treatment of the organic fraction of the
municipal solid waste
An additional measure considered and not included in the solid waste management
strategy is biogas recovery from old landfills, during their restoration.
Climate Change and Forests

71 | C y p r u s ’ N E C P 2 0 2 1 - 2 0 3 0
The island has already been affected by climate change and consequently the forests
suffer by the prolonged droughts which put the forest ecosystem under serious water
stress and high fire risk.
The Department of Forests adopts and applies actions aiming to the adaptation of forest
stands (natural and artificial) to climate change. The strategic intention "Protection of the
environment and promotion of resource efficiency” is achieved through the protection of
forests from fires, overgrazing, human interventions and other biotic and abiotic factors
that affect them. Additionally, these actions contribute to the reduction of greenhouse
gas emissions and increase carbon sequestration. These actions can be grouped into
three main areas as listed in the Statement of Forest Policy:
a) Protecting forests against forest fires,
b) Adaptation of forests to climate change and enhancing the contribution of forests in
addressing climate change and improvement of main forests and forested areas,
c) Improvement and expansion of forests.
The above actions include the following measures:
a) Maintenance and improvement of biodiversity in forests. In particular, the
conservation of biodiversity is enhanced by the protection of flora and fauna and the
protection and restoration of their habitats,
b) Protection of forests from illegal logging: The implementation of Law 139 (I) / 2013
acts as a tool to control most of the available firewood locally and apply criminal
penalties for any illegal or uncontrolled logging and / or disposal of the local timber
market without authorization,
c) Reforestation of Amiantos (asbestos) Mine as well as restoration of abandoned
mines in cooperation with the Competent Authorities (the Department of Geological
Survey and the Mines Service),
d) Protection of forests and enhancement of their structure and resistance to climate
change through the Rural Development Program 2014 – 2020.
In particular, through the Rural Development Program 2014 - 2020, a number of activities
and actions have been promoted under Measure 8 (Investments in forest area
development and improvement of the viability of forests). The Action 8.5.3 includes
thinning operations in dense forest stands, with the purpose of improving the structure
of forests, the adaptation of forest stands to climate change, the reduction of emissions
and increase the absorption of greenhouse gases. The implementation of targeted
thinning is expected to improve stability and resilience to other disturbances, such as
drought, increase of temperature and prolonged heat waves (as a result of climate
change).
Additionally the Department of Forests participates in European and International co-
funded projects (LIFE+, Interreg etc.) which aim to protect threatened species and
ecosystems from the impacts of climate change and succeed their adaptation and
sustainable management.

72 | C y p r u s ’ N E C P 2 0 2 1 - 2 0 3 0
ii. Where relevant, regional cooperation in this area
iii. If applicable, without prejudice to the applicability of State aid rules,
financing measures, including EU support and the use of EU funds, in
this area at national level
3.1.2. Renewable energy
i. Policies and measures to achieve the national contribution to the
binding EU-level 2030 target for renewable energy and trajectories as
referred to in Article 4(a)(2), and, if applicable or available, the
elements presented in 2.1.2 including sector- and technology-specific
measures
Cyprus Government has development various support schemes, incentives and soft
measures over the period 2008-2018 in order to further support the Renewable Energy
Sources penetration. Especially in the Electricity Sector where the penetration was very
low, a lot of support schemes have been developed over the period.
Based on the various incentives the broken down generation, by technologies and the
renewable based electricity production over the past 10 years in Cyprus is listed in the
table below.
Table 3.3. Electricity Generation per Technology until 2017
Electricity production from renewable
sources (GWh per year) Solar Wind Biogas Total
2008 2.55 0 11.54 14.09
2009 3.83 0 26.52 30.35
2010 6.39 31.37 35.12 72.88
2011 11.94 114.31 51.61 177.86
2012 21.54 185.48 50.02 257.04
2013 47.11 231.04 48.86 327.01
2014 83.59 182.85 50.55 316.99
2015 126.66 221.86 51.24 399.76
2016 147.65 226.7 52.02 426.37
2017 173.73 211.45 51.91 421.68
In the table below, broken down by technologies and how much was the electricity produced
from renewable sources sold at a subsidized price over the past 10 years, is shown. The
electricity generated for own consumption is not included.
Table 3.4. Renewable electricity sold at a subsidized price (GWh per year) until 2017.
Solar Wind Biogas Total
2008 1.64 0 7.81 9.45
2009 2.91 0 19.85 22.76
2010 4.59 31.37 24.8 60.76
2011 9.16 114.25 39.71 163.12
2012 18.65 185.05 37.63 241.33
2013 43.82 230.61 35.83 310.26
2014 60.11 182.42 37.46 279.99

73 | C y p r u s ’ N E C P 2 0 2 1 - 2 0 3 0
2015 85.75 221.43 37.41 344.59
2016 94.41 226.27 36.61 357.29
2017 111.36 211.02 36.5 358.88
From 2016 onwards all the new installed RES projects (PV Parks) they are not receiving any
subsidy.
Table 3.5, shows the broken down cost, by technologies and the actual subsidy payed to
renewable energy producers.
Table 3.5. Subsidy paid to RES Producers in million Euro per Year
20
08
20
09
20
10
20
11
20
12
20
13
20
14
20
15
20
16
20
17
Solar 0.03 0.1
35
0.055
1.365
2.369
4.402
9.624
11.349 14.005 11.957
Wind 0 0 0 3.607
2.223
5.725
10.433
19.637 24.815 18.299
Biogas* 0.122
0.696
0 0 0.266
1.565 1.783
1.222
*In 2013-2014 the market Price was higher than FiT Price for Biomass Projects. The excess
amount was return to RES and Energy Efficiency fund.
In addition, in the table below there is an analysis broken down by technologies and the
specific subsidy of the electricity produced from renewable sources in Cyprus over the past
10 years.
Table 3.6. Subsidy per renewable energy source in Cyprus for the period 2008-2017
Specific
subsidy of
the
renewable
electricity
(EUR/MWh)
2008 2009 2010 2011 2012 2013 2014-2017
Solar Households
Option 1:
0.205€/kWh + 55%
Option 2:
0.383€/kWh 15 years
contract
Commercial
Option 1:
0.205€/kWh + 40%
Option 2:
0.335€/kWh 15 years
contract
Households
Option 1: 0.225€/kWh
+ 55%
Option 2:
0.383€/kWh 15 years
contract
Commercial
Option 1: 0.205€/kWh
+ 40%
Option 2:
0.36€/kWh (≤ 20kW)
Option 3: 0.34€/kWh
(21-150kW) 20 years
contract
0.31€/kWh
(21-150kW)
20 years
contract
Households
0.28€/kWh
(≤7kW) 15
years contract
Commercial
0.25€/kWh
(≤150kW) 20
years contract
Commercial
0.138€/kWh
(21-150kW) 20
years contract
No FiT
Scheme for
net-metering
and self-
generation
Wind 0.166€/kWh
20 years contract
0 0.145€/kWh
20 years
contract
Biomass 0.108€/kWh 20 years
contract
0.135€/kWh
20 years contract
Biogas 0 0.1145€/kWh
20 years contract
Hydro 0 0 0 0 0 0 0
It should be also noted that as of 2015, all the new support schemes for Electricity
production will receive the so-called avoidance cost, which corresponds to an ideal marker
price. The scheme will continue until the full liberalization of the market, where the new
subsidized electricity and the subsidies paid to producers in provided through avoidance

74 | C y p r u s ’ N E C P 2 0 2 1 - 2 0 3 0
cost. The current selling price for electricity produced by renewable sources (avoidance cost)
is available in the following link:
https://www.eac.com.cy/EL/EAC/RenewableEnergySources/Pages/resenergypurcheac.aspx.
Electricity for own Consumption
Support schemes for the production of electricity from renewable energy sources for own
use such Net-metering, net-billing and self-consumption have been implemented since 2013
as national policy to promote RES electricity. Currently the Net-metering category is applied
for small scale photovoltaic systems with capacity up to 10KW, for all consumers (residential
and non-residential). The scope of the net-metering is to provide the option to residential and
small commercial consumers to cover all or part of their electricity consumption from a PV.
The generated RES electricity is subtracted from building’s electricity consumption.
Consumers pay only for the difference between the energy consumed and energy produced
(net electricity used) plus a cost that reflects the cost of the electricity grid to support
continuous supply and taxes (VAT, RES levy).
The above scheme is expected to continue, with some modifications in the near future in
order to enhance better the self-consumption for small systems.
Self-generation / Net billing
With Self-generation and Net-billing schemes, PV generated energy has to be self-consumed
within the same 20-min time period it was generated. If local energy demand exceeds PV
production, energy is imported from the grid. With Self-generation scheme, excess PV
generation is exported to the grid without any economic compensation nor additional fee. A
compensation for excess energy is foreseen by the Net-Billing scheme. The size of these
systems is basically unlimited (up to 10MW). Some existing burdens that exist (i.e. the long
procedure needed for town planning or building permit), is expected to be overcome in the
following years. This support scheme is the most effective for all industrial and commercial
consumers, since the self-consumer is almost excluded for all the taxes for the energy that is
self-consumed.
Development of a specific Software tool to perform technical and economical evaluations
of simple energy systems taking into account Cyprus’s regulatory and tariff
context/framework.
In order to enhance the above schemes (net-metering, net-billing and self-consumption), a
software tool will be developed and provided free of charge to both energy consultants and
to the end users. With this tool (that will be monitored and maintain from the government),
the end user can have an indication of what size system to install that can make economic
sense. On the other hand the advance mode of the software tool, will give some more
insights to the consultants in order to advice better the pronsumers in other sectors as well
(Energy efficiency, storage, etc.) .
The operation of the energy system will be simulated by making energy balance calculations
in each time step (interval) of the year. For each time step, the SW tool compares the
electricity demand to the energy that the system can supply in that time step, and calculates
the flow of energy to and from each component of the system and the corresponding cash
flows. For systems that include batteries, SW tool will determine in each time step whether
to charge or discharge the batteries.

75 | C y p r u s ’ N E C P 2 0 2 1 - 2 0 3 0
Software tool estimates also the cost of installing and operating the system over the lifetime
of the project, defined by the user as an input. Economic and Financial calculations account
for costs such as initial investment, replacement, operation and maintenance, network fees
and tariffs, RES incentive schemes etc.
New Forecasting Tool that will help further the penetration for RES
At a basic level Variable Renewable Energy (VRE) forecasting aims to predict the generation
of renewable energy technologies with variable outputs that are strongly affected by
weather (wind, sunshine, etc.). VRE forecasting was first developed for use by the wind
power industry but has been adapted to provide forecasts for solar technologies including PV
and CSP. Modern VRE forecasting has achieved a high level of accuracy through a
combination of models and analysis tools that use historic and real-time weather
observations along with characteristics and real-time generation of VRE assets to predict VRE
power generation. VRE generation can be forecast across numerous different time scales,
from minutes to hours to days and across various system scales, from single wind turbines to
PV panels to CSP units up to regional systems with gigawatts of generation capacity.
Due to the isolation of the island and the various weather phenomena in Cyprus,
deterministic numerical weather prediction (NWP) model forecast can provide useful
information for decision-making.
Ministry of Energy has requested a Technical Assistance, through SRSS, in order to improve
and correlate all the existing forecasting models in an effort to create a new weather to
energy model tool for RES that will participate to the market and also for the Transmission
System Operator for the smoother penetration of Renewables. One important aspect that
will need to be indentified and examine, is the dust forecast prediction, which occurs vary
often in the Area of Cyprus.
Forecasting aims to provide an accurate prediction of when and how much power VRE assets
will generate at a given time in the following hours (i.e. up to 6 hours), along with an
associated probability. This information will support TSO in reducing VRE integration costs
and assists utilities and independent power producers (IPP) in more efficient operation of
VRE assets, which increases revenue and makes VRE more attractive to investors as it was
highlighted in IRENA study.
In general forecasting will help to increase the share of VRE generation that can be safely and
economically integrated into an electricity grid.
Alternative fuels – Biofuels in transport
Biofuels are liquid or gaseous transport fuels such as biodiesel and bioethanol which are
made from biomass. They serve as a renewable alternative to fossil fuels in the EU's
transport sector, contributing to reduction of greenhouse gas emissions and improvement
the EU's security of supply. Each member state is obliged to fulfil two obligatory targets by
2020, setting by the relevant EU Directives, 2009/28/EC and 2009/30/EC: 10% of the energy
consumption of transport sector comes from renewable sources such as biofuels, and fuel
suppliers are required to reduce the greenhouse gas intensity of the transport fuels that they
enter in the market by 6% compared with the fuel baseline standard (greenhouse gas
emission of EU transport fuels mix in 2010). Currently, the percentage of biofuels to
transport fuels is at 2.5% and the greenhouse gas emission reduction is at 1%. These targets
will gradually be increased until 2020 in order to meet the obligatory targets.

76 | C y p r u s ’ N E C P 2 0 2 1 - 2 0 3 0
The European Directive 2014/94/EU on the Deployment of Alternative Fuels Infrastructure
establishes a common framework for measures to develop the market for alternative fuels in
the transport sector and the implementation of relevant infrastructure within the Union in
order to minimize dependence on liquid minerals and reduce the environmental impact in
the transport sector. Within the framework of the directive, which sets practical goals, the
development of the market and related infrastructure for the use of electricity, liquefied
natural gas (LNG), compressed natural gas (CNG) and hydrogen in transport is specifically
promoted. Directive 2014/94/EU is a tool to meet the mandatory 2020 target for road
transport, i.e. (a) 10% energy from RES in transport (Directive 2009/28/EC) and b) 6 %
reduction in greenhouse gas emission intensity in the life cycle of road transport fuels
(Directive 2009/30/EC). The competent authority for the achievement of those targets is the
Ministry of Energy, Trade, Industry and Tourism. A National Policy Framework describing
national targets and guidelines, support actions and policies for the development of
alternative fuels and the necessary infrastructures was prepared by the Ministry of
Transport, Communications and Works in cooperation with the Ministry of Energy,
Commerce and Industry.
Charging points and infrastructures for electric vehicles have been installed in public
buildings and in public roads. There are currently 18 double charging stations in Cyprus: 6
charging stations in Nicosia, 5 in Limassol, 2 in Larnaca, 2 in Ammochostos and 3 in Paphos.
Additionally, the Department of Electromechanical Services is proceeding to the installation
of 10 high charging stations in high ways and public roads. Although the numbers are still
very small, the expectation is that the registration of electric cars will increase considerably
over the next five years. New electric car sales are expected to comprise 25%-50% of total
vehicles on the road by 2040.
The installation of LPG systems in vehicles and LPG refuelling points in retail stations have
also started in 2017 and will reduce the emission of pollutants and fuel consumption in old
vehicles.
ii. Where relevant, specific measures for regional cooperation, as well as,
optionally, the estimated excess production of energy from renewable
sources which could be transferred to other Member States in order to
achieve the national contribution and trajectories presented in 2.1.2
Cyprus, in the basic reference scenario is remaining isolated (see below all possible
scenarios). Even if this might not be the case, at the time being is premature to plan and
design specific measures for regional cooperation. Cyprus Authorities, will prepare a scenario
for the national contribution and trajectories for exchanging energy with other neighbouring
countries like Greece and Israel while with latter is very difficult to obtain information.
After analysing all the possible options for Cyprus and due to various uncertainties and
political decisions, as well as various externalities, it was decided that the scenario with
existing measures that it will be adopted for the current NECP is as shown below:

77 | C y p r u s ’ N E C P 2 0 2 1 - 2 0 3 0
Figure 3.1. Policy Decision Tree and Scenario’s With Existing Measures (WEM) and 3 possible
pathways With Additional Measures (WAM)
Current Cyprus Energy System 2018
No imported Natural Gas
Cyprus Remains Electrical Isolated
Central Storage Available (Pumped) + Distribution Storage
WAM (1)
Cyprus Electrical Interconnected
Indigenous gas exported via LNG
terminal and available for Power
High RES & Energy Efficiency Scenario
(WAM 2)
Gas (imported) Available
Cyprus Remains Electrical Isolated
Distributed Storage and Gas in
Transportation
High Energy Efficiency
WEM
Cyprus Electrical Interconnected
Gas or EVs in Transport & Energy
Efficiency +RES additional measures
WAM (3)
2018
2020
2023
2024
2030

78 | C y p r u s ’ N E C P 2 0 2 1 - 2 0 3 0
iii. Specific measures on financial support, where applicable including EU
support and the use of EU funds, for the promotion of the production and
use of energy from renewable sources in electricity, heating and cooling,
and transport
iiibis. When applicable, the assessment of the support for electricity from
renewable sources that Member States have to carry out pursuant to
Article 6 (1b) of the Directive XXXX on the promotion of the use of energy
from renewable sources.
iv. Specific measures to introduce one or more contact points, streamline
administrative procedures, provide information and training, and facilitate
the uptake of power purchase agreements
v. Assessment of the necessity to build new infrastructure for district heating
and cooling produced from renewable energy sources
vi. If applicable, specific measures on the promotion of the use of energy from
biomass, especially for new biomass mobilisation taking into account:
3.1.3. Other elements of the dimension
i. If applicable, national policies and measures affecting the EU ETS sector
and assessment of the complementarity and impacts on the EU ETS
iii. Policies and measures to achieve other national targets, if applicable
iv. Policies and measures to achieve low-emission mobility (including
electrification of transport)
iva. If applicable, national policies, timelines and measures planned to phase
out energy subsidies, in particular for fossil fuels
3.2. Dimension Energy efficiency
The existing and additional policies and measures for energy efficiency are described below.
It should be clarified that for the draft NECP, policies and measures are not spitted/allocated
to points 3.2 i to vii of the Annex I, Part1 of the Governance regulation). Related tables on
policies and measures are included in the provided template. A summary table on the
existing and additional polices and measures on energy efficiency is attached in Appendix II
(in greek).
Existing policies and measures
The energy saving measures planned by 2020 and those that have been implemented in the
previous years in each sector and those that will be implemented by 2020 (buildings sector,
transport sector, residential sector, tertiary sector, public sector and industrial sector) for
achieving the national target, as well as all legislative and non-legislative measures at
national level for the promotion of energy efficiency.

79 | C y p r u s ’ N E C P 2 0 2 1 - 2 0 3 0
The major implemented/ ongoing measures are:
Legislative measures (implemented /ongoing)
Minimum energy performance requirements for new buildings, buildings that
undergo major renovation and building elements that are retrofitted.
Legislation that defines the technical requirements of Nearly Zero Energy Buildings.
Compulsory issuing of Energy Performance Certificates (EPC) for new buildings and
buildings that are sold or rented.
Compulsory inspection of large air conditioning systems and heating systems with
boiler.
Requirements for technical building systems installed in existing buildings
Legislation for the qualification of technical building systems installers
Legislation for promotion of combined heat and power generation systems and high
efficiency standards in heating and cooling systems.
Legislation for energy efficiency (energy efficiency in public sector, energy efficiency
in metering and billing, in transformation, transmission and distribution, energy
audits etc)
Legislation for regulating the market for energy auditing in buildings, industries and
transport and the operation of Energy Service Companies (ESCOs)
Legislation for energy labeling and market surveillance
Legislations for setting up energy efficiency obligation scheme for energy companies
Information and training measures (implemented/ongoing)
Training and Licensing of Energy Auditors.
Licensing of ESCOs.
Training of Energy Managers.
Training and Licensing of Qualified Experts (Issuing Energy Performance Certificates
of buildings).
Certification s of small scale Renewable Energy Sources installers.
Training and licensing of technical building system installers
Licensing of Heating Systems Inspectors.
Licensing of Air-conditioning Systems Inspectors.
Promoting the role of energy managers within business. The energy manager
monitors energy use in a business and promotes the implementation of actions to
reduce energy consumption.
Promotion of energy management system
Training of Energy Saving Officer in the public sector. About 700 officers are
assigned on government owned buildings. They are responsible for energy efficiency
in each public building and they report back on the measures and savings achieved
annually.
Annual information campaigns for energy efficiency. The campaign uses the logo
“Save energy-Save money”
Annual competition for schools for promoting Energy Efficiency, 5 radio spots
broadcasted by radio stations all over Cyprus, leaflets, workshops, annual fairs,
lectures. Information actions promote energy efficiency investments, energy
performance certificates, energy audits and energy performance contacting.

80 | C y p r u s ’ N E C P 2 0 2 1 - 2 0 3 0
More targeted awareness increase actions are implemented in 2018 and 2019 with
technical assistance provided by EU (SRSS and Environment Agency Austria and
Cyprus Energy Agency), in order to increased awareness of enterprises, industries,
citizens, local authorities and journalists of the importance of energy efficiency and
of opportunities to save energy and take steps towards saving energy. It will include:
an electronic tool (in web-based user-friendly interface) for the calculation of energy
savings that will enable households to have a clear view on cost effectiveness of
potential energy saving measures, the establishment of the Energy Efficiency
Network of enterprises and industries and Event-based awareness campaign for
citizens, local authorities and journalists. Performance indicators will be used to
evaluate their effectiveness.
Public financing schemes and other financial Measures (implemented/ongoing)
53 million euro has been secured by the European and Structural Funds 2014-2020
for grant schemes and projects for energy efficiency investments in private and
public buildings. 33 million euro will be allocated for improving the energy efficiency
for buildings used by SMEs and households while, the remaining amount will be
allocated for improving the energy efficiency in central government public buildings.
Moreover, 1,17 million Euro have been secured from the EU structural and cohesion
funds for the period 2014-2020 for pilot projects of combined heat and power
generation in public and semi-public buildings. The projects in public sector have
started in 2018.
The Ministry of Energy, Commerce and Industry (MECI) announced in 2017, the
operation of a support scheme for the installation of cogeneration systems fueled
by biomass/biogas for the production of electricity for self-consumption. MECI
announced a support scheme based on net-billing principle for the installation of
High Efficiency combined heat and power generation with capacity up to 5MW.
A support scheme (Saving – Upgrading) was enacted in 2015 for the energy
renovation of existing houses and existing buildings owned or used by small and
medium enterprises utilizing European and Structural Funds 2014-2020 (33 million
euro). The support scheme provides direct grants for the application of thermal
insulation and other energy efficiency measures in buildings that will upgrade their
energy class on the building’s Energy Performance Certificate to at least B or achieve
energy saving of at least 40% or upgrade the building to the nearly zero energy
level. A 2nd
phase of a scheme was announced in 2018 providing grants for energy
efficiency upgrade for households and multifamily buildings (European and
Structural Funds 2014-2020)
Support scheme “Solar Energy for All” for on-the-site production and consumption
of RES for own use which provides: (a) the installation of Net-metering photovoltaic
systems with capacity up to 5KW connected to the grid for all consumers
(residential and non-residential) and (b) the self-generation systems with capacity
up to 10MW for commercial and industrial consumers.
Support scheme for the replacement of old solar domestic hot water heating
systems (f national funding).
Energy poverty, vulnerable consumers’ categories and measures to protect them
were defined in a Ministerial Decree which entered into force in 14/9/2015. The
Ministerial Decree includes measures such as (a) reduced prices on electricity tariffs,
(b) financial incentives for participating in a scheme for installing a net-metering

81 | C y p r u s ’ N E C P 2 0 2 1 - 2 0 3 0
Photovoltaic system with a capacity of up to 3kW, (c) financial incentives for
upgrading the energy efficiency of their houses, and (d) uninterrupted supply of
electricity, during critical periods for those vulnerable consumers that continuous
power supply is essential for reasons related to their health.
Grant Scheme for the insulation of the roofs in the residential sector
Grant Scheme for conducting energy audits in SMEs
Establishment of a new energy efficiency revolving fund /soft loan Financing
Instrument to promote investments in the fields of Energy Efficiency and Renewable
Energy Sources, targeting small and medium-sized enterprises, public bodies and
households (managed by the EIB, state’s financial contribution € 40 million for 2019,
funding is 85% from the European Commission and 15% of national participation)..
Private financing institutions offer financing for energy efficiency investments, such
as the energy loans for thermal insulation, for energy efficiency upgrade of buildings
etc.
In the framework of two new Interregional European programs between Cyprus and
Greece (SYNERGEIN and STRATENERGY), 11 buildings in municipalities and wider
public will be energy upgraded in the period 2018-2020.
Targeted energy efficiency measures in public buildings
Establishment of an energy efficiency network with voluntary agreements with
businesses
Financing measures for energy efficiency investments in existing hotels
Financing measures in agriculture
Targeted measures in transportation and Integrated Fleet Management Systems
street lighting projects-replacing existing lamps / lighting fixtures in road lighting
systems with new, more efficient ones
Incentives for new buildings with higher energy efficiency than EPBD requirements-
new buildings and buildings renovated can receive a 5% extra building factor if they
achieve higher energy efficiency than the minimum mandatory levels provided by
the legislation
Reduced VAT for energy efficiency retrofits of households - applying a lower VAT
rate (5 %), instead of 19 %, for renovation and repair works carried out in existing
private dwellings. The lower rate is used, inter alia, for works consisting in applying
thermal insulation on the external envelope and replacing external door and
window frames.
Targeted energy efficiency measures at schools
Increasing tax on electricity consumption for energy efficiency and renewables
For the transport sector: measures to increase the use of a bicycle, to increase the
use of public transportation, integrated fleet management system in governmental
fleet, training and information on eco-driving etc.
Excise duty on vehicles with a view to reducing CO2 emissions. This measure
relates to the tax imposed on vehicles with a view to reducing CO2 emissions
Policies and measures for period 2021-2030
An In-Depth Assessment of the Energy Efficiency Potential in Cyprus has been conducted in
the framework of a Technical Assistance project for the government of Cyprus and the aim
was to assess the maximum theoretical and economically viable energy efficiency potential in
Cyprus. A final energy demand forecast model was employed, which was specifically
developed for the energy system of Cyprus. The model calculates future annual energy

82 | C y p r u s ’ N E C P 2 0 2 1 - 2 0 3 0
consumption in each major economic sector of Cyprus (agriculture, cement industry, other
industry, households, services, road passenger transport, road freight transport and air
transport) as a function of future macroeconomic variables and energy prices. It also
calculates fuel shares in each sector, depending on technology costs (investment, operation,
maintenance and fuel costs), the penetration potential of various technologies and technical
constraints for the uptake of new technologies, and allows computing future final energy
consumption by sector and fuel. A large part of the input data used in this top-down forecast
model was derived from detailed simulations of building energy demand for a number of
representative residential and commercial buildings, using the EnergyPlus model. In this way
a reconciliation of engineering with economic calculations was achieved. Three distinct
scenarios were designed: a reference scenario, which incorporates all policies adopted until
early 2016; a ‘realistic scenario’, which assumes the implementation of cost-optimal
measures in all economic sectors under a modest deployment of financial resources; and a
much more ambitious ‘maximum technical potential scenario’, which assumes an
unprecedented mobilisation of financial and human resources that could lead to a deep
renovation of all existing buildings and a substantial penetration of alternative fuels in
transport. After an interval between 2013-2018, where energy use patterns were affected by
the significant economic downturn of years 2013-2015, it is projected that overall energy
intensity in Cyprus will continue its downward trend in the coming decades, mainly as a
result of improved energy performance of buildings in the residential and tertiary sector.
Road transport, which currently accounts for 40% of final energy demand, is expected to
demonstrate a decline in energy intensity too, but a slower pace since it exhibits great inertia
and thus a shift towards more use of public transport modes will take a long time to
materialize. In line with the real-world financial and technical capacity of Cyprus, the Realistic
Scenario foresees a small or modest improvement in the intensity of energy use. Under this
scenario, an assessment of the cost-effectiveness of the different Energy Efficiency
interventions is performed in order to illustrate the optimum mix of these interventions. This
is done on the basis of their cost efficiency and affected number of end-users as well as to
their attractiveness for the end-users and also from a macroeconomic perspective. Overall,
the expected expenditure (capital cost), only for energy efficiency interventions for the
household and service sector until 2030, in order to meet the targets resulted out of the
realistic scenario which is considered as the energy efficiency scenario (additional measures),
amount to at least 1 billion € and this is translated to a mean weighted ratio of annual
investments at the level of around 0.33% of the estimated GDP over the 2018-2030 period.
To exploit the considerable potentials in the different sectors the main barriers preventing a
broader uptake of energy efficiency measures limited financial support on the one hand and
interest of final consumers on the other will be adequately addressed in the post 2020
period.
The regulatory framework will be further adjusted in order to establish a secure, consistent
and market-oriented framework for energy efficiency interventions mainly targeting the
building sector and to a less extent the transport sector. More emphasis will be put on issues
related to standardization of energy services provided, the performance of such services and
their procurement and operation in the public sector.
It is evident from the analysis provided in the context of this study, that the existing energy
saving potential should be approached on a cost-efficient investment basis and to allow,
even incentivize, the best performing interventions and instruments to scale-up.

83 | C y p r u s ’ N E C P 2 0 2 1 - 2 0 3 0
The existing regulatory provisions with regard to the building code, Energy Performance
Certificates, as well as energy audits for non-SMEs will be further enhanced in terms of
monitoring processes and increased market value in order to create a sustainable regulatory
framework for Energy Efficiency. In this context, the enhancement and extension (both also
in time) of an obligation scheme for energy suppliers is proposed in order to increase
relevance of the foreseen energy efficiency interventions on the market and to allow for the
integration of these measures as new market mechanisms under a competitive framework.
Though, the structure of the domestic energy market currently does not leave big room for
competition among energy suppliers, considering the anticipated changes especially in the
electricity market the introduction of such energy efficiency obligations can be expected to
foster and accelerate the establishment of a functioning national energy service market.
The low-hanging fruits in terms of energy efficiency interventions still are not fully exploited
and further emphasis will be given to awareness, training and information activities that
would allow the fairly easily achievement of some significant energy savings.
A balanced mix of mandatory obligations as well as voluntary targets for the various energy
consumers and suppliers will be considered. This needs to be done in a way that while going
beyond the minimum mandatory instruments currently foreseen under the EED not to create
market failures or uneven burden for some end-users or market participants. The instrument
of energy audits especially for non-SMEs should be exploited far more in the future in both
the service and industry sector and to be directly linked with any kind of state financial
support.
Any regulatory market barrier should be addressed as efficient and as fast as possible in
order not to witness market bottlenecks or lock-in effects. For this reason, mainly capacity
building measures for various stakeholders groups (e.g. building installers, energy managers,
lawyers, bankers) will be timely planned and implemented. The introduction of standardized
tools and procedures as well as the development of electronic databases, registries and
communication platforms are also considered key instruments for the successful tackling of
the existing mainly market-related barriers.
However, the most sever barrier for the achievement of the planned savings is the limited
available budget for such kind of interventions. The private sector has been accustomed to
be responsive only when a significant public subsidy is available, while the public sector
tends to request full upfront capital coverage. For this reason, the transition to a more
market-oriented financial support scheme, will be definitely a challenge and a careful
planning along with the mobilization of the appropriate financial and market instruments will
be required. Public support will continue to play a vital and indispensable role in the
achievement of the targeted energy savings and as such the appropriate new energy
efficiency financing instruments will be deployed and be in operation in due course. The aim
from the side of the State is not to reduce its overall share in the support of the energy
efficiency interventions, but mainly to drive the public financial resources to more cost-
efficient support instruments and types of energy efficiency interventions with a higher
leverage.
The establishment of a dedicated energy efficiency revolving fund is proposed (soft loans)
allowing the sustainable medium-term design of national support schemes for energy
efficiency interventions. The success or not of this proposed fund is closely associated with
the involvement and cooperation with the domestic banking sector and for this reason the

84 | C y p r u s ’ N E C P 2 0 2 1 - 2 0 3 0
active and direct participation of the latter sector should be thoroughly discussed and
ultimately guaranteed before the launch of support programs under this Fund.
In this context the possibility of additional inflows to this fund will be assessed and
considered, mainly in the framework of carbon/green taxes, however without jeopardizing
the existence of an initial capital for the medium-term fund operation. The capital for the
fund operation is overall proposed to be allocated from the national Cohesion and Structural
funds.
Benchmarking assessment and analysis in order to support the efficient planning and
distribution of public funds is essential and to this end the current data set of specific energy
consumption data for various end-use sectors needs to be systematically broadened and
detailed. Market surveys and wider participation of market associations in the various
national energy efficiency schemes (e.g. voluntary agreements) and exploitation of data
collected by the energy managers of the public buildings and the stock of issued energy
building certificates in the framework of dedicated Information System databases and
platforms are proposed to be one of the first administrative driven actions.
The Government is examining a fiscally neutral green tax reform, which can significantly
contribute towards transition to an economically and environmentally sustainable
development. A gradual implementation of environmental taxes to sectors (that are not
subject to the EU Emissions Trading System) and at the same the reduction of other expenses
related e.g to labor cost, is expected to lead to energy savings and will notable reduce the
energy dependency of Cyprus. It is noted that this measure, due to the expected large impact
on reducing the national energy consumption, will simultaneously contribute to the
achievement of obligations of the country for 2030 regarding energy efficiency, the reduction
of the carbon dioxide emissions and the increase of share for renewable energy sources. In
general, a fiscally neutral gradual green tax reform can have substantially positive effects
both on environmental and economic performance of a country and enable the transition to
a more productive, more resource-efficient and less polluting economy.
In the household/residential sector, while not undermining the acceleration of new building
requirements (i.e. deep renovations leading to nZEB consumption), any new instrument will
be designed to be cost-attractive as well as implementable in market terms. Programmes
with a fast market uptake (i.e. roof insulation, heat pumps, solar thermal) allowing both
comprehensive and stand-alone interventions shall be priorities. Linking these types of
interventions in the household sector to the proposed Energy Efficiency Obligation Schemes
will be considered in order to bridge the regulatory and financial gaps and to allow an
upscale of the deemed beneficiaries.
In the service sector targeted sub-sectors for tailored initiatives are proposed to be the
tourism and the industry food, diary, tobacco sector, while as far as the public sector is
concerned emphasis should be given to hospitals and energy efficiency upgrade of street
lighting. Since the latter is primarily under the responsibility of municipalities and communes,
targeted schemes would need to be designed to empower and/or support local government
to programme, procure and implement such measures, while a priority should again be given
to the mobilisation of private capital through light energy performance contracting.
Moreover, MECI, with technical assistance from SRSS completed two studies, one by JRC and
one by GIZ, that looked into the barriers that hinder the development of the ESCO market in
Cyprus. These, given the results of these studies, such as the preparation of template tender

85 | C y p r u s ’ N E C P 2 0 2 1 - 2 0 3 0
studies provide a list of solutions, measures and actions that can be taken in order to
overcome these barriers. Targeted and well-designed actions will be taken documents as
standard procedures for procuring ESCO projects in public sector. More actions will include
capacity building, targeted trainings, information workshops and events for removing
barriers that impede the uptake of energy performance contracting and the implementation
of energy efficiency investments in general
Ministry of Energy, Commerce and Industry is working together with the Department of
Spatial Planning and Housing to revise the existing requirements that qualify a building to
receive an extra 5% building factor. These requirements are examined to go beyond
requirements for NZEB at least for new buildings.
The Directive 2018/844/EU amending Directive 2010/31/EU on energy efficiency of buildings
has to be transposed to national legislation by March 2020. As a result, new measures will be
implemented in the building sector and onwards. The most notable ones are:
a) Setting measurable progress indicators in building renovation
b) Integration of electromobility infrastructure in build environment
c) Smart readiness indicator for buildings
d) Promotion of building automation and control systems in heating and cooling systems
As far as concerns the agricultural sector the focus will be mainly given to higher penetration
of RES systems for heating and cooling, achieving relative significant savings in terms of
primary energy use and avoided cost of imported fuel, while also the adoption and support
of an energy audit scheme could allow the identification of some significant cost efficient
energy saving potential that could be addressed under tailored design national programmes
either for specific sub-sectors (e.g. wineries) or agricultural process activities (e.g.
greenhouses, drying). Given the poor knowledge on RES and energy efficiency potentials and
technologies along the agricultural value chain all measures will need to be accompanied by
awareness raising and training activities.
The transport sector, while exhibits a reference high potential for savings, due to existing and
persistent modal shift patterns and overall infrastructure constraints is expected to perform
quite modestly in terms of energy savings in the decade up to 2030. Action will focus on
modifying the vehicle taxes to accelerate the penetration of higher efficient cars and light
commercial vehicles, soft measures to promote a modal shift towards public, e-mobility and
other alternative transport modes. To accelerate the uptake of e-mobility public funding the
charging infrastructure and/or other regulatory measures for the set-up of charging
infrastructure to enable the development of a free and competitive market will be
considered, however only after a certain satisfactory level of cost-efficiency for these
infrastructure investments is reached.
Finally, using the European Structural and Investment Funds in the new Programming Period
2020 – 2026, under the "Greener low carbon Europe" thematic priority, actions to promote
energy efficiency and the use of renewable energy sources will be promoted. It expected that
30% of the resources available from the European Regional Development Fund, which are
expected to be 30% of € 225 to € 250 million, should be allocated to the above thematic
priority.

86 | C y p r u s ’ N E C P 2 0 2 1 - 2 0 3 0
Figure 3.2. Overview of policies for the household sector
Figure 3.3. Overview of policies for the service sector
Household sector
Market mechanisms
Energy certificate of
buildings
Minimum energy
requirements on new
buildings
Energy upgrade of existing buildings
Obligation schemes
EE revolving fund
Awareness and tools for the
engagement of consumers
Scheme for prosumers
Training of professionals /
installers
Service sector
Market mechanisms
Energy certificate of buildings &
sectoral surveys
Minimum energy requirements on
new buildings
Energy upgrade of
existing buildings
Energy Services
Energy Audits
EE revolving fund
Voluntary schemes
RES heating and cooling

87 | C y p r u s ’ N E C P 2 0 2 1 - 2 0 3 0
Figure 3.4. Overview of policies for the industry sector
Figure 3.5. Overview of policies for the agricultural sector
Industry sector
Market mechanisms
Auto-consumption
schemes
Tax regime for EE
interventions
Energy Audits
EE revolving fund
Voluntary schemes/ EE
Networks
Promote and support heCHP
Energy Management
Schemes
Enabling the usage of new technologies/ tech. solutions
Agricultural sector
Market mechanisms
Capacity building /
dissemination
Energy Audits
Integration into
agricultural programmes
EE revolving fund
Combination with RES
Enabling the usage of new technologies/ tech. solutions
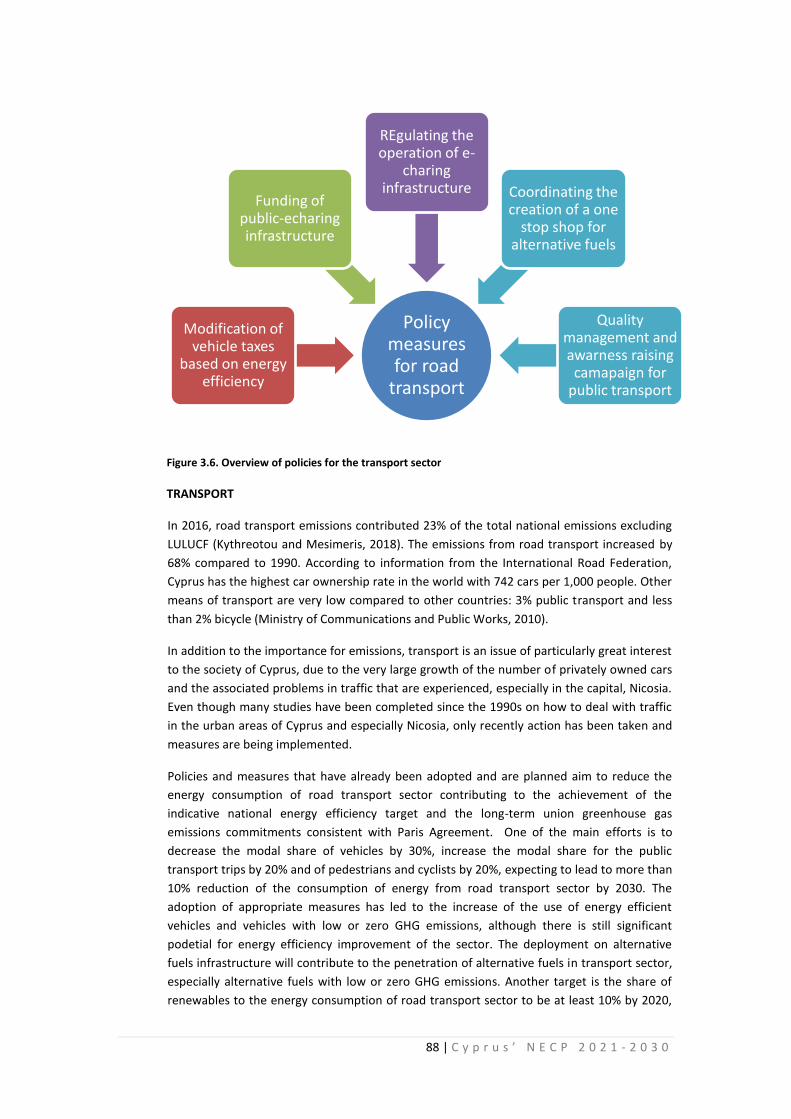
88 | C y p r u s ’ N E C P 2 0 2 1 - 2 0 3 0
Figure 3.6. Overview of policies for the transport sector
TRANSPORT
In 2016, road transport emissions contributed 23% of the total national emissions excluding
LULUCF (Kythreotou and Mesimeris, 2018). The emissions from road transport increased by
68% compared to 1990. According to information from the International Road Federation,
Cyprus has the highest car ownership rate in the world with 742 cars per 1,000 people. Other
means of transport are very low compared to other countries: 3% public transport and less
than 2% bicycle (Ministry of Communications and Public Works, 2010).
In addition to the importance for emissions, transport is an issue of particularly great interest
to the society of Cyprus, due to the very large growth of the number of privately owned cars
and the associated problems in traffic that are experienced, especially in the capital, Nicosia.
Even though many studies have been completed since the 1990s on how to deal with traffic
in the urban areas of Cyprus and especially Nicosia, only recently action has been taken and
measures are being implemented.
Policies and measures that have already been adopted and are planned aim to reduce the
energy consumption of road transport sector contributing to the achievement of the
indicative national energy efficiency target and the long-term union greenhouse gas
emissions commitments consistent with Paris Agreement. One of the main efforts is to
decrease the modal share of vehicles by 30%, increase the modal share for the public
transport trips by 20% and of pedestrians and cyclists by 20%, expecting to lead to more than
10% reduction of the consumption of energy from road transport sector by 2030. The
adoption of appropriate measures has led to the increase of the use of energy efficient
vehicles and vehicles with low or zero GHG emissions, although there is still significant
podetial for energy efficiency improvement of the sector. The deployment on alternative
fuels infrastructure will contribute to the penetration of alternative fuels in transport sector,
especially alternative fuels with low or zero GHG emissions. Another target is the share of
renewables to the energy consumption of road transport sector to be at least 10% by 2020,
Policy measures for road
transport
Modification of vehicle taxes
based on energy efficiency
Funding of public-echaring infrastructure
REgulating the operation of e-
charing infrastructure Coordinating the
creation of a one stop shop for
alternative fuels
Quality management and awarness raising camapaign for
public transport

89 | C y p r u s ’ N E C P 2 0 2 1 - 2 0 3 0
contributing to the GHG reduction and the diversification of energy mix of the transport
sector. This target is continuing after 2020 and becoming stricter for 2030.
Policies and Measures
The energy intensity in the transport sector is among the highest in the EU, mainly due to the
large percentage of road transport operations. However, there has been a remarkable
improvement in this sector in recent years. The increase of the energy efficiency of private
vehicles and the import of smaller and more efficient cars have led to better results although
public transport in Cyprus is not adequately developed. The transport sector, along with the
electricity generation and building sectors, is one of those sectors that offer a significant
potential for energy efficiency improvement.
Actions such as improvement of infrastructure for further encouragement of use of public
transport, cycling and walking and financial incentives to encourage new vehicles with low or
zero emissions and discourage the use of vehicles with high emissions, can reduce the
emissions of one of the most important sectors in Cyprus.
In particular, the increase of the modal share for the bus trips to 20% and the modal share of
pedestrians and cyclists to 20% by 2030, will be achieved by the development and
implementation of measures, such as high quality public transport services, zero or near zero
emission zones, improvement of cycling and pedestrian facilities, effective parking policy,
measures to promote the use of sustainable modes of transport and discouragement of the
use of the passenger car and introduction of a tram system in Nicosia. Furthermore, the
possibility of setting up a railway system linking the main urban areas should be further
exploited.
According to the 2013 (Amending) Law on Motor Vehicles and Road Traffic, which entered
into force on 1 January 2014, the annual circulation tax for each category M1 motor vehicle
and the annual circulation tax for each category N1 motor vehicle, resulting from a category
M1 motor vehicle and classified under the category of light lorry (VAN type), is calculated on
the basis of the carbon dioxide emissions of the vehicle. In addition, as from 1 January 2014,
category N2 and N3 vehicles (lorries) and M2 and M3 vehicles (buses) are registered in so far
as they have been proven to comply with the ‘EURO VI’ requirements on the emission of
pollutants.
A revision of the vehicle taxes and annual circulation taxes in order to promote the further
use of low emission vehicles, including zero emissions vehicles (ZLEVs) has been prepared by
amending the Motor Vehicles and Road Traffic Law. The proposed legislation is expected to
enter into force in the first quarter of 2019.
The launch of the 4th Old Vehicle Scrapping and Replacement Scheme was announced on
11th of October 2010, whereas the scheme was implemented in 2011. Applications were
admitted for a period of 2 months with final date on 13th of December 2010. The 4th
Scheme related to the payment of a grant equal to EUR 1 800 and covered the scrapping of
M1 category motor vehicles, older than 15 years old, under the condition that a new car with
CO2 mass emissions lower or equal to 165gr/km would be purchased.
The new public transportation system was put into force in the second half of 2010. The new
bus operators replaced part of their vehicles with new ones that have low fuel consumption
and pollutant emissions, as compared to the old vehicles that were replaced. The Ministry of
Transport, Communications and Works has recently installed a telematic system that

90 | C y p r u s ’ N E C P 2 0 2 1 - 2 0 3 0
manages the bus services and records data for further optimization of the Public transport
system. The related website and mobile application contain a detailed map of the routes and
the timetable of buses in order to facilitate passengers in real time.
New bus concessions are planned to be put in force in 2020 and will further improve the
public transportation system. The increase of the use of buses that have low or zero GHG
emissions will be implemented by applying the following:
• Additional Cost for the Tenderer to convert their bus fleet to Compressed Natural Gas
(CNG), when such fuel source is available in Cyprus and the prerequisites for doing so
exist.
• Additional Cost for the Tenderer to provide Electric Buses (maximum capacity 22 persons)
in Historic City Centres of Nicosia, Limassol, Larnaca, Paphos and Famagusta (Paralimni &
Agia Napa).
• The tenderer may submit a variant to their standard offer (of 10-year contract period),
showing amortisation over a longer period – not exceeding 15years – for supplying a fleet
with vehicles (buses) operating with electric energy, which are more expensive than the
usual diesel buses, and will require further significant investments on charging stations in
depots and key locations, but contribute towards a cleaner environment. To consider
such a variant, all vehicles shall be electric and the tenderer will carry out a detailed
feasibility study taking into account all costs (including vehicle and infrastructure cost).
The introduction of environmental fees for the use of the road network by 2030 is a revenue
generating measure that will discourage the use of cars and also provide a source of funding
for implementing the other proposed measures. This measure will be implemented by
actions, such as applying congestion charges in the city centres, toll charges applied initially
to HGV on Motorways to be extended later to other roads and vehicle types, increasing the
taxes for fossil fuels and increasing the parking charges and penalties for illegal parking.
The enhanced planting of trees along streets and strategic road corridors is another measure
that reduces the CO2 amount of the atmosphere. Benefits include shading, ambient
temperature reduction, CO2 absorption (up to 22 000 tonnes/year), and better conditions for
walking and cycling.
In the context of the implementation of EU Regulation (EC) No 1222/2009 on the labelling of
tyres with respect to fuel efficiency and other essential parameters, delegated inspectors of
the Energy Department perform market surveillance checks in order to identify cases of non-
compliance with these provisions. In addition, presentations on energy savings in the
transport sector and on eco-driving are made in the context of the seminars addressed to
unemployed engineers of all specialisations organised by the Energy Department and the
Productivity Centre, with the support of the Human Resources Development Authority of
Cyprus.
3.3. Dimension Energy security
i. Policies and measures related to the elements set out in 2.3
Following the completion of a feasibility study in 2016, the Government of Cyprus (GoC)
decided to proceed with a policy which will result in the import of Natural Gas in Cyprus fuel
market, by approving the import of Liquefied Natural Gas (LNG) to Cyprus in a manner
leading to the commencement of natural gas supply by the year 2020. The LNG import route

91 | C y p r u s ’ N E C P 2 0 2 1 - 2 0 3 0
shall act as the single gas supply route until the indigenous gas sources become available for
the Cyprus market, and will serve as an alternative supply route, for ensuring the security of
inland gas supply.
As per the above, a tender was announced by ETYFA (Natural Gas Infrastructure Company of
Cyprus) in October 2018 for the LNG Import infrastructure in Vasilikos Bay), aiming for a
completion by the end of year 2020. This infrastructure aims to end the energy isolation of
Cyprus and has many cross-border impacts/ benefits for Cyprus and the Eastern
Mediterranean region.
The tender entails the design, construction and operation of the project, which consists of (a)
the pprocurement of a floating storage and regasification unit (FSRU), of at least 125,000
cubic meters storage capacity, to unload LNG from LNG carriers ranging in size from 120,000
cubic meters to 217,000 cubic meters (Q-Flex), (b) the Construction of offshore infrastructure
for the permanent berthing of the FSRU, and (c) Onshore natural gas infrastructure and
related construction components for gas delivery to the Vasilikos power station and
potentially other gas consumers.
The capital cost of the Project is estimated to be €300 million, spread over three years (2018
– 2020). It is also expected that the Project capital costs will be financed through a
combination of a grant from the EU CEF (Connecting Europe Facility) of up to €101 million
(project was approved by CEF in January 2018), debt financing (e.g. EIB, etc.) and possibly an
investment by the Electricity Authority of Cyprus (EAC). The Operational and Maintenance
cost is estimated to be around €200 million and is designed for a period of twenty years.
ii. Regional cooperation in this area
it is not applicable.
iii. If applicable, financing measures in this area at national level, including EU
support and the use of EU funds,
it is not applicable.
3.4. Dimension Internal energy market
3.4.1. Electricity infrastructure
i. Policies and measures to achieve the targeted level of interconnectivity set
out in Article 4(d)
EuroAsia Interconnector is an electricity cross border interconnector between Greek, Cypriot,
and Israel power grids via the world's longest submarine HVDC power cable. HVDC onshore
converter stations with a total capacity of 2000MW will be located at each connection point.
It is a leading Project of Common Interest of the European Union and also priority Electricity
Highway Interconnector Project. The Interconnector is an energy highway bridging Asia and
Europe. The quantified objective is market integration but also ending the energy isolation of
Cyprus and secure energy supply (related to dimension energy security). The planned budget
of the EuroAsia Interconnector project is approximately 5 billion Euros.

92 | C y p r u s ’ N E C P 2 0 2 1 - 2 0 3 0
ii. Regional cooperation in this area
See 3.4.1. i
iii. If applicable, financing measures in this area at national level, including EU
support and the use of EU funds
It is not applicable
3.4.2. Energy transmission infrastructure
i. Policies and measures related to the elements set out in 2.4.2, including, if
applicable, specific measures to enable the delivery of Projects of Common
Interest (PCIs) and other key infrastructure projects
Specific measures to enable the delivery of Projects of Common Interest (PCIs)
The current PCI in Cyprus for electricity is EuroAsia interconnector which is categorised
according to EU Regulation 347/2013/EC in NSI East electricity corridor. The PCIs for gas,
EastMed Pipeline and CyprusGas2EU, are both categorised in NSI East gas corridor and SGC
gas corridor. The quantified objectives of these projects are market integration, increase the
flexibility of the national energy system, ending the energy isolation of the island and secure
energy supply (related to energy security dimension) and reduce greenhouse emissions due
to lower emissions of natural gas than conventional fuels (related to decarbonisation
dimension mostly for gas projects). Gas supply transmitted by PCIs will be used for power
generation in the island.
A Ministerial decision appointed MECI as the National Competent Authority (NCA) for
Projects of Common Interest (PCIs). Some of NCAs’ adopted obligations according to EU
Regulation 347/2013/EC are the following:
1. The real priority status for PCIs in public sector. Priority status in each Ministry and
governmental services of each Member State. A variety of Legislative and Non-
legislative measures like One-Stop Shop 4Energy PCIs, Manual of Procedures of PCIs,
Environmental manual and legislative measures like Labour Legislation for PCIs, natural
gas national quality specifications and excise duties Legislations/Decrees,
Environmental Regulations to simplify and to accelerate the permitting granting
process. The main objective of the above is the efficient administrative processing of
the application files related to PCIs. The policy is related to 3.4.2ii "regional cooperation
in this area".
2. Transparency and public participation. These can be achieved through Public
Consultation and Participation Plan for PCIs. For this purpose, is essential to i) identify
key stakeholder groups related to the PCIs in each MS and Third Country ii) use
improved national methodology for public consultation of energy projects to facilitate
public acceptance, iii) organise generic and specific consultation with all stakeholder
groups, iv) educate public officers dedicated to the permitting for PCIs. All data related
to Public Consultation available on One-Stop Shop 4Energy PCIs website. Cooperation
with all Project Promoters is needed to create the National Public Consultation Plan for
PCIs. The policy is related to 3.4.2 "regional cooperation in this area".
3. The development of the One-Stop Shop 4Energy PCIs E-platform. This platform will
increase the efficiency, promote the transparency and help enhance cooperation

93 | C y p r u s ’ N E C P 2 0 2 1 - 2 0 3 0
among Member States. The MECIT budget of 2019 includes budget provisions 50000€
for the basic design of the interactive E-Platform for Projects of Common Interest
(PCIs). The One-Stop Shop 4Energy PCIs provides internal procedures for Energy
Investors Hub, Call centre for energy investors and all key stakeholders, interactive
Website in English and Greek version. E-Platform will be hosted on
www.OneStopShop4EnergyPCIs.gov.cy. The policy is related to 3.4.2ii "regional
cooperation in this area" and 3.4.2.iii "financing measures in this area at national level,
including EU support and the use of EU funds''.
Furthermore, a MoU was signed between the countries of Cyprus, Greece, Israel and Italy on
5th of December 2017 at Nicosia for the EastMed pipeline project, aiming at the
development of this Gas PCI. This MoU is a prerequisite legal measure for the PCI
implementation, according to EU Regulation 347/2013/EC. EastMed Pipeline is an
offshore/onshore natural gas pipeline, directly connecting East Mediterranean resources to
Greece via Cyprus and Crete. The policy is related to 3.4.2ii "regional cooperation in this
area".
Other key infrastructure projects
1. Cyprus TSO Ten Year Network Development Plan 2018-2027 according to Article 63 of the
Laws for the Regulation of the Electricity Market from 2003 to 2018.
The main objective of this PaM is the development and the secure operation of the
Transmission Network in the years 2018-2027. The criterion employed is n-2 for the
backbone network and n-1 for the rest of the network circuits and the transmission
transformers. The Transmission TYNDP analyses the investments to be carried out during the
ten year period 2018 to 2027 for the development and the secure operation of the
transmission electricity system.
The T-TYNDP takes into consideration the total yearly demand forecast for the period 2016-
2025 as well as the maximum forecasted demand for each transmission substation. The
average long-term expected capacity growth of new PV systems was also taken into
consideration. The TYNDP is implemented by the Transmission System Owner, which is part
of the Electricity Authority of Cyprus, but is functionally unbundled from Generation and
Supply Activities.
Details regarding this Policy and Measure are included in PaMs template.
2. Regulatory Decision 05/2017 on the Implementation of a Binding Schedule for the Full
Implementation and Operation by the DSO of the Meter Data Management System (MDMS).
The main objective of this PaM is to provide new suppliers with access to the electricity
market. MDMS enables the registration and entry of the meters in a particular registry. The
meter readings of all consumers are registered and communicated to respective suppliers.
The MDMS will be used to manage the supplier switching process.
Details regarding this Policy and Measure are included in PaMs template.
3. Regulatory Decision 02/2018 on the Implementation of a Binding Schedule for the Mass
Installation and Operation by the DSO of Advanced Metering Infrastructure (AMI).
The main objective of this PaM is the enhancement of observability, monitoring, data
recovery and electrical energy and power measurements at the distribution system level. The

94 | C y p r u s ’ N E C P 2 0 2 1 - 2 0 3 0
basic quantitative target is the roll out of 400 000 meters by the year 2027. AMI offers the
necessary observability, monitoring and recoverability of data and measurements of electric
energy and power at the customer's connection point. AMI increases the accuracy of load
and demand forecasting, improves the system analysis, enables the load and demand
management and in effect the optimisation of the operation of the Distribution System. AMI
aids at managing EV Charging, PV System management and generation monitoring,
optimisation of RES generation forecasting, maximises RES penetration, enables remote DSO
operations (connections/ disconnections, meter reading), aids at the reduction of non-
technical losses.
ii. Regional cooperation in this area
One of the NCA of PCIs obligation’s (according to EU Regulation 347/2013/EC) is the Cross
Border collaboration with other EU Member States and Third Countries. The purpose is to
accelerate PCIs' implementation. The precise scope includes Collaboration with
Governmental Authorities, National competent Authorities, Transmission System Operators
for Gas and Electricity in other countries, Assessment of Investment Opportunities,
Assessment of Cross Border Environmental Impact Assessment, Public Consultation and
Public surveys in parallel to all impacted countries, Views on studies for Cost Benefit Analysis
of each PCI and new policies to lift energy isolation of Cyprus and to highlight the strategic
role of Eastern Mediterranean. For the implementation of the above, streamlining of Public
Permitting Procedures and bureaucracy is necessary. The policy is related to 3.4.2i
"....specific measures to enable the delivery of Projects of Common Interest (PCIs) and other
key infrastructure projects".
iii. If applicable, financing measures in this area at national level, including EU
support and the use of EU funds
Some additional NCAs' obligations according to EU Regulation 347/2013/EC involve financial
assistance for PCIs. Actually, some assistance is implemented and some is adopted, as
following:
1. Financial assistance for the preparation of the Natural Gas Market in Cyprus. The purpose
of this assistance is to import Natural Gas in Cyprus. For example, CEF Grant of 4,5 million
Euros was approved for Cynergy programme. For the Cynergy Programme the status is
implemented. The technical support is needed for the study for the dedication of TSO Gas,
Network codes, the preparation of the new legislation for natural gas and other legislations.
The potential EU technical support will also cover the study for the design of an E-Platform
for the One Stop Shop 4 Energy PCIs. MECIT requested 1,040,000 euros for EU technical
support (SRSP) but approval is still pending. The status for the Technical Support from SRSP is
considered as adopted.
2. Financial assistance for PCIs to accelerate Investment in the field of Trans-European
Networks -PCIs and to leverage funding from both private and public sectors in order to
support PCIs (some adopted and some implemented). Financial Measures include local and
European measures for PCIs (e.g. CEF, Invest EU, EIB grants and financial tools etc.). For the
category of local financial measures for PCIs and related energy infrastructure, Cyprus
Government may decide to develop a national fund for energy transmission infrastructure.
The above policy is related to 3.4.2i " .... specific measures to enable the delivery of PCIs and
other key infrastructure projects " and 3.4.2ii "regional cooperation in this area".

95 | C y p r u s ’ N E C P 2 0 2 1 - 2 0 3 0
3.4.3. Market integration
i. Policies and measures related to the elements set out in 2.4.3
ii. Measures to increase the flexibility of the energy system with regard to
renewable energy production such as smart grids, aggregation, demand
response, storage, distributed generation, mechanisms for dispatching, re-
dispatching and curtailment, real-time price signals, including the roll-out
of intraday market coupling and cross-border balancing markets
1. Regulatory Decision 01/2017 on the Implementation of a Binding Schedule for the Full
Commercial Operation of the New Electricity Market Model.
This PaM aims at introducing a Forward, a Day Ahead, an Intraday and a Balancing Market
with a Contingency Reserve to operate a competitive electricity market in Cyprus to increase
the share of renewable energy sources to electricity balance. The main quantitative objective
is to allow participation of at least (1) 212.5MW of RES Generation, (2) IPPs with a total
licensed capacity of ca. 500MW, (3) 4 licensed independent Suppliers. The introduction of
Forward and Day-Ahead Markets and at a later stage an Intraday market in order to allow for
new RES, IPPs and Suppliers to compete in generating and supplying electricity to final
customers. Forward market is based on bilateral over the counter trading between suppliers
and generators. The incumbent's bilateral prices will be fixed at its Wholesale Regulated
Tariff. Day-Ahead Market will be centrally operated by the TSOC (who is also the Market
Operator), obligatory for conventional generators for their available capacity not contracted
in the Forward Market or allocated to cover Replacement Reserve. The energy offer cap will
be Administratively Defined by the Regulator. The minimum energy offered by the
incumbent is equal to its generator's minimum variable cost. Integrated Scheduling Process
will be used for preallocating balancing activation instructions to Balancing Responsible
Parties (before real time balancing) and procuring frequency ancillary services (FCR, aFRR,
mFRR). ISP may modify the Unit Commitment (UCS) schedule. Real time balancing inherits
ISP UCS. Dispatch instructions will be issued by the TSOC during real time balancing.
Details regarding this Policy and Measure are included in PaMs template.
iia. If applicable, measures to ensure the non-discriminatory participation of
renewable energy, demand response and storage, including via
aggregation, in all energy markets
1. Regulatory Decision on Storage Systems that are installed after the metering point.
The main objective of this PaM is the amendment of the TSRs and TDRs to allow for the
participation of storage systems that are installed after the metering point in the electricity
markets. The (draft) Regulatory Decision permits the participation in the electricity market of
licensed storage systems installed after the meter that are not combined with consumption
of energy locally and calls the TSOC to amend the Market and Network Rules to enable their
non-discriminatory participation in the market. The TSOC should also define the minimum
capacity and technical characteristics of a storage system to be able to participate in the
electricity market as a dispatched unit. The (draft) Regulatory Decision also calls the TSOC, in
cooperation with the DSO, to take into consideration when drafting the Transmission -
TYNDP any developments regarding the provision of services by storage systems in
combination with the rate of RES development, the benefits due to loss reduction,

96 | C y p r u s ’ N E C P 2 0 2 1 - 2 0 3 0
investment avoidance and/or upgrading of the network and/or the Transmission and
Distribution Substations. The Transmission TYNDP should also include storage systems after
the metering point. The Regulatory Decision calls the TSOC to amend Market and Network
Rules in order to allow for the provision of services by storage systems related to the
operation of the transmission and distribution systems, to suggest network charges
applicable during their charging cycle in the case that such systems offer services to the TSOC
and/ or DSO related to the operation of the transmission and/or distribution system.
Details regarding this Policy and Measure are included in PaMs template.
2. Amend the national law to enable operation of the electricity market and make the
Market Operator/TSO independent from the vertically integrated electricity company
This PaM aims at enabling the operation of the electricity market and making the MO/TSO
independent financially and organizationally (management, human resources) from the
incumbent EAC. The amending Bill makes all necessary legislative changes to allow for the
operation of the Net-Pool market electricity model. The Net-Pool market model is in
compliance to the EU Target Model. The Bill introduces the category of "Aggregators" to
allow for the combination of load and energy, including energy from storage systems. It also
creates the category of "Storage Systems" and allows for the licensing of aggregators,
storage systems and BRPs. The Regulator is authorized to decide on simplified licensing
procedures for self-consumption, RES, suppliers and non-connected generation systems. The
Bill strengthens clauses related to the Distribution System Owner, Distribution System
Operator, foresees for the independence of the Cyprus TSO from the incumbent by providing
to the former the necessary resources and autonomy in decision making related to its budget
and personnel. It provides for a national certification process for the TSO independence,
broadens the duties and responsibilities of the TSOC to include Market Operation and
provides to the MO/TSO the authority to enforce Market Rules. The Bill strengthens clauses
related to the Transmission-TYNDP. The Bill also concentrates previously scattered clauses on
Universal Service under a dedicated Article.
Details regarding this Policy and Measure are included in PaMs template.
iv. Policies and measures to protect consumers, especially vulnerable and,
where applicable, energy poor consumers, and to improve the
competitiveness and contestability of the retail energy market
v. Description of measures to enable and develop demand response including
those addressing tariffs to support dynamic pricing
1. Amend Trade and Settlement Rules and Transmission and Distribution Rules to allow for
Demand Response in the market according to Art. 15(8) Directive 2009/27/EU.
This PaM aims at creating the necessary conditions for the participation of Demand Response
in the Day Ahead Market (directly or via Aggregator) and the Balancing and Ancillary Services
Markets (via aggregator). Technical modalities should be defined in order for the national
law, as harmonized with Article 15(8) of the Directive, to be applied in practice; in particular,
the submission of DR Upward and Downward offers with priority over other participants i.e.
should be cleared before offers of other sources with the same price. The DR Aggregator
should be engaged in Bilateral Contracts with Suppliers, so as to secure the necessary
capacity for participating in the Day Ahead Market and the Balancing Market.

97 | C y p r u s ’ N E C P 2 0 2 1 - 2 0 3 0
Details regarding this Policy and Measure are included in PaMs template.
3.4.4. Energy Poverty
i. If applicable, policies and measures to achieve the objectives set out in
2.4.4
It is not applicable.
3.5. Dimension Research, innovation and competitiveness
i. Policies and measures related to the elements set out in 2.5
Existing policies and measures
1. National funds that promote research in energy and climate, and the development
by businesses innovative products and services i.e. RESTART 2016-2020 and Grant
Scheme to Enhance Business Innovation
2. EU Competitive funds i.e. Horizon 2020 and Life
3. European Territorial Cooperation Programs i.e. Cross-Border Cooperation Program
Greece - Cyprus 2014-2020 and Transnational Cooperation Program Balkan-
Mediterranean 2014-2020
4. Climate-KIC which is a European knowledge and innovation community, working to
accelerate the transition to a zero-carbon economy. Supported by the European
Institute of Innovation and Technology, it identifies and supports innovation that
helps society mitigate and adapt to climate change. Climate - KIC accelerates climate
innovation across Europe by connecting the established Climate-KIC innovation
hubs, currently in nine countries, which in turn act as a bridge into a pan-European
network. Partners in Cyprus are the Cyprus University of Technology, Cyprus Energy
Agency and Chrysalis LEAP who are committed to making the country a hub for
cleantech innovation in the region. Activities such as a start-up acceleration
program or the Journey summer school focus on promoting the nascent innovation
and entrepreneurship ecosystem in Cyprus.
5. Business4Climate has developed by Cyprus Employers and Industrialists Federation
(OEB) in collaboration with Cyprus University of Technology, the Department of
Environment and funded by the Climate - KIC. The aim of this initiative is to commit
more than 250 companies from all sectors of economic activity in Cyprus to reduce
their emissions by at least 8% by 2030. Within this framework, companies are
expected to implement energy saving and renewable energy measures that will
reduce their operating costs and make them more competitive.
Planned policies and measures
1. Financing tool providing soft loans for energy efficiency investments
2. Support schemes to promote energy efficiency investments in agricultural sector

98 | C y p r u s ’ N E C P 2 0 2 1 - 2 0 3 0
3. Fiscally neutral green tax reform by increasing environmental taxes while reducing
labor taxation: The Government is examining a fiscally neutral green tax reform,
which can significantly contribute towards transition to an economically and
environmentally sustainable development. A gradual implementation of
environmental taxes to sectors (that are not subject to the EU Emissions Trading
System) and at the same the reduction of other expenses related to labor cost, is
expected to lead to energy savings and will notable reduce the energy dependency
of Cyprus. It is noted that this measure, due to the expected large impact on
reducing the national energy consumption, will simultaneously contribute to the
achievement of obligations of the country for 2030 regarding energy efficiency, the
reduction of the carbon dioxide emissions and the increase of share for renewable
energy sources. In general, a fiscally neutral gradual green tax reform can have
substantially positive effects both on environmental and economic performance of a
country and enable the transition to a more productive, more resource-efficient and
less polluting economy.
4. European Structural and Investment Funds in the new Programming Period 2021 –
2027: Under the "Greener low carbon Europe" thematic priority, actions to promote
energy efficiency and the use of renewable energy sources will be promoted. It
expected that 30% of the resources available from the European Regional
Development Fund, which are expected to be in the range of € 225 to € 250 million,
should be allocated to the above thematic priority.
5. Revision of national funds regarding research and innovation with the aim to boost
climate and energy priorities.
ii. If applicable, cooperation with other Member States in this area, including
information on how the SET Plan objectives and policies are being
translated to a national context, where appropriate
The European Strategic Energy Technology Plan (SET Plan) is the pillar of EU energy and
climate policy research and innovation, contributing to the structure of European and
national research programs and stimulating significant investments in low carbon
technologies.
The European Technology Priorities, grouped according to the main objective of the Energy
Union under the SET, are as follows:
a) Becoming world number one in renewables
b) Delivering a smart consumer-centric energy system
c) Developing and strengthen energy efficient systems
d) Diversify and strengthen energy options for sustainable transport
e) Driving the ambition of carbon capture, use and storage
f) Increase safety in the use of nuclear energy
In national level the Smart Specialization Strategy had highlighted the priority areas in which
policy implementation could be based. The priority areas have been selected through the
synthesis of quantitative and qualitative data and reflect the areas in which Cyprus has or can
have comparative advantages, has significant resources and can present prospects in the
near future. An additional parameter for selecting the priority areas was the ability of the
research and innovation system to produce significant results in each sector. Cyprus Smart

99 | C y p r u s ’ N E C P 2 0 2 1 - 2 0 3 0
Specialization Strategy has recognized energy sector as one of the priority areas, and taking
into account SET-Plan and national targets for 2020, sets the following topics for research:
a) Development of New or Optimized Technologies for Renewable Energy Sources
b) Innovative Applications of Renewable Energy Sources
c) Exploitation of Hydrocarbons
d) Efficient Use- Energy Saving
Cyprus Smart Specialization Strategy, besides energy sector lists as priority areas:
a) Tourism
b) Agriculture and food industry
c) Build environment and construction industry
d) Transport and shipping
e) Information and communication technologies
f) Health
g) Environment
Subsectors of the abovementioned priority areas, like sustainable tourism and development
of innovative and smart construction materials also contribute in energy and climate goals.
The RESTART 2016-2020 program focus on the priority areas that emerged through the
Smart Specialization Strategy.
Corporation with other MS is mainly materialized through programs funded by Horizon 2020,
Interreg MED.
iii. If applicable, financing measures in this area at national level, including EU
support and the use of EU funds
1. RESTART 2016-2020 has as a vision to promote the Research, Technological
Development and Innovation sector, as a key contributor to the economic
development of Cyprus by contributing to addressing key economic and social
challenges and developing the conditions for sustainable development, in line with
the principles outlined in the Europe 2020 strategic framework for smart,
sustainable and inclusive growth. RESTART 2016-2020 sets energy as a priority area
based on the outcomes of Smart Specialization Strategy. At the same time, it is part
of the Operational Program "Competitiveness and Sustainable Development 2014-
2020", the Cyprus Development Strategy for the utilization of the ERDF resources
under Priority Axis 1 "Enhancing the Competitiveness of the Economy". The program
has a total budget of 99 m Euros from which 45m will be covered by ERDF. RESTART
2016-2020 has been designed and is managed by Research Promotion Institute.
2. The Grant Scheme to Enhance Business Innovation supports existing, start-ups and
other businesses investing in research and innovation to develop competitive
innovative products and services that they plan to make available in the market, as
well as innovative processes and processes in production of their products. The
Scheme is co-funded by ERDF, it is part of the Operational Program
"Competitiveness and Sustainable Development 2014-2020", the Cyprus
Development Strategy for the utilization of the ERDF resources under Priority Axis 1
"Enhancing the Competitiveness of the Economy". The first call has a total budget of
18 m Euros.

100 | C y p r u s ’ N E C P 2 0 2 1 - 2 0 3 0
3. Horizon 2020 has the general objective to contribute in building a society and an
economy based on knowledge and innovation across the Union by leveraging
additional research, development and innovation funding and by contributing to
attaining research and development targets, including the target of 3 % of GDP for
research and development across the Union by 2020. It shall thereby support the
implementation of the Europe 2020 strategy and other Union policies, as well as the
achievement and functioning of the European Research Area (ERA). Cyprus has so
far, managed to secure so far 129m Euro EU contribution by participating in 435
projects.
4. The LIFE program is the EU’s funding instrument for the environment and climate
action. The general objective of LIFE is to contribute to the implementation,
updating and development of EU environmental and climate policy and legislation
by co-financing projects with European added value. After 22 years, €3.4 billion and
4.170 projects, the LIFE Programme continues to finance actions for nature,
environment and climate. For the 2014-2020 the total budget of the LIFE
Programme was €3,46 billion
5. Out of the total €784 million allocated to Cyprus for the implementation of
Cohesion Policy for the programming period 2014-2020, an amount of €32.7 million
will be assigned to the Objective of European Territorial Cooperation, which
supports cross-border, transnational and interregional cooperation programs.
During 2014-2020, Cyprus will be participating in the following European Territorial
Cooperation Programs:
a) Cross-Border Cooperation Program Greece - Cyprus 2014-2020
b) Transnational Cooperation Program MED 2014-2020 – Interreg V-B MED
c) Transnational Cooperation Program Balkan-Mediterranean 2014-2020 –
Interreg V – B Balkan Med
d) Cross-Border Cooperation Program Mediterranean Basin ENI Med 2014-2020
e) Interregional Cooperation Program INTERREG EUROPE 2014-2020
f) Program for Sustainable Urban Development URBACT III
g) European Spatial Planning Observation Network ESPON 2020
The following table provides information about the related to energy and climate projects
that have been funded up to now by the abovementioned financing measures
Table 3.7. Energy and climate projects funded up to now by the financing measures in Cyprus
Program Public funding
(million Euros)
Private funding
(million Euros)
RESTART 2016-2020 14 -
Grant Scheme to Enhance Business Innovation 1,84 1,84
Horizon 2020 23,71 -
LIFE - -
European Territorial Cooperation 2,3 -
Appendix IV provides a detailed list of the programs funded by EU competitive funds related
to research in energy and climate for the period 2014 – 2020.

101 | C y p r u s ’ N E C P 2 0 2 1 - 2 0 3 0
Part 1
General framework
SECTION B: ANALYTICAL BASIS

102 | C y p r u s ’ N E C P 2 0 2 1 - 2 0 3 0
4. Current situation and projections with existing policies
and measures
4.1. Projected evolution of main exogenous factors influencing
energy system and GHG emission developments
i. Macroeconomic forecasts (GDP and population growth)
The macroeconomic forecasts used for the projections (Table 4.1) are the latest prepared by
the Ministry of Finance19
.
Table 4.1. Macroeconomic forecasts (GDP and population growth)
Real GDP Population end of year
(mln €) Annual growth (%) (x 103) Annual growth (%)
2017 19488.7 4.2% 864.2 1.1%
2018 20276.7 4.0% 869.5 0.6%
2019 21051.4 3.8% 874.9 0.6%
2020 21763.1 3.4% 880.6 0.6%
2021 22425.6 3.0% 886.2 0.6%
2022 23031.1 2.7% 891.7 0.6%
2023 23606.9 2.5% 897.2 0.6%
2024 24149.9 2.3% 902.5 0.6%
2025 24632.9 2.0% 907.6 0.6%
2026 25125.5 2.0% 912.6 0.5%
2027 25628.0 2.0% 917.4 0.5%
2028 26140.6 2.0% 921.9 0.5%
2029 26663.4 2.0% 926.2 0.5%
2030 27196.7 2.0% 930.4 0.4%
2031 27740.6 2.0% 934.3 0.4%
2032 28295.4 2.0% 938.0 0.4%
2033 28861.3 2.0% 941.6 0.4%
2034 29438.6 2.0% 945.0 0.4%
2035 30027.3 2.0% 948.3 0.4%
2036 30627.9 2.0% 951.5 0.3%
2037 31240.4 2.0% 954.7 0.3%
2038 31865.2 2.0% 957.8 0.3%
2039 32502.5 2.0% 960.8 0.3%
2040 33152.6 2.0% 963.8 0.3%
ii. Sectorial changes expected to impact the energy system and GHG emissions
F-gases Regulation (no. 517/2014)
19
Ms. Maria Matsi, Economic Officer, Directorate of Economic Research and EU Affairs, Ministry of Finance, 1439 Nicosia – Cyprus, Tel. no.: +35722601231, Email: [email protected]

103 | C y p r u s ’ N E C P 2 0 2 1 - 2 0 3 0
Due to the EU legislation importers are allocated with specific quotas of t CO2 eq. that they
can import as F-gases. These quotas, according to the relevant EU legislation, are annually
decreased. Therefore, there is a reduction of F-gases used in air-conditioning and
refrigeration applications, since there are gradually replaced by CO2 and NH3. The impact of
these changes has not been taken into account in the projections.
Municipal solid waste management strategy
The municipal solid waste management strategy is currently undergoing a major revision,
which is expected to be completed by the end of 2019. This revision in addition to the
municipal solid waste management policies and measures to be implemented will also
provide a revision of waste production projections.
iii. Global energy trends, international fossil fuel prices, EU ETS carbon price
iv. Technology cost developments
4.2. Dimension Decarbonisation
4.2.1. GHG emissions and removals
Three important issues that should be noted for these projections are the following:
(a) The change noticed during the recent years in the types of HFCs used is not taken into
consideration due to the high uncertainty associated to any prediction of such changes.
(b) The emissions from the possible exploitation of natural gas in the Exclusive Economic
Zone are not taken into account due to the high uncertainty associated to any
prediction of such changes.
(c) The organic fraction of solid waste not going to the landfill is treated by composting,
anaerobic digestion and incinerated for energy. The additional organics for incineration
at the cement installation have not been accounted for.
i. Trends in current GHG emissions and removals in the EU ETS, Effort
Sharing Regulation and LULUCF sectors and different energy sectors
The Business as Usual (BaU) emissions by sector are presented in Table 4.2 for the period
2005-2040. Emissions for LULUCF have not been estimated. The latest inventory year used as
reference is 2016. Total emissions are projected to increase by -4% in 2030 and by -6% in
2040 compared to 2005. ETS emissions (Table 4.3) are projected to decrease by -17% in 2030
and by -12% in 2040 compared to 2005. ESR emissions (Table 4.4) are projected to increase
by 13% in 2030 and 2040 compared to 2005. Figure 4.1 presents the expected trends in ETS
and ESR emissions for the period 2005-2040. The projections of the energy sectors
(distinguished in ETS and ESR) are presented in Table 4.5 and Figure 4.2.
Table 4.2. Total BaU GHG emissions aggregated by source category (Gg CO2 eq.) 2005-2040
Gg CO2 eq. 2005 2016 2020 2030 2040
ENERGY 7126 6476 6739 6101 6244
INDUSTRY 1067 1250 1449 1471 1485
AGRICULTURE 535 476 496 535 541
WASTE 486 554 579 718 857
BaU TOTAL (excl. LULUCF) 9213 8756 9263 8824 9127
Change compared to 2005 -5% 1% -4% -1%

104 | C y p r u s ’ N E C P 2 0 2 1 - 2 0 3 0
Table 4.3. ETS BaU GHG emissions aggregated by source category (Gg CO2 eq.) 2005-2040
Gg CO2 eq. 2005 2016 2020 2030 2040
ENERGY 4377 3899 3892 3284 3564
INDUSTRY 882 894 1082 1082 1082
AGRICULTURE 0 0 0 0 0
WASTE 0 0 0 0 0
ETS TOTAL (excl. LULUCF) 5259 4793 4974 4366 4646
Change compared to 2005 -9% -5% -17% -12%
Table 4.4. ESR BaU GHG emissions aggregated by source category (Gg CO2 eq.) 2005-2040
Gg CO2 eq. 2005 2016 2020 2030 2040
ENERGY 2749 2577 2848 2817 2681
INDUSTRY 185 356 366 389 402
AGRICULTURE 535 476 496 535 541
WASTE 486 554 579 718 857
ETS TOTAL (excl. LULUCF) 3954 3964 4289 4458 4481
Change compared to 2005 0% 8% 13% 13%
Figure 4.1. ESR, ETS and Total BaU GHG emissions for the period 2005-2040 (Gg CO2 eq.)
Table 4.5. Total BaU GHG emissions for the energy sources (Gg CO2 eq.) 2005-2040
2005 2016 2020 2030 2040
1A1 Energy Industries 3483 3311 3310 2712 3037
1A2 Manufacturing Industries and Construction 909 603 596 577 533
1A3a ii Domestic Aviation 13 1 1 1 1
1A3b Road Transport 2089 2019 2133 2112 2057
1A3d ii Domestic water-borne navigation 2 2 3 3 4
1A4a Commercial / Institutional 100 82 141 139 116
1A4b Residential 421 360 468 461 397
1A4c Agriculture / Forestry / Fishing / Fish farms 89 80 67 68 67
0
2000
4000
6000
8000
10000
12000
20
05
20
07
20
09
20
11
20
13
20
15
20
17
20
19
20
21
20
23
20
25
20
27
20
29
20
31
20
33
20
35
20
37
20
39
Gg
CO
2 e
q.
ETS
ESD

105 | C y p r u s ’ N E C P 2 0 2 1 - 2 0 3 0
1A5 Non-Specified 19 19 22 27 33
TOTAL 7126 6476 6739 6101 6244
Figure 4.2. ESR, ETS and Total Energy BaU GHG emissions for the period 2005-2040 (Gg CO2 eq.)
ii. Projections of sectorial developments with existing national and EU
policies and measures at least until 2040 (including for the year 2030)
The “With existing measures” (WEM) emissions by sector are presented in Table 4.6 for the
period 2005-2040. Emissions for LULUCF have not been estimated. The latest inventory year
used as reference is 2016. Total emissions are projected to increase by -4% in 2030 and by -
6% in 2040 compared to 2005. ETS emissions (Table 4.7) are projected to decrease by -17% in
2030 and by -12% in 2040 compared to 2005. ESR emissions (Table 4.8) are projected to
increase by 13% in 2030 and 2040 compared to 2005. Figure 4.3 presents the expected
trends in ETS and ESR emissions for the period 2005-2040.
Table 4.6. Total WEM GHG emissions aggregated by source category (Gg CO2 eq.) 2005-2040
Gg CO2 eq. 2005 2016 2020 2030 2040
ENERGY 7126 6476 6210 5868 4272
INDUSTRY 1067 1250 1447 1456 1453
AGRICULTURE 535 476 489 508 494
WASTE 486 554 494 361 221
WEM TOTAL (excl. LULUCF) 9213 8756 8640 8193 6441
Change compared to 2005 -5% -6% -11% -30%
Change compared to BaU -7% -7% -29%
Table 4.7. ETS WEM GHG emissions aggregated by source category (Gg CO2 eq.) 2005-2040
Gg CO2 eq. 2005 2016 2020 2030 2040
ENERGY 4377 3899 3394 3089 1660
INDUSTRY 882 894 1082 1082 1082
AGRICULTURE 0 0 0 0 0
WASTE 0 0 0 0 0
ETS TOTAL (excl. LULUCF) 5259 4793 4476 4171 2742
0
1000
2000
3000
4000
5000
6000
7000
8000
9000
20
05
20
07
20
09
20
11
20
13
20
15
20
17
20
19
20
21
20
23
20
25
20
27
20
29
20
31
20
33
20
35
20
37
20
39
Gg
CO
2 e
q.
ETS
ESD

106 | C y p r u s ’ N E C P 2 0 2 1 - 2 0 3 0
Change compared to 2005 -9% -15% -21% -48%
Change compared to BaU -10% -4% -41%
Table 4.8. ESR WEM GHG emissions aggregated by source category (Gg CO2 eq.) 2005-2040
Gg CO2 eq. 2005 2016 2020 2030 2040
ENERGY 2749 2577 2816 2779 2612
INDUSTRY 185 356 365 374 371
AGRICULTURE 535 476 489 508 494
WASTE 486 554 494 361 221
ETS TOTAL (excl. LULUCF) 3954 3964 4164 4022 3698
Change compared to 2005 0% 5% 2% -6%
Change compared to BaU -3% -10% -17%
Figure 4.3. ESR, ETS and Total WEM GHG emissions for the period 2005-2040 (Gg CO2 eq.)
4.2.2. Renewable energy
i. Current share of renewable energy in gross final energy consumption and
in different sectors (heating and cooling, electricity and transport) as well
as per technology in each of these sectors
iii. Indicative projections of development with existing policies for the year
2030 (with an outlook to the year 2040)
4.3. Dimension Energy efficiency
i. Current primary and final energy consumption in the economy and per
sector (including industry, residential, service and transport)
Table 4.9. Current primary and final energy consumption in the economy and per sector
0
2000
4000
6000
8000
10000
12000
20
05
20
07
20
09
20
11
20
13
20
15
20
17
20
19
20
21
20
23
20
25
20
27
20
29
20
31
20
33
20
35
20
37
20
39
Gg
CO
2 e
q.
ETS
ESD

107 | C y p r u s ’ N E C P 2 0 2 1 - 2 0 3 0
ii. Current potential for the application of high-efficiency cogeneration and
efficient district heating and cooling
The Comprehensive assessment of the potential for the application of high-efficiency
cogeneration and efficient district heating and cooling identified an economic potential for
high-efficiency cogeneration of around 50 MW in 2020.
iii . Projections considering existing energy efficiency policies, measures and
programmes as described under 1.2. ii) for primary and final energy
consumption for each sector at least until 2040 (including for the year
2030)
Table 4.10. Sectoral energy projections for 2030 With Existing Measures
Sectoral projections for 2030 With Existing Measures (Mtoe) With Existing
Measures
Primary Energy Consumption 2,8
Total final energy consumption 2,3
Final energy consumption - industry 0,3
Final energy consumption - households 0,5
Final energy consumption - agriculture 0,05
Final energy consumption - transport 1,2
Final energy consumption - services 0,3
Indicator Name Value Unit(s)Eurostat
Indicator(s)Eurostat database table
Eurostat
Code
Last update (date of the
data)
primary energy
consumption2.4 Mtoe
Primary Energy
Consumption
Energy saving - annual data
[nrg_ind_334a]B_100910 2/1/2018
total final energy
consumption1.758 ktoe
Final Energy
Consumption
Supply, transformation,
consumption - all products -
annual data [nrg_100a]
B_101700 31/05/2018
final energy
consumption -
industry
213.3 ktoe
Final Energy
Consumption -
Industry
Supply, transformation,
consumption - all products -
annual data [nrg_100a]
B_101800 31/05/2018
final energy
consumption -
transport
931.1 ktoe
Final Energy
Consumption -
Transport
Supply, transformation,
consumption - all products -
annual data [nrg_100a]
B_101900 31/05/2018
final energy
consumption -
households
326.3 ktoe Residential
Supply, transformation,
consumption - all products -
annual data [nrg_100a]
B_102010 31/05/2018
final energy
consumption - services225.5 ktoe Services
Supply, transformation,
consumption - all products -
annual data [nrg_100a]
B_102035 31/05/2018
final energy
consumption -
agriculture
43.3 ktoeAgriculture/For
estry
Supply, transformation,
consumption - all products -
annual data [nrg_100a]
B_102030 31/05/2018
final energy
consumption – other
sectors
613.6 ktoe Other sectors
Supply, transformation,
consumption - all products -
annual data [nrg_100a]
B_102000 31/05/2018
CYPRUS Eurostat data - 2016 (as available on 28/11/2018)

108 | C y p r u s ’ N E C P 2 0 2 1 - 2 0 3 0
iv. Cost-optimal levels of minimum energy performance requirements
resulting from national calculations, according to Article 5 of Directive
2010/31/EU
The cost – optimal levels of minimum energy performance requirements have been
calculated for second time in 2018. According, to the results for new building the NZEB are at
the cost optimum levels, except hotels. Renovated buildings could achieve higher levels of
energy performance, which currently is energy class B in order to achieve cost optimum
levels. In general, it is indicated that existing building envelope requirements are much or
less at cost optimum level, while more penetration of efficient lighting and PVs could better
cost – optimality from the investor’s point of view. Based on the results of cost-optimum
calculation minimum energy performance requirement will be revised in 2019.
4.4. Dimension Energy security
i. Current energy mix, domestic energy resources, import dependency,
including relevant risks
Data for Cyprus energy mix for 2017
RES MToe Oil MToe Other (Industrial waste) MToe
Domestic Sources 0,122 0 0.003
Imports 0.037 2.278 0.018
Current Import dependency is at 95%
ii. Projections of development with existing policies and measures at least
until 2040 (including for the year 2030)
It is not applicable at the moment.
4.5. Dimension Internal energy market
4.5.1. Electricity interconnectivity
i. Current interconnection level and main interconnectors
0%
ii. Projections of interconnector expansion requirements (including for the
year 2030)
It will be set later.
4.5.2. Energy transmission infrastructure
i. Key characteristics of the existing transmission infrastructure for
electricity and gas
For electricity transmission infrastructure see Sections 2.4.2, 3.4.1. and 3.4.2.
At the moment there is no gas transmission infrastructure.

109 | C y p r u s ’ N E C P 2 0 2 1 - 2 0 3 0
ii. Projections of network expansion requirements at least until 2040
(including for the year 2030)
See Sections 2.4.2, 3.4.1. and 3.4.2.
4.5.3. Electricity and gas markets, energy prices
i. Current situation of electricity and gas markets, including energy prices
See Sections 2.4.3 and 3.4.3.
ii. Projections of development with existing policies and measures at least
until 2040 (including for the year 2030)
It will be set later.
4.6. Dimension Research, innovation and competitiveness
i. Current situation of the low-carbon-technologies sector and, to the extent
possible, its position on the global market (this analysis should be done on
the European and/or global level)
According to Smart Specialization Strategy, Cyprus has a high level of research potential in
human capital that should be exploited to the greatest extent possible. This potential must
include Cypriot scientists living and working outside Cyprus and foreigners working in Cyprus.
Additionally, the development of public and private universities the last 10 years has
significantly improved the research facilities. Especially, the establishment of research
centers of KOIOS and FOSS by University of Cyprus and the establishment of Cyprus Institute
have provided useful infrastructure dedicated research and innovation in energy and climate.
Recent developments in establishing centers of excellence in research like RISE are expected
to further improve infrastructure.
ii. Current level of public and, if available, private research and innovation
spending on low-carbon-technologies, current number of patents, and
current number of researchers
The current level of public finance is estimated to be less than 10m Euro per year.
iii. Breakdown of current price elements that make up the main three price
components (energy, network, taxes/levies)
Considering electricity prices for commercial consumers EAC which is the only supplier,
implements five tariffs as follows:
1) Low Voltage Single Sign-On Bimonthly Tariff (Code 10)
The charges, at a basic fuel price of € 300 / MT, for every two months for a supply electricity
according to this tariff are:
Energy Cost per Unit Provided 9.51 Cent
Network Cost per Unit Provided 3.21 Cent
Cost of Ancillary Services for each unit provided 0.67 cent
Cost of Metering € 0,98

110 | C y p r u s ’ N E C P 2 0 2 1 - 2 0 3 0
Cost of Supply € 4,68
2) Low Voltage Subscription Binomial Industrial Use (Code 20)
The charges, at a basic fuel price of € 300 / MT, for every two months for a supply electricity
according to this tariff are:
Energy costs per unit provided 9.57 cent
Network Cost per Unit Provided 3.22 Cent
Cost of Ancillary Services for each unit provided 0.67 cent
Cost of Metering € 0,98
Cost of Supply € 4,68
3) Monthly Seasonal Double Use Commercial and Industrial Use Low Voltage Recording
(Code 30)
Table 4.11. Monthly Seasonal Double Use Commercial and Industrial Use Low Voltage Recording
(Code 30)
Charge per unit provided cent / kWh Monthly
charge €
Period October – May June – September
Weekdays Weekends
and
holidays
Weekdays Weekends
and
holidays
Energy
costs
Peak 8,89 8,54 14,29 8,61 -
Out of peak 7,63 7,25 8,49 8,31 -
Network
Cost
Peak 3,21 3,21 3,24 3,21 -
Out of peak 3,21 3,21 3,21 3,21 -
Cost of
Ancillary
Services
Peak 0,67 0,67 0,67 0,67 -
Out of peak 0,67 0,67 0,67 0,67 -
Cost of
Metering
- - - - - 0,49
Cost of
Supply
- - -- - - 2,34
4) Monthly Seasonal Double Use Commercial and Industrial Use Medium Voltage
Recording (Code 40)
Table 4.12. Monthly Seasonal Double Use Commercial and Industrial Use Medium Voltage Recording
(Code 40)
Charge per unit provided cent / kWh Monthly
charge €
Period October – May June – September
Weekdays Weekends
and
holidays
Weekdays Weekends
and
holidays
Energy
costs
Peak 8,72 8,38 13,83 8,45 -
Out of peak 7,49 7,12 8,34 8,15 -
Network Peak 2,03 2,03 2,04 2,03 -

111 | C y p r u s ’ N E C P 2 0 2 1 - 2 0 3 0
Cost Out of peak 2,03 2,03 2,03 2,03 -
Cost of
Ancillary
Services
Peak 0,66 0,66 0,66 0,66 -
Out of peak 0,66 0,66 0,66 0,66 -
Cost of
Metering
- - - - - 0,49
Cost of
Supply
- - -- - - 2,34
5) Monthly Seasonal Double Use Commercial and Industrial Use High Voltage Recording
(Code 50)
Table 4.13. Monthly Seasonal Double Use Commercial and Industrial Use High Voltage Recording
(Code 50)
Charge per unit provided cent / kWh Monthly
charge €
Period October – May June – September
Weekdays Weekends
and
holidays
Weekdays Weekends
and
holidays
Energy
costs
Peak 8,58 8,25 13,46 8,31 -
Out of peak 7,37 7,00 8,20 8,02 -
Network
Cost
Peak 0,70 0,70 0,70 0,70 -
Out of peak 0,70 0,70 0,70 0,70 -
Cost of
Ancillary
Services
Peak 0,65 0,65 0,65 0,65 -
Out of peak 0,65 0,65 0,65 0,65 -
Cost of
Supply
- - -- - - 2,34
For all above tariffs EAC imposes the following additional charges:
1. 0,01€/kWh for the special fund for RES and Energy Conservation (no VAT is imposed on
this charge)
2. 0,00065 €/kWh public benefit obligations
3. 19% VAT
iiia. Description of energy subsidies, including for fossil fuels
For vulnerable consumers the tariff with code 08 is applicable. The following categories of
customers are eligible provided they are Cypriot citizens or citizens of any other MS or
citizens with equal rights to the above, who are legally residing in the areas controlled by the
Republic of Cyprus:
1. Large families. For the purpose of this tariff large family is defined as a family that
receives Child Benefit from the Welfare Benefits Administration Service of the Ministry
of Labour, Welfare and Social Insurance for three or more dependent children and with
an annual combined family income of up to €51.258. The annual combined family

112 | C y p r u s ’ N E C P 2 0 2 1 - 2 0 3 0
income criterion is increased by €5.126 for every additional child over the number of
four.
2. Public Assistance recipients from the Social Welfare Services of the Ministry of Labour,
Welfare and Social Insurance.
3. Beneficiaries of Guaranteed Minimum Income provided by the Welfare Benefits
Administration Service of the Ministry of Labour, Welfare and Social Insurance.
4. Beneficiaries of Severe Motor Disability Allowance from the Department for Social
Inclusion of Persons with Disabilities of the Ministry of Labour, Welfare and Social
Insurance.
5. Beneficiaries of Care Allowance for Quadriplegic Persons from the Department for Social
Inclusion of Persons with Disabilities of the Ministry of Labour, Welfare and Social
Insurance.
6. Beneficiaries of Care Allowance for Paraplegic Persons from the Department for Social
Inclusion of Persons with Disabilities of the Ministry of Labour, Welfare and Social
Insurance.
7. Hemodialysis patients who are beneficiaries of the Mobility Allowance from the
Department for Social Inclusion of Persons with Disabilities of the Ministry of Labour,
Welfare and Social Insurance.
8. People suffering from multiple sclerosis who are registered members of Cyprus Multiple
Sclerosis Association.

113 | C y p r u s ’ N E C P 2 0 2 1 - 2 0 3 0
5. Impact assessment of planned policies and measures
This chapter will be prepared once the draft final submission is ready (end of 2019).

114 | C y p r u s ’ N E C P 2 0 2 1 - 2 0 3 0
Part 2
List of parameters and variables to
be reported in Section B of National
Plans
The following parameters, variables, energy balances and indicators are to be reported in Section B
'Analytical Basis' of the National Plans, if used.

115 | C y p r u s ’ N E C P 2 0 2 1 - 2 0 3 0
1. General parameters and variables
(1) Population [million]
Population [million]
2017 0.8642
2018 0.8695
2019 0.8749
2020 0.8806
2021 0.8862
2022 0.8917
2023 0.8972
2024 0.9025
2025 0.9076
2026 0.9126
2027 0.9174
2028 0.9219
2029 0.9262
2030 0.9304
2031 0.9343
2032 0.9380
2033 0.9416
2034 0.9450
2035 0.9483
2036 0.9515
2037 0.9547
2038 0.9578
2039 0.9608
2040 0.9638
(2) GDP [euro million]
GDP [euro million]
2017 19488.7
2018 20276.7
2019 21051.4
2020 21763.1
2021 22425.6
2022 23031.1
2023 23606.9
2024 24149.9
2025 24632.9
2026 25125.5

116 | C y p r u s ’ N E C P 2 0 2 1 - 2 0 3 0
2027 25628.0
2028 26140.6
2029 26663.4
2030 27196.7
2031 27740.6
2032 28295.4
2033 28861.3
2034 29438.6
2035 30027.3
2036 30627.9
2037 31240.4
2038 31865.2
2039 32502.5
2040 33152.6
(3) Sectorial gross value added (including main industrial, construction,
services, and agriculture sectors) [euro million]
(4) Number of households [thousands]
(5) Household size [inhabitants/households]
(6) Disposable income of households [euro]
(7) Number of passenger-kilometres: all modes, i.e. split between road (cars
and buses separated if possible), rail, aviation and domestic navigation
(when relevant) [million pkm]
(8) Freight transport tonnes-kilometres: all modes excluding international
maritime, i.e. split between road, rail, aviation, domestic navigation
(inland waterways and national maritime) [million tkm]
(9) International oil, gas and coal fuel import prices [euro/GJ or euro/toe]
based on the Commission's recommendations
(10) EU-ETS carbon price [euro/EUA] – based on the Commission's
recommendations
(11) Exchange rates to euro and to US Dollar (if applicable) assumptions [euro/
currency and USD/currency]
(12) Number of Heating Degree Days (HDD)
(13) Number of Cooling Degree Days (CDD)
(14) Technology cost assumptions used in modelling for main relevant
technologies

117 | C y p r u s ’ N E C P 2 0 2 1 - 2 0 3 0
2. Energy balances and indicators
2.1. Energy supply
(1) Indigenous Production by fuel type (all energy products that are produced
in significant quantities) [ktoe]
(2) Net imports by fuel type (including electricity and split into intra- and
extra EU net imports) [ktoe]
(3) Import dependency from third countries [%]
(4) Main import sources (countries) for main energy carriers (including gas
and electricity)
(5) Gross Inland Consumption by fuel type source (including solids, all energy
products: coal, crude oil and petroleum products, natural gas, nuclear
energy, electricity, derived heat, renewables, waste) [ktoe]
2.2. Electricity and heat
(1) Gross electricity generation [GWh]
(2) Gross electricity generation by fuel (all energy products) [GWh]
(3) Share of combined heat and power generation in total electricity and heat
generation [%]
(4) Capacity electricity generation by source including retirements and new
investments [MW]
(5) Heat generation from thermal power generation
(6) Heat generation from combined heat and power plants, including
industrial waste heat
(7) Cross-border interconnection capacities for gas and electricity [Definition
for electricity in line with outcome of ongoing discussions on basis for 15%
interconnection target] and their projected usage rates
2.3. Transformation sector
(1) Fuel inputs to thermal power generation (including solids, oil, gas) [ktoe]
(2) Fuel inputs to other conversion processes [ktoe]
2.4. Energy consumption
(1) Primary and final energy consumption [ktoe]

118 | C y p r u s ’ N E C P 2 0 2 1 - 2 0 3 0
(2) Final energy consumption by sector (including industry, residential,
tertiary, agriculture and transport (including split between passenger and
freight transport, when available)) [ktoe]
(3) Final energy consumption by fuel (all energy products) [ktoe]
(4) Final non-energy consumption [ktoe]
(5) Primary energy intensity of the overall economy (primary energy
consumption per GDP [toe/euro]
(6) Final energy intensity by sector (including industry, residential, tertiary
and transport (including split between passenger and freight transport,
when available))
2.5. Prices
(1) Electricity prices by type of using sector (residential, industry, tertiary)
(2) National retail fuel prices (including taxes, per source and sector)
[euro/ktoe]
2.6. Investments
Investment costs in energy transformation, supply, transmission and distribution sectors.
2.7. Renewables
(1) Gross final consumption of energy from renewable sources and share of
renewable energy in gross final energy consumption and by sector
(electricity, heating and cooling, transport) and by technology
(2) Electricity and heat generation from renewable energy in buildings (as
defined in Article 2(1) of Directive 2010/31/EU); this shall include, where
available, disaggregated data on energy produced, consumed and injected
into the grid by solar photovoltaic systems, solar thermal systems,
biomass, heat pumps, geothermal systems, as well as all other
decentralized renewables systems)
(3) If applicable, other national trajectories, including long-term or sectorial
ones (the share of food-based and advanced biofuels, the share of
renewable energy in district heating, as well as the renewable energy
produced by cities and energy communities as defined by Article 22 of
[recast of Directive 2009/28/EC as proposed by COM(2016) 767])

119 | C y p r u s ’ N E C P 2 0 2 1 - 2 0 3 0
3. GHG emissions and removals related indicators
(1) GHG emissions by policy sector (EU ETS, Effort Sharing Regulation and
LULUCF)
LULUCF emissions have not been estimated.
Gg CO2 eq. BaU WEM
ESD ETS TOTAL ESD ETS TOTAL
2021 4350 4993 9343 4212 3826 8038
2022 4358 4984 9343 4189 3820 8009
2023 4369 4974 9343 4167 3955 8122
2024 4377 4126 8503 4150 4020 8169
2025 4392 4167 8559 4131 4110 8241
2026 4406 4209 8615 4110 4157 8267
2027 4420 4247 8667 4089 4179 8268
2028 4433 4286 8719 4067 4213 8281
2029 4446 4325 8771 4045 4260 8305
2030 4458 4366 8824 4022 4171 8193

120 | C y p r u s ’ N E C P 2 0 2 1 - 2 0 3 0
(2) GHG emissions by IPCC sector and by gas (where relevant split into EU ETS and Effort Sharing sectors) [tCO2eq]
BaU Gg CO2 eq. 2021 2022 2023 2024 2025 2026 2027 2028 2029 2030
ESD Energy 2859 2850 2844 2835 2833 2831 2828 2825 2821 2817
IPPU 369 371 374 376 378 381 383 385 387 389
Agriculture 529 530 530 531 531 532 533 533 534 535
Waste 593 607 621 635 649 662 676 690 704 718
TOTAL 4350 4358 4369 4377 4392 4406 4420 4433 4446 4458
ETS Energy 3910 3902 3892 3044 3085 3126 3164 3203 3243 3284
IPPU 1082 1082 1082 1082 1082 1082 1082 1082 1082 1082
Agriculture 0 0 0 0 0 0 0 0 0 0
Waste 0 0 0 0 0 0 0 0 0 0
TOTAL 4993 4984 4974 4126 4167 4209 4247 4286 4325 4366
TOTAL Energy 6770 6752 6735 5879 5918 5957 5993 6028 6064 6101
IPPU 1451 1454 1456 1458 1461 1463 1465 1467 1469 1471
Agriculture 529 530 530 531 531 532 533 533 534 535
Waste 593 607 621 635 649 662 676 690 704 718
TOTAL 9343 9343 9343 8503 8559 8615 8667 8719 8771 8824
WEM ESD Energy 2822 2813 2806 2804 2802 2799 2796 2791 2786 2779
IPPU 366 367 368 369 370 371 372 373 373 374
Agriculture 520 519 517 516 515 513 512 511 509 508
Waste 504 490 476 460 444 426 409 393 377 361
TOTAL 4212 4189 4167 4150 4131 4110 4089 4067 4045 4022
ETS Energy 2743 2738 2873 2937 3028 3075 3096 3131 3178 3089
IPPU 1082 1082 1082 1082 1082 1082 1082 1082 1082 1082
Agriculture 0 0 0 0 0 0 0 0 0 0
Waste 0 0 0 0 0 0 0 0 0 0
TOTAL 3826 3820 3955 4020 4110 4157 4179 4213 4260 4171
TOTAL Energy 5565 5550 5678 5741 5830 5874 5892 5922 5964 5868
IPPU 1449 1450 1451 1452 1453 1454 1454 1455 1455 1456
Agriculture 520 519 517 516 515 513 512 511 509 508
Waste 504 490 476 460 444 426 409 393 377 361
TOTAL 8038 8009 8122 8169 8241 8267 8268 8281 8305 8193

121 | C y p r u s ’ N E C P 2 0 2 1 - 2 0 3 0
(3) Carbon intensity of the overall economy [tCO2eq/GDP]
BaU WEM
GDP [euro million]
Emissions (Gg CO2 eq.)
C intensity t CO2 eq./ml €
Emissions (Gg CO2 eq.)
C intensity t CO2 eq./ml €
2021 22426 9343 416.6 8038 358.4
2022 23031 9343 405.7 8009 347.8
2023 23607 9343 395.8 8122 344.1
2024 24150 8503 352.1 8169 338.3
2025 24633 8559 347.5 8241 334.6
2026 25126 8615 342.9 8267 329.0
2027 25628 8667 338.2 8268 322.6
2028 26141 8719 333.5 8281 316.8
2029 26663 8771 329.0 8305 311.5
2030 27197 8824 324.5 8193 301.2
(4) CO2 emission related indicators
(a) GHG intensity of domestic power and heat generation [tCO2eq/MWh]
(b) GHG intensity of final energy consumption by sector [tCO2eq/toe]
(5) Non-CO2 emission related parameters
(a) Livestock: dairy cattle [1000 heads], non-dairy cattle [1000 heads], sheep [1000
heads], pig [1000 heads], poultry [1000 heads]
dairy cattle
[1000 heads]
non-dairy cattle
[1000 heads]
sheep [1000
heads]
pig [1000
heads]
poultry [1000
heads]
2017 29.8 35.7 313.3 355.7 3326.5
2018 29.8 35.7 316.4 359.2 3359.1
2019 29.8 35.7 319.4 359.2 3391.8
2020 29.8 35.7 319.4 362.7 3424.4
2021 34.2 38.0 334.6 373.3 3522.2
2022 34.2 38.0 334.6 373.3 3522.2
2023 34.2 38.0 334.6 373.3 3522.2
2024 34.2 38.0 334.6 373.3 3522.2
2025 34.2 38.0 334.6 373.3 3522.2
2026 34.2 38.0 334.6 373.3 3522.2
2027 34.2 38.0 334.6 373.3 3522.2
2028 34.2 38.0 334.6 373.3 3522.2
2029 34.2 38.0 334.6 373.3 3522.2
2030 34.2 38.0 334.6 373.3 3522.2
2031 34.2 38.0 334.6 373.3 3522.2
2032 34.2 38.0 334.6 373.3 3522.2
2033 34.2 38.0 334.6 373.3 3522.2
2034 34.2 38.0 334.6 373.3 3522.2
2035 34.2 38.0 334.6 373.3 3522.2
2036 34.2 38.0 334.6 373.3 3522.2

122 | C y p r u s ’ N E C P 2 0 2 1 - 2 0 3 0
2037 34.2 38.0 334.6 373.3 3522.2
2038 34.2 38.0 334.6 373.3 3522.2
2039 34.2 38.0 334.6 373.3 3522.2
2040 34.2 38.0 334.6 373.3 3522.2
(b) Nitrogen input from application of synthetic fertilizers [kt nitrogen]
Assumed constant as 2016 for the period 2017-2040, i.e. 8.073 kt nitrogen.
(c) Nitrogen input from application of manure [kt nitrogen]
Nitrogen input from application of manure [kt nitrogen]*
2017 12.357
2018 12.698
2019 12.807
2020 12.897
2021 12.935
2022 13.616
2023 13.620
2024 13.625
2025 13.629
2026 13.633
2027 13.637
2028 13.642
2029 13.646
2030 13.650
2031 13.654
2032 13.659
2033 13.663
2034 13.667
2035 13.671
2036 13.675
2037 13.680
2038 13.684
2039 13.688
2040 13.692
* including volatilisation
(d) Nitrogen fixed by N-fixing crops [kt nitrogen]
Included in Nitrogen in crop residues returned to soils, see next paragraph.
(e) Nitrogen in crop residues returned to soils [kt nitrogen]
Nitrogen fixed by N-fixing crops [kt nitrogen]
2017 0.248
2018 0.250
2019 0.251
2020 0.253

123 | C y p r u s ’ N E C P 2 0 2 1 - 2 0 3 0
2021-2040 0.254
(f) Area of cultivated organic soils [hectares]
Cultivation of organic soils does not occur in Cyprus.
(g) Municipal solid waste (MSW) generation
Total MSW production (1000t) - wet mass
2017 563.8
2018 573.1
2019 581.4
2020 589.5
2021 598.4
2022 607.2
2023 616.3
2024 625.5
2025 634.9
2026 644.7
2027 654.8
2028 665.5
2029 676.7
2030 688.5
2031 693.7
2032 703.2
2033 712.6
2034 722.1
2035 731.5
2036 741.0
2037 750.4
2038 759.9
2039 769.3
2040 778.8
(h) Municipal solid waste (MSW) going to landfills
Municipal solid waste (MSW) going to landfills
Without measures scenario With measures
scenario
With additional
measures scenario
2017 423.78 315.57 315.57
2018 430.75 320.76 320.76
2019 437.03 325.44 325.44
2020 443.12 329.97 329.97
2021 449.77 269.86 269.86
2022 456.40 256.73 256.73
2023 463.25 243.21 243.21
2024 470.18 229.21 229.21
2025 477.23 214.75 214.75

124 | C y p r u s ’ N E C P 2 0 2 1 - 2 0 3 0
2026 484.58 213.22 213.22
2027 492.16 211.63 211.63
2028 500.20 210.08 210.08
2029 508.63 208.54 208.54
2030 517.54 207.02 207.02
2031 521.44 203.36 203.36
2032 528.55 200.85 200.85
2033 535.65 198.19 198.19
2034 542.75 195.39 195.39
2035 549.85 192.45 192.45
2036 556.95 194.93 194.93
2037 564.05 197.42 197.42
2038 571.15 199.90 199.90
2039 578.25 202.39 202.39
2040 585.35 204.87 204.87
(i) Share of CH4 recovery in total CH4 generation from landfills [%]
Biogas recovery from landfills does not occur in “Without Measures” scenario.
Biogas recovery assumed 20% in “With Existing Measures” scenario.
Biogas recovery assumed 30% in “With Additional Measures” scenario.

125 | C y p r u s ’ N E C P 2 0 2 1 - 2 0 3 0
References
Kythreotou N., T. Mesimeris, 2018, Cyprus National Greenhouse Gas Inventory 2018 – submitted to
the UNFCCC secretariat according to the United Nations Convention on Climate Change and the Kyoto
Protocol. Version 1.3; May 2018 submission. Department of Environment – Ministry of Agriculture,
Rural Development and Environment.
Zachariadis T., P. Hadjinicolaou , 2014, The effect of climate change on electricity needs – A case study
from Mediterranean Europe. Energy 76:899 - 910

126 | C y p r u s ’ N E C P 2 0 2 1 - 2 0 3 0
Appendices

127 | C y p r u s ’ N E C P 2 0 2 1 - 2 0 3 0
Appendix I: List of technical assistance projects completed
Description Grant Agreement
or Contractor
Status
Workshop on Electricity Market set-up by providing advice on
the planned market model
FSR Complete
2014
“Energy Efficiency: Technical Assistance in the framework of
the directive 2012/27/EU for the assessment of the potential
for the application of high efficiency cogeneration and efficient
district heating and cooling in Cyprus and identify measures to
exploit it a cost effective manner”
JRC Complete
2015
Conference ‘Heating and cooling in the European energy
transition’
SRSS Complete
2015
Impact Assessment regarding the implementation of the
proposed Final Detailed Electricity Market Design in Cyprus
E3MLAB Complete
2015
Workshop "Supporting investments in Smart Grids in
2014-2020 JASPERS Networking Platform"
SRSS Complete
2015
Workshop "Cost Benefit Analysis of Smart Metering Systems" SRSS Complete
2015
ClimaMed2015 SRSS Complete
2015
Technical assistance for assessing the current state of the
transmission and distribution electricity systems and proposing
optimum solutions for increasing the amount of Renewable
Energy Sources (RES) generation that can be fed on the
electricity system
JRC
Complete
10/07/2016
MESSAGE (Model for Energy Supply Strategy Alternatives and
their General Environmental Impacts) tool
KTH
Complete
05/02/2016
Energy Efficiency in Buildings: Technical Assistance in the
framework of the Directive 2 2012/27/EU for the preparation
of the long-term strategy for mobilizing investment in
renovating Cyprus national building stock and Directive
2010/31/EU for the Promotion of the transition toward Nearly
Zero Energy Buildings (NZEB) for improving the energy
efficiency and reducing the cost of energy bills in the buildings
sector”
JRC Complete
29/07/2016
Development of a cogeneration/trigeneration feasibility tool Ricardo-AEA Complete
26/12/2016
“Technical Assistance for energy efficiency and sustainable
transport in Cyprus”
Technical Assistance in order to assess and formulate
recommendations for the promotion and penetration of and
alternative fuels in the transport sector
GIZ1 Complete
03/06/2017
Technical assistance in the form of a study for examining the
economic feasibility and technical suitability for installing
individual consumption meters in multi-apartment and multi-
purpose buildings
GIZ1 Complete
03/06/2017

128 | C y p r u s ’ N E C P 2 0 2 1 - 2 0 3 0
Description Grant Agreement
or Contractor
Status
Technical assistance in order to make a comprehensive study
for assessing the Cypriot energy efficiency potential and
propose a strategy to exploit it
GIZ1 Complete
03/06/2017
Technical Assistance in order to design an Energy Efficiency
Awareness Campaign in the Republic of Cyprus
GIZ1 Complete
03/06/2017
Support to MECIT Trade and Settlement Electricity Market
Rules (‘TSRs’)
RSE Complete
03/02/2017
Training on Electricity and Gas Markets FSR Complete
09/01/2017
Development of a Heating and Cooling Strategy at Local Level RICARDO Complete
24/12/2017
Preparation of technical specifications regarding the design,
supply, installation, commissioning, setting to work and
handover of cogeneration units and an appropriate support
scheme strategy for cogeneration/trigeneration units
Costas Theofylactos Complete
24/03/2018
Development of a code of practice and rules, policies
concerning heat network operation
RICARDO Complete

129 | C y p r u s ’ N E C P 2 0 2 1 - 2 0 3 0
Appendix II: Summary table on the existing and additional
polices and measures on energy efficiency

130 | C y p r u s ’ N E C P 2 0 2 1 - 2 0 3 0
Σενάριο: «Με μέτρα»20
Τομέας
Ενότητα Χρονοδιάγραμμα υλοποίησης
Εκτίμηση Δαπάνη Αναμενόμενη συνεισφορά στις εθνικές υποχρεώσεις για την ενεργειακή απόδοση21
Σημειώσεις
Ύψος επενδυτικής δαπάνης (€)
Ύψος συνεισφοράς δημοσίου (€)
ΕΞΕ Οικιστικός Τομέας Τομέας Υπηρεσιών, Βιομηχανικός και Γεωργικός Τομέας
2019-2023 40εκ-80εκ εκατομμύρια κόστος νέων επενδύσεων ΕΞΕ
Μερική συμβολή στην επίτευξη του υποχρεωτικού στόχου ΕΞΕ κατά την τελική χρήση της περιόδου 2021-2030, που εκτιμάται προκαταρτικά στα 235,000-238,000 toe (σωρευτικά)
Το ποσό θα παρασχεθεί ως χαμηλότοκα δάνεια μέσω του δανειοδοτικού χρηματοδοτικού εργαλείου της ΓΔ ΕΠΣΑ (Διαρθρωτικά Ταμεία περιόδου 2014-2020). Δεν υπάρχει εκτίμηση για την αναμενομένη απορρόφηση σε επενδύσεις ΕΞΕ.
ΕΞΕ Τομέας Υπηρεσιών, Βιομηχανικός Τομέας
2018-2030 Δίκτυο επιχειρήσεων για την ενεργειακή απόδοση – Εθελοντικές συμφωνίες/δεσμεύσεις επιχειρήσεων για μείωση στις
Δεν εφαρμόζεται
Δέσμευση περισσότερων από 250 επιχειρήσεων (που δε συμμετέχουν στο σύστημα εμπορίας δικαιωμάτων εκπομπής
20
Σύμφωνα με τον Κανονισμό για τη Διακυβέρνηση, οι «προβλέψεις με μέτρα» αφορούν μέτρα και πολιτικές που έχουν θεσπιστεί και τεθεί σε εφαρμογή. 21
Όλα τα μέτρα συμβάλλουν και στον ενδεικτικό στόχο ΕΞΕ που μπορεί να θέσει η Κύπρος και υπολογίζεται ως «μείωση της πρωτογενούς κατανάλωσης ενέργειας κατά 9,5% το 2030, σε σχέση με την αντίστοιχη πρόβλεψη της Ε.Ε για την Κύπρο το 2007 (PRIMES REFERENCE SCENARIO 2007)». Προς την επίτευξη του ενδεικτικού στόχου συνεισφέρουν και οι σχετικές Ευρωπαϊκές Οδηγίες (ενεργειακή απόδοση των κτιρίων, ενεργειακής σήμανσης κλπ). Για το υποχρεωτικό στόχο ΕΞΕ στην τελική χρήση δεν επιτρέπεται να λογίζονται εξοικονομήσεις από εφαρμογή του υποχρεωτικά εφαρμοστέου Ευρωπαϊκού Κεκτημένου.

131 | C y p r u s ’ N E C P 2 0 2 1 - 2 0 3 0
Τομέας
Ενότητα Χρονοδιάγραμμα υλοποίησης
Εκτίμηση Δαπάνη Αναμενόμενη συνεισφορά στις εθνικές υποχρεώσεις για την ενεργειακή απόδοση21
Σημειώσεις
εκπομπές τους σε αέρια του θερμοκηπίου περισσότερο από 8% μέχρι το 2030, αναλαμβάνοντας δράσεις για μείωση της κατανάλωσης ενέργειας και πόρων, όπως βελτίωση της ενεργειακής απόδοσης, ΑΠΕ κλπ. Το κόστος επενδύσεων δεν έχει ακόμα υπολογιστεί.
αερίων του θερμοκηπίου). Δεν υπάρχει εκτίμηση για την αναμενόμενη υλοποίηση επενδύσεων ΕΞΕ.
ΕΞΕ Τομέας Υπηρεσιών, Βιομηχανικός Τομέας
2018-2030 € 20 εκατομμύρια κόστος νέων επενδύσεων για εγκατάσταση μονάδων συμπαραγωγής ηλεκτρισμού και θερμότητας υψηλής απόδοσης
Δεν εφαρμόζεται
Προώθηση μονάδων συμπαραγωγής ηλεκτρισμού και θερμότητας υψηλής απόδοσης με τη μέθοδο συμψηφισμού λογαριασμών
ΕΞΕ Τομέας Υπηρεσιών 2019-2021 € 1,2 εκατομμύρια κόστος νέων επενδύσεων για εγκατάσταση μονάδων συμπαραγωγής ηλεκτρισμού και θερμότητας υψηλής απόδοσης
€ 1,2 -Συγχρηματοδοτούμενο από τα διαρθρωτικά ταμεία (Διαρθρωτικά Ταμεία περιόδου 2014-2020).
Πιλοτική Εγκατάσταση 2 μονάδων συμπαραγωγής ηλεκτρισμού και θερμότητας υψηλής απόδοσης
ΕΞΕ Οικιστικός Τομέας Τομέας Υπηρεσιών,
2019-2030 1,5 εκ για εκστρατείες ενημέρωσης
150,000 ευρώ ετησίως
Διενέργεια ενημερωτικής εκστρατείας ετησίως με

132 | C y p r u s ’ N E C P 2 0 2 1 - 2 0 3 0
Τομέας
Ενότητα Χρονοδιάγραμμα υλοποίησης
Εκτίμηση Δαπάνη Αναμενόμενη συνεισφορά στις εθνικές υποχρεώσεις για την ενεργειακή απόδοση21
Σημειώσεις
Βιομηχανικός Τομέας, Τομέας Μεταφορών
πόρους από τον προϋπολογισμό του ΥΕΕΒΤ. Μικρή συνεισφορά στους στόχους ΕΞΕ. Λειτουργεί υποστηρικτικά για τα χρηματοδοτικά και άλλα κίνητρα/μέτρα.
ΕΞΕ Οικιστικός Τομέας, Τομέας Υπηρεσιών
2016-2030 Πρόσθετες επενδύσεις ΕΞΕ κυρίως σε νέα κτίρια πολυκατοικιών και ξενοδοχείων που υπερβαίνουν τις ελάχιστες απαιτήσεις που ορίζει ο Νομός. Το κόστος επενδύσεων δεν έχει ακόμα υπολογιστεί.
Δεν εφαρμόζεται
Πολεοδομικό κίνητρο για αύξηση του συντελεστή δόμησης σε κτίρια, εφόσον ικανοποιήσουν επίπεδο ενεργειακής απόδοσης , υψηλότερο των ελάχιστων απαιτήσεων που ορίζει ο Νόμος.
ΕΞΕ Οικιστικός Τομέας, Τομέας Υπηρεσιών
2016-2030 Μειωμένος συντελεστής ΦΠΑ για εργασίες ενεργειακής αναβάθμισης σε υφιστάμενα κτίρια. Το κόστος επενδύσεων δεν έχει ακόμα υπολογιστεί.
Δεν εφαρμόζεται
Δεν εκτιμάται μεγάλη συνεισφορά. Κυρίως οι επενδύσεις ενεργειακής αναβάθμισης γίνονται όταν υπάρχει σχέδιο επιδότησης.
ΕΞΕ Βιομηχανικός Τομέας 2020-2030 Αύξηση της απόδοσης στις μονάδες ηλεκτροπαραγωγής λόγω της χρήσης φυσικού αερίου αντί πετρέλαιο.
Σημαντική συμβολή στη «μείωση της πρωτογενούς κατανάλωσης ενέργειας 9,5% το 2030, σε σχέση με την αντίστοιχη πρόβλεψη της Ε.Ε για την Κύπρο
Δεν συνεισφέρει στον υποχρεωτικό στόχο για εξοικονόμηση ενέργειας κατά την τελική χρήση, αλλά μόνο ενδεικτικό που αφορά μείωση της πρωτογενούς κατανάλωσης ενέργειας.

133 | C y p r u s ’ N E C P 2 0 2 1 - 2 0 3 0
Τομέας
Ενότητα Χρονοδιάγραμμα υλοποίησης
Εκτίμηση Δαπάνη Αναμενόμενη συνεισφορά στις εθνικές υποχρεώσεις για την ενεργειακή απόδοση21
Σημειώσεις
το 2007 (PRIMES REFERENCE SCENARIO 2007
ΕΞΕ Τομέας Μεταφορών-Τέλη κυκλοφορίας οχημάτων -Τροποποίηση παραμέτρων υπολογισμού Τελών Κυκλοφορίας για να ευνοούνται περισσότερο τα χαμηλών εκπομπών οχήματα που θα εγγράφονται για 1
η φορά
Εκτίμηση έναρξης – 1
ο
Τρίμηνο 2019 -
-
Μερική συμβολή στην επίτευξη του υποχρεωτικού στόχου ΕΞΕ κατά την τελική χρήση της περιόδου 2021-2030, που εκτιμάται προκαταρτικά στα 235,000-238,000 toe (σωρευτικά)

134 | C y p r u s ’ N E C P 2 0 2 1 - 2 0 3 0
Σενάριο: «Με πρόσθετα μέτρα22»
Τομέας)
Ενότητα Χρονοδιάγραμμα υλοποίησης
Εκτίμηση Δαπάνη Αναμενόμενη συνεισφορά στις εθνικές υποχρεώσεις για την ενεργειακή απόδοση27
Σημειώσεις
Ύψος επενδυτικής δαπάνης (€) Ύψος συνεισφοράς δημοσίου (€)
ΕΞΕ Οικιστικός Τομέας
2021-2030 €500 Εκατομμύρια κόστος νέων επενδύσεων (μεμονωμένα μέτρα ΕΞΕ και ενεργειακές αναβαθμίσεις), εάν υλοποιηθούν μέχρι το 2025. Το ύψος συνεισφοράς του δημοσίου δεν έχει προσδιοριστεί.
Οι ελάχιστες πρόσθετες οικονομικά αποδοτικές επενδύσεις που υπολογίστηκε ότι απαιτούνται για επίτευξη του υποχρεωτικού στόχου ΕΞΕ κατά την τελική
Οι πολιτικές που θα εφαρμοστούν δεν μπορούν στο παρόν στάδιο να καθοριστούν. Αυτές μπορεί να είναι σχέδια χορηγιών, χαμηλότοκα δάνεια/χρηματοδοτικά εργαλεία, φορολογικά μέτρα κοκ23. Πιθανές πολιτικές θα μελετηθούν περαιτέρω εντός του 2019, στα πλαίσια
ΕΞΕ Τομέας Υπηρεσιών
2021-2030 €500 Εκατομμύρια κόστος νέων επενδύσεων ΕΞΕ (μεμονωμένα μέτρα ΕΞΕ και ενεργειακές αναβαθμίσεις), εάν υλοποιηθούν μέχρι το 2025. Το ύψος συνεισφοράς του δημοσίου δεν έχει προσδιοριστεί.
22 Σύμφωνα με τον Κανονισμό για τη Διακυβέρνηση, οι «προβλέψεις με πρόσθετα μέτρα» αφορούν τις πολιτικές και μέτρα που έχουν θεσπιστεί και τεθεί σε εφαρμογή για τον μετριασμό της αλλαγής του κλίματος ή την ικανοποίηση των ενεργειακών στόχων καθώς και των προγραμματισμένων πολιτικών και μέτρων και μέτρων υπό εξέταση προς τον σκοπό αυτό. 23
Σύμφωνα με τη ΓΔ ΕΠΣΑ, τη νέα προγραμματική περίοδο 2020-2026 αναμένεται να είναι διαθέσιμοι πόροι από τα Ευρωπαϊκά ταμεία σε ποσό 30% των πόρων (που αναμένονται στα 225-250 εκ) για ΑΠΕ και ΕΞΕ. Η απορρόφηση συνήθως καθυστερεί λόγω διαδικασιών και συνεπώς δεν αναμένεται να συμβάλουν ουσιαστικά στον εθνικό υποχρεωτικό στόχο ΕΞΕ). Θα χρειαστεί η διασφάλιση και εθνικών πόρων εάν αποφασιστεί ότι θα υλοποιηθούν με Σχέδια Χορηγιών.

135 | C y p r u s ’ N E C P 2 0 2 1 - 2 0 3 0
Τομέας)
Ενότητα Χρονοδιάγραμμα υλοποίησης
Εκτίμηση Δαπάνη Αναμενόμενη συνεισφορά στις εθνικές υποχρεώσεις για την ενεργειακή απόδοση27
Σημειώσεις
χρήση της περιόδου 2021-2030, υπολογίζεται προκαταρτικά στα 235,000-238,000 toe (σωρευτικά)
τεχνικής βοήθειας που παρέχεται και θα οριστικοποιηθούν κατά την υποβολή του τελικού πρώτου σχεδίου Δράσης
Όλοι οι τομείς
2019-2030 Επιβολή σε διανομείς ενέργειας υποχρέωση για επίτευξη μέρους του σωρευτικού στόχου εξοικονόμησης ενέργειας στην τελική χρήση . Ανάλογα με το μέρος του σωρευτικού στόχου που θα επιβληθεί στους διανομείς ενέργειας οι αντίστοιχες επενδυτικής δαπάνες θα κατανεμηθούν στους διανομείς ενέργειας.
Δεν εφαρμόζεται Μερική συμβολή στην επίτευξη του υποχρεωτικού στόχου ΕΞΕ κατά την τελική χρήση της περιόδου 2021-2030, που εκτιμάται προκαταρτικά στα 235,000-238,000 toe (σωρευτικά)
Ο μηχανισμός αποσκοπεί στην ενεργή δραστηριοποίηση των διανομέων ενέργειας με σκοπό την υλοποίηση παρεμβάσεων βελτίωσης της ενεργειακής απόδοσης. Νομοθεσία σε δημόσια διαβούλευση.
ΕΞΕ Βιομηχανικός Τομέας και Γεωργικός τομέας
2021-2030 Μέτρα προώθησης μεμονωμένων μέτρων ΕΞΕ κατόπιν διενέργειας ενεργειακού ελέγχου. Το ύψος των επενδύσεων και το κόστος συνεισφοράς του δημοσίου δεν έχει
Δεν έχει προσδιοριστεί.
Σε αρχικό στάδιο. 24
24
θα μελετηθούν περαιτέρω εντός του 2019, στα πλαίσια τεχνικής βοήθειας που παρέχεται και θα οριστικοποιηθούν ορισμένες (ή συνδυασμός τους) κατά την υποβολή
του τελικού σχεδίου Δράσης το 2019

136 | C y p r u s ’ N E C P 2 0 2 1 - 2 0 3 0
Τομέας)
Ενότητα Χρονοδιάγραμμα υλοποίησης
Εκτίμηση Δαπάνη Αναμενόμενη συνεισφορά στις εθνικές υποχρεώσεις για την ενεργειακή απόδοση27
Σημειώσεις
προσδιοριστεί.
ΕΞΕ Όλοι οι τομείς
2021-2030 Δημοσιονομικά ουδέτερη πράσινη φορολογική μεταρρύθμιση. Μετατόπιση των φορολογικών επιβαρύνσεων σε ρυπογόνες δραστηριότητες και τα έσοδα που προκύπτουν να επιστρέφονται στους πολίτες π.χ. με μείωση του κόστους εργασίας.
Δεν εφαρμόζεται Εξετάζεται από το Υπουργείο Οικονομικών. Σε αρχικό στάδιο.
ΕΞΕ Τομέας Υπηρεσιών
2019-2030 Αντικατάσταση λαμπτήρων οδικού φωτισμού σε Δήμους και Κοινότητες. Το κόστος δεν έχει ακόμα εκτιμηθεί.
Προωθείται δανειοδότηση από την Ευρωπαϊκή Τράπεζα Επενδύσεων
Εξετάζεται από τα Υπουργεία Εσωτερικών και Οικονομικών. Σε αρχικό στάδιο. 5
ΕΞΕ Οικιστικός τομέας και τομέας υπηρεσιών
2021-2030 Εγκατάσταση μικρής κλίμακας συστημάτων ΑΠΕ στα κτίρια
Δεν έχει εκτιμηθεί
Υπάρχουν περιορισμοί που απαιτούν να αποδεικνύεται εξοικονόμηση ενέργειας κατά την τελική χρήση, λόγω αλλαγής σε ενεργειακά αποδοτικότερη τεχνολογία.5
ΕΞΕ Οικιστικός τομέας, Τομέας Υπηρεσιών και Βιομηχανικός
2021-2030 Προώθηση μέτρων εξοικονόμησης νερού και ενέργειας κατά την παραγωγή, διανομή αφαλάτωση νερού κλπ.
Δεν έχει εκτιμηθεί
Σε αρχικό στάδιο5

137 | C y p r u s ’ N E C P 2 0 2 1 - 2 0 3 0
Τομέας)
Ενότητα Χρονοδιάγραμμα υλοποίησης
Εκτίμηση Δαπάνη Αναμενόμενη συνεισφορά στις εθνικές υποχρεώσεις για την ενεργειακή απόδοση27
Σημειώσεις
Τομέας.
ΕΞΕ Τομέας Υπηρεσιών
2021-2030 Ανάπτυξη υποδομών αποδοτικής τηλεθέρμανσης και τηλεψύξης με χρήση RDF και συμπαραγωγής σε τουριστικές περιοχές.
Δεν έχει εκτιμηθεί
Σε αρχικό στάδιο5
ΕΞΕ Τομέας Υπηρεσιών
2021-2030 Λήψη μέτρων εξοικονόμησης ενέργειας στο τομέα της Άμυνας
Δεν έχει εκτιμηθεί
Σε αρχικό στάδιο5
ΕΞΕ Τομέας Υπηρεσιών
2021-2030 Επενδύσεις ενεργειακής απόδοσης στα δημόσια κτίρια για επίτευξη της νέας υποχρέωσης για 3% αναβάθμιση (ή εξοικονόμηση 3.316 GWh) ετησίως ή άλλα ισοδύναμα μέτρα. Ετοιμασία πρότυπων διαδικασιών για χρήση παροχών ενεργειακών υπηρεσιών και άρση των υφιστάμενων εμποδίων
Δεν έχει εκτιμηθεί
εξοικονόμηση 3.316 GWh ετησίως την περίοδο 2021-2030
Σε αρχικό στάδιο5
ΕΞΕ Τομέας Μεταφορών-Δημόσιες συγκοινωνίες
2023-2028 Χρήση λεωφορείων με μειωμένες εκπομπές ρύπων . €18 εκ
€18 εκ.
Μερική συμβολή στην επίτευξη του υποχρεωτικού στόχου ΕΞΕ κατά την τελική χρήση της περιόδου 2021-2030, που εκτιμάται προκαταρτικά στα 235,000-238,000 toe (σωρευτικά)
ΕΞΕ Τομέας Μεταφορών-Περιβαλλοντικοί δασμοί
2021-2030 Εισαγωγή περιβαλλοντικών δασμών για τη χρήση ιδιωτικών οχημάτων
-
ΕΞΕ Τομέας Μεταφορών-Περιορισμός της χρήση του ιδιωτικού οχήματος
2020-2030 Αύξηση της πεζής διακίνησης, και της χρήσης του ποδηλάτου και των δημόσιων μεταφορών . €2860 εκ.
€930 εκ
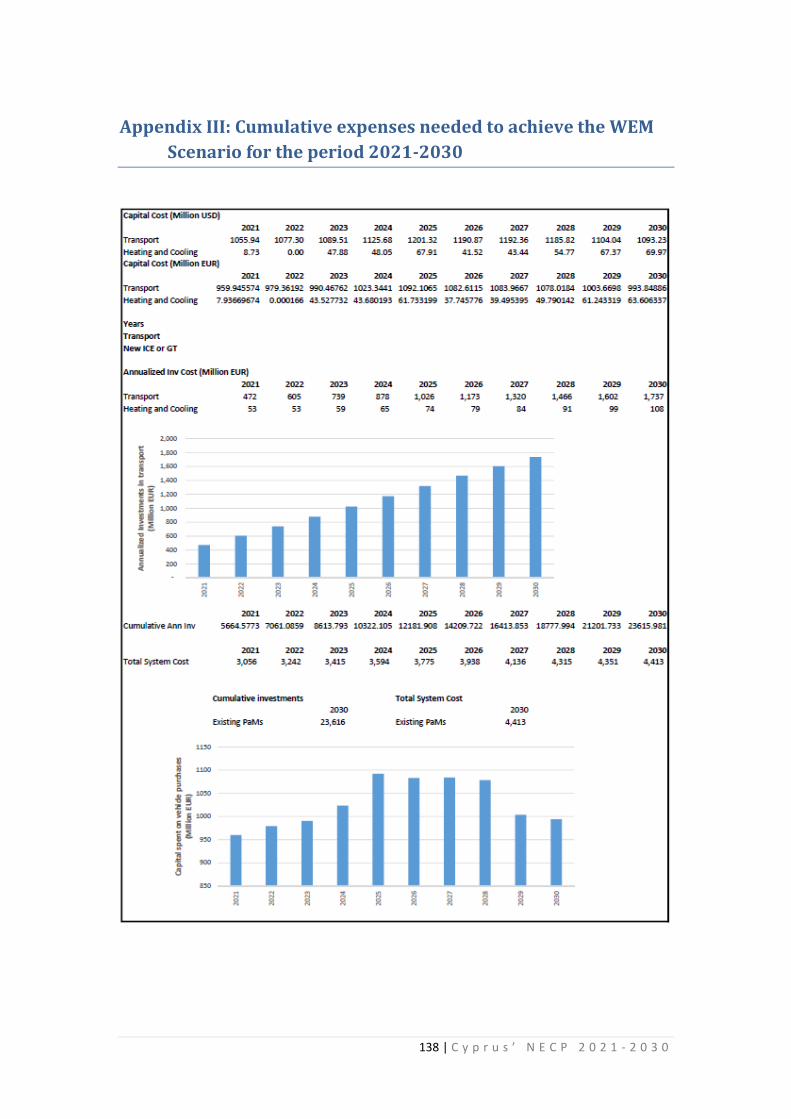
138 | C y p r u s ’ N E C P 2 0 2 1 - 2 0 3 0
Appendix III: Cumulative expenses needed to achieve the WEM
Scenario for the period 2021-2030

139 | C y p r u s ’ N E C P 2 0 2 1 - 2 0 3 0
Appendix IV: EU competitive programs related to energy and
climate for the period 2014 - 2020
HORIZON 2020
A/A Name of the
project
Participant Subject EU funding
1
Compete4SECAP
(C4S)
Cyprus Energy
Agency
Promotes the adaption of
standardized energy
management systems in local
authorities
€ 117887
2
HAPPEN Cyprus Energy
Agency
Boost building energy renovation
market, targeting the
development of NZEB
€133312
3 ENERFUND CUT– Department
of Environment,
Cyprus Energy
Cyprus
Tool for evaluating the
opportunities in building energy
renovation, similarly as banking
institutions evaluate potential
customers
CUT - €154375
Cyprus Energy
Agency - €89406
4 Energy Water Cyprus Energy
Agency
Reduction of energy consumption
by 20% in industries that they use
water
€87687.50
5 GreenS Cyprus Energy
Agency
Database to facilitate Green
Public Procurement in line with
the local authorities needs
€93325
6 ZERO-PLUS Cyprus Institute A comprehensive, cost-effective
system for Net Zero Energy (NZE)
settlements will be developed
and implemented. A primary
objective of the project will be to
develop a system whose
investment costs will be at least
16% lower than current costs
€177500
7 SUI - Smart Urban
Isle
Cyprus Institute Exploring how energy mini-
ecosystems are integrated in the
existing urban fabric, having as
main objective to move forward
with the urban energy savings
through a whole new urban
planning that allows cities to
grow in a sustainable way.
€130000
8 SOCLIMPACT Cyprus Institute Modelling downscaled Climate
Change effects and their
economic impacts in European
islands and archipelagos for 2030
– 2100 in the context of the EU
€155798

140 | C y p r u s ’ N E C P 2 0 2 1 - 2 0 3 0
A/A Name of the
project
Participant Subject EU funding
Blue Economy, and assess
corresponding decarbonization
and adaptation pathways, thus
complementing current available
projections for Europe, and
nourishing actual economic
models with non-market
assessment.
9 SMART GEMS Cyprus Institute
CUT –
Department of
Civil Engineers
Fully analyze all aspects of smart
grids targeting in the
improvement of reliability,
mitigation of security risks,
increase load shaping and energy
efficiency, optimal integration
and generation-consumption
matching as well as smart
monitoring and control.
Cyprus Institute -
€153000
CUT - €135000
10 NESTER Cyprus Institute Upgrading the scientific and
innovation performance of the
Cyprus Institute in the field of
Solar-Thermal Energy
€424940
11 INSHIP Cyprus Institute Focuses on engaging major
European research institutes with
recognized activities on Solar
Heat for Industrial Processes, into
an integrated structure
€270215
12 EoCoE Cyprus Institute Establish an Energy Oriented
Centre of Excellence for
computing applications (EoCoE).
EoCoE (pronounce “Echo”) will
use the prodigious potential
offered by the ever-growing
computing infrastructure to
foster and accelerate the
European transition to a reliable
and low carbon energy supply.
€238000
13 EMME – CARE Cyprus Institute Provides scientific, technological
and policy solutions through the
establishment of a world-class
Research and Innovation Centre
of Excellence, focusing on
environmental challenges.
€160000
14 CySTEM Cyprus Institute Consolidating and upgrading the
already substantial activity at the
Cyprus Institute in Solar Energy,
principally solar-thermal and
related activities. This will be
€3499375
(including €2.5
Million from the
EC)

141 | C y p r u s ’ N E C P 2 0 2 1 - 2 0 3 0
A/A Name of the
project
Participant Subject EU funding
accomplished by attracting and
installing a cluster of outstanding
researchers, led by a professor of
international stature to
maximally utilize and upgrade the
existing facilities, and pursue a
program of excellence in Cyprus
with local and regional focus in
the region of Eastern
Mediterranean and Middle East.
15 FLEXITRANSTORE University of
Cyprus – FOSS,
KOIOS
Aims to contribute to the
evolution towards a pan-
European transmission network
with high flexibility and high
interconnection levels. This will
facilitate the transformation of
the current energy production
mix by hosting an increasing
share of renewable energy
sources. Novel smart grid
technologies, control and storage
methods and new market
approaches will be developed,
installed, demonstrated and
tested introducing flexibility to
the European power system.
16 TwinPV University of
Cyprus – FOSS
Stimulating scientific excellence
through twinning in the quest for
sustainable energy. The concept
underpinning the project
foresees the strengthening of a
research field in an academic
institution of a low performer
country through linking
effectively with internationally-
leading research partners in the
specific field.
17 GOFLEX University of
Cyprus – FOSS
The main objective of GOFLEX is
to make a set of technology
solutions for distributed
flexibilities and automated
dynamic pricing market ready
which enables regional actors like
Generators, Prosumers, Flexible
Consumers and Demand Side
Operators, Energy Suppliers,
Microgrid Operators and Energy
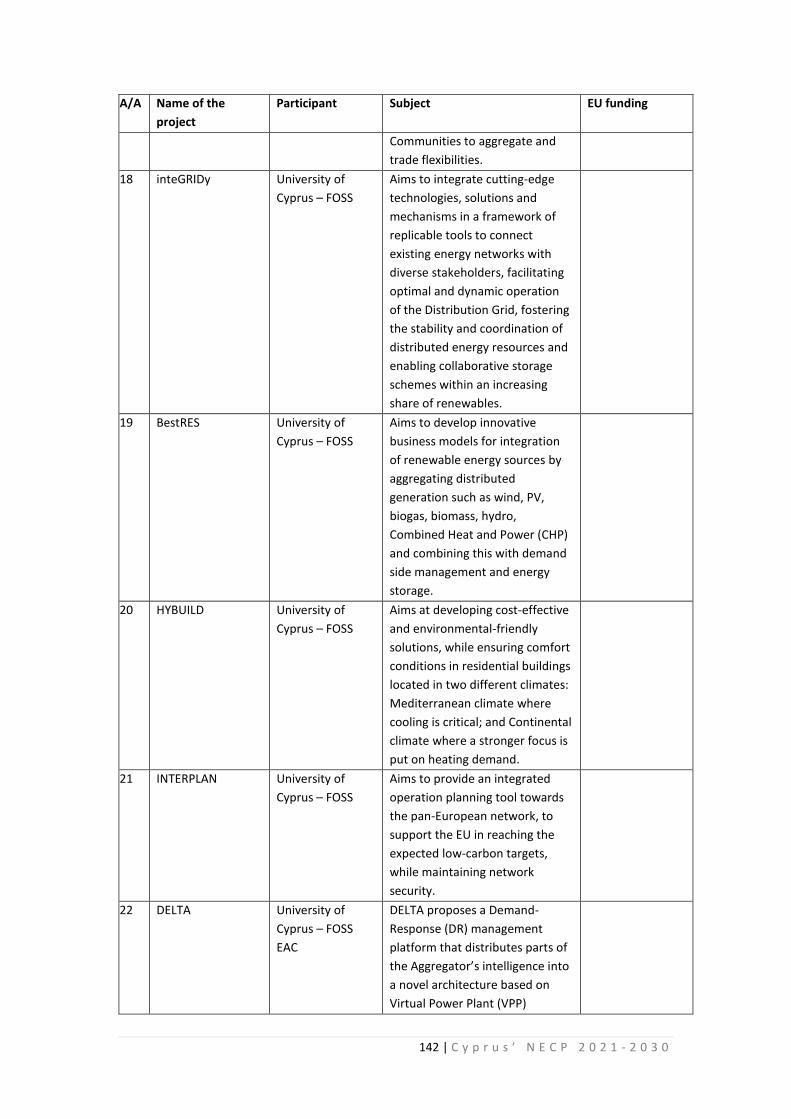
142 | C y p r u s ’ N E C P 2 0 2 1 - 2 0 3 0
A/A Name of the
project
Participant Subject EU funding
Communities to aggregate and
trade flexibilities.
18 inteGRIDy University of
Cyprus – FOSS
Aims to integrate cutting-edge
technologies, solutions and
mechanisms in a framework of
replicable tools to connect
existing energy networks with
diverse stakeholders, facilitating
optimal and dynamic operation
of the Distribution Grid, fostering
the stability and coordination of
distributed energy resources and
enabling collaborative storage
schemes within an increasing
share of renewables.
19 BestRES University of
Cyprus – FOSS
Aims to develop innovative
business models for integration
of renewable energy sources by
aggregating distributed
generation such as wind, PV,
biogas, biomass, hydro,
Combined Heat and Power (CHP)
and combining this with demand
side management and energy
storage.
20 HYBUILD University of
Cyprus – FOSS
Aims at developing cost-effective
and environmental-friendly
solutions, while ensuring comfort
conditions in residential buildings
located in two different climates:
Mediterranean climate where
cooling is critical; and Continental
climate where a stronger focus is
put on heating demand.
21 INTERPLAN University of
Cyprus – FOSS
Aims to provide an integrated
operation planning tool towards
the pan-European network, to
support the EU in reaching the
expected low-carbon targets,
while maintaining network
security.
22 DELTA University of
Cyprus – FOSS
EAC
DELTA proposes a Demand-
Response (DR) management
platform that distributes parts of
the Aggregator’s intelligence into
a novel architecture based on
Virtual Power Plant (VPP)

143 | C y p r u s ’ N E C P 2 0 2 1 - 2 0 3 0
A/A Name of the
project
Participant Subject EU funding
principles. It will establish a more
easily manageable and
computationally efficient DR
solution and will deliver
scalability and adaptiveness into
the Aggregator’s DR toolkits.
23 ESPResSo University of
Cyprus – FOSS
Targets alternative cost-effective
materials, novel cell concepts and
architectures, and advanced
processing know-how and
equipment to overcome the
current limitations of this
technology.
24 Domognostics University of
Cyprus – KOIOS
Aims at reducing energy losses in
buildings using intelligent
building automation diagnostics.
25 ODYSSEE-MURE CUT –
Department of
Environment
The general objective of the
project is to provide a
comprehensive monitoring of
energy consumption and
efficiency trends as well as an
evaluation of energy efficiency
policy measures by sector for EU
countries and Norway
€31355
26 ItHERM CUT –
Department of
Electrical
Engineering
Investigate, design, build and
demonstrate innovative plug and
play waste heat recovery
solutions to facilitate optimum
utilization of energy In selected
applications with high
replicability and energy recovery
potential in the temperature
range of 70℃ – 1000℃.
€145525
27 Sol-Pro CUT –
Department of
Mechanical
Engineering
Lifetime, cost, flexibility and non-
toxicity have to be equally
considered, regarding the
technological progress of solution
processed PVs. The ambit of the
Sol-Pro research programme is to
re-design solution processed PV
components relevant to the
above product development
targets
€1840940
INTERREG MED 2014-2020
A/A Project name Participant Subject EU funding

144 | C y p r u s ’ N E C P 2 0 2 1 - 2 0 3 0
1 LOCAL4GREEN Cyprus Energy
Agency
Implementation of new
policies specifically green tax
by local authorities to finance
and promote RES in their
territory.
€162813
2 TEESCHOOLS Cyprus Energy
Agency
New solutions in local
authorities, in technical and
financial terms, in order to
implement measures of
renovating schools of the
Mediterranean to NZEB.
€270000
3 PRISMI Cyprus Energy
Agency
Development of a
comprehensive tool box for
evaluating and mapping RES
and their penetration in island
electricity grids.
€74870
4 ENERJ Cyprus Energy
Agency
Supports local authorities in
the implementation of energy
efficiency measure in public
buildings, as part of their local
energy and climate plans.
€205340
5 Pegasus University of
Cyprus – FOSS
Aims to promote the
development of microgrids in
cities, islands and remote
areas.
6 STORES University of
Cyprus – FOSS
Boost PV self-consumption on
the Mediterranean through an
optimal storage solution.
€600000
INTERREG EUROPE 2014-2020
Α/Α Project
name
Participant Subject EU funding
1 VIOLET Cyprus Energy
Agency
Promotion and development
of policies the will upgrade the
energy performance of
historical and traditional
buildings with respect to their
heritage value
€158805
2 Resor Cyprus Energy
Agency
The aim of the project is to
support energy efficiency and
renewable energy use in
businesses of the secondary
and tertiary sector of the
partner regions by improving
current regional policies. The
project activities will envisage
an interregional learning
€143536

145 | C y p r u s ’ N E C P 2 0 2 1 - 2 0 3 0
process involving staff from
public authorities and
representatives of relevant
stakeholder groups. This
learning process will result in
the identification of best
practices for the improvement
of regional policy instruments
supporting energy efficiency
and RES use and in the draft of
Action Plans to be
implemented in each partner
region.
INTERREG Balkan Med 2014-2020
Α/Α Project
name
Participant Subject EU funding
1 ZenH Balkan Cyprus Institute Facilitate the implementation
of the EPBD by defining the
characteristics and Standards
for Zero Energy Hospitals in
the South Balkan region.
€180000
3 PV-ESTIA University of Cyprus
– FOSS
Enhancing Storage integration
in buildings with Photovoltaics
4 SMecoMP CUT – Department
of Environment
A knowledge Alliance in Eco-
Innovation Entrepreneurship
to Boost SMEs
Competitiveness
€110000
5 PRO ENERGY Cyprus Energy
Agency
Aims to address energy
efficiency of buildings by
developing and implementing
a Joint Strategy and Action
Plan, increasing competences
of buildings' owners and
operators, developing&
applying technologies and
tools to reduce energy
consumption in public
buildings, promoting
generated good practices and
results to
local/regional/national entities
in the Balkan-Med region. The
project addresses the policy
and institutional level (Joint
Strategy& Action Plan), human
resources level (Capacity
Building of Energy Managers)
€102000

146 | C y p r u s ’ N E C P 2 0 2 1 - 2 0 3 0
and the managerial systems to
reduce energy consumption,
as literature & practice
suggests.
INTERREG Greece - Cyprus 2014-2020
Α/Α Project
name
Participant Subject EU funding
1 ERMIS-F Cyprus Institute Intends to create a model of an
Integrated Public Service, a
Digital System and an Online
Information Platform regarding
floods and other natural and
environmental risks
€380000
2 STEP2SMART University of
Cyprus –
Department of
Civil Engineering
Development of a prototype
system for an open source
system of urban transport
management and their
environmental impact
3 ΕΝΕΔΗ University of
Cyprus – ΕΠΛ
Installation of PV for providing
electricity in data centers and
the development of smart
management system based on
consumption.

147 | C y p r u s ’ N E C P 2 0 2 1 - 2 0 3 0
Appendix V:
Επιτροπή για μελέτη της Πράσινης Φορολογικής Μεταρρύθμισης
Απόψεις εκπροσώπου ΓΔ Υπουργείου Ενέργειας
1. Μία καλή πράσινη φορολογική μεταρρύθμιση, που να αυξάνει τη φορολογία κατανάλωσης
ορυκτών καυσίμων, έναντι μείωσης άλλων φορολογιών, δύναται να εξυπηρετήσει του
στόχους του Υπουργείου αυτού για εξοικονόμηση ενέργειας (ΕΞΕ) και αύξηση της
διείσδυσης ανανεώσιμων πηγών ενέργειας (ΑΠΕ) καθώς και επιδίωξη των πέντε
διαστάσεων της Ευρωπαϊκής ενεργειακής ένωσης:
i. Ενεργειακή ασφάλεια,
ii. Ανταγωνιστική αγορά ενέργειας,
iii. Υψηλή ενεργειακή απόδοση,
iv. Απαλλαγή από τις ανθρακούχες εκπομπές και
v. Έρευνα, καινοτομία και ανταγωνιστικότητα.
Υπό κάποιες προϋποθέσεις ανοικτών αγορών με ελεύθερο ανταγωνισμό, και πάταξης της
φοροδιαφυγής, μία καλή φορολογική μεταρρύθμιση θα μπορούσε να αποτελέσει επαρκές
και δίκαιο κοινωνικά μέτρο για επίτευξη όλων των στόχων ΕΞΕ και ΑΠΕ.
2. Στην περίπτωση της εξοικονόμησης ενέργειας η πρόταση Ζαχαριάδη για σταδιακή εισαγωγή
εισφοράς άνθρακα ύψους €120/ τόνο αναμένεται να είναι από μόνη της επαρκές μέτρο για
επίτευξη των εθνικών ευρωπαϊκών υποχρεώσεων για την περίοδο 2021-2030.
3. Στην περίπτωση των ανανεώσιμων πηγών ενέργειας, η πρόταση Ζαχαριάδη για εξαίρεση
των οικονομικών δραστηριοτήτων που εμπίπτουν στο Σχέδιο Εμπορίας Δικαιωμάτων
Εκπομπών, που περιλαμβάνει την ηλεκτροπαραγωγή από ορυκτά καύσιμα, αναμένεται να
έχει σχετικά απροσδιόριστα αποτελέσματα, ή να απαιτήσει. Οι υφιστάμενες τιμές των
δικαιωμάτων αυτών βρίσκονται σήμερα στα €20/ τόνο, με την προοπτική του σχεδιασμού
της Ε.Επ. για €33/τόνο μέχρι το 2030. Το διαφορετικό ύψος επιβάρυνσης για καύσιμα
τελικής χρήσης και αυτών που χρησιμοποιούνται για παραγωγή ηλεκτρισμού, αναμένεται
να δημιουργήσει στρέβλωση της αγοράς προς την κατεύθυνση της κατανάλωσης ηλεκτρικής
ενέργειας, με περιορισμένο κίνητρο για περιορισμό των εκπομπών ηλεκτροπαραγωγής. Θα
πρέπει να εξεταστεί το ενδεχόμενο περιορισμού του ύψους της εισφοράς άνθρακα στα
καύσιμα τελικής χρήσης σε χαμηλότερο επίπεδο και αύξησης της εισφοράς άνθρακα στα
καύσιμα ηλεκτροπαραγωγής. Αυτό θα λειτουργήσει και ως παράγοντας σταθεροποίησης
των μακροπρόθεσμων φορολογικών εσόδων, ενόψει της αναμενόμενης μείωσης της
κατανάλωσης καυσίμων τελικής χρήσης και αύξησης της κατανάλωσης ηλεκτρισμού. Η
επιδιωκόμενη απαλλαγή από τις ανθρακούχες εκπομπές θα πρέπει να οδηγήσει σε κάποιο
στάδιο στην αναζήτηση άλλων πηγών για την αντικατάσταση των φορολογικών εσόδων από
ορυκτά καύσιμα.
4. Ένα από τα χαρακτηριστικά των αγορών ενέργειας είναι ότι βραχυπρόθεσμα παρουσιάζουν
ανελαστικότητα ζήτησης σε σχέση με τις τιμές στην αγορά, πράγμα που αντικατοπτρίζει τις
κεφαλαιουχικές επενδύσεις και τον χρόνο που χρειάζονται οι αγορές ώστε να μετακινηθούν
σε υποκατάστατα. Για αυτόν τον λόγο είναι επάναγκες να διατηρηθεί το στοιχείο της
σταδιακής εισαγωγής της εισφοράς άνθρακα. Η επέκταση της προτεινόμενης περιόδου
από έξι σε δέκα ή και 15 χρόνια θα ταιριάζει στη διάρκεια ζωής υφιστάμενων
επενδύσεων. Οι πρόσφατες ταραχές στο Παρίσι καταδεικνύουν την ευαισθησία των
πολιτών σε απότομες αλλαγές τιμών. Ιδιαίτερα όταν η αλλαγή συμπεριφοράς εκ μέρους
τους απαιτεί ταλαιπωρία ή υψηλές κεφαλαιουχικές δαπάνες.

148 | C y p r u s ’ N E C P 2 0 2 1 - 2 0 3 0
5. Η ανακοίνωση του μακροπρόθεσμου πλάνου αύξησης της εισφοράς κρίνεται απαραίτητη
για σκοπούς προγραμματισμού και ομαλής προσαρμογής της αγοράς.
6. Οι φορολογικές ελαφρύνσεις ως αντιστάθμισμα της αύξησης της φορολογίας στα ορυκτά
καύσιμα θα πρέπει να σχεδιαστούν προσεκτικά μέσα στα πλαίσια ενός κοινωνικού
διαλόγου ώστε να τύχουν γενικής αποδοχής, χωρίς να μειώνονται μακροπρόθεσμα τα
φορολογικά έσοδα. Η εισφορά άνθρακα είναι δυσνόητη έννοια για το ευρύ κοινό. Η
φορολόγηση ορυκτών καυσίμων είναι πλήρως κατανοητή και αποτελεί καλύτερη ορολογία
για σκοπούς διαλόγου. Θα πρέπει να αναμένονται αντιδράσεις από τους βαρείς
καταναλωτές ορυκτών καυσίμων: Αυτοκινητιστές, επιχειρήσεις μεταφορών, θερμάνσεις
πετρελαίου, κάποιες βιομηχανικές δραστηριότητες. Η πρόταση για μείωση των φόρων
εργασίας είναι ελκυστική βραχυπρόθεσμα. Επειδή όμως οι φορολογίες κατανάλωσης
πλήττουν περισσότερο τους πολίτες με χαμηλά εισοδήματα, είναι σημαντικό η μείωση των
φόρων εργασίας να προέλθει περισσότερο με αύξηση του αφορολόγητου εισοδήματος
παρά με τη μείωση του ανώτατου συντελεστή φορολόγησης. Μακροπρόθεσμα, η
φορολογία εργασίας είναι απαραίτητη ώστε να ικανοποιείται η απαίτηση του συντάγματος
για τη συνεισφορά στις κρατικές δαπάνες σύμφωνα με τις δυνατότητες του καθενός. Άλλες
φορολογικές ελαφρύνσεις που προσφέρονται καλύτερα είναι περιορισμός των τελών
αδειών κυκλοφορίας οχημάτων στο ύψος του κόστους τους, μείωση των τελών μεταβίβασης
ακίνητης ιδιοκτησίας, μείωση ή κατάργηση του ΦΠΑ σε είδη πρώτης ανάγκης κοκ.
7. Η κυβέρνηση θα μπορούσε να υποβοηθήσει την προσαρμογή της αγοράς με τα ακόλουθα
πρόσθετα μέτρα:
i. Ευκολίες χρηματοδότησης σε φυσικά πρόσωπα που αντιμετωπίζουν οικονομικά
προβλήματα προσαρμογής. Επειδή το κόστος αγοράς του απαραίτητου
εξοπλισμού για εξοικονόμηση ενέργειας ή και ιδιο-κατανάλωση από ΑΠΕ
αποτελεί επένδυση, η παραχώρηση δανείων αντί χορηγιών θα μπορούσε να
αποτελεί καταλληλότερο και πιο καθολικό μέτρο, χωρίς κρατική δαπάνη. Η δόση
αποπληρωμής των δανείων με βάση εισοδηματικά κριτήρια θα μπορούσε να
αποτελέσει και κατάλληλη κοινωνική ρύθμιση (υπό τη προϋπόθεση ότι θα
παταχθεί η φοροδιαφυγή).
ii. Επιταχυνόμενη απόσβεση για επενδύσεις εξοικονόμησης ενέργειας ή ιδιο-
κατανάλωσης ΑΠΕ σε επιχειρήσεις.

149 | C y p r u s ’ N E C P 2 0 2 1 - 2 0 3 0
Appendix VI

150 | C y p r u s ’ N E C P 2 0 2 1 - 2 0 3 0
Α/Α
ΑΡ.
ΑΙΤΗΣΕ
NO OF
APPLICATIONAMOUND
€
ENERGY SAVING
1 ENERGY SAVING IN COMMERSIAL AND INDUSTRIAL UNITS 26 756 8,667,292
2 THERMAL INSULATION IN NON-MOUNTAINOUS REGIONS 157 22,162 28,262,022
3 THERMAL INSULATION IN MOUNTAINOUS REGIONS 0 2,853 5,915,108
0 0
5 Compact Fluorescent Lamps (CFL) 0 0 2,710,840
183 25,771 45,555,262
TRANSPORT 0 0
7 HYBRIC VEHICLE 0 831 997,338
8 ELECTRIC VEHICLE 0 32 22,566
9 VEHICLES WITH CO2 EMISSIONS LESS THAN 120 g CO2/Km 0 2,230 1,594,119
0 3,093 2,614,023
RENEWABLE ENERGY SOURCES
11 GEOTHERMAL HEAT PUMBS 0 134 2,792,384
13
SOLAR THERMAL SYSTEMS HEATERS FOR THE PRODUCTION OF
HOT WATER 6 206 1,389,604
14 SOLAR THERMAL SYSTEMS FOR SPACE HEATING 3 1,017 9,520,551
15 DOMESTIC SOLAR WATER HEATERS 258 17,264 10,326,757
16 SOLAR HEATERS FOR THE HEATING OF SWIMMING POOL WATER 4 61 225,014
17 BIOMASS BOILERS AND HEATERS 0 1,226 3,976,108
18 BIOMASS STATIONS FOR HEATING 0 12 136,723
271 19,920 28,367,142
19 SMALL WIND GENERATORS 0 2 3,826
20
SUBSIDY FOR THE INSTALLATION OF GRID CONNECTED
PHOTOVOLTAIC SYSTEMS 21 608 8,297,513
21
PHOTOVOLTAIC SYSTEMS IN HOUSES OF VOLNERABLE
CONSUMERS (NET METERING) 2,092 5,625,329
23 STAND ALONE PHOTOVOLTAIC SYSTEMS 18 875 2,741,903
24 STAND ALONE PHOTOVOLTAIC SYSTEMS FOR WATER PUMPS 0 43 229,556
39 3,620 16,898,127
0 0
TOTAL RES 310 23,540 45,265,268
TOTAL 493 52,404 93,434,554
CATEGORY OF INVESTMENT
2016
2005 TOTALS (2005-20016)

151 | C y p r u s ’ N E C P 2 0 2 1 - 2 0 3 0
Appendix VII: Input assumptions for the first iteration of the
Existing PaMs scenario
1. OVERALL INPUT ASSUMPTIONS
1.1. Modelling Approach
Since this modelling activity aims at indicating the effectiveness of proposed policies and measures
(PaMs), the aim was no longer the identification of a cost-optimal solution for a suite of renewable
energy and emission targets. As such, all hard constraints defined previously on these were removed
from the model, unless backed-up by existing policies. Therefore, the only target related constraint
left in the model is associated with the necessity to cut down SOx emission in 2020, once natural gas
becomes available.
1.2. Discount Rates
Due to the different modelling approach followed in this study, it was important to implement
technology-specific discount rates. The data used in the analysis were drawn from the discount rates
employed by the PRIMES model for the EU Reference Scenario 2016 (European Union, 2016)25
.
Table 1 – Technology specific discount rates.
Discount Rates in Energy Supply Sectors
Assumptions for EU Reference Scenario 2016 Discount Rate
Regulated monopolies and grids 7.50%
Companies in competitive energy supply markets 8.50%
RES investment under feed-in-tariff 7.50%
Investment under contract for differences 7.50%
RES investment under feed-in premium, RES obligation, quota systems with
certificates 8.50%
RES investment in competitive markets 8.50%
Risk premium specific to immature or less accepted technologies 1-3%
Risk premium specific to investment surrounded by high regulatory or
political uncertainty None
Country-specific risk premiums None
Discount Rates of Firms in Energy Demand Sectors
Assumptions for EU Reference Scenario 2016 Discount Rate
Energy intensive industries 7.50%
Non energy intensive industries 9%
Services sectors 11%
Public transport (conventional) 7.50%
Public transport (advanced technologies, e.g. high speed rail) 8.50%
Business transport sectors (aviation, heavy goods vehicles, maritime) 9.50%
Country risks None
25
European Union, 2016. EU Reference Scenario 2016: Energy, transport and GHG emissions - trends to 2050. Publications Office of the European Union, Luxembourg.

152 | C y p r u s ’ N E C P 2 0 2 1 - 2 0 3 0
Discount Rates of Individuals in Energy Demand Sectors
Assumptions for EU Reference Scenario 2016
Standard
Discount
Rate
Modified
Discount
Rate due
to EE
policies
Private cars and powered two wheelers 11% 11%
Households for renovation of houses and for heating equipment 14.75% 12%
Households for choice of appliances 13.50% 9.50%
1.3. Fossil Fuel Prices and ETS price projections
Following recommendations by MECI, the low fuel price assumptions adopted during the KTH study of
2017 were adopted in this scenario run as well. MECI has consulted with both the Cyprus Gas
Company and the Cyprus Hydrocarbons Company before reaching this decision. As such, the prices as
provided in Table 2 were used. However, it should be clarified that the ETS price projection
recommended by the EC was adopted.
Table 2 – International Fuel prices assumed in the model.
2020 2021 2022 2023 2024 2025 2026 2027 2028 2029 2030 2035 2040
Oil EUR2016/GJ 5.12 5.40 5.69 5.99 6.30 6.64 6.71 6.79 6.86 6.93 7.00 8.51 9.61
Gas EUR2016/GJ 5.16 5.43 5.73 6.03 6.34 6.68 6.76 6.84 6.91 6.98 7.06 8.57 9.68
Carbon
price ETS
sectors
EUR2016/ton
CO2
15.5 17.6 18.6 20.7 21.7 23.3 25.9 27.9 30.0 32.1 34.7 43.5 51.7
2. ELECTRICITY SUPPLY SECTOR
Some overarching assumptions regarding the electricity supply sector include:
a) No Electricity Interconnection or any New Energy Intensive Investment was assumed (such as
LNG Terminal, Ethanol Production plant etc).
b) The generation system must have at least two conventional generation points, one at each power
station online at all times, for operational security reasons. For this purpose, it was assumed that
the installation of the next new CCGT unit (if the installation is deemed cost-optimal) will be at
Dhekelia Power Station. Before the installation of the next new CCGT unit at Dhekelia Power
Station, two units of ICE (2x17MW) at Dhekelia Power Station and one Steam Unit at Vasilikos
Power Station or one Gas Unit of one of the CCGT Units at Vasilikos Power Station will operate as
must-run.
c) Natural gas becomes available through an FSRU unit in the last quarter of 2020.
d) From 2020 onwards Low Sulphur HFO will be used instead of 1%S HFO at Dhekelia’s ICE and
steam units.
e) Only Vasilikos Power Station was allowed to consume natural gas from the existing thermal
plants.
f) All new Conventional units, including any new CCGTs at locations other than Vasilikos, were
assumed to use Natural Gas as the primary fuel, if this fuel is available. However, it is important
to mention that this implies new installations will occur in a location that can be supplied with
natural gas. It should be clarified that the cost of gas transmission infrastructure to supply other
locations with gas has not been taken into account. This may affect somewhat the optimization

153 | C y p r u s ’ N E C P 2 0 2 1 - 2 0 3 0
results, depending on whether the gas transmission infrastructure cost will pass to the fuel price
or not. The respective policy decisions have to be better clarified by MECI in the next iterations.
2.1. Technology Assumptions
All existing generating options were included in the model (Table 2.3). The units at Vasilikos, Dhekelia
and Moni were modelled separately based on the type of technology. Existing renewable energy
technologies (RET) were included, while future thermal and RET were allowed for investment as part
of the optimal solution. Gas turbines (62 MW), internal combustion engines (17 or 100 MW), steam
turbines (57 MW) and combined cycle gas turbines (110 or 220 MW) were modelled as potential
available options.
Table 3 – Existing thermal generation capacity.
Facility Technology Type Fuel Rated Capacity
(MW)
Retirement date*
Vasilikos
Power Plant
Combined Cycle
Gas Turbine
Diesel (or gas
if available)
440 31/12/2035 – 220 MW
31/12/2038 – 220 MW
Steam Turbine HFO (or gas if
available)
390 31/12/2032 – 260 MW
31/12/2037 – 130 MW
Gas Turbine Diesel 38 31/12/2035
Dhekelia
Power Plant
Steam Turbine HFO 360 31/12/2023
Internal
Combustion
Engine
HFO 102 31/12/2035 – 51 MW
31/12/2036 – 51 MW
Moni Power
Plant
Gas Turbine Diesel 150 31/12/2031
Total 1,480
*Based on expected outlook provided by EAC.
As in the case of fuel prices, except for certain cases mentioned elsewhere in the document, the same
technology costs as used in the KTH study of 2017 were used for the entire suite of energy
technologies considered in the model. MECI suggested keeping the same technology assumptions for
this set of iterations since the marker in Cyprus is very small comparing with all other EU countries. In
addition, the cost of limited land in Cyprus is much higher than the average price of EU. As it was
discussed in various fora i.e. Concerted action for RES, POTEnCIA, the average prices assumed in the
models does not really reflect the spread of the cost among the various member states. MECI is
suggesting that EC should use a standard diviation approach and let each MS choose the appropriate
values for the various technology options based on real data (like IRENA costs26
)
As indicated, taking into account the fact that the values used are not consistent with EC’s
recommendations (Figure 1), these may be revised for the next round of iterations.
26
https://www.irena.org/costs

154 | C y p r u s ’ N E C P 2 0 2 1 - 2 0 3 0
Figure 1 – Investment Cost Comparison of generation technologies considered in the KTH study (and
this study) and other literature sources.
Furthermore, MECI will review the techno-economic characteristics for solar thermal technologies,
due to the absence of credible figures in time for the scenario run, no change was implemented on
these. It is likely that in the next iterations of the two scenarios, new values will be adopted, based on
figures to be provided by academics and industry participants that recently attended a CSP-focused
conference or from https://www.irena.org/costs/Charts/CSP.
Table 4 – Technoeconomic assumptions for RE technologies for generation.
Investment Cost
(EUR2016/kW)
Fixed Cost
O&M cost
(EUR2016/kW)
Capacity
Factor
Lifetime
(years)

155 | C y p r u s ’ N E C P 2 0 2 1 - 2 0 3 0
2020 2030 2040
Utility-scale PV 1,161 886 611 9 18.5% 20
Wind 1,394 1,330 1,266 53 16% 25
Biomass-biogas 2,461 2,438 2,415 62 48.5% 30
Rooftop PV 1,467 1,241 1,016 12 18.5% 20
EOS 50 MW CSP with storage 3,355 106 39.3% 30
In order to prevent complete decommissioning of RET, the model was allowed to repower solar and
wind installations, as the new REDII states, thus prolonging their lifetime and keeping these in the
system until the end of the model horizon. It was assumed that the repowering cost would
correspond to approximately an average of 60% of the cost of a new installation of the same
technology, according to MECI’s estimations. This approach was adopted at the end of the study,
which did not allow for further code improvements regarding repowering. Thus the additional cost
was incorporated on the fixed annual cost of each technology instead. In future enhancements of this
work, a more detailed analysis of the potential for retrofits can be included, both for renewable
energy technologies as well as conventional thermal technologies. Table 4 provides a summary of the
main parameters used for renewable energy technologies.
2.2. Final Electricity Demand Projections
MECI after analysing and discussed with TSO-Cy regarding the forecast used, it was agreed not to use
the latest forecast by TSO-Cy despite the fact that this one was approved by CERA, as it showed
considerable increase in final electricity demand as compared to the previously adopted demand
forecasts. After the discussions made it was unearth that TSOCy was using different assumptions for
GDP and some policy decision regarding the energy efficiency were not taken into account.
As such, the demand projection provided by Dr. Zachariadis for the previous set of studies (i.e. KTH
study 2017 and GIZ study 2017) was once again used (Table 5). The only exception that has to be
noted is that the transport electricity demand was allowed to increase or decrease according to the
level of electric and plug-in hybrid vehicle penetration. As such, final electricity demand in the
transport sector was a result provided by the cost-optimization algorithm.
Table 5 – Final Electricity Demand (GWh) as a total of all sectors (forecast provided by Dr.
Zachariades).
2015 2016 2017 2018 2019 2020 2021 2022 2023 2024 2025 2026 2027
GWh 4,084 4,227 4,339 4,463 4,593 4,724 4,828 4,913 5,004 5,076 5,130 5,218 5,315
2028 2029 2030 2031 2032 2033 2034 2035 2036 2037 2038 2039 2040
GWh 5,422 5,518
5,600
5,694
5,798
5,909
6,026
6,150
6,272
6,394
6,515
6,635
6,754
2.3. Storage Options
Two main electricity storage options were considered. The pumped hydro storage facility was
maintained as an option, but its deployment was delayed until 2027, as the earliest possible year,
according to MECI’s suggestions after discussions with the TSOCy. The reasoning for this is that no
interest has been shown in such a facility yet and no technical feasibility assessment has been
conducted so far. MECI also argues that the cost and performance characteristics assumed for this
facility may need to be revised, as the existence of periodic droughts in Cyprus may affect the
attractiveness and viability of such a project.
The second option, that of lithium-ion batteries was split into two different categories:
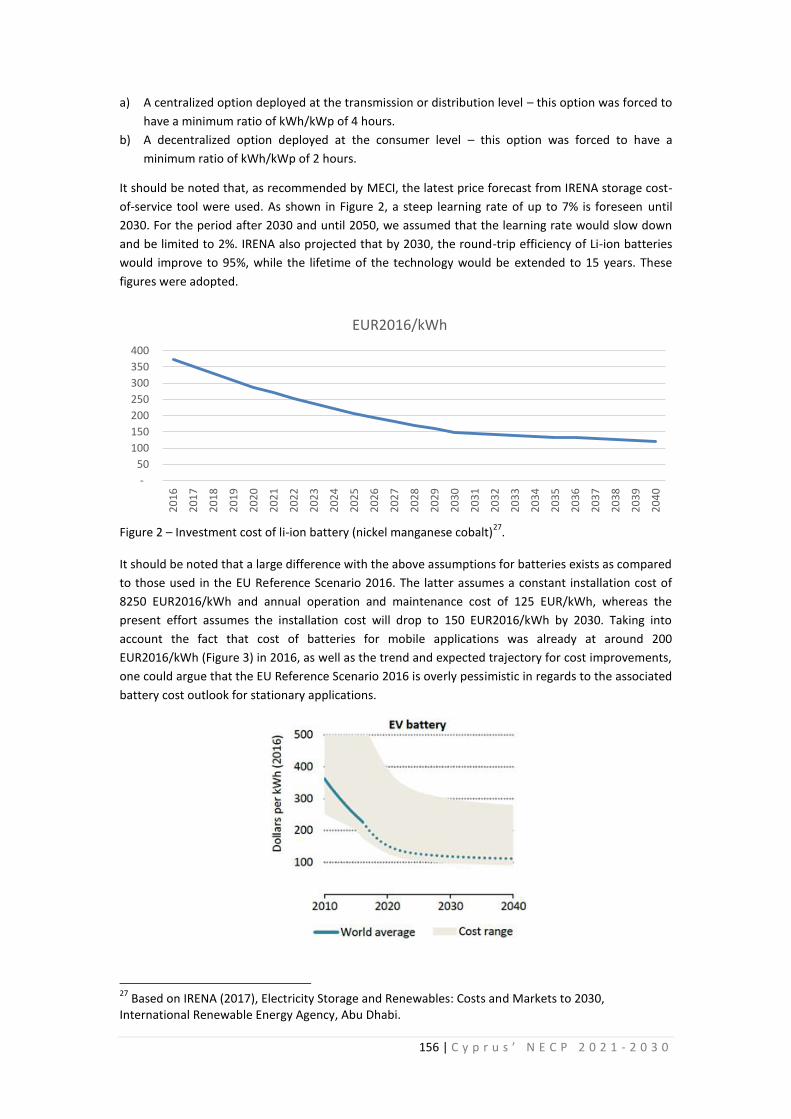
156 | C y p r u s ’ N E C P 2 0 2 1 - 2 0 3 0
a) A centralized option deployed at the transmission or distribution level – this option was forced to
have a minimum ratio of kWh/kWp of 4 hours.
b) A decentralized option deployed at the consumer level – this option was forced to have a
minimum ratio of kWh/kWp of 2 hours.
It should be noted that, as recommended by MECI, the latest price forecast from IRENA storage cost-
of-service tool were used. As shown in Figure 2, a steep learning rate of up to 7% is foreseen until
2030. For the period after 2030 and until 2050, we assumed that the learning rate would slow down
and be limited to 2%. IRENA also projected that by 2030, the round-trip efficiency of Li-ion batteries
would improve to 95%, while the lifetime of the technology would be extended to 15 years. These
figures were adopted.
Figure 2 – Investment cost of li-ion battery (nickel manganese cobalt)
27.
It should be noted that a large difference with the above assumptions for batteries exists as compared
to those used in the EU Reference Scenario 2016. The latter assumes a constant installation cost of
8250 EUR2016/kWh and annual operation and maintenance cost of 125 EUR/kWh, whereas the
present effort assumes the installation cost will drop to 150 EUR2016/kWh by 2030. Taking into
account the fact that cost of batteries for mobile applications was already at around 200
EUR2016/kWh (Figure 3) in 2016, as well as the trend and expected trajectory for cost improvements,
one could argue that the EU Reference Scenario 2016 is overly pessimistic in regards to the associated
battery cost outlook for stationary applications.
27
Based on IRENA (2017), Electricity Storage and Renewables: Costs and Markets to 2030, International Renewable Energy Agency, Abu Dhabi.
-
50
100
150
200
250
300
350
400
20
16
20
17
20
18
20
19
20
20
20
21
20
22
20
23
20
24
20
25
20
26
20
27
20
28
20
29
20
30
20
31
20
32
20
33
20
34
20
35
20
36
20
37
20
38
20
39
20
40
EUR2016/kWh

157 | C y p r u s ’ N E C P 2 0 2 1 - 2 0 3 0
Figure 3 – Historic trend and projection for electric vehicle battery costs, based on the New Policies
Scenario of the IEA World Energy Outlook 201728
.
2.4. Capacity Reserve
A capacity reserve margin of 20% higher than the yearly peak demand, as suggested by CERA, was
assumed as the lower limit allowed for the entire model horizon after 2019. Storage options and
conventional thermal plants were allowed to contribute 100% of their rated capacity, while RET
without storage were allocated a lower capacity credit, since their availability is intermittent (Table 6).
Table 6 – Capacity credit of each technology.
Technology Capacity credit (% of capacity)
Conventional thermal 100%
Biomass 33%
CSP with storage 100%
Wind 0%
PV 20%
Storage Technologies 100%
2.5. Operational Reserves
The assumption used regarding spinning reserve in IRENA Renewable Energy Roadmap for the
Republic of Cyprus was adopted in this analysis as well. The demand for spinning reserve was
expressed throughout the model horizon as:
a) A constant 60 MW demand;
b) Plus, an additional 50% of the instantaneous wind generation;
c) Plus, an additional 10% of the instantaneous PV generation.
All thermal conventional technologies were allowed to contribute to this reserve. Additionally,
storage options were included, for which the capacity to provide spinning reserve was defined as a
function of the level of electricity charge on a ratio of 1:1.
2.6. RES Support Schemes
Certain forced investments or potential investments of renewable energy technologies based on
existing support schemes were implemented in the model. Specifically:
Forced investments in rooftop PV of 60 MW (20 MW in 2018 and 40 MW in 2019), relating to net-
metering and net-billing schemes.
Forced investments in large-scale PV of 120 MW by end of 2019 (i.e. these appear in solution by
the first day of 2020). These were forced as MECI foresees that even though applications reached
400 MW, at least the capacity mentioned in the relevant RES support scheme (i.e. 120 MW) will
be developed by 2020.
Forced investments in wind of 12.5 MW by 2020 (instead of 17.5 from 2018 in KTH study). A
previously licensed plants of this capacity has not been implemented, but the same capacity has
been released in the relevant RES support scheme for inclusion of projects in the competitive
electricity market. MECI foresees that this capacity (12.5 ΜW) will be taken up by interested
investors.
28
IEA, World Energy Outlook 2017, International Energy Agency, Paris.
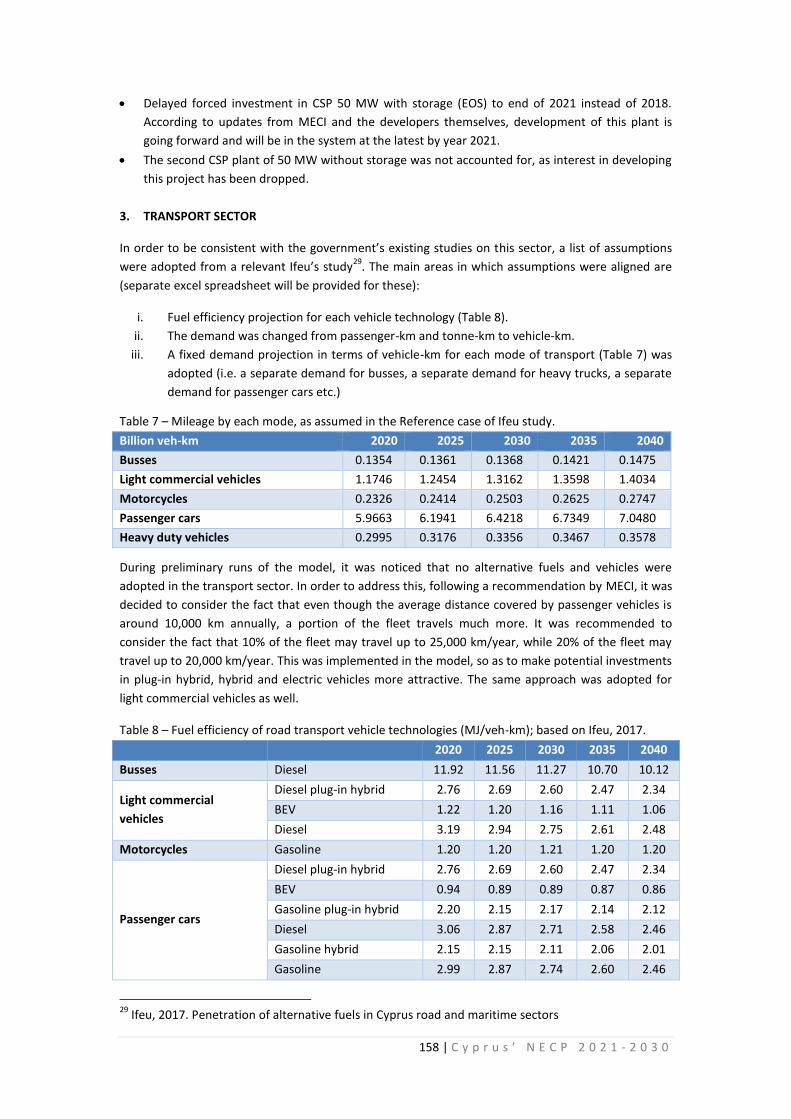
158 | C y p r u s ’ N E C P 2 0 2 1 - 2 0 3 0
Delayed forced investment in CSP 50 MW with storage (EOS) to end of 2021 instead of 2018.
According to updates from MECI and the developers themselves, development of this plant is
going forward and will be in the system at the latest by year 2021.
The second CSP plant of 50 MW without storage was not accounted for, as interest in developing
this project has been dropped.
3. TRANSPORT SECTOR
In order to be consistent with the government’s existing studies on this sector, a list of assumptions
were adopted from a relevant Ifeu’s study29
. The main areas in which assumptions were aligned are
(separate excel spreadsheet will be provided for these):
i. Fuel efficiency projection for each vehicle technology (Table 8).
ii. The demand was changed from passenger-km and tonne-km to vehicle-km.
iii. A fixed demand projection in terms of vehicle-km for each mode of transport (Table 7) was
adopted (i.e. a separate demand for busses, a separate demand for heavy trucks, a separate
demand for passenger cars etc.)
Table 7 – Mileage by each mode, as assumed in the Reference case of Ifeu study.
Billion veh-km 2020 2025 2030 2035 2040
Busses 0.1354 0.1361 0.1368 0.1421 0.1475
Light commercial vehicles 1.1746 1.2454 1.3162 1.3598 1.4034
Motorcycles 0.2326 0.2414 0.2503 0.2625 0.2747
Passenger cars 5.9663 6.1941 6.4218 6.7349 7.0480
Heavy duty vehicles 0.2995 0.3176 0.3356 0.3467 0.3578
During preliminary runs of the model, it was noticed that no alternative fuels and vehicles were
adopted in the transport sector. In order to address this, following a recommendation by MECI, it was
decided to consider the fact that even though the average distance covered by passenger vehicles is
around 10,000 km annually, a portion of the fleet travels much more. It was recommended to
consider the fact that 10% of the fleet may travel up to 25,000 km/year, while 20% of the fleet may
travel up to 20,000 km/year. This was implemented in the model, so as to make potential investments
in plug-in hybrid, hybrid and electric vehicles more attractive. The same approach was adopted for
light commercial vehicles as well.
Table 8 – Fuel efficiency of road transport vehicle technologies (MJ/veh-km); based on Ifeu, 2017.
2020 2025 2030 2035 2040
Busses Diesel 11.92 11.56 11.27 10.70 10.12
Light commercial
vehicles
Diesel plug-in hybrid 2.76 2.69 2.60 2.47 2.34
BEV 1.22 1.20 1.16 1.11 1.06
Diesel 3.19 2.94 2.75 2.61 2.48
Motorcycles Gasoline 1.20 1.20 1.21 1.20 1.20
Passenger cars
Diesel plug-in hybrid 2.76 2.69 2.60 2.47 2.34
BEV 0.94 0.89 0.89 0.87 0.86
Gasoline plug-in hybrid 2.20 2.15 2.17 2.14 2.12
Diesel 3.06 2.87 2.71 2.58 2.46
Gasoline hybrid 2.15 2.15 2.11 2.06 2.01
Gasoline 2.99 2.87 2.74 2.60 2.46
29
Ifeu, 2017. Penetration of alternative fuels in Cyprus road and maritime sectors

159 | C y p r u s ’ N E C P 2 0 2 1 - 2 0 3 0
LPG 2.52 2.48 2.44 2.39 2.35
Natural gas 2.54 2.49 2.50 2.47 2.43
Trucks
BEV 3.40 3.27 3.14 3.05 2.96
Diesel 9.37 9.30 9.05 8.53 8.01
Natural gas 12.63 11.64 10.80 9.48 8.01
The potential deployment of electric and plug-in hybrid vehicles will have an effect on the load profile
of the electricity sector. As such, so as to account for this, a charging profile had to be adopted. Since
there is limited penetration of these technologies in Cyprus, local information on the charging
behaviour is lacking. Therefore, information from a relevant academic article was adopted30
, as shown
in Figure 4 below. The same profile was assumed to be applicable for the entire year throughout the
modelling horizon.
Figure 4 – Share of hourly charging rate as compared to daily total charging volume for electric and
plug-in hybrid vehicles.
4. HEATING AND COOLING SECTOR
In order to conform with the results and assumptions adopted in the Energy Efficiency studies of the
government, it was decided that the results pertaining to the Existing Policies and Measures scenario
from these studies would be adopted on an as-is basis. In this sense, the final energy demand
projections for the industrial, agricultural, residential and commercial sectors were directly taken
from the latest demand projections of Prof. Zachariadis (Cyprus University of Technology – CUT),
provided to the Cyprus Institute in October 2018 (Table 9). The main reason for this decision is that
the latest PaMs in this sector were taken into account by CUT, whereas these were not easily
captured by a cost-optimization conducted by the OSeMOSYS model; a quantitative provision of data
which would enable this was difficult in the time available. However, in the future iterations of the
model an effort will be made to retrieve the required information from MECI, so as to allow a full
optimization of this sector as well, rather than predefining the results.
Table 9 – Forced final energy demand in the Heating and Cooling sector (PJ).
2020 2025 2030 2035 2040
Gas Oil/Diesel/Gasoline/Light Fuel Oil/ 9.009 8.887 8.510 7.598 6.667
30
Anglani, Norma & Fattori, Fabrizio & Muliere, Giuseppe. (2014). Combining Photovoltaic Energy with Electric Vehicles, Smart Charging and Vehicle-to-Grid. Solar Energy. 10.1016/j.solener.2014.09.034.
0%
2%
4%
6%
8%
10%
12%
14%
1 6 11 16 21
Shar
e o
f to
tal c
har
ge
Hour of the day

160 | C y p r u s ’ N E C P 2 0 2 1 - 2 0 3 0
Heavy Fuel Oil
LPG 3.381 3.379 3.482 3.352 3.186
Pet coke 4.3196 4.0445 3.6873 3.4153 3.1630
Biomass 1.4195 1.5517 1.7849 1.8637 1.9016
Solar Thermal 4.1454 4.3051 5.1507 6.4694 7.8105
Electricity 8.2933 8.3740 9.2593 10.1851 10.9272
The seasonal variation in demand for heating and cooling was estimated based on historical
measurements of heating and cooling degree days, provided by MECI. An estimate of the demand
profile within each day had to be assumed for each of the demands. In the case of cooling, this was
based on the recorded electricity demand profile of each sector (Figure 5). However, analysis
providing a more accurate demand profile may be needed for future enhancements of the model.
Figure 5 – Assumed share of annual cooling demand for each hour within each month.
The technoeconomic assumptions for the technologies used in this sector (Tables 10 and 11) were
taken from a separate JRC study focusing on this sector 31
. In order to ensure enough capacity of
technologies able to provide high heat would be present, a high heat requirement was inserted in the
model. This requirement was set at 0.62 PJ in 2020 and increased gradually to 0.75 PJ by 2040. Only
boilers and CHP technologies were allowed to satisfy this demand.
Table 10 – Technoeconomic characteristics of technologies in the industrial, commercial and
agricultural sectors.
Resource Technology Investment
cost
(EUR2016/kW)
Fix O&M
(EUR2016/kW)
Lifetime
(years)
Heat
efficiency
Electric
efficiency
Cooling
efficiency
Electricity Heat
pumps
838 16.8 20 3 -- 4
Electricity Resistance 101 1.1 15 0.9 -- 0.63
31
JRC, 2016. Cost-benefit analysis for the potential of high-efficiency cogeneration in Cyprus.
0.0000
0.0020
0.0040
0.0060
0.0080
0.0100
0.0120
0.0140
0.0160
0.0180
0.0200
1 2 3 4 5 6 7 8 9 10 11 12 13 14 15 16 17 18 19 20 21 22 23 24
Shar
e o
f an
nu
al c
oo
ling
dem
and
(%
)
Apr May Jun Jul Aug Sep Oct

161 | C y p r u s ’ N E C P 2 0 2 1 - 2 0 3 0
heaters
Gas oil, kerosene,
light fuel oil
Boilers 80 4.0 20 0.77 -- 0.54
Gas oil, light fuel
oil, livestock/
industrial waste,
LPG
CHP 1241 16.7 20 0.47 0.34 0.33
Gas oil, kerosene,
light fuel oil
Efficient
Boilers
325 16.2 20 0.9 -- 0.63
LPG Boilers 188 9.4 20 0.66 -- 0.46
Municipal waste,
biomass
CHP 1448 19.7 20 0. 47 0.34 0.33
Livestock/industrial
waste, LPG
Efficient
Boilers
327 22.9 20 0.96 -- 0.67
Biomass Boilers 350 17.5 20 0.77 -- 0.54
Municipal waste,
biomass
Efficient
Boilers
726 8.2 20 0.81 -- 0.57
Solar Solar
panels
893 17.9 20 6.54 -- 4.58
Table 11 – Technoeconomic characteristics of technologies in the residential sector.
Resource Technology Investment
cost
(EUR2016/
kW)
Fix O&M
(EUR2016/
kW)
Lifetime
(years)
Heat
efficiency
Electric
efficiency
Cooling
efficiency
Electricity Heat
pumps
1263 9.3 20 3.79 -- 2.65
Electricity Resistance
heaters
182 2.0 15 0.9 -- 1
Gas oil,
kerosene,
light fuel
oil
Boilers 216 10.9 20 0.77 -- 1
Gas oil,
light fuel
oil, LPG
CHP 1552 22.1 10 0.5 0.4 0.35
Gas oil,
kerosene,
light fuel
oil
Efficient
Boilers
325 16.2 20 0.96 -- 1
LPG Boilers 188 9.4 20 0.77 -- 1
LPG Efficient
Boilers
432 21.6 20 0.96 -- 1
Biomass Boilers 504 25.2 20 0.77 -- 1
Biomass CHP 1759 27.9 10 0.5 0.4 0.35
Biomass Efficient
Boilers
958 24.1 20 0.85 -- 1

162 | C y p r u s ’ N E C P 2 0 2 1 - 2 0 3 0
Solar Solar
panels
1191 23.8 20 6.54 -- 1

163 | C y p r u s ’ N E C P 2 0 2 1 - 2 0 3 0
Appendix VIII: Forecasting of Energy Prices for Cyprus
Government in coordination with Cyprus Hydrocarbon
Company
There are ongoing discussions on the possibility of US flooding the market with cheap shale
LNG, and as a matter of fact this is the strategy of the US, to establish the demand markets in
order to land the chilled molecules to various buyers around the world. As discussed during
our meeting in the case of US sourced LNG, the price indexation we have to focus is HH
(Henry Hub). As shown on the below graph HH has been historically traded lower than other
regional indices, but we have to keep in mind that for this particular region we have to add
on top of the HH price the liquefaction and shipping cost. Therefore, although a very valid
argument on the cheapest LNG option from the US, there are two variable elements which at
any case when market dictates can rise for a number of reasons (especially shipping rates)
and deem the LNG more expensive than alternative options.
The below graph along with other details on gas prices can be found on the attached
document IHS Market LNG and Gas Prices
1. The prices of futures
Future prices run up to 2026, and the importance of the futures lays on the volume of
money, traders, banks, oil majors, producers and other related parties are committing to the
specific future. A single snapshot from today’s monthly future prices is as per below:

164 | C y p r u s ’ N E C P 2 0 2 1 - 2 0 3 0
We can safely assume that the market is not expecting Brent to trade through 2025-2026
above $70/bbl. We then assume a 2% annual inflation rate, based of the Ministry of finance
assumptions, of the Brent prices which gives us the results below.
2. Forecasts from Banks
We have been gathering and recording a number of forecasts from various banks and other
intelligence service providers to create our own view of the market.
The general outlook we have up to date is as per graph below, please note that we have
taken the various reported forecasted prices from the banks and other service providers up
to 2025 and then we escalated each reported price with 2% (based in inflation rate) for the
remaining 5 years. Even with the escalation the most optimistic scenario does not overpass
the $70-$75/bbl threshold.
Full data and graphs of the below can be found on various public and internal documents.

165 | C y p r u s ’ N E C P 2 0 2 1 - 2 0 3 0
Please note that most of majors oil companies, usually do not forecast that far in the future
and the reports we currently have reach 2025.
From various presentations MECI has attended the last couple of months we have seen
various forecasts from reporting agencies on Brent and especially from Platts where they
presented their view on Brent forecasts until 2040.
The forecasted values we have been presented were based on three scenarios: Low Case
Expected and High Case. The results are shown on the below table:
Scenarios Low Case Expected High Case
Average Price in $/bbl $42 $61 $84
In addition to that there a probabilistic distribution which was also presented during that
presentations which illustrated that the Brent price will fluctuate around $64/bbl for the
period 2020-2040 with a 50% probability. The probability to drop below $50/bbl was
estimated at 30% and the remaining 20% was on the high case where prices rise over
$80/bbl
In addition, in the attached McKinsey report page 28: «New normal case, new crude
production is expected to come at lower cost breaking even at 65-75/bbl»
On the matter of the regional developments we should just mention that East Med is a
frontier exploration play and as further exploration is expected in the region, local reserves
might feed the regional demand in a more economical method and consequently replace the
imported and more expensive oil distillates products for power production.

166 | C y p r u s ’ N E C P 2 0 2 1 - 2 0 3 0
We have strong indications, from various confidential on-going discussions that the oil prices
and natural gas prices in the region will remain to the levels indicated above up to 2030 (i.e.
$60-70/bbl).
3. Projections of oil prices
Figure 16. Oil cost projections (prices in €2016/boe)
McKinsey report page 28:
Table 17: Oil cost projections (prices in €2016/boe)
Year EC Option 1 EC option 2 Basic High price Low price POTEnCIA
2021 84.57 74.92 49.85 69.80 37.39 73.72
2022 85.95 78.53 52.54 73.55 39.40 77.64
0
50
100
150
2010 2015 2020 2025 2030 2035 2040 2045
Comparison oil prices [EUR2016/boe]
EC Option 1 EC option 2 Basic
High price Low price POTEnCIA

167 | C y p r u s ’ N E C P 2 0 2 1 - 2 0 3 0
2023 88.61 83.48 55.31 77.44 41.48 82.45
2024 90.45 87.81 58.18 81.45 43.63 86.62
2025 91.47 91.47 61.32 85.85 45.99 90.15
2026 93.75 93.75 62.01 86.81 46.51 92.40
2027 95.82 95.82 62.69 87.77 47.02 94.44
2028 97.23 97.23 63.38 88.73 47.53 95.82
2029 99.43 99.43 64.06 89.69 48.05 97.99
2030 100.77 100.77 64.75 90.64 48.56 99.31
Table 2: Natural gas cost projections (prices in €2016/boe)
Year EC Option 1 EC option 2 Basic High Low POTEnCIA
2021 53.84 47.51 32.97 61.55 16.49 45.13
2022 54.01 49.35 34.75 64.86 17.37 47.46
2023 54.88 51.76 36.58 68.29 18.29 50.22
2024 55.57 54.02 38.48 71.83 19.24 52.82
2025 56.08 56.08 40.56 75.71 20.28 55.27
2026 56.97 56.97 41.01 76.55 20.51 56.15
2027 57.80 57.80 41.46 77.40 20.73 56.97
2028 58.72 58.72 41.92 78.24 20.96 57.88
2029 59.65 59.65 42.37 79.09 21.18 58.78
2030 60.99 60.99 42.82 79.93 21.41 60.11
4. Projections on natural gas prices
0
20
40
60
80
100
120
2010 2015 2020 2025 2030 2035 2040 2045
Natural gas price [EUR 2016 / boe]
EC Option 1 EC option 2 Basic
High price Low price POTEnCIA

168 | C y p r u s ’ N E C P 2 0 2 1 - 2 0 3 0
Appendix IX: DRAFT - JRC/IPR/2018/C.3/0034/NC - Technical
support on long-term energy modelling (LTEM) - Analysis
of future scenarios for the Cyprus energy system - Existing
PaMs scenario
Authored by: The Cyprus Institute
v.4 – 14th
December 2018
1. BACKGROUND
Building on the EU’s 2030 Framework for Climate and Energy and the European Energy Security
Strategy, the Energy Union aims at providing more secure, affordable and sustainable energy to all
European citizens. On 30 November 2016, the European Commission proposed a Regulation on the
Governance of the Energy Union, whose aims include ensuring the achievement of the EU’s 2030
energy and climate targets. The proposed Regulation highlights that EU countries and the Commission
should work together and emphasises the importance of cooperation between Member States. It
takes into account the fact that different countries may contribute to the Energy Union in different
ways and degrees. Member States will be required to prepare and submit integrated National Energy
and Climate Plans that address the five dimensions of the Energy Union for the period 2021-2030,
according to a common template, and will have to report on their progress on a biennial basis.
The five dimensions of the Energy Union to be addressed in the submitted Energy and Climate Plans
are:
Security, solidarity and trust – the EU’s energy and supply mix should be diversified to ensure
energy security. Cooperation between Member States can assist in this.
Integrated Internal Energy Market to allow exchange of energy across the EU, thus
promoting competition between suppliers. Adequate technological and regulatory
infrastructure is required for this point.
Energy Efficiency improvements to reduce dependence on energy imports, emissions and
boost economic growth.
Decarbonisation of the economy to conform with the Paris Agreement. Reduction of
greenhouse gas emissions should occur in both the ETS and non-ETS sectors.
Research, Innovation and Competitiveness to promote advancements in low-carbon and
clean energy technologies that will assist in the transition to a decarbonised energy system.
The objective of the conducted work is to provide technical support on Long-Term Energy modelling
for one of the Member States; the Republic of Cyprus. The modelling work will help assess the impact
of the Cyprus energy system on the five dimensions of the Energy Union. The work is conducted using
an existing OSeMOSYS model of the Cyprus energy system. OSeMOSYS is an open-source demand-
driven cost-optimisation model, which identifies the cost-optimal solution for satisfying an externally
defined demand for energy32
. The choice of technologies and energy mix is based on techno-
economic data inserted in the model, such as fuel costs, technology costs, availability of resources, as
32
Mark Howells et al., “OSeMOSYS: The Open Source Energy Modeling System: An Introduction to Its Ethos, Structure and Development,” Energy Policy 39, no. 10 (October 2011): 5850–70, https://doi.org/10.1016/j.enpol.2011.06.033.

169 | C y p r u s ’ N E C P 2 0 2 1 - 2 0 3 0
well as constraints such as emission limits and renewable energy share targets. The model for Cyprus
consists of three modules: electricity supply, road transport and heating and cooling. Scenarios will be
developed that cut across the three sectors, taking into account local specificities. The model has
been updated to an extent using recently provided data by the Cypriot Ministry of Energy, Commerce
and Industry (MECI), but further updates and enhancements are planned.
Once fully updated and calibrated, two separate scenarios will be evaluated – an Existing Policies and
Measures scenario and an Additional Policies and Measures scenario. This document provides an
overview of the key results provided by the first iteration of the Existing Policies and Measures (PaMs)
scenario for the Cyprus energy system. Due to the short timeframe provided to conduct this run, the
results should be considered as provisional. Certain assumptions will be revisited in the next iterations
of the model. Further, a thorough analysis and potentially additional studies are still required to verify
the technical feasibility of the provided results; especially so in the electricity supply sector.
The results shown in this report focus till 2040, in line with the reporting template provided by the
European Commission, but it should be clarified that the results provided by the model are available
on an annual basis till 2050. The detailed model results can be accessed in separate spreadsheets
given as supplementary material to this report.

170 | C y p r u s ’ N E C P 2 0 2 1 - 2 0 3 0
5. EXISTING PAMS SCENARIO RESULTS
The results description of this section has been broken down by sector (i.e. electricity, transport,
heating and cooling). Additionally, results on the primary energy supply and final energy demand are
provided along with a forecast on the carbon dioxide emissions from both ETS and non-ETS sectors. A
short comparison with the results of the EU Reference Scenario 2016 is included in each section.
5.1. Electricity Supply Sector
2.1.1. Capacity
The projection offered by the model in the electricity supply sector is quite interesting and can be
regarded as optimistic. Following the expected deployment of renewable energy technologies till
2020 as promoted by the existing support schemes and the development of the planned 50 MW CSP
plant by 2021, only an additional 320 MW of solar PV and 20 MW of biomass-fired facilities are
deployed till 2030. Nonetheless, even though penetration of renewables is relatively modest till 2030,
an aggressive deployment of solar PV occurs in the period 2031-2040 (Table 1). This deployment is
driven and enabled by an equally aggressive deployment of Li-ion batteries during the same period, as
these reach 657 MW in 2040. It should be noted that based on a relevant IRENA publication33
,
optimistic techno-economic characteristics were assumed for Li-ion batteries. This publication
foresees that by 2030 battery life will exceed 15 years and round-trip efficiency will be higher than
95% at an installation cost of approximately 150 EUR2016/kWh. All Li-ion batteries deployed are in-
front-of-the-meter facilities and have 4 hours of storage; this results in 288 MWh of battery storage in
2030 and 2628 MWh in 2040. No behind-the-meter battery storage is deployed as this is not deemed
cost-optimum under the current assumptions followed. Furthermore, at the latter part of the
modelling period, a 130 MW (1040 MWh) pumped-hydro facility is also developed.
Table 1 – Capacity projections in the electricity supply sector (MW).
2020 2025 2030 2035 2040
Vasilikos 868 868 868 608 0
Dhekelia 460 102 102 0 0
Moni 150 150 150 0 0
New CCGT 0 216 216 216 216
New ICE 0 0 0 0 0
New ST 0 0 0 0 57
New GT 0 0 0 0 0
Light fuel oil CHP 0 85 96 97 110
Solar PV 292 292 614 2114 3408
Solar Thermal 0 50 50 50 50
Wind 175 175 175 175 175
Biomass 10 25 29 70 70
Pumped Hydro 0 0 0 0 130
Li-Ion Batteries 0 0 72 307 657
The aggressive deployment of batteries and solar PV can be attributed to the reduction in capital cost
assumed over time for both of these technologies. At the same time, increasing fuel and ETS prices
make fossil-fired plants less competitive. However, the feasibility of these results has to be scrutinized
thoroughly, as during low electricity demand and high PV output periods, a significant amount of
33
IRENA, 2017. Electricity Storage and Renewables: Costs and Markets to 2030, International Renewable Energy Agency, Abu Dhabi.

171 | C y p r u s ’ N E C P 2 0 2 1 - 2 0 3 0
curtailment may be observed. This curtailment is not easily captured by a long-term energy systems
model, as employed here. Hence, a separate detailed analysis focusing on a single year in a much finer
temporal resolution may be needed to assess this proposed outlook.
Another aspect that should be raised is that of the deployment of small CHP facilities at the final end-
user level. This CHP capacity, which reaches 96 MWe in 2030 and 110 MWe in 2040, is deployed due
to the direct adoption in the model of the final energy demand projections in the Heating and Cooling
sector as provided by the Cyprus University of Technology. The model simply deems that this is the
most efficient way of consuming the fuel forcibly allocated to the system. It is expected that if the
limits on fuel use for the Heating and Cooling sector are lifted from the model, this option will not
appear to this high degree in the optimal solution. To do this, updated demands for Heating and
Cooling will need to be expressed in terms of useful energy demand.
EU Reference Scenario 2016 is more optimistic for the year 2020 than the present results. It projects
that solar capacity will reach 338 MW and wind capacity will reach 216 MW. In contrast, the present
effort estimates 292 MW and 175 MW respectively.
In respect to 2030, the electricity capacity results are quite comparable between the two models.
Specifically, the EU’s Reference Scenario 2016 projects a thermal capacity of 1455 MW, whereas the
present scenario projects 1432 MW. Renewable energy capacity as a whole is also similar, albeit with
some differences. Solar capacity reaches 529 MW in EU Reference Scenario and 664 MW (PV and CSP)
in the present effort, while wind capacity is 229 MW in the former and 175 MW in the latter case.
Finally, biomass-fired facilities are limited to 11 MW in EU Reference Scenario, but increase to 29 MW
in the present effort.
A big difference can be noticed in 2040, mainly due to the increased penetration of solar PV in the
present effort. The EU Reference scenario projects that only a further 50 MW solar PV will be added
to the system between 2030 and 2040, whereas this effort projects nearly 2.8 GW.
It is worth noting that no information is given regarding penetration of any storage technologies in
the EU Reference Scenario 2016. As such, no comparison regarding this aspect can be made.
2.1.2. Generation
The above technology deployment provides the generation mix shown in Figure 1. The substitution in
the latter part of 2020 (i.e. in the period October-December) of oil-fired generation with gas-fired
generation results in a transitional period as indicated below. Renewable energy contribution as a
share of the final electricity consumption reaches 15.6% in 2020, falling just short of the 16% target. In
the post-2020 period, gas-fired generation dominates the electricity mix till 2030. The RE share in
2030 reaches 26%, as more solar PV is introduced in the system.
The rapid deployment of solar PV discussed above slowly displaces natural gas from the generation
mix, which occurs gradually over the decade 2030-2040. The RE share reaches as high as 78% in the
latter years of the modeling horizon. Another enabler of solar PV is the electrification of the transport
sector, as this raises the demand for electricity throughout the year. Specifically, in 2030 about 700
GWh are consumed in the transport sector, while for the period 2032-2040 annual consumption rises
to approximately 950 GWh. This aspect is elaborated further in the relevant section later on in the
report.

172 | C y p r u s ’ N E C P 2 0 2 1 - 2 0 3 0
Figure 1 – Projected generation mix till 2040.
In terms of generation, similar observations as in the capacity results apply when conducting a
comparison with EU Reference Scenario 2016. The RES shares in generation are 21.5%, 29.4% and
28% in 2020, 2030 and 2040 respectively in the EU Reference Scenario 2016. Even though in that
scenario a mild increase in renewable energy generation is foreseen between 2030 and 2040 in
absolute terms, this is overshadowed by the foreseen increase in fossil-fired generation. In contrast,
the results shown here indicate 13.5%, 24.4% and 78% in 2020, 2030 and 2040 respectively.
Further, inconsistencies exist in regards to electricity demand, as well. Gross generation reaches
approximately 4,900 GWh in 2020, 5,500 GWh in 2030 and 6,200 GWh in 2040 in the EU Reference
Scenario 2016. However, the present effort projects gross generation will reach 4,800 GWh in 2020,
6,300 GWh in 2030 and 7,600 GWh in 2040. As such, even though the demand projection is
comparable in the two scenarios for 2020, it is much greater in the present effort.
2.1.3. Costs
Despite the considerable investments in the electricity supply sector, the average cost of gross
electricity generation stays relatively stable throughout the modelling period. Undeniably, this is a
function of the assumed fuel price and technology costs adopted in the model. Figure 2 provides a
breakdown of the different system cost components; these are all undiscounted34
. As illustrated, a
reduction in cost is achieved when the system shifts fully towards gas-fired generation in 2021. It can
be noticed that variable costs (i.e. fuel costs) are the main driver of the electricity cost till 2036. From
2037 onwards, the considerable investments in solar PV and storage technologies (Figure 3)
substitute these variable costs as the main driver for the cost of electricity. The rate at which these
investments occur is considerably high in the period 2030-2040 and raises the question of adequate
funding to finance all this infrastructure.
34
Undiscounted costs are reported to avoid giving the wrongful impression that costs are expected to decrease dramatically with time. Taking into account that the discount rate adopted is 8.5% for most technologies in the electricity sector, if the cost were to be discounted to the first year, then the values after the first few years would be distorted (i.e. reduced) substantially.
-
1,000
2,000
3,000
4,000
5,000
6,000
7,000
8,000
9,000
20
20
20
21
20
22
20
23
20
24
20
25
20
26
20
27
20
28
20
29
20
30
20
31
20
32
20
33
20
34
20
35
20
36
20
37
20
38
20
39
20
40
Ge
ne
rati
on
(G
Wh
)
Gas HFO Diesel Solar PV
Solar Thermal Wind Biomass Demand

173 | C y p r u s ’ N E C P 2 0 2 1 - 2 0 3 0
Figure 2 – Average cost of electricity and breakdown of system cost components.
In comparison to EU Reference Scenario 2016, the average cost of electricity generation is slightly
lower in the present scenario. The former projects a cost of around 110-120 EUR2016/MWh for the
entire period between 2020-2040, whereas the present scenario projects the cost between 100-120
EUR2016/MWh. A potential reason for this difference is that technology and fuel cost assumptions
were not aligned between the two models; the present effort assumes considerably lower fuel price
projections. Similarly, the assumptions regarding photovoltaics and battery storage have significant
discrepancies. For instance, utility-scale PV assumed here has an investment cost of 1160
EUR2016/kW in 2020 and 890 EUR2016/kW in 2030, whereas the EU Reference Scenario 2016
assumes 840 EUR/kW in 2020 and 700 EUR/kW in 2030. On the other hand, the present effort
assumes battery storage cost will drop to 150 EUR2016/kWh by 2030, while the EU Reference
Scenario 2016 assumes a constant cost of 8250 EUR2016/kWh until 2050.
Figure 3 – Annualized investment costs in solar PV and storage technologies in the period 2020-2040.
5.2. Transport Sector
The forecast for the transport sector foresees penetration of alternative fuels and technologies. Due
to the assumed higher mileage allowed for certain vehicle categories, alternative technologies are
deemed cost-competitive by the model and as such enter the market in significant numbers (Table 2).
In the passenger car fleet, the number of gasoline and diesel vehicles are reduced over time; these
are replaced by hybrid and plug-in hybrid vehicles. It is worth highlighting that even though a
significant penetration of plug-in hybrid vehicles is achieved, no new electric vehicles appear in the
-
20
40
60
80
100
120
140
-
100
200
300
400
500
600
700
800
900
20
20
20
21
20
22
20
23
20
24
20
25
20
26
20
27
20
28
20
29
20
30
20
31
20
32
20
33
20
34
20
35
20
36
20
37
20
38
20
39
20
40
EUR
20
16
/MW
h
Mill
ion
EU
R2
01
6
Fixed Cost Variable Cost Annualized Investment Cost CO2 Average electricity cost
0
50
100
150
200
250
300
350
20
20
20
21
20
22
20
23
20
24
20
25
20
26
20
27
20
28
20
29
20
30
20
31
20
32
20
33
20
34
20
35
20
36
20
37
20
38
20
39
20
40
Mill
ion
EU
R2
01
6
Solar PV Rooftop PV Pumped Hydro Li-Ion batteries

174 | C y p r u s ’ N E C P 2 0 2 1 - 2 0 3 0
fleet35
. Furthermore, a considerable penetration of LPG-fired vehicles is observed – the rate at which
this occurs may be considered unrealistic, given the current limited adoption of this technology in
Cyprus.
Table 2 – Projected vehicle fleet (total number of vehicles).
2020 2025 2030 2035 2040
Pas
sen
ger
cars
Diesel 73,788 43,042 12,296 - -
Diesel hybrid - - - - -
Diesel PHV - - 31,228 64,279 69,185
Gasoline 363,854 216,172 157,893 117,345 153,027
Gasoline
Hybrid
56,502 60,844 62,807 66,241 69,185
Gasoline PHV - 60,844 62,807 65,927 69,185
BEV 39 39 39 27 12
LPG 34,430 103,925 143,769 147,725 122,670
Natural gas - - - - -
Hydrogen - - - - -
2020 2025 2030 2035 2040
Bu
sse
s
Diesel 5,518 5,546 5,575 5,791 6,011
Diesel hybrid - - - - -
BEV - - - - -
Hydrogen - - - - -
2020 2025 2030 2035 2040
MC
s Gasoline 56,887 61,248 66,382 70,341 68,097
BEV - - - - -
2020 2025 2030 2035 2040
Tru
cks Diesel 18,097 19,190 20,278 20,948 21,619
BEV - - - - -
Natural gas - - - - -
2020 2025 2030 2035 2040
Ligh
t Tr
uck
s Diesel 107,689 106,303 112,797 116,385 119,973
BEV - - - - -
PHEV Diesel 8,877 13,351 13,885 14,419 14,953
Hybrid diesel - - - - -
The projected shift in the road transport fleet results in an equivalent change in the fuel consumption
in the transport sector. As indicated in Table 3, gasoline remains as the main fuel consumed in road
transportation up to 2040. However, gasoline consumption is reduced from 433 million litres in 2020
to 266 million litres in 2040. The use of diesel remains relatively stable throughout the period
dropping only slightly from 270 million litres in 2020 to 240 million litres by 2040. Similarly, the 1st
generation biodiesel used for blending follows a similar trend, as the current blending mix is kept
constant throughout the whole period. Bioethanol is not mixed with gasoline at the moment and
35
Zero penetration of BEV can be attributed to assumed costs. It has to be mentioned that costs in the transport sector were not changed from the KTH study of 2017. In that, vehicle technology costs were taken primarily from IEA-ETSAP technology briefs, which admittedly can now be considered as outdated. This is an important area for improvement in the next set of iterations, where perhaps a mixture of EU Reference Scenario 2016 and Ifeu transport study assumptions can be adopted to tackle this.

175 | C y p r u s ’ N E C P 2 0 2 1 - 2 0 3 0
there is no indication that this will occur in the future. Therefore, bioethanol use remains at zero
levels throughout the modelling horizon. Similarly, no forced blending was implemented for 2nd
generation biofuels, hence these do not appear in the solution.
Table 3 – Evolution of fuel consumption in the transport sector till 2040.
2020 2025 2030 2035 2040
Biodiesel 1st gen Litres 15,719,713 13,982,785 13,886,518 14,340,552 14,102,662
Biodiesel 2nd gen Litres - - - - -
Bioethanol 1st gen Litres - - - - -
Bioethanol 2nd gen Litres - - - - -
Diesel Litres 268,134,121 238,507,006 236,864,974 244,609,521 240,551,780
Gasoline Litres 432,589,622 333,353,280 278,301,631 265,789,608 266,379,848
LPG Litres 37,972,943 112,674,263 153,162,007 125,333,557 126,247,291
Natural gas (STP) m3 - - - - -
Electricity MWh 63,882 463,782 709,896 943,194 965,321
As aforementioned, the model results show a considerable increase in the use of LPG for transport, as
it increases gradually to 153 million litres in 2030 and 126 million litres by 2040. Considering the fact
that the current use of this fuel is minimal, the realistic nature of the results has to be assessed.
Electrification of the transport sector is regarded as a key step in the decarbonisation and
diversification of fuel supply of this sector. A degree of electrification occurs in the projected
scenarios, albeit not by fully-electric vehicles, but by plug-in hybrid vehicles. Nonetheless, the
electricity demand in the transport sector increases significantly, reaching 710 GWh in 2030 and 965
GWh in 2040; corresponding to 11% and 13% of the total final electricity demand respectively. This
poses several challenges to the grid, but also offers opportunities. On the one hand, electricity
demand rises; this will not happen uniformly as charging will primarily occur at specific hours of the
day. It can be expected that the overall load profile will be affected as a consequence. This is
something that is perhaps not captured adequately by the current version of the model and may need
to be amended in the next set of iterations.
At the same time, smart charging of vehicles and potential use of vehicle-to-grid systems, in which
vehicle batteries can be used as additional supporting infrastructure by the grid operator, can offer
demand response services that in turn can add flexibility and have an enabling effect for intermittent
renewable energy technologies. It has to be noted that changes in the transport sector are subject to
the social behaviour of individuals, which is not a trivial matter to address in optimization models. The
willingness of consumers to change their behaviour is a factor that may limit the transition of the
transport sector to alternative fuels and technologies.
Detailed results regarding the transport sector are not provided by the EU Reference Scenario 2016,
thus a detailed direct comparison cannot be made. Furthermore, demand in this scenario is expressed
in vehicle-kilometres, whereas EU Reference Scenario 2016 breaks this down into passenger-
kilometres and tonne-kilometres. Since the assumptions on occupancy and load rate of vehicles are
not shared, a comparison regarding demand cannot be reached either. Nonetheless, the rate of
electrification between the two scenarios can be compared. The share of electricity in the transport
sector increases slowly to 0.6% and 1.3% by 2030 and 2040 respectively in the EU Reference Scenario
2016. However, the corresponding figures in the present scenario are 11.9% by 2030 and 16.9% by
2040. Similarly, EU Reference Scenario project the RES share in the transport sector to fluctuate
around 10% throughout the period from 2020 to 2040, whereas this effort indicates that it will

176 | C y p r u s ’ N E C P 2 0 2 1 - 2 0 3 0
gradually increase from roughly 3% in 2020 to 9.6% in 2040. This inconsistency may be attributed to
different assumptions regarding biofuel blending between the two scenarios36
.
5.3. Heating And Cooling Sector
Concrete conclusions on this sector cannot be made, since the final energy demand was specified as a
hard constraint. Nonetheless, it is worth noting the significant RE share projected till 2050, which will
be mainly driven by solar thermal technologies in buildings, as well as the higher share of RES in the
electricity consumed by this sector. The projected final energy demand of the Heating and Cooling
sector is provided in Table 4. The RES share foreseen in the Heating and Cooling sector is comparable
to that of the EU Reference Scenario up to 2030, as it reaches 24.1% in 2020 and 29.7% in 2030.
However, it is limited to 37.6% in 2040, whereas this scenario projects it to 55%. The main reason for
this difference is the higher share of RES projected in the electricity sector.
Table 4 - Final energy demand in the Heating and Cooling sector (PJ).
PJ 2020 2025 2030 2035 2040
Electricity 8.29 8.37 9.26 10.19 10.93
Heating oil/light fuel oil/Gas Oil 9.01 8.89 8.51 7.60 6.67
Pet Coke 4.32 4.04 3.69 3.42 3.16
LPG 3.38 3.38 3.48 3.35 3.19
Biomass 1.42 1.55 1.78 1.86 1.90
Solar 4.15 4.31 5.15 6.47 7.81
RES share 22.4% 24.3% 29.2% 43.9% 55.8%
5.4. Primary Energy Supply and Final Energy Demand
A moderate decrease in the primary energy supply can be observed across the time horizon (Table 5).
The main driver of this is the incorporation of greater shares of renewable energy, which displaces
fossil-fired generation in the electricity sector. Additionally, in 2020 heavy fuel oil is still used to a
considerable extent until the introduction of less carbon-intensives natural gas in the power sector in
the last quarter of the same year.
Table 5 – Primary Energy Supply evolution till 2040 (ktoe).
2020 2025 2030 2035 2040
Diesel 449 205 204 210 207
Gasoline 331 255 213 203 204
Heavy Fuel Oil 362 - - - -
LPG 102 143 168 150 146
Heating Oil/light fuel oil/Gas oil 215 212 203 181 159
Pet coke 103 97 88 82 76
Natural gas 333 747 748 434 202
Hydrogen - - - - -
Electricity - - - - -
Biomass (includes biofuels) 57 59 65 112 113
36
The future level of blending as well as potential shift of some of the public fleet (e.g. public busses) into fully biofuel-fired is something that needs to be clarified from MECIT. Similarly, whether bioethanol can be blended with gasoline in Cyprus remains unclear. Petrol companies in Cyprus argue that due to the high temperatures experienced in Cyprus, the blended fuel’s vapor pressure will not conform with the fuel quality directive.

177 | C y p r u s ’ N E C P 2 0 2 1 - 2 0 3 0
Solar thermal 99 117 138 169 201
Solar PV 41 41 86 295 476
Wind 20 20 21 21 21
Total 2,112 1,896 1,932 1,858 1,804
Despite the reduction in primary energy supply, final energy demand is projected to increase over
time (Table 6). The main driver in this case is the increased electricity demand. Continued
electrification of the heating and cooling sector, as well as the considerable volumes of electricity
consumed in the transportation sector have a significant role in this. The contribution of fossil fuels
decreases with time, with the exception of LPG, which increases due to its adoption in the transport
sector. Furthermore, the contribution of solar thermal in the heating and cooling sector is projected
to nearly double from 2020 to 2040.
In comparison to EU Reference Scenario 2016, the final energy demand in the present effort is higher.
When aviation is excluded, since it is not reported here either, the EU Reference Scenario 2016
projects final energy demand at 1452 ktoe, 1396 ktoe and 1454 ktoe for 2020, 2030 and 2040
respectively. Thus, the demand reported here is higher by 150 ktoe in 2020, 220 ktoe in 2030 and 280
ktoe in 2040. As mentioned above, a major reason for this discrepancy is related to the final electricity
demand; a difference of 85 ktoe exists for 2020, 130 ktoe for 2030 and nearly 200 ktoe for 2040.
Table 6 – Final Energy Demand evolution till 2040 (ktoe).
2020 2025 2030 2035 2040
Diesel 231 205 204 210 207
Gasoline 331 255 213 203 204
LPG 102 143 168 150 146
Heating Oil/light fuel oil 215 212 203 181 159
Natural gas - - - - -
Pet Coke 103 97 88 82 76
Hydrogen - - - - -
Electricity 476 514 571 637 696
Biomass (includes biofuels) 46 48 54 56 57
Solar thermal 99 103 123 155 187
Total 1,603 1,577 1,624 1,674 1,731
As shown in Table 7, the RES share in final energy demand is projected to increase gradually. The key
sector driving this transition is the electricity supply sector. The 13% target for 2020 is achieved, while
this increases further to 19.5% by 2030 and 45.5% by 2040. In contrast, the EU Reference Scenario
2016 projects a RES share in final energy demand of 14.8% in 2020, 18.4% in 2030 and 20.3% in 2040.
Table – RE share across the energy system.
2020 2025 2030 2035 2040
All sectors 13.1% 15.3% 19.5% 34.3% 45.5%
Electricity 15.6% 18.7% 25.7% 60.0% 83.1%
Heating and cooling 22.4% 24.3% 29.2% 43.9% 55.8%
Transport (Directive 2009/28/EC methodology) 3.7%
Transport (Directive (EU) 2015/1513
methodology) 5.1% 7.4% 9.1% 9.6%
5.5. Carbon Dioxide Emissions
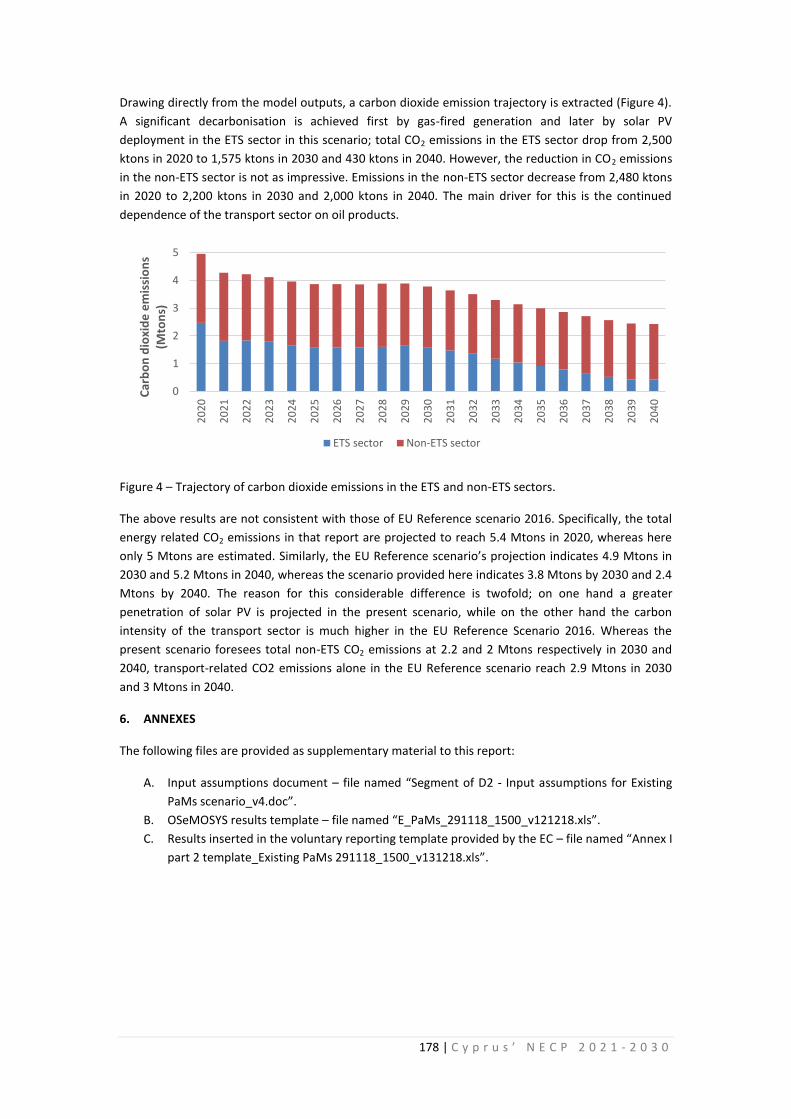
178 | C y p r u s ’ N E C P 2 0 2 1 - 2 0 3 0
Drawing directly from the model outputs, a carbon dioxide emission trajectory is extracted (Figure 4).
A significant decarbonisation is achieved first by gas-fired generation and later by solar PV
deployment in the ETS sector in this scenario; total CO2 emissions in the ETS sector drop from 2,500
ktons in 2020 to 1,575 ktons in 2030 and 430 ktons in 2040. However, the reduction in CO2 emissions
in the non-ETS sector is not as impressive. Emissions in the non-ETS sector decrease from 2,480 ktons
in 2020 to 2,200 ktons in 2030 and 2,000 ktons in 2040. The main driver for this is the continued
dependence of the transport sector on oil products.
Figure 4 – Trajectory of carbon dioxide emissions in the ETS and non-ETS sectors.
The above results are not consistent with those of EU Reference scenario 2016. Specifically, the total
energy related CO2 emissions in that report are projected to reach 5.4 Mtons in 2020, whereas here
only 5 Mtons are estimated. Similarly, the EU Reference scenario’s projection indicates 4.9 Mtons in
2030 and 5.2 Mtons in 2040, whereas the scenario provided here indicates 3.8 Mtons by 2030 and 2.4
Mtons by 2040. The reason for this considerable difference is twofold; on one hand a greater
penetration of solar PV is projected in the present scenario, while on the other hand the carbon
intensity of the transport sector is much higher in the EU Reference Scenario 2016. Whereas the
present scenario foresees total non-ETS CO2 emissions at 2.2 and 2 Mtons respectively in 2030 and
2040, transport-related CO2 emissions alone in the EU Reference scenario reach 2.9 Mtons in 2030
and 3 Mtons in 2040.
6. ANNEXES
The following files are provided as supplementary material to this report:
A. Input assumptions document – file named “Segment of D2 - Input assumptions for Existing
PaMs scenario_v4.doc”.
B. OSeMOSYS results template – file named “E_PaMs_291118_1500_v121218.xls”.
C. Results inserted in the voluntary reporting template provided by the EC – file named “Annex I
part 2 template_Existing PaMs 291118_1500_v131218.xls”.
0
1
2
3
4
5
20
20
20
21
20
22
20
23
20
24
20
25
20
26
20
27
20
28
20
29
20
30
20
31
20
32
20
33
20
34
20
35
20
36
20
37
20
38
20
39
20
40
Car
bo
n d
ioxi
de
em
issi
on
s (M
ton
s)
ETS sector Non-ETS sector