cyclone larry march 2006 - jcu australia · cyclone larry march 2006 post disaster residents survey...
TRANSCRIPT

Cyclone Larry March 2006
Post Disaster Residents Survey
Centre for Disaster Studies, James Cook University,
Australian Bureau of Meteorology
Report Prepared by David King and Douglas Goudie

2
Cyclone Larry. Post Disaster Survey Contents Section Topic Page Acknowledgements 1 Summary 3 2 Introduction 4 3 Method 4 Results 7 4 Warnings and preparations 7 5 Perceptions of warnings 9 6 Timing of Warnings Awareness and Action 16 7 Preparations for Cyclone Season and Cyclone Larry 18 8 Vulnerable households 21 9 Family and Neighbours 23 10 Shelter and Actions 30 11 Perceptions of the Cyclone: Personal and Community 33 12 Impacts and lessons 39 13 Structures and Damage 47 Appendices 54 1 Notes on questions, answers and coding of responses 54 2 All Cyclones experienced by respondents 60 3 Observed Damage 61 4 Survey instrument 64 5 Photographs 68 Acknowledgements Thanks to the survey respondents, often still in shock, for sharing their insights and resilience. Thanks to the Australian Bureau of Meteorology for their sponsorship of this research. Queensland Department of Emergency Services, the centre’s partner. The research team: Dr Douglas Goudie, Dr Dale Dominey-Howes of Macquarie University who participated at his own expense, Sonia Leonard coordinator of the Centre for Disaster Studies and JCU postgraduates Irna Rusch and Kiah Williams.

3
Summary
• Most residents knew what to do and did it. • 81% of respondents had previously experienced a cyclone, primarily Winifred 20
years ago. • The calm of Sunday was deceptive, but people essentially did all they reasonably
could. • The weather warnings were effective. Some suggested there could be more
‘action/how-to’ messages with the warnings. • Many people reported going out to secure or check things during the eye. • People did not go outside during the cyclone. • Many reported putting towels etc. under sliding windows as the rain blew horizontal.
This was dangerous if gusts had struck. • Media reporting of time of impact caused some confusion. It was reported the
destructive winds started at 5 am south of Innisfail, and 7 am to the north. This created some confusion or alarm among some residents – what the media was saying from 5 – 9am was not necessarily matching their real-time experience.
• The forecast track map was well appreciated: • There were a couple of households who used no media, and had no warning from
others, only learning about the cyclone as it hit. • Responses suggested that many people do not understand the nature and cause of
storm surge. • The Bureau needs to continue to promote its web site, particularly how to get into the
high impact weather warning areas as threats manifest. However, computer and internet use are low in this rural area which was reflected by survey respondents.
• Respondents perceived that TV, radio and the internet gave different advice. • Broadcasts created an uncertainty as to whether the eye of the cyclone or the area of
destructive winds was being referred to. Radio stations were each giving out different information.
• There was insufficient information following Larry about Cyclone Wati. This created additional anxiety.
• The overwhelming lesson was ‘Be prepared’.

4
Introduction Following the impact of cyclone Larry on Johnstone Shire and surrounding communities on 20th March, a team of five researchers from the Centre for Disaster Studies carried out a post disaster household survey. The team was led by Dr Douglas Goudie, who has participated in previous post disaster studies. We were also fortunate to have the participation of Dr Dale Dominey-Howes from Macquarie University, and organization as well as participation by Sonia Leonard, the coordinator of the centre, and two postgraduates from JCU Cairns campus. The survey was carried out on a face to face interview basis, beginning on Saturday 25th and concluding on Tuesday March 28th. Eight separate areas/communities were covered – Innisfail Estate, East Innisfail, Flying Fish Point, Coconuts, Kurrimine Beach (one individual was interviewed in Innisfail), South Johnstone, Mourilyan and Babinda. The survey interviewed a representative from 147 participating households that held a total of 471 people at the time the cyclone impacted. The survey indicates a strong pattern of good preparation and protective behaviour, but significantly 82% of respondents had previously experienced a cyclone, principally Winifred that hit Innisfail 20 years ago. All the people; over 200 who spoke to us directly; also represent their families, and reflect the experiences of their neighbours and friends in the impact zone. Many knew they were going through a life-threatening experience. Some only realised this at 3 am, briefly before impact, but even they had prepared. The researchers appreciate them sharing the following information, in the hope that warnings, public awareness and preparedness ahead of major impact events will only become more complete as a result of these responses. A limitation of this data is that it was a household survey. We did not interview many occupants of the possibly 1 in 20 households which had been rendered uninhabitable by cyclone Larry. This means the data is slightly biased on the side of less damage, of less impact than the total zone population. 3. Method The survey was conducted by short answer questionnaire. One respondent from each household answered the questions that were put to them by the interviewer. The interview team worked closely together, both as a team but also geographically. A random point was selected in the community and a cluster of houses was approached by the team. It was clear from examination of the initial photographs of the cyclone impact that damage had occurred in quite a random way, such that a house may have been destroyed while its neighbours were virtually intact. Thus the cluster selection did not necessarily result in a concentration of damage. The advantages of the team working in clusters included security, mutual support, group feedback and access to transport. Early estimates of the cyclone impact suggested that about 5% of residential dwellings had been totally destroyed. The survey recorded less than this estimate because places that had been totally destroyed were less likely to have any household members present at the wreckage at the time of the survey. However the intention of the survey was less about damage, than about behaviour, preparation and warnings. The survey instrument was based upon earlier post disaster studies, especially Steve which hit Cairns in 2000, but in undergoing a rapid review before being conducted, some repetition of questions resulted. There was however an advantage to this when coding the questionnaires

5
for-data entry, in that answers could be cross referenced for greater detail. The questions were open-ended rather than being pre-coded, but limited space was made available on the questionnaire form for answers. Additional notes were recorded by the interviewers where the respondents expanded on their answers or gave additional information. These notes have been incorporated into the text of this report. Because the questions were open-ended there was a diversity of responses. All answers were therefore coded and defined by one person. Notes on questions, answers and coding of responses are given as Appendix 1. The questions in the survey followed a roughly chronological or logical order in terms of actions and preparedness following a series of different types of warnings and information. The responses have been organized into categories of questions which are presented as tables and figures with annotation and discussion. The transcriptions reflect general responses verbatim, not easily reduced to one of the standard array of coded answers. They also capture ‘the outliers’, or the unusual. With so many open-ended questions and prompts, the transcriptions show the merit of such questions, to capture a complete and accurate record of how people reacted to safety weather warnings, what happened, what lessons the Bureau, the media, various authorities and residents in threat zones can learn from impact residents’ often frightening experiences. The transcribed responses to questions were variously obvious, detailed, thorough, telling, insightful or illuminating. Transcriptions of Comments Following the commentary on tables that have been generated from the database are statements, thoughts and ideas from the respondents who participated in the survey. To indicate each location, survey form, respondent gender, age and household size, the following coding guide introduces each entry: Coding guide ie: 6, 120, m79, 2. = Location 6 (Babinda), interview form #120, main respondent male, 79 yo, 2 people normally in HH. Survey location key: Innisfail Estate = 1, Innisfail East = 2, The Coconuts/ Flying Fish Point = 3, South Johnstone = 4, Mourilyan = 5, Babinda = 6 (See Figure 1). R = Source of a recommendation, while an “*” identifies a point of particular interest. [words in squared brackets added by Goudie] No names or addresses were recorded in the questionnaire database, which remains confidential.

6
Figure 1. Location of Survey Communities

7
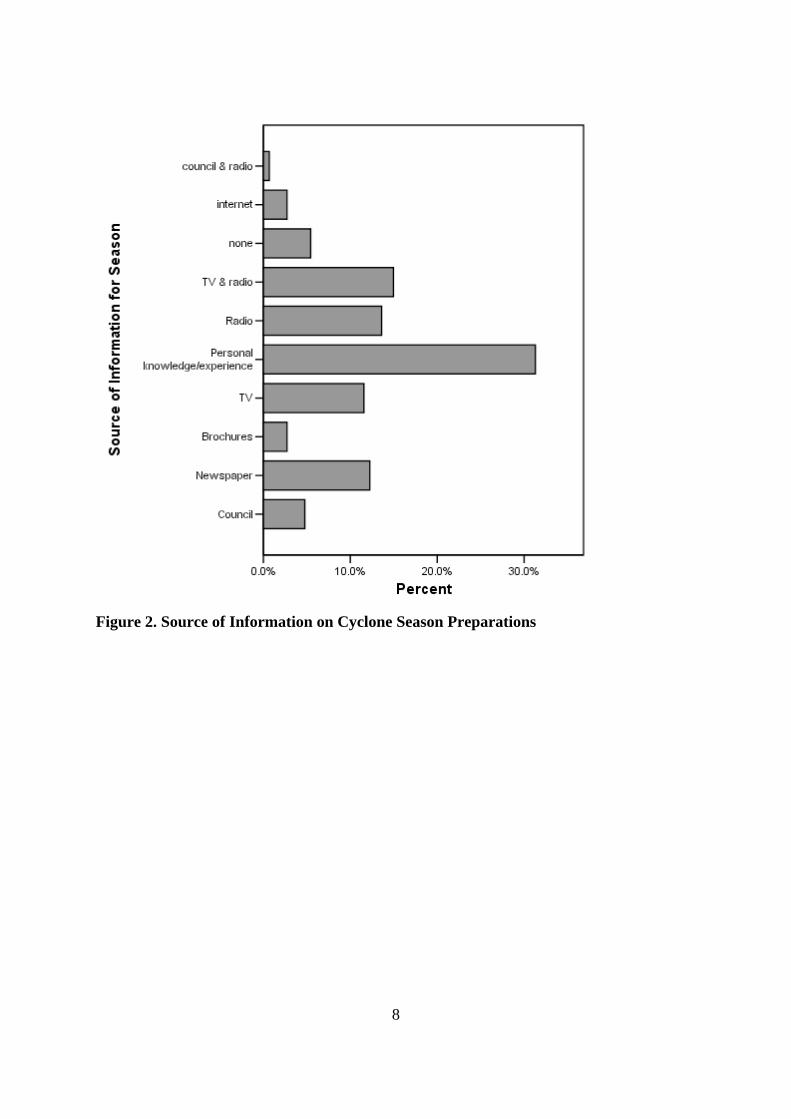
Results 4. Warnings and preparations Warnings to the public and community at large consisted of non specific cyclone preparation advice that is issued at the beginning of each cyclone season and reiterated throughout the season, and specific cyclone watch and cyclone warning advice when the cyclone threatened. Table 1. Source of Information for Pre Cyclone Season Preparations
Pre season Household Discussion Total Source of Information for Season Yes No Count Col % Count Col % Count Col % Council 6 8.6% 1 1.3% 7 4.8%Newspaper 12 17.1% 6 7.8% 18 12.2%Brochures 1 1.4% 3 3.9% 4 2.7%TV 7 10.0% 10 13.0% 17 11.6%Personal knowledge/experience 25 35.7% 21 27.3% 46 31.3%Radio 5 7.1% 15 19.5% 20 13.6%TV & radio 11 15.7% 11 14.3% 22 15.0%None 2 2.9% 6 7.8% 8 5.4%Internet 1 1.4% 3 3.9% 4 2.7%Council & radio 1 1.3% 1 .7%Total 70 100.0% 77 100.0% 147 100.0% The dominant answer to source of information on general preparations for the cyclone season, in Table 1, is personal or local knowledge. This response was stronger in the smaller communities outside Innisfail, but these were visited later in the survey and it seems probable that the interviewer’s response to peoples’ statements altered after the first day of surveying. It is probable that a much higher proportion of people than the 31% indicated had ample personal knowledge, as shown in later tables of cyclone experience. Otherwise the dominant sources of information are a combination of TV, radio and newspapers – both the local Innisfail Advocate and the Cairns Post. Almost equal numbers of respondents had discussed a cyclone emergency plan with household members as had not done so. Many of those who had not discussed a plan were either single or a couple, many of whom were elderly and of long term residence. This does not therefore indicate a lack of interest so much as underscore the long acquired local knowledge of residents.
8
Figure 2. Source of Information on Cyclone Season Preparations

9
5. Perceptions of warnings Table 2. Information Source During Cyclone Warning Period
Info source on Sunday Count Col % Radio 38 25.9%TV 26 17.7%Friends & Relatives 5 3.4%BoM website 19 12.9%Local Authorities 1 .7%Multiple sources 31 21.1%TV & radio 27 18.4%Total 147 100.0%
Figure 3. Source of Cyclone Information on Sunday 19th March A cyclone warning existed throughout Sunday 19th March, with Larry already categorized as a fast moving category five. Table 2 records the source of information that people used during that warning period. The Bureau website is identified, but some people just answered ‘internet’ to this question. Multiple sources also included internet use, but this response was

10
often also a combination of word of mouth and media. A very small number of respondents had Austar and had mentioned the excellence of the weather channel. My own sources of information that day also included the weather channel, TV stations and the BoM website. The weather channel was the only TV station to accurately, promptly and continuously represent the Bureau’s information. That further information prompted people to: 1, 31, f31, 3. Cut near trees, opened manhole, informed neighbours, packed up family ready to leave. 2, 46, f43, 9. Cleared yard, secured all, put trampoline away, and mobile basketball hoop and clothesline packed in shed. 2, 53, m39, 3. Panic buying of food. Left everything to the very last minute. 4, 99, m40, 2. Screwed windows shut. 6, 126, f 51, 6. *Did nothing because Babinda was never mentioned in the final warnings. [This may seem naive, but it does help reinforce the: “it won’t happen to me” syndrome – R: as landfall nears, ensure the names of all settlements and districts in the high impact zone are mentioned.] 2, 42, f38, 4. Packed photos, kept preparing, priming kids. Table 3. Use and Source of Cyclone Tracking Map Used tracking
map Total
Yes No Source of tracking map Count Count
Count Col %
BoM website 29 1 30 20.5% Phone book 4 1 5 3.4% Brochure 1 1 2 1.4% Council 6 10 16 11.0% Did not use map 83 83 56.8% Newspaper 6 6 4.1% Family/friends 2 1 3 2.1% Phone book & shop 1 1 .7% Total 48 98 146 100.0% Of the 98 respondents to this question, of the vast majority, who did not use a tracking map, there were 15 who at least possessed one. The majority of those who did use the tracking map did so through the BoM website, which means that they were not marking on their own track points. This leaves only 13% who interactively plotted the cyclone themselves. After similar surveys some years ago we reported to the Bureau that hardly anyone used the tracking map in the phone book. The consequent temporary withdrawal of the map from the phone book resulted in an outcry, and its resubmission. However, nothing much has changed – only a handful of true believers still plot their own cyclone track in the phone book. Table 3 indicates that only 20% of respondents used the BoM website for sourcing tracking maps while table 2 and figure 2 indicate that only 13% of respondents used the website or internet for obtaining general information about the progress of cyclone Larry during the warning period. In table 2 we have recorded the primary source of information about the cyclone while table 3 is specifically concerned with where people obtained or viewed the

11
tracking maps. Despite the difference in these proportions they are both very low. For this reason table 4 has been generated from the ABS 2001 census. The figures in this table are for the whole of the population of Johnstone Shire 5 years ago, but in line with the survey data they indicate that only 12.5% of the population uses the internet at home, 16% use it at home and in combinations with work and elsewhere and a whopping 72% does not use the internet at all. This is of no surprise in a rural/small town population where communications are far below the quality enjoyed in metropolitan areas. Table 4. 2001 Census Data Showing Internet Use in Johnstone Shire
Source: ABS CData 2001 Table 5. Use of Tracking and Forecast Maps Used tracking map Total
Yes No Usefulness of Forecast map Count Count
Count Col %
Yes very 19 27 46 32.6% Yes 27 20 47 33.3% Not much 1 4 5 3.5% Did not see it 2 41 43 30.5% Total 49 92 141 100.0% The information sheet that was handed out with the questionnaire survey (assuring confidentiality and the voluntary nature and purpose of the study) illustrated the forecast track map that was used by the Bureau on its website and on TV. While 65% had not used the

12
tracking map, 69% had seen and used the forecast track map, with most of them finding it useful or very useful. Table 6. Bureau of Meteorology Advice and Warnings Rating of BoM cyclone advice Count Col % spot on 18 12.2% reliable 47 32.0% could be more frequent near landfall 13 8.8% more prominent/louder 10 6.8% okay/pretty good 44 29.9% missed/didn't hear them 5 3.4% contradictory messages 6 4.1% exact locations impacted 3 2.0% NESB 1 .7% Total 147 100.0% Were the BoM messages Useful Yes 133 91.7% No 12 8.3% Total 145 100.0% Were They Easy to Understand Yes 141 98.6% No 2 1.4% Total 143 100.0% Were They Too Technical Yes 13 9.1% No 130 90.9% Total 143 100.0% Were They Frequent Enough Yes 105 73.4% No 38 26.6% Total 143 100.0% Rating of BoM messages excellent 17 13.2% good 31 24.0% Okay 22 17.1% poor 3 2.3% Make them more regular 39 30.2% media exaggerated 2 1.6% no access to radio/power loss 3 2.3% needed more info 11 8.5% siren frightening 1 .8% Total 129 100.0% Some comments on the tracking maps: 1, 6, f50, 2. No. Don’t understand how to use map. 2, 46, f34, 9. Could not find until after cyclone passed. 4, 90, m63, 1. No – saw the neighbour’s print out and didn’t bother with it.

13
6, 121 m75, 2. Don’t understand longs and lats. Would be better if it said ‘100 km east of …, or 45 km SE of …. There was a strong positive response to questions about BoM advice and messages. The interviewers recorded the terms used by respondents such as “spot on” or “reliable”. There was more of a rating implied in the last of these questions, but responses were mixed up with the way in which the media relayed these messages. Thus while there is high approval of the usefulness, ease of understanding, and technical appropriateness (all over 90%), approval dropped with the frequency question to only 73% and on the rating of messages the request to make a messages more regular came from 30% of respondents. Some of this response concerned BoM spacing of warnings but criticism also included media failure to be up-to-date. A specific criticism was a tendency for some channels to continue broadcasting an earlier warning well after the time that an update had been issued. TV channels were also unpredictable as to when they would broadcast an update. The best channels were those that used a continually repeated text banner. Channel 7 did this throughout the Sunday evening. Responses to Qs 34 – 36 have been merged and grouped [demonstrating the merit in structural survey prompting]: 34. During the passage of Cyclone Larry the weather bureau issued regular cyclone advice messages. Is there anything about the delivery of these messages that members of this household believe could be improved? 35. Did the messages contain the information that you felt you needed? 36. Please add any additional remarks you would like to make regarding the advice messages put out by the weather bureau. Emergent groups Feedback to media, siren use, conflicting information, old information, impact times, update frequency, Cyclone Wati, praise to the Bureau, advertise Bureau site, Bureau innovation, and ‘what-to-do’ information. Feedback to media 1, 31, f31, 3. Good; but the live broadcast stories [on the ABC] were depressing. 1, 19, m53, 5. Need TV warnings hourly (and not 3 hours old). Didn’t give lat and long on 4KZ until it cut out. 5, 116, m48, 4. Radio did not broadcast enough Bureau facts. 6, 145, m 81, 4. Not as much warning on TV. 4, 89, f 69, 2. *Clear feedback to radio commentators – speak more slowly. 4,101, f39, 5. For Sunday TV: use less crawlers, more siren and detail. 1, 20, m37, 6. * Please give flood warnings – very worried. Knowledge of alternative radio information 1, 15, m53, 2. When cyclone happened (8 hours) there was no radio signal. [The local radio stations (4KZ and ABC) stopped broadcasting, but an adjacent ABC transmitter (on another frequency) broadcast into the impact zone – many but not all knew of the alternative radio frequency]. 2, 42, f38, 4. No access to radio transmission for 2 days. 2, 53, m39, 3. ** If radio and power gone, how can we get extra messages?

14
Sirens 2, 48, m40, 5. The siren on TV was too short. 2, 50, f30, 8. Louder siren. 4,101, f39, 5. We need a longer siren time. 5, 117, m 42, 6. * Not all channels used the siren. The siren was under-used. Used to use of the siren warnings. 6, 145, m 81, 4. No siren, which really needed to tell people to be careful. Conflicting information 3, 74, m30, 2. Felt that messages were misleading and contradictory. Different sources said different things. 2, 56, m47, 4. **TV, radio and www all giving different advice. 2, 51, f58, 2. Don’t stuff around. Be clear and precise. Felt messages were conflicting. 5, 116, M48, 4. Austar said hit by 6 am, and it did [in Mourilyan]. Radio said about 10 am – it was all over by 9.30. 2, 56, m47, 4. Consistency. Old media information caused concern 2, 48, m40, 5. There was some confusion, because some of the information was 2 hours old – ie 6 pm Sunday gave a 3 pm bulletin. Listened to the ABC all night. We would like the broadcast bulletins to be up-to-date. 2, 48, m40, 5. *The media presenting old reports. This father of 3 got updates from out of the region by mobile (clear until Monday) because “the ABC had old news”. 3, 65, m38, 5. The radio kept running on past reports. For example, the 8 pm report on the ABC was from the 5 pm bulletin from the Bureau.. A 1 am bulletin from the web, but a 2 am broadcast on the ABC quoted a 12 midnight Bureau bulletin. 2, 35, m49, 4. A bit late - behind in time by 1 hour. 4, 88, f30, 4. TV relays old messages. Impact times 2, 46, f34, 9. While the cyclone was on, radio (NQ ABC) forecasts were about an hour late – saying the eye was coming at 8 am, when it had already passed. 4, 89, f69, 2. Warning area too wide, seen as alarmist tactics. 5, 116, m48, 4. Landfall time not accurate. 2, 46, f34, 9. They didn’t know the eye was passing, we did (the 2nd half was worse). 6, 132, f 50, 3. **Make clear in broadcasts if they are talking about the eye of the cyclone, or which quadrant. Dept of Met needs to have better communication with radio stations, as each one was giving out different information. Update frequency 1, 17, f38, 5. Warnings old. More frequent. We need ½ hourly warnings. Two hour warnings is bullsh.. 1, 19, m53, 5. Need TV warnings hourly (and not 3 hours old). 2, 40, m45, 4. Frequent enough but not updated enough. Wati 2, 45, f62, 6. *Cyclone Wati – why no information? We had to ring Mackay to get

15
information. 1, 31, f31, 3. *Wanted more information on Wati [some people felt that Wati was threatening, but ‘the authorities were keeping this from the Innisfail area, so as not to alarm people more; but this fear only made many worry, anyway’. 4, 89, f69, 2. Started tracking Wati on net – but updates were late. 2 – 3 updates were late. Why so little information on Wati? Praise to Bureau 1, 33, f56, 6. ‘Spot on’. Predicted hit at 6 am and it did. 2, 48, m40, 5. OK, felt well updated. 2, 50, f30, 8. Really good. 3, 65, m38, 5. Can’t do more. Internet was good. 1, 15, m53, 2. Family got through on landline from down south to give information [this was often reported – family or friends ringing in to give web or media based information after local power outages.] 2, 46, f34, 9. We were relying on the forecasts and we got what we needed. 1, 33, f56, 6. The best. 2, 46, f34, 9. Good. We liked the basic information first. 2, 51, f58, 2. Clearer – unambiguous. 4, 88, f30, 4. TV relays old messages; internet [BoM] the best. 4,101, f39, 5. Did their best. Got on the radio a lot. ‘Good to have that warning’. Advertise Bureau site 1, 33, f56, 6. ***Learned about the Bureau cyclone forecast map from chat room from some-one in the USA. We then printed that and other info and shared it with neighbours. [there were some people with web access who were unaware of the bureau site – a long-standing recommendation to the bureau is to do more to promote the site, and particularly how to get into the high impact weather warning areas as threats manifest. 1, 33, f56, 6. Would liked to have know where the BoM web site was before the cyclone was looming. 1, 33, f56, 6. *Please let us know about the Bureau web site. [Advertising the Bureau site more is a standing recommendation]. What-to-do information 6, 136, m 55, 2. Did not tell newcomers the practical things to do, like opening windows on lee-ward side in case of pressure build up. Should have checklist of things people should run through. [see list of ‘what-to-do’ near end of this working report, for inclusion in information in lead up to cyclone season and individual cyclone threats]. Bureau innovation 6, 126, f 51, 6. Wants a list of the exact locations which may be heavily impacted. 2, 41, f30, 5. *Didn’t advise when over. 3, 73, m75, 2. As a FESA volunteer from WA, strongly recommend that a colour coding should be used. 3, 77, m57, 3. Got to make them more meaningful – we didn’t believe them. [see standing Goudie recommendations to Bureau, below, re impact simulations, recent like-impact photos and footage for visual media use]
16
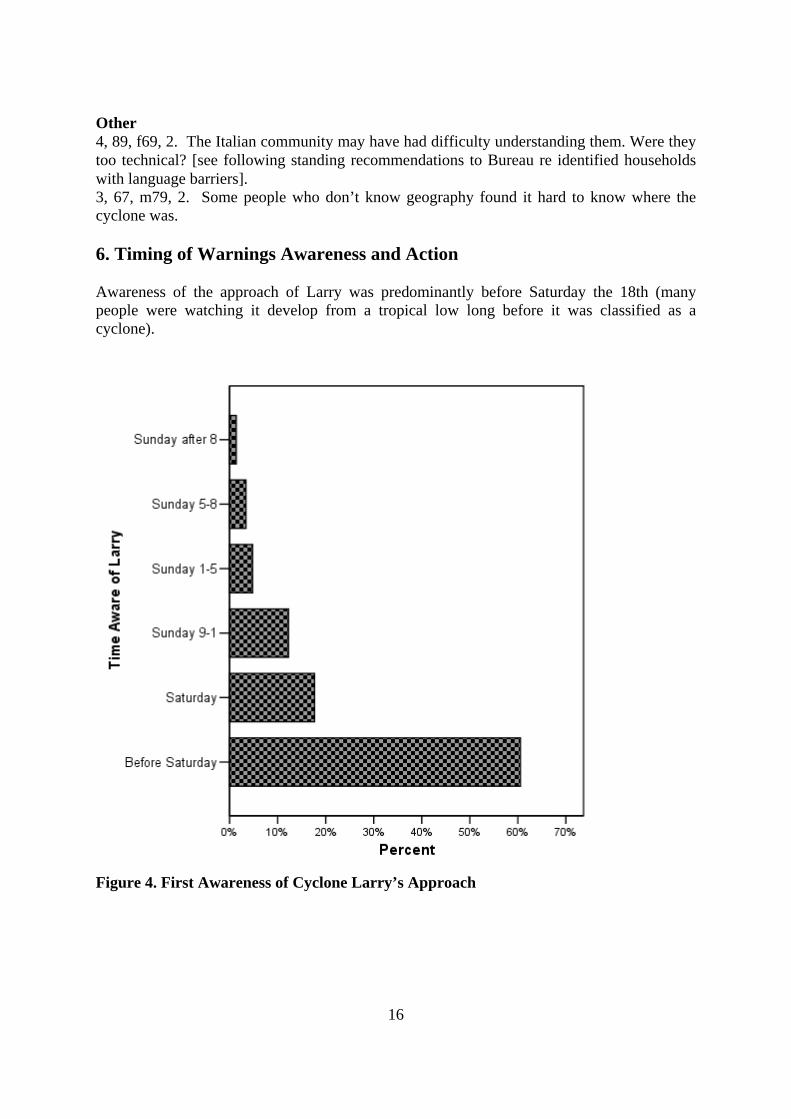
Other 4, 89, f69, 2. The Italian community may have had difficulty understanding them. Were they too technical? [see following standing recommendations to Bureau re identified households with language barriers]. 3, 67, m79, 2. Some people who don’t know geography found it hard to know where the cyclone was. 6. Timing of Warnings Awareness and Action Awareness of the approach of Larry was predominantly before Saturday the 18th (many people were watching it develop from a tropical low long before it was classified as a cyclone).
Figure 4. First Awareness of Cyclone Larry’s Approach

17
Table 7. Time that People Became Aware of Cyclone Larry’s Approach Time Aware of Larry Count Col % Before Saturday 89 60.5% Saturday 26 17.7% Sunday 9-1 18 12.2% Sunday 1-5 7 4.8% Sunday 5-8 5 3.4% Sunday after 8 2 1.4% Total 147 100.0% Final preparations were predominantly left until Saturday and Sunday. Those who made no preparations seemed to have generally maintained a seasonal pre cyclone readiness and commented thus. A later section of this report indicates peoples’ feelings on receiving the cyclone warning on Sunday; most responded that they had experienced levels of fear and concern. This appears to have been slightly disconnected from the concern expressed in responses in table 8. A level of concern felt during the preparation period seems to have ratcheted up for a sizeable proportion, 38%, who reported becoming concerned when the cyclone impacted, giving various times between 4:30 and 7:30 a.m. By this time the power had gone off and people were in the dark inside their homes. Table 8. Time that People Became Concerned About Larry and Time of Commencing Preparations in Response to the Cyclone Warning Time of beginning preparations Count Col % Before Saturday 16 11.0% Saturday 30 20.7% Sunday before 9 3 2.1% Sunday 9-1 22 15.2% Sunday 1-5 41 28.3% Sunday 5-8 11 7.6% Sunday after 8 10 6.9% none made 12 8.3% Total 145 100.0% Time became concerned about Larry
Before Saturday 5 3.5% Saturday 14 9.8% Sunday before 9 5 3.5% Sunday 9-1 19 13.3% Sunday 1-5 27 18.9% Sunday 5-8 8 5.6% Sunday after 8 8 5.6% Monday am 54 37.8% Not concerned 3 2.1% Total 143 100.0%

18
Transcription of Comments 1, 4, m78, 4. Monday early morning when the power went out. 2, 48, m40, 5. Way too casual. 3, 65, m38, 5. *A 4 – 6 m surge was predicted, and believed our slab was above 4 m anyway, so stayed [at Kurrimine Beach]. The shelter at Silkwood blew away. 7. Preparations for Cyclone Season and Cyclone Larry We attempted to categorise levels and timings of Cyclone preparation in tables 9 to 11 itemising different actions. Table 9 shows pre-season activities, where the response “nothing” often came from single or couple household respondents who felt that they had maintained their property in a state of readiness. Table 9. Activities in Preparation for Cyclone Season Preparation for Cyclone season Count Col % Yard clean up 39 26.7% House preparation 17 11.6% Emergency kit 6 4.1% Nothing 52 35.6% Shopping 26 17.8% All of the above activities 6 4.1% Total 146 100.0% As shown in table 10 smaller proportions did “nothing” in response to the warning, although again comments suggested that many of these respondents felt there was nothing further that was necessary. Table 10. Additional Preparations Prompted by Cyclone Warning Preparations prompted by warning Count Col % Tape windows 5 3.4% Clear yard 43 29.3% Buy supplies 8 5.4% Buy fuel 1 .7% Evacuate 3 2.0% Repair building/trim vegetation 2 1.4% Secure car and/or boat 2 1.4% Secure other belongings 6 4.1% Nothing 26 17.7% Store water 7 4.8% Food preparation 1 .7% Clear yard & secure boat 10 6.8% Clear up, shop & secure 26 17.7% Buy supplies & store water 4 2.7% Store water & secure belongings 3 2.0% Total 147 100.0%

19
Table 11 attempts to separate purchases from other preparations, but many respondents saw these questions as repetitious and gave similar answers. The categories in both tables 10 and 11 of "secure, clear up and shop" were used for people who indicated that they had done all of the advised preparatory activities. Only 18% fell into this category in table 10, while in table 11 some of those people's responses were concerned with actual purchases as intended by the question. Generally people gave one or two responses rather than indicating that they had prepared on a range of actions. As a community they covered all the activities, but as individual households they were selective in terms of the actions they took. Table 11. Further Purchases and Preparations Made During the Warning Period Purchases & Preparations during warning period
Count Col %
Batteries 4 2.7% Tinned Food 3 2.0% Fresh food 2 1.4% Fuel 3 2.0% Check or buy generator 2 1.4% All of batteries, candles, food, fuel 42 28.6% Nothing 37 25.2% Batten down/clear yard 28 19.0% Store water 2 1.4% Store water & clear up 9 6.1% batteries & candles 1 .7% Food 7 4.8% Secure,clear & shop 6 4.1% Secure personal belongings 1 .7% Total 147 100.0% Despite the selective nature of preparations 84% felt that preparations were excellent or good, with a further 8% reckoning "pretty good", which in common usage in Australia can be taken to mean the same as good. Sometimes we interpret pretty good to be less than good, but as frequently it is the classic understatement that actually means better than just good. Overall 92% of households felt satisfied with the adequacy of their preparations. The mass majority of the respondents to this survey had not experienced major loss or damage, so to an extent their assessment is related to their good fortune in getting through. For example only 8% had experienced the loss of the roof of the house (see table 37). 1, 13, m69, 8. Froze water, brought generator. 1, 20, m37, 6. Welded up frame for roller door. 3, 73, m75, 2. Put newspapers and towels around doors and windows.

20
Table 12. Household Assessment of Cyclone Preparations and Decision to Stay or Evacuate Stay in House Total
Yes No - evacuate Count Col % Adequacy of Preparations Count Col % Count Col %
Excellent 11 9.2% 3 12.5% 14 9.7% Good 90 75.0% 16 66.7% 106 73.6% Pretty good 11 9.2% 1 4.2% 12 8.3% Fair 8 6.7% 8 5.6% Poor 4 16.7% 4 2.8% Total 120 100.0% 24 100.0% 144 100.0% Table 12 also indicates the households that chose to stay and those that evacuated. Firstly there is not a significant difference between those who stayed and those evacuated in terms of the perception of the adequacy of preparations. Those who evacuated did not do so because they had not prepared adequately for the impact of the Cyclone. Rather they evacuated because they lived in low-lying coastal areas that were vulnerable to storm surge. Authorities and emergency services went to communities that were at risk of storm surge impact and ordered evacuation for reasons of safety. People were instructed to leave but not necessarily directed to a shelter or place of safety. Evacuation was to other friends and relatives outside the storm surge zone, or even outside the region. 1, 2, f30, 4. OK. Could do better – needed extra food and gas for bbq. 2, 46, f34, 9. Didn’t get dog food or gas. 5, 119, f 41, 5. Need cash. [This was a recurrent theme – no power = no auto tellers = no $ ]

21
8. Vulnerable households Table 13. Vulnerable Households Preparations Prompted by Cyclone Warning Vulnerable Families Total
Elderly Single Parent & Young kids
Special Needs
All others
Preparations prompted by warning
% % % %
Count %
Tape windows 6% 5 3%Clear yard 28% 75% 25% 28% 41 29%Buy supplies 9% 8 6%Buy fuel 1% 1 1%Evacuate 10% 2 1%Repair building/trim vegetation
2% 2 1%
Secure car and/or boat 2% 2 1%Secure other belongings 13% 2% 6 4%Nothing 25% 20% 16% 26 18%Store water 9% 5% 7 5%food preparation 3% 1 1%clear yard & secure boat 3% 10% 7% 9 6%Clear up, shop & secure 13% 25% 30% 17% 26 18%Buy supplies & store water 3% 5% 2% 4 3%Store water & secure belongings
3% 2% 3 2%
Total 100% 100% 100% 100% 143 100% In table 13 and various other tables that follow, a sub categorisation of vulnerable families has been generated from family type (see table 16), ages of household residents, and people with special needs (see table 25). While the categories of elderly and single parents with young children are mutually exclusive, those with special needs may include members from each of the former categories: such as frailty, medical needs and the needs of young children. As special needs was a self reported categorisation, vulnerable families have been classified firstly according to elderly households and single parent with young children households, with special needs households being others that had not fitted into either of the former categories. The special needs group thus consists mostly of people who are either disabled or on medication. 1, 4, m28, 1. In wheelchair. 1, 14, m46, 2. In wheelchair. 2, 44, n, 6. Twin babies (given nappies). * it is reasonable to categorise babies as having special needs. 2, 48, m40, 5. One child on crutches had to be carried, and, with the high humidity, one child with croup. 2, 58, m43, 6. 1 mentally challenged; one with kidney problems – can’t monitor kidney tests. 3, 79, x, x. Wheelchair. Evacuated to Cairns. 5, x, mx, 1. Sight impaired

22
6,120, m79, 2. Man is wheat intolerant, problem with basic food supplies; F has low-level leukemia, needs careful diet control. Table 14. Insurance Status of Vulnerable Families Vulnerable Families Total Property insurance Elderly Single
Parent & Young kids
Special Needs
All others
Count %
House only 3% 25% 5% 2% 5 4%Contents only 5% 13% 12 9%House & contents 84% 25% 75% 64% 96 69%None 13% 50% 15% 21% 27 19%Total 100% 100% 100% 100% 140 100% In both tables 13 and 14 the single parents with young kids households clearly behaved significantly different from the elderly households. Obviously their priorities are different as well as their economic status. Most single parents were in rented accommodation so the insurance situation was quite different, but they were clearly more vulnerable with 50% having no insurance at all. Preparatory activities were also very different for the single parents, who were dominated by clearing up the yard. The elderly did a much greater range of things and presumably their yards were clearer in the first place. The fact that 69% of the respondents had both house and contents insurance indicates a high level of preparation and production of vulnerability. The survey only recorded the insurance that the respondents held. A number of people in rental accommodation indicated that they thought that the landlord probably had house insurance. However this has not been included in table 14.

23
9. Family and Neighbours The question on family and visitors during the passage of the Cyclone was not answered too well, so only the basic numbers are recorded in table 15. What it particularly shows is that only one household had a family member not present in the house during the Cyclone. In one sense this is not surprising as the Cyclone hit some time before dawn. However in the days before the survey was carried out, when we were generating the survey instrument, there were many stories of people who had found themselves stuck away from home, and some anecdotes of people trying to get back just as the cyclone arrived. The responses from the survey suggest that this was not an issue. Table 15. Family and Visitors During Cyclone Larry Other visitors Family together Other
family visited
Other Friends visited
None not relevant/ no family
Total
All family in house 7 1 37 45 Some family out 1 1 evacuated 2 2 2 1 7 not relevant 1 7 1 9 family & evacuees 6 4 10 Total 15 8 47 2 72 The family type was derived from a listing of age and gender, but did not ask people to define their relationships. Generally the interviewers provided notes to explain who was there in the house at the time of the Cyclone. There is therefore some approximation in these categories. The survey only records 7% of families and single parents whereas the census (table 21) indicates that 15% of all families in Johnstone shire were one parent families. However the categories in table 16 of multi-family, unrelated adults and extended family are a consequence of people going to shelter with relatives, neighbours and friends. Some of the extended families may normally be extended family households, but table 16 records the family/household structure as it existed during the Cyclone. Family contact 4, 89, f69, 2. By phone. Phone landlines in Sth Johnstone stayed on until Monday night. 6, 135, f80, 2. No phone – due to crossed lines my neighbour was receiving my calls.

24
Table 16. Family Type and Contact/Presence of Family Members Family contactable Total
Yes No No others
Count Col % Family Type
Count Count Count Single person 11 5 3 19 14.1% Couple 30 4 34 25.2% Single parent kids under 12 2 2 1.5% Single parent & kids >12 6 6 4.4% Couple & kids <12 11 2 13 9.6% Couple & kids >12 15 1 16 11.9% Multi family 9 1 10 7.4% Unrelated adults 2 2 1.5% Extended Family 23 23 17.0% Single parent & kids all ages 1 1 .7% Couple & kids all ages 9 9 6.7% Total 119 10 6 135 100.0% Tables 19 to 21 are derived from the ABS 2001 census to provide supplementary figures on Johnstone Shire. The overall proportion of single parent families in the shire, 15%, is slightly lower than the state proportion of 15%, but the elderly at 15% are higher than the state proportion of 12%, and the indigenous population at 8% in Johnstone Shire is much higher than the state proportion of 3%. Table 17. Contact With Relatives and Neighbours, Before and During Cyclone Contact with other relatives Count Col % Yes 26 24.8% No 6 5.7% None 3 2.9% Lots 22 21.0% Little 3 2.9% Mobile contact 15 14.3% Landline Phone 30 28.6% Total 105 100.0% Frequency of neighbour contact Often or lots 55 48.7% A bit 22 19.5% None 16 14.2% Helped/contacted during eye 15 13.3% Community evacuated 2 1.8% After cyclone 3 2.7% Total 113 100.0% Contact with other relatives and with neighbours both before and during the Cyclone was very high. Only 3% had no contact with other relatives and 14% had no contact with neighbours. A number of respondents reported having contact with their neighbours during the passage of the eye of the Cyclone. The eye did not pass over all of the communities that

25
were covered in this survey -- this was primarily an Innisfail experience. Additionally a number of households had invited their neighbours in or had gone and spent the cyclone with neighbours or other relatives. The same is generally true for those households which are defined as more vulnerable. Contact with other relatives was very high, although contact with neighbours was significantly lower for these groups, possibly because of a strong involvement with family and relatives. Contact with neighbours 1, 8, m37, 5. We are not particularly close to our neighbours but because it was such a horrible experience, we kept checking out how each household was doing and kept swapping one generator between two households. We buried any negative feelings because the community has got to work together. 4, 87, m49, 5. Yes, elderly neighbour, recent heart surgery. 4,100, f46, 5. Phones out Tues. am. Mobile out Monday. Phones back Thursday. If yes, when or how often? 1, 15, m53, 2. During eye. [Many people reported going out to secure or check things during the eye]. 1, 18, f64, 1. Went out in the eye to help move neighbour’s roof truss. 1, 19, m53, 5. During the eye – helped move iron. 1, 20, m37, 6. All out in the yard before and after. 1, 8, m37, 5. Regularly in the eye of the storm. Table 18. Vulnerable Households Contact with Relatives & Neighbours Vulnerable Families Total Contact with other relatives Elderly Single
Parent & Young kids
Special Needs
All others
No. %
Yes 10% 50% 33% 23% 23 23%No 5% 7% 6% 6 6%None 5% 3 3%Lots 19% 50% 20% 21% 22 22%Little 5% 3 3%mobile contact 10% 20% 16% 15 15%Phone 57% 20% 24% 30 29%Total 100% 100% 100% 100% 102 100%Frequency of neighbour contact
Often or lots 35% 67% 64% 49% 53 48%A bit 26% 21% 21 19%None 17% 33% 29% 10% 16 15%helped/contacted during eye 9% 7% 17% 15 14%community evacuated 4% 1% 2 2%after cyclone 9% 1% 3 3%Total 100% 100% 100% 100% 110 100%
26
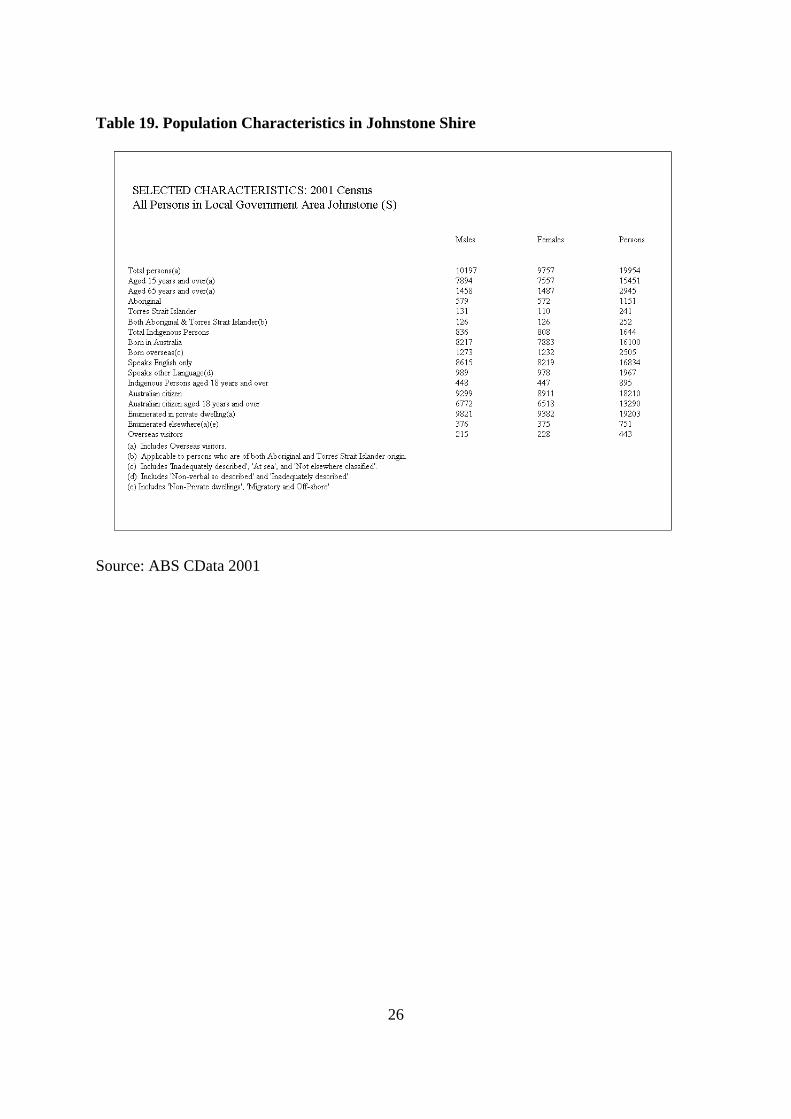
Table 19. Population Characteristics in Johnstone Shire
Source: ABS CData 2001

27
Figure 5. Household Size
28
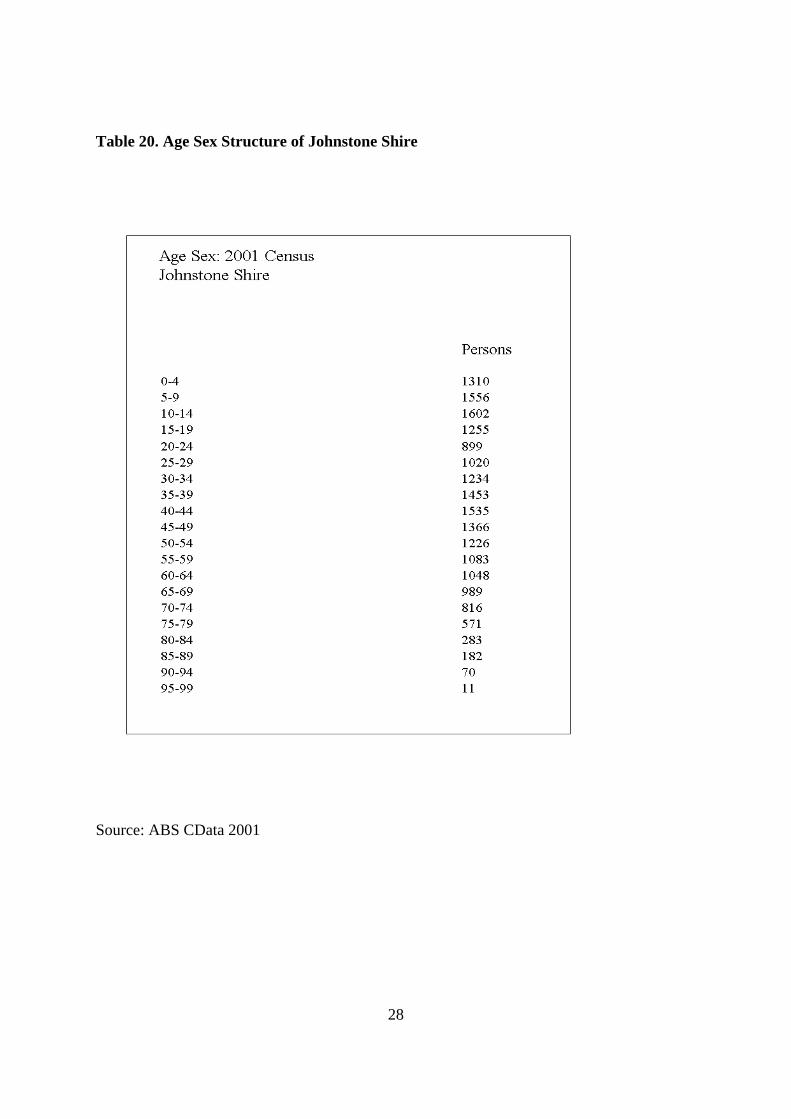
Table 20. Age Sex Structure of Johnstone Shire
Source: ABS CData 2001

29
Table 21. Family Type in Johnstone Shire
Source: ABS CData 2001

30
10. Shelter and Actions Two separate questions were asked concerning where people shelter in the house and what actions they took in protecting themselves and sheltering during the passage of the Cyclone. Respondents tended to see these questions as repetitive such that many gave the same answer to both questions. However the intent had been to record the place of shelter within the house, as indicated in table 22, and actions that were taken to improve safety and protection, as indicated in table 23. The two tables give a picture of where people sheltered within their houses and some of the additional things that they used such as mattresses or sheltering underneath a table. The impression from the survey questionnaires was that people chose stronger rooms, centrally located rooms, or rooms that were on the lee side of the house. Thus some people moved about from room to room anyway, but others clearly relocated as the wind shifted. Many older Queensland houses have a hallway or passageway in a central part of the house, while newer houses tend to be much more open plan in the main living areas. Therefore the diversity of responses reflects individual household decisions in relation to position as well as internal architecture. Many older high set houses are built of flimsier materials on the main floor while subsequent closing in of the area under the house is frequently done with blocks. In such cases the under house room may be the strongest room in the dwelling. Table 22. Place of Shelter Within House and Choice of Evacuation Shelter Shelter Location Count Col % Moved around inside 27 20.6%Central area 35 26.7%Bathroom/laundry 20 15.3%Used mattresses 3 2.3%lounge 13 9.9%bedroom 9 6.9%kitchen 3 2.3%under house room 12 9.2%hallway 5 3.8%in car/garage 3 2.3%shelter at work place 1 .8%Total 131 100.0%Sheltered elsewhere/Evacuated Relative or friend 19 73.1%other property 2 7.7%at workplace 2 7.7%shelter/church 1 3.8%ignored evacuation order 1 3.8%Cairns 1 3.8%Total 26 100.0% Table 22 also shows where those households that evacuated chose to relocate. The vast majority, 73%, went to relatives or friends.

31
Table 23. Place and Actions in Sheltering During Cyclone Larry’s Passage Actions to shelter Count Col % evacuate 17 11.6% shelter in central room 31 21.2% mattresses 13 8.9% under table 2 1.4% shelter in bathroom/laundry 16 11.0% lounge 14 9.6% shelter in bedroom 8 5.5% kitchen 2 1.4% under house room 12 8.2% anywhere/moved about 28 19.2% in car/garage 3 2.1% Total 146 100.0% Comments 2, 51, f58, 2. In concrete bunker under house. 2, 53, m39, 3. In our underground garage. 1, 32, m 30, 4. Friends flat – in the stair well, then in the downstairs ‘bunker’, but the roller door blew in. 1, 33, f56, 6. Went to units. 2, 52, m31, 4. (inc 3 week old baby). Police Station. 1, 10. f65,1. Put quilts on windows in bedroom. 5, 110, m 75, 2. The rattles and tree crashes caused us to come out and look. 5, 113, m 78, 2. Went across road and a palm tree smashed the house next door. Went home. Table 24. Number of Households with Pets and Shelter of Pets During Cyclone Type of Pets Count Col % Dog or dogs 33 39.8% Cat or cats 18 21.7% caged bird or birds 8 9.6% poultry 1 1.2% cats & dogs 13 15.7% Menagerie – many pets 6 7.2% bird & dog 1 1.2% dog & poultry 2 2.4% cat & bird 1 1.2% Total 83 100.0% Shelter of Pets in house 58 65.9% locked in shed or pen 8 9.1% under house 12 13.6% evacuated with them 6 6.8% out during cyclone 4 4.5% Total 88 100.0%

32
Pets are a significant issue, especially when people are confronted with the need to evacuate. Almost all pet owners are not willing to abandon these household members so that it is not surprising that 66% of all pets spent the cyclone with their owners. The small number that were "out during the cyclone" mostly escaped and bolted and appear to have survived. Those that did not spend the time in the same room as their owners were generally secured in an outside shed or the room under the house. Table 25. People with Special Needs Special needs Count Col % Medical 12 36.4%Elderly/Frail 8 24.2%Disabled 8 24.2%young kids 4 12.1%kids special diet 1 3.0%Total 33 100.0%Special needs met Yes 26 78.8%No 7 21.2%Total 33 100.0% People with special needs is a self reported category, which means that in some senses this reflects the perception of the respondent. The 33 households represent 22% of the survey population, but only seven of them experienced problems as a consequence of the cyclone and felt that the special needs of their family members had not been met. Table 26. Previous Experience of a Cyclone By Location Previously experienced a cyclone Total Location Winifred Other
Cyclone No previous experience
Innisfail Estate 18 6 6 30 East Innisfail 18 6 9 33 Flying Fish Point 2 2 4 Coconuts 7 2 2 11 Kurrimine 1 1 Mourilyan 19 2 2 23 South Johnstone 13 2 2 17 Babinda 20 3 5 28 Total 97 22 28 147 New housing areas in Innisfail and rented housing seemed to contain more newcomers who had not previously been through a cyclone, although we did not specifically elicit that information. However there is no concentration of less cyclone experienced people. The population is quite stable with people having lived in the area for a long time, even if not necessarily in the same house or community.
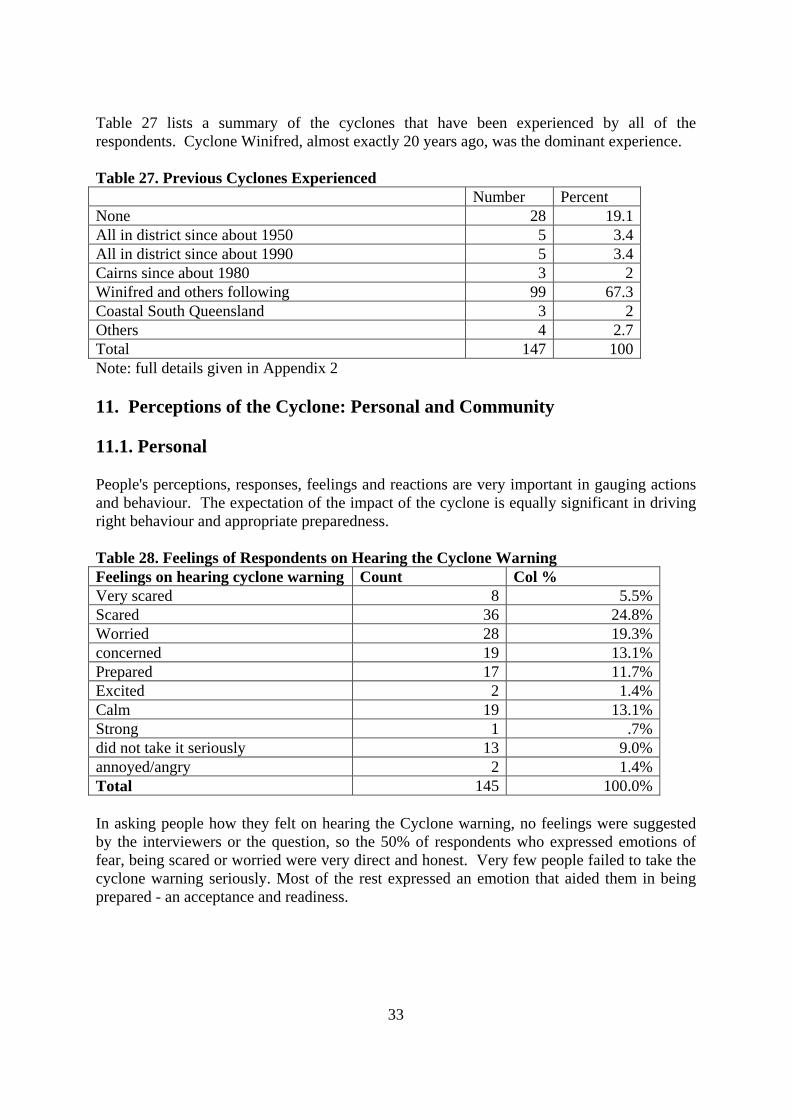
33
Table 27 lists a summary of the cyclones that have been experienced by all of the respondents. Cyclone Winifred, almost exactly 20 years ago, was the dominant experience. Table 27. Previous Cyclones Experienced Number Percent None 28 19.1 All in district since about 1950 5 3.4 All in district since about 1990 5 3.4 Cairns since about 1980 3 2 Winifred and others following 99 67.3 Coastal South Queensland 3 2 Others 4 2.7 Total 147 100 Note: full details given in Appendix 2 11. Perceptions of the Cyclone: Personal and Community 11.1. Personal People's perceptions, responses, feelings and reactions are very important in gauging actions and behaviour. The expectation of the impact of the cyclone is equally significant in driving right behaviour and appropriate preparedness. Table 28. Feelings of Respondents on Hearing the Cyclone Warning Feelings on hearing cyclone warning Count Col % Very scared 8 5.5% Scared 36 24.8% Worried 28 19.3% concerned 19 13.1% Prepared 17 11.7% Excited 2 1.4% Calm 19 13.1% Strong 1 .7% did not take it seriously 13 9.0% annoyed/angry 2 1.4% Total 145 100.0% In asking people how they felt on hearing the Cyclone warning, no feelings were suggested by the interviewers or the question, so the 50% of respondents who expressed emotions of fear, being scared or worried were very direct and honest. Very few people failed to take the cyclone warning seriously. Most of the rest expressed an emotion that aided them in being prepared - an acceptance and readiness.

34
Figure 6. Feelings of Respondents on Hearing Cyclone Warning Comments 1, 7, f61, 3. Strong – mother needed to care for others. 1, 10. f65, 1. Thought they were joking. 1, 20, m37, 6. Wasn’t really believing 1, 33, f56, 6. Stopped functioning – petrified. 2, 37, m50, 4. Need for urgent response. 4, 97, m60, 4. Deciding where to go. Scared and apprehensive. While the small number of single parents with young children were more strongly in the scared category, the elderly and special needs households are not significantly different from the rest of the population. This is obviously a simplification of what for many people was probably a complex of emotions. However, one week after the event these are obviously the feelings that people remembered most strongly. A particularly vivid response to this question came from an eighty year old lady in Babinda whose response was to go off and play bowls -- "can't stop living" and her action on hearing the warning, after clearing up missiles in her backyard, was to go and enjoy herself "can only prepare so much".
35
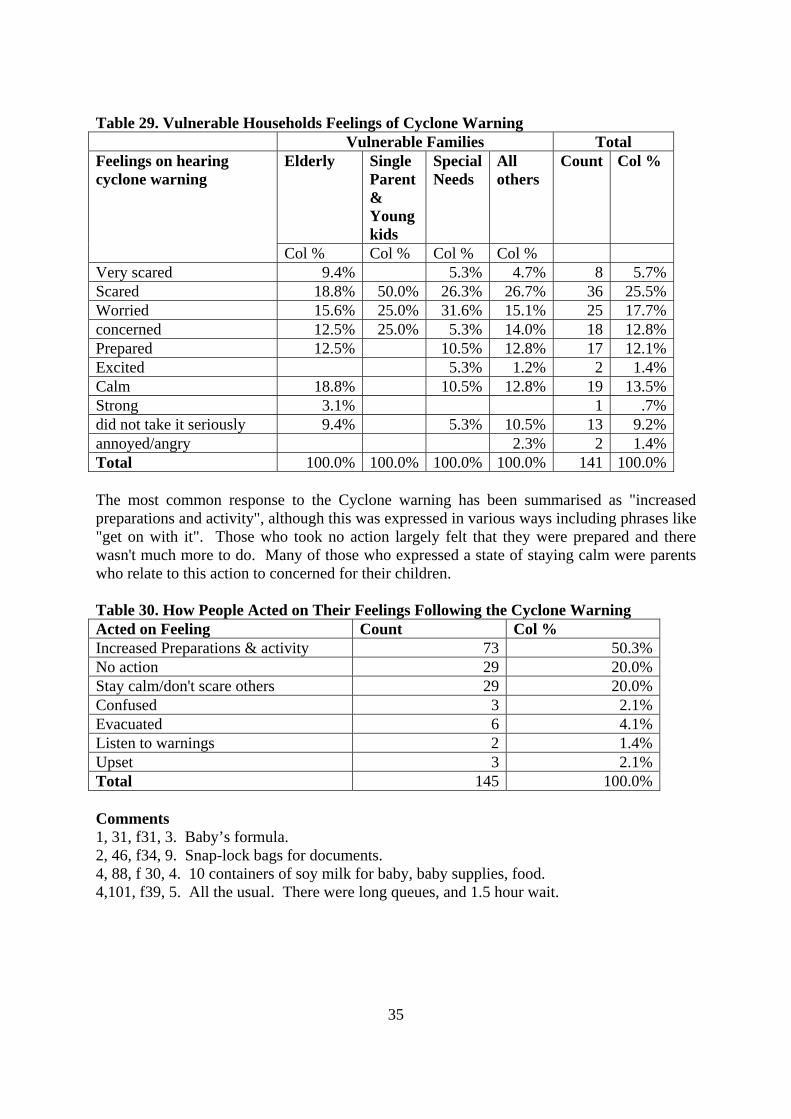
Table 29. Vulnerable Households Feelings of Cyclone Warning Vulnerable Families Total
Elderly Single Parent & Young kids
Special Needs
All others
Count Col % Feelings on hearing cyclone warning
Col % Col % Col % Col % Very scared 9.4% 5.3% 4.7% 8 5.7%Scared 18.8% 50.0% 26.3% 26.7% 36 25.5%Worried 15.6% 25.0% 31.6% 15.1% 25 17.7%concerned 12.5% 25.0% 5.3% 14.0% 18 12.8%Prepared 12.5% 10.5% 12.8% 17 12.1%Excited 5.3% 1.2% 2 1.4%Calm 18.8% 10.5% 12.8% 19 13.5%Strong 3.1% 1 .7%did not take it seriously 9.4% 5.3% 10.5% 13 9.2%annoyed/angry 2.3% 2 1.4%Total 100.0% 100.0% 100.0% 100.0% 141 100.0% The most common response to the Cyclone warning has been summarised as "increased preparations and activity", although this was expressed in various ways including phrases like "get on with it". Those who took no action largely felt that they were prepared and there wasn't much more to do. Many of those who expressed a state of staying calm were parents who relate to this action to concerned for their children. Table 30. How People Acted on Their Feelings Following the Cyclone Warning Acted on Feeling Count Col % Increased Preparations & activity 73 50.3% No action 29 20.0% Stay calm/don't scare others 29 20.0% Confused 3 2.1% Evacuated 6 4.1% Listen to warnings 2 1.4% Upset 3 2.1% Total 145 100.0% Comments 1, 31, f31, 3. Baby’s formula. 2, 46, f34, 9. Snap-lock bags for documents. 4, 88, f 30, 4. 10 containers of soy milk for baby, baby supplies, food. 4,101, f39, 5. All the usual. There were long queues, and 1.5 hour wait.

36
Figure 7. Expectations of Impact of Cyclone Larry Table 31. Expectations of the Impact of Cyclone Larry Expectations of Larry Count Col % Roof go 6 4.3% Exactly as happened 6 4.3% Devastation 44 31.2% Lose power & water 3 2.1% Damage & Flooding 23 16.3% Widespread damage 29 20.6% Wind & rain 10 7.1% No clear expectation 14 9.9% Expected it to go elsewhere 6 4.3% Total 141 100.0% During both Saturday and Sunday it was clear to me (D.King) that a very destructive cyclone was heading our way. Only by late afternoon on the Sunday did it seem inevitable that Innisfail was the most likely target and that there was unlikely to be any damaging impact on Townsville, although by then the weather had already turned wet and very windy. Consequently even as far south as Townsville people were making Cyclone preparations and

37
the Mayor had issued preparation advice on Sunday. Throughout the week the Cyclone did not waver from its status as a severe threat. Consequently my own expectation was of devastation, including loss of life and many injuries. This expectation of devastation was also held by 31% of the respondents to this survey. Other phrases that are recorded in Table 31 are as people gave them, except for three of the categories, which are summaries of descriptive expectations - "damage and flooding", "widespread damage" and "wind and rain". The descriptive and sometimes vague accounts of people's expectations were coded into a rank order where "widespread damage" is a rank order less than devastation, then followed by "damage and flooding" and at the lowest ranking "wind and rain" as the least in terms of expectation. The response "roof may go" may be related to the individual house, but it is also clearly an expectation of severe damage or devastation. In terms of what happened, "widespread damage" or "damage and flooding" turn out to be more accurate than devastation, although the appearance of the communities immediately after the event was one of devastation, as much because of the enormous amount of debris and vegetation damage. However, it remains interesting that people largely did not expect a category five Cyclone to wreak utter devastation. Comments 1, 17, f38, 5. Knew we would be in for it. Serious. 1, 32, m 30, 4. Windows would smash, worried about flying debris and car damage. 1, 32, m 30, 6. Daughter had panic attack, had to comfort. Thought we were all going to die. 2, 38, m57, 4. Extreme damage. More than there was. Expected house to go but it didn’t. 2, 42, f38, 4. Devastation, like Titanic. 2, 46, f34, 9. No idea, not from area. When I knew it was a cat 5, I knew it would be bad. 2, 51, f58, 2. Didn’t know anything about it [***no use of media or input from family, friends or neighbours]. 3, 67, m79, 2. Didn’t expect damage as bad as it was. * I knew there would be no storm surge here [The Coconuts] because the cyclone needed to be more north before we had to worry. 4,101, f39, 5. Thought we would lose house. Stressed out Sunday 7 pm when upgraded to a category 5. 5, 199, m 43, 5. Thought there would be wind, but there was no wind or rain before the cyclone. With the fine weather, we * “Thought they were having a go at us” It was calm until 3 am, then build up to 5 am, when it hit. [they had prepared anyway, a testament to faith in the warning system]. 6, 139, m86, 2. Not much. The weather was so calm, so you hope it will not hit. The ABC radio said that the calm was deceptive.

38
Table 32. Expectation of Storm Surge and Local Impact by Location Expectation of Storm
Surge on Coast Total Expectation of surge
impact at this Location Total
Location Yes No maybe Yes No maybe Innisfail Estate 20 9 1 30 12 17 1 30East Innisfail 26 6 32 8 24 32Flying Fish Point 3 1 4 3 1 4Coconuts 9 2 11 9 2 11Kurrimine 1 1 1 1Mourilyan 14 9 23 4 19 23South Johnstone 9 8 17 1 15 1 17Babinda 13 15 28 1 27 28Total 94 51 1 146 38 106 2 146 The expectation of storm surge concern has been cross tabulated in Table 32 by location. Flying Fish Point, Coconuts and Kurrimine Beach were all in the storm surge zone and everyone living in these locations should have expected local surge, while all respondents should have expected storm surge generally on the coast. This was included in the warnings and was followed up by an evacuation order in beachside suburbs. Some houses in nearly all beachside suburbs were on higher elevations up the hill slope. Some of these households chose to ignore the evacuation order. The storm surge impact on communities was less than might have occurred if tidal conditions had been different. However, that does not change the fact that storm surge occurred extensively along the coast. The responses in Table 32 suggested an inexact understanding of storm surge. While South Johnstone is not a coastal suburb, its proximity to the river meant that the surge was likely to enhance river flooding. Comments 1, 20, m37, 6. Yes. * There were no warnings about surge, even for people who live close to the [tidal] river”. 3, 68, m35, 4. Yes, that is why we evacuated. Question 19. Did you expect to be affected by storm surge and why? 1,4,m78, 4. No. Watched tides. 1, 19, m53, 5. SES at Coconut village warned them. 1, 33, f56, 6. Yes – kids came from Flying Fish Point. 2, 42, f38, 4. This street is prone to it. 3, 73, m75, 2. Sea water went into the garage, and either side of house. 3, 77, m57, 3. Yes. [beachfront] SES and police came to house to tell us to evacuate. 3. 80, m77, 2. No, because of reef. 4,101, f39, 5. River tidal. Floodwaters banked up a metre over downstairs floor.

39
12. Impacts and Lessons
Table 33. Personal Impacts of Cyclone Larry by Previous Experience Previously experienced a cyclone Total Personal effect Winifred Other
CycloneNo previous experience
Count Table %
Count Count Count additional costs 1 1 1 3 2.1%shaken 18 7 8 33 22.9%disoriented 6 1 1 8 5.6%lucky/ good community spirit 8 1 1 10 6.9%distressed or stressed 18 4 5 27 18.8%frustrated 1 1 2 1.4%loss of business/work 11 3 2 16 11.1%inconvenienced 8 2 3 13 9.0%no effect 7 1 2 10 6.9%worried 9 4 13 9.0%loss of belongings 6 1 1 8 5.6%guilty 1 1 .7%Total % 65.3% 15.3% 19.4% 144 100.0%Lessons learned Be prepared 77 10 20 107 75.9%Take it seriously 12 4 4 20 14.2%keep up morale 2 1 1 4 2.8%stay in contact with family neighbours
1 1 .7%
unpredictability of impact 1 1 .7%evacuate 3 4 7 5.0%keep out sightseers 1 1 .7%Total % 67.4% 14.9% 17.7% 141 100.0% Table 33 records personal impacts and lessons learned from this Cyclone. Responses have been broken down by previous Cyclone experience. Having gone through an earlier Cyclone was the reality for 81% of the population. Those who had not experienced a cyclone before do not show significantly different responses from those who had been through such storms before. The main responses of "shaken" or "distressed/stressed" was stated by 42% of respondents. The random nature of impact and of households’ personal situation meant that primary impacts varied considerably. However when questioned about lessons learned there was a 90% response of be prepared, be ready etc and take it seriously, which implied a similar preparatory attitude. Comments 1, 17, f38, 5. Cost in all areas – work wise – life on hold for two years. The two biggest impacts – spending too much money on petrol for generators (estimated $400 per week for 3 weeks [??!], and mobile phones too expensive for communication – should have coupons for fuel and phones.

40
1, 31, f31, 3. *Fear of Wati, lots of mosquitos, fear of dengue. Was in shock. Feel empty, but got through. 2, 41, f30, 5. Terrified, but thankful. 2, 46, f34, 9. Trauma is after. We were fearful of Wati. We needed flood info for possible escape. We rely a lot on the internet, but then no power . 2, 47, m61, 2. A bit stunned. A bit slow to react. A bit shocked. Fortunate. 2, 48, m40, 5. Gave me a chance to do good service to the community. 2, 52, m31, 4. (inc 3 week old baby). Buy a generator, extra costs and costs of fuel supply.. We were very frightened, so moved to the police station (a worker there). The home was basically undamaged, but we were grateful to have somewhere strong to go to, and are more philosophical about our fear now. 2, 58, m43, 6. Lost everything. Financial trauma. Kids are quiet. 2, 60, m 50, 4. *Job uncertainty, no security, homeless. 3, 65, m38, 5. Children are disrupted. The young ones still upset. When they heard that Innisfail was being demolished, they cried for 2 hours. 3, 68, m35, 4. Effects on the environment. Closeness of community. 3, 70, m40, 6. Grandmother (90) worsened, and we had to put her in a home. 3. 72, x, x. Stress. Kids traumatised – they sleep lightly, and wake up at the smallest noises. There is extra stuff to deal with – very disruptive. 3, 74, m30, 2. Loss of income and closer to neighbours. 4, 89, f69, 2. Stressed out and scared. The second lot of wind stronger. 4, 94, m68, 2. The clean-up afterward affected me. 5, 118, M 33, 6. Makes us think about leaving Mourilyan [meat works closed is part of this]. 5, 119, f 41, 5. Shocked. Feel sad at loss of others. – houses, bananas, farms. Daughter is scared, son is happy. [There were a few reports of children who remained ‘disturbed’ a few days after impact.] 4, 87, m 49, 5. Car not insured and written off. 1, 19, m53, 5. Sugar cane crop – lost 50%; loss on harvesting. 1, 30, m33, 4. Whirly bird wrecked. 2, 46, f34, 9. Casement windows kept opening. 2, 60, m 50, 4. Everything lost – in the rain for 4 days. 4,101, f39, 5. Lost tools. One full panel of louvres blew out, and 4 other louvres shook to bits. There are some cracks in the roof joists. 6, 141, f75, 1. manhole cover lifted off, toilet seat was flung up so hard it broke

41
12.1. Impact perceptions: Community Both tables 34 and 35 record perceptions of the cyclones impact on community facilities. In Table 34 the impact is cross tabulated by location in order to ascertain issues or impacts that may have been more location specific. The perception of devastation seems to be higher in Innisfail and loss of power and water, although universal in the impact area, is a particular issue in the smaller communities. These smaller communities also experienced a much more direct impact on agriculture as many more respondents were employed directly as agricultural workers or as farmers. This effect on workplace is summarised in table 35, showing that 13% of the respondents had been laid off. Table 34. Impact of Cyclone Larry on Community Facilities by Location Location Effect on community facilities
Innisfail Estate
East Innisfail
Flying Fish Point
Coconuts Kurri-mine
Mourilyan South Johnstone
Babinda
Power loss 5 1 3 10 Water loss 1 1 1 Phone loss 1 Problem of power dependancy ie No ATM
1 2 1
Devastation 10 7 1 2 1 3 2 1 Loss of Farms/ agriculture
2 2 1
loss of homes & public buildings
1 1 4 3
Isolation 1 1 1 positive/good response
2 2 2
price increases 1 No power or water
7 9 2 2 4 8 7
No power & phone
4 1
loss of power & homes
3 1
No power, water & ATM
1 1 1
Total 27 32 4 7 1 18 14 26 There were comments from a number of households that one person was now out of work as a result of the cyclone while the other was still receiving salary or in some cases had experienced an increased workload. The responses in table 35 are those of the principal respondents who were interviewed. Where workplaces were destroyed or badly damaged the impact on employees varied considerably depending upon whether or not the workplace was

42
a small private enterprise or a public organisation. Smaller enterprises were more likely to be out of business and unable to pay employees. Table 35. Impact of Cyclone Larry on Workplace and Community Effect on workplace Count Col % No power 3 2.1% Destroyed/badly damaged 20 13.7% Laid off 19 13.0% Water damage 8 5.5% Retired/not employed 54 37.0% Structural & Stock damage 2 1.4% Mobile/self employed 2 1.4% No effect 24 16.4% Damage/loss to farm 3 2.1% Increased workload 8 5.5% Reduced workload 3 2.1% Total 146 100.0% Effect on community facilities Power loss 19 14.7% Water loss 3 2.3% Phone loss 1 .8% Problem of power dependency ie no ATM 4 3.1% Devastation 27 20.9% Loss of Farms/agriculture 5 3.9% Loss of homes & public buildings 9 7.0% Isolation 3 2.3% positive/good response 6 4.7% Price increases 1 .8% No power or water 39 30.2% No power & phone 5 3.9% Loss of power & homes 4 3.1% No power, water & ATM 3 2.3% Total 129 100.0% Comments 1, 15, m53, 2. All stress and heartache. High school is gone. 1, 19, m53, 5. Water out for 2 days. No sewage problem. 1, 20, m37, 6. Couldn’t access anything including bank for money. 1, 30, m33, 4. Having no water is the hardest. 1, 31, f31, 3. No ATMs, no bank, no money for baby’s formula. Chemist would give no credit. This was most distressing. Very difficult with young kids. Eventually got some from SES evacuation centre – queued for hours. 1, 31, f31, 3. No power, water, toilet, money. 2, 41, f30, 5. Nothing is really working, except water. 2, 42, f38, 4. Water still polluted, no electricity (2 more weeks). 2, 46, f34, 9. ATM and EFPOS down. Still had some water from gravity feed. 2, 48, m40, 5. Pretty pleased with the way resources were used. It was a marvellous job, the

43
authorities seemed prepared. 4, 88, f 30, 4. No electricity is driving us crazy – no TV, no fridge. 4, 90, m63, 1. The telephone exchange ran out of battery back-up, so failed [One report was that people had been stealing generator back-up power from the Telstra system] 4,100, m51, 5. Went to work, helped clean up. Bundaberg sugar in South Johnstone had bins derailed and trees over lines. Wife in banana industry – no job. 6, 131, m 35, 4. Pool closed for a week, no active theatre, no school. 2, 39, m58, 2. Roof gone, no computers. We have done some work. 2, 46, f34, 9. Youth shelter blew away. 2, 48, m40, 5. Work out of region. Employer has given me time off. 3, 74, m30, 2. We are real estate agents so we cannot sell property, so now no income. 3, 76, m47, 8. Roof missing off own business, along with structural damage. Business did not have business interruption loss insurance. 4, 87, m 49, 5. To be demolished but still employed and receiving wages.

44
13. Structures and Damage The survey was not primarily a damage survey. The recording of property damage was done as a check against preparation activities. Table 36. Vulnerable Families and Age of House Vulnerable Families Total Age of House Elderly Single Parent &
Young kids Special Needs
All others
Less than 10 years 1 1 2 410 -19 years 1 1 2 5 920-29 years 8 5 14 2730-49 years 11 1 4 21 3750-100 years 11 2 8 44 65Total 32 4 20 86 142
Figure 8. Ages of Houses Impacted by Cyclone Larry Most houses are fairly old with a mean of 46 years. Cyclone resistant building codes came in during the mid-1970s so that those dwellings that are less than 30 years old are more likely to

45
have greater Cyclone resistance in their structures. The elderly are mostly in older houses but they are not significantly different from the rest of the community. Table 37. Dwelling Damage Categories by Age of House Age of House in Years Total
Under10 years
10-19 20-29 30-49 50-100 Property damage
Count Count Count Count Count
Count Col %
Minor 3 14 16 26 59 40.7%Some damage 1 3 6 11 22 43 29.7%Minor to windows 2 2 5 9 6.2%Roof damage from trees 1 2 1 3 7 4.8%Damage to walls 1 1 4 6 4.1%Vegetation destroyed 2 1 2 5 3.4%House shaking 1 1 .7%Damage to other properties/farm
1 1 .7%
Roof loss 1 5 5 11 7.6%No Damage 1 1 1 3 2.1%Total 4 9 27 38 67 145 100.0% From Table 37 it may be observed the roof loss occurred almost entirely to houses over 30 years old, as is also the case with wall damage. It was estimated by the interview team that approximately 1 in 20 or 5% of houses had been severely damaged or destroyed. Most of these places were consequently unoccupied, with their former residents not being interviewed in the survey. There is thus a small distortion in the selection of households, that selected out those places that were the most severely damaged. However, as the data shows, 11 houses that had lost their roofs were occupied and their occupants interviewed at the time of the survey.

46
Figure 8. Classification of Dwelling and Property Damage Table 38. Dwelling Insurance by Age of House Property insurance Total
House only
Contents only
House & contents
None Age of House
Count Count Count Count
Count Table %
Less than 10 years 4 4 2.8%10 -19 years 7 2 9 6.3%20-29 years 1 2 18 4 25 17.6%30-49 years 2 4 22 9 37 26.1%50-100 years 3 6 47 11 67 47.2%Total % 4.2% 8.5% 69.0% 18.3% 142 100.0% Table 38 attempted across tabulation with property insurance, but it doesn't really demonstrate a pattern as it has been shown in earlier tables that the elderly residents were fairly consistently insured and that many of them lived in older houses.

47
Table 39. Amount of Rainwater that Entered Dwelling and Type of Damage Amount of rain that
entered Total
1-10 litres
>10 litres
Loss of roof
Rain Damage
Count Count Count
Count Col %
Carpet 6 25 31 50.8% Furniture 1 4 2 7 11.5% Ceiling 1 1 1.6% Soaked everything 1 11 7 19 31.1% Floor damage 1 2 3 4.9% Total 9 42 10 61 100.0% Table 39 indicates that 41% of respondents experienced rainwater coming inside the house, primarily through windows and under doors, as well as through damaged areas such as punctured walls, broken windows and in extreme cases loss of roof. Half of all damage was the carpets as a consequence of water over the floor, but where damage was more extreme a very wide range of household electrical goods, furniture and fittings were soaked and damaged. Table 40. Depth of Water Over Floor of Dwelling Number
of Dwellings
Minimum
Maximum Mean Std. Deviation
Depth of water over floor: mms
31 5 1000 94.74 185.954
Table 41. Damage observed Damage – near all properties had some minor damage. Almost all had major vegetation damage
Frequency Percent (of 147)
None 5 3.4 Vegetation damage and minor 36 24.4 Damage to guttering and other minor 12 8.1 Basically fully uninhabitable 12 8.1 Roof 16 10.8 Loss or damage to some walls 10 6.8 Water damage 11 7.4 Windows 17 11.6 Doors 7 4.7 Loss or major damage to shed or garage 12 8.1 Awning damage 34 23.1 Fence damage 13 8.8 185 125.3 % > 100 because some properties sustained multiple damage Note: full details given as Appendix 3.

48
The interviewers visually observed damage to buildings and property. These are summarised in Table 41 and recorded as a complete list in appendix 3. In the comments that follow there are clearly many instances of faulty practices, misconceptions and myths. These need to be identified and countered in preparation education and advice. Comments 3, 71, m60, 2. ridge cap lost, about 200 litres in. No floor coverings meant not a lot of damage. 5, 110, m 75, 2. The whirly-gig blew off. 5, 113, m 78, 2. Completely flooded inside, ceiling collapsed. 3, 77, m57, 3. Huge amounts through lost roof, all contents lost. Comments: Lessons What did you learn from your experiences that may help others facing a natural disaster threat? 1, 7, f61, 3. Keeping people happy in the house and keeping every-ones’ spirits up. 1, 17, m70, 4 (including 2 evacuees from Flying Fish Point). Be prepared – don’t have tall trees near houses, shrubs only. 1, 18, f64, 1. Stay calm, listen to radio, don’t go out in the eye [she had]. 1, 19, m53, 5. Shop in advance. 1, 20, m37, 6. Keep windows open a little bit. Store lots of water, batteries and gas. Pop out the manhole to help adjust pressure. 1, 28, f46, 5. long term preparedness, maintenance. Don’t be complacent. 1, 31, f31, 3. Get ice straight away, or an ice-making machine into the district. 1, 33, f56, 6. Stress to everyone that the wind can come from ANY direction. 2, 42, f38, 4. Use the kids’ bike helmets. Keep shoes and socks on. Each person have a torch, and have a rope to tie the family together. 2, 46, f34, 9. Be prepared. Do everything. “Forget the boy who cried wolf”. Buy ice, generator and chain saw. 2, 48, m40, 5. Beware gusts. 2, 47, m61, 2. Make some preparation. Ramp up preparations. 2, 49, f40, 3. Listen to other people and their experience. Be prepared. Don’t be complacent, consider the size. 2, 53, m39, 3. Be prepared, and get messages after the cyclone. 2, 54, m47, 6. The warnings are as good as you can hope for, but some people just cannot be helped – they are too complacent. 2, 60, m 50, 4. Run away – do what you can to prepare, then leave. 3, 65, m38, 5. Evacuate is preferable. Don’t want to go though it again. The Council was good. 3, 66, x, x. *Never take food, water and shelter for granted ever again. 3, 68, m35, 4. Didn’t get petrol. Need petrol, generators and chain saw. 3, 69, x, x. No big trees, or cut them back to gutter height. 3, 73, m75, 2. Elderly people need to take extra care that they do not do too much. There are many kind people. 3, 74, m30, 2. *Keep insurance up to date. 4, 84, m 36, 2. Evacuate before it gets here. 4, 88, f 30, 4. Buy a bbq and generator. 4, 91, f26, 3. Prepare house, be in a safe place, check everything on the check list. Never go

49
outside during the cyclone. 4, 93, m71, 2. Pull down old sheds. 4, 99, m40,2. Don’t encourage candles [danger?/blow out?. Stop sightseers. 4,100, m51, 5. Follow advice, get ready, clean up, get prepared. Make sure all doors are properly secured (strong). Consider storm shutters. 5, 116, m48, 4. *Need more wind speed monitoring equipment [to allay peoples' uncertainties during impact, so what they are experiencing is properly reflected in the media information, there may be some merit in this – the logistics of getting such equipment in the right places, secured and sending data ahead of landfall make it very unlikely]. Further comments Tourists 2, 56, m47, 4. We are really angry with the local politicians and how they responded. We are also angry that backpackers have not been moved out and are still taking supplies and handouts. We are annoyed that information about warnings stopped being communicated because authorities were frightened about driving away tourists. The SES is focusing on helping tourist businesses rather than local residents. 6, 121 M75, 2 – Angry that tourists are calling in for free lunches. Concerned that tourists are getting help – what about the locals. 6, 125, m59, 4. Fed up with emphasis on tourists and backpackers. General 1, 1, f40, 6. Woman making extra money from small household farm. Farm buildings, vegies and bananas all totally destroyed. The farm was much more damaged than the home (farm 6 km inland). This reinforces the clear observation that the impacts, and thus wind speeds, were very patchy. 1, 15, m53, 2. Army here in 24 hours. 1, 19, m53, 5. *Lawn lockers [small garden sheds] should be banned – they are missiles. 1, 19, m53, 5. Trees should be no higher than gutter height. 2, 40, m45, 4. Generator petrol cost $50. 2, 44, n, 6. Supportive community. Centre link gave $1000 per person [!!??]. 2, 45, f62, 6. Electrician had to check everything before they are allowed to use electricity – at own cost. Neighbours were unfriendly. We have lived in this neighbourhood for 30 years. 3, 69, x, x. Good community spirit. 4, 89, f69, 2. People are blasé about it, because we get too many warnings at the beginning. Also, ** the radio and BoM web information did not match. 4,100, m51, 5. Mangos did not bear, so knew it would probably be a big wet. Because it passed so fast, it did not do so much damage. Need tin washers under screws in roofs. Without, screws tear through. 4,100, m51, 5. Some people are complacent – sons thought I was over-reacting. They were glad. We are getting a lot of good help from the Army. Fire and rescue helped. There is a need to encourage self-help. The cyclone has gone now – get on with it. Question planting Alexandria palms and other unsuitable trees, especially if they can fall on power lines or roofs. Many people reported going outside in the eye.

50
General comments for consideration by relevant agencies Language barriers and the more vulnerable There were about 1 in 20 older respondents from an Italian background, who, along with some others, found that the information from TV and radio was often delivered too rapidly. There were about the same number of Indigenous people interviewed, who seemed to have no special ‘weather reading skills’ to herald Larry’s approach (it would be useful to follow this up more broadly). There were a number of Philipinos, but with no great language barriers. There were some older males on their own, without much family or community interaction. Unnoticed harm to this last group may need to form a focus for initial recovery assurances that older, more isolated single men got though such an impact unharmed. Older single (widowed) women seemed to have much better networking with local family and neighbours. 6, 136, m 55, 2. There is a devaluing of all you hold valuable – environment and property. 6, 143, f57, 2 wildlife, especially birds, now all turned into ground-feeders. Recommendations Prior 1, 4, m78, 4. This householder was sure any storm surge would not effect them: ‘We watched the tides’. For people who may be in a potential surge zone (lower that 7m AHD), tide watching is a good recommendation – assuming the cyclone comes in where and when predicted. Make sure you have a phone that does not need to be plugged into a mains answering machine to work * 5, 119, f 41, 5. Need to encourage people to get cashed-up before impact because: no power = no auto tellers = no $ = trouble Make sure you have cash – ATMs and EFPOS probably will not work afterward. 4, 88, f 30, 4. and others – Stock up on baby formula 4, 99, m40, 2. Screwed windows shut. There were many who reported windows or entry doors blowing in because of poor latches. Part of the preparation ‘checklist’ should be to check and strengthen door and window fastenings. 6, 125, m59, 4. Best thing would be to have a dedicated emergency band on radio to do continuous broadcasting. At the commercial level Keep in supplies of generators, and gas bbqs, perhaps promote sales early in cyclone season. This also applies for all the standard items – water containers, battery (or wind-up) radios, torches 6, 140, m69, 1. Every house should have a bunker. *6, 143, f57, 2. Councils to check all buildings and permits for defective buildings before cyclone season. A lot of the debris in Babinda was from defective sheds and unsafe buildings. 5, 110, m75, 2 Share the idea that a mattress pushed against inside of roller-door by car or 4x4 may help stop the roller-door from blowing in.

51
5, 115, m37, 1. Need to deliver generators. Extra ‘checklist’ items to add to cyclone preparation advice material across coastal northern Australia: Have sufficient cash to buy necessities after impact. Banks and other sources may be closed from power loss. Freeze lots of water (in plastic milk bottles or the like) to keep refrigerated food for days after power loss. Make sure you have a landline phone which does not need mains power to operate (phones with an answering machine need power). Let isolated neighbours know of the warnings. Make extra efforts to tie down small, light sheds (lawn lockers). If caring for a baby, make sure you have plenty of formula. 1, 17, m70, 4 (including 2 evacuees from Flying Fish Point). Be prepared – don’t have tall trees near houses, shrubs only. Research and collate existing information on the role of vegetation in extreme winds in the built environment (such as post-Tracy), then work to have findings taken up and promoted by government and residents in wind-hazard areas. 2, 41, f30, 5. There is a lack of coordination to oversee relief funds [at Sunday, March 26]. Poorly coordinated works in council. No organisation; own agenda. 4, 84, m36, 2. No one came out to South Johnstone after the impact, until the army drove around on Tuesday night. 4. 85, m40, 2. Aid given to overseas by government, but where is the money here? Grants not loans!! 4, 86, m70, 1. Grateful for assistance received so far, although not seriously affected by cyclone. 4, 88, f30, 4. Suspected malaria in the area. 4, 88, f30, 4. Even though we cannot live in our damaged house, we are being told we still have to pay rent. 4, 93, m71, 2. Pull down old sheds. 4,100, m51, 5. All kit sheds blew away. Make sure all buildings have plenty of bracing. New sliding windows let water in. [this was common and the disruptive damage is disproportionate to this seemingly poor design feature. Sliding window weatherproofing standards need review and likely upgrade.] Water came in through air conditioning units. The media 3, 69, x, x. Sick of the media, invading privacy, rude attitude, intrusive, not sensitive. * 4, 89, f 69, 2. Clear feedback to radio commentators – speak more slowly. Impact times and confusion 1, 19, m53, 5. In the middle of the eye [in Innisfail Estate], the radio [ABC] said the eye will be crossing in an hour. 1, 20, m37, 6. * Please give flood warnings – very worried. 2, 60, m 50, 4. A truck driver was coming home to Innisfail, but couldn’t get through. The first he knew that his house was destroyed was when he saw it in the Townsville Bulletin.

52
4, 97, m60, 4. Sitting in the middle of the cyclone, a message came out on the radio that another cyclone was approaching. Not good for us. 4,100, m51, 5. For South Johnstone, there was a stuff up on the time. The big winds started at 5.30. A lull at about 8.30, then the second lot about 9am. 4,101, f39, 5. For Sunday TV: use less crawlers, more siren and detail. We need a longer siren time. TV not interrupting movies. At 5 am we were getting destructive winds in South Johnstone, but at 6 am the ABC radio was saying the cyclone [eye?] was still 30 Km off the coast. At the same time, the ABC was conducting live interviews with people in the cyclone, such as with a husband and father-in-law who were holding the bathroom door shut while the wife was being interviewed. This was very confusing when we expected our roof to come off at any moment. We thought: ‘if this is before landfall, what will it be like when the full force hits us’. 5, 107, f 50, 2. Most assistance/response centred on Innisfail, but there are outlying smaller settlements. ‘What about us?’ Preparedness/knowledge 1, 13, m69, 8. Froze water, brought generator. 1, 20, m37, 6. Keep windows open a little bit. Store lots of water, batteries and gas. Pop out the manhole to help adjust pressure. 1, 23, f52, 1. Documents and valuables in plastic bags. 5, 103, m 77 2. Held back door closed [There were so many people who reported putting towels under windows, of moving around from room to room looking through windows. With stronger winds, there would have been more injured people]. 6, 121 M75, 2 – Lady of the house was playing bowls on Sunday arvo. All the ladies talked about the cyclone. 6,124, m 65, 2. M had a lot of knowledge about cyclones explaining why he was basically complacent, but his knowledge base was wrong. [ongoing public education a necessity]. 6, 128, f 35, 4. Liked people ringing in on the radio [during impact] Observations 6, 125, m59, 4. Mentioned birds flew away on the Sunday morning, even though there were no winds. 6, 126, f 51, 6. Said all the birds were gone. 6, 127, f 60, 3. Said some locals are complacent about risk, and that the community is amazing, although new community members from south were not listening/preparing and then were the first to complain. 6,129, m55, 2. Did not expect the ferocity. 6, 132, f 50, 3. Great community spirit. 6, 136, m 55, 2. As a weather buff, has observed that about 80% of cyclones in last 15 years have struck on weekends. *See Larry as an opportunity for Fed Govt to take a lead role in adapting to climate change. 6,137, m 86, 2. Community spirit good, close knit community, a lot of new comers. Many reports of supportive community. Afterwards 4, 87, m 49, 5. Boss is being good – all staff being paid and even getting generators and fuel. * Happy with the government response – the army came by on Tues [21 March] with rations.

53
**4, 89, f 69,2. ‘Why no information on Wati?’ - reflecting what was said by many – there was a concern about Wati following, and a feeling * ‘the authorities’ were keeping people, particularly in the Innisfail area, under-informed so as to avoid further alarm. This concern came after the life-threatening and often fully disruptive vulnerability caused by Larry, and is easy to understand. Future cyclone warnings will need to spell out the likely course in a way that makes the already-impacted comfortable that they are getting the complete picture. Goudie heard the Wati forecasts and was satisfied it was slow moving and likely to head south; and believed those messages. People in the Larry impact zone heard the same messages and felt they were in for it again, and that they were not being told. This is at the core of risk communication – the message sender (s) and the message receivers. Special sensitivities need to be considered at the local level. 4, 92, m 27, 5. Concern over leptospirosis. 6,122, f 81 , 1 – neighbours helped out – brought bread and extra supplies. Felt isolated from authorities because English is a problem. 6, 125, m59, 4. Going to get a satellite mobile phone. 6,129, m55, 2. Trauma at school. In Babinda, the water stayed on, as did the phone until Tuesday. 6, 130, m 65, 1. Felt disappointed relief effort went to Innisfail, and that Babinda seemed to be by-passed because it is in the Cairns area.

54
APPENDICES Appendix 1 Notes on questions, answers and coding of responses Number: each household was allocated a number from 1 to 147, in which the database entry corresponds to the additional notes. The survey instrument is Appendix 4. 1. Where did you get information from on how to prepare for this cyclone season? This somewhat tactless question prompted many people to respond that they'd lived here a long time, been through many cyclones and all of this has been classed as personal knowledge. 2. At the beginning of this cyclone season did members of this household discuss the possibility of a cyclone affecting you this year? If yes, what sort of household emergency plan did you have for such an event? 3. What did you do to prepare for this cyclone season? Many people’s little responses to questions two and three were no or didn't do anything etc. For single people and even couples this is a rational response, but many people indicated that they maintain a level of preparedness without necessarily having a formal plan or taking specific action. 4. At what time (and day) did you first become aware cyclone Larry was heading your way? While Sunday was the warning period the development of the low was watched much earlier in the week. There was plenty of time on Sunday from people to prepare for the cyclone and as it was a glorious sunny day many respondents indicated that they participated in other activities. 5. As Cyclone Larry approached on Sunday March 19th, where did you mainly get information about the cyclone? In this as in other answers, some people referred to the BoM web site and others to the Internet. Coding has grouped both answers as the BoM web site. Many people listed more than two sources of information, so this has been coded as multiple sources. 6. What further preparations did the warnings prompt you to carry out? This question sought information of the actual actions of people. Some gave a single action, when others indicated a number of activities. Coding has attempted to summarise knees into groups of separate actions. 7. Can you remember how you felt when you heard the cyclone advice messages for cyclone Larry? Frightened has been coded under scared. A few people said they prayed (these responses appeared genuine) and these have been coded along with feeling calm, although the intent may have been more oriented to action rather than to personal self-control.

55
8. Can you recall how you acted on this feeling? A dominant response was that people got on with preparations with a sense of increased urgency and importance. This question was looking for the type of response rather than the specific actions as these have already been recorded in question six. 9. Who was in your household on Sunday March 19th as Cyclone Larry approached the coast (ie were all the family at home? did others come to your household?) (List ages and gender) A number of data columns were generated from this question. The interviewers generally did not record whether others have come to the household but this information is implicit in various other answers. The total number of people and householders recorded, and a list of ages and genders. From this an approximate definition of the family type or group of people present in the house has been attempted and from this information the classification of vulnerability categories may be added. However we did not ask people their relationships to other members of the household, so that the family type variable is indicative only. An additional variable was generated from a combination of age, family type and the special needs question. Households were classified as elderly if the members, or the mean age of a couple, were over 65 years of age. Single parents with children under twelve were selected next, then additional households containing someone with special needs. Some of these had already been classified as elderly, or single parent with young kids in which case the initial classification was left. All other households are thus deemed less vulnerable. 10. Were all the usual members of your household contactable and accounted for on Sunday March 19th? If no, were you able to do anything about this? Please explain. 11. Was this a cause of particular concern to you? These questions attempted to identify additional causes of concern and stress for the household concerned. It has been a risk in other cyclones that family members may have been out, at work, school, visiting etc, but because this one arrived in the middle of Sunday night there was much less likelihood of people being caught out in another place. Thus most respondents did not identify a problem. 12. Were any of your family or relatives (that do not live with you) also in the Cyclone Larry warning area? If yes, did you have contact with them? 13. Did members of your household talk to / visit / stay with, neighbours during the Cyclone Larry warning period on Sunday March 19th? If yes, when or how often? To both questions 12 and 13 people responded with words like lots or often had contact etc. They also indicated contact by mobile and landline telephone. Where the answer was given as lots of contact it may have been by telephone. Some people also indicated the different periods of time when they had contact with relatives or neighbours, and there is a significant number who mentioned visiting neighbours during the passage of the eye of the cyclone (principally in Innisfail, but not communities to the north and south). Therefore this response has been coded even though it is not technically an answer to the question that they were asked.
56
14. Did you track Cyclone Larry using a cyclone tracking map? 15. Where did you get the map from? These were relatively straightforward questions and answers. 16. Was the forecast track map useful? (prompt for reaction to the new style of BoM forecast track map) The cover sheet to the questionnaire form (explaining the purpose of the survey, confidentiality and the voluntary nature of the interview) also contained a printout of the BoM forecast tracking map. This was there as an intentional prompt in order to elicit a response to a map that people may not have been able to identify by name. 17. What did you expect would occur on Sunday night and Monday morning when you heard that Cyclone Larry was likely to impact the Innisfail area within a few hours? Responses were graded in relation to the actual impact, so that when people answered “not as bad as what happened”, “like Winifred” or something similar, this has been interpreted as widespread damage. Responses were also coded in relation to what people would have expected from a warning that the category five cyclone was heading towards their communities. From my own knowledge and experience I expected devastation as did many people within the impact area. As Winifred was not a category five people should have expected worse. The coatings reflect this relativity. 18. Did you expect there to be a storm surge associated with Cyclone Larry crossing the coast at or near Innisfail? The answer to this question should have been a universal yes as it was contained within warnings. It is uncertain whether or not it was the interviewer or the respondent who gave the impression that this referred to the local community in which the interview was taking place. However many people interpreted this question in that way, such that Babinda residents strongly answered in the negative . 19. Did you expect to be affected by storm surge and why? The answer to this question is strongly location specific – Kurrimine Beach, Coconuts and Flying Fish Point all expected a local storm surge and many residents were evacuated . 20. When did you begin to be concerned about cyclone Larry? The category of Monday a.m. was generally stated as between 4.30 and 7.30, presumably when destructive winds were at their strongest. 21. When did you begin to make preparations for Cyclone Larry? This question was repetitive and used the same time categories as other questions, but was additionally useful for qualifying some of the other answers. 22. When the cyclone warning was in force, what preparations, including purchases, did you make? This question was repetitive but emphasised purchases as well as other preparatory actions. 23. How adequate do you think your household’s preparations were for Cyclone Larry? Most people had answered yes which was interpreted as good.

57
24. Did you stay in your own residence while cyclone Larry impacted the Innisfail area on Sunday and Monday and where in the house did you shelter? If no, where did you go? All households are moved elsewhere were classified as evacuated, but those from the three beachside communities were told to evacuate, whereas other households chose to shelter with family, relatives or friends and neighbours. 25. What was the effect of Cyclone Larry on your property (or properties)? Answers to this question gave a list of major damage from the point of view of the respondent. Question 42 required the interviewer to record a visual observation of damage. Clearly some things could have been fixed up by the time the interview took place. Actual items of damage were transferred from this question to question 42, and a combination of both questions was used to code the level of damage under this variable . 26. About how old is/was your home? The answer is in years. 27. Is your property insured for cyclone damage? a) Yes, House only b) Yes, Contents only c) Yes, House and contents d) No There were some respondents who answered no, and made a comment that the dwelling was rented and that the landlord probably had insurance. 28. What was the effect of Cyclone Larry on your workplace? The retired and the unemployed were grouped together. Some people were not at work but had not been laid off and presumably were continuing to be paid wages or salary. Many agricultural workers were clearly casual employees and had therefore been formally laid off. 29. What was the effect of Cyclone Larry on your community's amenities and resources? There was a diversity of responses to this question, including an opportunity to make some political and social comments. Some people praised the strong community spirit, so that this has been coded as a direct response. However opinions about what should or should not be done when not coded as responses to this question. Most of those who stated opinions had also given an observation of the effect of the cyclone on the community. 30. How much rainwater came into your house? How did it enter? About how much (a cup, a bucketful)? What damage (if any) did that rainfall cause? Quantities of rainwater that entered people’s houses were not precise, but have been approximated into broad numbers of litres. This is not intended as a quantification but rather as a qualitative indicator of likely water damage. 31. Was your floor covered by floodwaters? If yes, by about how much? (Specify if there is a business as well as a residence) Some people experienced considerable amounts of flood water inside the house especially those who lost their rooves, but some people referred to a terrestrial inundation from nearby creeks and rivers. This inundation did not necessarily occur at the time of the cyclone, although it was certainly a consequence. Numbers in the database are millimetres – most people estimated water depth in inches.

58
32. What did you and members of your family do to shelter and protect yourselves during the passage of Cyclone Larry. Questions 24 and 32 appear to be repetitions. It was intended that question 24 would identify the part of the house all room in which people sheltered while question 32 would record other actions that people took in those places to protect themselves, such as mattresses or under the table or in the car etc. People tended to give the same answer to each question but where are additional information was given that has been coded in question 32. 33. Do you have any pets? If yes, what did you do with them during the time that Cyclone Larry threatened the area? The coding of dog or cat includes multiples of each of these. The aim of the question was not to quantify the number of animals so much as to quantify the number of households with pets and where the animals sheltered during the cyclone. Small number of households that had numerous birds and animals of different types have been coded as menagerie . 34. During the passage of Cyclone Larry the Weather Bureau issued regular cyclone advice messages. Is there anything about the delivery of these messages that members of this household believe could be improved? 35. Did the messages contain the information that you felt you needed? Were they easy to understand? Were they too technical? Were they frequent enough? 36. Please add any additional remarks you would like to make regarding the advice messages put out by the weather bureau. Questions 34 and 36 were repetitious in that people generally used these to indicate whether or not the warnings were good and effective. Both questions referred to BoM but many answers related to the media and their weather forecasters. Thus criticisms and indications of quality are as likely to be about the media presentation of the weather forecasts rather than specifically concerned with the messages from the weather bureau themselves. Answers to question 35 were all yes or no, that the question about frequency prompted many people to comment about frequency under question 36. Again the coded comment that messages should be more regular refers both to BoM and to the media’s use and broadcasting of those messages. People did not separate the roles of the two groups of organisations unless they had been using the Internet. 37. What was the effect of Cyclone Larry on you personally? Responses to question 37 will not on a continuum scale but tended to be quite diverse, such that coding has attempted to reflect the diversity but with some compression of emotional responses. 38 What did you learn from your experiences that may help others facing a natural disaster threat? The category be prepared summarised a broad range of actions, recommendations, behaviour and preparation. 39. Have you previously experienced a cyclone? (which ones and where) Cyclone names all years in which a respondent hand experienced a cyclone are recorded exactly as they were given. 40. Is there anyone in this household who has special needs?

59
If yes how were their needs met during the passage of the cyclone? This question was a broad self definition. If somebody answered yes their responses have been coded. Thus some babies had special needs while others did not, and some eighty-year-olds had special needs while others did not. 41. Suburb 42. Visual observation of damage See question 25. Items from both of these questions have been recorded within a 50 character limit.

60
Appendix 2. Previous Cyclones Experienced - full details Number Percent None 28 19.1 1956 1983 Babinda 1 .7 1957 1 .7 All cyclones since 1947 1 .7 All cyclones since 1956 1 .7 Cairns 1978 1 .7 Cairns 1986 1 .7 Cairns in 1980s/90s 1 .7 Fraser Island 1980s 1 .7 Hervey Bay Joy 1 .7 Innisfail 1990s Justin Rona 1 .7 Joy 3 2.0 Joy Steve Justin 1 .7 Justin 1 .7 Justin Rona 1 .7 Kerry Winifred 1 .7 Overseas 1 .7 South East Queensland 1950 1 .7 Tracey 1 .7 Winifred 53 36.1 Winifred Justin 1 .7 Winifred & all others in 75 years 1 .7 Winifred & others 1 .7 Winifred Alamba 1 .7 Winifred Althea Joy 1 .7 Winifred Althea Joy Justin Rona 1 .7 Winifred Ivan 1 .7 Winifred Joy 12 8.2 Winifred Joy Dave Steve Justin 1 .7 Winifred Joy Justin 9 6.1 Winifred Joy Justin Althea Eda Rona 1 .7 Winifred Joy Justin Rona 4 2.7 Winifred Joy Justin Rona Steve 1 .7 Winifred Joy Rona 2 1.4 Winifred Justin Agnes Joy 1 .7 Winifred Justin Rona 1 .7 Winifred Justin Rona Steve 1 .7 Winifred Peter 1 .7 Winifred Rona Justin 1 .7 Winifred Silkwood 1958 1 .7 Winifred Joy 1 .7 Other unnamed 2 1.4 Total 147 100.0
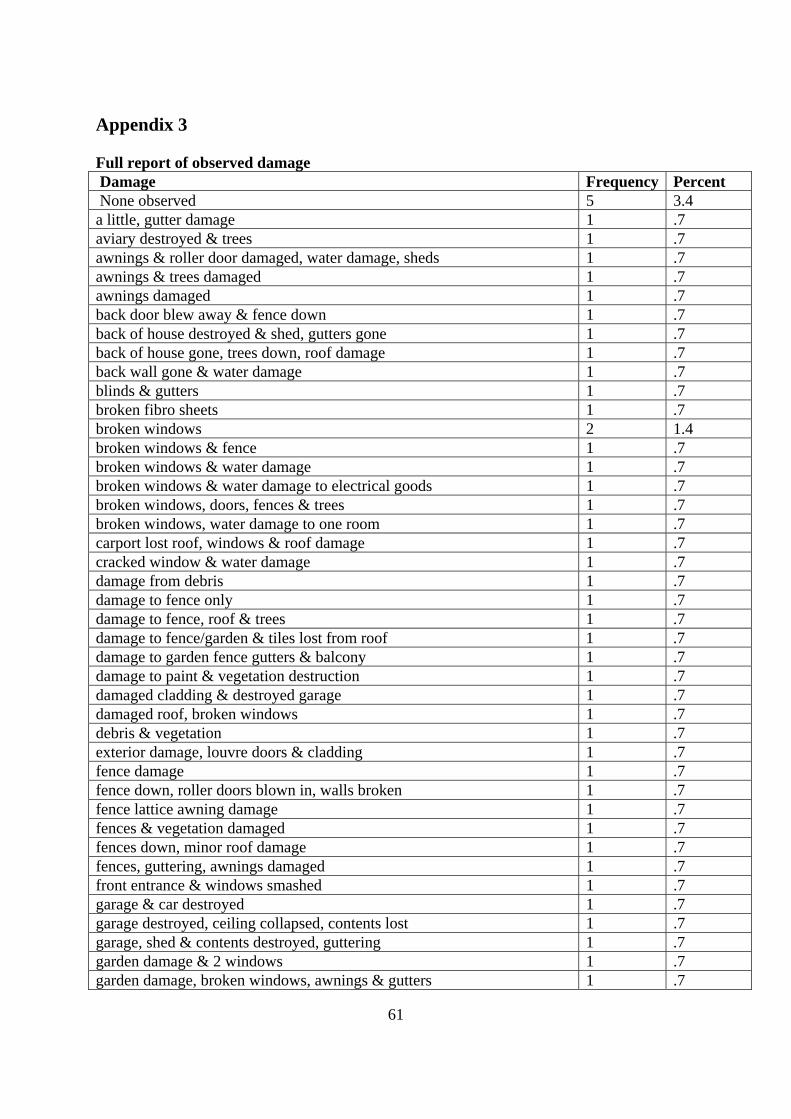
61
Appendix 3 Full report of observed damage Damage Frequency Percent None observed 5 3.4 a little, gutter damage 1 .7 aviary destroyed & trees 1 .7 awnings & roller door damaged, water damage, sheds 1 .7 awnings & trees damaged 1 .7 awnings damaged 1 .7 back door blew away & fence down 1 .7 back of house destroyed & shed, gutters gone 1 .7 back of house gone, trees down, roof damage 1 .7 back wall gone & water damage 1 .7 blinds & gutters 1 .7 broken fibro sheets 1 .7 broken windows 2 1.4 broken windows & fence 1 .7 broken windows & water damage 1 .7 broken windows & water damage to electrical goods 1 .7 broken windows, doors, fences & trees 1 .7 broken windows, water damage to one room 1 .7 carport lost roof, windows & roof damage 1 .7 cracked window & water damage 1 .7 damage from debris 1 .7 damage to fence only 1 .7 damage to fence, roof & trees 1 .7 damage to fence/garden & tiles lost from roof 1 .7 damage to garden fence gutters & balcony 1 .7 damage to paint & vegetation destruction 1 .7 damaged cladding & destroyed garage 1 .7 damaged roof, broken windows 1 .7 debris & vegetation 1 .7 exterior damage, louvre doors & cladding 1 .7 fence damage 1 .7 fence down, roller doors blown in, walls broken 1 .7 fence lattice awning damage 1 .7 fences & vegetation damaged 1 .7 fences down, minor roof damage 1 .7 fences, guttering, awnings damaged 1 .7 front entrance & windows smashed 1 .7 garage & car destroyed 1 .7 garage destroyed, ceiling collapsed, contents lost 1 .7 garage, shed & contents destroyed, guttering 1 .7 garden damage & 2 windows 1 .7 garden damage, broken windows, awnings & gutters 1 .7

62
gutter & facia, 2 windows & glass door 1 .7 gutter & roof damage 1 .7 guttering, wall damage under house 1 .7 gutters & power lines 1 .7 gutters damaged 1 .7 gutters, awnings & roller door & trees down 1 .7 hole in roof, broken windows & awning 1 .7 holes in roof 1 .7 house & belongings totally destroyed 1 .7 Innisfail property devastated, minor damage here 1 .7 lost house & all belongings 1 .7 louvres smashed & roof joists cracked 1 .7 Major damage to 2 houses & business 1 .7 major destruction 1 .7 major structural damage to walls & windows 1 .7 minor 5 3.4 minor roof damage 1 .7 minor & vegetation 1 .7 minor damage 2 1.4 minor damage to carport 1 .7 minor damage to fences 1 .7 minor damage to paintwork 1 .7 minor damage to shed 1 .7 minor damage to weatherboard 1 .7 minor damage, shed gone, shades & blinds 1 .7 minor from debris, guttering & garage contents 1 .7 minor roof damage 1 .7 minor to gutters awning & whirlybird 1 .7 minor water damage, sea water in laundry 1 .7 minor, fence 1 .7 minor, shed & fence 1 .7 missing tiles 1 .7 no damage 4 2.7 no damage to house, garage roller doors damaged 1 .7 no roof wall damage, all furniture & belongings 1 .7 no roof, walls & windows shattered, trees down 1 .7 none 13 8.8 none to house, garden damage 1 .7 ok 1 .7 pagoda gone, roof lost, all furniture damaged 1 .7 portion of wall damaged 1 .7 punctured wall, broken louvres 1 .7 roller door carport shed damage & trees down & car 1 .7 roller doors off, loss of awnings & hole in roof 1 .7 roof & gutter damage 1 .7 roof damage, shed & garage destroyed 1 .7

63
roof damage, tiles missing 1 .7 roof damage, wrecked bedrooms 1 .7 roof guttering 1 .7 roof loss & major damage 1 .7 roof off & trees down 1 .7 roof portion lost & windows 1 .7 roof severely damaged, shed gone 1 .7 roof truss split & fences down 1 .7 shed & cladding 1 .7 shed damaged & vegetation 1 .7 shed gone & garden damage 1 .7 total destruction of house & belongings 1 .7 tree damage 2 1.4 tree damage & gutters 1 .7 tree damage, broken windows, walls& awnings, shed 1 .7 trees 2 1.4 trees & powerline 1 .7 trees & water damage 1 .7 trees down 1 .7 trees down, little house damage 1 .7 trees, windows & power line down 1 .7 tress down, damage to awnings & gutters 1 .7 vegetation damage 2 1.4 water damage & fence down 1 .7 water damage, debris 1 .7 water damage, shed lost, minor structural damage 1 .7 window & garage damaged 1 .7 windows & cladding damaged 1 .7 Windows blown in, water damage 1 .7 windows broken, ceiling damage, guttering 1 .7 windows smashed, underneath house damaged 1 .7 Total 147 100.0

64
Appendix 4. Survey Instrument Number: 1. Where did you get information from on how to prepare for this cyclone season? 2.. At the beginning of this cyclone season did members of this household discuss the possibility of a cyclone affecting you this year? If yes, what sort of household emergency plan did you have for such an event? 3. What did you do to prepare for this cyclone season? 4. At what time (and day) did you first become aware cyclone Larry was heading your way? 5. As Cyclone Larry approached on Sunday March 19th, where did you mainly get information about the cyclone? 6. What further preparations did the warnings prompt you to carry out? 7. Can you remember how you felt when you heard the cyclone advice messages for cyclone Larry? 8. Can you recall how you acted on this feeling? 9. Who was in your household on Sunday March 19th as Cyclone Larry approached the coast (ie were all the family at home? did others come to your household?) (List ages and gender) 10. Were all the usual members of your household contactable and accounted for on Sunday March 19th? If no, were you able to do anything about this? Please explain. 11. Was this a cause of particular concern to you? 12. Were any of your family or relatives (that do not live with you) also in the Cyclone Larry warning area? If yes, did you have contact with them? 13. Did members of your household talk to / visit / stay with, neighbours during the Cyclone Larry warning period on Sunday March 19th? If yes, when or how often? 14. Did you track Cyclone Larry using a cyclone tracking map? 15. Where did you get the map from? 16. Was the forecast track map useful? (prompt for reaction to the new style of BoM forecast track map)

65
17. What did you expect would occur on Sunday night and Monday morning when you heard that Cyclone Larry was likely to impact the Innisfail area within a few hours? 18. Did you expect there to be a storm surge associated with Cyclone Larry crossing the coast at or near Innisfail? 19. Did you expect to be affected by storm surge and why? 20. When did you begin to be concerned about cyclone Larry? 21. When did you begin to make preparations for Cyclone Larry? 22. When the cyclone warning was in force, what preparations, including purchases, did you make? 23. How adequate do you think your household’s preparations were for Cyclone Larry? 24. Did you stay in your own residence while cyclone Larry impacted the Innisfail area on Sunday and Monday and where in the house did you shelter? If no, where did you go? 25. What was the effect of Cyclone Larry on your property (or properties)? 26. About how old is/was your home? 27. Is your property insured for cyclone damage? a) Yes, House only b) Yes, Contents only c) Yes, House and contents d) No 28. What was the effect of Cyclone Larry on your workplace? 29.What was the effect of Cyclone Larry on your community's amenities and resources? 30. How much rainwater came into your house? How did it enter? About how much (a cup, a bucketful)? What damage (if any) did that rainfall cause? 31. Was your floor covered by floodwaters? If yes, by about how much? (Specify if there is a business as well as a residence) 32. What did you and members of your family do to shelter and protect yourselves during the passage of Cyclone Larry. 33. Do you have any pets? If yes, what did you do with them during the time that Cyclone Larry threatened the area? 34. During the passage of Cyclone Larry the Weather Bureau issued regular cyclone advice messages. Is there anything about the delivery of these messages that members of this household believe could be improved?

66
35. Did the messages contain the information that you felt you needed? Were they easy to understand? Were they too technical? 36. Please add any additional remarks you would like to make regarding the advice messages put out by the weather bureau. 37. What was the effect of Cyclone Larry on you personally? 38 What did you learn from your experiences that may help others facing a natural disaster threat? 39. Have you previously experienced a cyclone? (which ones and where) 40. Is there anyone in this household who has special needs? If yes how were their needs met during the passage of the cyclone? 41. Suburb 42. Visual observation of damage
Centre for Disaster Studies, James Cook University
Post Cyclone Larry Household Survey: Johnstone Shire March 2006 Introduction – We are researchers and students from the Centre for Disaster Studies at James Cook University. We carry out brief household surveys after natural disasters in order to find out what people did and how they heard about and responded to warnings. The information we gather is reported back to the Bureau of Meteorology, Queensland Department of Emergency Services and Local Councils to help improve future cyclone education and the warnings and information that go to local communities and households. We should be grateful if you will give us fifteen minutes of your time by sharing your experiences of cyclone Larry. This survey is completely voluntary and confidential. Any time you want to stop please tell us and we will leave. Completed questionnaires will be securely stored at the Centre for Disaster Studies at James Cook University. Any questions about this survey can be addressed to the Director, David King, on 0747814430.
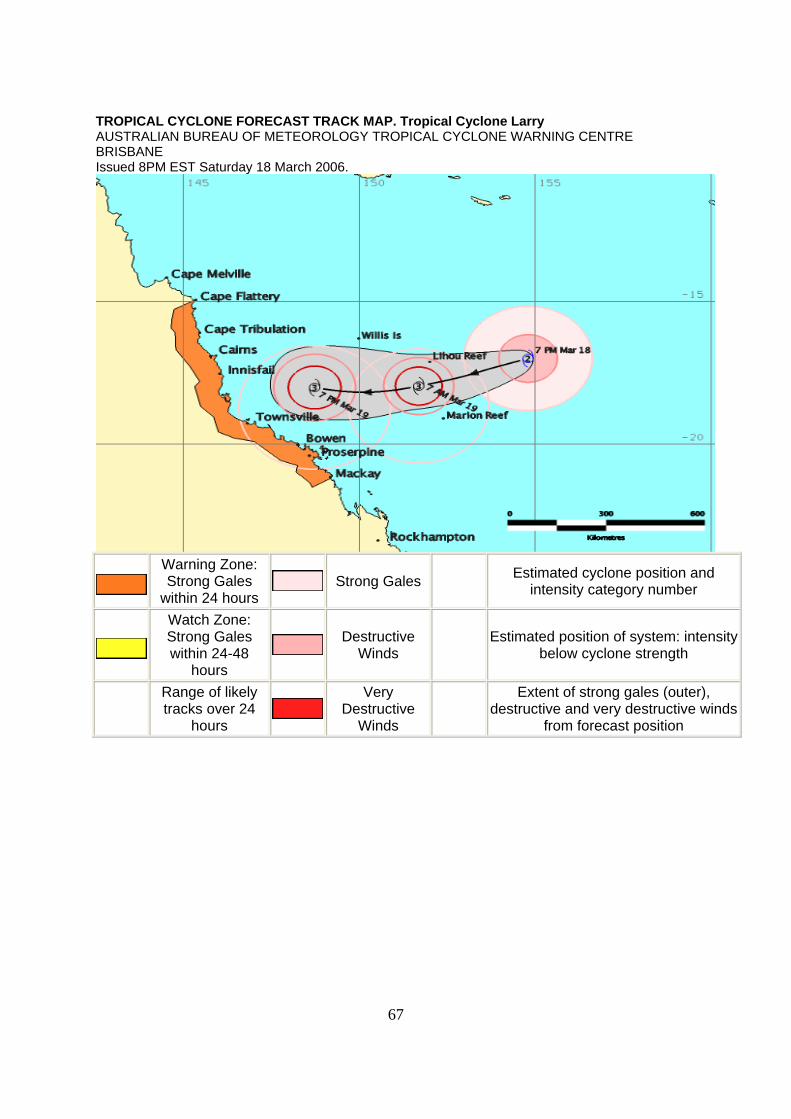
67
TROPICAL CYCLONE FORECAST TRACK MAP. Tropical Cyclone Larry AUSTRALIAN BUREAU OF METEOROLOGY TROPICAL CYCLONE WARNING CENTRE BRISBANE Issued 8PM EST Saturday 18 March 2006.
Warning Zone: Strong Gales
within 24 hours Strong Gales Estimated cyclone position and
intensity category number
Watch Zone: Strong Gales within 24-48
hours
Destructive Winds
Estimated position of system: intensity below cyclone strength
Range of likely tracks over 24
hours
Very Destructive
Winds
Extent of strong gales (outer), destructive and very destructive winds
from forecast position

68
Appendix 5 Pictures post Larry The Coast, from Cardwell to Flying Fish point took a battering Cardwell
Kurrimine Beach

69
Cowley Beach
Coastal vegetation absorbed energy at Kurrimine and Cowley Beaches

70
Vegetation was largely decimated

71
Commercial crops, like banana, were wiped out
Flying debris presents a great danger – vegetation may ‘filter’ some of that

72
Houses, old and new, were often built to full cyclone standards
Some old houses coped well – this 90 year old in South Johnstone had 2 broken louvres

73
Road signs and shredded vegetation indicate wind speed
Some old, highly exposed houses (this one just north of Innisfail) were unscathed – the wind speeds appeared to be patchy

74
There were bands of destruction; some elevation dependent - Innisfail
Innisfail

75
There was major damage in parts of South Johnstone:

76
Pubs in the district were often badly damaged
Most building damage was not severe

77
Note that most windows stayed intact
Many fences went down