cyclical dynamics in creation and destruction
TRANSCRIPT

Cyclical Dynamics in Worker and Job Flows and Vacancies
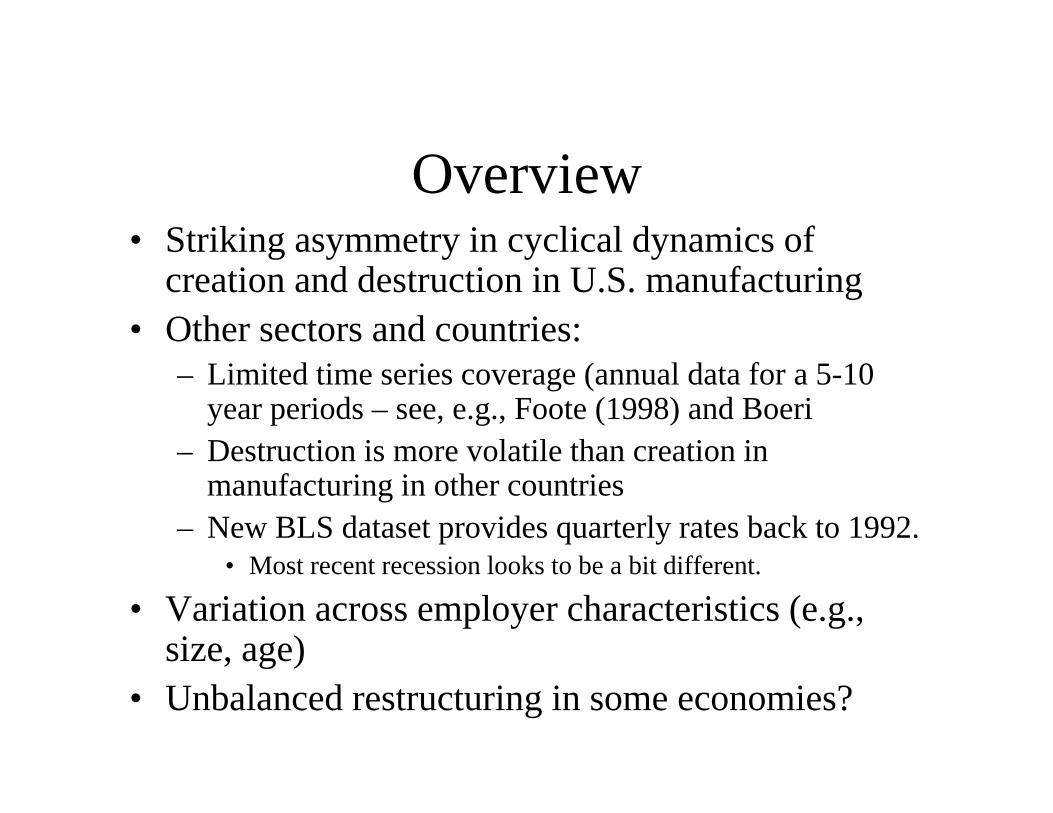
Overview• Striking asymmetry in cyclical dynamics of g y y y y
creation and destruction in U.S. manufacturing• Other sectors and countries:
– Limited time series coverage (annual data for a 5-10 year periods – see, e.g., Foote (1998) and Boeri
– Destruction is more volatile than creation inDestruction is more volatile than creation in manufacturing in other countries
– New BLS dataset provides quarterly rates back to 1992. M t t i l k t b bit diff t• Most recent recession looks to be a bit different.
• Variation across employer characteristics (e.g., size, age), g )
• Unbalanced restructuring in some economies?

Theory: Business Cycle andTheory: Business Cycle and Reallocation
• Which way does causality go and/or what is nature of interaction?
Bl h d d Di d (1989 1990)– Blanchard and Diamond (1989, 1990)– Davis/Haltiwanger (1990)– Mortensen/Pissarides (1994, 1999)Mortensen/Pissarides (1994, 1999)– Caballero/Hammour (1994, 1996)– Campbell/Fisher (2001)– Foote (1998)– Ramey/Watson (1997)– Barlevy (2002)Barlevy (2002)
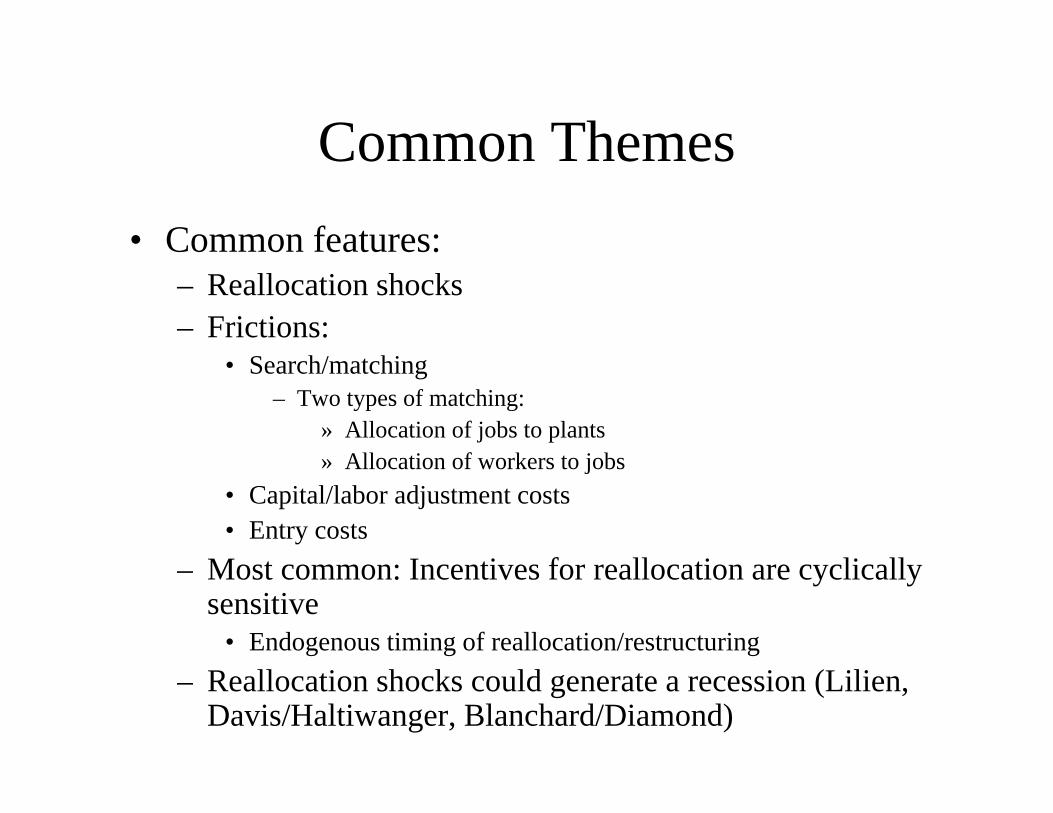
Common ThemesCommon Themes• Common features:
– Reallocation shocks– Frictions:
h/ hi• Search/matching– Two types of matching:
» Allocation of jobs to plantsAllocation of orkers to jobs» Allocation of workers to jobs
• Capital/labor adjustment costs• Entry costs
M t I ti f ll ti li ll– Most common: Incentives for reallocation are cyclically sensitive
• Endogenous timing of reallocation/restructuring– Reallocation shocks could generate a recession (Lilien,
Davis/Haltiwanger, Blanchard/Diamond)

Efficiency?
• Technological sclerosis and unbalanced restructuring (Caballero and Hammour)
ll i ff ( l )• Sullying effect (Barlevy)• Sources of inefficiency:
B i i– Bargaining– Hold-up problems– Asymmetric informationy– Distortions in credit/product markets
• Growth vs. fluctuations?

Understanding cyclical drivingUnderstanding cyclical driving forces
• Aggregate vs. reallocation shocks• Does timing of reallocation respond in systematic
h kways to aggregate shocks?• Is the business cycle caused by reallocation
shocks?shocks?• Decomposition of driving forces using a structural
VAR– Mapping to deep structural parameters?
• Davis and Haltiwanger (AER, 1999) and (JME, 2001)


Long run neutrality restrictions

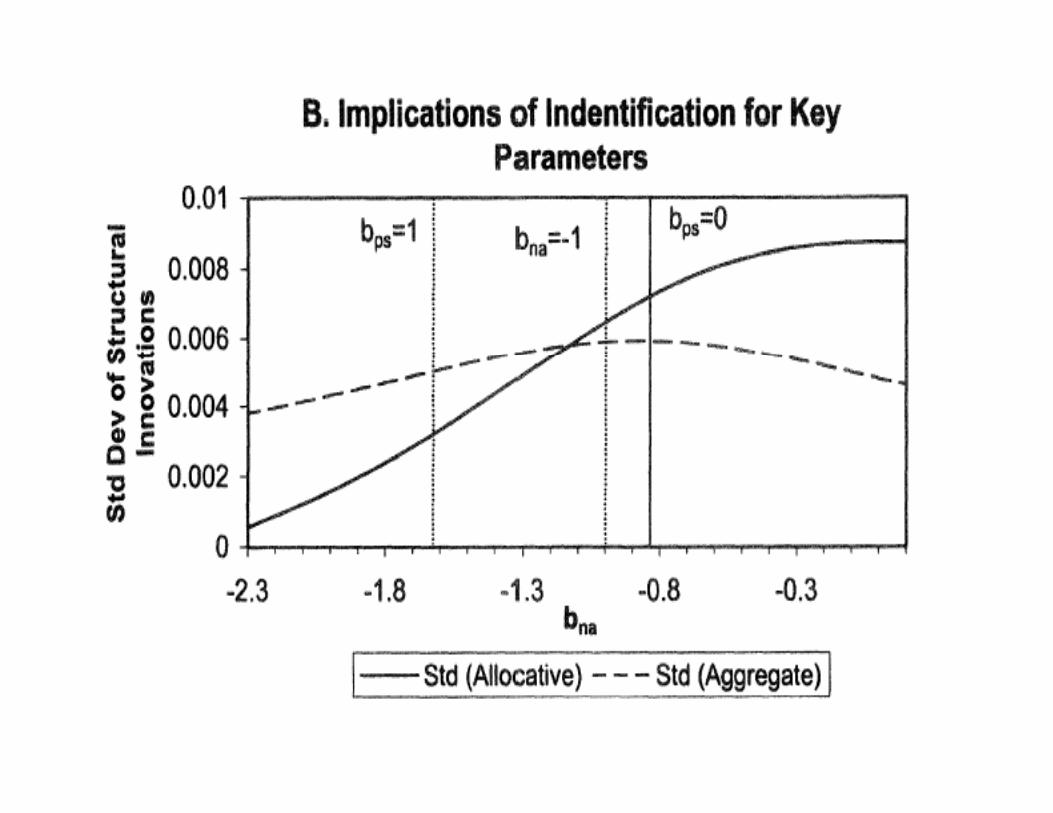


7-Variable system with observable shocks


Net vs Reallocation ResponsesNet vs. Reallocation Responses to Oil and other Shocks
• Net employment response to 73 oil price shock is -8 percent at 8 quarters but only -2 percent at 16 quarters.
• Reallocation response is 11 percent at 16 quarters.• Net response to 79 money shock is -3 percent at 8
quarters, -1.3 percent at 16 quarters -- and ll ti i 2 7 t t 16 treallocation response is 2.7 percent at 16 quarters.
Reallocation Responses toReallocation Responses to Shocks
• Oil Shocks:– positive price shocks cause downturn but
negative shocks cause upturns;– reallocation dynamics can explain why;
• Credit/Money Shocks:– Look more like “traditional” aggregate shock – Still asymmetric response of destruction
relative to creation -- recessions as reorganizations?reorganizations?

Taking stock…
• Theory and evidence link reallocation (permanent) and cycle
• Evidence for non-manufacturing still unclear
• Theory and evidence has not fully exploited differences by plant characteristics (e.g., size, age)
• Causality difficult

Search/matching literature and vacancies

Overview• Models of search & matching now standard for
understanding of labor market interactions
• One critical component is the process of:demand for labor vacancy posting worker-job match
• Until recently, good data for studying process in US did not exist– To date, relevant micro analyses almost non-existent
• This lecture exploits newly available JOLTS data (both p y (macro and micro) to explore role of vacancies in job and worker flows
Background – Standard Model• Mortensen-Pissarides (1994):
– Vacancies – (costly) tool used by firms to signal an open job– Free entry firms post vacancies until E(returns) = costFree entry firms post vacancies until E(returns) cost– Search frictions cause hiring/job creation to be costly & time-consuming
process– Once matched, worker & job stay together so long as E(returns) of , j y g g ( )
match remain 0; • If a shock drives E(returns) < 0, match separates/job is destroyed
• Interesting complications:– On-the-job search and quits– Hires with no posted vacancy and multiple hires per vacancyp y p p y– New hires vs job creation and separations vs job destruction
Resulting Empirical Questions• What is the role of vacancies in hiring?
– Do they truly capture all unmet labor demand?– Are they essential inputs to hiring?Are they essential inputs to hiring?
• What does the hiring-vacancy relationship look like?I it th t t d t bli h t l l ?– Is it the same at aggregate and establishment levels?
• When a firm changes employment, how does it alter its i f hi i & i ?mix of hires, separations, & vacancies?
– Put differently, where do vacancies fit into the relationships between job creation & hires, and job destruction & separations?

More Deep-Rooted Questions• Is the standard matching function consistent with
the micro data evidence on vacancies, hires and number of job searchers?number of job searchers?– Does h = m(v,u) hold at the firm level?
• What modifications of the standard matching model are necessary to accommodate the patterns at the micro level?– Are there other variables that may factor in to the
matching process?

JOLTS Concepts & Definitions (1)
• Job Openings and Labor Turnover• Job Openings and Labor Turnover Survey (JOLTS)
M thl f hl 16 000– Monthly survey of roughly 16,000 establishments starting in December 2000Core questions on:– Core questions on:
• Employment level• # hires during month# hires during month• # separations during month (with quit/layoff
breakdown)• # posted vacancies at end of month

JOLTS Concepts & DefinitionsJOLTS Concepts & Definitions (2)
– Stock of employment at mid month (pay period including the 12th); all employees on payroll at the time
– Hires, separations (incl. quits, layoffs & other , p ( q , yseparations) are flows measured over the course of the calendar month
• Definitions allow workers to move off (on) payroll without il b i t d (hi d)necessarily being separated (hired)
– Posted, unfilled vacancies at the end of calendar month• A vacancy must be part of an active recruitment, and must be for
a job that can start within 30 daysa job that can start within 30 days• Definition may not capture long-term postings or vacancies
posted and filled within the calendar month

JOLTS Data & MeasurementJOLTS Data & Measurement• Data used for studyData used for study
– Pooled microdata from Dec 2000 to Jan 2005– Use only estabs with observations over two consecutive months
• Allows tabulation of net employment change & use of lagged p y g ggvacancy rate
– Restrict to estabs with positive employment in consecutive months -- very few entering/exiting estabs anywayAll estimates sample weighted– All estimates sample-weighted
• Measurement Issues– Given definitions, timing differences, and potential measurement
d h ld ( d f d ) ierror, H – S = E need not hold (and often does not) in JOLTS micro data
– Worker flows and job flows computed from JOLTS are smaller than those from other sources
JOLTS Data & Measurement (cont’d)
• We impose identity that H S = E• We impose identity that H – S = E – H(t), S(t), and E(t) data taken at face value for month t– E(t–1) redefined as E(t) – H(t) + S(t) so identity holds
• We relate vacancies posted at end of t – 1 to hires and separations during t and employment growthand separations during t and employment growth from t-1 to t
• Meas res t rned into rates sing DHS a erage• Measures turned into rates using DHS average employment denominator, ½[E(t) + E(t–1)]– Vacancy Rate denominator = V + DHS Emp.

Aggregate Evidence –Aggregate Evidence Labor Market Tightness
L b M k t Ti ht (V /U )0 9 Labor Market Tightness (V /U )
0.8
0.9
0.6
0.7
0.4
0.5
0.3
2000
12
2001
03
2001
06
2001
09
2001
12
2002
03
2002
06
2002
09
2002
12
2003
03
2003
06
2003
09
2003
12
2004
03
2004
06
2004
09
2004
12
• There were large movements in V/U during the period
2 2 2 2 2 2 2 2 2 2 2 2 2 2 2 2 2

Aggregate Evidence –Aggregate Evidence Hires and Vacancies
4 0 Hi H(t)
3.5
4.0 Hires H(t)Vacancies V(t)
3.0
2.0
2.5
1.5
0001
2
0010
3
0010
6
0010
9
0011
2
0020
3
0020
6
0020
9
0021
2
0030
3
0030
6
0030
9
0031
2
0040
3
0040
6
0040
9
0041
2
• Hires and vacancies also had considerable volatility
20 20 20 20 20 20 20 20 20 20 20 20 20 20 20 20 20

Aggregate Evidence –Aggregate Evidence The Vacancy Yield
V Yi ld H ( )/V ( 1)1 8 Vacancy Yield H (t )/V (t -1)
1.6
1.7
1.8
1.4
1.5
1 1
1.2
1.3
1.0
1.1
0001
2
0010
3
0010
6
0010
9
0011
2
0020
3
0020
6
0020
9
0021
2
0030
3
0030
6
0030
9
0031
2
0040
3
0040
6
0040
9
0041
2
• The yield, however, has been acyclical, if not somewhat counter-cyclical
20 20 20 20 20 20 20 20 20 20 20 20 20 20 20 20 20

Basic Micro Evidence –Basic Micro Evidence How are Vacancies Distributed?
Distribution of Vacancy Postings across Establishments, Employment-Weighted50 y g p y g
35
40
45
25
30
35
10
15
20
0
5
0 1 2 3 4 5 6 7 8 9 10 11 12 13 14 15 16 17 18 19 20 21 22 23 24 25
• Employment-weighted, 46 percent of estabs post novacancies; unweighted it’s even greater (88 percent!)

Basic Micro Evidence –Basic Micro Evidence How are Vacancies Distributed?
Distribution of Positve Vacancy Postings across Establishments, 30 y gEmployment-Weighted
25
15
20
5
10
0
5
0 5 10 15 20 25
• ...and conditional on posting a vacancy, 24 percent of estabs only post one (unweighted, 66 percent!)

Basic Micro Evidence –Basic Micro Evidence Why so few vacancies?
50 0 Distribution of Net Employment Growth across
35 0
40.0
45.0
50.0 Distribution of Net Employment Growth acrossEstablishments, Employment-Weighted
20 0
25.0
30.0
35.0
5 0
10.0
15.0
20.0
• Because there are few monthly employment changes!
0.0
5.0
-0.30 -0.25 -0.20 -0.15 -0.10 -0.05 0.00 0.05 0.10 0.15 0.20 0.25 0.30
• Because there are few monthly employment changes! – 78 pct of estabs, representing 45 pct of employment have no net
change in a month
Vacancy & Net Growth Relations –Vacancy & Net Growth Relations Distribution of Vacancies across Net
25.0
20.0
10 0
15.0
5.0
10.0
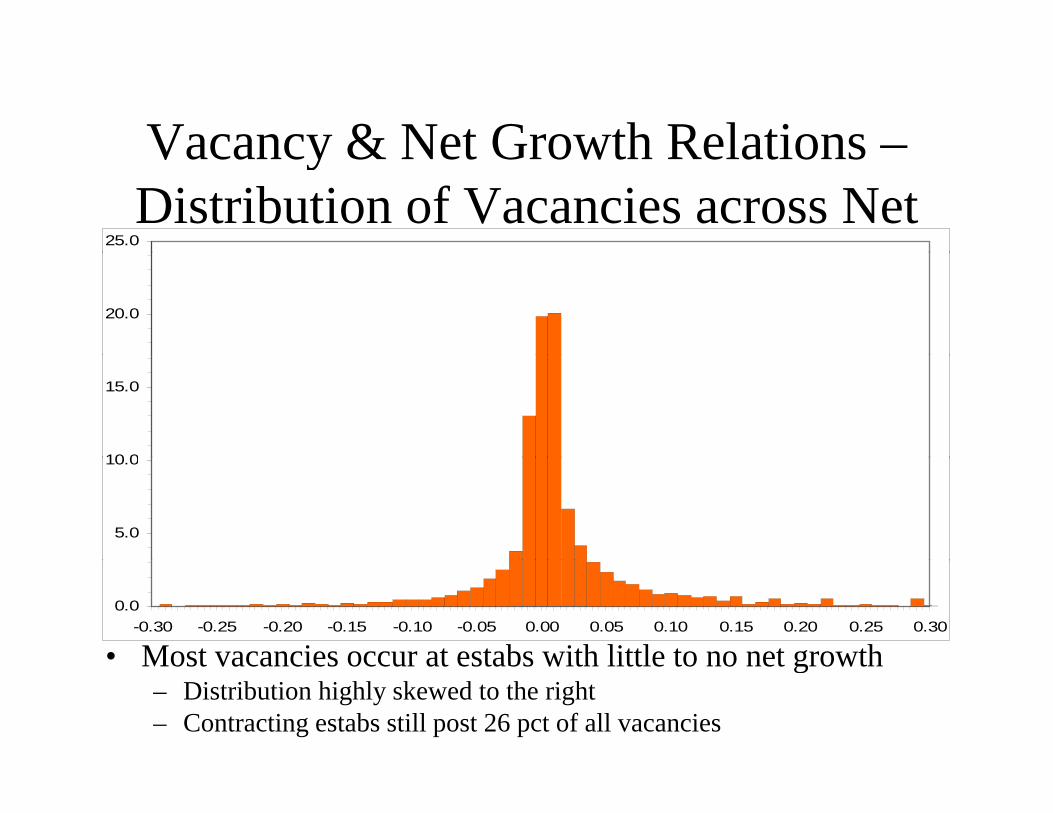
• Most vacancies occur at estabs with little to no net growth
0.0-0.30 -0.25 -0.20 -0.15 -0.10 -0.05 0.00 0.05 0.10 0.15 0.20 0.25 0.30
Most vacancies occur at estabs with little to no net growth – Distribution highly skewed to the right– Contracting estabs still post 26 pct of all vacancies

Vacancy & Net Growth Relations –Vacancy & Net Growth Relations Vacancy Rates as a function of Net
0.06
0 04
0.05
Vacancy RateV UClMean = 0.022
0.03
0.04
0.01
0.02
• Vacancy Rates increase nonlinearly with net growth
0.00-0.30 -0.25 -0.20 -0.15 -0.10 -0.05 0.00 0.05 0.10 0.15 0.20 0.25 0.30
Net Growth Rate
Vacancy Rates increase nonlinearly with net growth – Contracting estabs have essentially constant rates (~ 2 pct)– Zero-growth estabs have lowest rates (1.4 pct)

Vacancy & Net Growth Relations –Vacancy & Net Growth Relations Pr(V(t–1) > 0) as a function of Net
1.00P b bilit f V P ti
0.80
Probability of a Vacancy PostingV UClMean = 0.124
0.40
0.60
0.20
• Probability of a vacancy posting increasing in Net but
0.00-0.30 -0.25 -0.20 -0.15 -0.10 -0.05 0.00 0.05 0.10 0.15 0.20 0.25 0.30
Net Growth Rate
Probability of a vacancy posting increasing in Net, but…– Estabs with small changes are most likely to post vacancies– Zero-growth estabs have very low vacancy posting probability

Vacancy & Net Growth Relations –Vacancy & Net Growth Relations Vacancy Yield as a function of Net
6Hires per Vacancy (for Vacancies > 0)
4
5
Hires per Vacancy (for Vacancies > 0)V UClMean = 0.94
3
4
1
2
• Vacancy yield also nonlinearly increasing in net
0-0.30 -0.25 -0.20 -0.15 -0.10 -0.05 0.00 0.05 0.10 0.15 0.20 0.25 0.30
Net Growth Rate
y y y g– Expansions have yield >> 1, contractions have yield 1– Similar pattern when all hires included (but with mean yield > 1)– Pattern differs considerably from aggregate patterns

Summary of Vacancy FindingsSummary of Vacancy Findings• Most estabs have no vacancies, net growth; rich dynamics g y
come about from small share that do
• Vacancy posting and yield behavior clearly varies with estab growth– Most relations are nonlinear– Zero-growth estabs appear fundamentally different in their
vacancy patterns (less likely to need active search)– Yield evidence suggests factors correlated with growth may affect
matching process
• Next, take a step back to worker-job flow relations– Remember that…
• Estab Net Growth > 0 Job Creation• Estab Net Growth > 0 Job Creation• Estab Net Growth < 0 Job Destruction
– Useful to see how vacancy behavior is related
Worker & Job Flow Relations –Worker & Job Flow Relations Hires and Separations vs Net Growth
0.35
0.25
0.30Hiring Rate Separations RateH UCl S UClMean = 0.033 Mean = 0.031
0.15
0.20
0.05
0.10
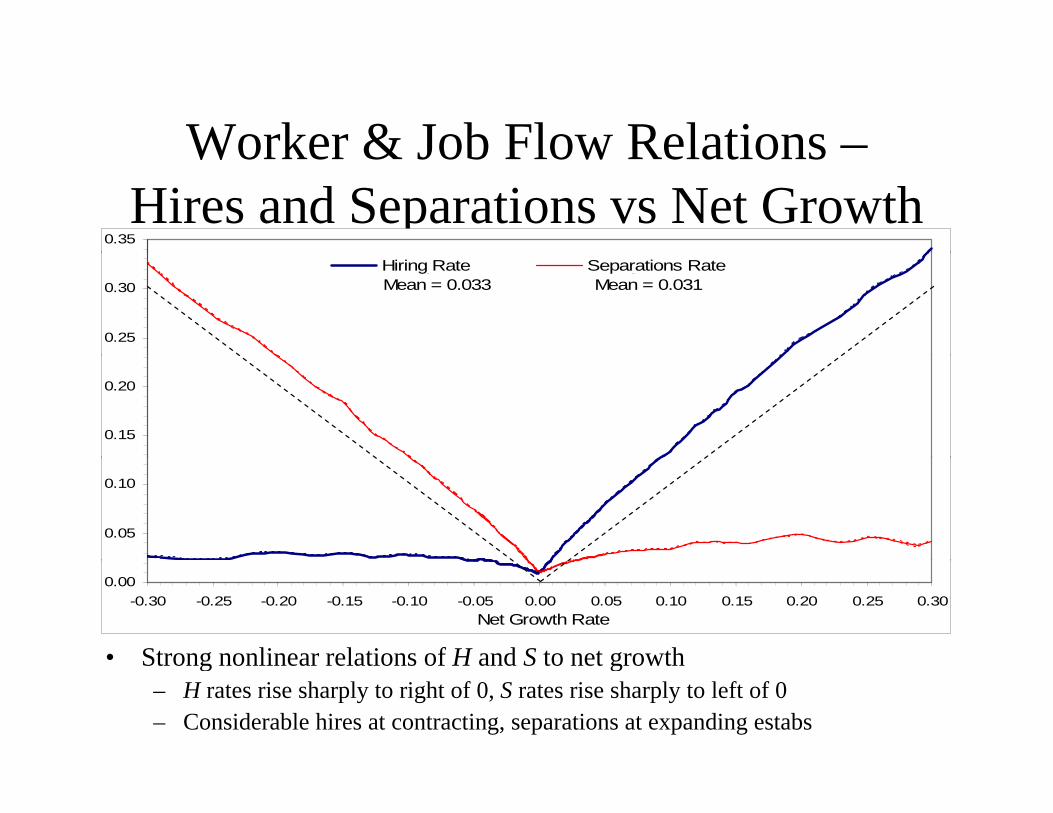
• Strong nonlinear relations of H and S to net growth
0.00-0.30 -0.25 -0.20 -0.15 -0.10 -0.05 0.00 0.05 0.10 0.15 0.20 0.25 0.30
Net Growth Rate
Strong nonlinear relations of H and S to net growth– H rates rise sharply to right of 0, S rates rise sharply to left of 0– Considerable hires at contracting, separations at expanding estabs

Worker & Job Flow Relations –Worker & Job Flow Relations Excess Worker Flows vs Net Growth
0.06
0 04
0.05
Excess Worker Flow RateV UClMean = 0.017
0.03
0.04
0.01
0.02
• Excess Flow H – JC = S – JD highlights churning from last figure
0.00-0.30 -0.25 -0.20 -0.15 -0.10 -0.05 0.00 0.05 0.10 0.15 0.20 0.25 0.30
Net Growth Rate
Excess Flow H JC S JD, highlights churning from last figure– Excess flows increase with the magnitude of net growth– Greater excess churning for expanding estabs (~ 4-5 pct vs 2-3 pct)

Worker & Job Flow Relations –Worker & Job Flow Relations Some Notes on Worker Flows
• Worker-job flow relations are robust to a variety of circumstances– Patterns persist across sectors, size class, relaxation of
identity restrictionPatterns persist in other data at lower frequency– Patterns persist in other data, at lower frequency
• LEHD – quarterly, administrative (universe) data
– Patterns persist in high and low-growth periodsp g g p• Curves show little to no movement over business cycle• Instead, aggregate flow rates change mainly via shifts in the
net growth distributionnet growth distribution

Worker & Job Flow Relations –Worker & Job Flow Relations Concentration of Job Flows
8.0
6.0
7.0
3.0
4.0
5.0
1.0
2.0
• Job flows spread over wide range of net growth ratesConcentration of Job Creation (right of zero) and Job Destruction (left of zero)
0.0-0.30 -0.25 -0.20 -0.15 -0.10 -0.05 0.00 0.05 0.10 0.15 0.20 0.25 0.30
Job flows spread over wide range of net growth rates– Larger job flow shares at smaller growth rates– Similar to pattern in DHS (1996), except missing births and deaths.

Worker & Job Flow Relations –Distribution of Worker Flows along
Net12.0 Net
8.0
10.0
4.0
6.0
0.0
2.0
0 30 0 25 0 20 0 15 0 10 0 05 0 00 0 05 0 10 0 15 0 20 0 25 0 30
• Worker flows concentrated among small Net changes– H distribution skewed to right, S distribution skewed to left
-0.30 -0.25 -0.20 -0.15 -0.10 -0.05 0.00 0.05 0.10 0.15 0.20 0.25 0.30Hires Separations
g– Yet, 17 pct of H occur at contractions, 24 pct of S occur at expansions– Small net changes have low churning rates, but represent most total churning

Worker & Job Flow Relations –Worker & Job Flow Relations Quits and Layoffs vs Net Growth
0.35
0.25
0.30Quits Rate Layoffs RateH UCl S UClMean = 0.012Mean = 0.017
0.15
0.20
0.05
0.10
• Quits, Layoffs also exhibit strong nonlinear patterns
0.00-0.30 -0.25 -0.20 -0.15 -0.10 -0.05 0.00 0.05 0.10 0.15 0.20 0.25 0.30
Net Growth Rate
Q , y g p– Quits dominate separations at expansions– Quits also account for many separations at contractions– Layoff/quit ratio rises as net growth rate becomes more negative

The Role of Structural HeterogeneityThe Role of Structural Heterogeneity• Evidence thus far says little about differences across y
establishments
• Variations by estab size (see handout)S ll t b l t lik l t t V t h hi h t h i– Small estabs: least likely to post a V, yet have highest churning
– Conditional on V > 0, vacancy yield increases in size; unconditionally, it decreases
• Variations by sector (see handout)– Much variation in H, S, V Rates and likelihood of posting a
vacancyHi h h i d t i ( t il t ti ) t d t h l– High churn industries (retail, construction) tend to have low likelihoods of V postings
• For more comprehensive check on role of heterogeneity, li i l lli f bli hwe replicate previous results controlling for establishment
fixed effects

Controlling for Establishment FE –Controlling for Establishment FE Vacancy Rates vs Net Growth
0.06
0 04
0.05
Vacancy RateVacancies, controlling for estab. FE
0.03
0.04
0.01
0.02
• Vacancy rates still increase with net growth but estab effects
0.00-0.30 -0.25 -0.20 -0.15 -0.10 -0.05 0.00 0.05 0.10 0.15 0.20 0.25 0.30
Net Growth Rate
• Vacancy rates still increase with net growth, but estab effects account for some of the key nonlinearities
Controlling for Establishment FE –Controlling for Establishment FE Pr(V(t–1) > 0) vs Net Growth
1.00P b bilit f V P ti
0.80
Probability of a Vacancy PostingProbability, controlling for estab. FE
0.40
0.60
0.20
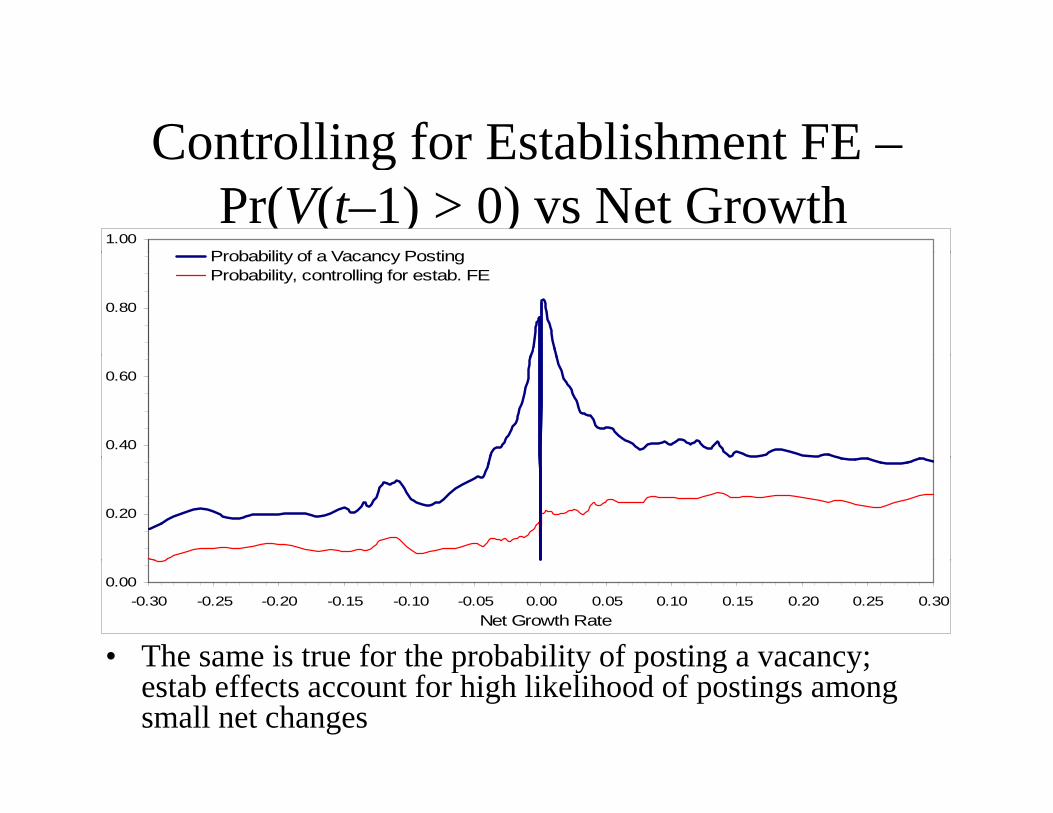
• The same is true for the probability of posting a vacancy;
0.00-0.30 -0.25 -0.20 -0.15 -0.10 -0.05 0.00 0.05 0.10 0.15 0.20 0.25 0.30
Net Growth Rate
The same is true for the probability of posting a vacancy; estab effects account for high likelihood of postings among small net changes

Controlling for Establishment FE –Controlling for Establishment FE Vacancy Yield vs Net Growth
6Hi V (f V i 0)
4
5
Hires per Vacancy (for Vacancies > 0)Hires per Vacancy, controlling for estab. FE
3
4
1
2
• Estab effects do not however account for the nonlinear
0-0.30 -0.25 -0.20 -0.15 -0.10 -0.05 0.00 0.05 0.10 0.15 0.20 0.25 0.30
Net Growth Rate
Estab effects do not, however, account for the nonlinear patters of the vacancy yield, and even exacerbates them among small net changes

Controlling for Establishment FE –Controlling for Establishment FE Hires and Separations vs Net Growth
0.35
0.25
0.30
Hiring RateSeparations RateHires, controlling for estab. FESeparations, controlling for estab. FE
0.15
0.20
0.05
0.10
• Estab effects have almost no effect on the patterns of
0.00-0.30 -0.25 -0.20 -0.15 -0.10 -0.05 0.00 0.05 0.10 0.15 0.20 0.25 0.30
Net Growth Rate
• Estab effects have almost no effect on the patterns of hires or separations

Controlling for Establishment FE –Controlling for Establishment FE Excess Worker Flows vs Net Growth
0.06E W k Fl R t
0 04
0.05
Excess Worker Flow RateExcess Flows, controlling for estab. FE
0.03
0.04
0.01
0.02
• But estab effects remove some of the nonlinearities of
0.00-0.30 -0.25 -0.20 -0.15 -0.10 -0.05 0.00 0.05 0.10 0.15 0.20 0.25 0.30
Net Growth Rate
…But estab effects remove some of the nonlinearities of excess churning; churning is now flat among contractions and increasing among expansions

Ke PointsKey Points• Vacancy and worker flow patterns exhibit robust• Vacancy and worker flow patterns exhibit robust
nonlinear relations to establishment growth
At thl f i tt t f d i f• At monthly frequencies, patterns stem from dynamics of a small share of establishments
i i d bl b h• Expansions, contractions, and stable estabs have fundamentally different vacancy and worker flow behavior– For expanders, churning rates and vacancy yields rise with net
growth rate– Contractions have generally constant rates of each– Stable estabs are exactly that: low-churn, low-search, low-yield,
etc.

Implications for Models of Labor pMarket Search & Matching
• The standard matching process cannot account for theThe standard matching process cannot account for the observed micro-level vacancy and worker flow patterns– Excess churning (and thus match efficiency) varies systematically
with firm growth– The vacancy yield also varies systematically with growth– Asymmetries exist in the patterns of vacancies and worker flows
between expanding and contracting firms
• Evidence suggests factors correlated with firm growth may affect the search process
Growth may act as a signal of success job security to searching– Growth may act as a signal of success, job security to searching workers
– Long-term successful firms may attract workers via a “reputation effect”
– Firms more successful/efficient in production may also be more efficient in labor market search

Topics for Further Thought &Topics for Further Thought & Research
• Estimate local and micro matching functions– Can we “rescue” standard matching specification by formally modeling
unmeasured vacancies?
• Explore vacancy and worker flow behavior in response to longer-term growth paths
• Robust nonlinear micro relationships + cross-sectional heterogeneity imply new way of thinking about the cyclical behavior of aggregate worker flows– See Davis, Faberman, & Haltiwanger (2005), Caballero-Engel (1992), , g ( ), g ( )
• Quit/layoff, hire/vacancy patterns raise questions about different types of labor search behavior
Expansion hiring vs Quit replacement hiring– Expansion hiring vs. Quit replacement hiring

Distributions of Vacancy PostingsDistributions of Vacancy Postings, Equal Establishment Weights
Distribution of Vacancy Postings across Establishments90
50
60
70
80
10
20
30
40
00 1 2 3 4 5 6 7 8 9 10 11 12 13 14 15 16 17 18 19 20 21 22 23 24 25
Distribution of Positve Vacancy Postings across Establishments
60
70
30
40
50
0
10
20
0 5 10 15 20 25

Pr(V(t–1) > 0) vs Net GrowthPr(V(t 1) > 0) vs Net Growth, Employment-Weighted
1.00
0.60
0.80
Probability of a Vacancy Posting, Employment-WeightedV UClMean = 0.535
0 00
0.20
0.40
0.00-0.30 -0.25 -0.20 -0.15 -0.10 -0.05 0.00 0.05 0.10 0.15 0.20 0.25 0.30
Net Growth Rate
0 80
1.00Probability of a Vacancy Posting, Employment-WeightedProbability, controlling for estab. FE
0.40
0.60
0.80
0.00
0.20
-0.30 -0.25 -0.20 -0.15 -0.10 -0.05 0.00 0.05 0.10 0.15 0.20 0.25 0.30Net Growth Rate

Vacancy Yield vs Net Growth, Including all Hires in a Growth
Kernel6Hires per Vacancy (for all within each kernel)Kernel
3
4
5
Hires per Vacancy (for all within each kernel)Mean = 1.35
1
2
3
0-0.30 -0.25 -0.20 -0.15 -0.10 -0.05 0.00 0.05 0.10 0.15 0.20 0.25 0.30
Net Growth Rate
5
6Hires per Vacancy (for all within each kernel)Hires per Vacancy, controlling for estab. FE
2
3
4
0
1
2
-0.30 -0.25 -0.20 -0.15 -0.10 -0.05 0.00 0.05 0.10 0.15 0.20 0.25 0.30Net Growth Rate
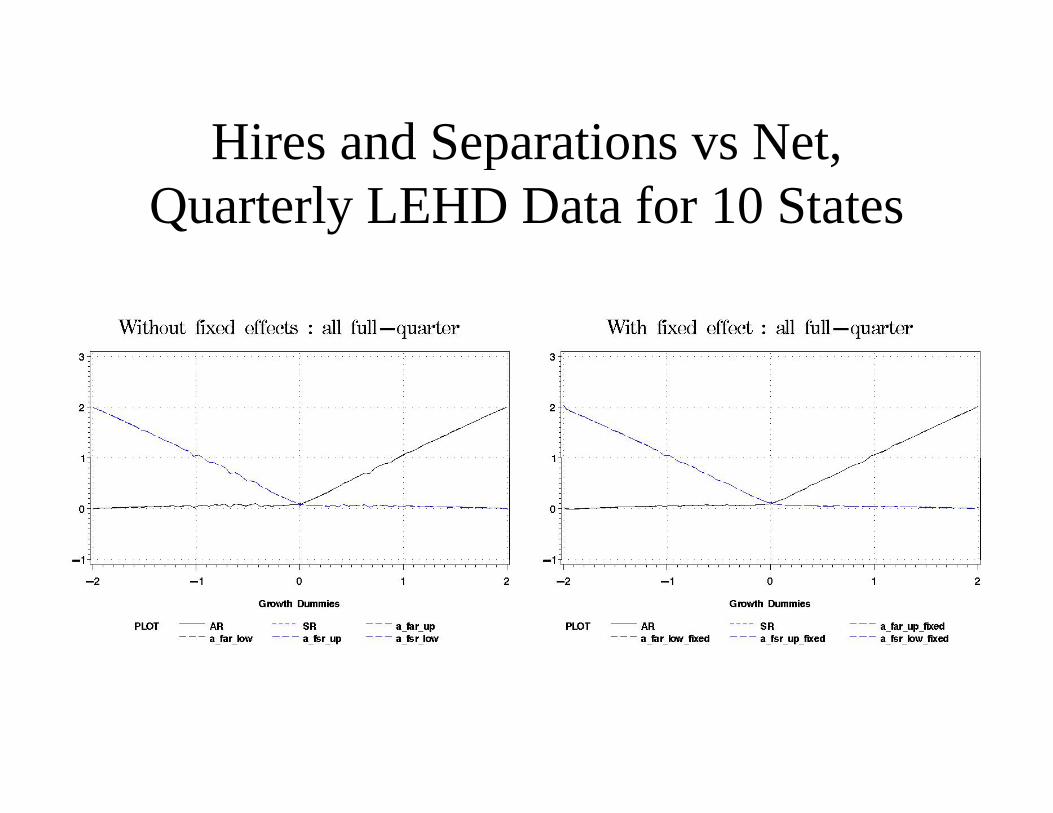
Hires and Separations vs NetHires and Separations vs Net,Quarterly LEHD Data for 10 States

Differences in Patterns byDifferences in Patterns by Establishment Size
Employees H/V Pr(V)Employees H S Q L XWF V Pr(V)
H/V(V>0)
Pr(V)(emp) H/V
0 to 9 3.4 3.1 1.7 1.2 1.1 1.5 0.05 0.4 0.08 1.710 to 49 4.0 3.9 2.2 1.4 1.9 1.9 0.21 0.8 0.25 1.8 50 to 249 3.9 3.6 2.0 1.4 2.1 2.3 0.50 1.5 0.54 1.5 250 to 999 3.0 2.7 1.5 1.1 1.7 2.5 0.78 2.2 0.80 1.11,000 to 4 999 2.0 1.9 1.0 0.6 1.3 2.7 0.90 2.4 0.92 0.74,999 5000 + 1.5 1.3 0.7 0.5 0.9 2.3 0.93 2.8 0.93 0.6

Differences in Patterns by IndustryIndustry
H S Q L XWF V P (V)H/V
(V 0)Pr(V)( ) H/VH S Q L XWF V Pr(V) (V>0) (emp) H/V
Resources 3.2 3.3 1.3 1.4 1.5 1.1 0.09 1.1 0.34 2.6 Construction 5.5 5.4 2.1 3.1 2.4 1.4 0.08 1.0 0.25 3.4 Manufacturing 2 3 2 6 1 2 1 2 1 2 1 4 0 16 1 2 0 54 1 5Manufacturing 2.3 2.6 1.2 1.2 1.2 1.4 0.16 1.2 0.54 1.5Transp., Utils., Wholesale, 2.6 2.6 1.3 1.1 1.3 1.6 0.10 0.8 0.46 1.5
Retail Trade 4.4 4.2 2.6 1.3 2.4 1.9 0.12 1.1 0.39 2.0 Information 2.1 2.3 1.3 0.8 1.1 2.0 0.17 0.8 0.62 1.0FIRE 2.3 2.2 1.3 0.6 1.1 2.1 0.09 0.7 0.50 1.0 Personal Serv. 4.3 3.8 2.0 1.6 2.2 3.0 0.11 1.0 0.57 1.3 Health & Ed 2 7 2 3 1 5 0 7 1 5 3 3 0 16 0 8 0 68 0 7Health & Ed. 2.7 2.3 1.5 0.7 1.5 3.3 0.16 0.8 0.68 0.7Leisure & Hosp. 6.2 5.9 3.9 1.8 3.4 2.9 0.18 1.2 0.45 1.9
Other Services 3.3 3.1 1.9 1.0 1.5 1.9 0.10 0.6 0.29 1.4 Government 1.5 1.2 0.6 0.4 0.7 1.8 0.24 1.0 0.74 0.8

Quits and Layoffs vs NetQuits and Layoffs vs Net,Controlling for Establishment FE
0.35
0.25
0.30
Quits RateLayoffs RateQuits, Controlling for estab. FELayoffs, controlling for estab. FE
0 15
0.20
0.25
0 05
0.10
0.15
0.00
0.05
-0.30 -0.25 -0.20 -0.15 -0.10 -0.05 0.00 0.05 0.10 0.15 0.20 0.25 0.30Net Growth Rate