cyclic voltammetry study of the host-guest …10.1038...performance summary of selected...
TRANSCRIPT
- 1 -
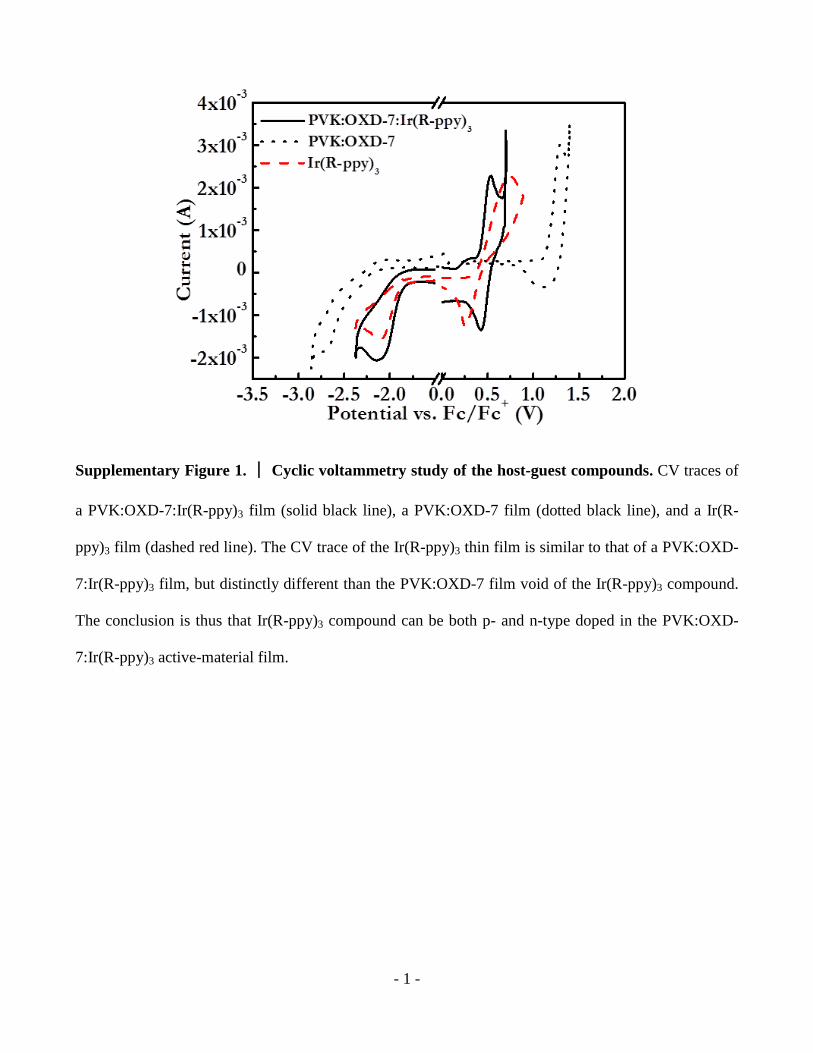
Supplementary Figure 1. │ Cyclic voltammetry study of the host-guest compounds. CV traces of
a PVK:OXD-7:Ir(R-ppy)3 film (solid black line), a PVK:OXD-7 film (dotted black line), and a Ir(R-
ppy)3 film (dashed red line). The CV trace of the Ir(R-ppy)3 thin film is similar to that of a PVK:OXD-
7:Ir(R-ppy)3 film, but distinctly different than the PVK:OXD-7 film void of the Ir(R-ppy)3 compound.
The conclusion is thus that Ir(R-ppy)3 compound can be both p- and n-type doped in the PVK:OXD-
7:Ir(R-ppy)3 active-material film.

- 2 -
Supplementary Figure 2. │ Electrochemical stability and doping capacity of the electrolytes. (a)
The electron-energy levels of the host compounds and the two electrolytes. (b-c) CV traces in the
cathodic regime for an OXD-7 film, using either (b) THABF4 or (c) TMPE-OH:LiCF3SO3 as the
electrolyte. (d-e) CV traces in the anodic regime for a PVK film, using either (d) THABF4 or (e)
TMPE-OH:LiCF3SO3 as the electrolyte. The electron-energy data show that the THABF4 ionic liquid,
but not the TMPE-OH:LiCF3SO3 electrolyte, displays a broad electrochemical stability window that
encompasses the p- and n-type doping potentials of the PVK and OXD-7 host compounds. The CV
data confirm this statement, since they show that is possible to electrochemically n-type dope OXD-7
and p-type dope PVK with THABF4, but not with TMPE-OH:LiCF3SO3, as the supporting electrolyte.
- 3 -
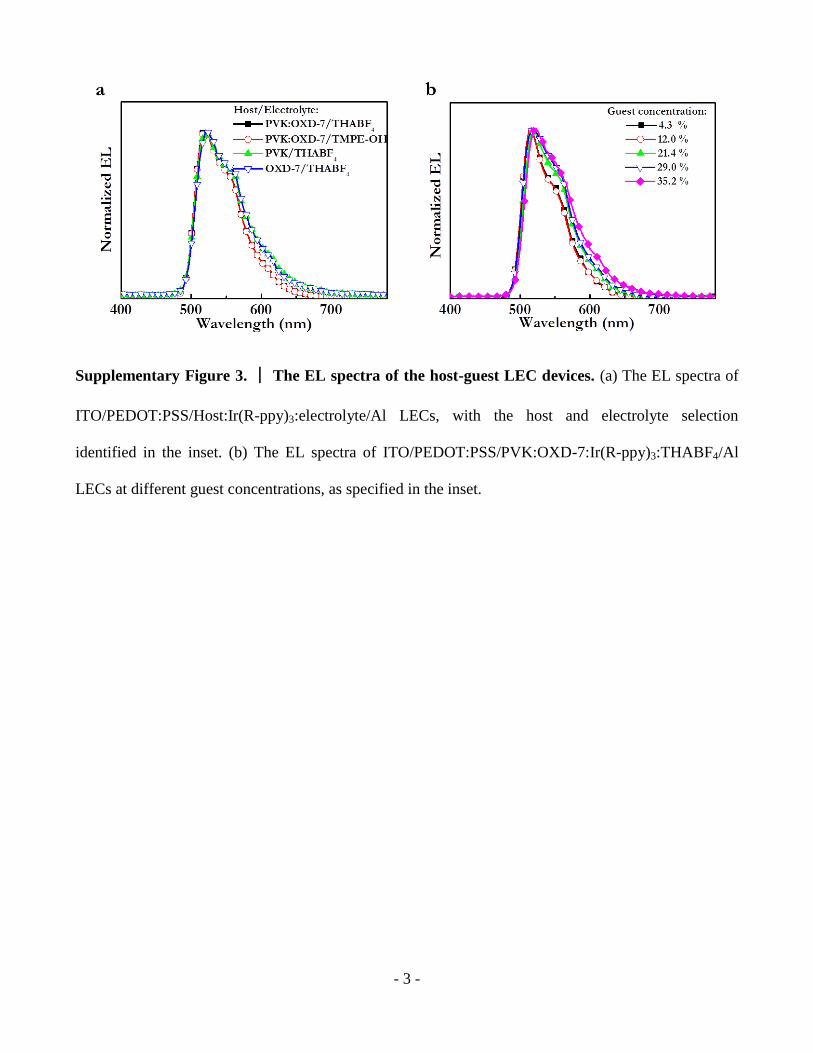
Supplementary Figure 3. │ The EL spectra of the host-guest LEC devices. (a) The EL spectra of
ITO/PEDOT:PSS/Host:Ir(R-ppy)3:electrolyte/Al LECs, with the host and electrolyte selection
identified in the inset. (b) The EL spectra of ITO/PEDOT:PSS/PVK:OXD-7:Ir(R-ppy)3:THABF4/Al
LECs at different guest concentrations, as specified in the inset.
- 4 -
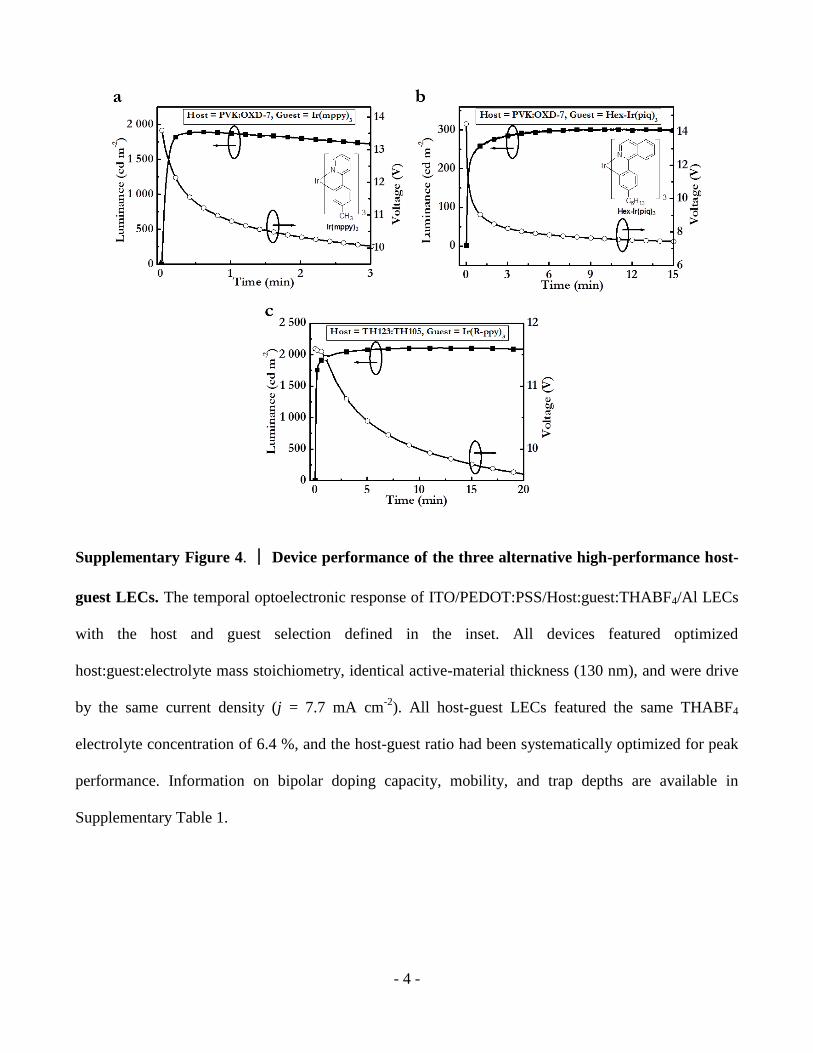
Supplementary Figure 4. │ Device performance of the three alternative high-performance host-
guest LECs. The temporal optoelectronic response of ITO/PEDOT:PSS/Host:guest:THABF4/Al LECs
with the host and guest selection defined in the inset. All devices featured optimized
host:guest:electrolyte mass stoichiometry, identical active-material thickness (130 nm), and were drive
by the same current density (j = 7.7 mA cm-2
). All host-guest LECs featured the same THABF4
electrolyte concentration of 6.4 %, and the host-guest ratio had been systematically optimized for peak
performance. Information on bipolar doping capacity, mobility, and trap depths are available in
Supplementary Table 1.
- 5 -
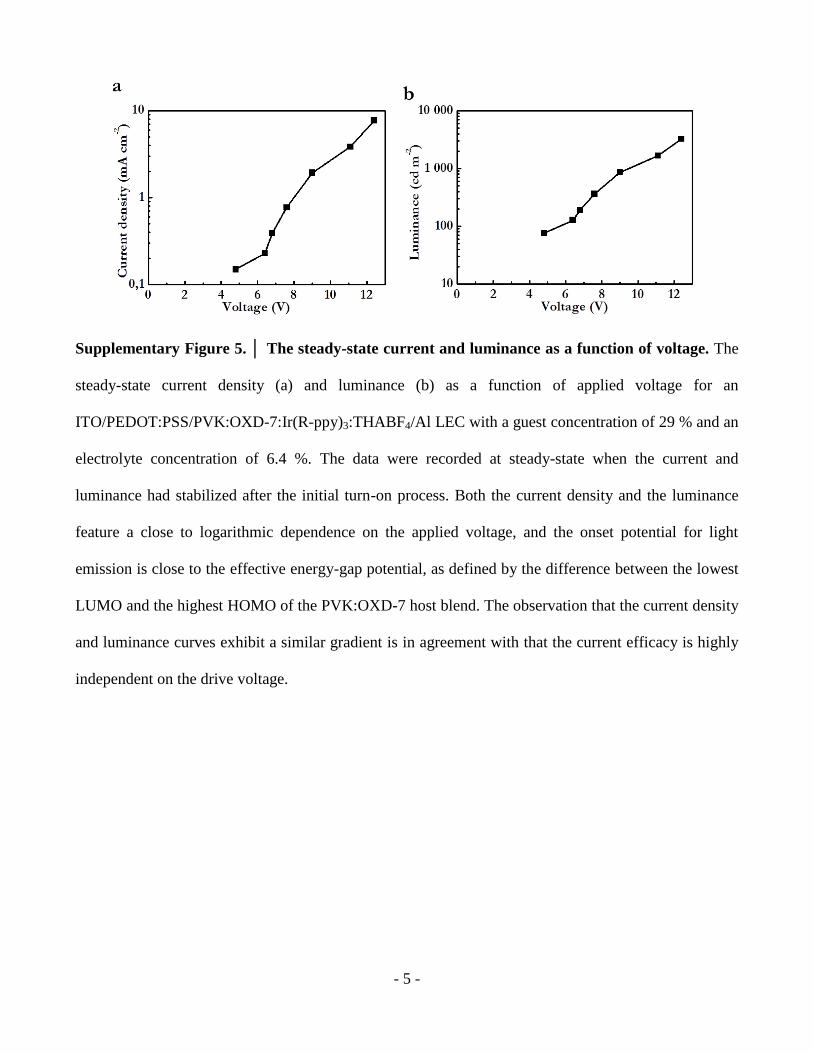
Supplementary Figure 5. │ The steady-state current and luminance as a function of voltage. The
steady-state current density (a) and luminance (b) as a function of applied voltage for an
ITO/PEDOT:PSS/PVK:OXD-7:Ir(R-ppy)3:THABF4/Al LEC with a guest concentration of 29 % and an
electrolyte concentration of 6.4 %. The data were recorded at steady-state when the current and
luminance had stabilized after the initial turn-on process. Both the current density and the luminance
feature a close to logarithmic dependence on the applied voltage, and the onset potential for light
emission is close to the effective energy-gap potential, as defined by the difference between the lowest
LUMO and the highest HOMO of the PVK:OXD-7 host blend. The observation that the current density
and luminance curves exhibit a similar gradient is in agreement with that the current efficacy is highly
independent on the drive voltage.
- 6 -
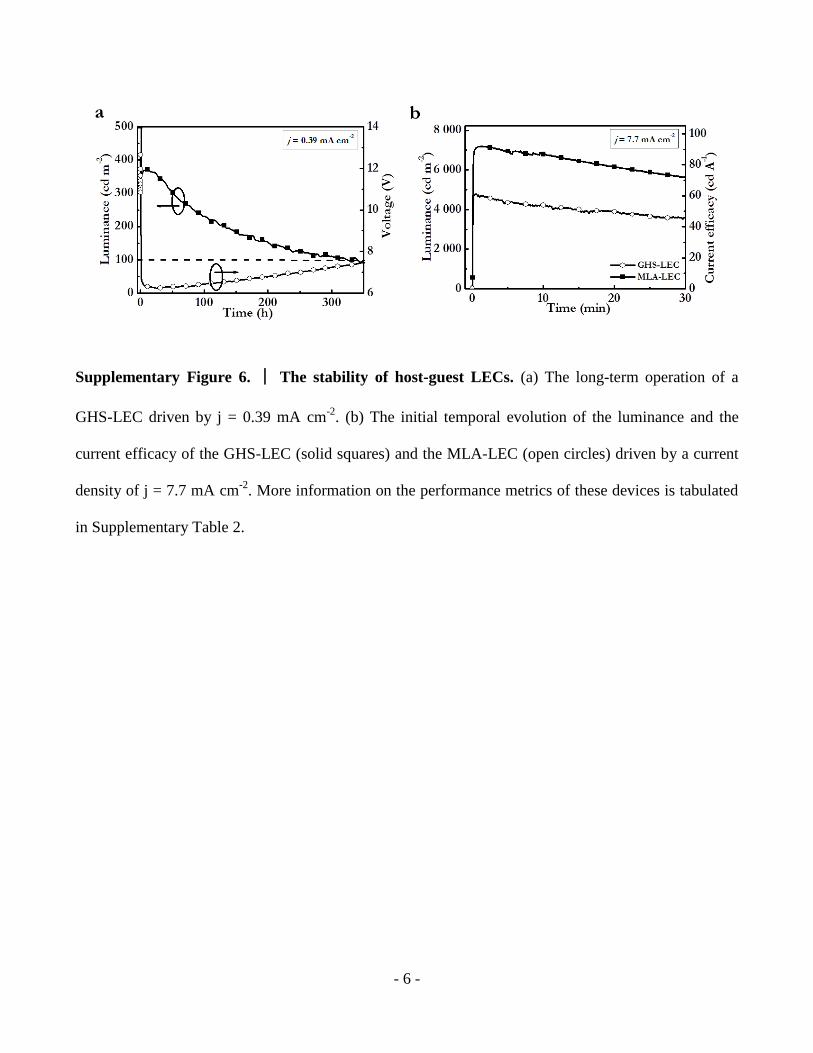
Supplementary Figure 6. │ The stability of host-guest LECs. (a) The long-term operation of a
GHS-LEC driven by j = 0.39 mA cm-2
. (b) The initial temporal evolution of the luminance and the
current efficacy of the GHS-LEC (solid squares) and the MLA-LEC (open circles) driven by a current
density of j = 7.7 mA cm-2
. More information on the performance metrics of these devices is tabulated
in Supplementary Table 2.
- 7 -
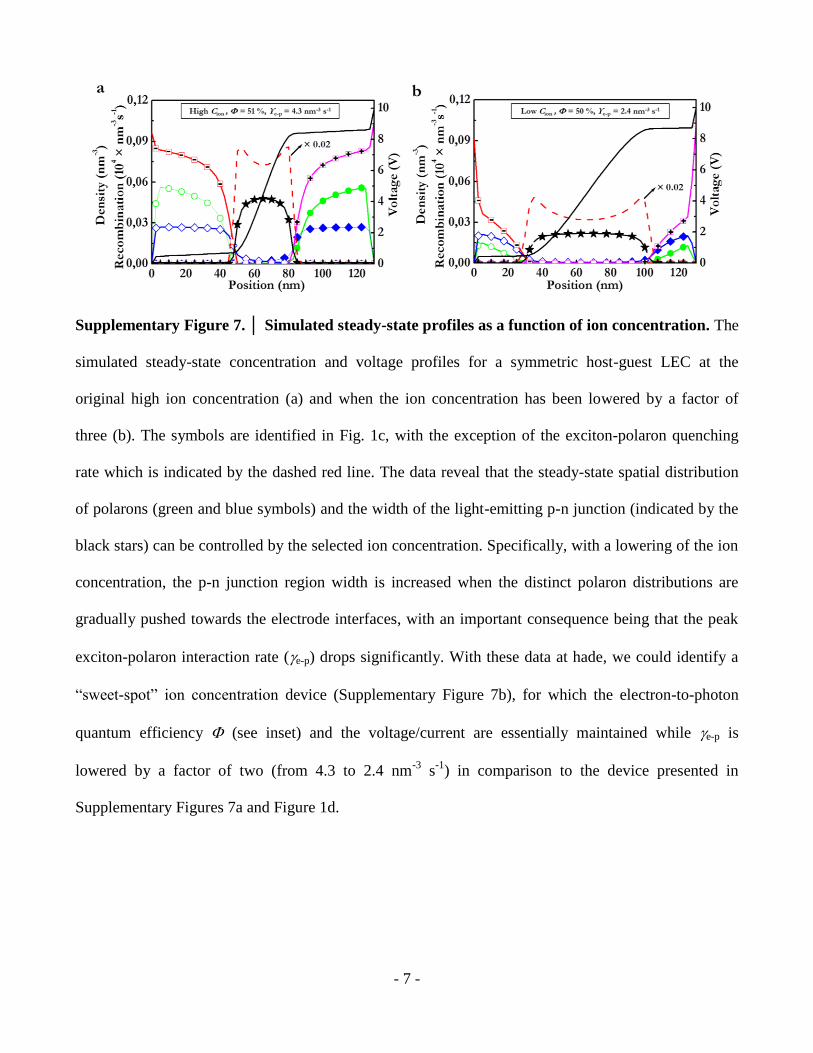
Supplementary Figure 7. │ Simulated steady-state profiles as a function of ion concentration. The
simulated steady-state concentration and voltage profiles for a symmetric host-guest LEC at the
original high ion concentration (a) and when the ion concentration has been lowered by a factor of
three (b). The symbols are identified in Fig. 1c, with the exception of the exciton-polaron quenching
rate which is indicated by the dashed red line. The data reveal that the steady-state spatial distribution
of polarons (green and blue symbols) and the width of the light-emitting p-n junction (indicated by the
black stars) can be controlled by the selected ion concentration. Specifically, with a lowering of the ion
concentration, the p-n junction region width is increased when the distinct polaron distributions are
gradually pushed towards the electrode interfaces, with an important consequence being that the peak
exciton-polaron interaction rate (e-p) drops significantly. With these data at hade, we could identify a
“sweet-spot” ion concentration device (Supplementary Figure 7b), for which the electron-to-photon
quantum efficiency (see inset) and the voltage/current are essentially maintained while e-p is
lowered by a factor of two (from 4.3 to 2.4 nm-3
s-1
) in comparison to the device presented in
Supplementary Figures 7a and Figure 1d.
- 8 -
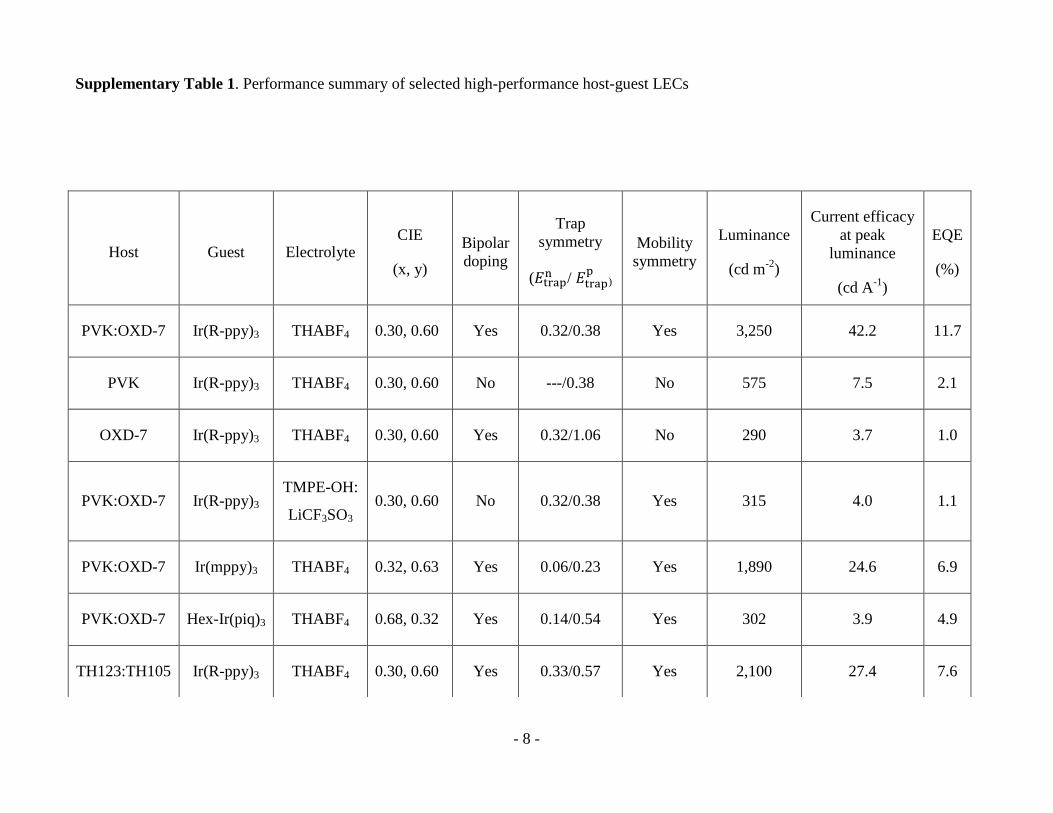
Supplementary Table 1. Performance summary of selected high-performance host-guest LECs
Host Guest Electrolyte CIE
(x, y)
Bipolar
doping
Trap
symmetry
( /
)
Mobility
symmetry
Luminance
(cd m-2
)
Current efficacy
at peak
luminance
(cd A-1
)
EQE
(%)
PVK:OXD-7 Ir(R-ppy)3 THABF4 0.30, 0.60 Yes 0.32/0.38 Yes 3,250 42.2 11.7
PVK Ir(R-ppy)3 THABF4 0.30, 0.60 No ---/0.38 No 575 7.5 2.1
OXD-7 Ir(R-ppy)3 THABF4 0.30, 0.60 Yes 0.32/1.06 No 290 3.7 1.0
PVK:OXD-7 Ir(R-ppy)3 TMPE-OH:
LiCF3SO3 0.30, 0.60 No 0.32/0.38 Yes 315 4.0 1.1
PVK:OXD-7 Ir(mppy)3 THABF4 0.32, 0.63 Yes 0.06/0.23 Yes 1,890 24.6 6.9
PVK:OXD-7 Hex-Ir(piq)3 THABF4 0.68, 0.32 Yes 0.14/0.54 Yes 302 3.9 4.9
TH123:TH105 Ir(R-ppy)3 THABF4 0.30, 0.60 Yes 0.33/0.57 Yes 2,100 27.4 7.6
- 9 -
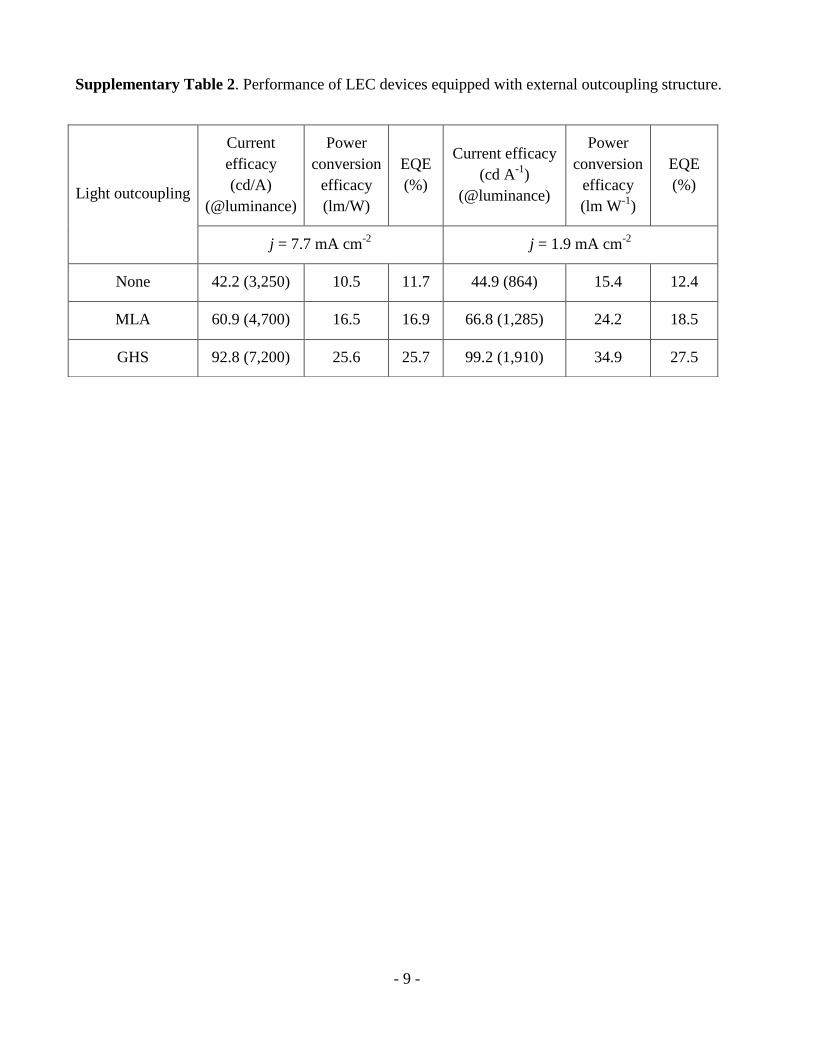
Supplementary Table 2. Performance of LEC devices equipped with external outcoupling structure.
Light outcoupling
Current
efficacy
(cd/A)
(@luminance)
Power
conversion
efficacy
(lm/W)
EQE
(%)
Current efficacy
(cd A-1
)
(@luminance)
Power
conversion
efficacy
(lm W-1
)
EQE
(%)
j = 7.7 mA cm-2
j = 1.9 mA cm-2
None 42.2 (3,250) 10.5 11.7 44.9 (864) 15.4 12.4
MLA 60.9 (4,700) 16.5 16.9 66.8 (1,285) 24.2 18.5
GHS 92.8 (7,200) 25.6 25.7 99.2 (1,910) 34.9 27.5
- 10 -
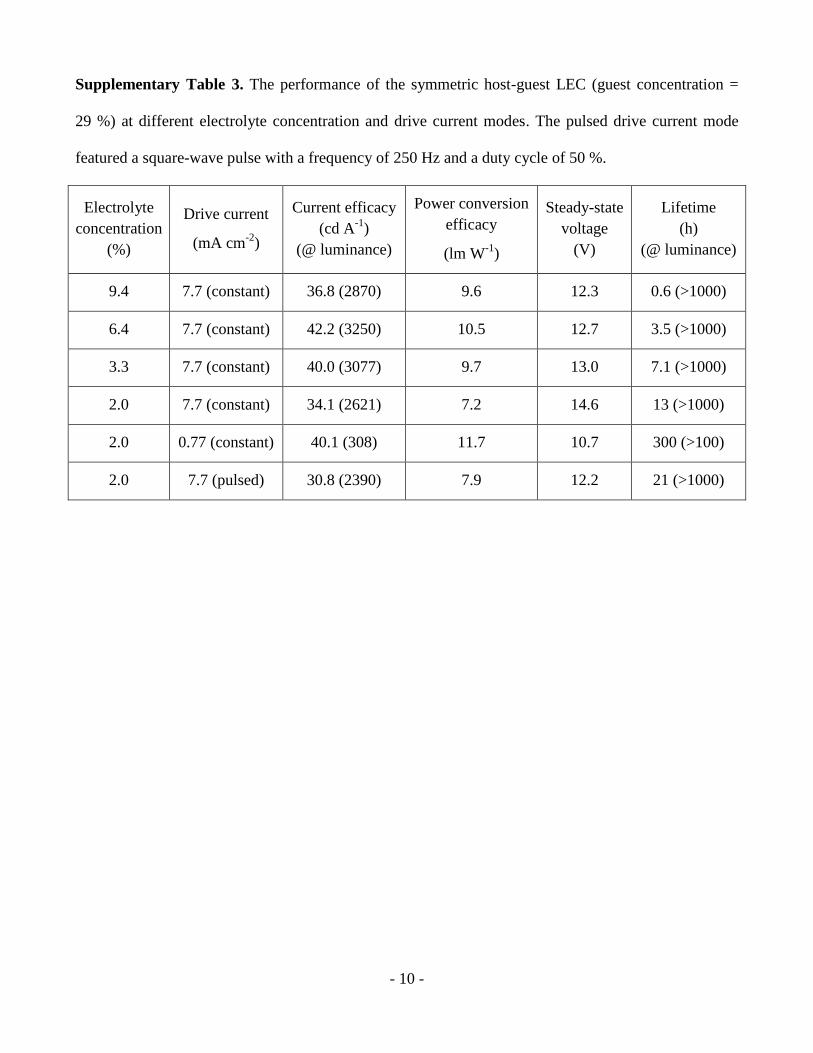
Supplementary Table 3. The performance of the symmetric host-guest LEC (guest concentration =
29 %) at different electrolyte concentration and drive current modes. The pulsed drive current mode
featured a square-wave pulse with a frequency of 250 Hz and a duty cycle of 50 %.
Electrolyte
concentration
(%)
Drive current
(mA cm-2
)
Current efficacy
(cd A-1
)
(@ luminance)
Power conversion
efficacy
(lm W-1
)
Steady-state
voltage
(V)
Lifetime
(h)
(@ luminance)
9.4 7.7 (constant) 36.8 (2870) 9.6 12.3 0.6 (>1000)
6.4 7.7 (constant) 42.2 (3250) 10.5 12.7 3.5 (>1000)
3.3 7.7 (constant) 40.0 (3077) 9.7 13.0 7.1 (>1000)
2.0 7.7 (constant) 34.1 (2621) 7.2 14.6 13 (>1000)
2.0 0.77 (constant) 40.1 (308) 11.7 10.7 300 (>100)
2.0 7.7 (pulsed) 30.8 (2390) 7.9 12.2 21 (>1000)
- 11 -
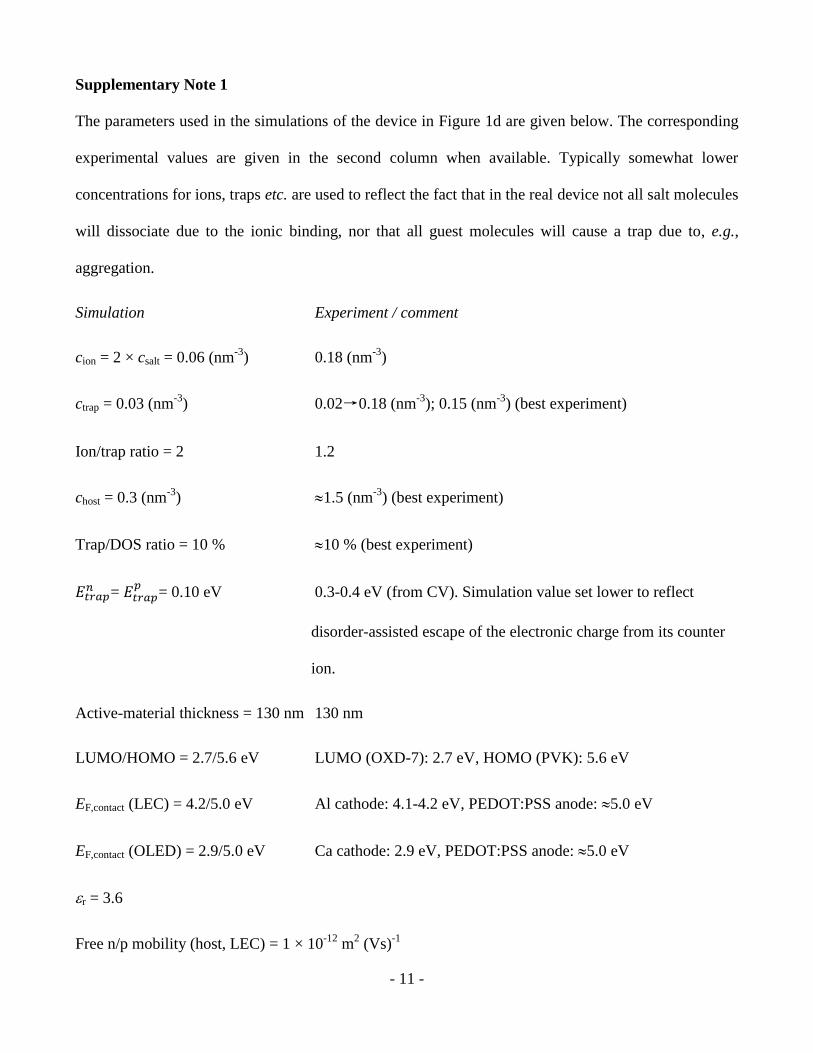
Supplementary Note 1
The parameters used in the simulations of the device in Figure 1d are given below. The corresponding
experimental values are given in the second column when available. Typically somewhat lower
concentrations for ions, traps etc. are used to reflect the fact that in the real device not all salt molecules
will dissociate due to the ionic binding, nor that all guest molecules will cause a trap due to, e.g.,
aggregation.
Simulation Experiment / comment
cion = 2 × csalt = 0.06 (nm-3
) 0.18 (nm-3
)
ctrap = 0.03 (nm-3
) 0.02→0.18 (nm-3
); 0.15 (nm-3
) (best experiment)
Ion/trap ratio = 2 1.2
chost = 0.3 (nm-3
) 1.5 (nm-3
) (best experiment)
Trap/DOS ratio = 10 % 10 % (best experiment)
=
= 0.10 eV 0.3-0.4 eV (from CV). Simulation value set lower to reflect
disorder-assisted escape of the electronic charge from its counter
ion.
Active-material thickness = 130 nm 130 nm
LUMO/HOMO = 2.7/5.6 eV LUMO (OXD-7): 2.7 eV, HOMO (PVK): 5.6 eV
EF,contact (LEC) = 4.2/5.0 eV Al cathode: 4.1-4.2 eV, PEDOT:PSS anode: 5.0 eV
EF,contact (OLED) = 2.9/5.0 eV Ca cathode: 2.9 eV, PEDOT:PSS anode: 5.0 eV
r = 3.6
Free n/p mobility (host, LEC) = 1 × 10-12
m2 (Vs)
-1
- 12 -
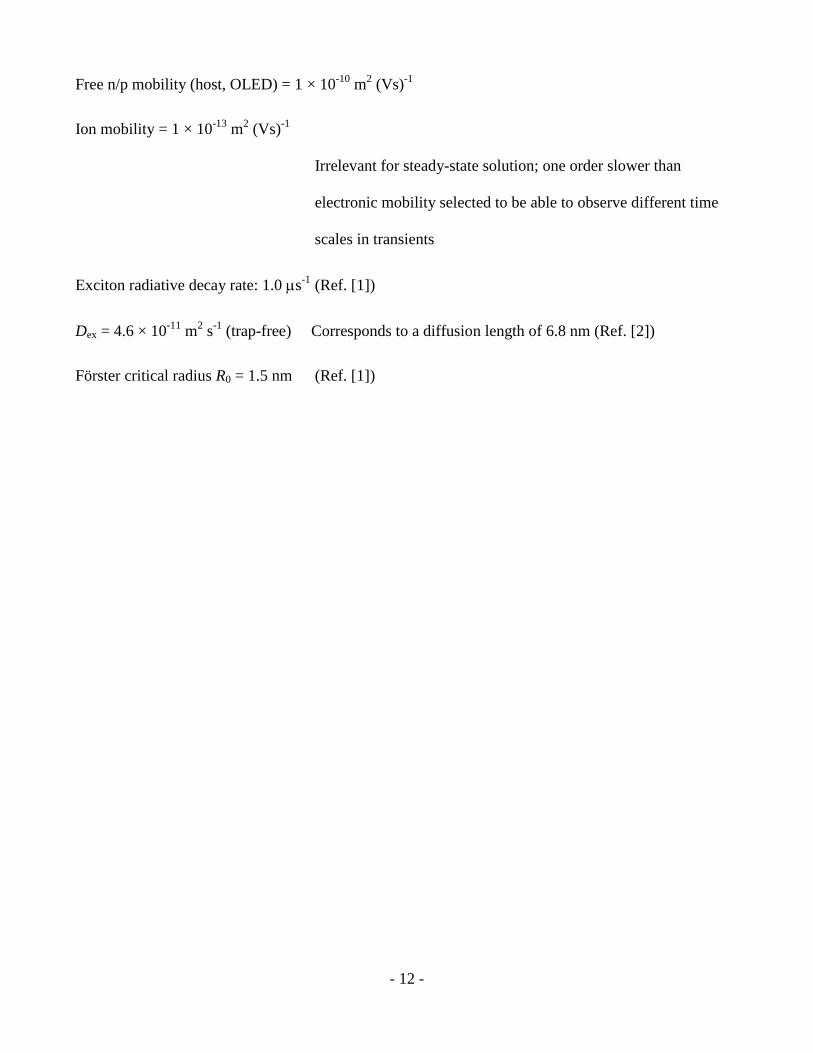
Free n/p mobility (host, OLED) = 1 × 10⁻¹⁰
m2 (Vs)
-1
Ion mobility = 1 × 10-13
m2 (Vs)
-1
Irrelevant for steady-state solution; one order slower than
electronic mobility selected to be able to observe different time
scales in transients
Exciton radiative decay rate: 1.0 s-1
(Ref. [1])
Dex = 4.6 × 10⁻¹¹
m2 s
-1 (trap-free) Corresponds to a diffusion length of 6.8 nm (Ref. [2])
Förster critical radius R0 = 1.5 nm (Ref. [1])

- 13 -
Supplementary References
1. Mesta M, et al. Molecular-scale simulation of electroluminescence in a multilayer white organic
light-emitting diode. Nat. Mater. 12, 652-658 (2013).
2. van Reenen S, Janssen RAJ, Kemerink M. Fundamental Tradeoff between Emission Intensity
and Efficiency in Light-Emitting Electrochemical Cells. Adv. Funct. Mater. 25, 3066-3073
(2015).