cyber survey: understanding the level of cyberethics, safety and security awareness of middle school...
TRANSCRIPT

Cyber Survey: Understanding the Level of Cyberethics, Safety and Security Awareness of Middle
School Students
Brianna MentleHoward County Public School System,
Maryland
1
This study examined the level of Cyberethics, Cybersafety and Cybersecurity Awareness of middle school students.
2

Conducted Surveys Consisting of:
• Paper Based Survey with 31 questions• One Middle School• 143 Students • 75 Male/68 Female• 42 in 6th Grade, 52 in 7th Grade, and 49 in 8th
Grade• 74 in On-Grade Level English, 69 in GT English
3

4

5

6
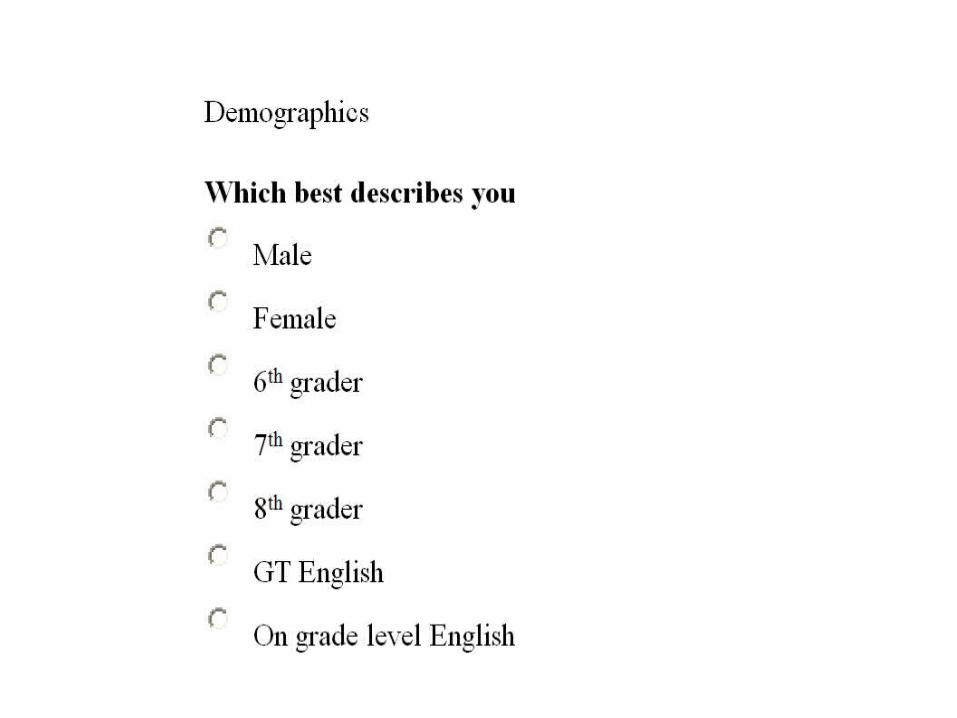
Demographics page
7

How much do you know about…
8

How much do you know about....(mean)
00.5
11.5
22.5
3
Topic
Rat
ing
Sca
le
Overall
6th
7th
8th
0=Not At All
1=Not Much
2=Some
3= A Lot

Computers Overall
Not at all= 0 Not much=1 Some=2 A lot=3
Overall 6th 7th 8th Male Female
0 3.5% 0.0% 7.8% 2.0% 5.4% 1.5%1 6.3% 2.4% 7.8% 8.2% 6.8% 5.9%2 52.1% 50.0% 60.8% 44.9% 44.6% 60.3%3 38.0% 47.6% 23.5% 44.9% 43.2% 32.4%Mean 2.25 2.45 2.00 2.33 2.26 2.24Std Dev 0.73 0.55 0.80 0.72 0.81 0.63
GT Regular
0 2.9% 4.1%1 7.2% 5.5%2 50.7% 53.4%3 39.1% 37.0%Mean 2.26 2.23Std Dev 0.72 0.74 10

Cyberbullying?Overall 6th 7th 8th Male Female
0 4.2% 0.0% 3.8% 8.2% 8.0% 0.0%1 8.4% 4.8% 9.6% 10.2% 5.3% 11.8%2 53.1% 50.0% 57.7% 51.0% 46.7% 60.3%3 34.3% 45.2% 28.8% 30.6% 40.0% 27.9%Mean 2.17 2.40 2.12 2.04 2.19 2.16Std Dev 0.75 0.59 0.73 0.87 0.87 0.61
Not at all= 0 Not much=1 Some=2 A lot=3
GT Regular
0 2.9% 5.4%1 7.2% 9.5%2 58.0% 48.6%3 31.9% 36.5%Mean 2.19 2.16Std Dev 0.69 0.81 11

Sexting
Not at all= 0 Not much=1 Some=2 A lot=3
Overall 6th 7th 8th Male Female
0 18.3% 35.7% 15.4% 6.3% 13.3% 23.9%1 22.5% 23.8% 19.2% 25.0% 18.7% 26.9%2 38.7% 23.8% 40.4% 50.0% 42.7% 34.3%3 20.4% 16.7% 25.0% 18.8% 25.3% 14.9%Mean 1.83 1.21 1.75 2.43 1.80 1.85Std Dev 2.73 1.12 1.01 4.39 0.97 3.84
GT Regular
0 13.2% 23.0%1 22.1% 23.0%2 42.6% 35.1%3 22.1% 18.9%Mean 2.17 1.50Std Dev 3.76 1.05 12

Identity Theft
Not at all= 0 Not much=1 Some=2 A lot=3
Overall 6th 7th 8th Male Female
0 12.6% 11.9% 15.4% 10.2% 9.3% 16.2%1 30.8% 21.4% 30.8% 38.8% 29.3% 32.4%2 35.7% 45.2% 30.8% 32.7% 33.3% 38.2%3 21.0% 21.4% 23.1% 18.4% 28.0% 13.2%Mean 1.65 1.76 1.62 1.59 1.80 1.49Std Dev 0.95 0.93 1.01 0.91 0.96 0.92
GT Regular
0 8.7% 16.2%1 31.9% 29.7%2 40.6% 31.1%3 18.8% 23.0%Mean 1.70 1.61Std Dev 0.88 1.02 13
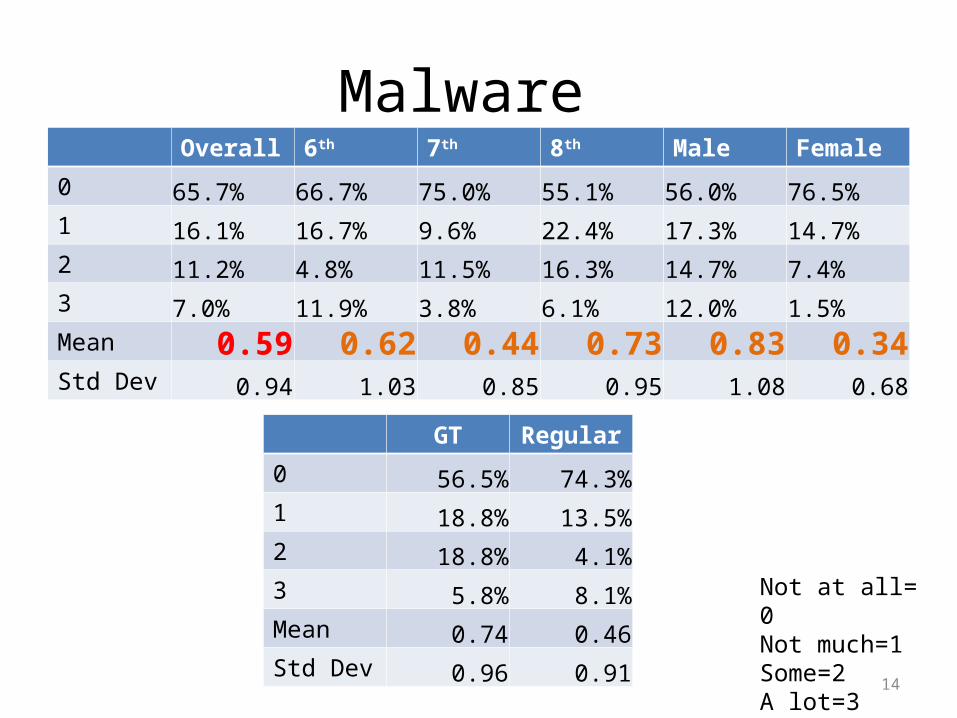
Malware
Not at all= 0 Not much=1 Some=2 A lot=3
Overall 6th 7th 8th Male Female
0 65.7% 66.7% 75.0% 55.1% 56.0% 76.5%1 16.1% 16.7% 9.6% 22.4% 17.3% 14.7%2 11.2% 4.8% 11.5% 16.3% 14.7% 7.4%3 7.0% 11.9% 3.8% 6.1% 12.0% 1.5%Mean 0.59 0.62 0.44 0.73 0.83 0.34Std Dev 0.94 1.03 0.85 0.95 1.08 0.68
GT Regular
0 56.5% 74.3%1 18.8% 13.5%2 18.8% 4.1%3 5.8% 8.1%Mean 0.74 0.46Std Dev 0.96 0.91 14

How significant a role have these played in teaching you about C3
15

How Significant a Role Have These Played in Teaching You About Cyberethics, Safety and
Security Topics?
0
0.51
1.5
2T
.V.
& N
ews
Par
ent
Con
vers
atio
ns
Sib
lings
Sch
ool C
lass
Wor
k
Sch
ool
Ass
embl
ies
Pee
rs/F
riend
s
Topics
Rat
ing
Sca
le
Overall
6th
7th
8th
0=Not At All
1=Not Much
2=Some
3= A Lot

Parents
Not at all= 0 Not much=1 Some=2 A lot=3
Overall 6th 7th 8th Male Female
0 14.1% 11.9% 17.6% 12.2% 13.5% 14.7%1 36.6% 42.9% 27.5% 40.8% 32.4% 41.2%2 35.2% 31.0% 37.3% 36.7% 35.1% 35.3%3 14.1% 14.3% 17.6% 10.2% 18.9% 8.8%Mean 1.49 1.48 1.55 1.45 1.59 1.38Std Dev 0.91 0.89 0.99 0.84 0.95 0.85
GT Regular
0 14.5% 13.7%1 34.8% 38.4%2 40.6% 30.1%3 10.1% 17.8%Mean 1.46 1.52Std Dev 0.87 0.94 17

TV and News
Not at all= 0 Not much=1 Some=2 A lot=3
Overall 6th 7th 8th Male Female
0 14.0% 16.7% 11.5% 14.3% 16.0% 11.8%1 36.4% 47.6% 44.2% 18.4% 40.0% 32.4%2 38.5% 23.8% 40.4% 49.0% 30.7% 47.1%3 11.2% 11.9% 3.8% 18.4% 13.3% 8.8%Mean 1.47 1.31 1.37 1.71 1.41 1.53Std Dev 0.87 0.90 0.74 0.94 0.92 0.82
GT Regular
0 11.6% 16.2%1 37.7% 35.1%2 37.7% 39.2%3 13.0% 9.5%Mean 1.52 1.42Std Dev 0.87 0.88 18

Class Work
Not at all= 0 Not much=1 Some=2 A lot=3
Overall 6th 7th 8th Male Female
0 21.7% 4.8% 26.9% 30.6% 25.3% 17.6%1 32.2% 26.2% 34.6% 34.7% 29.3% 35.3%2 37.1% 52.4% 26.9% 34.7% 36.0% 38.2%3 9.1% 16.7% 11.5% 0.0% 9.3% 8.8%Mean 1.34 1.81 1.23 1.04 1.29 1.38Std Dev 0.92 0.77 0.98 0.82 0.96 0.88
GT Regular
0 26.1% 17.6%1 34.8% 29.7%2 36.2% 37.8%3 2.9% 14.9%Mean 1.16 1.50Std Dev 0.85 0.95 19

School Assemblies
Not at all= 0 Not much=1 Some=2 A lot=3
Overall 6th 7th 8th Male Female
0 28.0% 31.0% 15.4% 38.8% 30.7% 25.0%1 27.3% 21.4% 28.8% 30.6% 28.0% 26.5%2 32.2% 28.6% 42.3% 24.5% 30.7% 33.8%3 12.6% 19.0% 13.5% 6.1% 10.7% 14.7%Mean 1.29 1.36 1.54 0.98 1.21 1.38Std Dev 1.01 1.12 0.92 0.95 1.00 1.02
GT Regular
0 23.2% 32.4%1 24.6% 29.7%2 40.6% 24.3%3 11.6% 13.5%Mean 1.41 1.19Std Dev 0.97 1.04 20

Peers
Not at all= 0 Not much=1 Some=2 A lot=3
Overall 6th 7th 8th Male Female
0 33.6% 28.6% 40.4% 30.6% 42.7% 23.5%1 37.8% 45.2% 38.5% 30.6% 26.7% 50.0%2 22.4% 16.7% 19.2% 30.6% 22.7% 22.1%3 6.3% 9.5% 1.9% 8.2% 8.0% 4.4%Mean 1.01 1.07 0.83 1.16 0.96 1.07Std Dev 0.90 0.92 0.81 0.96 0.99 0.80
GT Regular
0 29.0% 37.8%1 42.0% 33.8%2 26.1% 18.9%3 2.9% 9.5%Mean 1.03 1.00Std Dev 0.82 0.98 21

Siblings
Not at all= 0 Not much=1 Some=2 A lot=3
Overall 6th 7th 8th Male Female
0 55.2% 42.9% 63.5% 57.1% 58.7% 51.5%1 25.2% 33.3% 25.0% 18.4% 21.3% 29.4%2 14.7% 14.3% 11.5% 18.4% 14.7% 14.7%3 4.9% 9.5% 0.0% 6.1% 5.3% 4.4%Mean 0.69 0.90 0.48 0.73 0.67 0.72Std Dev 0.90 0.98 0.70 0.97 0.92 0.88
GT Regular
0 53.6% 56.8%1 30.4% 20.3%2 14.5% 14.9%3 1.4% 8.1%Mean 0.64 0.74Std Dev 0.79 0.99 22

My school promotes correct student use of computers and the internet
by
23

My School Promotes Correct Student Use of Computers and the Internet by...
0
0.5
1
1.5
2
2.5
Has a Policy RequiresCyberethicsbe Taught in
School
RequiresWhat to do
aboutCyberbullyingbe Taught in
School
RequiresWhat to do
About Sextingbe Taught in
school
RequiresWhat to do
AboutMalware be
Taught inschool
RequiresWhat to do
About IdentityTheft beTaught in
school
Topics
Ra
rtin
g S
ca
le Overall
6th
7th
8th
0=Not At All
1=Not Much
2=Some
3= A Lot

Policy/student Handbook
Not at all= 0 Not much=1 Some=2 A lot=3
Overall 6th 7th 8th Male Female
0 2.9% 2.4% 5.8% 0.0% 4.2% 1.5%1 14.3% 22.0% 11.5% 10.6% 16.7% 11.8%2 48.6% 46.3% 51.9% 46.8% 43.1% 54.4%3 34.3% 29.3% 30.8% 42.6% 36.1% 32.4%Mean 2.14 2.02 2.08 2.32 2.11 2.18Std Dev 0.76 0.79 0.81 0.66 0.83 0.69
GT Regular
0 1.5% 4.2%1 13.2% 15.3%2 47.1% 50.0%3 38.2% 30.6%Mean 2.22 2.07Std Dev 0.73 0.79 25

Teaching what to do about cyberbullying
Not at all= 0 Not much=1 Some=2 A lot=3
Overall 6th 7th 8th Male Female
0 11.5% 7.3% 3.9% 23.4% 16.7% 6.0%1 24.5% 22.0% 33.3% 17.0% 22.2% 26.9%2 36.7% 34.1% 39.2% 36.2% 37.5% 35.8%3 27.3% 36.6% 23.5% 23.4% 23.6% 31.3%Mean 1.80 2.00 1.82 1.60 1.68 1.93Std Dev 0.97 0.95 0.84 1.10 1.02 0.91
GT Regular
0 9.0% 13.9%1 28.4% 20.8%2 40.3% 33.3%3 22.4% 31.9%Mean 1.76 1.83Std Dev 0.91 1.03 26
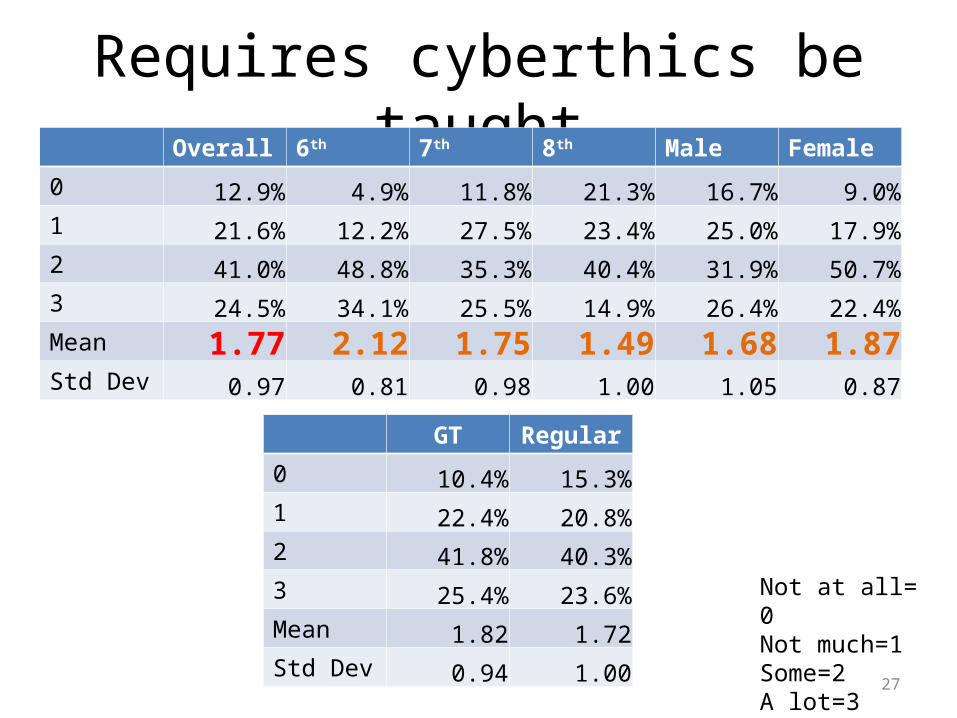
Requires cyberthics be taught
Not at all= 0 Not much=1 Some=2 A lot=3
Overall 6th 7th 8th Male Female
0 12.9% 4.9% 11.8% 21.3% 16.7% 9.0%1 21.6% 12.2% 27.5% 23.4% 25.0% 17.9%2 41.0% 48.8% 35.3% 40.4% 31.9% 50.7%3 24.5% 34.1% 25.5% 14.9% 26.4% 22.4%Mean 1.77 2.12 1.75 1.49 1.68 1.87Std Dev 0.97 0.81 0.98 1.00 1.05 0.87
GT Regular
0 10.4% 15.3%1 22.4% 20.8%2 41.8% 40.3%3 25.4% 23.6%Mean 1.82 1.72Std Dev 0.94 1.00 27

Identity theft be taught
Not at all= 0 Not much=1 Some=2 A lot=3
Overall 6th 7th 8th Male Female
0 53.2% 48.8% 52.9% 57.4% 58.3% 47.8%1 30.2% 31.7% 27.5% 31.9% 25.0% 35.8%2 15.1% 17.1% 19.6% 8.5% 13.9% 16.4%3 1.4% 2.4% 0.0% 2.1% 2.8% 0.0%
Mean 0.65 0.73 0.67 0.55 0.61 0.69Std Dev 0.79 0.84 0.79 0.75 0.83 0.74
GT Regular
0 55.2% 51.4%1 32.8% 27.8%2 11.9% 18.1%3 0.0% 2.8%Mean 0.57 0.72Std Dev 0.70 0.86 28

Requires the topic of sexting be covered in school
Not at all= 0 Not much=1 Some=2 A lot=3
Overall 6th 7th 8th Male Female
0 56.8% 51.2% 52.9% 66.0% 56.9% 56.7%1 28.1% 29.3% 37.3% 17.0% 23.6% 32.8%2 10.1% 14.6% 7.8% 8.5% 11.1% 9.0%3 5.0% 4.9% 2.0% 8.5% 8.3% 1.5%Mean 0.63 0.73 0.59 0.60 0.71 0.55Std Dev 0.86 0.90 0.73 0.97 0.97 0.72
GT Regular
0 62.7% 51.4%1 28.4% 27.8%2 6.0% 13.9%3 3.0% 6.9%Mean 0.49 0.76Std Dev 0.75 0.94 29

Malware be taught
Not at all= 0 Not much=1 Some=2 A lot=3
Overall 6th 7th 8th Male Female
0 71.9% 75.6% 58.8% 83.0% 65.3% 79.1%1 19.4% 12.2% 31.4% 12.8% 25.0% 13.4%2 6.5% 9.8% 7.8% 2.1% 5.6% 7.5%3 2.2% 2.4% 2.0% 2.1% 4.2% 0.0%Mean 0.39 0.39 0.53 0.23 0.49 0.28Std Dev 0.71 0.77 0.73 0.60 0.79 0.60
GT Regular
0 74.6% 69.4%1 19.4% 19.4%2 6.0% 6.9%3 0.0% 4.2%Mean 0.31 0.46Std Dev 0.58 0.80 30

How would you like to learn more about C3
31
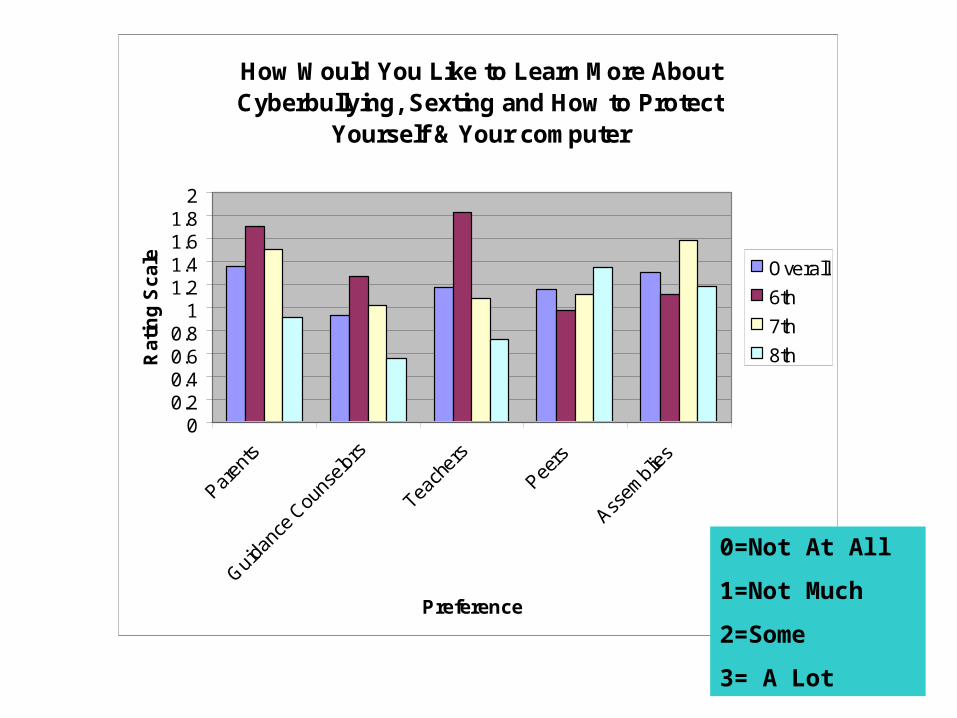
How Would You Like to Learn More About Cyberbullying, Sexting and How to Protect
Yourself & Your computer
00.20.40.60.8
11.21.41.61.8
2
Paren
ts
Guida
nce
Couns
elors
Teach
ers
Peers
Assem
blies
Preference
Ra
tin
g S
ca
le Overall
6th
7th
8th
0=Not At All
1=Not Much
2=Some
3= A Lot

Parents
Not at all= 0 Not much=1 Some=2 A lot=3
Overall 6th 7th 8th Male Female
0 31.4% 22.0% 23.5% 47.9% 30.6% 32.4%1 18.6% 12.2% 21.6% 20.8% 15.3% 22.1%2 32.1% 39.0% 35.3% 22.9% 29.2% 35.3%3 17.9% 26.8% 19.6% 8.3% 25.0% 10.3%Mean 1.36 1.71 1.51 0.92 1.49 1.24Std Dev 1.11 1.10 1.07 1.03 1.17 1.02
GT Regular
0 32.8% 30.1%1 20.9% 16.4%2 31.3% 32.9%3 14.9% 20.5%Mean 1.28 1.44Std Dev 1.08 1.13 33

Assemblies
Not at all= 0 Not much=1 Some=2 A lot=3
Overall 6th 7th 8th Male Female
0 33.6% 39.0% 23.5% 39.6% 34.7% 32.4%1 20.0% 22.0% 17.6% 20.8% 23.6% 16.2%2 27.9% 26.8% 35.3% 20.8% 20.8% 35.3%3 18.6% 12.2% 23.5% 18.8% 20.8% 16.2%Mean 1.31 1.12 1.59 1.19 1.28 1.35Std Dev 1.13 1.08 1.10 1.16 1.15 1.10
GT Regular
0 23.9% 42.5%1 23.9% 16.4%2 31.3% 24.7%3 20.9% 16.4%Mean 1.49 1.15Std Dev 1.08 1.15 34

Teachers
Not at all= 0 Not much=1 Some=2 A lot=3
Overall 6th 7th 8th Male Female
0 30.0% 9.8% 29.4% 47.9% 37.5% 22.1%1 32.9% 22.0% 41.2% 33.3% 33.3% 32.4%2 26.4% 43.9% 21.6% 16.7% 16.7% 36.8%3 10.7% 24.4% 7.8% 2.1% 12.5% 8.8%Mean 1.18 1.83 1.08 0.73 1.04 1.32Std Dev 0.98 0.92 0.91 0.82 1.03 0.92
GT Regular
0 26.9% 32.9%1 35.8% 30.1%2 29.9% 23.3%3 7.5% 13.7%Mean 1.18 1.18Std Dev 0.92 1.05 35
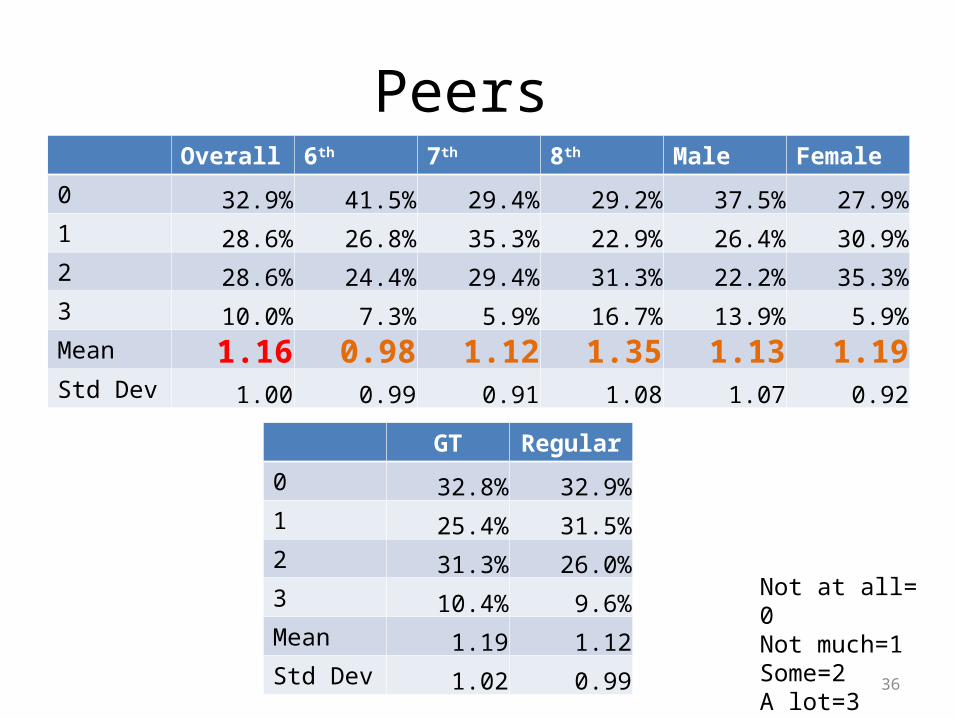
Peers
Not at all= 0 Not much=1 Some=2 A lot=3
Overall 6th 7th 8th Male Female
0 32.9% 41.5% 29.4% 29.2% 37.5% 27.9%1 28.6% 26.8% 35.3% 22.9% 26.4% 30.9%2 28.6% 24.4% 29.4% 31.3% 22.2% 35.3%3 10.0% 7.3% 5.9% 16.7% 13.9% 5.9%Mean 1.16 0.98 1.12 1.35 1.13 1.19Std Dev 1.00 0.99 0.91 1.08 1.07 0.92
GT Regular
0 32.8% 32.9%1 25.4% 31.5%2 31.3% 26.0%3 10.4% 9.6%Mean 1.19 1.12Std Dev 1.02 0.99 36

Guidance Counselors
Not at all= 0 Not much=1 Some=2 A lot=3
Overall 6th 7th 8th Male Female
0 36.4% 14.6% 35.3% 56.3% 41.7% 30.9%1 37.9% 46.3% 37.3% 31.3% 38.9% 36.8%2 21.4% 36.6% 17.6% 12.5% 18.1% 25.0%3 4.3% 2.4% 9.8% 0.0% 1.4% 7.4%Mean 0.94 1.27 1.02 0.56 0.79 1.09Std Dev 0.87 0.74 0.97 0.71 0.79 0.93
GT Regular
0 40.3% 32.9%1 35.8% 39.7%2 20.9% 21.9%3 3.0% 5.5%Mean 0.87 1.00Std Dev 0.85 0.88 37
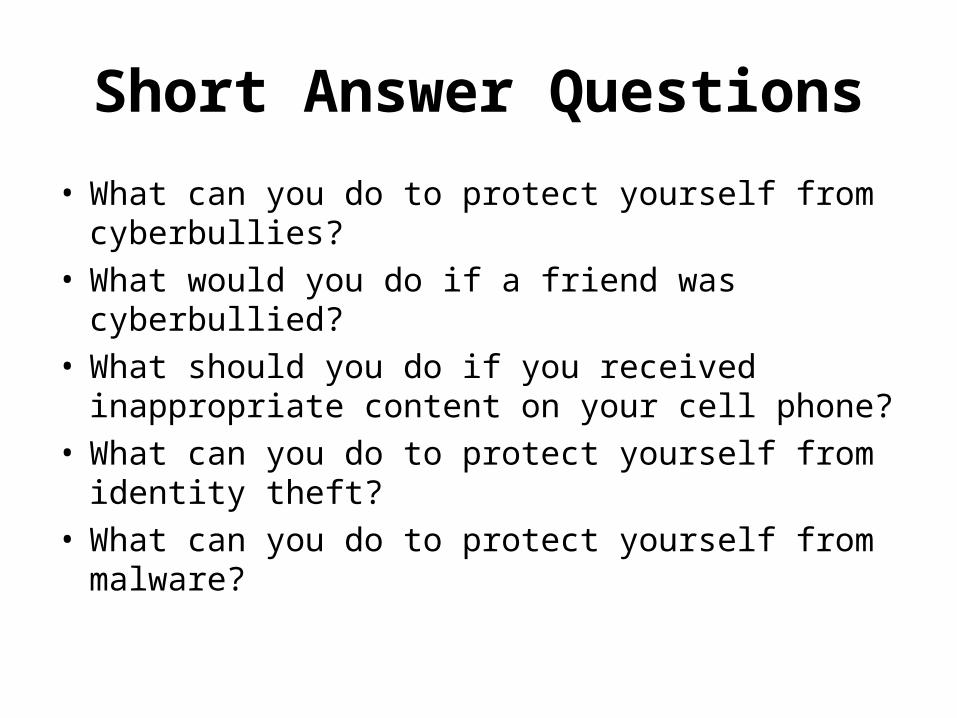
Short Answer Questions
• What can you do to protect yourself from cyberbullies?
• What would you do if a friend was cyberbullied?• What should you do if you received inappropriate
content on your cell phone?• What can you do to protect yourself from identity
theft?• What can you do to protect yourself from malware?

Conclusions• The majority of students surveyed at FQMS report
they know– nothing at all or not much about malware and identity
theft – not much to some about sexting
• Those who responded some, when asked what to do if they received an inappropriate message stated delete or ignore it
– some about cyberbullying• The most frequent answers to the question “what do you do if you
or a friend are cyberbullied” were– Don’t give out personal information– Don’t go to chat rooms/SNS– Tell an adult– Delete or ignore it

Conclusions
• The majority of students surveyed at FQMS report they learn about cyberethics, safety and security topics – most from parents and T.V. and the News and – least from siblings
• The majority of students surveyed at FQMS report they would like to learn more about these topics from their parents

41