cyanobacterial harmful algal blooms and u.s. geological ... · to human and aquatic ecosystem...
TRANSCRIPT

Cyanobacterial Harmful Algal Blooms and U.S. Geological Survey Science CapabilitiesBy Jennifer L. Graham, Neil M. Dubrovsky, and Sandra M. Eberts
Photograph by J. Graham, U.S. Geological Survey.
View of a cyanobacterial bloom in Milford Lake, Kansas, July 2016.
U.S. Department of the InteriorU.S. Geological Survey
Open-File Report 2016–1174Ver. 1.1, December 2017

2 Cyanobacterial Harmful Algal Blooms and U.S. Geological Survey Science Capabilities
Cyanobacterial harmful algal blooms (CyanoHABs) are increasingly a global concern because CyanoHABs pose a threat to human and aquatic ecosystem health and cause economic damages. Toxins produced by some species of cyanobacteria (called cyanotoxins) can cause acute and chronic illnesses in humans. Aquatic ecosystem health also is affected by cyanotox-ins, as well as low dissolved oxygen concentrations and changes in aquatic food webs caused by an over-abundance of cyanobac-teria. Economic damages related to CyanoHABs include loss of recreational revenue, decreased property values, and increased drinking-water treatment costs (Chorus and Bartram, 1999; Hudnell, 2008).
Chronic CyanoHABs have been reported throughout the United States, and cyanotoxins have been implicated in human and animal illness and death in at least 43 States (Hudnell, 2008; Graham and others, 2009; fig. 1). Several CyanoHABs have gained national attention because of their extent and severity. A toxic CyanoHAB in Lake Erie caused the City of Toledo, Ohio,* to issue a “do not drink” order for tap water that left more than 500,000 people without drinking water for 2 days in August 2014 (Dungjen and Patch, 2014). More than 650 miles of the Ohio River* recorded a toxic CyanoHAB during August through October 2015, affecting the drinking-water supply for 5 million people and impacting recreational activities in five States (Arenschield, 2015). A state of emergency was declared in four Florida* counties during June and July 2016 because a toxic CyanoHAB in the Lake Okeechobee Waterway* negatively affected recreational activities, the tourism industry, and marine life (Cuevas, 2016).
*Geographic location not shown on a map.
WA
INWV
OR
CA
ID
UT
ND
NE
KS
IA
MO
IL
MS
KY
OH
NC
FL
NY
VTMT
WY
NV
AZ NM
TX
OKAR
LAAL GA
SCTN
SD
VA
WIMI
MDDE
ME
NJCT
RI
MA
NH
PA
MN
CO
HI
0 100 200 MILES
0 100 200 KILOMETERS
0 500 1,000 MILES
0 500 1,000 KILOMETERS
0 300 600 MILES
0 300 600 KILOMETERS
AK
N
N
N
Anecdotal reports of cyanobacterial harmfulalgal bloom (CyanoHAB) poisonings
EXPLANATION
States with CyanoHABs, beach closures, and health advisories in August 2016
No anecdotal reports of CyanoHAB poisonings
Figure 1. Toxic cyanobacterial harmful algal blooms (CyanoHABs) have been implicated in human and animal illness and death in at least 43 States in the United States (Hudnell, 2008; Graham and others, 2009). For example, in August 2016 at least 19 States had public health advisories because of CyanoHABs (U.S. Environmental Protection Agency, 2016).
An Algal Bloom may be called harmful because of resulting reductions in dissolved oxygen concentrations, alterations in aquatic food webs, unsightly scums along shorelines, production of taste-and-odor compounds that cause unpalatable drinking water and fish flesh, or the production of toxins potent enough to poison aquatic and terrestrial organisms. Many different types of algae can cause harmful algal blooms in freshwater ecosystems. However, the most frequent and severe blooms typically are caused by cyanobacteria, the only freshwater “algae” with the potential for production of toxins potent enough to adversely affect human health.
Phot
ogra
ph c
ourte
sy o
f U.S
. Arm
y Co
rps
of E
ngin
eers
.
A 2015 cyanobacterial bloom on the Ohio River extended more than 650 miles and affected drinking water supplies and recreational activities in five States.

3
What are Cyanobacteria?
Cyanobacteria are naturally occurring microscopic organisms. Cyanobacteria are true bacteria with a prokaryotic cell structure (cells that lack membrane-bound nuclei); however, cyanobacteria also have the photosynthetic pigment chlorophyll-a, and hence function more like eukaryotic algae (cells with membrane-bound nuclei) in aquatic ecosystems. Because cyanobacteria function like algae in aquatic ecosystems, they typically are considered to be part of algal communities (this is why they often are called blue-green algae). Cyanobacterial blooms may appear as visual discolorations in the water or paint-like scums at the water surface; blooms typically are blue-green in color, but also may be yellow, red, or brown (Rosen and St. Amand, 2015).
Cyanobacteria are known for producing a variety of compounds that cause water-quality concerns. Cyanobacteria produce taste-and-odor compounds that people are sensitive to at very low concentrations (parts per trillion) in drinking water. Taste-and-odor compounds also may accumulate in fish flesh making it unpalatable, which can negatively impact the aquaculture industry. Of particular concern is the production of a diverse group of toxins that can cause human-health effects. The ability for cyanobacteria to produce taste-and-odor compounds and cyanotoxins is caused by genetic distinctions at the subspecies level.
40 micrometers
Phot
ogra
phs
by B
. Ros
en, U
.S. G
eolo
gica
l Sur
vey.
100 micrometers
Dolichospermum (Anabaena)
Microcystis
200 micrometers
Aphanizomenon
Aphanizomenon, Dolichospermum (Anabaena), Microcystis, and Planktothrix are some of the more commonly occurring cyanobacteria that have the potential to produce taste-and-odor compounds and cyanotoxins. Ingestion, inhalation, or contact with water containing elevated concentrations of cyanotoxins can cause allergic reactions, dermatitis, gastroenteritis, and seizures.
Several types of cyanotoxins cause a range of mild to severe human health effects. Human illnesses associated with cyanotox-ins have most commonly occurred after exposure through rec-reational activities or drinking water. Many States in the United States have established monitoring and education programs to protect public health. For example, during August 2016, at least 19 States issued public health advisories because of CyanoHABs (U.S. Environmental Protection Agency, 2016; fig. 1). Despite widespread monitoring, the severity and extent of human and animal illnesses caused by CyanoHABs have not been well documented. The One Health Harmful Algal Bloom System was launched by the U.S. Centers for Disease Control and Preven-tion in June 2016 to better understand the effect of HABs on
human and animal health (Centers for Disease Control and Prevention, 2016).
Economic impacts of CyanoHABs have not been well quanti-fied in the United States, but include loss of recreational and tourism revenues, decreased property values, increased drinking-water treatment costs, and commercial fisheries losses. Avail-able economic information suggests impacts may be substantial. For example, a preliminary study on the economic impacts of CyanoHABs in Lake Erie estimated that the 2014 event (which affected Toledo, Ohio, in August 2014) had an economic impact of $65 million in lost benefits ($43 million for recreation and tourism, $18 million for property value, and $4 million for drink-ing-water treatment) (Bingham and others, 2015).

Downstreamtransport
Warm calmsurface waters Optimal light,
increasing temperatures
Food-webinteractions In-lake
nutrientcycling
Atmospheric deposition
Wastewatereffluent
Industrialeffluent
Urban runoff
Agriculturalrunoff
Harmful Algal BloomsWhen nutrients (nitrogen and phosphorus)
are in high concentrations, cyanobacteria can grow in large numbers, resulting in a harmful algal bloom. Cyanobacterial harmful algal blooms can impair
drinking-water quality and result in closures of recreational areas, both of
which have economic impacts.
Transport of Cyanotoxins DownstreamWater quality in large rivers is influenced by
the cumulative effects of upstream land use and water management. Upstream lakes and reservoirs can have a substantial influence on downstream water quality. For example, cyanotoxins can be transported downstream from
lakes and reservoirs reporting cyanobacterial harmful algal blooms and
cyanotoxins can impair water quality far from where the bloom occurred.
Nutrient InputsInputs from agricultural areas,
urban areas, wastewater and industrial effluents, and atmospheric deposition contribute nutrients to streams, rivers, and lakes. Nutrients can also enter
these waters through the groundwater, an often overlooked source of nutrients.
Drinking-water intake
Groundwaterinputs
Groundwaterrecharge
4 Cyanobacterial Harmful Algal Blooms and U.S. Geological Survey Science Capabilities
State of Cyanobacterial Harmful Algal Bloom Science
The cyanobacteria that most com-monly produce cyanotoxins and other nuisance compounds (for example, taste-and-odor compounds), the diversity of compounds produced by the cyanobac-teria, when and where CyanoHABs are likely to occur, and the environmental factors linked to CyanoHAB occurrence are generally known (fig. 2). Key factors related to CyanoHAB occurrence and toxicity include the following:
Cyanobacterial bloom in Kabetogama Lake, Voyageurs National Park, Minnesota, September 2016.
Photograph by J. LeDuc, National Park Service.

Downstreamtransport
Warm calmsurface waters Optimal light,
increasing temperatures
Food-webinteractions In-lake
nutrientcycling
Atmospheric deposition
Wastewatereffluent
Industrialeffluent
Urban runoff
Agriculturalrunoff
Harmful Algal BloomsWhen nutrients (nitrogen and phosphorus)
are in high concentrations, cyanobacteria can grow in large numbers, resulting in a harmful algal bloom. Cyanobacterial harmful algal blooms can impair
drinking-water quality and result in closures of recreational areas, both of
which have economic impacts.
Transport of Cyanotoxins DownstreamWater quality in large rivers is influenced by
the cumulative effects of upstream land use and water management. Upstream lakes and reservoirs can have a substantial influence on downstream water quality. For example, cyanotoxins can be transported downstream from
lakes and reservoirs reporting cyanobacterial harmful algal blooms and
cyanotoxins can impair water quality far from where the bloom occurred.
Nutrient InputsInputs from agricultural areas,
urban areas, wastewater and industrial effluents, and atmospheric deposition contribute nutrients to streams, rivers, and lakes. Nutrients can also enter
these waters through the groundwater, an often overlooked source of nutrients.
Drinking-water intake
Groundwaterinputs
Groundwaterrecharge
5
Cyanobacteria diversity.—Not all, or even most, cyanobac-teria have the ability to produce cyanotoxins and other nuisance compounds. Consequently, not all CyanoHABs will be toxic or produce nuisance compounds.
Cyanotoxin diversity.—There is the potential for numerous cyanotoxins to occur simultaneously in a CyanoHAB.
Nutrient concentrations.—Cyanobacteria tend to proliferate when nutrient concentrations, particularly nitrogen and phospho-rus, are elevated. In addition, the inorganic and organic forms of nitrogen present are important in determining CyanoHAB development and toxicity.
Buoyancy regulation.—Many planktonic cyanobacteria can optimize their position in the water column with respect to light and nutrients by regulating their buoyancy. Buoyancy regulation may result in cyanobacteria changing their position in the water column throughout the day. A stable water column provides the best opportunity for cyanobacteria to maintain a favorable posi-tion, giving them a competitive advantage over other algae. As a result, CyanoHABs may develop at depth and not be visible at the water surface.
Light level.—Cyanobacteria are relatively well adapted to low-light conditions and may proliferate at low-light intensities.
Low-light adaptation allows cyanobacteria to grow even when other types of algae are dominant and to take advantage of loca-tions in the water column that other algae cannot access.
Water temperature.—In general, cyanobacteria proliferate in warmer waters and CyanoHABs tend to occur most frequently during late summer and early fall in temperate climates. Some species, however, are adapted to cold conditions and Cyano-HABs may develop under ice during the winter.
Hydrologic conditions.—Hydrologic conditions play an important role in the development of CyanoHABs. The timing and magnitude of runoff events influence nutrient loading and other conditions that influence cyanobacteria proliferation. Large inflow events followed by warm periods may lead to bloom development. Alternatively, large inflow events during a bloom may halt cyanobacterial growth and flush the system.
Meteorological conditions.—Surface accumulations, or scums, may develop when cyanobacteria float to the surface dur-ing calm conditions or when a key growth factor is reduced, and cyanobacteria are no longer able to effectively regulate buoy-ancy. Surface accumulations may develop and dissipate within a matter of hours as wind and weather conditions change, resulting in extreme spatial and temporal variability.
Figure 2. Many environmental factors are linked to cyanobacterial harmful algal bloom (CyanoHAB) occurrence, including watershed inputs, in-lake processes, and downstream transport.
Nutrient inputs photograph by U.S. Department of Agriculture; other photographs in illustration by U.S. Geological Survey.

6 Cyanobacterial Harmful Algal Blooms and U.S. Geological Survey Science Capabilities
U.S. Geological Survey Cyanobacterial Harmful Algal Bloom Science
Despite advances in scientific understanding of cyanobac-teria and associated compounds, many unanswered questions remain about occurrence, environmental triggers for toxicity, and the ability to predict the timing, duration, and toxicity of CyanoHABs. Scientific data and mechanistic understanding of environmental factors—as well as the related adverse effects of cyanotoxin exposure—are necessary to develop reliable early warning systems and predictive tools that guide management decisions. Advanced warning at time scales relevant to Cyano-HAB management (hours to days), allow proactive, rather than reactive, responses to CyanoHAB events.
U.S. Geological Survey (USGS) scientists are currently (2016) leading a diverse range of studies to address CyanoHAB issues in water bodies throughout the United States (fig. 3), including the following: developing field and laboratory methods to identify and quantify cyanobacteria and associated com-pounds; understanding causal factors, environmental fate and transport, ecological processes, and effects of environmental exposure; and developing early warning systems for potentially harmful blooms. Study approaches use a combination of tradi-tional methods and emerging technologies, including advanced analytical techniques, stable isotopes, molecular techniques, sensor technology, and satellite imagery. Studies range in scale from laboratory experiments, to individual water bodies, to stud-ies that are regional or national in scope, and are completed in collaboration with local, State, Federal, Tribal, university, and industry partners (fig. 3). Recent examples of USGS CyanoHAB science include the following:
0 500 1,000 MILES
0 500 1,000 KILOMETERS
AK
HI
0 100 200 MILES
0 100 200 KILOMETERS
WA
IN
WV
OR
CA
ID
UT
ND
NE
KS
IA
MO
IL
MS
KY
OH
PA
NC
FL
NY
VTMT
WY
CO
NV
AZNM
TX
OK
AR
LAAL GA
SC
TN
SD
VA
MNWI MI
MDDE
ME
NJCT
RI
MA
NH
EXPLANATION
0 200 400 600 MILES
0 200 400 600 KILOMETERS
Cyanobacterial harmful algal bloom study site type
River or streamLakeEstuaryWetland
Study site with continuous monitor for algae and cyanobacteria
LakeEstuary
River or stream
NN
N
Figure 3. U.S. Geological Survey cyanobacterial harmful algal bloom (CyanoHAB) study sites from the mid-1990s through 2016. Studies range in scale from laboratory experiments, to individual water bodies, to those that are regional or national in scope, and have been completed in collaboration with local, State, Federal, Tribal, university, and industry partners.
7
• USGS scientists have developed a variety of approaches to quantify cyanobacteria and associated compounds, including field protocols, field guides, taxonomy, sample preparation techniques, advanced analytical techniques, and molecular tools. For example, the Native American and Alaska Native communities are likely to have direct contact with cyano-toxins through traditional uses, such as subsistence fishing, and therefore have an increased risk of exposure. The USGS responded to this recognized risk by producing the “Field and Laboratory Guide to Freshwater Cyanobacteria Harmful Algal Blooms for Native American and Alaska Native Communi-ties” (Rosen and St. Amand, 2015) to allow easy identification of potentially toxic CyanoHABs.
• Near real-time data acquisition immediately identifies chang-ing water-quality conditions that may be used in early warning systems for CyanoHAB occurrence. The USGS currently (2016) operates a network of about 80 sensors that measure algae or cyanobacteria in near real-time in high-valued water bodies used for recreation and drinking water throughout the United States (fig. 3; see http://waterdata.usgs.gov/nwis). Sen-sors that measure algae or cyanobacteria show promise for use in early warning systems. Preliminary models based on sensor data that estimate the occurrence of cyanotoxins and taste-and-odor compounds are being evaluated as decision-making tools at recreational and drinking-water sites in Ohio* (Francy and others, 2016) and Kansas* (see https://nrtwq.usgs.gov/).
Phot
ogra
ph b
y T.
Will
iam
s, U
.S. G
eolo
gica
l Sur
vey.
Sensors that measure cyanobacteria in near real-time show promise for use in early warning systems for cyanobacterial blooms.
• National- and regional-scale assessments show the widespread occurrence of multiple cyanotoxins in a diverse range of set-tings across the United States. For example, a study completed in collaboration with the U.S. Environmental Protection Agency (EPA) detected the cyanotoxins microcystin, cylindro-spermopsin, and saxitoxin in lakes and reservoirs throughout the United States (Loftin and others, 2016). Nationwide occur-rence of multiple cyanotoxins demonstrates that microcystin is not the only cyanotoxin that poses ecological and human health risks.
*Geographic location not shown on a map.
• Bottom sediments in lakes and reservoirs contain a substantial amount of information about changing water-quality condi-tions through time, including the occurrence of CyanoHABs. USGS studies have used information in bottom sediments to reconstruct the history of CyanoHABs, which show some lakes have likely had events throughout their history, even under pre-settlement conditions (Juracek, 2015), highlighting the fact that CyanoHABs are a natural, though anthropogeni-cally amplified, phenomenon.
• The environmental persistence, fate, and transport of cya-nobacteria and associated compounds have not been well quantified. However, impacts may occur for hundreds of miles downstream from lakes and reservoirs reporting CyanoHABs. For example, within a week after upstream reservoir releases during a CyanoHAB, microcystin and taste-and-odor com-pounds were detected throughout a 173-mile reach of the Kansas River*, affecting the primary source of drinking water for about 800,000 people (Graham and others, 2012).
• Understanding environmental influences is critical to devel-oping effective mitigation and management strategies, early warning systems, and predictive models. Ongoing integrated ecosystem studies that use tools such as stable isotopes, genet-ics, and sensors, in addition to traditional approaches, to better understand environmental drivers of CyanoHAB formation are being completed in lakes, reservoirs, rivers, and estuar-ies throughout the United States. Combined, these studies contribute to scientific knowledge of the diverse range of environmental factors that influence CyanoHAB occurrence and toxicity, including nutrient sources, concentrations, and ratios; genetic make-up of the cyanobacteria; algal community dynamics; and hydrodynamics. For example, an ongoing study in the Great Lakes* is connecting the Lakes to the surrounding landscape and examining various controls on the formation, duration, and intensity of CyanoHABs (see http://www.glsc.usgs.gov/coastal-ecosystems/coastal-ecosystems-ecological-processes/western-lake-erie-river-influence-harmful).
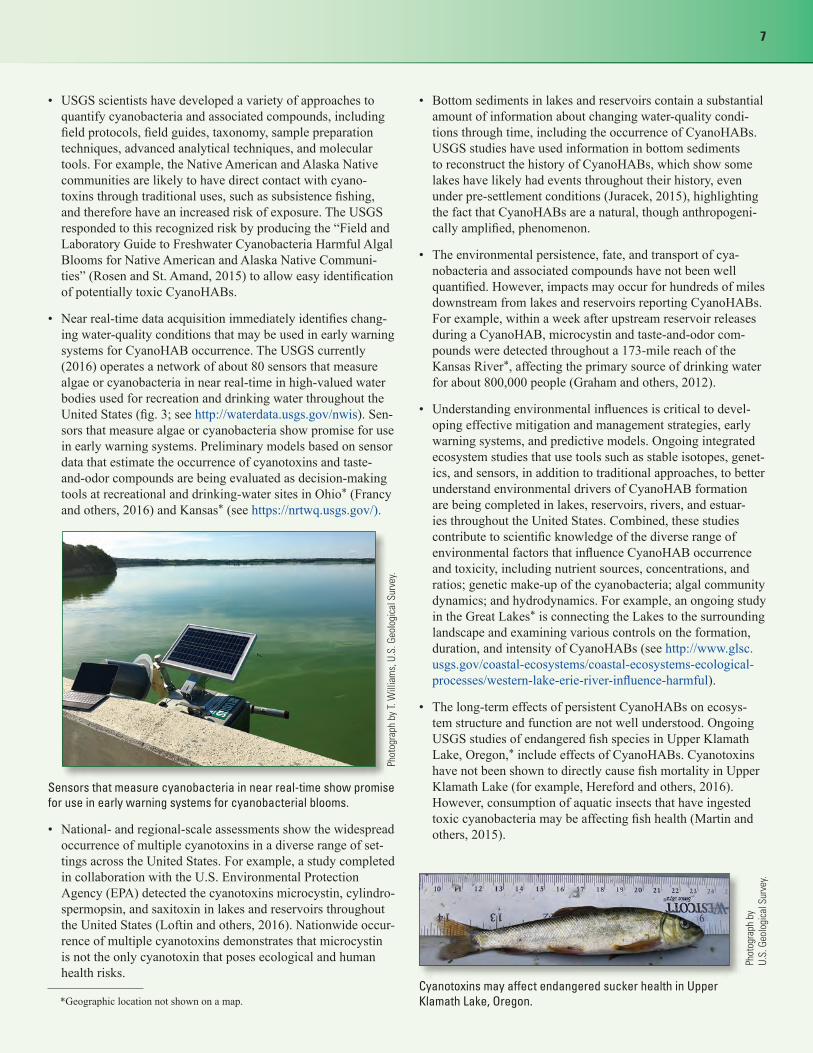
• The long-term effects of persistent CyanoHABs on ecosys-tem structure and function are not well understood. Ongoing USGS studies of endangered fish species in Upper Klamath Lake, Oregon,* include effects of CyanoHABs. Cyanotoxins have not been shown to directly cause fish mortality in Upper Klamath Lake (for example, Hereford and others, 2016). However, consumption of aquatic insects that have ingested toxic cyanobacteria may be affecting fish health (Martin and others, 2015).
Phot
ogra
ph b
y
U.S.
Geo
logi
cal S
urve
y.
Cyanotoxins may affect endangered sucker health in Upper Klamath Lake, Oregon.

8 Cyanobacterial Harmful Algal Blooms and U.S. Geological Survey Science Capabilities
• Collaboration is taking place with National Aeronautics and Space Administration (NASA), EPA, and National Oce-anic and Atmospheric Administration (NOAA) scientists to develop an early warning indicator of freshwater CyanoHABs by using ocean color satellite data and to develop an informa-tion distribution system to aid expedient public health adviso-ries (Cyanobacteria Assessment Network Project; see https://www.epa.gov/water-research/cyanobacteria-assessment-network-cyan-project).
• The USGS is engaged in CyanoHAB outreach and inter-agency science coordination. USGS scientists actively participate in the Interagency Working Group on the Harm-ful Algal Bloom and Hypoxia Research and Control Act, the National HAB Committee, the Inland HAB Discussion Group, the Great Lakes HABs Collaboratory, and many more local, regional, and national groups that are addressing HAB concerns.
U.S. Geological Survey CyanoHAB studies are ongoing at a variety of scales and with numerous partners to address Cyano-HAB issues in water bodies throughout the United States. Spe-cific outcomes to these studies are improved decisions in water resources management and public health protection through an enhanced understanding of the environmental factors that affect CyanoHAB occurrence, fate, and transport; real-time monitoring strategies to develop early warning systems; and development of models and other assessment tools to predict occurrence. By providing practical applications of cutting edge CyanoHAB research, USGS studies have advanced scientific understanding, enabling the development of approaches to help protect ecologi-cal and human health.
Phot
ogra
ph b
y th
e N
atio
nal A
eron
autic
s an
d Sp
ace
Adm
inis
tratio
n.
Satellite view of a cyanobacterial bloom in Lake St. Clair on the border between the United States and Canada.
What are cyanotoxins?
Cyanotoxins are naturally produced compounds; however, the reason cyanobacteria produce these compounds currently (2016) is unknown. Hypothesized reasons include primary roles in cellular processes, secondary metabolites, and defense mechanisms. The cyanotoxins are chemically and bioactively diverse, all targeting fundamental cellular processes and thereby affecting a wide range of organisms. The three main groups of cyanotoxins, defined by their effects on human health, are hepatotoxins, neurotoxins, and dermatoxins. Hepatotoxins primarily affect the liver, neurotoxins primarily affect the central nervous system, and dermatoxins primarily affect the skin and mucous membranes (Chorus and Bartram, 1999).
Microcystin, a hepatotoxin, is the most commonly occurring cyanotoxin worldwide. Other hepatotoxic cyanotoxins include cylindrospermopsin and nodularin. Neurotoxic cyanotoxins include anatoxin, saxitoxin, and potentially the amino acid ß-N-methylamino-L-alanine. Dermatoxic cyanotoxins include lyngbyatoxin, aplysiatoxin, and lipopolysaccharides (Chorus and Bartram,1999; Hudnell, 2008).
Many cyanotoxins have multiple variants with a wide range of toxicities. For example, there are at least 90 known microcystin variants and toxicity differences among them vary by an order of magnitude. A single bloom may
contain multiple cyanotoxins and variants. Information about the toxicology of many cyanotoxins and variants is lacking. The diversity of cyanotoxins and incomplete toxicological information complicates risk assessment and the development of regulations for human-health protection. Currently (2016), there are no regulations for cyanotoxins in drinking water. However, in May 2015, the EPA established health advisory values for microcystin and cylindrospermopsin in finished drinking water (U.S. Environmental Protection Agency, 2015).
Human exposure to cyanotoxins occurs through consumption of tainted drinking water, fish, or shellfish; recreational activities; or inhalation of aerosolized toxins. The adverse health effects caused by contact with, or ingestion or inhalation of, high concentrations of cyanotoxins (acute exposure) are well documented and include allergic reaction, dermatitis, gastroenteritis, and seizure (Chorus and Bartram, 1999). The effects of exposure to low levels of cyanotoxins for an extended period of time (chronic exposure), are not well understood. Some cyanotoxins have been indicated as tumor promoters, mutagens, and carcinogens, and there have also been suggested linkages with neurodegenerative disease; however, much more research is needed in this area.

9
Nutrient Enrichment—A Key Factor
One of the key causes of CyanoHABs is nutrient enrichment. The USGS, in cooperation with local, State, Federal, Tribal, and university partners, is pioneering new monitoring, assessment, and modeling approaches to understanding nutrient sources, transport, and their role in toxic CyanoHABs. Nutrient concentrations and flux are monitored at key sites nationwide (see http://cida.usgs.gov/quality/rivers/home). In addition, the USGS is using advanced optical sensor technology to track nitrate levels in real time at about 135 sites nationwide; these data provide real-time information, improve load calculations, and advance our understanding of processes controlling nutrient variability (see http://waterwatch.usgs.gov/wqwatch/).
U.S. Geological Survey models of nutrient concentrations and loads in streams provide an important tool for identifying nutrient sources. USGS model estimates provide insights into which areas and sources are contributing the largest amounts of nutrients to local streams, lakes, and reservoirs. For example, the highest yields of total phosphorus from agricultural sources occur in the Midwest (Preston and others, 2011). These models also enable the tracking of nutrients and their sources from local streams to the Nation’s estuaries and the Great Lakes (see http://water.usgs.gov/nawqa/sparrow/estuary/).
“Nutrient input reductions are the most obvious targets which can be altered and as such should be a central part of any CyanoHAB mitigation strategies.”
—Paerl and Otten, 2013
Phot
ogra
ph b
y M
. Nar
di, U
.S. G
eolo
gica
l Sur
vey.
The chemicals used in agricultural and urban or suburban areasmight affect surface and groundwater quality downstream.
Agricultural sources of phosphorus, incremental yield in kilograms per square kilometer per year
Less than 5
5 to 13
13 to 28
28 to 58
Greater than 58
EXPLANATION
0 200 400 600 MILES
0 200 400 600 KILOMETERS
N
U.S. Geological Survey model estimates of total phosphorus yields from agricultural sources indicate that the highest yields occur in the Midwest. Understanding which areas and sources are contributing the highest amounts of nutrients to streams helps target nutrient reduction actions. Figure modified from Preston and others, 2011.

10 Cyanobacterial Harmful Algal Blooms and U.S. Geological Survey Science Capabilities
SummaryCyanobacterial harmful algal blooms (CyanoHABs) are
increasingly a global concern because CyanoHABs pose a threat to human and aquatic ecosystem health and cause economic damages. Despite advances in scientific understanding of cyano-bacteria and associated compounds, many unanswered questions remain about occurrence, environmental triggers for toxicity, and the ability to predict the timing, duration, and toxicity of Cya-noHABs. U.S. Geological Survey (USGS) scientists are leading a diverse range of studies to address CyanoHAB issues in water bodies throughout the United States, using a combination of traditional methods and emerging technologies, and in collabo-ration with numerous partners. By providing practical applica-tions of cutting edge CyanoHAB research, USGS studies have advanced scientific understanding, enabling the development of approaches to help protect ecological and human health.
References Cited
Arenschield, L., 2015, Toxic algae bloom now stretches 650 miles along Ohio river: The Columbus [Ohio] Dispatch, October 3, 2015, accessed September 2016, at http://www.dispatch.com/content/stories/local/2015/10/03/algae-along-the-ohio.html.
Bingham, M., Sinha, S.K., and Lupi, F., 2015, Economic ben-efits of reducing harmful algal blooms in Lake Erie: Envi-ronmental Consulting and Technology, Inc. Report, 66 p., accessed August 2016, at http://ijc.org/files/tinymce/uploaded/Publications/Economic-Benefits-Due-to-Reduction-in-HABs-October-2015.pdf.
Centers for Disease Control and Prevention, 2016, One Health Harmful Algal Bloom System (OHHABS), accessed July 2016, at http://www.cdc.gov/habs/ohhabs.html.
Chorus, I., and Bartram, J., eds., 1999, Toxic cyanobacteria in water—A guide to their public health consequences, monitor-ing and management: New York, E&FN Spon, 416 p.
Cuevas, M., 2016, Toxic algae bloom blankets Florida beaches, prompts state of emergency: Cable News Network, July 1, 2016, accessed September 2016, at http://www.cnn.com/2016/07/01/us/florida-algae-pollution/.
Dungjen, T. and Patch, D., 2014, Toledo-area water advisory expected to continue through Sunday as leaders await tests; water stations to remain open: The Toledo [Ohio] Blade, August 2, 2014, accessed September 2016, at http://www.toledoblade.com/local/2014/08/02/City-of-Toledo-issues-do-no-drink-water-advisery.html.
Francy, D.S., Brady A.M.G., Ecker, C.D., Graham, J.L., Stelzer, E.A., Struffolino, P., Dwyer, D.F., and Loftin, K.A., 2016, Estimating microcystin levels at recreational sites in western Lake Erie and Ohio: Harmful Algae, v. 58, p. 23–34. [Also available at http://www.sciencedirect.com/science/article/pii/S1568988316301068.]
Phot
ogra
ph b
y E.
Loo
per,
U.S.
Geo
logi
cal S
urve
y.
USGS scientist collecting a surface grab sample from a cyanobacterial bloom.
Phot
ogra
ph b
y K.
Car
pent
er, U
.S. G
eolo
gica
l Sur
vey.
Cyanobacterial overgrowth on rocks and other surfaces may cause harmful blooms.
Phot
ogra
ph b
y J.
Gra
ham
, U.S
. Geo
logi
cal S
urve
y.
Cyanobacterial bloom in a boat wake.

11
Phot
ogra
ph b
y K.
Car
pent
er, U
.S. G
eolo
gica
l Sur
vey.
Phot
ogra
ph b
y J.
Gra
ham
, U.S
. Geo
logi
cal S
urve
y.
Graham, J.L., Loftin, K.A., and Kamman, N., 2009, Monitoring recreational freshwaters: LakeLine, v. 29, p. 16–22.
Graham, J.L., Ziegler, A.C., Loving, B.L., Loftin, Keith, 2012, Fate and transport of cyanobacteria and associated toxins and taste-and-odor compounds from upstream reservoir releases in the Kansas River, Kansas, September and October 2011: U.S. Geological Survey Scientific Investigations Report 2012–5129, 65 p. [Also available at https://pubs.er.usgs.gov/publication/sir20125129.]
Hereford, D.M., Burdick, S.M., Elliott, D.G., Dolan-Caret, A., Conway, C.M., and Harris, A.C., 2016, Survival, movement, and health of hatchery-raised juvenile Lost River suck-ers within a mesocosm in Upper Klamath Lake, Oregon: U.S. Geological Survey Open-File Report 2016–1012, 48 p. [Also available at https://pubs.er.usgs.gov/publication/ofr20161012.]
Hudnell, H.K., ed., 2008, Cyanobacterial harmful algal blooms–State of the science and research needs: Advances in Experi-mental Medicine and Biology, v. 619, 950 p.
Juracek, K.E., 2015, Occurrence and trends of selected nutri-ents, other chemical constituents, diatoms, and cyanobacteria in bottom sediment, Lake Maxinkuckee, northern Indiana: U.S. Geological Survey Scientific Investigations Report 2014–5199, 61 p. [Also available at https://pubs.er.usgs.gov/publication/sir20145199.]
Loftin, K.A., Graham, J.L., Hilborn, E.D., Lehmann, S.C., Meyer, M.T., Dietze, J.E., and Griffith, C.B., 2016, Cyano-toxins in inland lakes of the United States—Occurrence and potential recreational health risks in the EPA National Lakes Assessment 2007: Harmful Algae, v. 56, p. 77–90.
Martin, B., Echols, K.R., Feltz, K., Conway, C.M., 2015, Effects of microcystin on juvenile Lost River suckers, American Fish-eries Society 145th Annual Conference Proceedings: accessed August 2016, at https://afs.confex.com/afs/2015/webprogram/Paper19806.html.
Paerl, H.W., and Otten, T.G., 2013, Harmful cyanobacterial blooms—Causes, consequences, and controls: Microbial Ecol-ogy, v. 65, p. 995–1010.
Preston, S.D., Alexander, R.B. and Wolock, D.M., 2011, Spar-row modeling to understand water-quality conditions in major regions of the United States—A featured collection introduc-tion: JAWRA Journal of the American Water Resources Asso-ciation, v. 47. p. 887–890. [Also available at http://dx.doi.org/10.1111/j.1752-1688.2011.00585.x.]
Rosen, B.H., and St. Amand, Ann, 2015, Field and laboratory guide to freshwater cyanobacteria harmful algal blooms for Native American and Alaska Native Communities: U.S. Geo-logical Survey Open-File Report 2015–1164, 44 p. [Also available at https://pubs.er.usgs.gov/publication/ofr20151164.]
U.S. Environmental Protection Agency, 2016, August 2016 Freshwater HABs News: accessed August 2016, at https://www.epa.gov/nutrient-policy-data/cyanohabs-newsletters-2016.
U.S. Environmental Protection Agency, 2015, Recommendations for public water systems to manage cyanotoxins in drinking water: accessed September 2016, at https://www.epa.gov/nutrient-policy-data/recommendations-public-water-systems-manage-cyanotoxins-drinking-water.
Phot
ogra
ph b
y L.
Kin
g, U
.S. G
eolo
gica
l Sur
vey.
Cyanobacterial bloom on a beach at a Kansas lake.

USGS CyanoHAB DataUSGS CyanoHAB, and other water-quality, data are available at the following Web sites:
National Water Information System: https://waterdata.usgs.gov/nwis
National Real-Time Water Quality: https://nrtwq.usgs.gov/
Water-Quality Watch: https://waterwatch.usgs.gov/wqwatch/
Water-Quality Portal: https://www.waterqualitydata.us/
For more information, contact:
CoordinatorNational Water Quality Program12201 Sunrise Valley DriveReston, VA 20192(703) 648-6874
Or visit the U.S. Geological Survey Web site at: https://www.usgs.gov
For more information on the USGS—the Federal source for science about the Earth, its natural and living resources, natural hazards, and the envi-ronment—visit https://www.usgs.gov or call 1–888–ASK–USGS.
For an overview of USGS information products, including maps, imagery, and publications, visit https://store.usgs.gov.
Although this information product, for the most part, is in the public domain, it also may contain copyrighted materials as noted in the text. Permission to reproduce copyrighted items must be secured from the copyright owner.
Suggested citation: Graham, J.L., Dubrovsky, N.M., and Eberts, S.M., 2017, Cyanobacterial harmful algal blooms and U.S. Geologi-cal Survey science capabilities (ver 1.1, December 2017): U.S. Geological Survey Open-File Report 2016–1174, 12 p., https://doi.org/10.3133/ofr20161174.
Phot
ogra
ph b
y J.
Gra
ham
, U.S
. Geo
logi
cal S
urve
y.
Cyanobacterial bloom in a Minnesota lake, August 2006.
ISSN 0196-1497 (print)ISSN 2331-1258 (online)https://dx.doi.org/10.3133/ofr20161174