cxcl14, a brown adipokine that mediates brown- fat-to
TRANSCRIPT

Article
CXCL14, a Brown Adipoki
ne that Mediates Brown-Fat-to-Macrophage Communication in ThermogenicAdaptationGraphical Abstract
Highlights
d The chemokine CXCL14 is secreted by brown fat in response
to thermogenic activation
d Brown-fat-secreted CXCL14 promotes the recruitment of
M2-type macrophages
d Lack of CXCL14 impairs brown fat activity and alters glucose
homeostasis
d CXCL14 induces browning of white fat via type 2 immune
cells activation
Cereijo et al., 2018, Cell Metabolism 28, 750–763November 6, 2018 ª 2018 Elsevier Inc.https://doi.org/10.1016/j.cmet.2018.07.015
Authors
Ruben Cereijo, Aleix Gavalda-Navarro,
Montserrat Cairo, ..., Decio L. Eizirik,
Marta Giralt, Francesc Villarroya
In Brief
Cereijo et al. show that brown adipose
tissue exerts part of its healthy effects on
metabolism by secreting the chemokine
CXCL14. Thermogenically activated
brown adipocytes secrete CXCL14,
promoting adaptive thermogenesis via
M2 macrophage recruitment and leading
to enhanced BAT activation as well as the
browning of white fat.
Cell Metabolism
Article
CXCL14, a Brown Adipokine that MediatesBrown-Fat-to-Macrophage Communicationin Thermogenic AdaptationRuben Cereijo,1,2,7 Aleix Gavalda-Navarro,1,2,7 Montserrat Cairo,1,2 Tania Quesada-Lopez,1,2 Joan Villarroya,1,3
Samantha Moron-Ros,1 David Sanchez-Infantes,4 Marion Peyrou,1,2 Roser Iglesias,1,2 Teresa Mampel,1,2
Jean-Valery Turatsinze,5 Decio L. Eizirik,5 Marta Giralt,1,2,6 and Francesc Villarroya1,2,6,8,*1Department of Biochemistry andMolecular Biomedicine, Institute of Biomedicine of the University of Barcelona, Barcelona, Catalonia, Spain2CIBER Fisiopatologıa de la Obesidad y Nutricion, Barcelona, Catalonia, Spain3Institut de Recerca Hospital de la Santa Creu i Sant Pau, Barcelona, Catalonia, Spain4Department of Endocrinology and Nutrition, Institut d’Investigacio en Ciencies de la Salut Germans Trias i Pujol, Barcelona, Catalonia, Spain5Laboratory of Experimental Medicine, ULB Center for Diabetes Research, Universite Libre de Bruxelles, Brussels, Belgium6Institut de Recerca Hospital Sant Joan de Deu, Barcelona, Catalonia, Spain7These authors contributed equally8Lead Contact
*Correspondence: [email protected]://doi.org/10.1016/j.cmet.2018.07.015
SUMMARY
The beneficial effects of brown adipose tissue (BAT)are attributed to its capacity to oxidize metabolitesand produce heat, but recent data suggest thatsecretory properties of BAT may also be involved.Here, we identify the chemokine CXCL14 (C-X-Cmotif chemokine ligand-14) as a novel regulatoryfactor secreted by BAT in response to thermogenicactivation. We found that the CXCL14 released bybrown adipocytes recruited alternatively activated(M2) macrophages. Cxcl14-null mice exposed tocold showed impaired BAT activity and low recruit-ment of macrophages, mainly of the M2 phenotype,into BAT. CXCL14 promoted the browning of whitefat and ameliorated glucose/insulin homeostasisin high-fat-diet-induced obese mice. Impairmentof type 2 cytokine signaling, as seen in Stat6-nullmice, blunts the action of CXCL14, promoting adi-pose tissue browning. We propose that active BATis a source of CXCL14, which concertedly promotesadaptive thermogenesis via M2 macrophage recruit-ment, BAT activation, and the browning of white fat.
INTRODUCTION
Brown adipose tissue (BAT) is the main site of adaptive thermo-
genesis in mammals (Cannon and Nedergaard, 2004). High BAT
activity is associated with protection against obesity and related
metabolic alterations, an association attributed to the capacity
of BAT to oxidize metabolites to produce heat. However, recent
data suggest that secretory properties of BAT contribute to the
systemic effects of activeBAT (Villarroya et al., 2017a). Transplan-
tation of small amounts of brown adipose tissue, or even brownor
beige (the specific type of brown adipocytes that appear in ther-
750 Cell Metabolism 28, 750–763, November 6, 2018 ª 2018 Elsevie
mogenically stimulated white adipose tissue) cells, into rodent
models of obesity, type II diabetes, or other related diseases ame-
liorates glucose homeostasis and bodyweight regulation through
a mechanism that is not attributable to intrinsic energy expendi-
ture but instead involves the signaling properties of the trans-
planted cells (Liu et al., 2013; Stanford et al., 2013; Min et al.,
2016). The secretory properties of BATare expected to bedistinct
from those of white adipose tissue (WAT), considering the
opposing rolesofbothBAT (energyexpenditure) andWAT (energy
storage), and in fact, BAT shows little release of themainWATadi-
pokine leptin (Cannon and Nedergaard, 2004). Several regulatory
factors released by brown adipocytes have been identified; most
of theseact in anautocrine and/or paracrinemanner, targeting the
local vascular andnervous systems to improveBAT remodeling in
response to thermogenic adaptations. Moreover, a few brown
adipokines have been identified that are capable of influencing
otherorgansatadistance, includingFGF21 (fibroblastgrowth fac-
tor-21), neuregulin-4, insulin-like growth factor binding protein-2,
and possibly IL-6 (interleukin-6) (see Villarroya et al., 2017b for
review). It has also recently been found that specific microRNAs
(Thomou et al., 2017) and lipid signaling molecules (Lynes et al.,
2017) are released preferentially by BAT. However, the identifica-
tion of such ‘‘batokines’’ is still at the beginning stages, and
comprehensive knowledge of the BAT secretome is not yet avail-
able. To identify novel, relevant brownadipokines,wecombineda
genome-wide analysis of gene expression and bioinformatics
prediction of ‘‘secretability,’’ which allowed us to identify the che-
mokine CXCL14 (C-X-C motif chemokine ligand 14) as a novel
regulatory factor secreted by thermogenically activated BAT.
RESULTS
Identification of CXCL14 as a Protein Secreted byBAT inResponse to Thermogenic ActivationTo identify new brown adipokine candidates, we followed a tran-
scriptomic data-mining strategy (Figure 1A). Microarray data
(GEO: GSE8044) from mouse interscapular BAT (iBAT) versus
r Inc.

(legend on next page)
Cell Metabolism 28, 750–763, November 6, 2018 751
epididymal WAT (eWAT) were used to detect protein-encoding
transcripts that were significantly upregulated in iBAT compared
with eWAT. The identified differentially expressed genes were
then screened for extracellular release potential using TargetP
and SecretomeP applications. Next, we retrieved RNA-seq-
based transcript data from iBAT in mice exposed to cold (4�C)for 24 hours or housed under thermoneutral conditions (30�C)(Quesada-Lopez et al., 2016) and analyzed cold-induced pro-
tein-encoding transcripts for predicted secretability, as above;
these data were complemented by assessing ‘‘extracellular’’ at-
tributes using theGeneOntology database. Proteins known to be
secreted by BAT and upregulated during adaptive thermogene-
sis—such as FGF21, BMP8B (bonemorphogenic protein-8B), or
NRG4 (Villarroya et al., 2017b)—were identified at this step, vali-
dating the strategy followed (Figure 1A). Finally, we combined
the results from the iBAT-versus-eWAT and cold-exposure data-
sets. The products of two genes,Cxcl14 andKng1 (kininogen-1),
matched the criteria for BAT-versus-WAT enrichment, upregula-
tion upon cold stimulus, and predicted secreted protein. Here,
we report our findings concerning the chemokine CXCL14 as a
brown adipokine.
We confirmed that short-term and long-term cold exposure
caused a significant induction of the Cxcl14 transcript, like the
thermogenic markers UCP1 (uncoupling protein-1) and PGC-
1a (PPARg coactivator-1a). This effect of cold was not common
to genes encoding the inflammation-related cytokines TNFa
(tumor necrosis factor-a) or Ccl2 (C-Cmotif chemokine ligand 2),
which showed unaltered and decreased expression, respec-
tively (Figure 1B). CXCL14 expression trended higher in both
iWAT and eWAT with acute cold exposure (24 hours) and was
significantly upregulated by long-term exposure (22 days) to
cold in eWAT (Figures 1C and S1A). Both acute and long-term
cold exposure caused a significant increase in CXCL14 levels
in blood (Figure 1D), an effect that was not associated with the
induction of CXCL14 expression in non-adipose tissues such
as heart, liver, and intestine (Figure S1B).
To directly assess the release of CXCL14 by iBAT, we used an
arterio-venous difference approach in rats (Hondares et al.,
Figure 1. Identification of CXCL14 as a Protein Secreted by BAT in Re
(A) Flow chart of the data-mining strategy followed to detect candidate molecule
(B) mRNA expression of Cxcl14, thermogenesis-related Ucp1 and Ppargc1a, an
moneutrality (control, 30�C) or exposed to 4�C for either 24 hours or 22 days (n =
(C) Cxcl14 mRNA expression in iWAT and eWAT (n = 6 per condition).
(D) Plasma CXCL14 in mice housed at thermoneutrality (see C) or exposed to 4�
(E) Schematic depiction of the procedure for extracting blood from the efferent ve
arterio-venous differences in CXCL14 concentration across iBAT.
(F) Arterio-venous differences of plasma CXCL14 concentrations (arterial concent
(see C) or exposed to 4�C for 24 hours or 22 days (left, n = 5).
(G) Quantification of CXCL14 protein released from iBAT (right, n = 5).
(H) Cxcl14 and Ucp1 mRNA levels in the mature adipocyte fraction (MAF) and s
percentage of transcript levels in the MAF. ND, not detectable.
(I) Cxcl14 and Ucp1 mRNA expression during the differentiation of primary brow
(J) Effects of 0.5 mM norepinephrine (NE) or 1 mM dibutyryl-cAMP (cAMP, 24 ho
(K) CXCL14 protein concentration in cell cultures from differentiated primary bro
24 hours.
(L) Effects of 10 mM SB202190 (p38 MAPK inhibitor) and 20 mM H-89 (PKA inhib
entiated brown adipocytes (n = 4).
Bars indicate means ± SEM. *p < 0.05, **p < 0.01, and ***p < 0.001 compared wit
and +++p < 0.001 for the effects of SB202190 or H89 in (L). ANOVA with Tukey’s po
the discrepancy from zero in (F), and a two-tailed Student’s t test was performed
752 Cell Metabolism 28, 750–763, November 6, 2018
2011), as depicted in Figure 1E. Cold-dependent induction of
Cxcl14 expression in BAT and enhancement of CXCL14 levels
in blood were confirmed to occur in rats (Figures S1C and
S1D) as in mice. CXCL14 was significantly released by iBAT
(negative arterio-venous difference), and the extent of release
was increased with cold exposure (Figure 1F). A quantitative
analysis of the release of CXCL14 by iBAT, calculated using
the perfusion rates across iBAT, revealed a significant induction
by cold (Figure 1G).
Brown Adipocytes Release CXCL14 in Response toNoradrenergic ActivationCxcl14 mRNA levels were much higher in mature brown adipo-
cytes than in the stromal vascular fraction (SVF) (Figure 1H), indi-
cating that CXCL14 in BAT is mainly expressed in brown adipo-
cytes.Cxcl14mRNA expression was induced in association with
the acquisition of the mature brown adipocyte phenotype in
culture, a pattern similar to that of Ucp1 expression (Figure 1I).
Treatment with norepinephrine (NE) or cAMP caused a signifi-
cant induction of Cxcl14 mRNA levels in brown adipocytes (Fig-
ure 1J) and CXCL14 protein release into the cell culture media
(Figure 1K). This effect was not observed in culturedwhite adipo-
cytes (Figures S1E and S1F). Block of protein kinase-A or p38
mitogen-activated protein kinase activity with the specific
antagonists (H-89 and SB202190, respectively) blunted cAMP-
mediated induction of Cxcl14 mRNA (Figure 1L). Thus, brown
adipocytes release CXCL14 in response to the same noradren-
ergic-induced, cAMP-mediated signaling responsible for ther-
mogenic activation processes.
Impaired Thermogenic Activity and AlteredMacrophageInfiltration in iBAT from Cxcl14-Null Neonatal MiceNext, we examined the in vivo effects of CXCL14 deficiency. Ho-
mozygous Cxcl14-null mice (in a mixed 129S5 and C57BL6/J
background) exhibited a substantial rate of death before wean-
ing, as previously reported (Tanegashima et al., 2010). However,
after three rounds of mating Cxcl14+/� with 129S5 mice to in-
crease the 129S5 strain background, the resulting Cxcl14-null
sponse to Thermogenic Activation
s preferentially secreted by BAT in response to thermogenic activation.
d inflammation-related Tnf and Ccl2 genes in iBAT from mice housed at ther-
6).
C for 24 hours or 22 days (n = 6).
nous (Sulzer’s vein) and afferent arterial circulation in iBAT for determination of
ration – venous concentration) across iBAT in rats housed at room temperature
tromal vascular fraction (SVF) of mouse iBAT (n = 3). Data are presented as a
n adipocytes (n = 4)
urs) on Cxcl14 mRNA expression in differentiated brown adipocytes.
wn adipocytes treated with 0.5 mM NE for 12 hours or with 1 mM cAMP for
itor) on changes in Cxcl14 and Ucp1 mRNA induced by 1 mM cAMP in differ-
h corresponding controls in (C); # p < 0.05 compared with zero in F; 2+p < 0.01,
st hoc test was used for (I), (J), and (L), a one-sample t test was used to assess
for (B),(C),(D),(G),(H), and (K). See also Figure S1.

Figure 2. Impaired BAT Thermogenic Activity in Cxcl14-Null Neonatal Mice
(A) Cxcl14 mRNA levels in late fetuses (18 day fetal life), neonatal mice (0, 16, and 24 hours after birth) and adult mice (n = 3).
(B) Cxcl14 mRNA levels in the heart, liver, and intestine from late fetuses (18 day fetal life) and neonatal mice (24 hours after birth).
(C–H) The following data correspond to 3-day-oldCxcl14-null (KO) andWT (WT)mice: (C) Blood glucose, plasma insulinm andHOMA-IR levels; (D) representative
H&E-stained microscopy images (left) and lipid droplet size quantification (right) of iBAT, scale bar: 20 mm; (E) representative thermal images (left) and surface
temperature of the interscapular region (right) (n = 5); (F) UCP1 protein levels per iBAT depot (n = 5); (G) mRNA levels of genes involved in thermogenic function,
adipogenesis, and lipid homeostasis, as well as immune infiltration in iBAT (n = 6); and (H) quantification of immunoreactive signals in immunohistofluorescence
labeling of F4/80 positive cells in iBAT (n = 4).
Data are presented as means ± SEM. *p < 0.05, *p < 0.01, and *p < 0.001 for comparisons between WT and Cxcl14-KO mice, except for (A), where comparisons
correspond to the distinct time points versus ‘‘Birth.’’ A two-tailed Student’s t test was used for comparisons in (B)–(H); an ANOVAwith Tukey’s post hoc test was
used in (A). See also Figure S2.
micewere found to be viable and showedMendelian rates of sur-
vival until adulthood, with no signs of significant mortality or
obvious health derangements.
We found that Cxcl14 expression in iBAT was dramatically
induced in WT mouse pups immediately after birth (Figure 2A),
a setting in which a strong BAT thermogenic activation is known
to occur (Cannon and Nedergaard, 2004); this effect was not
observed in other tissues (Figure 2B). Three-day-old Cxcl14-
null neonates exhibited unaltered circulating glucose levels,
whereas insulin levels trended higher and HOMA-IR levels
Cell Metabolism 28, 750–763, November 6, 2018 753

Figure 3. Reduced BAT Thermogenic Activity in Adult Cxcl14-Null Mice
(A) Glucose, insulin and HOMA-IR levels, and glucose tolerance in Cxcl14-null (KO) and wild-type (WT) mice.
(B) Oxygen consumption under basal conditions and after a single i.p. injection of 1 mg/kg CL316,243 in Cxcl14-null (KO) and WT mice.
(C) Representative thermal images (left) and surface temperature of the interscapular region (right) of adult Cxcl14-KO and WT mice.
(D) Representative H&E-stained microscopy images (left), scale bar: 20 mm; lipid droplet surface quantification (right) of iBAT from adultCxcl14-KO andWTmice.
(E) Cold-induced (4�C, 7 days) mRNA levels of genes involved in thermogenic function, adipogenesis, and lipid homeostasis in iBAT, iWAT and eWAT from adult
Cxcl14-KO and WT mice.
(legend continued on next page)
754 Cell Metabolism 28, 750–763, November 6, 2018
were significantly increased (Figure 2C). The findings of HOMA-
IR should be interpreted with caution in neonates, given the un-
certainty regarding their food intake status at the time of analysis.
However, data suggest that Cxcl14-null mice exhibit a certain
degree of insulin resistance. The iBAT from Cxcl14-null mice
showed multiple interspersed cells that each contained a single
lipid droplet instead of multiple droplets (a morphology closer to
that of white adipocytes), and the surface area of the lipid droplet
was significantly increased in Cxcl14-null pups relative to con-
trols (Figure 2D). This suggests that Cxcl14-null pups exhibit
defects in acquiring the active brown adipocyte phenotype.
The surface body temperature at the iBAT site was significantly
reduced in Cxcl14-null pups, indicating impaired iBAT thermo-
genic activity (Figure 2E). Consistent with this, the iBAT depot
of Cxcl14-null pups exhibited a significant reduction in the pro-
tein level of UCP1 (Figure 2F), which is a bona fide indicator of
tissue thermogenic activity (Nedergaard and Cannon, 2013).
Transcripts related to adaptive thermogenesis were significantly
downregulated (Ppargc1a, Fgf21, Dio2) or showed a downward
trend (Ucp1) in Cxcl14-null pups (Figure 2G, up). In contrast,
genes related to overall lipid accumulation, such as Fasn or
Lpl, were upregulated, consistent with previous observations in
experimental models in which ‘‘whitening’’ of BAT is enhanced
(Duteil et al., 2016). Expression of the alternatively activated
(M2) macrophage marker gene Arg1 (arginase-1), was strongly
reduced in iBAT from Cxcl14-null pups, leading to a significant
reduction in the Arg1/Nos2 ratio, an index of the extent of
M2/M1 macrophage polarization (Galic et al., 2011; Figure 2G,
down). This observation is consistent with the previously estab-
lished association between local M2 macrophage polarization in
BAT and thermogenic activity (Nguyen et al., 2011). However,
transcript levels of marker genes for eosinophil (Siglec5) and
innate lymphoid cell (ILC2) activity (IL-5, IL-33)—other immune
cells proposed to be involved in activation of browning (Qiu
et al., 2014; Rao et al., 2014, Brestoff et al., 2015; Lee et al.,
2015, Odegaard et al., 2016)—were significantly upregulated.
Expression of mRNA for the BAT thermogenesis activation-
associated cytokine IL-6 (Stanford et al., 2013) was decreased
inCxcl14-null neonates. Immunofluorescence analyses revealed
a reduction in total macrophage (F4/80+) infiltration in iBAT from
Cxcl14-null pups (Figures 2H and S2A). However, low levels of
CD206 signals in neonatal BAT precluded a reliable quantifica-
tion of specific M2 macrophage infiltration. Taken together,
these observations indicate that a CXCL14 deficiency impairs
thermogenic activity and disturbs macrophage infiltration in
BAT in neonates.
ReducedBATThermogenic Activity andAlteredGlucoseHomeostasis in Adult Cxcl14-Null MiceAdult Cxcl14-null mice did not show gross changes in body
weight relative to WT littermates, despite a significant increase
in iWAT and eWAT size (Table S1). Cxcl14-null mice exhibited
(F) Representative immunoblot of UCP1 protein levels in iBAT (top) and quantifi
maintained at room temperature (RT; 21�C) or exposed to cold (4�C, 7 days).
(G) Cold-induced (4�C, 7 days) changes in RNA levels of genes involved in immu
(H) Total (F4/80+) and M2-type (CD206+) macrophages in iBAT, iWAT, and eWA
Data are presented as means ± SEM of 6 mice per group. *p < 0.05 and **p < 0.01
CL316,243 in (B); ##p < 0.01 for the effects of cold. A two-tailed Student’s t test
higher blood glucose and significantly increased HOMA-IR
levels relative to WT mice, which is suggestive of insulin resis-
tance (Figure 3A, left). This was accompanied by impaired
glucose tolerance (Figure 3A, right). Oxygen consumption
under basal conditions was not significantly altered, whereas
b3-adrenergic-induced oxygen consumption, stimulated by the
selective agonist CL316,243, was moderately—but signifi-
cantly—reduced in Cxcl14-null mice (Figure 3B). A thermog-
raphy assessment indicated a reduction in surface temperature
specifically at the interscapular region corresponding to the
iBAT site in Cxcl14-null mice (Figure 3C), and a microscopy ex-
amination of iBAT revealed increased numbers of unilocular ad-
ipocytes and augmented lipid droplet size, indicative of poor
thermogenic activation (Figure 3D). Exposure of Cxcl14-null
mice to an ambient temperature of 4�C for 1 week did not
compromise viability or modified core temperature (36.2 ±
0.2�C in WT versus 36.3 ± 0.2�C in CXCL14-null mice); however
the induction of genes involved in thermogenic function, such as
Ucp1 and Hsl, as well as that of glucose transporters GLUT1
(Slc2a1) and GLUT4 (Slc2a4), was diminished in iBAT from these
mice compared with their WT counterparts (Figure 3E). The total
amount of UCP1 protein in iBAT was significantly reduced in
Cxcl14-null mice relative to WT mice (Figure 3F) after 1 week of
cold exposure, indicating impaired thermogenic recruitment of
BAT. An analysis of the expression of marker genes indicative
of immune cell infiltration in tissue revealed a dramatic reduction
in the expression of Arg1 andMrc1 (mannose receptor C-type 1)
in iBAT and iWAT from Cxcl14-null mice, indicative of impaired
M2 macrophage recruitment (Figure 3G). eWAT exhibited a
reduction in Mrc1 and Metrnl (meteorin-like) gene expression.
A flow-cytometry-based analysis of immune cell abundance in
cold-exposed mice revealed that, relative to WT mice, Cxcl14-
null mice exhibit significant reductions of total macrophages
(F4/80+) in iBAT and of M2 macrophages (CD206+) in iBAT
and iWAT (Figure 3H). An independent, immunofluorescence-
based analysis of adipose tissues confirmed that M2 (CD206+)
macrophages were reduced in the iBAT and iWAT of Cxcl14-
null mice (Figure S2B). Overall, these data indicate reduced
energy expenditure, signs of insulin resistance, and impaired
thermogenic activity in iBAT in adult mice devoid of CXCL14,
similar to observations in neonates, as well as reduced infiltration
of macrophages, especially of the M2 phenotype, into BAT
and iWAT.
CXCL14 Secreted by Brown Adipocytes AttractsAlternatively Polarized Macrophages and Favors M2PolarizationTo further explore the role of CXCL14, we treated brown and
beige adipocytes in culture with recombinant CXCL14. No
alterations in brown adipocyte differentiation or thermogenic
activation in vitro, assessed by determining the expression
of marker genes for thermogenic function, adipogenesis, and
cation of total UCP1 protein (bottom) in iBAT from Cxcl14-KO and WT mice
ne infiltration.
T from adult Cxcl14-KO and WT mice exposed to cold.
for comparison between WT and Cxcl14-KO mice; #p < 0.05 for the effects of
was used for comparisons. See also Figure S2 and Table S1.
Cell Metabolism 28, 750–763, November 6, 2018 755

Figure 4. CXCL14 Secreted by Brown Adipocytes Attracts Alternatively Polarized Macrophages (M2) and Favors M2 Polarization
(A) Representative clear-field microscopy pictures of hematoxylin-stained chemotactic chambers showing the migration of M1- and M2-preactivated RAW264.7
macrophages in response to brown-adipocyte conditioned medium (CM) supplemented with a CXCL14-neutralizing antibody (anti-CXCL14), a nonspecific anti-
isotype antibody (anti-IgG), no antibody, or no CM (control) (left); scale bar: 100 mm. Quantification of migrating macrophages is expressed as cells per field (right)
(n = 4 for M1 and n = 8 for M2).
(B) Effects of 10 nM CXCL14 on M1 and M2 RAW264.7 macrophage migration and representative microscopy pictures (left), scale bar: 100 mm; quantification of
migrating macrophages (right) (n = 4 for M1, and n = 8 for M2).
(C) mRNA levels of genes indicative of macrophage M2 activation (Arg1, Clec10a, Mrc1) and M1 activation (Nos2, Tnf, Ccl2), as well as Cxcl14 mRNA and the
Arg1/Nos2 ratio in RAW264.7 macrophages previously polarized to the M1 or M2 phenotype.
(legend continued on next page)
756 Cell Metabolism 28, 750–763, November 6, 2018

inflammation, or glucose oxidation were observed in vitro
(Figures S3A–S3D). Similar negative effects were found in
adipocytes differentiated from iWAT and eWAT precursors
(Figure S3E). These data strongly suggest that brown-adipo-
cyte-derived CXCL14 does not exert a major autocrine function.
Given the known association of M2 macrophage recruitment
with the activation of BAT thermogenesis and WAT browning,
as well as the indications of altered macrophage infiltration in
iBAT from Cxcl14-null mice, we assessed the chemotactic
behavior of RAW 264.7 macrophages previously polarized to
M1 or M2 phenotypes (Figure S4A). Brown-adipocyte condi-
tioned medium (CM) dramatically promoted migration of M2-
activated macrophages and inhibited migration of M1-activated
macrophages (Figure 4A). Addition of an anti-CXCL14 antibody
to CM strongly inhibited the migration of M2-polarized cells,
whereas addition of a control anti-IgG did not. Consistent with
this, recombinant CXCL14 preferentially promoted migration of
M2 macrophages (Figure 4B). Moreover, brown adipocyte
CM strongly induced the expression of the M2 macrophage
marker genes Arg1 and Clec10a, an effect that was reduced
by an anti-CXCL14 antibody (Figure 4C). Brown adipocyte CM
inhibited the expression of M1 phenotype pro-inflammatory
markers in macrophages. However, this action was unaltered
by the anti-CXCL4 antibody, indicating that factors released by
brown adipocytes other than CXCL14 account for their anti-in-
flammatory action. Collectively, these findings indicate that the
release of CXCL14 by brown adipocytes accounts for the pro-
motion of macrophage M2 polarization and recruitment. These
effects were further checked usingmouse bone-marrow-derived
macrophages (BMDM) previously polarized to theM1 orM2phe-
notypes (Figure S4B). The data obtained confirmed our main
findings in RAW 264.7 macrophages: brown-adipocyte condi-
tioned medium induced preferential M2 macrophage migration
and the expression of genemarkers for M2 polarization, whereas
addition of the CXCL14 antibody to the conditioned medium
blunted these effects (Figures S4D and S4E). Recombinant
CXCL14 induced BMDM migration, especially when the cells
had been previously polarized to theM2 phenotype (Figure S4C).
CXCL14 Induces iBAT Activation, the Browning of WAT,and Enrichment of Adipose Tissues with M2MacrophagesWe next determined the effects of CXCL14 treatment in vivo
in mice using osmotic mini-pumps adjusted to deliver CXCL14
for 1 week at a rate that resulted in a rise in plasma CXCL14
levels into the range induced by cold exposure (Figure 5A).
This treatment did not significantly affect mouse biochemical
or hormonal profile (Table S2). A microscopic examination re-
vealed no major changes in iBAT in CXCL14-treated mice; how-
ever, these mice exhibited noticeable browning in iWAT, and
even in eWAT, as evidenced by the presence of abundant multi-
locular beige adipocytes (Figure 5B). Transcript levels of thermo-
genic-related genes (e.g., Ucp1, Ppargc1, Dio2) were increased
Data are represented as means ± SEM. *p < 0.05, **p < 0.01, and ***p < 0.001 for t
and ###p < 0.001 for the effects of anti-CXCL14 antibody versus nonspecific IgG (Azzzp < 0.001 for differences betweenM2 andM1 controls; xp < 0.05 for the effects
test was used in (A) and (C); two-tailed Student’s t test was used in (B). See also
in iWAT and eWAT (Figure 5C), but not in iBAT, whereas nomajor
changes in the expression of genes related to general adipo-
genesis occurred in any adipose depot. Levels of UCP1 were
significantly increased in iBAT, iWAT, and eWAT (Figure 5D).
Macrophage infiltration in adipose tissues was assessed in the
SVF of adipose depots using flow cytometry and indicated an in-
crease in M2 macrophages (F4/80+/CD206+ cells) in iWAT and
eWAT depots, but not in iBAT, from CXCL14-treated mice (Fig-
ure 5E). Immunofluorescence labeling for CD206 confirmed
that M2-polarized macrophages were enriched in WAT depots
following CXCL14 treatment (Figure S5A). Moreover, a gene
expression analysis of adipose tissues fromCXCL14-treated an-
imals showed upregulation of the M2-macrophage-related gene
transcripts (Arg1, Mrc1, and Clec10a), and to a lesser extent
M1-related transcripts, in WAT depots (Figure 5F), but not in
iBAT. Transcript levels of marker genes of eosinophil infiltration
and activation (Metrnl, Ccr3, Siglec5) and ILC2 activation
(IL-33) were upregulated in both WAT depots (Figure 5F),
although flow-cytometry analyses revealed no significant
changes in eosinophil (CD11b+/SiglecF+ cells) abundance
(data not shown). CXCL14 treatment caused modest changes
in the expression of inflammation-related genes in liver that fol-
lowed a pattern similar to that elicited by cold exposure (Fig-
ure S5B). Thus, CXCL14 elicits recruitment of M2 macrophages
toWAT, promotesWAT browning, and has minor effects in iBAT.
Normalization of CXCL14 Levels in HFD-Fed MiceImproves Glucose Homeostasis and Induces Browningand Recruitment of M2 Macrophages to WATWe found that mice made obese by feeding a high-fat diet (HFD)
showed reduced circulating levels of CXCL14 (Figure 6A). Inter-
estingly, a similar reduction in CXCL14 levels was observed in
human obese individuals, and these patients showed a recovery
of circulating CXCL14 levels after reduction of body weight
through bariatric surgery (Figure S6). In obese mice, reduced
CXCL14 levels in blood were associated with impaired Cxcl14
gene expression in BAT and eWAT (Figure 6B), but not in iWAT
or the liver (not shown). Normalization of blood CXCL14
levels to lean mouse levels, achieved by delivering recombinant
CXCL14 in HFD-fed mice for 1 week with osmotic mini-pumps
(Figure 6A), caused a reduction in HFD-induced fasting hypergly-
cemia with no changes in insulinemia (Figure 6C). In fed condi-
tions, unchanged glycemia was associated with lower insulin
levels in CXCL14-treated mice; circulating cytokine or adipokine
levels were unaltered (Table S2). Treatment with CXCL14 signif-
icantly ameliorated glucose intolerance in HFD-fed mice (Fig-
ure 6D), despite the fact that glucose-induced insulinemia was
reduced in CXCL14-treated mice (Figure 6D, right). Insulin toler-
ance test also indicated a mild increase in insulin sensitivity after
CXCL14 treatment (Figure S5C). Collectively, these data indicate
improved insulin sensitivity in CXCL14-treated mice. The levels
of transcripts for some genes involved in thermogenic activation
were induced in response to CXCL14, especially those for Ucp1
he effects of CM (A and C) or CXCL14 (B) versus controls; #p < 0.05, ##p < 0.01,
and C), and for differences betweenM2 andM1 phenotypes (B); zp < 0.05, and
of nonspecific IgG versus controls (no antibody). ANOVAwith Tukey’s post hoc
Figures S3 and S4.
Cell Metabolism 28, 750–763, November 6, 2018 757
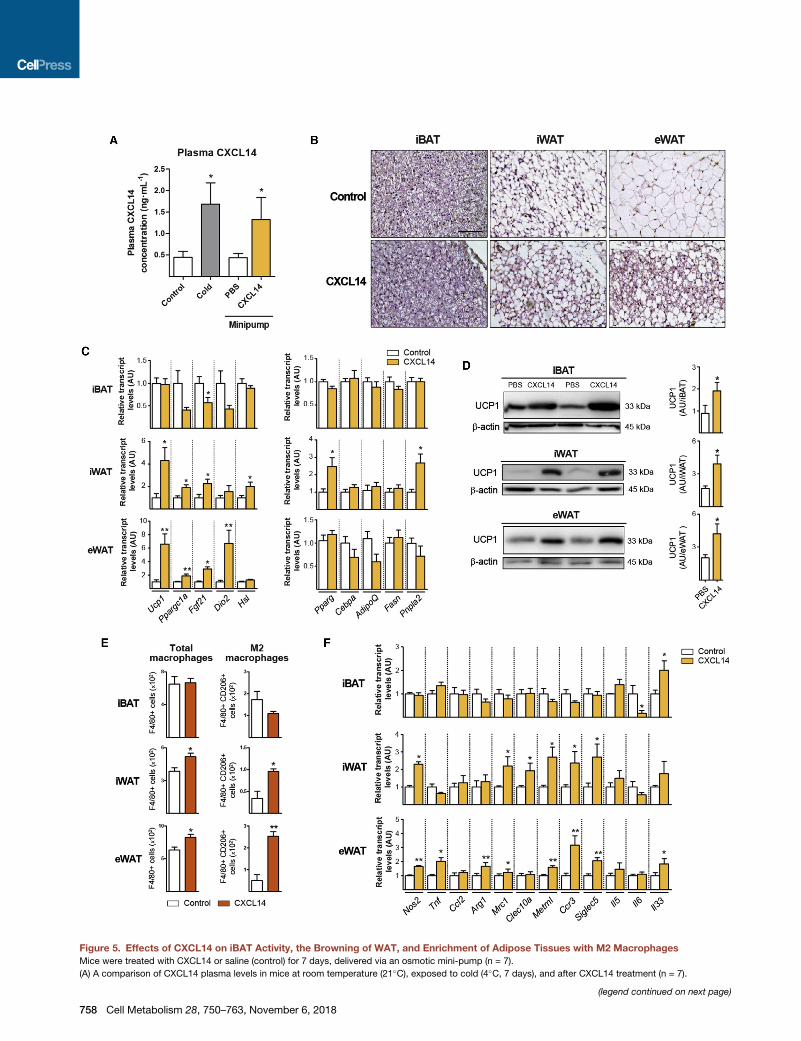
Figure 5. Effects of CXCL14 on iBAT Activity, the Browning of WAT, and Enrichment of Adipose Tissues with M2 Macrophages
Mice were treated with CXCL14 or saline (control) for 7 days, delivered via an osmotic mini-pump (n = 7).
(A) A comparison of CXCL14 plasma levels in mice at room temperature (21�C), exposed to cold (4�C, 7 days), and after CXCL14 treatment (n = 7).
(legend continued on next page)
758 Cell Metabolism 28, 750–763, November 6, 2018

andDio2 in eWAT (Figure 6E), whereas UCP1 protein levels were
significantly increased in the three adipose depots after treat-
ment of HFD-fed mice with CXCL14 (Figure 6F). These increases
in UCP1 were accompanied by significant recruitment of M2
(CD206+) macrophages to iWAT and eWAT, with minor effects
on total (F4/80+) macrophages (Figures 6G and S5D). CXCL14
treatment upregulated marker genes of M2 macrophage
infiltration (e.g., Arg1), and eosinophil recruitment (e.g., Siglec5,
Metrn1) was upregulated mainly in eWAT (Figure 6H) but caused
no such induction in other tissues such as liver (Figure 5E).
Collectively, these data indicate that normalization of CXCL14
levels in HFD-fed mice by exogenous administration of
CXCL14 improves glucose homeostasis in association with
increased thermogenic capacity in adipose tissues and M2
macrophage infiltration in WAT.
CXCL14 Treatment Partially Rescues the AlterationsPresent in Cxcl14-Null MiceTreatment for 1 week with recombinant CXCL14 resulting in
plasma levels consistent with the range observed in adult control
mice (0.40 ± 0.05 ng/mL) was found to normalize the hyperinsu-
linemia and HOMA-IR ofCxcl14-null mice (Figure 7A). Moreover,
treatment with CXCL14 improved the glucose intolerance of
Cxcl14-null mice, to levels intermediate between those of un-
treated CXCL14-null mice and WT mice (Figure 7B). The signs
of impaired thermogenic activity in eWAT from Cxcl14-null
mice, such as reduced expression of Fgf21 and Dio2, were
normalized by CXCL14 treatment (Figure 7C). The expression
ofmarker genes for theM2 phenotype,Mrc1 andClec10a, which
were reduced in iBAT fromCxcl14-null mice, were normalized by
CXCL14 treatment, as were both Mrc1 expression in iWAT and
Clec10a expression in eWAT. Interestingly, expression of marker
genes of M1 pro-inflammatory macrophages (as opposed
to M2-polarized macrophages) such as Tnfa and Ccl2 were
increased due to Cxcl14 invalidation in iWAT and eWAT; this
phenomenon was rescued by CXCL14 treatment. Flow-cytome-
try-based assessment of macrophage abundance revealed that
the reduced levels of M2-polarizedmacrophages in the iBAT and
iWAT of Cxcl14-null mice were fully normalized after CXCL14
treatment and that this treatment trended to increase the total
macrophages (Figure 7E).
Type 2 Cytokine Signaling Is Required for theCXCL14-Induced Browning of Adipose TissuesWe further analyzed whether CXCL14 can exert its action on the
browning of WAT in the absence of type 2 cytokine signaling.
We used Stat6-null (Stat6-KO) mice as model of impaired type
2 immune activation, according to previous studies (Rao et al.,
2014; Fabbiano et al., 2016). CXCL14 treatment of Stat6-KO
mice resulted in an approximately 3-fold rise in circulating
CXCL14 levels, similar to that achieved in WT mice (1.20 ±
(B) Representative optical microscopy images of H&E-stained iBAT, iWAT, and e
(C) mRNA levels of genes related to thermogenic function, adipogenesis, and lip
(D) Representative images of UCP1 immunoblot (left) and UCP1 protein levels p
(E) F4/80+ (total macrophages, left) and CD206+ F4/80+ (M2 macrophages, righ
(F) mRNA levels of genes related to immune cell infiltration in iBAT, iWAT, and eW
Data are presented as mean ± SEM in all cases. *p < 0.05, **p < 0.01, and ***p < 0
t test was used for comparisons. See also Figure S5 and Table S2.
0.11 ng/mL in CXCL14-treated versus 0.36 ± 0.22 ng/mL in con-
trol Stat6-KO mice; 1.42 ± 0.40 ng/mL versus 0.44 ± 0.09 ng/mL
in control WT mice). As expected, CXCL14 treatment failed to
induce the expression levels of the M2 macrophage marker
genes Arg1, Mrc1, and Clec10a at any adipose depot of
Stat6-KO mice (Figure S5F). A 1-week treatment with CXCL14
failed to elicit significant browning of iWAT and eWAT in
Stat6-KO mice, which contrasted with the effects elicited in
WT mice. This was evidenced by the microscopic morphology
of iWAT and eWAT depots (total absence of multilocular
cells in CXC14-treated Stat-6 KO mice) (Figure 7F), and the
lack of upregulation among thermogenic genes—such as
Ucp1, Ppargc1a, Fgf21, and Dio2—in Stat6-KO mice treated
with CXCL14 (Figure 7G).
DISCUSSION
CXCL14 was originally identified as a chemokine with possible
involvement in tumor progression and organogenesis, but no
specific cognate receptor has been identified to date (Benarafa
andWolf, 2015). Broad chemotactic effects of CXCL14 involving
monocytes, immature dendritic cells, neutrophils, and natural
killer cells have been reported (Lu et al., 2016). Our present
results indicate that thermogenic stimuli led to increased
CXCL14 levels and the release of CXCL14 by BAT. This release
was associated with strong promotion of macrophage recruit-
ment, especially among macrophages of the M2 phenotype,
and browning of WAT. Moreover, experimental normalization
of CXCL14 levels, which are reduced in obesity, was associated
with signs of improved glucose homeostasis, enhanced iBAT ac-
tivity, and eWAT browning. Suppression of CXCL14 impaired
BAT activity and reduced the recruitment of M2 macrophages
to BAT. Notably, our experiments indicate that WAT browning
was more strongly affected than BAT in our CXCL14 gain-
of-function setting (an experimentally induced increase in
CXCL14 levels), whereas BAT appeared to be more strongly
affected in the CXCL14 loss-of-function setting (Cxcl14-null
mice). Although impacts of experimental manipulations cannot
be ruled out, these observations seem to suggest that thermo-
genic processes and M2 macrophage recruitment events are
distinctly sensitive to CXCL14 levels in WAT depots and BAT.
The observed browning of eWAT (a WAT depot that is relatively
insensitive to browning under physiological conditions) in
response to CXCL14 may reflect the existence of an additional
thermogenic-capacity-recruiting pathway that does not involve
standard sympathetic mechanisms. In any case, our findings
point to a new mechanism through which inter-tissue communi-
cation controls adaptations to thermogenic activation. Although
non-BAT sources of CXCL14 cannot be totally ruled out, our data
are consistent with the notion that the CXCL14 released by BAT
in response to thermogenic stimuli promotes the recruitment of
WAT (n = 7); scale bar: 100 mm.
id homeostasis in iBAT, iWAT, and eWAT.
er adipose depot (right).
t) cells in the SVF from adipose tissues.
AT.
.001 for the effects of CXCL14 compared with controls. A two-tailed Student’s
Cell Metabolism 28, 750–763, November 6, 2018 759

Figure 6. Effects of CXCL14 on Metabolic Status, the Browning of WAT, and Enrichment of Adipose Tissues with M2 Macrophages in
HFD-Fed Mice
Mice were fed a HFD or standard diet (SD) for 15 weeks and then implanted with mini-pumps delivering CXCL14 or saline (control) (n = 7).
(A) Plasma levels of CXCL14 in SD-fed mice, HFD-fed mice, and HFD-fed mice treated with CXCL14.
(B) A comparison of the effects of HFD and SD on CXCL14 mRNA levels in iBAT and eWAT.
(C) Blood glucose and plasma insulin levels.
(D) Glucose tolerance test curves (left) and plasma insulin levels 30 min after glucose injection (right).
(E) mRNA levels of genes related to thermogenic function in iBAT, iWAT, and eWAT.
(F) Representative images of UCP1 immunoblots (left) and UCP1 protein levels per adipose depot (right).
(G) Quantification of immunoreactive signals of immunohistofluorescence labeling of F4/80 and CD206 in iBAT, iWAT, and eWAT.
(H) mRNA levels of genes related to immune infiltration in iBAT, iWAT, and eWAT.
Data are presented as mean ± SEM in all cases. *p < 0.05, **p < 0.01, and ***p < 0.001 for the effects of CXCL14 compared with controls; #p < 0.05, and###p < 0.001 for the effects of HFD versus SD. A two-tailed Student’s t test was used for comparisons, except in (A), where ANOVAwith Tukey’s post hoc test was
used. See also Figures S5 and S6.
760 Cell Metabolism 28, 750–763, November 6, 2018

Figure 7. Effects of CXCL14 on CXCL14-Null and Stat6-Null Mice
CXCL14-null mice and Stat6-null mice were treated with CXCL14 or saline (control) for 7 days delivered via an osmotic mini-pump.
(A)–(E) Data for CXCL14 treatment of CXCL14-null mice are shown (N = 7 each group). (A) Glucose, insulin and HOMA-IR levels; (B) glucose tolerance; (C) mRNA
levels of genes related to thermogenic function in iBAT, iWAT, and eWAT; (D) mRNA levels of genes related to immune cell infiltration in iBAT, iWAT, and eWAT;
and (E) F4/80+ (total macrophages) and CD206+ F4/80+ (M2 macrophages) cells in the SVF from adipose tissues.
(F and G) Data for CXCL14 treatment of Stat6-null mice are shown (n = 6). (F) Representative optical microscopy images of H&E-stained iBAT, iWAT, and eWAT;
scale bar: 50 mm; (G) mRNA levels of genes related to thermogenic function in iBAT, iWAT, and eWAT.
Data are shown asmean ± SEM in all cases. In (A)–(E), *p < 0.05 and **p < 0.01 show the effects of CXCL14-KO versusWT, whereas # p < 0.05 shows the effects of
CXCL14 treatment on CXCL14-KO mice. In (F) and (G), *p < 0.05 and **p < 0.01 show the effects of CXCL14 treatment. ANOVA with Tukey’s post hoc test was
used in (A)–(E); two-tailed Student’s t test was used in (F) and (G). See also Figure S5.
M2 macrophages to adipose depots, leading to WAT browning
and even BAT activation.
The few studies that have investigated CXCL14 in a metabolic
context have yielded contradictory findings, which have ranged
from indications that CXCL14 improves glucose uptake in
response to insulin in adipocytes (Takahashi et al., 2007) to sug-
gestions that it promotes insulin resistance in female mice (Nara
et al., 2007). A lean phenotype and improved insulin sensitivity
have been reported specifically in female Cxcl14-null mice
when compared with Cxcl14-haploinsuficient female mice (Ta-
negashima et al., 2010). Further research would be needed to
ascertain why these findings are in contrast with our current
data. However, we speculate that the differences might relate
to the use of Cxcl14-null mice that survived the high perinatal
Cell Metabolism 28, 750–763, November 6, 2018 761

mortality rates observed in the colony used by Tanegashima
et al. (2010) and/or to the specific use of females, given that
Cxcl14 is reportedly controlled by estrogen receptors (Lin
et al., 2007). Our data consistently showed the positive associa-
tions between CXCL14 levels and improved glucose homeosta-
sis, BAT activation, and WAT browning in several loss-of-func-
tion models (neonates and adult males) and gain-of-function
models (CXCL14 treatment of standard diet-fed mice and
HFD-induced obese mice). These effects were strongly associ-
ated with the capacity of CXCL14 to recruit macrophages, espe-
cially those of the M2 phenotype, to adipose depots.
Since the initial studies by Nguyen et al. (2011), several labora-
tories have reported that the thermogenic activation of BAT and
the browning of WAT are associated with type 2 cytokine activa-
tion and local recruitment of M2 macrophages (for review, see
Villarroya et al., 2018). Injection of engineered anti-inflammatory
macrophages has been reported to induce WAT browning and
improve diet-induced insulin resistance (Liu et al., 2015). The
molecular mechanisms that link M2 macrophage recruitment
to thermogenic activation processes in BAT and WAT are un-
known, and recent work (Fischer et al., 2017) has raised ques-
tions regarding the earlier proposal that NE produced by M2
macrophages may contribute to the classical adrenergic
pathway of brown and beige adipocyte activation. It has also
been claimed that M2 macrophages support browning by
removing cell remnants during the tissue remodeling that is
associated with WAT browning and/or through the synthesis of
endogenous PPARg agonists (Lee et al., 2016).
Regardless of the consideration of brown adipocytes as tar-
gets of macrophage activity, our current findings recognize
brown adipocytes as active actors in signaling to immune cells.
We herein identify and describe a novel, BAT-derived signaling
mechanism that involves the release of the chemokine CXCL14
by thermogenically activated brown adipocytes. Through this
release of CXCL14, brown adipocytes control macrophage
recruitment and polarization at adipose tissue depots, thus
contributing to the remodeling of adipose tissues via crosstalk
with immune cells.
LIMITATIONS OF STUDY
The use of general CXCL14-null mice in our studies makes it diffi-
cult to unequivocally establish the specific contribution of BAT
to systemic CXCL14 levels. Another limitation is that the use
of Stat6-null mice, while allowing establishment of the role of
type 2 cytokine signaling, does not allow us to definitively rule
out the involvement of immune cells other than M2macrophages
in the effects ofCXCL14onbrown/beigeactivation.Moreover, the
ultimate reasons for the differences of our current findings from
previous research mainly in CXCL14-null female mice should
deserve further research. Finally—though we did not specifically
address this in our study—our findings contribute to the ongoing
debate on the mechanisms of crosstalk between immune cell
and brown/beige adipocytes during thermogenic adaptations.
STAR+METHODS
Detailed methods are provided in the online version of this paper
and include the following:
762 Cell Metabolism 28, 750–763, November 6, 2018
d KEY RESOURCES TABLE
d CONTACT FOR REAGENT AND RESOURCE SHARING
d EXPERIMENTAL MODEL AND SUBJECT DETAILS
B Animal experiments
B Human samples
B Cell culture
d METHOD DETAILS
B Transcriptomic data mining strategy
B Real-time RT-PCR
B Western blotting
B Quantification of circulating parameters
B Histological analysis
B Thermography imaging
B Flow cytometry analysis of immune cells
B Glucose oxidation
B Chemotaxis assay
d QUANTIFICATION AND STATISTICAL ANALYSIS
SUPPLEMENTAL INFORMATION
Supplemental Information includes seven figures and three tables and can be
found with this article online at https://doi.org/10.1016/j.cmet.2018.07.015.
ACKNOWLEDGMENTS
We thank A. Pero and M. Morales for technical support. We acknowledge
L. Herrero from the Department of Biochemistry and Physiology, Faculty of
Pharmacy, University of Barcelona for assistance with the flow cytometry ex-
periments, andwe thank A.F. Valledor, J. Font, and E.Glarıa from the Section of
Immunology, Faculty of Biology, University of Barcelona for support with the
bone-marrow-derived macrophage cell culture system. This work was sup-
ported by grants from theMinisterio de Economia y Competitividad (MINECO),
Spain (SAF2017-85722R and PI17/00420), co-financed by the European
Regional Development Fund (ERDF); by the European Community’s Seventh
Framework Program (FP7 BetaBat for F.V. and D.L.E.); and by a grant to
D.L.E. from the Horizon 2020 Program (T2Dsystems; GA667191). T.Q.-L. is
supported by a CONACyT (National Council for Science and Technology in
Mexico) PhD scholarship. R.C., M.C., and S.M.-R. were supported by PhD
scholarships from MINECO, Spain. J.V. and M.P. are ‘‘Juan de la Cierva’’
post-doctoral researchers by MINECO.
AUTHOR CONTRIBUTIONS
The experiments were conceived and designed by R.C., M.G., and F.V. RNA-
seq data were obtained and analyzed by J.-V.T., R.C., and D.L.E. Experiments
with mice were performed by R.C., A.G.-N., M.P., and M.C. Arterio-venous
blood analyses were performed by T.M. and R.I. Cell culture experiments
were performed by R.C., T.Q.-L., S.M.-R., and J.V. Human data were obtained
by D.S.-I. Overall data were analyzed by R.C., M.G., D.L.E., and F.V. The
manuscript was written by F.V. and revised/approved by all contributors.
DECLARATION OF INTERESTS
The authors declare that they have no conflict of interest.
Received: July 18, 2017
Revised: May 23, 2018
Accepted: July 26, 2018
Published: August 16, 2018
REFERENCES
Benarafa, C., and Wolf, M. (2015). CXCL14: the Swiss army knife chemokine.
Oncotarget 6, 34065–34066.

Bendtsen, J.D., Jensen, L.J., Blom, N., Von Heijne, G., and Brunak, S. (2004).
Feature-based prediction of non-classical and leaderless protein secretion.
Protein Eng. Des. Sel. 17, 349–356.
Brestoff, J.R., Kim, B.S., Saenz, S.A., Stine, R.R., Monticelli, L.A., Sonnenberg,
G.F., Thome, J.J., Farber, D.L., Lutfy, K., Seale, P., and Artis, D. (2015). Group
2 innate lymphoid cells promote beiging of white adipose tissue and limit
obesity. Nature 519, 242–246.
Cannon, B., and Nedergaard, J. (2004). Brown adipose tissue: function and
physiological significance. Physiol. Rev. 84, 277–359.
Duteil, D., Tosic, M., Lausecker, F., Nenseth, H.Z., M€uller, J.M., Urban, S.,
Willmann, D., Petroll, K., Messaddeq, N., Arrigoni, L., et al. (2016). Lsd1
Ablation Triggers Metabolic Reprogramming of Brown Adipose Tissue. Cell
Rep. 17, 1008–1021.
Emanuelsson, O., Brunak, S., von Heijne, G., and Nielsen, H. (2007). Locating
proteins in the cell using TargetP, SignalP and related tools. Nat. Protoc. 2,
953–971.
Fabbiano, S., Suarez-Zamorano, N., Rigo, D., Veyrat-Durebex, C., Stevanovic
Dokic, A., Colin, D.J., and Trajkovski, M. (2016). Caloric Restriction Leads to
Browning of White Adipose Tissue through Type 2 Immune Signaling. Cell
Metab. 24, 434–446.
Fischer, K., Ruiz, H.H., Jhun, K., Finan, B., Oberlin, D.J., van der Heide, V.,
Kalinovich, A.V., Petrovic, N., Wolf, Y., Clemmensen, C., et al. (2017).
Alternatively activated macrophages do not synthesize catecholamines or
contribute to adipose tissue adaptive thermogenesis. Nat. Med. 23, 623–630.
Galic, S., Fullerton, M.D., Schertzer, J.D., Sikkema, S., Marcinko, K., Walkley,
C.R., Izon, D., Honeyman, J., Chen, Z.P., van Denderen, B.J., et al. (2011).
Hematopoietic AMPK b1 reduces mouse adipose tissue macrophage inflam-
mation and insulin resistance in obesity. J. Clin. Invest. 121, 4903–4915.
Herrero, L., Shapiro, H., Nayer, A., Lee, J., and Shoelson, S.E. (2010).
Inflammation and adipose tissue macrophages in lipodystrophic mice. Proc.
Natl. Acad. Sci. USA 107, 240–245.
Hondares, E., Iglesias, R., Giralt, A., Gonzalez, F.J., Giralt, M., Mampel, T., and
Villarroya, F. (2011). Thermogenic activation induces FGF21 expression and
release in brown adipose tissue. J. Biol. Chem. 286, 12983–12990.
Lee, M.W., Odegaard, J.I., Mukundan, L., Qiu, Y., Molofsky, A.B., Nussbaum,
J.C., Yun, K., Locksley, R.M., and Chawla, A. (2015). Activated type 2 innate
lymphoid cells regulate beige fat biogenesis. Cell 160, 74–87.
Lee, Y.H., Kim, S.N., Kwon, H.J., Maddipati, K.R., and Granneman, J.G.
(2016). Adipogenic role of alternatively activatedmacrophages in b-adrenergic
remodeling of white adipose tissue. Am. J. Physiol. Regul. Integr. Comp.
Physiol. 310, R55–R65.
Lin, C.Y., Vega, V.B., Thomsen, J.S., Zhang, T., Kong, S.L., Xie, M., Chiu, K.P.,
Lipovich, L., Barnett, D.H., Stossi, F., et al. (2007). Whole-genome cartography
of estrogen receptor alpha binding sites. PLoS Genet. 3, e87.
Liu, X., Zheng, Z., Zhu, X., Meng, M., Li, L., Shen, Y., Chi, Q., Wang, D., Zhang,
Z., Li, C., et al. (2013). Brown adipose tissue transplantation improves whole-
body energy metabolism. Cell Res. 23, 851–854.
Liu, P.S., Lin, Y.W., Burton, F.H., and Wei, L.N. (2015). Injecting engineered
anti-inflammatory macrophages therapeutically induces white adipose tissue
browning and improves diet-induced insulin resistance. Adipocyte 4, 123–128.
Lu, J., Chatterjee, M., Schmid, H., Beck, S., and Gawaz, M. (2016). CXCL14 as
an emerging immune and inflammatory modulator. J. Inflamm. (Lond.) 13, 1.
Lynes, M.D., Leiria, L.O., Lundh, M., Bartelt, A., Shamsi, F., Huang, T.L.,
Takahashi, H., Hirshman, M.F., Schlein, C., Lee, A., et al. (2017). The cold-
induced lipokine 12,13-diHOME promotes fatty acid transport into brown ad-
ipose tissue. Nat. Med. 23, 631–637.
Min, S.Y., Kady, J., Nam, M., Rojas-Rodriguez, R., Berkenwald, A., Kim, J.H.,
Noh, H.L., Kim, J.K., Cooper, M.P., Fitzgibbons, T., et al. (2016). Human ‘brite/
beige’ adipocytes develop from capillary networks, and their implantation im-
proves metabolic homeostasis in mice. Nat. Med. 22, 312–318.
Mutch, D.M., Rouault, C., Keophiphath, M., Lacasa, D., and Clement, K.
(2009). Using gene expression to predict the secretome of differentiating hu-
man preadipocytes. Int. J. Obes. 33, 354–363.
Nara, N., Nakayama, Y., Okamoto, S., Tamura, H., Kiyono, M., Muraoka, M.,
Tanaka, K., Taya, C., Shitara, H., Ishii, R., et al. (2007). Disruption of CXC motif
chemokine ligand-14 in mice ameliorates obesity-induced insulin resistance.
J. Biol. Chem. 282, 30794–30803.
Nedergaard, J., and Cannon, B. (2013). UCP1 mRNA does not produce heat.
Biochim. Biophys. Acta 1831, 943–949.
Nguyen, K.D., Qiu, Y., Cui, X., Goh, Y.P., Mwangi, J., David, T., Mukundan, L.,
Brombacher, F., Locksley, R.M., and Chawla, A. (2011). Alternatively activated
macrophages produce catecholamines to sustain adaptive thermogenesis.
Nature 480, 104–108.
Odegaard, J.I., Lee, M.W., Sogawa, Y., Bertholet, A.M., Locksley, R.M.,
Weinberg, D.E., Kirichok, Y., Deo, R.C., and Chawla, A. (2016). Perinatal
Licensing of Thermogenesis by IL-33 and ST2. Cell 166, 841–854.
Qiu, Y., Nguyen, K.D., Odegaard, J.I., Cui, X., Tian, X., Locksley, R.M.,
Palmiter, R.D., and Chawla, A. (2014). Eosinophils and type 2 cytokine
signaling in macrophages orchestrate development of functional beige fat.
Cell 157, 1292–1308.
Quesada-Lopez, T., Cereijo, R., Turatsinze, J.V., Planavila, A., Cairo, M.,
Gavalda-Navarro, A., Peyrou, M., Moure, R., Iglesias, R., Giralt, M., et al.
(2016). The lipid sensor GPR120 promotes brown fat activation and FGF21
release from adipocytes. Nat. Commun. 7, 13479.
Rao, R.R., Long, J.Z., White, J.P., Svensson, K.J., Lou, J., Lokurkar, I.,
Jedrychowski, M.P., Ruas, J.L., Wrann, C.D., Lo, J.C., et al. (2014).
Meteorin-like is a hormone that regulates immune-adipose interactions to
increase beige fat thermogenesis. Cell 157, 1279–1291.
Seale, P., Kajimura, S., Yang, W., Chin, S., Rohas, L.M., Uldry, M., Tavernier,
G., Langin, D., and Spiegelman, B.M. (2007). Transcriptional control of brown
fat determination by PRDM16. Cell Metab. 6, 38–54.
Stanford, K.I., Middelbeek, R.J., Townsend, K.L., An, D., Nygaard, E.B.,
Hitchcox, K.M., Markan, K.R., Nakano, K., Hirshman, M.F., Tseng, Y.H., and
Goodyear, L.J. (2013). Brown adipose tissue regulates glucose homeostasis
and insulin sensitivity. J. Clin. Invest. 123, 215–223.
Suarez-Zamorano, N., Fabbiano, S., Chevalier, C., Stojanovi�c, O., Colin, D.J.,
Stevanovi�c, A., Veyrat-Durebex, C., Tarallo, V., Rigo, D., Germain, S., et al.
(2015). Microbiota depletion promotes browning of white adipose tissue and
reduces obesity. Nat. Med. 21, 1497–1501.
Takahashi, M., Takahashi, Y., Takahashi, K., Zolotaryov, F.N., Hong, K.S., Iida,
K., Okimura, Y., Kaji, H., and Chihara, K. (2007). CXCL14 enhances insulin-de-
pendent glucose uptake in adipocytes and is related to high-fat diet-induced
obesity. Biochem. Biophys. Res. Commun. 364, 1037–1042.
Tanegashima, K., Okamoto, S., Nakayama, Y., Taya, C., Shitara, H., Ishii, R.,
Yonekawa, H., Minokoshi, Y., and Hara, T. (2010). CXCL14 deficiency in
mice attenuates obesity and inhibits feeding behavior in a novel environment.
PLoS ONE 5, e10321.
Tarraga, J., Medina, I., Carbonell, J., Huerta-Cepas, J., Minguez, P., Alloza, E.,
Al-Shahrour, F., Vegas-Azcarate, S., Goetz, S., Escobar, P., et al. (2008).
GEPAS, a web-based tool for microarray data analysis and interpretation.
Nucleic Acids Res. 36, W308–W314.
Thomou, T., Mori, M.A., Dreyfuss, J.M., Konishi, M., Sakaguchi, M., Wolfrum,
C., Rao, T.N., Winnay, J.N., Garcia-Martin, R., Grinspoon, S.K., et al. (2017).
Adipose-derived circulatingmiRNAs regulate gene expression in other tissues.
Nature 542, 450–455.
Villarroya, F., Cereijo, R., Villarroya, J., and Giralt, M. (2017a). Brown adipose
tissue as a secretory organ. Nat. Rev. Endocrinol. 13, 26–35.
Villarroya, F., Gavalda-Navarro, A., Peyrou, M., Villarroya, J., and Giralt, M.
(2017b). The Lives and Times of Brown Adipokines. Trends Endocrinol.
Metab. 28, 855–867.
Villarroya, F., Cereijo, R., Villarroya, J., Gavalda-Navarro, A., and Giralt, M.
(2018). Toward an Understanding of How Immune Cells Control Brown and
Beige Adipobiology. Cell Metab. 27, 954–961.
Cell Metabolism 28, 750–763, November 6, 2018 763

STAR+METHODS
KEY RESOURCES TABLE
REAGENT or RESOURCE SOURCE IDENTIFIER
Antibodies
Mouse anti-b-actin (clone AC-15) Sigma-Aldrich Cat. #A5441; RRID:AB_476744
Rabbit anti-UCP1 Abcam Cat. #10983; RRID: AB_2241462
Goat anti-mouse:HRP Bio-Rad Cat. #1721011; RRID: AB_11125936
Goat anti-rabbit:HRP Abcam Cat. #ab6721; RRID: AB_955447
Rabbit anti-CXCL14 Santa Cruz Biotechnology Cat. #sc-130979; RRID: AB_10608354
Normal rabbit IgG Sigma-Aldrich Cat. #12-370; RRID: AB_145841
Rat anti-F4/80 Abcam Cat. #ab6640; RRID: AB_1140040
Goat anti-CD206 Santa Cruz Biotechnology Cat. #sc-34577; RRID: AB_2144904
Anti-rat IgG:AlexaFluor 488 ThermoFisher Scientific Cat. #A-21208; RRID: AB_141709
Anti-goat IgG:AlexaFluor 488 ThermoFisher Scientific Cat. #A-11055; RRID: AB_2534102
Rat anti-F4/80:AlexaFluor 488 Bio-Rad Cat. #MCA497A488; RRID: AB_321210
Rat anti-CD206:AlexaFluor 647 Bio-Rad Cat. #MCA2235A647; RRID: AB_324890
Rat anti-CD11b:BV786 BD Biosciences Cat. #740861
Rat anti-SiglecF:APC-Cy7 BD Biosciences Cat. #565527
AlexaFluor488 rat IgG2b isotype control BD Biosciences Cat. #557726; RRID: AB_396834
AlexaFluor647 rat IgG2a isotype control Bio-Rad Cat. # MCA1212A647; RRID: AB_567361
BV786 rat IgG2b isotype control BD Biosciences Cat. #563334
APC-Cy7 rat IgG2a isotyope control BD Biosciences Cat. #552770; RRID: AB_394456
Mouse Fc block antibody BD Biosciences Cat. #553142; RRID: AB_394657
Biological Samples
Human serum samples Department of Endocrinology
and Nutrition, Institut d’Investigacio
Germans Trias i Pujol (Barcelona)
www.germanstrias.org
Chemicals, Peptides, and Recombinant Proteins
(-)-Norepinephrine Sigma-Aldrich Cat. #A0937
Dibutyryl-cAMP Sigma-Aldrich Cat. #D0627
SB 202190 Sigma-Aldrich Cat. # S7067
H-89 dihydrochloride hydrate Sigma-Aldrich Cat. #B1427
CL316,243 Sigma-Aldrich Cat. #C5976
D-[14C(U)]-glucose Hartmann Analytic Cat. #MC-144W
Recombinant murine CXCL14 R&D Systems Cat. #730-XC-025
LPS Sigma-Aldrich Cat. #L2654
Recombinant murine IL-4 PreproTech Cat. #214-14
Recombinant murine IL-13 PreproTech Cat. #210-13
DMEM Biowest Cat. #L0104-500
DMEM/F-12 Life Technologies Cat. #31330
RPMI 1640 Life Technologies Cat. #21875
FBS Life Technologies Cat. #10270106
Penicillin/Streptomycin Life Technologies Cat. #15140
cOmplete-Mini protease inhibitor cocktail Roche Cat. #11836153001
Hoechst 33258 Sigma-Aldrich Cat. #H6024
Critical Commercial Assays
Accu-Check� Aviva glucose test strips Roche Cat. #06453970
Accutrend� triglyceride test strips Roche Cat. #11538144
(Continued on next page)
e1 Cell Metabolism 28, 750–763.e1–e6, November 6, 2018

Continued
REAGENT or RESOURCE SOURCE IDENTIFIER
Transwell� polycarbonate membrane cell
culture inserts
Corning Incorporated Cat. #CLS3422
TaqMan Reverse Transcription Reagents Thermo Fisher Scientific Cat. #N8080234
Platinum Quantitative PCR SuperMix-UDG w/ROX Thermo Fisher Scientific Cat. #11743-500
NucleoSpin� RNA Macherey-Nagel Cat. #740955.250
MILLIPLEX� Multiplex Assay Merck Millipore Cat. #ADKMAG-71K-7
Murine CXCL14 ELISA Cloud-Clone Corp. Cat. #SEB607Mu
Human CXCL14 ELISA Ray Biotech Cat. #ELH-CXCL14
Mouse/rat insulin ELISA Merck Millipore Cat. #EZRMI-13K
Pierce BCA Protein Assay Kit Thermo Fisher Scientific Cat. #23227
Deposited Data
Raw RNA-Sequencing data Quesada-Lopez et al., 2016 GEO: GSE77534
Raw microarray data Seale et al., 2007 GEO: GSE8044
Experimental Models: Cell Lines
RAW 264.7 ATCC Cat. #ATCC� TIB-71; RRID: CVCL_0493
L929 Cells ATCC Cat. #ATCC� CCL-1); RRID: CVCL_0462
Experimental Models: Organisms/Strains
Mouse: Wild type C57BL/6J OlaHsd Envigo Cat. #057
Mouse: B6;129S5-Cxcl14tm1Lex/Mmucd MMRRC Cat. #032258-UCD; RRID: MMRRC_032258-UCD
Mouse: B6;129S2(C)-Stat6tm1Gru/J The Jackson Laboratory Cat. #005977; RRID: IMSR_JAX:005977
Rat: Wild type Wistar; RjHan:WI Janvier Labs RRID: RGD_13508588
Oligonucleotides
TaqMan gene expression probes
(see Table S3 for a full list)
Thermo Fisher Scientific See Table S3
Software and Algorithms
CytExpert 1.2 Beckman Coulter www.beckman.com
GraphPad Prism 5 GraphPad Software www.graphpad.com
ImageJ 2.0 NIH www.fiji.sc
TargetP 1.1 Emanuelsson et al., 2007 www.cbs.dtu.dk/services/TargetP
SecretomeP 2.0 Bendtsen et al., 2004 www.cbs.dtu.dk/services/SecretomeP
GEPAS/Babelomics Tarraga et al., 2008 www.babelomics.org
Significance Analysis of Microarrays (SAM) 3.03 Mutch et al., 2009 statweb.stanford.edu/�tibs/SAM/
Oxylet Metabolism 3.0 Panlab/Harvard Apparatus www.panlab.com
FLIR QuickReport 1.2 FLIR Systems www.flir.com
Science Lab Multigauge 3.0 Fujifilm www.fujifilm.com
Other
7500 Real-Time PCR System Thermo Fisher Scientific Cat. #4351105
Oxylet System for respiratory metabolism Harvard Apparatus Cat. #LE405; Cat. #LE4004FL; Cat. #LE8708TS
High fat diet (45% Kcal fat) Envigo Cat. #12451
Micro-osmotic pumps Alzet Cat. #1007D
Thermal imaging camera FLIR Systems Cat. #T335
CONTACT FOR REAGENT AND RESOURCE SHARING
Further information and requests for resources and reagents should be directed to and will be fulfilled by the Lead Contact, Francesc
Villarroya ([email protected]).
Cell Metabolism 28, 750–763.e1–e6, November 6, 2018 e2

EXPERIMENTAL MODEL AND SUBJECT DETAILS
Animal experimentsWild-type mice
All adult animal experiments were done using males. Experiments using wild-type mice were conducted on 8-week-old C57BL/6J
individuals (Envigo) kept at thermoneutrality (30�C), at room temperature (21�C) or exposed to cold (4�C) for 24 hours or 22 days, as
stated in the text, under controlled lighting conditions in all cases (12/12h light/dark cycle). Mice were maintained under standard
rodent diet (2018, Teklad Diet, Envigo) conditions or, where indicated, fed a high-fat diet for 15 weeks (#D12451, 45% Kcal fat,
Envigo), the latter of which resulted in enhanced adiposity (5.6-fold increase in iWAT pad, 6.5-fold increase in eWAT pad).
Where indicated, mice were anesthetized with 1.5% isoflurane, and implanted with subcutaneous Alzet osmotic mini-pumps
(Cupertino, CA, USA) containing CXCL14 (R&D Systems, Minneapolis, MN, USA) calibrated to release the chemokine at a rate of
4.5 ng$g�1 per day for 7 days; control mice received phosphate buffered saline (PBS) delivered at the same rate. Micro-osmotic
pumps were surgically implanted subcutaneously in the interscapular region. For glucose tolerance tests, 2.5 mg glucose$g-1
body weight (BW) was administered intraperitoneally (i.p.) to mice starved for 6 hours. For insulin tolerance tests, 0.75 insulin
units$kg-1 BW were administered i.p. to mice starved for 3 hours.
Where indicated, the volume of consumed oxygen, the volume of produced carbon dioxide and the respiratory quotient were
determined on anOxylet system (Harvard Apparatus) before and after i.p. injection of 1 mg$kg�1 CL316,243 and analyzedwithOxylet
Metabolism 3.0 (Harvard Apparatus).
Cxcl14-null mice
Wild-type and heterozygous mice from a Cxcl14-KO strain (B6;129S5-Cxcl14tm1Lex/Mmucd), donated by Lexicon Genetics, Inc.,
were obtained from the Mutant Mouse Regional Resource Centre (MMRRC) and the colony was further expanded. Cxcl14+/�
mice in a mixed 129S5 and C57BL/6J background were mated with 129S5 mice (Jackson Laboratory) for three generations. The
resulting Cxcl14-KO and wild-type littermates in an increased 129S5 background were viable and were used for studies in adult
(8-week-old males) and neonatal (three-day-old) periods. Mice were fed standard diet and maintained under controlled lighting
conditions in all cases (12/12h light/dark cycle).
Stat6-null mice
Stat6-null (B6;129S2(C)-Stat6tm1Gru/J) and wild-type mice were obtained from The Jackson Laboratory (Bar Harbor, USA). 8-week-
oldmale animals fed standard diet were used for experimental procedures. Micewere under controlled lighting conditions in all cases
(12/12h light/dark cycle).
Rats
Male Wistar rats (Janvier Labs, Le Genest-Saint-Isle, France) were used to assess arterio-venous differences in CXCL14 concentra-
tions as previously described (Hondares et al., 2011). Briefly, 8-week old rats were kept at room temperature (21�C) or exposed to 4�Cfor 24 hours or 30 days, under controlled lighting conditions (12/12h light/dark cycle) and standard rodent diet feeding (2018, Teklad
Diet, Envigo). Rats were anesthetized by i.p. injection of sodium barbital (50 mg$kg-1 BW). Sulzer’s vein, which drains blood flowing
through iBAT was exposed, a small incision was performed on it and a heparinized capillary was placed on the incision. Blood was
allowed to flow directly into the capillary. After collection of a total of 100-150 mL of blood, hemorrhage was prevented by compres-
sion and the skin incision was closedwith clips. The abdominal cavity was opened and a blood samples (200-250 ml) were drawn from
the abdominal aorta with a heparinized syringe. Blood samples were then centrifuged and iBAT was excised and frozen in liquid
nitrogen. Blood flow rates, as determined in Hondares et al., 2011, were then used to estimate the net CXCL14 output from iBAT,
calculated from the product of each individual arterio-venous difference and blood flow values for each experimental group.
All animal experiments were performed in accordance with the European Community Council directive 86/609/EEC and were
conducted with the appropriate authorization of the Institutional Animal Care and Use Committee of the University of Barcelona.
Human samplesSerum samples were obtained from 44 Caucasian subjects corresponding to patients with obesity (BMIR 30; N = 15, 47 ± 12 years-
old, 67% female) seen at the Department of Endocrinology and Nutrition, Institut d’Investigacio Germans Trias i Pujol (Badalona,
Spain), and age- and gender-matched lean healthy volunteers (BMI % 25; N = 29, 43 ± 8 years-old, 75% female). Exclusion criteria
were opportunistic infections, acute hepatitis, liver insufficiency, neoplasms or fever of undetermined origin, and treatment with drugs
such as anabolic hormones, systemic corticosteroids or recombinant human growth hormone. Patients were studied before (time 0),
and 3 and 6 months after bariatric surgery (gastric bypass, n = 7; sleeve gastrectomy, n = 8). Mean BMI reductions 3 months and
6months after surgery were 18.6% and 25.6%, respectively. Serumwas obtained from blood drawn from seated patients and volun-
teers after a 12-hour overnight fast and at least 15 minutes after the placement of a peripheral intravenous catheter. The study was
approved by the Institutional Ethics Committee of Hospital Germans Trias i Pujol (approval code CP15/00106), in accordance with
theDeclaration of Helsinki. All participants gave signed consent after being fully informed of the goals and characteristics of the study.
Cell culturePrimary adipocyte culture
Primary brown or white adipocytes were differentiated in culture as previously described (Quesada-Lopez et al., 2016). Briefly,
preadipocytes were isolated from iBAT, iWAT or eWAT of 3-week old male C57BL/6J mice by following a tissue extraction and
e3 Cell Metabolism 28, 750–763.e1–e6, November 6, 2018

collagenase digestion procedure. The resulting mature adipocyte and stromal vascular fractions were stored for subsequent gene
expression analysis. Brown adipocyte differentiation was achieved by exposing confluent precursor cells from iBAT to DMEM/
F-12 medium containing 10% fetal bovine serum (FBS) (Life Technologies) and supplemented with 20 nM insulin, 2 nM triiodothyro-
nine (T3) and 0.1 mM ascorbic acid. Confluent precursor cells from iWAT and eWAT were maintained in DMEM/F-12 containing 10%
inactivated newborn calf serum (iNCS) (Life Technologies) at 37�C in a humidified 7% CO2 incubator. For differentiation, 850 nM
insulin, 3 mM T3, 35 nM dexamethasone and 10 mM rosiglitazone were added. Differentiated brown adipocytes (day 8 of culture)
were treated for 6, 12 and 24 hours with 0.5 mM NE, for 24 hours with 1 mM dibutyryl-cAMP or for 24 hours with 0, 1 or 10 nM
CXCL14, 10 mM SB 202190, and 20 mMH-89. Differentiated inguinal or epididymal white adipocytes (day 15 of culture) were treated
with 0.5 mM NE or 10 nM CXCL14 for 24 hours. Where indicated, cells were used for dynamic measurements (see below) and/or
further collected for RNA extraction. Pictures of culture wells were taken using a clear-field inverted microscope (Leica).
RAW 264.7 cell culture
Murine male RAW 264.7 macrophages were grown in RPMI-1640 medium supplemented with 10% heat-inactivated FBS (iFBS) and
1% penicillin/streptomycin (P/S) (Life Technologies) at 37�C in a humidified 5% CO2 incubator. Cells between passages 15 and 20
were used for the experiments shown. For gene expression assays, macrophages were plated at a concentration of 2.5 3 105
cells$mL-1.Once they reached80%confluence, cellswere serum-starvedandkept inRPMImediumsupplementedwith 0.05%bovine
serum albumin (BSA) for 12 hours. Then, macrophages were either classically activated with 60 ng$mL-1 (LPS; Sigma-Aldrich) or alter-
natively activated with 40 ng$mL-1 IL-4 or with 60 ng$mL-1 IL-13 (PeproTech) for 12 hours. Thereafter, cells were used for chemotaxis
assays (see below) or were treatedwith conditionedmedium (CM) from brown adipocytes differentiated in culture as described above
(medium collected on day 8 of culture) for 12 hours. Cells were then harvested and RNA was extracted as described below.
BMDM primary culture
Bone marrow was extracted from the limbs of 8-week-old male mice by perfusion with DMEM and precursors were differentiated in
DMEM supplemented with 20% iFBS, 30% L929-cell conditioned medium and 1% P/S for 7 days in a humidified 5% CO2 incubator
at 37�C. L929-cell conditionedmediumwas obtained from a 7 day-culture of cells at passage 10,maintained in DMEMsupplemented
with 10% iFBS in a humidified 5% CO2 incubator at 37�C. Differentiated macrophages were subsequently scraped and plated in
DMEM supplemented with 10% iFBS and 1% P/S. Upon adhesion, cells were serum-starved (1% iFBS), activated to the M1 or
M2 polarization states with LPS (60 ng$mL-1) or IL-4 (40 ng$mL-1) as described above and used for chemotaxis assays or brown
adipocyte CM treatment as performed for RAW 264.7 cells.
METHOD DETAILS
Transcriptomic data mining strategyRetrieval of microarray and RNA-seq data
Geneexpressiondata from themicroarrayGSE8044, showing transcriptomic profiles in iBATandeWAT from8-week-oldmaleC57BL/
6J mice, were downloaded from the public Gene Expression Omnibus (GEO) database (www.ncbi.nlm.nih.gov/sites/GDSbrowser).
Raw transcriptomic data were log-transformed without background signal extraction and a bulk Loess normalization was applied to
all datasets using theGEPAS/Babelomics online software (Tarraga et al., 2008) in order to provide an initial filter for reducing false-pos-
itive results as previously described (Mutch et al., 2009). Differential gene expression was assessed using the Significance Analysis of
Microarrays (SAM) software (statweb.stanford.edu/�tibs/SAM), an R-based application for mass statistical analysis of microarray
data. The falsediscovery rate (FDR) valuewasset to 1.25% inorder toprovide sufficient restrictiveness toavoid false-positive detection
with little compromise of true positive results. AP-value of 0.05was used as the significance threshold and only probes corresponding
to known gene IDswere considered for further analysis. For the analysis of cold-induced transcripts, we used a RNA-seq-based data-
base (GEO:GSE77534), obtained in iBAT frommice exposed to 4�C for 24 hours versusmice kept at thermoneutrality (30�C). Retrievalof cold-induced transcripts was performed as reported previously (Quesada-Lopez et al., 2016). In brief, a list of transcripts expressed
in both temperature conditions was obtained from the deposited data. This corresponded to sequenced cDNAs mapped to the
Ensembl 73 dataset (www.ensembl.org) in which relative coverage rates, measured in RPKM units (reads per kilobase per million
mapped reads), had been assigned to all BAT transcripts. From the assessed transcriptomic reads, 33345 corresponded to distinct
genes. In order to define significant variations in gene expression, fold changes were calculated for each gene as the ratio between
the sum of the RPKM of all transcripts under the cold condition and the same for those in thermoneutrality. Significance of such
variations was assessed by a Fisher’s exact test corrected by the Benjamini–Hochberg method (which enables consideration of the
number of reads mapped to a given gene and that mapped to all other genes in the cold condition compared to thermoneutrality).
Only those transcripts in which differences in expression were significant (p < 0.05) were considered for further comparisons.
Prediction of secreted proteins
Official gene symbols and UniProt accession numbers were retrieved for each significant probe from SAM results using the Mouse
Genome Informatics batch query service (http://www.informatics.jax.org/batch/?page=batchQF). Full sequences of each coding
protein were also retrieved from the UniProt database. These sequences were analyzed with two different CBS secretion prediction
programs, as previously reported (Mutch et al., 2009): TargetP 1.1, a software package that predicts the subcellular or extracellular
location of a eukaryotic protein by panning its N-terminal sequence for the presence of a signal peptide sequence or the lack thereof
(Emanuelsson et al., 2007), and SecretomeP 2.0, to focus on possible non-classically secreted proteins in which no signal peptide is
found (Bendtsen et al., 2004). The resulting protein database was compared with the Gene Ontology database for annotation as
Cell Metabolism 28, 750–763.e1–e6, November 6, 2018 e4

‘‘extracellular’’ and with bibliographical sources (NCBI, ISI Web of Knowledge, and Google Scholar) to provide evidence of secretion
of every specific protein taken into consideration. The resulting information was compiled into a database and integrated into a dif-
ferential expression and secretable potential query application in a Microsoft Excel runtime environment.
Real-time RT-PCRAt predetermined endpoints, animals were sacrificed and organ samples were weighted and frozen in liquid nitrogen until further
processing. Differential expression of genes of interest was quantified by real-time reverse transcriptase polymerase chain reaction
(RT-qPCR). Total RNA was isolated from tissue or cell homogenates using the NucleoSpin RNA kit (Macherey-Nagel). Reverse tran-
scription was performed using 0.5 mg of total RNA, random hexamer primers andMultiscribe reverse transcriptase (TaqMan Reverse
Transcription Reagents; Thermo Fisher Scientific, Foster City, CA, USA), according to the manufacturer’s protocol. Platinum Quan-
titative PCR SuperMix-UDG with ROX reagent (Thermo Fisher Scientific) was used as a master mix in a final volume of 20 mL con-
taining specific TaqMan probes for each candidate gene, as provided by the supplier. An ABI 7500 Real-Time PCR System (Thermo
Fisher Scientific) was used to assess RT-qPCR amplification. Expression of target genes in all samples was normalized to that of the
18S rRNA housekeeping gene.
Western blottingTissue extracts for protein analysis were prepared by homogenization in a buffer containing 50 mM Tris HCl (pH 7.4), 150 mM NaCl,
0.1 mM EDTA, 0.1 mM EGTA, 1% NP-40, 0.5% sodium deoxycholate, 0.1% sodium dodecyl sulfate, 2 mM sodium orthovanadate,
10 mM b-glycerophosphate, 5 mM sodium fluoride and a protease inhibitor cocktail (cOmplete-Mini, Roche, Sant Cugat del Valles,
Spain). Protein concentration in each sample was determined by the BCA method (Thermo Fisher Scientific). Total protein
(30 mg/lane) was resolved by sodium dodecyl sulfate-polyacrylamide gel electrophoresis (SDS-PAGE) on 12% acrylamide/
bisacrylamide gels using aMini Trans-Blot kit (Bio-Rad, Hercules, CA, USA) and transferred to Immobilon-P polyvinylidene difluoride
membranes (GE Healthcare, Little Chalfont, UK). Membranes were then incubated first with primary antibodies specific for UCP1
(ab10983; Abcam) or b-actin (A5441, Sigma-Aldrich) followed by incubation with horseradish peroxidase-conjugated anti-rabbit
IgG (ab6721, Abcam) or anti-mouse IgG (1721011, Bio-Rad) secondary antibodies. Signals were detected using a chemilumines-
cence horseradish peroxidase substrate (EMD Millipore) and expressed relative to b-actin signal and total tissue abundance.
Digitized images were quantified using the Multi Gauge V3.0 software suite (Fujifilm, Tokyo, Japan).
Quantification of circulating parametersBlood glucose and triglyceride levels were measured using specific reactive strips (Accu-Check Aviva and Accutrend triglyceride,
respectively; Roche, Basel, Switzerland) on Accutrend Technology devices (Roche). b-hydroxybutyrate was determined by
spectrophotometric methods (WakoDiagnostics, Richmond, VA, USA). Circulating levels of resistin, plasminogen activator inhibitor 1
(PAI-1), TNFa, MCP-1/CCL-2 and IL-6 were determined using a soluble protein quantification system (Milliplex kit ADKMAG-71K-7,
Millipore, Billerica, MA, USA). Insulin plasma levels were determined with an enzyme-linked immunoassay (ELISA) kit (EZRMI-13K,
Merck-Millipore). CXCL14 plasma levels and abundance in culture media were quantified with ELISA kits specific for rodents
(SEB607Mu, Cloud-Clone Corp., Wuhan, Hubei, PRC) or humans (ELH-CXCL14; RayBiotech, Norcross, GA. USA).
Histological analysisSamples from iBAT, iWAT and eWATwere fixed for 24 hours in 4%paraformaldehyde and embedded in paraffin. Paraffin blockswere
cut into 5 mM sections and stained with hematoxylin and eosin (H&E) or used for immunohistofluorescence (IHF) staining. For IHF,
rehydrated tissue sections were blocked with 3% BSA for 1h at room temperature. Preparations were then incubated with rat anti-
mouse F4/80 (ab6640, Abcam) or goat anti-mouse CD206 (sc-34577, Santa Cruz Biotechnology, Santa Cruz, CA, USA) antibodies
at a concentration of 10mg$mL-1 followedbyAlexaFluor 488-conjugatedanti-rat or anti-goat IgGsecondary antibodies (ThermoFisher
Scientific). Immunofluorescence signalswere visualized under a fluorescencemicroscope (Leica) and quantified using the ImageJ 2.0
imaging suite (U.S. National Institutes of Health, Bethesda, MD, USA). All signal counting procedures were performed by a blinded
observer. Mean lipid droplet surface in adipose tissue H&E-stained samples was, in turn, quantified with ImageJ 2.0 (NIH).
Thermography imagingSurface temperatures were recorded using a T335 infrared digital thermal imaging camera (FLIR Systems, Wilsonville, OR, USA),
which features a thermal sensitivity of 0.1�C and an image resolution of 6403 480 pixels. Environmental parameters (relative humid-
ity, room temperature and reflected apparent temperature) weremeasured in situ and set in the camera as parametric inputs from the
experiment. Triplicate infrared pictures of non-anaesthetized animals were taken from a distance of 30 cm. Adult mice had been
shaved 48 hours before thermographic measurements. The resulting images were analyzed using the FLIR QuickReport 1.2 software
package (FLIR Systems) so as to normalize temperature ranges and to quantify temperature values arising from the isotherms.
Maximal temperature values from the interscapular and the dorso-lumbar areas were retrieved, and a ratio of the two was calculated
as a measure of interest. For analysis of neonates, only measurements from pups that survived more than 7 days after birth were
considered for calculations. Core temperature levels were determined through non-invasive infrared eye temperature measurement
(Suarez-Zamorano et al., 2015; Quesada-Lopez et al., 2016) after previous validation with rectal temperature measurement using a
KM-1420 temperature recorder (Kane-May Measuring Instruments, UK).
e5 Cell Metabolism 28, 750–763.e1–e6, November 6, 2018
Flow cytometry analysis of immune cellsFlow cytometry analyses of immune cells in adipose tissues were performed essentially as previously described (Herrero et al., 2010).
iBAT, iWAT and eWAT from 8-week old male mice implanted with CXCL14- or saline-delivering micro-osmotic pumps for 7 days and
controls were excised upon sacrifice and submerged in KRB buffer (12.5 mM HEPES pH 7.4, 120 mM NaCl, 6 mM KCl, 1.2 mM
MgSO4, 1 mM CaCl2, 2% BSA, 2.5 mM glucose) at 37�C. Tissues were then cut into smaller fragments and digested for 40 minutes
at 37�C with high-speed shaking in a KRB buffer-based solution containing 1 mg$mL-1 collagenase II (C6885, Sigma-Aldrich) and
0.2 mg$mL-1 DNase I (DN25, Sigma-Aldrich). EDTA (0.1 M) was added 5 minutes before the end of the digestion, and tissue extracts
were filtered through 250-mmnylon filters. Homogenates were centrifuged at 400 x g for 5 minutes and the resulting upper layer, cor-
responding to adipocytes, was discarded. Pellets, containing the SVF, were then resuspended, centrifuged at 2000 x g for 30 s at 4�Cand incubated for 5 minutes with 100 mL ACK lysis buffer (155 mM NH4Cl, 10 mM KHCO3, 0.1 mM Na2EDTA, pH 7.4) to lyse eryth-
rocytes. 1 mL of 2% iFBS diluted in PBS was added to each tube, which was centrifuged again at 2000 x g for 30 s at 4�C and re-
suspended in 300 mL 2% iFBS-PBS. Cell suspensions were transferred to a 96-well-plate, and centrifuged at 800 x g at 4�C for 3 min
after which 200 mL of 2% FBS-PBS was added to each well. Samples were preincubated with Fc receptor-blocking antibody (Mouse
BD Fc Block, 553142, BD Biosciences) and then incubated with fluorophore-labeled antibodies against F4/80 (MCA497A488, Bio-
Rad), CD206 (MCA2235A647, Bio-Rad), CD11b (740861, BD Biosciences) or SiglecF (565527, BD Biosciences). Fc-blocked, un-
stained cells and cell suspensions stained with nonspecific isotype controls (557726, BD Biosciences; MCA1212A647, Bio-Rad;
563334, BD Biosciences and 552770, BD Biosciences) were used as negative controls. Thereafter, samples were incubated for
20 minutes on ice and washed twice with 2% iFBS-PBS. Cell viability was assessed by adding 1 mg$mL-1 Hoechst 33258 (H6024,
Sigma-Aldrich) to each preparation. Data were acquired on a CytoFLEX flow cytometer (Beckman Coulter) and analyzed using
CytExpert 1.2 software (Beckman Coulter). Adipose tissue SVF-isolated cells were gated on size (side- (SSC-A) and forward-
(FSC-A) scatter area), to exclude debris, and viability (Hoechst 33258-negative) prior to further analysis. Alive cells were then gated
for F4/80+ (macrophages), from which CD206+ cells were defined as M2-polarized macrophages (Figures S7A and S7B).
Glucose oxidationGlucose oxidation was assessed in vitro by quantifying 14CO2 release into the culture media after treating cells with 14C-radiolabelled
glucose. Primary brown adipocytes were differentiated as described above and treated with either 1 or 10 nMCXCL14 for 24 hours or
left untreated. Cells were then glucose-starved for 1 hour prior to incubation for 3 hours with DMEM supplemented with 3 mM
D-[U14C]-glucose (0.1 mCi$mL-1; Hartmann Analytic, Baunschweig, Germany). Culture media was acidified with 3M perchloric
acid (PanReac, Barcelona, Spain), and 14CO2 released from media over the course of 1 hour was collected on Whatman-3 paper
soaked with phenylethylamine (Sigma-Aldrich) placed above the wells in a sealed culture plate. Pieces of paper in contact with
the radioactive isotope were cut off and placed in 10 mL of Ecolite liquid scintillation cocktail (MP Biomedical, France). 14CO2
radioactive signals were measured on a Tri-Carb 2100TR counter (Packard Bioscience) as counts per minute (cpm).
Chemotaxis assayMacrophage chemotaxis was assessed using Costar Transwell chambers on 24-well plates (Corning Incorporated, NY, USA). Mac-
rophages activated with LPS, IL-4 or IL-3 were trypsinized and suspended in serum-free RPMI or DMEM for RAW 264.7 or BMDM,
respectively. The bottomwells of the chemotaxis plates were filled with serum-freemedium, with or without 10 nMCXCL14. CM from
brown adipocytes in primary culture at day 8 of culture (5 days of contact with cells) or the same type media (see above) that had not
been in contact with brown adipocytes, was placed in the lower well. An anti-CXCL14 antibody (Santa Cruz Biotechnology) or a
nonspecific antibody against IgG (Sigma-Aldrich) was added towells containing CM to assess the effects of blocking CXCL14 action.
Classically or alternatively activated macrophage suspensions (2 3 105 cells in 200mL) were placed in the upper wells where they
were separated from the lower wells by polycarbonate membranes with 8.0 mm pores. Plates were then incubated at 37�C for
20 hours. Afterward, media from the upper wells were removed and chambers were rinsed with 1x PBS. Cells were fixed with a
4% formaldehyde solution for 15minutes, washed with PBS, stained with hematoxylin for 30minutes at room temperature and finally
washed in water. Non-migrating cells were gently scrapped from the upper side of the membranes, and migrating macrophages on
the lower side were visualized on an inverted microscope. Cell counts were determined using ImageJ 2.0 software.
QUANTIFICATION AND STATISTICAL ANALYSIS
Data are expressed as means ± standard error of the mean (s.e.m.). Exact numbers of replicates are shown at each figure legend.
Outliers were detected and removed prior to significance analyses usingGrubbs’ test. One-sample t test was used to establish diver-
gence from zero. The Kolmogorov-Smirnov test was used to establish normality of datasets, and two-tailed unpaired Student’s t test
was used to assess statistical significance between two groups. For those datasets which did not pass the normality test, differences
were evaluated using a two-tailed unpaired nonparametric Mann-Whitney’s u-test. One-way analysis of variance (ANOVA) followed
byDunnett’s (comparisons relative to controls) or Tukey’s (multiple comparisons among groups) post hoc tests was used to compare
three or more groups. Statistical analyses were performed with GraphPad Prism 5 (GraphPad Software Inc., San Diego, CA, USA). In
all cases, a P value of 0.05 was set as the significance threshold.
Cell Metabolism 28, 750–763.e1–e6, November 6, 2018 e6