cvtech group inc. - vmbl option on indian minicar market: tata motors has indicated cvtech will be...
TRANSCRIPT

April 23, 2008
Industrial Products
CVTech Group Inc.
All Lined Up
CVT-T: $1.25
Rating: Top Pick Target price: $1.80
David Buma, CFA Mathieu Chevrier Industrial Products Analyst Associate (514) 350-2957 (514) 350-2949 [email protected] [email protected]

David Buma, CFA Industrial Products Analyst 514-350-2957 [email protected] April 23, 2008
CVTech Group Inc. All Lined Up
Page
Investment Highlights ...................................................................................... 1 Company Profile .............................................................................................. 2 Strategy: Capturing Growth & Acquisitions.......................................................... 3 Management Profile & Holdings ......................................................................... 5 Recent Results: Improving Profitability, Leverage................................................. 6 Financial Forecast: Good Long-Term Visibility ...................................................... 8 Valuation: Shares Appear To Be Significantly Undervalued.................................. 11 Key Risks: Customer Concentration & Currency ................................................. 13 Financial Statements...................................................................................... 14 Appendix I – Electricity Outlook ....................................................................... 17 Appendix II – Vehicles Outlook ........................................................................ 26 Appendix III – Important Disclosures ............................................................... 33
Company Report

CVTech Group Inc.
1 David Buma, CFA Industrial Products Analyst 514-350-2957 [email protected] April 23, 2008
Investment Highlights
CVTech Group (CVT-T/ $1.25)
Company Profile
CVTech builds and maintains electricity transmission and distribution (T&D) lines primarily in Québec and the northeastern United States. The company also designs and manufactures continuously variable transmissions (CVTs) and other engine-related parts in minicars and general purpose recreational vehicles.
Source: BigCharts.com
Ticker CVT-T Shares O/S (M) 54.9Rating Top Pick Market Cap (M) $68.6Risk High Float O/S (M) 19.8Price $1.25 Float Value (M) $24.71-Yr Target $1.80 Avg Daily Volume (K) 30.0Dividend $0.02 Control Blocks:1-Yr ROR 45.6% Manag & Dir 32%52 Wk High-Low $1.50-$0.68 Tontine 32%Valuation 10x P/E (2009E)
(December 31 Year End)Fully Diluted EPS Q1 Q2 Q3 Q4 Annual 2007 $0.04 A $0.03 A $0.02 A $0.02 A $0.112008 $0.04 $0.04 $0.03 $0.03 $0.142009 $0.182010 $0.21
EBITDA ($M) Q1 Q2 Q3 Q4 Annual 2007 5.0 A 4.2 A 3.6 A 3.5 A 16.42008 4.8 4.9 4.7 4.6 19.02009 22.62010 25.2
Source: Company reports; Thomson One; LBS estimates.
Market Data
Next Reporting May 2008
Top Pick – Target Price: $1.80 We are initiating coverage on CVTech Group Inc. (CVTech) with a Top Pick rating and a one-year share price target of $1.80 implying a 45.6% ROR. This target is based on a 10x forward P/E multiple. We have a share risk rating of High. We highlight the following: ♦ Strong Growth Prospects: We expect a 24% EPS
CAGR over the forecast horizon, driven by aggressive investment programs at electric utilities in the northeastern US following a long period of neglect. We believe this heightened level of electricity infrastructure spending could last 5-10 years.
♦ Protection Against Economic Downturn: Based on current contracts signed, CVTech has good revenue visibility over the next 16 months. We believe the company is well positioned in the event of a major economic slowdown given the immediate requirement in the US to secure access to inexpensive electricity.
♦ Call Option On Indian Minicar Market: Tata Motors has indicated CVTech will be the continuously variable transmission supplier to its Nano minicar. Although we expect the majority of the initial cars will use conventional transmissions, this represents a significant opportunity for CVTech. Our forecast does not include any contribution from the Nano.
♦ Compelling Valuation: CVTech shares are currently trading at 9.2x NTM EPS, a significant discount to the 17.7x average of its comps. We are using 10x P/E to value the shares, supported by a 23% ROE and superior margins and earnings growth relative to most of its comps. Offsetting this is the relative illiquidity of the shares; we estimate the public float to be approximately 22% of shares outstanding.
♦ Management & Directors Are Significant Owners: Management and directors currently own 32% of shares outstanding, including approximately 13% held by CEO André Laramée.
♦ Solid Balance Sheet: Net debt/capital currently stands at 31.8%, having improved steadily since the September 2006 acquisition of AAB Inc for $10.5 million, due to a $5 million private placement and strong free cash flow generation in 2007. We expect net debt/capital to continue to improve over the forecast horizon.

CVTech Group Inc.
2 David Buma, CFA Industrial Products Analyst 514-350-2957 [email protected] April 23, 2008
CVTech Group Inc.
Top Pick, $1.80 Target
We are initiating coverage on CVTech Group Inc. (CVTech) with a Top Pick rating and a one-year share price target of $1.80 implying a total return of 45.6%. This target is based on a 10x forward P/E multiple. We have a share risk rating of High.
Benefitting From Increased Infrastructure Spending
CVTech is a play on the maintenance and upgrade requirements of aging North American electricity transmission and distribution infrastructure. As the largest third-party service provider in the northeastern US, we expect CVTech’s overall revenue to be driven largely by the heightened investment in electricity infrastructure over the next 5-10 years. The company is also currently working with Tata Motors to supply the Indian car market with a CVT-based Nano minicar; this could provide further upside to our revenue assumptions as they do not currently reflect any contribution from the Nano. Combined with stable EBITDA margins, a solid balance sheet, experienced management, compelling valuation, and an appetite for future acquisitions, we rate CVTech shares a Top Pick with an ROR of 45.6%.
Company Profile
Electricity Infrastructure Is Dominant Business
CVTech operates in two distinct businesses: electricity transmission and distribution infrastructure (Electricity) and continuously variable transmissions (Vehicles). We profile those two segments below:
♦ Electricity – Accounting for 81.2% of revenue in 2007, the Electricity segment builds and maintains electricity transmission and distribution (T&D) lines, power houses, and sub-stations in Québec and the eastern United States. This segment also provides vegetation control services on rights-of-way for electric power T&D lines and storm restoration services in the southeastern United States during the hurricane season. CVTech entered into this business via acquisition in late 2005.
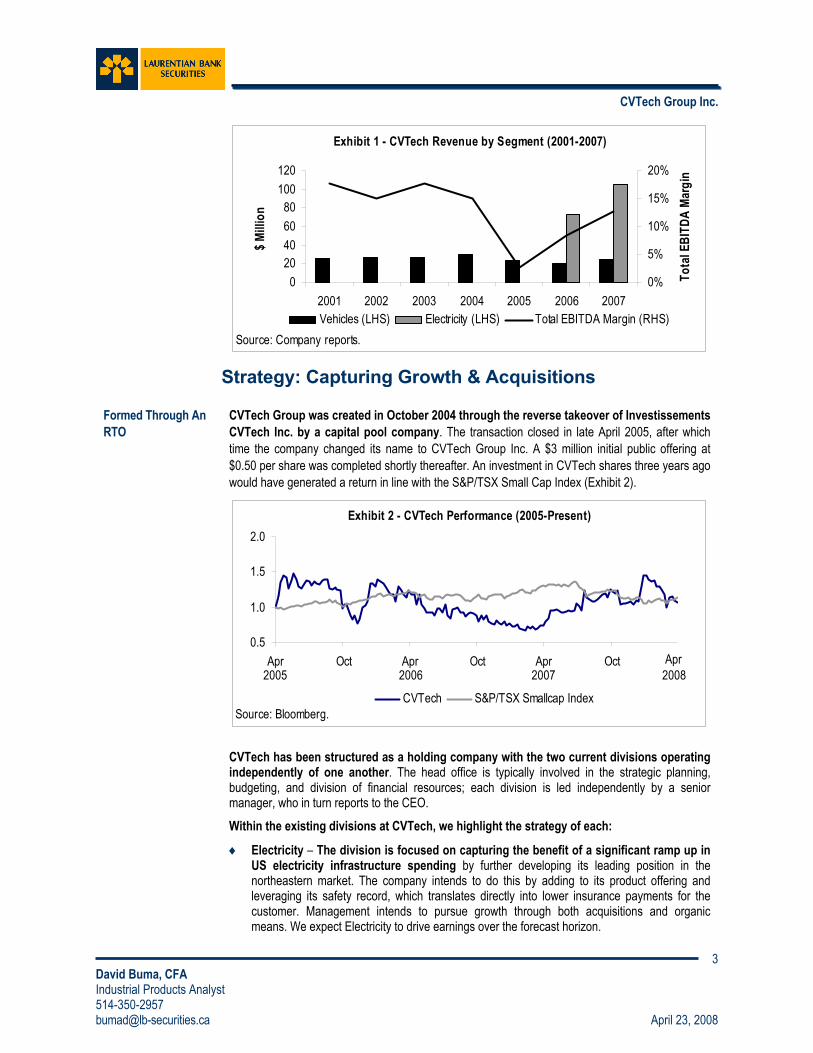
♦ Vehicles – Accounting for 18.8% of company revenue in 2007, the Vehicles segment develops, manufactures and markets continuously variable transmissions (CVTs) for original equipment manufacturers of minicars, utility vehicles (UTVs), all-terrain vehicles (ATVs), snowmobiles, and other general purpose recreational vehicles. Although the feeling of changing gears can be simulated with CVTs, in its purest form, the user would normally just experience a smooth acceleration; CVTs typically accelerate faster and use 15% less fuel than a comparable conventional automatic transmission. In addition, the Vehicles segment refurbishes crankshafts and engine cylinders and sells other industrial engine-related parts. The company is currently working with Tata Motors to supply it with a CVT for the Nano.
CVTech Is A North American Company, Asia Revenue To Grow
Approximately 93% of CVTech’s revenue was generated in North America in 2007. Of this amount, 50% was generated in the US and 43% in Canada, the majority of which came from Electricity. The Electricity segment operates out of Victoriaville, Québec and Newington, Connecticut. CVTech also has Vehicles manufacturing facilities in Drummondville and Thetford Mines, Québec. The remaining 7% of revenue is largely generated by minicar CVT sales in Europe; the company has a sales and service facility in La Tessoualle, France. Given CVTech’s involvement with the new Tata Nano, CVTech could eventually build a manufacturing facility in India.
We illustrate the evolution of CVTech’s revenue profile in Exhibit 1.
CVTech Group Inc.
3 David Buma, CFA Industrial Products Analyst 514-350-2957 [email protected] April 23, 2008
Exhibit 1 - CVTech Revenue by Segment (2001-2007)
020406080
100120
2001 2002 2003 2004 2005 2006 2007
$ Milli
on0%
5%
10%
15%
20%
Tota
l EBI
TDA
Marg
in
Vehicles (LHS) Electricity (LHS) Total EBITDA Margin (RHS)Source: Company reports.
Strategy: Capturing Growth & Acquisitions
Formed Through An RTO
CVTech Group was created in October 2004 through the reverse takeover of Investissements CVTech Inc. by a capital pool company. The transaction closed in late April 2005, after which time the company changed its name to CVTech Group Inc. A $3 million initial public offering at $0.50 per share was completed shortly thereafter. An investment in CVTech shares three years ago would have generated a return in line with the S&P/TSX Small Cap Index (Exhibit 2).
Exhibit 2 - CVTech Performance (2005-Present)
0.5
1.0
1.5
2.0
Apr Oct Apr Oct Apr Oct
CVTech S&P/TSX Smallcap IndexSource: Bloomberg.
2006 2007Apr20082005
CVTech has been structured as a holding company with the two current divisions operating
independently of one another. The head office is typically involved in the strategic planning, budgeting, and division of financial resources; each division is led independently by a senior manager, who in turn reports to the CEO. Within the existing divisions at CVTech, we highlight the strategy of each:
♦ Electricity – The division is focused on capturing the benefit of a significant ramp up in US electricity infrastructure spending by further developing its leading position in the northeastern market. The company intends to do this by adding to its product offering and leveraging its safety record, which translates directly into lower insurance payments for the customer. Management intends to pursue growth through both acquisitions and organic means. We expect Electricity to drive earnings over the forecast horizon.

CVTech Group Inc.
4 David Buma, CFA Industrial Products Analyst 514-350-2957 [email protected] April 23, 2008
♦ Vehicles – The two focal points of the Vehicles division are the opening up of new markets and the expansion of its aftermarket business. Leading the way in new markets is the ongoing negotiation with Tata Motors to supply a model of its Nano minicar with a CVT. Success with this product could eventually result in the broadening into other emerging markets such as China, South America, and Africa. Vehicles is also focused on enhancing its aftermarket services, potentially through an acquisition as well as organic growth. With all manufacturing in Canada, cost control is important as the weakened US$ has strengthened the position of its US-based competitors; CVTech is increasingly sourcing its components from either the US, for a natural currency hedge, or from low-cost countries.
Acquisitions Play Key Role In Growth Strategy
Acquisitions should continue to play a key role in management’s growth strategy, potentially falling into two different groups:
1. Existing Business – CVTech continues to assess acquisition targets that would enhance its position in the existing businesses. Key areas of focus are the CVT aftermarket service business and new services in Electricity, including line and cable burial.
2. Unrelated Business – Through acquisitions, the company intends to broaden its operations into potentially four or five different industries over the next several years. The 2005 acquisition of Thiro was of this nature and has proven to be very successful.
Management has set out the following criteria when evaluating an acquisition opportunity:
♦ Good management team willing to continue to run the business following the acquisition.
♦ Unique competitive advantage with export capabilities.
♦ A history of profitability and strong growth potential.
♦ Immediately accretive to earnings.
Two Acquisitions To Date
The company has completed two acquisitions since December 2005. We highlight those transactions below:
♦ Thiro Ltd – Essentially what is the Electricity segment today, Thiro was acquired in December 2005 for 6.5x earnings (Exhibit 3). Although the acquisition was somewhat opportunistic in nature, rather than a strategic goal to enter the electricity business, the Thiro business has become the earnings driver of the company; revenue has essentially doubled since it was acquired.
♦ Atelier Adrien Bernard Inc (AAB) – To complement the CVT offering of the Vehicles segment, the September 2006 acquisition of AAB gave CVTech exposure to the aftermarket, as it specialized in rebuilding engines and related parts for various types of industrial and recreational vehicles.
(In Millions)Name Closed Date Value Sales Earnings Net Margin P/E P/S
AAB Inc. Sep 2006 $10.5 $8.0 n.a. n.a. n.a. 1.3xThiro Ltd. Dec 2005 $15.0 $52.6 $2.3 4.4% 6.5x 0.3x
Source: Company Reports; LBS Estimates.
Exhibit 3 - CVTech Acquisitions

CVTech Group Inc.
5 David Buma, CFA Industrial Products Analyst 514-350-2957 [email protected] April 23, 2008
Management Profile & Holdings
Experienced Management Team
CVTech has an experienced management team that has been influential in the development of the company. We profile the management team below:
♦ André Laramée – President and Chief Executive Officer: Mr. Laramée was President and CEO of Investissements CVTech between 1996 and 2005, taking on the same role at CVTech in April 2005. Prior to joining Investissements CVTech, he was Vice-President of Gestion Capital de Développement 04 inc. from 1993 to 1996.
♦ Mario Trahan – Chief Financial Officer: Mr. Trahan was appointed Chief Financial Officer in 2004. Since joining CVTech in 1997, he has served in a number of roles including head accountant, controller and director of finance. Prior to that, Mr. Trahan held various accounting positions in other firms. Mr. Trahan has been a certified management accountant since 1997.
♦ Guy Aubert – Vice-President, Electrical Lines and Clearance & Pruning Division: Mr. Aubert was appointed vice-president of the Electrical Lines and Clearance & Pruning Division in 2005 after the acquisition of Thiro by CVTech. Since he joined Thiro in 1973, he has held many roles including controller, vice-president finance, and president and CEO from 1987 to 2005.
♦ Alain Charest – Vice-President, Vehicles Division: Mr. Charest was appointed vice-president of the Vehicles Division in 2006. Since he joined CVTech in 1998, he has held the positions of manager of operations and general manager of the Vehicles Division. Prior to joining CVTech, Mr. Charest worked as a production manager at Tye-Sil.
♦ Jacques Joly, Chairman of the Board. Mr. Joly was named Chairman of the Board in April 2005 after being a director of Investissements CVTech since 1996. Mr. Joly has been a partner with accounting firm Joly Riendeau & Duke CA since 1998 and a chartered accountant since 1989.
Extensive Insider Ownership
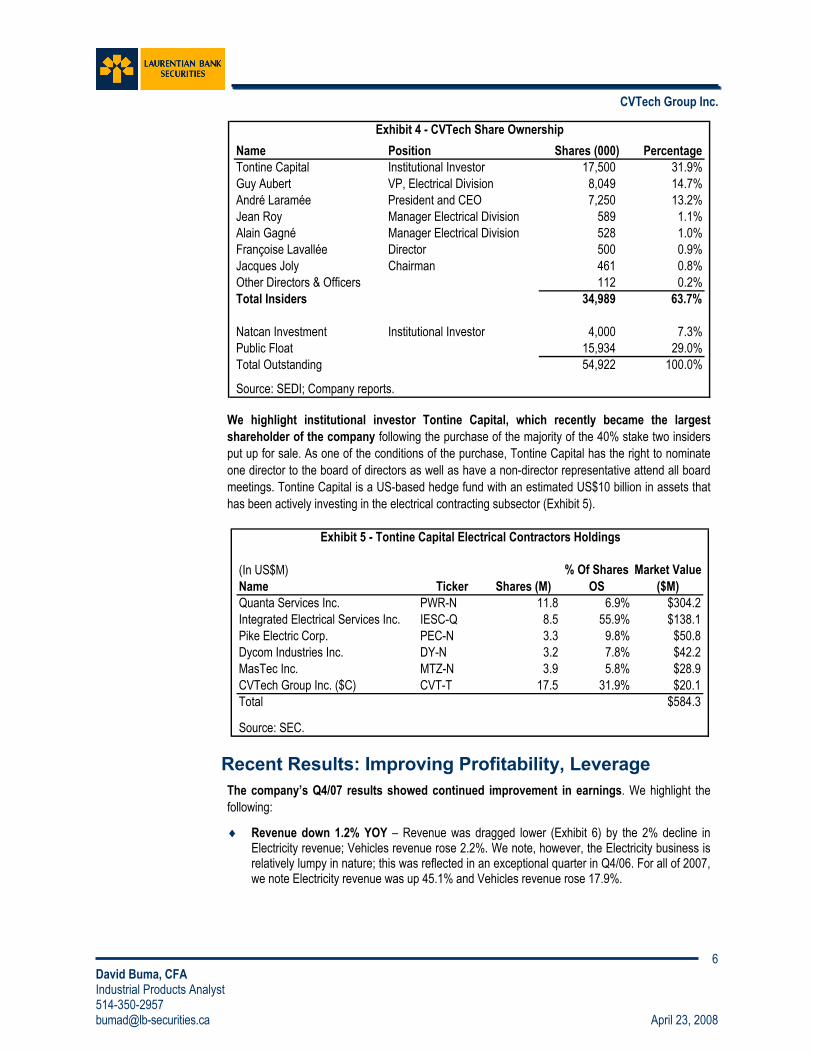
Insiders own close to 64% of CVTech shares. The top three insiders are Tontine Capital (32%), Mr. Guy Aubert (15%), and Mr. André Laramée (13%), accounting for close to 60% of shares outstanding (Exhibit 4). Factoring in the holdings of Natcan Investment Management and another institutional investor, the float is estimated to be 12 million shares or approximately 22% of shares outstanding.
CVTech Group Inc.
6 David Buma, CFA Industrial Products Analyst 514-350-2957 [email protected] April 23, 2008
Name Position Shares (000) PercentageTontine Capital Institutional Investor 17,500 31.9%Guy Aubert VP, Electrical Division 8,049 14.7%André Laramée President and CEO 7,250 13.2%Jean Roy Manager Electrical Division 589 1.1%Alain Gagné Manager Electrical Division 528 1.0%Françoise Lavallée Director 500 0.9%Jacques Joly Chairman 461 0.8%Other Directors & Officers 112 0.2%Total Insiders 34,989 63.7%
Natcan Investment Institutional Investor 4,000 7.3%Public Float 15,934 29.0%Total Outstanding 54,922 100.0%
Source: SEDI; Company reports.
Exhibit 4 - CVTech Share Ownership
We highlight institutional investor Tontine Capital, which recently became the largest shareholder of the company following the purchase of the majority of the 40% stake two insiders put up for sale. As one of the conditions of the purchase, Tontine Capital has the right to nominate one director to the board of directors as well as have a non-director representative attend all board meetings. Tontine Capital is a US-based hedge fund with an estimated US$10 billion in assets that has been actively investing in the electrical contracting subsector (Exhibit 5).
(In US$M)Name Ticker Shares (M)Quanta Services Inc. PWR-N 11.8 6.9% $304.2Integrated Electrical Services Inc. IESC-Q 8.5 55.9% $138.1Pike Electric Corp. PEC-N 3.3 9.8% $50.8Dycom Industries Inc. DY-N 3.2 7.8% $42.2MasTec Inc. MTZ-N 3.9 5.8% $28.9CVTech Group Inc. ($C) CVT-T 17.5 31.9% $20.1Total $584.3
Source: SEC.
Exhibit 5 - Tontine Capital Electrical Contractors Holdings
Market Value ($M)
% Of Shares OS
Recent Results: Improving Profitability, Leverage The company’s Q4/07 results showed continued improvement in earnings. We highlight the
following:
♦ Revenue down 1.2% YOY – Revenue was dragged lower (Exhibit 6) by the 2% decline in Electricity revenue; Vehicles revenue rose 2.2%. We note, however, the Electricity business is relatively lumpy in nature; this was reflected in an exceptional quarter in Q4/06. For all of 2007, we note Electricity revenue was up 45.1% and Vehicles revenue rose 17.9%.

CVTech Group Inc.
7 David Buma, CFA Industrial Products Analyst 514-350-2957 [email protected] April 23, 2008
♦ EPS increased to $0.02 from $0.01 – Although the increase in EPS was relatively modest, we note that earnings increased to $1.2 million from $0.5 million last year. EBITDA margin improved 127 bps to 11.1%. For the year, EPS increased to $0.11 from $0.02 in 2006 while EBITDA margin rose to 12.7% from 8.3%, despite the continued strength of the C$/US$.
♦ Cash flow up on working capital wind-down – With operating cash flow down slightly YOY in Q4/07, the reversal in working capital investment resulted in free cash flow (FCF) of $4.2 million, a significant turnaround from -$4.0 million in Q4/06. For all of 2007, CVTech generated $12.5 million in FCF, versus -$2.8 million in 2006, due to the combination of higher operating cash flow and a reversal in working capital investment.
♦ Net debt to capital improved to 31.8% – Driven by solid FCF and a $5 million equity issue in Q3/07, leverage levels have declined significantly over the past year. From a net debt/cap ratio of 54.9% in Q4/06, that ratio has been steadily reduced to 31.8% in the most recent quarter. Net debt/LTM EBITDA has also declined over the past year, to 1.3x in Q4/07 from 2.9x in Q4/06. Of note, the company announced a dividend of $0.02 per share in January 2008.
($M, except per share amounts) Q4/07 Q3/07 Q2/07 Q1/07Revenue 31.7 30.2 34.0 33.5
% Growth (YOY) -1.2% 37.1% 57.5% 93.4%EBITDA 3.5 3.6 4.2 5.0
% Growth (YOY) 11.6% 99.9% 256.8% 198.4%EBITDA Margin 11.1% 12.0% 12.5% 14.9%
bps Change (YOY) 127 bps 377 bps 698 bps 524 bpsEarnings 1.2 1.1 1.6 2.1
% Growth (YOY) 144.7% 428.3% -3562.0% 573.6%
EPS $0.02 $0.02 $0.03 $0.04% Growth 144.7% 428.3% -3562.0% 573.6%
Shares Outstanding (FD) 57.7 55.6 52.5 51.9
Source: Company reports.
Exhibit 6 - CVTech Recent Results

CVTech Group Inc.
8 David Buma, CFA Industrial Products Analyst 514-350-2957 [email protected] April 23, 2008
Financial Forecast: Good Long-Term Visibility
13.1% Revenue CAGR From 2007-2010E
We expect CVTech to post a revenue CAGR of 13.1% from 2007-2010E. In total, we expect revenue to progress from $129 million in 2007 to $148 million in 2008E, $171 million in 2009E, and $187 million in 2010E. This compares with management’s target of $200 million by 2010, as we have not included any revenue generation related to the Nano. We also note that although acquisitions remain a key part of management’s strategy to both grow and diversify, we have not included any impact of such transactions into our numbers due to the uncertainty involving the timing, size, and target business.
We highlight the outlook for the two divisions below with a more detailed analysis in Appendices I and II.
Electricity To Drive Revenue Growth
Industry Investment To Grow At 7.2%
We expect the Electricity division to drive revenue growth at CVTech. According to the Edison Electric Institute, construction and maintenance spending on electricity transmission infrastructure in the US is expected to grow at a real CAGR of 7.2% from 2007-2010. Key drivers behind this growth are the 2005 US Energy Policy Act which requires a minimum standard of reliability among other things and the financial incentive to expedite the natural replacement cycle of existing infrastructure; line maintenance requirements increase as infrastructure approaches the end of its useful life while an estimated 5-10% of electricity transmitted is lost on older networks.
We highlight a program of one northeastern utility calling for spending of almost $2.7 billion over the next five years on electricity infrastructure; for the distribution component of this program, it could result in the tripling of current annual spending over that time. Industry experts forecast the strong demand for installation and maintenance services could potentially last for the next 10 years.
Increased industry investment should be compounded by the growing trend at utilities to outsource their transmission and distribution installation and maintenance services. The number of utility employees has been declining steadily, even while power-generating capacity continues to expand. Electricity service provider Pike Electric estimates that 55% of transmission and distribution work will be outsourced by 2015, up significantly from 45% in 2005 and 20% in 1995. Other estimates are for a rate eventually as high as 70%. This migration to third-party service providers is largely driven by the benefits of having a flexible, more efficient workforce available to the utility without the cost burden associated with employee recruitment, training, or management, particularly given the current labour shortage in the industry.
Electricity Revenue CAGR Of 15.3% From 2007-2010E
We forecast a revenue CAGR in Electricity of 15.3% from 2007-2010E, the majority of which should be derived from the US. The company currently has orders worth $100 million for work over the next 16 months. In the event of an active hurricane season, the company could see further upside from its storm restoration services.
CVTech Group Inc.
9 David Buma, CFA Industrial Products Analyst 514-350-2957 [email protected] April 23, 2008
Vehicles Growth Modest, Nano Could Provide Upside
Weak 2008, Picking Up In 2009
We expect a slight decline in Vehicle revenue in 2008 before moving modestly higher in 2009 and 2010, translating into a revenue CAGR of 2.5% from 2007-2010. Minicars in Europe, which account for approximately one-third of Vehicle revenue and 6% of all CVTech revenue, should continue to grow in the mid-single digits. Demand for these vehicles is driven by the more relaxed licensing standards, fuel efficiency (up to 80 mpg), and ease of use versus conventional cars. CVTech is the sole transmission supplier in this market. The remainder of Vehicles revenue is from aftermarket services as well as general purpose recreational vehicles, which faces a more challenging environment due to the economic slowdown in the US and rising fuel costs. The growing aftermarket service business for these vehicles should offset a portion of this weakness.
Nano Could Provide Further Upside
Although we believe CVTech will eventually supply CVTs for Tata Motors’ Nano, we have not included any impact in our revenue growth estimates. Uncertainty includes the timing of the CVT-version launch, the actual success of the Nano, and the rate of adoption of the CVT Nano versus the conventional transmission. We highlight that CVTech is the only CVT manufacturer currently capable of supplying a product suitable for the vehicle. Barring the outright drop of the CVT version, which we see as unlikely given its lower cost, we expect CVTech will construct a production facility in India at some point; in addition to the Nano, we believe the company could leverage its Asian location to benefit from new entrants in the minicar market in the region.
Steady Margins, Strong Earnings Growth
EBITDA Margin To Remain Steady
We expect modest improvement in EBITDA margin over the forecast horizon. On the Electricity side, rising material and labour costs are typically passed on to customers. An increase in demand for storm restoration services could provide some lift to EBITDA margin. On the Vehicles side, we expect the efforts to increase outsourcing from outside of Canada, combined with an increase in the higher margin aftermarket business, to help offset the impact of the strong C$/US$. We forecast EBITDA margin will improve from 12.7% in 2007 to 12.9% in 2008E, 13.2% in 2009E, and 13.4% in 2010E.
24% EPS CAGR From 2007-2010E
Earnings per share growth should remain strong through 2010E. We expect earnings to progress from $0.11 per share in 2007, to $0.14 in 2008E, $0.18 in 2009E, and $0.21 in 2010E. We expect interest expense to decline modestly over the forecast horizon while the tax rate should remain relatively unchanged at 36%.

CVTech Group Inc.
10 David Buma, CFA Industrial Products Analyst 514-350-2957 [email protected] April 23, 2008
($M) 2005 2006 2007 2008E 2009E 2010ERevenue 23.4 93.1 129.4 147.6 171.3 187.2
% Growth -21.0% 297.2% 39.1% 14.0% 16.1% 9.3%EBITDA 0.6 7.7 16.4 19.0 22.6 25.2
% Growth -86.1% 1147.6% 111.8% 16.3% 18.7% 11.3%EBITDA Margin 2.6% 8.3% 12.7% 12.9% 13.2% 13.4%
bps Change (YOY) -1237 bps 567 bps 434 bps 25 bps 30 bps 24 bpsEarnings (1.1) 0.9 6.0 7.8 10.1 12.0
% Growth 11.9% -184.3% 533.7% 31.4% 28.8% 18.9%
EPS ($0.03) $0.02 $0.11 $0.14 $0.18 $0.21% Growth -150.6% -159.6% 507.6% 23.6% 28.8% 18.9%
Shares Outstanding (FD) 36.8 52.0 54.4 57.7 57.7 57.7
Source: Company reports; LBS estimates.
Exhibit 7 - CVTech Financial Outlook (2005-2010E)
Solid Balance Sheet
FCF Drops In 2008 Before Moving Higher
We expect a sharp drop off in free cash flow (FCF) in 2008, before moving steadily higher in 2009 and 2010. We forecast FCF after dividends to progress from $12.5 million in 2007, to -$1.5 million in 2008E, $6.2 million in 2009E, and $7.6 million in 2010E. Of note, the decline in 2008 FCF generation is due to the combination of reinvestment in working capital, higher capex as a result of the construction of two new buildings, and the payment of a dividend. Beyond 2008, we expect increasing operating cash flow and the return to more “normal” capex should contribute to the FCF growth.
We believe the majority of the cash generated over the forecast horizon will be used to fund additional acquisitions. In the absence of that, we expect the company will likely pay down debt. We expect the $0.02 dividend announced in January 2008 to be permanent.
-505
1015
2005 2006 2007 2008E 2009E 2010E
FCF
($M)
0%15%30%45%60%
Net D
ebt/C
ap
FCF After Dividends(LHS) Net Debt/Cap (RHS)
Source: Company reports.
Exhibit 8 - CVTech Financial Outlook (2005-2010E)
Net Debt/Cap Of 31.8% And Improving
Leverage levels have improved steadily since the September 2006 acquisition of AAB Inc for $10.5 million. With net debt/capital peaking in Q4/06 at 54.9%, debt levels have improved significantly as the result of the strong FCF generation in 2007 and the $5 million private placement in June 2007. We forecast net debt/capital to improve from 31.8% at the end of 2007, to 30.3% in 2008E, 18.1% in 2009E, and 4.8% in 2010E. The company has approximately $4.5 million in long-term debt and convertible debentures due in each of the next three years.

CVTech Group Inc.
11 David Buma, CFA Industrial Products Analyst 514-350-2957 [email protected] April 23, 2008
Shares Appear To Be Significantly Undervalued
Top Pick Rating, $1.80 Target
We rate the shares of CVTech a Top Pick with a one-year share price target of $1.80. This is based on 10x our 2009 EPS estimate of $0.18 per share and equates to 5x EV/2009 EBITDA. We note the shares could be worth $2.10 in two years, excluding any potential acquisitions. CVTech shares currently trade at 9.2x our 2008 EPS estimate of $0.14 and 4.1x 2008 EBITDA, well below a sample of specialty contractors, which currently trade at an average of 17.7x (Exhibit 9).
(In US$M except per share amounts)
Company Ticker Price Mkt Cap 2007 EPS 2008E EPS Growth 2009E EPS Growth 2008E P/E 2009E P/EPx Last CUR_MKTTRAIL_12MBEST_EEPS_CUR_YR BEST_EEPS_NXT_YR
Dycom Industries Inc. DY-N $13.41 $545.8 $1.03 $0.72 -30.1% $0.92 27.2% 18.6x 14.6xEMCOR Group Inc. EME-N $25.37 $1,654.8 $1.87 $2.23 19.0% $2.55 14.5% 11.4x 10.0xMasTec Inc. MTZ-N $7.43 $499.1 $0.67 $0.86 28.4% $1.02 18.4% 8.6x 7.3xPike Electric Corp. PEC-N $15.43 $511.3 $0.55 $0.66 19.6% $0.81 22.8% 23.4x 19.1xChurchill Corp.* CUQ-T $20.37 $364.4 $1.17 $1.51 28.9% $1.76 16.7% 13.5x 11.6xQuanta Services Inc. PWR-N $25.61 $4,381.1 $0.78 $0.84 7.7% $1.25 48.5% 30.5x 20.5xAverage 12.2% 24.7% 17.7x 13.9x
CVTech Group Inc.* CVT-T $1.25 $68.6 $0.11 $0.14 23.6% $0.18 28.8% 9.2x 7.1x
Company EVNet
Debt/Cap2007
EBITDA2008E
EBITDA Growth2009E
EBITDA Growth2008E
EV/EBITDA2009E
EV/EBITDACURR_ENTP_VAL EBITDA BEST_EST_EBITDA_CUBEST_EST_EBITDA_NXT_YR_MEAN
Dycom Industries Inc. $673.6 21.9% $133.3 $120.2 -9.8% $140.5 16.8% 5.6x 4.8xEMCOR Group Inc. $1,630.5 -3.0% $237.8 $301.2 26.6% $336.5 11.7% 5.4x 4.8xMasTec Inc. $543.4 25.3% $71.9 $87.1 21.2% $101.8 16.9% 6.2x 5.3xPike Electric Corp. $678.7 44.4% $95.3 $90.3 -5.3% $95.2 5.5% 7.5x 7.1xChurchill Corp.* $267.0 351.5% $31.4 $42.6 35.4% $48.6 14.1% 6.3x 5.5xQuanta Services Inc. $4,388.7 0.4% $250.0 $404.6 61.8% $516.8 27.7% 10.8x 8.5xAverage 21.7% 15.5% 7.0x 6.0x
CVTech Group Inc.* CVT-T $78.9 31.8% $16.4 $19.0 16.3% $22.6 18.7% 4.1x 3.5x
N - NYSE, Q - Nasdaq, T-TSX, V - TSX Venture* CADSource: LBS estimates; Capital IQ; Bloomberg.
Exhibit 9 - Specialty Contractors Comparables
Valuation Gap To Narrow
We believe CVTech shares are significantly undervalued for the following reasons:
♦ Within our comps, there appear to be two different groups: the higher growth, higher margin companies which trade above 20x, and the lower growth, lower margin companies which currently trade closer to 11x 2008 EPS. As illustrated in Exhibit 10, CVTech is the anomaly, falling into the higher earnings/EBITDA growth quadrant while trading at a discount even to the P/E of the lower quadrant.

CVTech Group Inc.
12 David Buma, CFA Industrial Products Analyst 514-350-2957 [email protected] April 23, 2008
Exhibit 10 - Profitability Versus Relative Valuation (2008 P/E)
0%3%6%9%
12%15%18%
0% 3% 6% 9% 12% 15%EPS CAGR (2007-2009)
EBIT
DA M
argi
n (2
007)
MTZ - 8.6x
CVT - 9.2x
EME - 11.4x CUQ - 13.5x
PWR - 30.5x
Source: Bloomberg; LBS estimates.
25%
DY - 18.6x
PEC - 23.4x
♦ EPS is expected to grow at a CAGR of 24% from 2007-2010E, as growth in infrastructure spending and increased outsourcing should offset the impact of a slowdown in the overall North American economy. Of note, we forecast CVTech should have an ROE of approximately 23% in each of the next three years.
♦ Our EPS estimate does not account for any top line contribution from the Nano minicar. Although significant progress has been made with Tata Motors, until an agreement is secured and some sort of clarity emerges as to the potential share of the CVT Nano versus the conventional transmission Nano, we are refraining from including any contribution in our estimates.
Shares Are Illiquid ♦ Offsetting the impact of the factors above is the relative illiquidity of CVTech shares with an average of 30,000 shares trading per day as management, directors, and the top three institutional shareholders hold 78% of shares outstanding. We note the overhang of two insiders selling 40% of the company has been lifted following the recent transaction in which a US-based hedge fund bought the majority.

CVTech Group Inc.
13 David Buma, CFA Industrial Products Analyst 514-350-2957 [email protected] April 23, 2008
Key Risks: Customer Concentration & Currency
Customer Concentration
Almost 54% of CVTech’s revenue comes from two customers. Both of these customers are in the electricity distribution business: Hydro-Québec, the government owned monopoly in Québec, and National Grid, a utility with extensive operations in the northeastern United States. The loss of one of these customers would have a major impact on the company’s overall performance.
Foreign Currency Exposure
CVTech is exposed to the C$/US$ and C$/EU foreign exchange rate. Within Electricity, the currency of costs and revenues is generally matched, leaving margins relatively unchanged, however profits are impacted when US$ income is translated into C$. Currency has more of an impact on the Vehicles side, where the majority of costs are incurred in C$, while a significant number of the units sold are sold in Europe and the US. We estimate the EPS sensitivity to a C$0.01/US$ change is approximately $0.003.
Shares Are Illiquid The shares of CVTech are relatively illiquid. Management, directors, and the top three institutional shareholders hold 78% of shares outstanding, leaving the public float at 22% or 12 million shares. The trading volume averages 30,000 shares per day.
Low Sensitivity to Economic Cycle
A slowdown in general North American economic activity could reduce demand for CVTech’s products. We note however, that the Electricity segment, accounting for over 80% of revenue in 2007 and all of it generated in North America, is less sensitive to short-term fluctuations in economic conditions. Sales of CVTs to recreational vehicle manufacturers, although particularly sensitive to general economic conditions, accounted for only 7% of revenue in 2007. In terms of seasonality, the Electricity business is typically strongest in Q3 and Q4; Vehicles is strongest in Q1.
Raw Materials Prices CVTech has some exposure to changes in prices and supply of its raw materials, including steel and aluminum. However, in the Electricity business, higher costs are typically passed on to customers. For the Vehicles business, which accounts for less than 20% of total revenue, the company has a limited ability to pass higher material costs through to the customer. As such, a sharp increase could negatively impact margins.
Intellectual Property CVTech relies on a combination of patents and trade secrets to compete, generally with respect to CVTs. Policing the misuse of this technology could potentially be expensive and time consuming. Furthermore, there is no guarantee that the company will be successful in protecting its proprietary rights in countries where intellectual property rights are not covered to the same extent as in Canada and the US.
Labour Labour disruptions could have a material impact on CVTech’s business. Approximately 61% of the 622 employees at CVTech are unionzed, all of which are part of Electricity. CVTech does not engage in collective bargaining directly but instead relies on agreements established between Décret Construction and the labour unions. As a result, any potential strike would be an industry-wide strike. No collective agreements are being negotiated at this time.

CVTech Group Inc.
14 David Buma, CFA Industrial Products Analyst 514-350-2957 [email protected] April 23, 2008
Financial Statements
(Fiscal Year Ending December 31;$M, except per share amounts) 2005 2006 2007 Q1/08E Q2/08E Q3/08E Q4/08E 2008E 2009E 2010ERevenuesElectricity 0.0 72.5 105.1 29.2 32.6 29.9 32.1 123.7 146.4 161.0Vehicles 23.4 20.6 24.3 7.7 5.3 5.0 5.9 23.9 24.9 26.2Total Revenue 23.4 93.1 129.4 36.9 37.9 34.8 38.0 147.6 171.3 187.2
Operating Expenses 22.8 85.3 113.1 32.1 33.0 30.1 33.3 128.6 148.7 162.0EBITDA 0.6 7.7 16.4 4.8 4.9 4.7 4.6 19.0 22.6 25.2
Depreciation & Amortization 1.3 4.2 4.8 1.2 1.3 1.3 1.4 5.3 5.6 5.5EBIT (0.7) 3.6 11.6 3.6 3.6 3.4 3.2 13.8 17.0 19.6
Interest Expense 0.6 1.4 2.0 0.4 0.4 0.4 0.4 1.5 1.2 0.9EBT (1.3) 2.1 9.6 3.2 3.2 3.0 2.9 12.2 15.8 18.7
Current Taxes (0.2) 0.9 4.0 0.9 0.9 0.8 0.8 3.3 4.3 5.1Deferred Taxes 0.1 0.2 (0.4) 0.3 0.3 0.3 0.3 1.1 1.4 1.7Net Earnings (1.1) 0.9 6.0 2.0 2.0 1.9 1.8 7.8 10.1 12.0
Weighted Average Shares Outstanding - Basic 36.8 49.8 52.5 54.9 54.9 54.9 55.0 54.9 55.0 55.1Weighted Average Shares Outstanding - Diluted 36.8 52.0 54.4 57.7 57.7 57.7 57.7 57.7 57.7 57.7
Diluted EPS ($0.03) $0.02 $0.11 $0.04 $0.04 $0.03 $0.03 $0.14 $0.18 $0.21
Income Statement StatisticsRevenue Growth -21.0% 297.2% 39.1% 10.2% 11.5% 15.2% 19.7% 14.0% 16.1% 9.3%EBITDA Growth -86.1% 1147.6% 111.8% -3.7% 14.7% 30.2% 32.1% 16.3% 18.7% 11.3%Net Earnings nm nm 533.7% -4.2% 25.6% 80.7% 59.5% 31.4% 28.8% 18.9%Diluted EPS nm nm 507.6% -13.7% 14.4% 74.3% 67.2% 23.6% 28.8% 18.9%
EBITDA Margin 2.6% 8.3% 12.7% 13.0% 12.8% 13.6% 12.2% 12.9% 13.2% 13.4%EBIT Margin -3.0% 3.8% 9.0% 9.7% 9.5% 9.7% 8.5% 9.3% 9.9% 10.5%Net Margin -4.8% 1.0% 4.6% 5.5% 5.4% 5.5% 4.9% 5.3% 5.9% 6.4%
Tax Rate 12.2% 55.6% 37.7% 36.0% 36.0% 36.0% 36.0% 36.0% 36.0% 36.0%
Source: Company reports; LBS estimates.
Exhibit 11 - CVTech Income Statement (2005-2010E)

CVTech Group Inc.
15 David Buma, CFA Industrial Products Analyst 514-350-2957 [email protected] April 23, 2008
Financial Statements (cont’d)
(Fiscal Year Ending December 31;$M, except per share amounts) 2005 2006 2007 Q1/08E Q2/08E Q3/08E Q4/08E 2008E 2009E 2010E
AssetsCash 1.7 1.5 10.9 10.7 7.5 5.7 4.4 4.4 6.0 9.0Accounts Receivable 17.0 19.4 11.9 20.3 20.8 21.1 22.9 22.9 26.6 29.6Inventories 5.8 12.0 12.3 10.6 10.9 10.9 12.1 12.1 14.0 16.1Prepaid Expenses & Other 1.8 2.8 6.7 6.8 6.8 6.8 6.8 6.8 6.9 6.9Future Income Taxes 0.2 0.1 0.4 0.4 0.4 0.4 0.4 0.4 0.4 0.4Total Current Assets 26.6 35.8 42.1 48.8 46.4 44.8 46.6 46.6 53.8 62.1
Property, Plant & Equipment 16.8 19.3 19.9 21.0 21.9 22.8 23.7 23.7 23.1 23.1Investments 1.8 1.9 1.9 1.9 1.9 1.9 1.9 1.9 1.9 1.9Future Income Taxes 0.6 0.4 0.2 0.2 0.2 0.2 0.2 0.2 0.2 0.2Intangible Assets & Goodwill 4.0 12.8 11.2 11.2 11.2 11.2 11.2 11.2 11.2 11.2Other Assets 0.5 1.0 1.0 1.1 1.2 1.3 1.3 1.3 1.3 1.3Total Non-Current Assets 23.7 35.5 34.2 35.3 36.4 37.4 38.3 38.3 37.7 37.7
Total Assets 50.3 71.3 76.3 84.1 82.8 82.2 84.9 84.9 91.5 99.8
Liabilities & Shareholders' EquityShort-Term Borrowings 2.8 6.3 0.0 0.0 0.0 0.0 0.0 0.0 0.0 0.0Accounts Payable & Accrued Liabilities 6.0 12.7 10.9 19.4 18.2 16.5 18.3 18.3 19.0 19.4Income Taxes Payable 1.3 0.0 2.5 1.7 0.4 0.4 0.4 0.4 0.5 0.5Long-Term Debt Due Within One Year 3.5 4.5 3.8 4.0 4.0 4.0 4.0 4.0 4.0 4.0Convertible Debt Due Within One Year 0.0 0.1 0.6 0.5 0.5 0.5 0.6 0.6 0.6 0.6Future Income Taxes 0.3 1.3 1.2 1.2 1.2 1.2 1.2 1.2 1.2 1.2Total Current Liabilities 14.0 25.0 19.0 26.8 24.2 22.6 24.6 24.6 25.3 25.7
Long-Term Debt 12.0 16.2 18.5 17.3 16.3 15.3 14.3 14.3 10.3 6.3Convertible Debt 0.0 2.5 2.8 2.9 2.7 2.6 2.3 2.3 1.7 1.1Other Liabilities 0.0 0.2 0.2 0.2 0.2 0.2 0.2 0.2 0.2 0.2Future Income Taxes 3.5 4.3 3.9 4.2 4.5 4.7 5.0 5.0 6.4 8.1Total Non-Current Liabilities 15.5 23.2 25.4 24.5 23.7 22.8 21.7 21.7 18.6 15.6
Total Liabilities 29.6 48.2 44.4 51.3 47.9 45.4 46.3 46.3 43.9 41.3
Shareholders' EquityCapital Stock 15.3 16.1 21.0 21.0 21.0 21.0 21.0 21.0 21.0 21.0Retained Earnings 4.6 5.5 11.5 12.4 14.4 16.4 18.2 18.2 27.2 38.1Other 0.8 1.5 (0.6) (0.6) (0.6) (0.6) (0.6) (0.6) (0.6) (0.6)Total Shareholders' Equity 20.7 23.1 31.9 32.8 34.9 36.8 38.6 38.6 47.6 58.5
Total Liabilities & Shareholders' Equity 50.3 71.3 76.3 84.1 82.8 82.2 84.9 84.9 91.5 99.8
Balance Sheet StatisticsNet Total Debt/Equity 80.3% 121.9% 46.6% 42.3% 45.8% 45.2% 43.4% 43.4% 22.2% 5.0%Net Total Debt/Capital 44.5% 54.9% 31.8% 29.7% 31.4% 31.1% 30.3% 30.3% 18.1% 4.8%Net Total Debt/LTM EBITDA 20.8x 2.9x 1.3x 1.0x 1.0x 0.9x 0.8x 0.8x 0.6x 0.3xEBIT Coverage -1.3x 2.5x 5.7x 8.8x 9.1x 8.9x 8.9x 8.9x 13.8x 22.3x
ROE (Annualized) -8.3% 4.3% 21.7% 25.1% 24.1% 21.5% 19.6% 22.2% 23.4% 22.6%Book Value $0.56 $0.44 $0.59 $0.57 $0.60 $0.64 $0.67 $0.67 $0.83 $1.01Tangible Book Value $0.45 $0.20 $0.38 $0.37 $0.41 $0.44 $0.48 $0.48 $0.63 $0.82
Source: Company reports; LBS estimates.
Exhibit 12 - CVTech Balance Sheet (2005-2010E)

CVTech Group Inc.
16 David Buma, CFA Industrial Products Analyst 514-350-2957 [email protected] April 23, 2008
Financial Statements (cont’d)
(Fiscal Year Ending December 31;$M, except per share amounts) 2005 2006 2007 Q1/08E Q2/08E Q3/08E Q4/08E 2008E 2009E 2010E
Operating ActivitiesEarnings (1.1) 0.9 6.0 2.0 2.0 1.9 1.8 7.8 10.1 12.0
Depreciation & Amortization 1.3 4.2 4.8 1.2 1.3 1.3 1.4 5.3 5.6 5.5Future Income Taxes 0.1 0.2 (0.4) 0.3 0.3 0.3 0.3 1.1 1.4 1.7Other 0.7 0.3 0.2 (0.8) (1.3) (0.0) 0.0 (2.1) 0.0 0.0
Operating Cash Flow 1.0 5.7 10.6 2.7 2.3 3.5 3.5 12.1 17.1 19.3
Decrease (Increase) In Non-Cash Working Capital (2.9) (3.4) 6.6 1.7 (2.1) (1.9) (1.3) (3.6) (4.9) (4.9)Cash Provided By Operating Activities (1.9) 2.3 17.2 4.4 0.2 1.7 2.2 8.6 12.3 14.3
Investing ActivitiesAcquisitions 0.0 0.2 0.0 0.0 0.0 0.0 0.0 0.0 0.0 0.0Capital Expenditures (0.9) (5.1) (4.7) (2.3) (2.3) (2.3) (2.3) (9.0) (5.0) (5.6)Other Assets (4.8) (8.9) (4.3) (0.1) (0.1) (0.1) (0.1) (0.4) 0.1 (0.0)Cash Provided By (Used In) Investing Activities (5.7) (13.8) (9.0) (2.4) (2.3) (2.3) (2.3) (9.4) (4.9) (5.6)
Financing ActivitiesVariation In Bank Loans 2.8 3.3 (7.0) 0.0 0.0 0.0 0.0 0.0 0.0 0.0Net Proceeds Of Long-Term Debt 2.0 5.4 2.2 (1.0) (1.0) (1.0) (1.0) (4.0) (4.0) (4.0)Net Proceeds Of Convertible Debt 0.0 2.7 0.9 (0.2) (0.2) (0.2) (0.2) (0.6) (0.6) (0.6)Dividends Paid 0.0 0.0 0.0 (1.1) 0.0 0.0 0.0 (1.1) (1.1) (1.1)Common Stock Issuance 2.6 0.0 4.8 0.0 0.0 0.0 0.0 0.0 0.0 0.0Other 1.1 (0.1) (0.0) 0.0 0.0 0.0 0.0 0.0 0.0 0.0Cash (Used In) Provided By Financing Activities 8.5 11.3 0.8 (2.2) (1.2) (1.2) (1.2) (5.7) (5.7) (5.7)
Net Increase (Decrease) In Cash 0.9 (0.2) 8.6 (0.2) (3.2) (1.8) (1.3) (6.5) 1.6 3.0Cash At Beginning Of Period 0.8 1.7 1.5 10.9 10.7 7.5 5.7 10.9 4.4 6.0Cash At End Of Period 1.7 1.5 10.9 10.7 7.5 5.7 4.4 4.4 6.0 9.0
Free Cash FlowOperating Cash Flow 1.0 5.7 10.6 2.7 2.3 3.5 3.5 12.1 17.1 19.3Change In Working Capital (2.9) (3.4) 6.6 1.7 (2.1) (1.9) (1.3) (3.6) (4.9) (4.9)Capital Expenditures (0.9) (5.1) (4.7) (2.3) (2.3) (2.3) (2.3) (9.0) (5.0) (5.6)Free Cash Flow (2.8) (2.8) 12.5 2.2 (2.0) (0.6) (0.1) (0.4) 7.3 8.7
Dividends 0.0 0.0 0.0 (1.1) 0.0 0.0 0.0 (1.1) (1.1) (1.1)Free Cash Flow After Dividends (2.8) (2.8) 12.5 1.1 (2.0) (0.6) (0.1) (1.5) 6.2 7.6
Free Cash Flow Per Share ($0.08) ($0.05) $0.23 $0.04 ($0.03) ($0.01) ($0.00) ($0.01) $0.13 $0.15Diluted Shares Outstanding 36.8 52.0 54.4 57.7 57.7 57.7 57.7 57.7 57.7 57.7
Source: Company reports; LBS estimates.
Exhibit 13 - CVTech Statement Of Cash Flow (2005-2010E)

CVTech Group Inc.
17 David Buma, CFA Industrial Products Analyst 514-350-2957 [email protected] April 23, 2008
Appendix I – Electricity Outlook
Electricity – 81% of 2007 Revenue, 87% of EBITDA
Building/Maintaining Electricity Infrastructure
The Electricity segment is involved in a variety of activities related to electricity transmission and distribution infrastructure. These include the following:
♦ Construction and maintenance of electricity transmission and distribution (T&D) lines, and to a lesser degree, powerhouses and sub-stations, in Québec and the eastern US.
♦ Vegetation control services on rights-of-way for T&D lines in Québec and the eastern US.
♦ Storm restoration services in the southeastern US during the hurricane season.
In 2007, the breakdown of Electricity revenue was approximately 48% transmission-related, 46% distribution-related, and 6% related to tree-pruning. The Electricity division has 458 employees and is the largest third-party services provider in the northeastern US.
Thiro Acquisition Has Proven Exceptional
CVTech entered into the Electricity business in late 2005 through the acquisition of Thiro Ltd, for which the company paid $15 million or 6.5x LTM earnings. At the time, Thiro had revenue of close to $53 million; in the two years since the acquisition closed, revenue has grown to $105 million. The president and major shareholder of Thiro, Mr. Guy Aubert, was paid in stock and continues to head the Electricity division. We note that earnings at the Electricity business have easily offset the losses incurred by the Vehicles business.
Revenue CAGR Of 15.3% From 2007-2010
We expect revenue growth in Electricity of 17.7% in 2008E, 18.3% in 2009E, and 10.0% in 2010E (Exhibit 14). One of the primary drivers over the forecast horizon should be the aggressive spending on electricity infrastructure by a number of eastern North American public utilities, in part to compensate for the relatively soft investment in infrastructure over the last 15 years. With the amount of outsourced building and maintenance work increasing, this should compound the growth experienced by third-party service providers. For CVTech, we expect the majority of the revenue growth to be derived from the US. The company currently has orders worth $100 million for work over the next 16 months.
($M) 2005 2006 2007 2008E 2009E 2010ERevenue 0.0 72.5 105.1 123.7 146.4 161.0
% Growth N/A N/A 45.1% 17.7% 18.3% 10.0%
EBITDA 0.0 6.7 14.2 16.8 20.2 22.5% Growth N/A N/A 111.7% 18.4% 20.1% 11.8%
EBITDA Margin N/A 9.3% 13.5% 13.6% 13.8% 14.0%
Source: Company reports; LBS estimates.
Exhibit 14 - Electricity Outlook (2005-2010E)

CVTech Group Inc.
18 David Buma, CFA Industrial Products Analyst 514-350-2957 [email protected] April 23, 2008
EBITDA margins should improve modestly as the business grows. We forecast a progression
from 13.5% in 2007 to 13.6% in 2008E, 13.8% in 2009E, and 14.0% in 2010E. Margins should be relatively insulated from rising material and labour costs as those increases can generally be passed on to customers. We have assumed very little revenue from the storm restoration services; however, we note this is typically a high margin business and could generate a meaningful contribution to the division profitability.
Electricity Infrastructure Investment Ramping Up
North America Covered By 4M Km Of Electricity Lines
Electricity infrastructure in North American is significant, including more than 340,000 km of high-voltage transmission lines (above 230kV) and more than 3.5 million km of low voltage distribution lines. Hydro-Québec, CVTech’s largest customer, owns close to 10% of all transmission lines in North America.
We illustrate the flow of electricity from the point of origin to the end user in Exhibit 15. Because electricity travels more efficiently at higher voltages, the electricity generated at power plants (1) is increased through a sub-station (2) before entering the transmission grid (3). Once the electricity reaches its intended destination, the voltage must be reduced in order to be used safely. To do this, the electricity passes through another sub-station (4) before flowing into the distribution lines (5). This low-voltage electricity can then be used by homes and businesses (6).
Source: Edison Electric Institute.
Exhibit 15 - Transmission & Distribution Infrastructure Overview

CVTech Group Inc.
19 David Buma, CFA Industrial Products Analyst 514-350-2957 [email protected] April 23, 2008
US Spending To Grow At 7.2% CAGR From 2007-2010
Real growth for investment in construction and maintenance of electricity transmission infrastructure in the US is expected to grow at a CAGR of 7.2% from 2007-2010 (Exhibit 16), according to the Edison Electric Institute. In Québec, Hydro-Québec transmission and distribution spending is expected to grow at a CAGR of 3.9% over the same period (Exhibit 17). With increased outsourcing by utilities of construction and maintenance work, growth at third-party service providers could potentially exceed these rates. The key driver is the pressing upgrade and/or replacement requirements, backed by growing demand for electricity and new generation capacity coming on line over the longer-term. We highlight these trends in the following section.
Exhibit 16 - US Transmission Investments (Real US$2006)
02,0004,0006,0008,000
10,000
2000 2002 2004 2006 2008e 2010e
US$ M
illion
0%
5%
10%
15%
20%
25%
Grow
th
Investments (LHS) Growth (RHS)Source: Edison Electric Institute.
Exhibit 17 - Hydro-Québec T&D Investments
200
700
1,200
1,700
2,200
2005 2006 2007 2008e 2009e 2010e
$ Milli
on
Transmission DistributionSource: Hydro-Québec.

CVTech Group Inc.
20 David Buma, CFA Industrial Products Analyst 514-350-2957 [email protected] April 23, 2008
Aging Infrastructure Requires Maintenance/Replacement
Electricity Investment Has Been Neglected
US utilities have spent relatively little on electricity infrastructure upgrades over the last 20 years. Even as recently as 2004-2008, National Grid estimates US investment in high voltage transmission infrastructure in terms of GW/year was the lowest of eight western countries (Exhibit 18)
Investment in high voltage transmission (>230kV)Normalized by load for 2004-2008
Country (in $M/GW/yr)New Zealand 22.0 1England 16.5 1Denmark 12.3 2Spain 12.0 1Netherlands 9.2 1Poland 8.6 1Finland 7.2 1United States 4.6 450
Source: National Grid.
Number of transmission
owning entities
Exhibit 18 - Investment In High Voltage Transmission Worldwide
Existing Infrastructure Is Aging
Utilities have a real incentive to upgrade equipment, driven by the 2005 US Energy Policy Act which requires a minimum standard of reliability among other things and the financial incentive to expedite the natural replacement cycle of existing infrastructure; line maintenance requirements increase as infrastructure approaches the end of its useful life while an estimated 5-10% of electricity transmitted is lost on older networks. We highlight the following:
♦ Hydro-Québec estimates more than 25% of its 108,883 km distribution infrastructure is either at or over its 40-year useful life.
♦ 60% of circuit breakers in the US are already more than 30 years old and 75% of large transformers will have reached their 40-year useful life by 2010.
♦ The majority of wood utility poles in the US were installed between the late 1940s and late 1960s and are nearing the end of their 50-year useful life (Exhibit 19).

CVTech Group Inc.
21 David Buma, CFA Industrial Products Analyst 514-350-2957 [email protected] April 23, 2008
Source: Quanta Services.
Exhibit 19 - US Electric Utility Pole Replacement
Catch-Up Could Last 10 Years
This catch-up in infrastructure spending is expected to drive strong demand for installation and maintenance services potentially for the next 10 years. This growth should be compounded by the US policy of securing access to inexpensive, renewable power, particularly in the northeastern US. We note this region is one that has suffered the effect of rolling blackouts over the last several years (Exhibit 20) and is being addressed in part through investment in new transmission lines to import hydroelectric power from Québec. Driven by the two trends described above, we highlight a program of one northeastern utility calling for spending of almost $2.7 billion over the next five years on electricity infrastructure; for the distribution component of this program, it could result in a tripling of current annual spending over that time. We believe this should easily offset any impact from continued weakness in housing starts.

CVTech Group Inc.
22 David Buma, CFA Industrial Products Analyst 514-350-2957 [email protected] April 23, 2008
Source: U.S. Department Of Energy.
Exhibit 20 - Critical Congestion Areas
Growth Supported By Additional Generating Capacity
Electricity Demand Strong Over Long Term
Growing electricity demand should require further transmission and distribution spending. Electricity use is expected to continue to grow, driven by population growth, increased per capita consumption, and continued economic growth (Exhibit 21). In order to meet this growing demand, electric utilities have two options: invest to make the transmission and distribution network more efficient or build new power plants. Both solutions bode well for line installation and maintenance service spending.
Exhibit 21 - US GDP & Electricity Demand Growth
-5%
0%
5%
10%
1956 1961 1966 1971 1976 1981 1986 1991 1996 2001 2006
Grow
th
GDP Growth Electricity Demand Growth

CVTech Group Inc.
23 David Buma, CFA Industrial Products Analyst 514-350-2957 [email protected] April 23, 2008
New Plants Must Connect To Grid
A significant number of new plants are expected over the next few years in the US. According to the Energy Information Agency (EIA), more than 15,000MW of new electricity generating capacity will come online in 2008 and more than 25,000MW in 2009 (Exhibit 22). These new plants will in turn require new transmission lines to connect them to the grid. We note that renewable energy power plants typically require more investment in transmission lines as they are often built in remote locations.
Exhibit 22 - US New Electricity Generating Capacity
0
5,000
10,000
15,000
20,000
25,000
30,000
2007e 2008e 2009e 2010e 2011e
MW
OtherRenewablesHydroelectricOther GasesNatural GasPetroleumCoal
Source: EIA.
Tropical Storms Create Maintenance Opportunities
Hurricane Intensity Increasing
Given the intensity, scope, and frequency of tropical storms and hurricanes, they can create significant and immediate demand for power grid restoration work. The hurricane season in the Atlantic US and Gulf of Mexico officially runs from June to November. Although 2007 represented an average hurricane season with 14 named storms, it was the first the season where 40% of the hurricanes reached the highest category status. The average number of tropical cyclones reaching storm and hurricane status has been on the rise; from 1997-2006, there were an average of 14.5 named storms, up from the 1977-2006 average of 11.4 (Exhibit 23). Risk Management Solutions (RMS), a leading provider of catastrophe risk assessment for insurers, forecasts above average hurricane activity rate for the next five years.
1851 - 2006 156 8.7 5.3 1.81944 - 2006 63 10.6 6.1 2.71957 - 2006 50 10.7 6.0 2.41966 - 2006 41 11.1 6.2 2.31977 - 2006 30 11.4 6.3 2.51987 - 2006 20 12.6 6.8 2.91997- 2006 10 14.5 7.8 3.6
Source: National Oceanic and Atmospheric Administration.
Period
Exhibit 23 - Tropical Storms And Hurricanes Trends
Avg Number of Tropical Storms
Avg Number of Hurricanes
Avg Number of Major Hurricanes
Number of Years

CVTech Group Inc.
24 David Buma, CFA Industrial Products Analyst 514-350-2957 [email protected] April 23, 2008
Trend Towards Increased Outsourcing
Utilities To Increase Outsourcing
Utilities are increasingly outsourcing their transmission and distribution installation and maintenance services. There has been a steady trend of declining utility employees, even while power-generating capacity continues to expand (Exhibit 24). Electricity service provider Pike Electric estimates that 55% of transmission and distribution work will be outsourced by 2015, up significantly from 45% in 2005 and 20% in 1995 (Exhibit 25). Other industry players have indicated outsourcing could increase potentially as high as 70%. This migration to third-party service providers is largely driven by the benefits of having a flexible, more efficient workforce available to the utility without the cost burden associated with employee recruitment, training, or management, particularly given the current labour shortage in the industry.
Exhibit 24 - US Utilities Employees and Power Generation
500
550
600
650
700
1995 1996 1997 1998 1999 2000 2001 2002 2003 2004 2005 2006
Thou
sand
s
3,0003,2003,4003,6003,8004,0004,200
Millio
n MW
h
Employees (LHS) Generation (RHS)Source: EIA.
Exhibit 25 - US Transmission & Distribution Outsourcing Outlook
80%55% 45%
20%45% 55%
0%
20%
40%
60%
80%
100%
1995 2005 2015eIn-House OutsourceSource: Pike Electric.

CVTech Group Inc.
25 David Buma, CFA Industrial Products Analyst 514-350-2957 [email protected] April 23, 2008
Key Competitors
Relatively Few Industry Players
There are relatively few third-party installation and maintenance service providers. Of those, the majority are privately held companies. Due to a shortage of linemen in North America, the industry is not overly competitive; key points of competition include price, existing relationships and quality of service (including the company’s safety record). We profile the industry players below:
♦ Pike Electric Corp. (PKE-NYSE) – Based in Mount Airy, North Carolina, Pike Electric is one of the largest providers of electric transmission and distribution services in the US. Pike is particularly strong in the southeastern US. Pike maintains, upgrades and installs electric distribution lines as well as transmission lines of less than 500 kV. Pike Electric had revenue of US$597 million in F2007.
♦ Quanta Services Inc. (PWR-NYSE) – Based in Houston, Texas, Quanta Services offers various network solutions to the electric power, gas, telecommunications, cable television, and specialty services industries. Quanta Services had revenue of US$2,656 million in 2006, of which approximately 56% was generated from its electric power activities.
♦ G.L.R. Inc. (Private) – Based in Québec City, Québec, G.L.R. is a general contractor operating in the power transmission lines construction and civil engineering services sectors. G.L.R. has completed projects worldwide, including in northern Québec and Africa. Strategis estimates G.L.R. has annual revenue of $10-$25 million.
♦ Hawkeye, LLC. (Private) – Based in Hauppauge, New York, Hawkeye provides construction services primarily in the northeastern and mid-Atlantic states. Hawkeye was acquired in late 2006 by Infrastrux Group, a national provider of infrastructure construction services to the electric, gas, water/sewer, and telecom industries. Infrastrux has revenue in excess of US$650 million.
♦ Arno Électrique Ltée. (Private) – Based in Trois-Rivières, Québec, Arno Électrique is active in the construction and maintenance of electrical power stations and transmission and distribution lines, as well as vegetation control. Arno Électrique has offices in Montréal, Québec and Bedford, New Hampshire. According to CapitalIQ, the company has annual revenue of US$51 million.
♦ Transelec/Common Inc. (Private) – Based in Laval, Québec, Transelec/Common specializes in the construction, management and maintenance of network infrastructure in the energy, telecommunications and civil engineering sectors. According to CapitalIQ, Transelec/Common has annual revenue of US$49 million.
♦ Asplundh Tree Expert Co. (Private) – Based in Willow Grove, Pennsylvania, Asplundh is the world’s largest vegetation management company that serves utilities and municipalities in the United States, Canada, Australia, and New Zealand. According to CapitalIQ, Asplundh has annual revenue of US$2,366 million.

CVTech Group Inc.
26 David Buma, CFA Industrial Products Analyst 514-350-2957 [email protected] April 23, 2008
Appendix II – Vehicles Outlook
Vehicles – 19% of 2007 Revenue, 13% of EBITDA
CVT Design, Production, And Rebuild
The Vehicles segment is involved in the design, production, and rebuilding of continuously variable transmissions (CVTs) and other engine-related parts. Core activities include the following:
♦ Design, production, and commercialization of CVTs for manufacturers of minicars and general purpose vehicles, including utility vehicles (UTVs), all-terrain vehicles (ATVs), and snowmobiles. CVTech adapts its product specifically to the needs of each client and of each vehicle. Of note, 23 of the division’s 164 employees are in the R&D department.
♦ Aftermarket services, including the re-plating of engine cylinders and rebuilding of crankshafts and other engine-related parts for a variety of vehicles.
Aftermarket To Offset F/X Impact
The original business of CVTech, Vehicles has been challenged by the rise in the C$/US$ (Exhibit 26). As one way to mitigate the decline in revenue and profitability, CVTech entered into the aftermarket service business with the September 2006 acquisition of Atelier Adrien Bernard Inc for $10.5 million. We believe the company will continue to expand its aftermarket offering. The Vehicles division is currently undergoing some cost-cutting intiatives to improve profitability on the manufacturing side.
Exhibit 26 - Vehicles Revenue & EBITDA Margin (2001-2007)
0
10
20
30
40
2001 2002 2003 2004 2005 2006 2007
$ Milli
on
0%
5%
10%
15%
20%
EBIT
DA M
argi
nRevenue (LHS) EBITDA Margin (RHS)
Source: Company reports.
Revenue To Be Flat, Nano Provides Long-Term Upside
We expect revenue growth at Vehicles of -1.6% in 2008E, 4.2% in 2009E, and 5.0% in 2010E (Exhibit 27). The company’s position in the European minicar car market and increasing aftermarket service business should offset any weakening recreational vehicle sales as a result of the US economic slowdown and rising fuel costs. Due to uncertainty surrounding the timing and scale of the CVT opportunity with Tata Motors’ Nano minicar, we have not attributed any value to it in our revenue forecast. Beyond the forecast horizon, however, we believe the opportunities in Asian minicar car market are potentially significant.

CVTech Group Inc.
27 David Buma, CFA Industrial Products Analyst 514-350-2957 [email protected] April 23, 2008
($M) 2005 2006 2007 2008E 2009E 2010ERevenue 23.4 20.6 24.3 23.9 24.9 26.2
% Growth -21.0% -12.1% 17.9% -1.6% 4.2% 5.0%
EBITDA 0.6 1.0 2.2 2.2 2.4 2.6% Growth -86.1% 66.3% 112.4% 2.7% 8.5% 7.1%
EBITDA Margin 2.6% 5.0% 9.0% 9.4% 9.8% 10.0%
Source: Company reports; LBS estimates.
Exhibit 27 - Vehicle Outlook (2005-2010E)
We expect profitability to improve over the forecast horizon. Vehicles has lost money in each of the last three years as a result of the combination of a stronger C$/US$ and the termination of its relationship with Bombardier Recreational Products (BRP) due to issues surrounding pricing. The company has indicated Vehicles could break even as early as this year, benefiting from increased activity levels, further cost-cutting measures, and a growing contribution from the company’s aftermarket business. We expect EBITDA margin to progress from 9.0% in 2007 to 9.4% in 2008E, 9.8% in 2009E, and 10.0% in 2010E.
What Is A CVT?
CVT Defined A pulley-based CVT is broadly a transmission comprised of two variable-diameter pulleys. Although the feeling of changing gears can be simulated with CVTs, in its purest form, the user would normally experience just a smooth acceleration. This is achieved by keeping the transmission belt fixed in length while adjusting the variable diameter pulleys (Exhibit 28), in effect creating an unlimited number of gear ratios. The belt can be made of either rubber or metal for more durability.
Source: HowStuffWorks.com
Exhibit 28 - Pulley-based CVT
CVTech Group Inc.
28 David Buma, CFA Industrial Products Analyst 514-350-2957 [email protected] April 23, 2008
The CVT allows the engine to run at its most efficient level in terms of power and fuel efficiency. The benefits of the CVT are clear: it generates more rapid acceleration than a manual transmission, burns approximately 15% less fuel, and costs less than a conventional transmission. The CVT can also be calibrated to simulate the feeling of a conventional transmission changing gears in order to provide a more exciting driving experience. The downside of the technology is the deterioration of the belt, which although inexpensive, requires regular replacement.
Minicars Account For 34% Of Vehicle Revenue
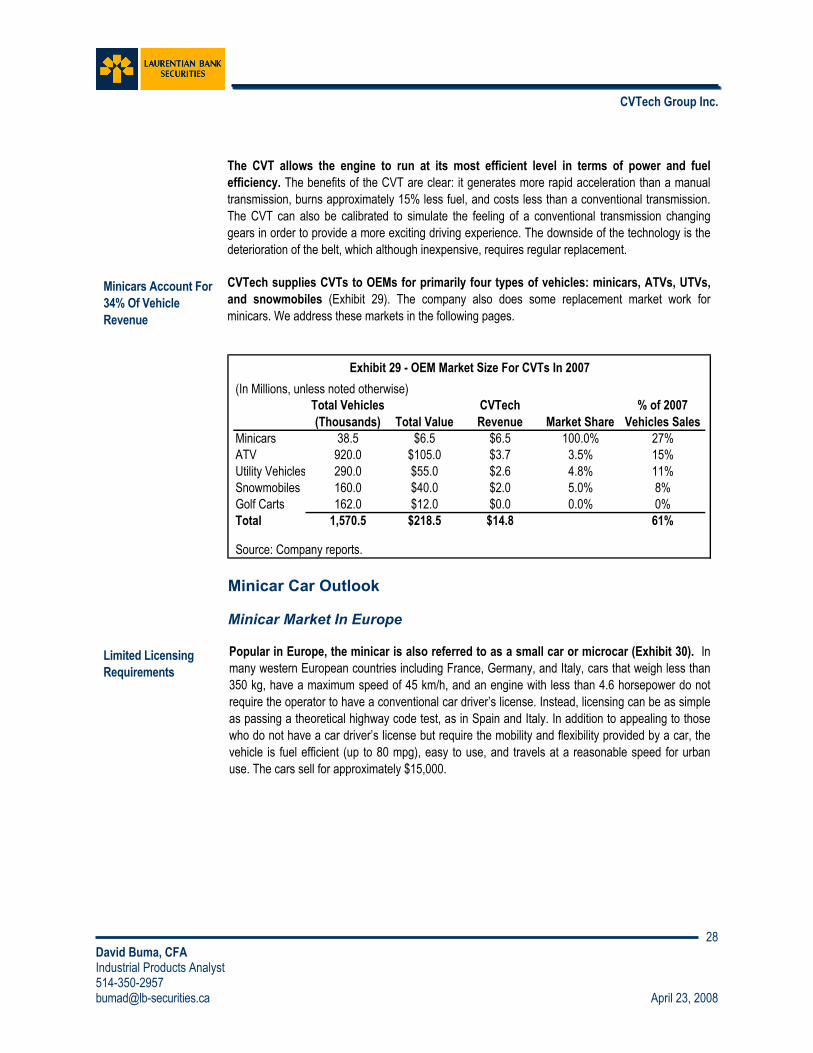
CVTech supplies CVTs to OEMs for primarily four types of vehicles: minicars, ATVs, UTVs, and snowmobiles (Exhibit 29). The company also does some replacement market work for minicars. We address these markets in the following pages.
(In Millions, unless noted otherwise)
Minicars 38.5 $6.5 $6.5 100.0% 27%ATV 920.0 $105.0 $3.7 3.5% 15%Utility Vehicles 290.0 $55.0 $2.6 4.8% 11%Snowmobiles 160.0 $40.0 $2.0 5.0% 8%Golf Carts 162.0 $12.0 $0.0 0.0% 0%Total 1,570.5 $218.5 $14.8 61%
Source: Company reports.
Exhibit 29 - OEM Market Size For CVTs In 2007
Total Vehicles (Thousands) Total Value Market Share
% of 2007 Vehicles Sales
CVTech Revenue
Minicar Car Outlook
Minicar Market In Europe
Limited Licensing Requirements
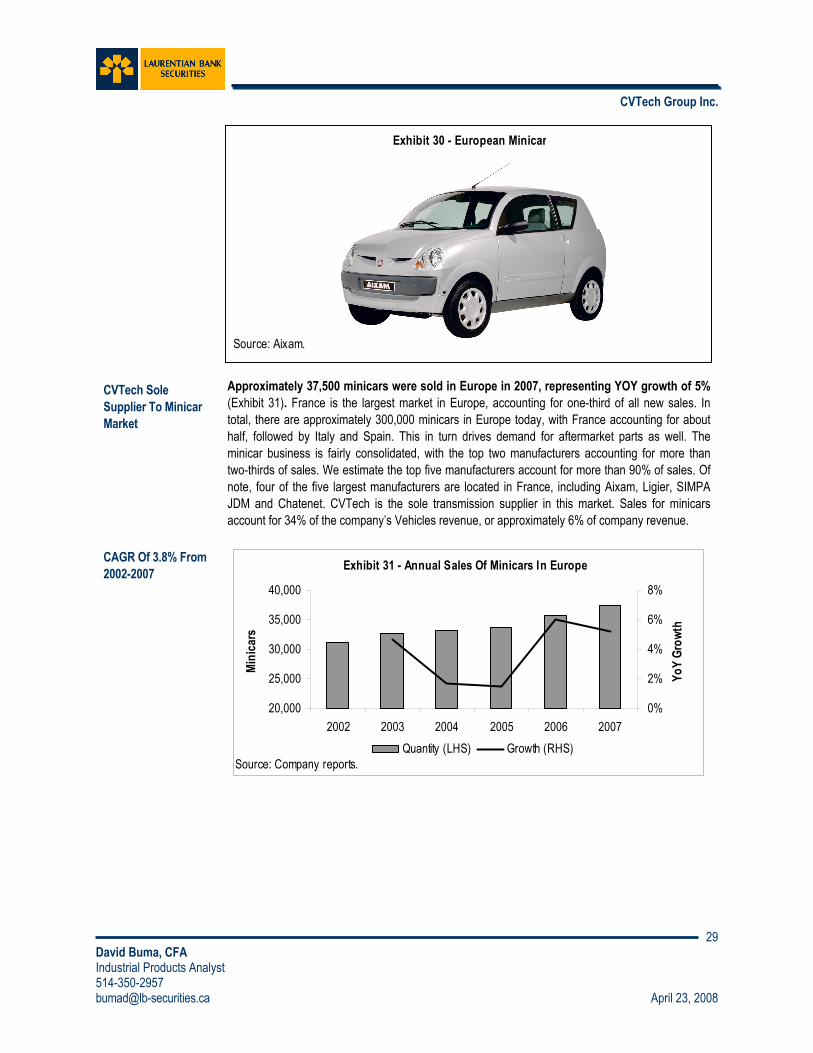
Popular in Europe, the minicar is also referred to as a small car or microcar (Exhibit 30). In many western European countries including France, Germany, and Italy, cars that weigh less than 350 kg, have a maximum speed of 45 km/h, and an engine with less than 4.6 horsepower do not require the operator to have a conventional car driver’s license. Instead, licensing can be as simple as passing a theoretical highway code test, as in Spain and Italy. In addition to appealing to those who do not have a car driver’s license but require the mobility and flexibility provided by a car, the vehicle is fuel efficient (up to 80 mpg), easy to use, and travels at a reasonable speed for urban use. The cars sell for approximately $15,000.
CVTech Group Inc.
29 David Buma, CFA Industrial Products Analyst 514-350-2957 [email protected] April 23, 2008
Source: Aixam.
Exhibit 30 - European Minicar
CVTech Sole Supplier To Minicar Market
Approximately 37,500 minicars were sold in Europe in 2007, representing YOY growth of 5% (Exhibit 31). France is the largest market in Europe, accounting for one-third of all new sales. In total, there are approximately 300,000 minicars in Europe today, with France accounting for about half, followed by Italy and Spain. This in turn drives demand for aftermarket parts as well. The minicar business is fairly consolidated, with the top two manufacturers accounting for more than two-thirds of sales. We estimate the top five manufacturers account for more than 90% of sales. Of note, four of the five largest manufacturers are located in France, including Aixam, Ligier, SIMPA JDM and Chatenet. CVTech is the sole transmission supplier in this market. Sales for minicars account for 34% of the company’s Vehicles revenue, or approximately 6% of company revenue.
CAGR Of 3.8% From 2002-2007 Exhibit 31 - Annual Sales Of Minicars In Europe
20,000
25,000
30,000
35,000
40,000
2002 2003 2004 2005 2006 2007
Mini
cars
0%
2%
4%
6%
8%
YoY
Grow
th
Quantity (LHS) Growth (RHS)Source: Company reports.

CVTech Group Inc.
30 David Buma, CFA Industrial Products Analyst 514-350-2957 [email protected] April 23, 2008
Enormous Minicar Potential In Asia
India Is Fastest Growing Car Market
India is the fastest growing car market in the world (Exhibit 32). CSM Worldwide estimates light vehicle sales volumes to increase at a CAGR of 14.5% from 2007-2013, well ahead of Indonesia (12.2%) and China (8.1%). Despite a population exceeding 1.1 billion people, there are only 13.5 million passenger cars and 65 million two-wheeled vehicles in use.
Country 2007 2013 CAGRIndia 1,708,415 3,844,102 14.5%Indonesia 334,205 666,458 12.2%Poland 321,639 569,302 10.0%Thailand 572,172 1,000,728 9.8%China 6,781,803 10,791,309 8.1%
Source: CSM Worldwide.
Exhibit 32 - Projected Light Vehicle Sales Volume
Tata Nano Price Is Revolutionary
Minicars represent a significant opportunity in India, particularly with the launch of Tata Motors’ revolutionary car. Unveiled in January, the base-model Nano is expected to cost $2,500 and will be targeted at the lower middle-class Indian families that currently operate relatively inexpensive two-wheeled vehicles. It is estimated 10% of the Indian population could afford the Nano. The next cheapest cars currently on the market, the Maruti-Suzuki 800 and Alto, sell for almost double the targeted price of the Nano. Launch of entry-level cars is expected from several manufacturers but none will likely be at the price point of the Nano. We note Tata Motors is the largest automobile company in India with revenue of US$7.2 billion in 2007, ranking first in commercial vehicles and second in passenger vehicles.
Timing Of CVT Version Uncertain
Tata is expected to offer a CVT model Nano, although the timing of such a launch is uncertain. Initial production of the conventional transmission Nano is expected to begin towards the end of 2008; Tata Motors estimates it will assemble 200,000-250,000 units in the first year of production and could reach one million units per year over time. CVTech is currently working to finalize its agreement with Tata; it is unclear what level of investment will be required of CVTech as CVT volumes may not warrant construction of a facility in India in the near-term. CVTech is currently developing an electronic CVT which would be made available first to Tata, most likely in 2009. This would eventually be rolled out to Europe.
Nano Upside Not Reflected In Our Estimates
Although we believe CVTech will eventually supply CVTs for the Nano, we have not included any impact in our revenue growth estimates. Uncertainty includes the timing of the CVT-version launch, the actual success of the Nano, and the rate of adoption of the CVT Nano versus the conventional transmission. We highlight that CVTech is the only CVT manufacturer currently capable of supplying a product suitable to the vehicle. Barring the outright drop of the CVT version, which we see as unlikely given its lower cost, we expect CVTech will construct a production facility in India at some point; in addition to the Nano, we believe the company could leverage its Asian location to benefit from new entrants in the minicar market in the region.

CVTech Group Inc.
31 David Buma, CFA Industrial Products Analyst 514-350-2957 [email protected] April 23, 2008
North American Recreational Vehicles Outlook Mixed
We profile below the three primary classes of general purpose recreational vehicles:
ATVs GDP-Sensitive In US
♦ All-terrain vehicles – All-terrain vehicles (ATVs), also known as “quads”, are the most widely used general purpose recreational vehicles. Worldwide ATV sales increased steadily between 1996 and 2004 before slowing down in 2005-2006. American Honda Motor Co. estimates sales of its ATV and personal watercraft were down 22% for the year 2007. Sales of ATVs in the US are sensitive to economic cycles, changes in disposable income, and fuel prices as they are largely viewed as recreational vehicles. Sales of ATVs in the US accounted for 77% of worldwide sales in 2006, although this percentage is decreasing steadily. ATV sales accounted for 15% of Vehicles revenues in 2007.
Exhibit 33 - Worldwide ATV Sales (Excluding UTV)
0200
400600
8001,000
1,200
1996 1997 1998 1999 2000 2001 2002 2003 2004 2005 2006
000 U
nits
Source: Powersports Business.
UTV Market Growing Quickly
♦ Utility vehicles – The utility vehicles (UTVs) segment is one area of growth in the recreational vehicles market. Although traditionally used for landscaping and general maintenance purposes, the recreational use of these vehicles seating two across is growing in popularity. Powersports Business estimates that the number of UTVs sold in the US in 2006 was approximately 250,000 units; Yamaha, one of the largest players in the UTV market, reported a jump of more than 20% in units sold in 2007. UTV sales accounted for 11% of Vehicles revenue in 2007.
Weakness In Snowmobiles Could Continue
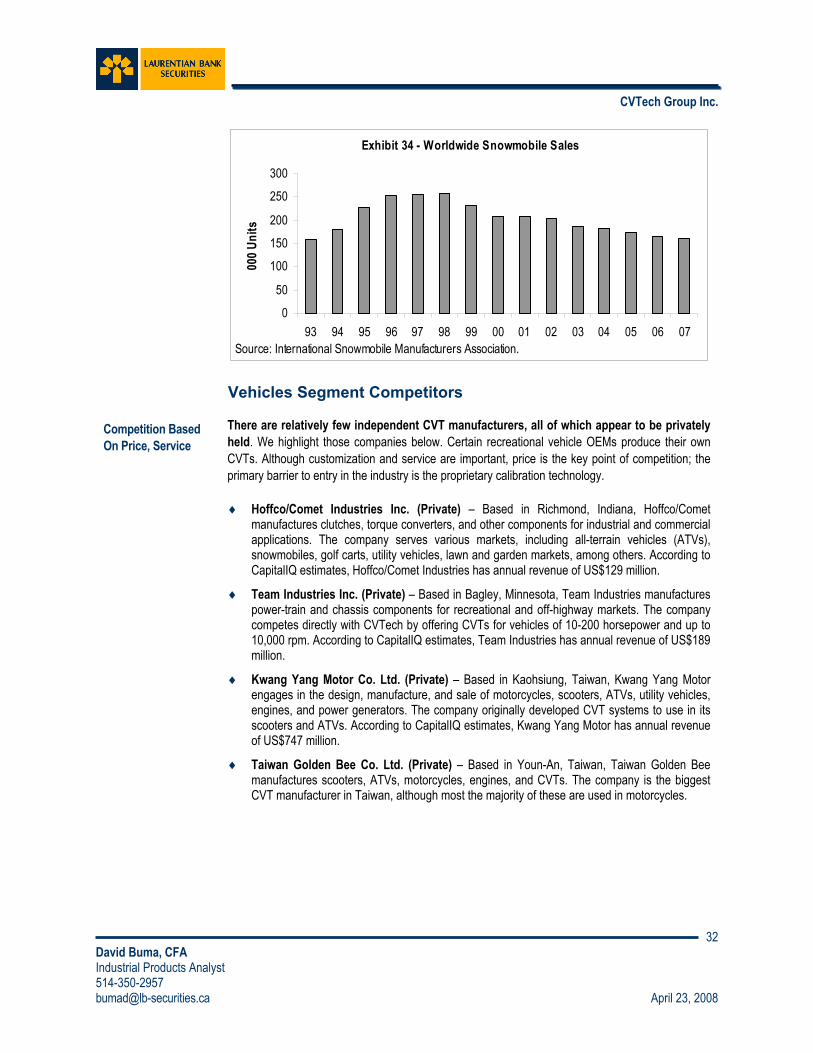
♦ Snowmobile – Key drivers of snowmobile sales include snowfall and general economic conditions; snowmobile sales declined for the tenth year in a row in 2007 (Exhibit 34). The US is the biggest market with 50% of worldwide sales followed by Canada with 28% and Europe with 22%. We expect the benefit of above-average snowfall in eastern North America could be offset by the US economic slowdown. Snowmobile sales accounted for 8% of Vehicles revenue in 2007.
CVTech Group Inc.
32 David Buma, CFA Industrial Products Analyst 514-350-2957 [email protected] April 23, 2008
Exhibit 34 - Worldwide Snowmobile Sales
0
50
100
150
200
250
300
93 94 95 96 97 98 99 00 01 02 03 04 05 06 07
000 U
nits
Source: International Snowmobile Manufacturers Association.
Vehicles Segment Competitors
Competition Based On Price, Service
There are relatively few independent CVT manufacturers, all of which appear to be privately held. We highlight those companies below. Certain recreational vehicle OEMs produce their own CVTs. Although customization and service are important, price is the key point of competition; the primary barrier to entry in the industry is the proprietary calibration technology.
♦ Hoffco/Comet Industries Inc. (Private) – Based in Richmond, Indiana, Hoffco/Comet manufactures clutches, torque converters, and other components for industrial and commercial applications. The company serves various markets, including all-terrain vehicles (ATVs), snowmobiles, golf carts, utility vehicles, lawn and garden markets, among others. According to CapitalIQ estimates, Hoffco/Comet Industries has annual revenue of US$129 million.
♦ Team Industries Inc. (Private) – Based in Bagley, Minnesota, Team Industries manufactures power-train and chassis components for recreational and off-highway markets. The company competes directly with CVTech by offering CVTs for vehicles of 10-200 horsepower and up to 10,000 rpm. According to CapitalIQ estimates, Team Industries has annual revenue of US$189 million.
♦ Kwang Yang Motor Co. Ltd. (Private) – Based in Kaohsiung, Taiwan, Kwang Yang Motor engages in the design, manufacture, and sale of motorcycles, scooters, ATVs, utility vehicles, engines, and power generators. The company originally developed CVT systems to use in its scooters and ATVs. According to CapitalIQ estimates, Kwang Yang Motor has annual revenue of US$747 million.
♦ Taiwan Golden Bee Co. Ltd. (Private) – Based in Youn-An, Taiwan, Taiwan Golden Bee manufactures scooters, ATVs, motorcycles, engines, and CVTs. The company is the biggest CVT manufacturer in Taiwan, although most the majority of these are used in motorcycles.

CVTech Group Inc.
33 David Buma, CFA Industrial Products Analyst 514-350-2957 [email protected] April 23, 2008
Percentage of companies covered by Laurentian Bank Securities Equity Research within each rating category.
Appendix III – Important Disclosures
Company Ticker Disclosures*
CVTech Group Inc. CVT-T V
The analyst(s) certify that (1) the views expressed in this report in connection with securities or issuers they analyze accurately reflect their personal views and (2) no part of their compensation was, is, or will be directly or indirectly, related to the specific recommendations or views expressed by them in this report. The Research Analyst’s compensation is based on various performance and market criteria and is charged as an expense to certain departments of Laurentian Bank Securities (LBS), including investment banking.
* Legend A The Analyst, in his/her own account or in a related account, owns securities of this issuer. L LBS collectively beneficially owns in excess of 1% of one or more classes of the issued and outstanding equity
securities of this issuer. O The Director of Equity Research, in his/her own account or in a related account, owns securities of this issuer. U Within the last 24 months, LBS has undertaken an underwriting liability with respect to equity securities of, or
has provided advice for a fee with respect to, this issuer. V The Analyst has visited material operations of this issuer, namely manufacturing facilities. P This issuer paid a portion of the travel-related expenses incurred by the Analyst to visit material operations of
this issuer Laurentian Bank Securities Equity Research Ratings Distribution
45%
5%9%
0%
41%
0%
10%
20%
30%
40%
50%
Top Pick Buy Spec Buy Hold Reduce
CVTech Group Inc.
34 David Buma, CFA Industrial Products Analyst 514-350-2957 [email protected] April 23, 2008
Recommendation LBS (Laurentian Bank Securities) recommendation terminology is as follows: Terminology
Top Pick Our best investment idea, the greatest potential value appreciation. Buy The stock is expected to generate significant risk-adjusted returns over the next 12 months. Hold The stock is expected to generate modest risk-adjusted returns over the next 12 months. Reduce The stock is expected to generate negative risk-adjusted returns over the next 12 months.
Our ratings may be followed by “(S)” which denotes that the investment is speculative and has a higher degree of risk associated with it.
Additionally, our target prices are based on a 12-month investment horizon.
The information contained in this document is based on what we deem to be reliable sources, but no guarantee or promise, explicit or implicit, is given as to the accuracy and exhaustiveness of these sources. This report shall under no circumstances be considered an offer to buy or sell, or a request to buy and/or sell the stocks mentioned. Laurentian Bank Securities Inc. and its employees may not be held liable for any monetary losses stemming from the implementation of the recommendations contained in this document. Laurentian Bank Securities Inc. and/or its officers, directors, representatives, traders, analysts and members of their families may hold positions in the stocks mentioned in this document and may buy and/or sell these stocks on the market or otherwise. Stocks in foreign currency may be adversely affected by exchange rate fluctuations. Laurentian Bank Securities Inc. is a wholly-owned subsidiary of Laurentian Bank of Canada. The opinions, projections and estimates are those of the Economic and Financial Research department of Laurentian Bank Securities Inc. as at the date appearing on the cover page, and are subject to change without prior notice. Laurentian Bank Securities Inc. may, in exchange for remuneration, act as a financial advisor or tax consultant for, or participate in the financing of companies mentioned in this document. This study may not be reproduced, in whole or in part, without the consent of Laurentian Bank Securities Inc.

CVTech Group Inc.
35 David Buma, CFA Industrial Products Analyst 514-350-2957 [email protected] April 23, 2008
Laurentian Bank Securities (LBS)
President
Michel Trudeau, MBA
Institutional Equity
Simon Lussier, MBA (514) 350-3060 Senior Vice President [email protected]
Research
David Buma, CFA (514) 350-2957 Head of Equity Research Industrial Products Analyst [email protected]
Alex Grassino, MSc (514) 350-2855 Information Technology Analyst [email protected]
Catherine Bouchard, MSc, MBA (514) 350-2938 Healthcare Analyst [email protected]
Alka Patel (514) 350-2941 Consumer Products Analyst [email protected]
Vincent Perri, CA, CFA (514) 350-2876 Special Situations Analyst [email protected]
Éric Lemieux, MSc, P. Geo (514) 350-2874 Mining Analyst (819) 472-8037 [email protected]
Carl Martel, MSc, MBA (514) 350-2964 Clean Technologies Analyst [email protected]
Ben Vendittelli, MBA, CFA (514) 350-2803 Transportation & Infrastructure Analyst [email protected] Mathieu Chevrier (514) 350-2949 Research Associate [email protected]
Trading
Maurice Gariepy (514) 350-3055 Head Trader [email protected]
Demitri Prassinos Trader (514) 350-2823 [email protected]
Sales
Suzy Champagne, MSc, CFA (514) 350-2992 [email protected]
Marcia Wisniewski, CFA (416) 865-5982 [email protected]
Patrick D’Amico, MBA (416) 865-5876 [email protected]
Corporate Finance
Patrick Langlois, CFA, MBA (514) 350-3045 [email protected]
Frédéric Beausoleil, CFA (514) 350-2839 [email protected]
Fixed Income Sales Division
Chris B. Ward (514) 350-2904 Vice President Sales [email protected]
Syndication
Pierre Godbout, CIM (514) 350-3050 Vice President [email protected]
Jean-François Carrière (514) 350-2979 Syndication Analyst [email protected]
Retail Division
Riccardo Magini (514) 350-2960 Vice President* [email protected]
Economics & Strategy
Carlos Leitao (514) 350-3000 Chief Economist [email protected]
Sébastien Lavoie (514) 350-2931 Economist [email protected]
Boris Wyka, CFA (514) 350-2975 Strategist [email protected]
Martine Bérubé (514) 350-3006 Coordinator [email protected]
* Subject to approval by the regulatory authorities. ** Leave of absence from November 2007 to September 2008