cvision – 2 digital imagingmcoimbra/lectures/mapi... · the saturation of a color is determined...
TRANSCRIPT

Cvision – 2Digital ImagingDigital Imaging
António J. R. Neves([email protected])
&&João Paulo Silva Cunha
&Bernardo Cunha
IEETA / Universidade de Aveiro

Outline
• Image sensors• Camera calibration• Camera calibration• Sampling and quantization• Data structures for digital images• Histograms
2
Acknowledgements: Most of this course is based on t he excellent courses offered by Prof. Shree Nayar a t Columbia University, USA and by Prof. Srinivasa Nar asimhan at CMU, USA. This was also based on Prof. Miguel Coimbra’s slides. Please acknowledge the ori ginal source when reusing these slides for academic purposes.

Topic: Image Sensors
• Image sensors• Camera Calibration• Camera Calibration• Sampling and quantization• Data structures for digital images• Histograms
3

Image Sensors
• Considerations• Considerations
• Speed
• Resolution
• Signal / Noise Ratio
4
• Cost

Image Sensors
• Convert light into an electric charge
CCD (charge coupled device) CMOS (complementary metal
5
CCD (charge coupled device)
Higher dynamic range
High uniformity
Lower noise
CMOS (complementary metalOxide semiconductor)
Lower voltage
Higher speed
Lower system complexity

CCD Performance Characteristics
• Linearity Principle: Incoming photon flux vs. Output Signal
• Sometimes cameras are made non-linear on purpose.
• Calibration must be done (using reflectance charts)
• Dark Current Noise: Non-zero output signal whenincoming light is zero
6
incoming light is zero
• Sensitivity: Minimum detectable signal produced by camera

Sensing Brightness
Incoming light has a spectral distribution ( )λp
7
So the pixel intensity becomes
( ) ( )∫∞
∞−
= λλλ dpqkI

How do we sense colour?
• Do we have infinite number of filters?
rod
cones
8
cones
Three filters of different spectral responses
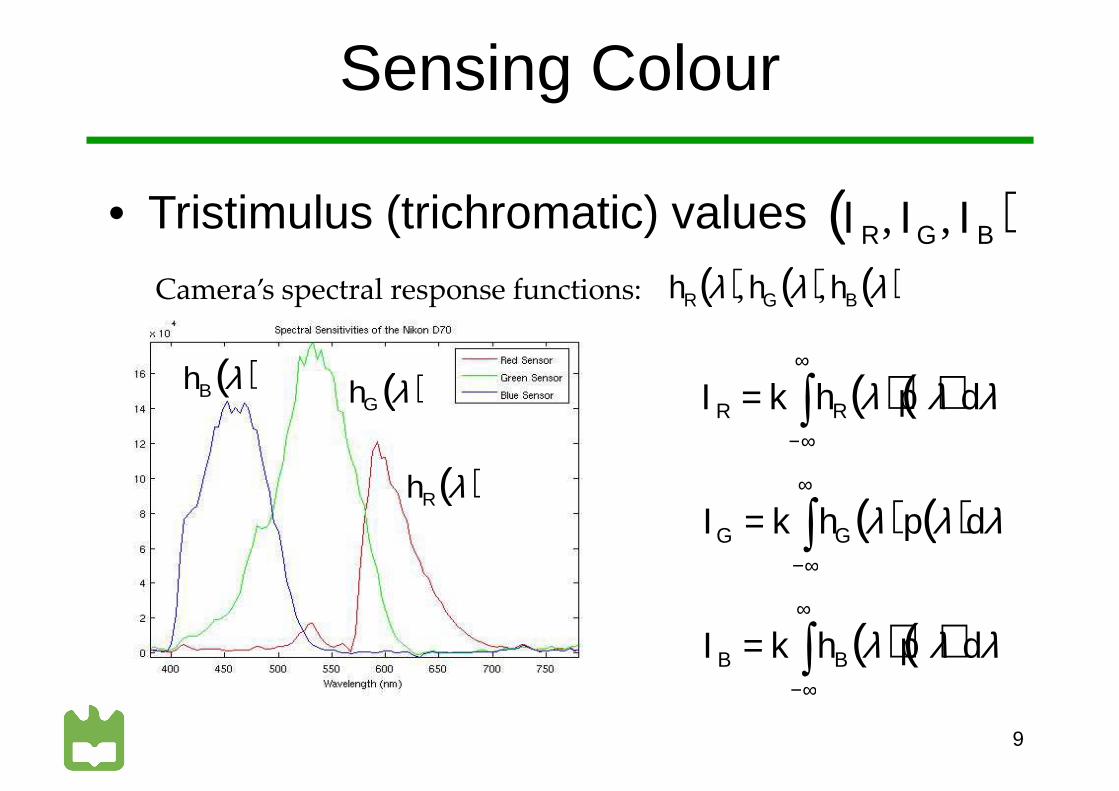
Sensing Colour
• Tristimulus (trichromatic) values ( )BGR III ,,
( ) ( )∫∞
∞−
= λλλ dphkI RR
( ) ( )∫∞
= λλλ dphkI GG
( )λRh
( )λGh( )λBh
( ) ( ) ( )λλλ BGR hhh ,,Camera’s spectral response functions:
9
( ) ( )∫∞−
= λλλ dphkI GG
( ) ( )∫∞
∞−
= λλλ dphkI BB

Sensing Colour
3 CCD
beam splitter
light
10
Bayer pattern
Foveon X3TM


Several types of cameras
• Several interfaces (Firewire, GigE, CameraLink, USB, ...).
• Scientific usage (high resolution, long exposure • Scientific usage (high resolution, long exposure time, ...).
• High speed (ex. 1000 fps).• Linear (ex. 10000 lines per second).• 3D• Infrared (ex. 8 to 14 µm).• Infrared (ex. 8 to 14 µm).• High dynamic range (ex. using a prism and two
sensors).• Multispectral

Topic: Camera Calibration
• Image sensors• Camera Calibration• Camera Calibration• Sampling and quantization• Data structures for digital images• Histograms
13

Definitions - Luminance
LuminanceLuminance is normally defined as a measurement of the photometric luminous Luminance is normally defined as a measurement of the photometric luminous intensity per unit area of light travelling in a given direction.
Therefore it is used to describe the amount of light that goes through, or is emitted from, a particular area, and falls within a given solid angle.
The SI unit for luminance is candela per square meter (cd/m2).
The CGS unit of luminance is the stilb, which is equal to one candela per square centimeter or 10 kcd/m2.

Definitions - Chrominance
ChrominanceChrominance is a numeral that describes the way a certain amount of light is Chrominance is a numeral that describes the way a certain amount of light is distributed among the visible spectrum.
A black and white image has a balanced distribution of energy among to the visible spectrum matched to the band pass characteristics of the human visual system. This means that when viewed by a human a B&W image has no color information which means that its color information is zero.
Therefore, chrominance has no luminance information but is used together with it to describe a colored image defined, for instance, by an RGB triplet.to describe a colored image defined, for instance, by an RGB triplet.
Any RGB triplet in which the value of R=G=B has no chrominance information.

RGB & YUV
Separating Luminance from ChrominanceGiven an RGB triplet, we can define a derived triplet in which luminance and Given an RGB triplet, we can define a derived triplet in which luminance and chrominance can be separated:
where This values originally derivates from the general
)(877.01
max
)(492.01
max
YRW
YRVV
YBW
YBUU
BWGWRWY
r
b
bgr
−≈−−=
−≈−−=
++= Luminance
Chrominance
where
61504360
587011402990
..
.
..
max
max
==
===
VUWWW
G
B
r
This values originally derivates from the general model of the human visual system and had a significant impact on the ability to develop a television color system compatible with the
previous B&W television systems.
A symetric operation can be performed in order to recover the original RGB triple.

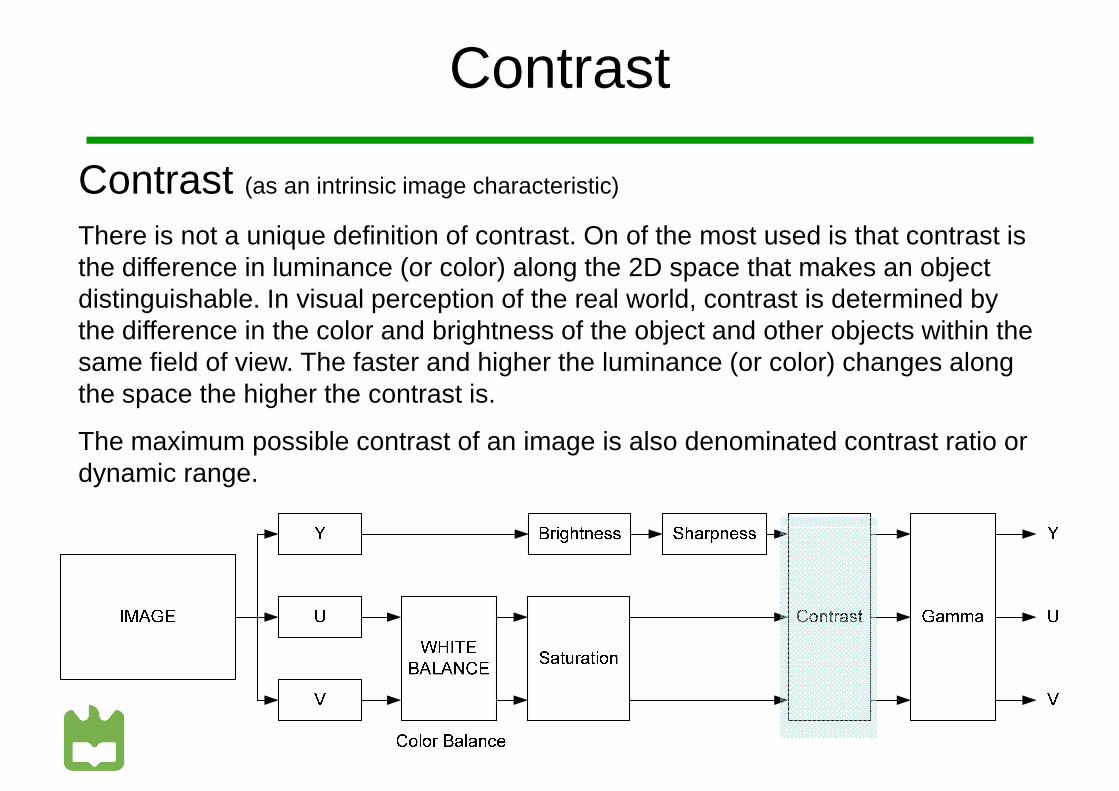
The image processing pipeline
Image processing pipelineA typical image processing pipeline (inside the image device) for a tri-stimulus A typical image processing pipeline (inside the image device) for a tri-stimulus system is shown bellow. This processing can be performed on the YUV or RGB components depending on the system. This should be understood as a mere example.

The image processing pipeline
Image processing pipelineDepending on the system, more or less image parameters may be available for Depending on the system, more or less image parameters may be available for the user to control. Also, some of these parameters (namely brightness, contrast and saturation) are also intrinsic original image characteristics apart from being externally controllable parameters.

Brightness
Brightness (as an intrinsic image characteristic)
Brightness is one on the intrinsic original image characteristics. It represents a measure of the average amount of light that is integrated over the image during measure of the average amount of light that is integrated over the image during the exposure time. Exposure time (that is, the period of time during which the sensor receives light while forming the image, may or may not be a controllable parameter of the image device).
If the brightness it too high overexposure may occur which will white saturate part or the totality of the image.

Brightness
Brightness (as a controllable parameter)
The brightness parameter is basically a constant (or offset) that can be added (subtracted) from the luminance component of the image.(subtracted) from the luminance component of the image.
Input
Output
Contrast
Contrast (as an intrinsic image characteristic)
There is not a unique definition of contrast. On of the most used is that contrast is the difference in luminance (or color) along the 2D space that makes an object the difference in luminance (or color) along the 2D space that makes an object distinguishable. In visual perception of the real world, contrast is determined by the difference in the color and brightness of the object and other objects within the same field of view. The faster and higher the luminance (or color) changes along the space the higher the contrast is.
The maximum possible contrast of an image is also denominated contrast ratio or dynamic range.

Contrast
Contrast (as an intrinsic image characteristic)
One of the possible definitions of contrast is given by the expression
diference Luminance
luminance Average
diference Luminance
The human eye contrast sensitivity function is a typical band-pass filter with a maximum at around 4 cycles per degree with sensitivity reducing to both sides off that maximum. This means that the human visual system can detect lower contrast differences at 4 cycles per degree than at any other spatial frequency.

Contrast
Contrast (as a controllable parameter)
The contrast parameter is basically a variation in the gain control function of the luminance component of the image.luminance component of the image.
Input
Output

Contrast + Brightness
Contrast + Brightness (as controllable parameters)
It is common that contrat and brightness are actually a combined single transfer function.function.
Input
Output

White Balance
White Balance(as controllable parameters)
White balance is the global adjustment of the intensities of the colors (typically red, green, and blue primary colors). green, and blue primary colors).
An important goal of this adjustment is to render specific colors – particularly neutral colors – correctly; hence, the general method is sometimes called gray balance, neutral balance, or white balance.
This balance is required because of different color spectrum energy distribution depending on the illumination source.

White Balance
White BalanceExamples

Saturation
Saturation (as an intrinsic image characteristic)
The saturation of a color is determined by a combination of light intensity that is acquired by a pixel and how much this light it is distributed across the spectrum of acquired by a pixel and how much this light it is distributed across the spectrum of different wavelengths. The most purest (most saturated) color is obtained when using a single wavelength at a high intensity (laser light is a good example).
If the light intensity declines, then, as a result, the saturation also decline.
A non saturated image (B&W) has a spectrum distribution that matches the human eye spectrum sensibility. Saturation is sometimes also defined as the amount of white you have blended into a pure color.

Saturation
Saturation (as a controllable parameter)
To reduce the saturation of an image we can add white to the original colors. In fact this is the same as changing the gain of the U and V chromatic components. fact this is the same as changing the gain of the U and V chromatic components.

Gamma
GammaGamma correction is the name of a nonlinear operation used to code and decode luminance or RGB tristimulus values. In the simplest cases gamma is defined by the power-law or RGB tristimulus values. In the simplest cases gamma is defined by the power-law expression:
where A is a constant and the input and output values are non-negative real values.
In most cases A = 1, and inputs and outputs are typically in the range 0–1.
δinout AVV =

Gamma
GammaExamples

Sharpness
Sharpness (as a controllable parameter)
Sharpness is a measure of the energy frequency spatial distribution over the image.image.
Not all devices provide access to this parameter.
Sharpness basically allows the control of the cut-off frequency of a low pass spatial filter. This may be very useful if the image is afterward intended to be decimated, since it allows to prevent spatial aliases artifacts.

Sharpness
Sharpness (as a controllable parameter)
Examples.

Topic: Sampling and quantization
• Image sensors• Camera Calibration• Camera Calibration• Sampling and quantization• Data structures for digital images• Histograms
33

Camera
Components of a Computer Vision System
Lighting
Scene
Computer
34
Scene
Scene Interpretation

Digital Images
35
What we seeWhat a computer sees

Simple Image Model
• Image as a 2D light-intensity functionintensity function
• Continuous• Non-zero, finite value Intensity
∞<< ),(0 yxf
),( yxf
36
Position
[Gonzalez & Woods]

Analog to Digital
The scene is:– projected on a 2D – projected on a 2D
plane, – sampled on a regular
grid, and each sample is
– quantized (rounded to the nearest
37
to the nearest integer) ( ) ( ){ }∆∆= jifjif ,Quantize,

Images as Matrices
• Each point is a pixelwith amplitude:
(0,0) (0,N-1)
with amplitude:– f(x,y)
• An image is a matrix with size N x M
M = [(0,0) (0,1) …[(1,0) (1,1) …
38
[(1,0) (1,1) …… (M-1,0)
Pixel

Sampling Theorem
Continuous signal: ( )xf
Shah function (Impulse train): x( )xs ( ) ( )∑
∞
−∞=
−=n
nxxxs 0δ
39
Sampled function: ( ) ( ) ( ) ( ) ( )∑∞
−∞=
−==n
s nxxxfxsxfxf 0δ
x0x

Quantization
• Analog: • Digital: Infinite storage space per pixel!
∞<< ),(0 yxf
• Digital: Infinite storage space per pixel!• Quantization
40

Quantization Levels
• G - number of levels• m – storage bits
mG 2=• m – storage bits• Round each value to
its nearest level
G 2=
41

Effect of quantization
42

Effect of quantization
43

Image Size
• Storage space– Spatial resolution: N x M– Spatial resolution: N x M– Quantization: m bits per pixel– Required bits b:
• Rule of thumb:mMNb ××=
44
– More storage space means more image quality

Image Scaling
This image is too big tofit on the screen. Howfit on the screen. Howcan we reduce it?
How to generate a half-sized version?
45

Sub-sampling
1/4
1/8
46
Throw away every other row and column to create a 1/2 size image
- called image sub-sampling

Sub-sampling
47
1/4 (2x zoom) 1/8 (4x zoom)1/2

Sub-Sampling with Gaussian Pre-Filtering
48
G 1/4 G 1/8Gaussian 1/2

Compare with...
49
1/4 (2x zoom) 1/8 (4x zoom)1/2

Topic: Data structures for digital images
• Image sensors• Sampling and quantization• Sampling and quantization• Data structures for digital images• Histograms
50

Data Structures for Digital Images
• Are there other ways to represent digital images?images?
51
What we see What a computer sees

Chain codes
• Chains represent the borders of objects.borders of objects.
• Coding with chain codes.– Relative.– Assume an initial
starting point for each
Freeman Chain Code
52
starting point for each object.
• Needs segmentation!
Using a Freeman Chain Code and considering the top-left pixel of the
image as the starting point:70663422

Topological Data Structures
• Region Adjacency GraphGraph– Nodes - Regions– Arcs – Relationships
• Describes the elements of an image and their spatial
53
and their spatial relationships.
• Needs segmentation!
Region Adjacency Graph

Relational Structures
• Stores relationsbetween objects.between objects.
• Important semantic information of an image.
• Needs segmentationand an image
54
and an image description (features)!
Relational Table

Topic: Histograms
• Image sensors• Sampling and quantization• Sampling and quantization• Data structures for digital images• Histograms
55

Histograms
• In statistics, a histogram is a histogram is a graphical display of tabulated frequencies.
Typically represented as a bar chart:
56
a bar chart:

Image Histograms
• Colour or Intensity distribution.distribution.
• Typically:– Reduced number of
bins.– Normalization.
• Compressed representation of an
57
representation of an image.– No spatial information
whatsoever!

Histogram Normalization
• Improves the contrast in an image in order to stretch out the intensity range.
• The goal is to reshape the image histogram to make it flat and wide.

Color Histogram
• As many histograms as axis of the color as axis of the color space.Ex: RGB Colour space
- Red Histogram- Green Histogram- Blue Histogram
Red
Green
59
- Blue Histogram
• Combined histogram.
Blue

Resources
• J.C. Russ – Chapters 2• R. Gonzalez, and R. Woods – Chapter 2• R. Gonzalez, and R. Woods – Chapter 2
60