customizing dlmtool for canadian fisheries for web
TRANSCRIPT

Customizing DLMtool for Canadian Fisheries.
Technical report for Fisheries and Oceans Canada
Tom Carruthers 1
May 2017
1 [email protected]. 335 IOF, 2202 Main Mall, UBC Vancouver, BC, V6T 1Z4. +1 604 805-6627
v4.2v4.2v4.2v4.2

Executive summary
Deliverable 1: Customized version of DLMtool software for Canadian fisheries that includes performance
metrics consistent with the DFO Sustainable Fisheries Framework and fishery stakeholder objectives.
A total of 57 new DLMtool functions were designed and tested to address the requirements of Canadian
fisheries (the principal functions are detailed in Table 1). In addition, the fundamental structure of DLMtool
was altered to add necessary features and flexibility to accommodate Canadian stock assessments, typical
data types and common life-histories (Table 2). In total these customizations represent over 3000 lines of
computer code (which can be tracked at www.github.com/DLMtool/DLMtool). These changes are detailed
in Section 1 and greatly expand the usefulness and relevance of DLMtool for DFO applications including:
evaluation of results with respect to DFO Target and Limit Reference Points, specification of operating
models by Canadian stock assessments, rapid graphing and visualization of results and accounting for
implementation error (imperfect adherence to management recommendations, e.g. overages / underages).
These changes are all publicly available in DLMtool version 4.1 (and have been refined in outgoing version
4.2, submitted 30th May 2017) and have been downloaded by over 500 times since their release.
Deliverable 2: Provisional Limit Reference Points for a pilot set of Pacific groundfish species.
Operating models were specified and management strategy evaluations were carried out for three species
of groundfish (Arrowtooth Flounder, Canary Rockfish and Rougheye rockfish) to quantify current limit
reference points and identify management procedures that satisfy DFO performance metrics (Section 2). All
operating models are now included in the data package of DLMtool (package DLMdata) and are free to
download.
Deliverable 3: Risk-based catch advice for all pilot species.
For all three pilot species, catch advice (and input control measures) were calculated for top-ranking
management procedures (Section 3). These were compared with status quo catch levels.
Deliverable 4: Technical Report to be incorporated into a CSAS working paper documenting methods and
results.
This report is intended to address this deliverable.
Deliverable 5: Peer reviewed publication.
A peer-reviewed paper is being drafted but requires additional data to sufficiently widen the scope of the
investigation. Currently data for only three stocks have been provided. A cited risk to this project was a
failure to obtain data in a timely manner. While the methodological framework for the paper is available
the case studies are lacking. However the time allocated for developing case studies was used productively:
instead, tools were developed that allow for rapid incorporation of additional stocks into the DLMtool
framework. A series of functions were developed that automatically convert stock assessments in iSCAM
and Stock Synthesis to DLMtool operating models and data objects. This greatly increases the speed at
which new case studies can be added as their assessments are made available (for example Pacific Cod for
which the assessment is currently being finalized).

1
Table of Contents
1 Customized version of DLMtool software for Canadian fisheries that includes performance metrics
consistent with the DFO Sustainable Fisheries Framework and fishery stakeholder objectives. ........................ 4
1.1 DFO_hist - Historical simulations framed in DFO limit and target reference points ........................... 6
1.2 DFO_proj - Projected MSE results frame in DFO limit and target reference points ............................ 7
1.3 iSCAM2DLM - Stock assessments inform DLMtool operating models ................................................. 8
1.4 iSCAM2Data - Stock assessments inform DLMtool data objects ......................................................... 8
1.5 SS2DLM - Stock assessments inform DLMtool operating models ........................................................ 9
1.6 SS2Data - Stock assessments inform DLMtool data objects ................................................................ 9
1.7 StochasticSRA - Stock reduction analysis informs DLMtool operating models .................................... 9
1.8 SRAsim - Simulator for testing StochasticSRA .................................................................................... 10
1.9 SRAcomp - Simulation evaluation of StochasticSRA .......................................................................... 11
1.10 plot.OM - A detailed plot of operating model conditions .................................................................. 12
1.11 ForceCor - Impose realistic correlations among life-history parameters .......................................... 18
1.12 SubCpars - Subset custom parameters .............................................................................................. 19
1.13 COSEWIC_plot - Plot performance to inform COSEWIC evaluation ................................................... 19
1.14 Dynamic B0 - Initial biomass is uncertain .......................................................................................... 20
1.15 Blow reference - Biomass reference points for conservation performance metrics ......................... 20
1.16 Implementation error - MSE now includes imperfect adherence to management ........................... 20
1.17 Extended custom parameters – users can fully customize MSEs ...................................................... 21
1.18 Robust MSE ........................................................................................................................................ 22
2 Provisional Limit Reference Points for a pilot set of Pacific groundfish species. ........................................ 22
2.1 Arrowtooth Flounder ......................................................................................................................... 22
2.2 Canary rockfish ................................................................................................................................... 26
2.3 Rougheye rockfish .............................................................................................................................. 30
3 Risk-based catch advice for all pilot species. .............................................................................................. 34
3.1 Arrowtooth flounder .......................................................................................................................... 34
3.2 Canary rockfish ................................................................................................................................... 35
3.3 Rougheye rockfish .............................................................................................................................. 36
4 Technical Report to be incorporated into a CSAS working paper documenting methods and results. ..... 38
5 Peer reviewed publication. ......................................................................................................................... 38
6 Discussion and Conclusions ........................................................................................................................ 38
6.1 Findings .............................................................................................................................................. 38
6.2 Limitations .......................................................................................................................................... 39
6.3 Short-term future DLMtool extensions (DLMtool v4.3) ..................................................................... 39
6.4 Long-term future DLMtool extensions (Phase II project, DLMtool v4.4+) ......................................... 40
7 Acknowledgments ...................................................................................................................................... 40
8 References .................................................................................................................................................. 40
9 Annex A: proposal .......................................................................................... Error! Bookmark not defined.
10 Annex B: Eligible Costs .............................................................................. Error! Bookmark not defined.
11 Annex C: Statement of Accounts ............................................................... Error! Bookmark not defined.

2
Introduction
Adoption of ecosystem-based fisheries management (EBFM) is a high priority for management of
multispecies Canadian fisheries. In fisheries such as the BC Integrated Groundfish Fishery which encounters
100+ species, EBFM requires an understanding of the status of all impacted species and requires catch advice
consistent with DFO’s Sustainable Fisheries Framework and the Precautionary Approach. A possible
methodological framework that can address these core issues is the Data-Limited Methods toolkit (DLMtool,
Carruthers and Hordyk 2017).
The “DLMtool” software package is a computer simulation framework for rapidly evaluating fishery
management systems, including stock assessment methods, data collection protocols and biological
reference points (Carruthers et al. 2014, Harford and Carruthers 2017). The toolkit is an efficient and
customizable software package for rapid comparison of more than 100 published data-limited stock
assessment methods against a set of quantifiable management objectives (Carruthers et al. 2015).
DLMtool is a collaboration between the Natural Resources Defense Council (NRDC) and UBC that applies a
standardized process to compile available data, define management objectives, evaluate management
strategies, and implement the best available catch recommendations. In 2014, a conceptual version was
presented to experts from the U.S. National Marine Fisheries Service (NMFS), U.S. State agencies,
universities, and NGOs to determine its usefulness and refine its functionality. Since then, DLMtool has been
used for management or academic research in over 30 fisheries, including NMFS and the California
Department of Fish & Wildlife (CDFW). Through these applications, it has received a high level of scientific
peer review. See also www.datalimitedtoolkit.org. In this project, DLMtool will be tailored to fit within a
Canadian context, initially for Pacific Region Groundfish species, but potentially for other national fisheries.
DLMtool uses Management Strategy Evaluation (MSE) simulations to test candidate management procedures
(MPs), evaluate robustness and quantify value of information (Butterworth and Punt 1999, Punt et al. 2016).
MSE is a widely accepted best-practice approach for assessing performance of fishery stock assessments that
is being applied in management of several data-rich Canadian fisheries, including Pacific Hake, Pacific Herring,
Sablefish and Atlantic Cod. DLMtool is open-source software that can perform rapid MSE for the much larger
set of species that are data-limited.
The central aim of this project is to investigate DLMtool as an efficient approach for significantly increasing
capacity to deliver scientifically-defensible catch advice for Canadian fisheries. There are two broad
objectives: (1) to increase the number of Canadian case-study stocks and (2) to add features and functions
that allow DLMtool to be more broadly applied to a wide range of Canadian stocks. The first objective uses
data from the Pacific integrated groundfish fishery and biological data from DFO surveys to specify new
operating models for Canadian fisheries (e.g. Arrowtooth Flounder, Canary Rockfish, Rougheye Rockfish). The
second objective requires customization of DLMtool to include relevant performance metrics, including Limit
and Target Reference Points that are consistent with DFO’s Sustainable Fisheries Framework. These new
features are intended to ensure that management advice is compliant with the Precautionary Approach.
This project is intended to support DFO’s mandate letter for using scientific evidence in decision-making for
fish stocks and ecosystem management. The project supports DFO’s Strategic Outcome #1: Economically
Prosperous Maritime Sectors, Program 1.1: Integrated Fisheries Management, which identifies a target of
90% of fish stocks being managed within conservation limits. Progress towards this target is dependent on
scientific assessments for all encountered species, many of which are data-limited. Through provision of
scientific advice for all encountered species, the project will also improve ability of stakeholders to meet eco-
certification standards (e.g., Marine Stewardship Council) and therefore access markets required for
economic prosperity. The project supports Strategic Outcome #2: Sustainable Aquatic Ecosystems, Program
2.3: Species at Risk, through improved ability to provide scientific advice for data-limited rockfish species. The

3
project addresses the need that DFO currently lacks capacity and informative data to produce timely stock
assessment advice for its multispecies fisheries. The project will also require development of provisional Limit
Reference Points for all species examined. Identification of Limit Reference Points for all Canadian fisheries
has been identified as a high priority by the Auditor General.
This project is intended as a pilot study to investigate the potential for the DLMtool software to address a
wider range of Canadian fisheries. If successful, there is the potential for DLMtool to be applied more widely
to other Canadian fisheries (e.g. invertebrates) and other regions nationally. This provides the context for this
report and the Discussion of limitations and findings below.
This report is structured in terms of the 5 core deliverables:
Section 1. Customization of DLMtool
Section 2. Provision of Limit reference points for pilot species
Section 3. Risk-based catch advice for pilot species
Section 4. Technical report (this report)
Section 5. Peer reviewed publication
The original proposal is included in Appendix A. Appendix B includes the Statement of Account.

4
1 Customized version of DLMtool software for Canadian fisheries that
includes performance metrics consistent with the DFO Sustainable
Fisheries Framework and fishery stakeholder objectives.
A number of new DLMtool functions (Table 1) and features (Table 2) were developed and tested to maximise
applicability to Canadian fisheries. In addition to the performance metrics of this deliverable these new
functions and features allow for rapid operating model construction from stock assessments, greater
transparency of the operating model conditions, modelling of implementation error, calculation of
conservation reference points, and greater flexibility for MSE configuration. In total these changes represent
over 55 new DLMtool functions and 3000 lines of code (these submissions can be tracked at the public
GitHub code repository: www.github.com/DLMtool/DLMtool where users can also post requests and bug
reports).
Table 1. Summary of new DLMtool functions that were developed to maximize applicability to Canadian fisheries
Function Description
DFO_hist A plot returning historical simulations relative to DFO target and limit reference points (e.g.
Figure 1)
DFO_proj An MSE projection plot providing both
iSCAM2DLM iSCAM (Martell et al. 2011)stock assessments can be used to populate DLMtool operating
models for MSE testing of MPs
iSCAM2Data
iSCAM stock assessments can be used to population DLMtool data objects for calculation of
management recommendations using MPs (and related function e.g. iSCAMinds and
iSCAMcomps)
SS2DLM Stock Synthesis 3 (Methot and Wetzel 2013) stock assessments can be used to population
DLMtool operating models for MSE testing of MPs
SS2Data Stock Synthesis 3 stock assessments can be used to population DLMtool data objects for
calculation of management recommendations using MPs
StochasticSRA
A custom written MCMC stock reduction analysis is used to reconstruct historical trajectories
of stock trends and exploitation rate given complete historical catch data and a current catch-
at-age sample.
SRAsim
For any DLMtool operating model, SRA data can be simulated to validate that StochasticSRA is
an appropriate method and should provide unbiased historical stock and fleet
reconstructions.
SRAcomp Graphing tools for summarizing the simulation evaluation of StochasticSRA
plot.OM A detailed plot of the conditions of the operating model
ForceCor Force correlations among sampled parameters in the operating model including natural
mortality rate, growth rate, length at maturity and maximum length.
SubCpars A function for sub setting custom parameters (e.g. for rejecting some of the simulated
operating models created by StochasticSRA based on depletion)
COSEWIC_plot A forward projection of status quo management, MSY management and zero catch
management to evaluate current status with respect to conservation reference points.
5
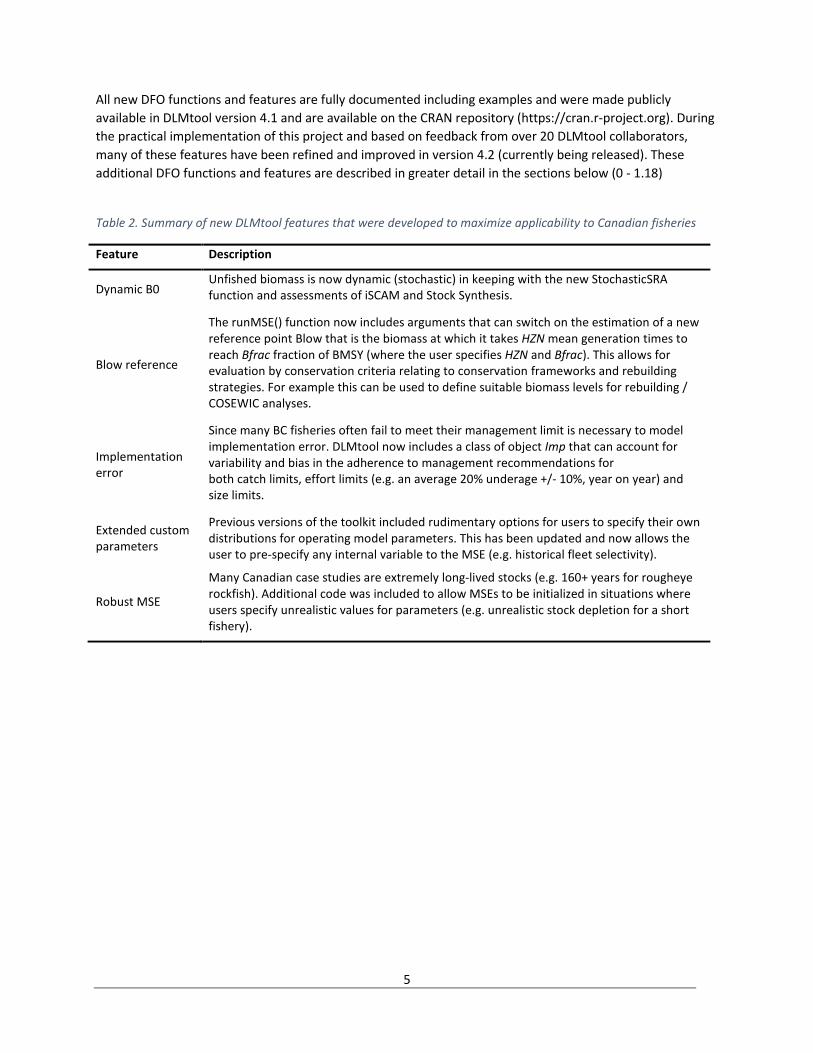
All new DFO functions and features are fully documented including examples and were made publicly
available in DLMtool version 4.1 and are available on the CRAN repository (https://cran.r-project.org). During
the practical implementation of this project and based on feedback from over 20 DLMtool collaborators,
many of these features have been refined and improved in version 4.2 (currently being released). These
additional DFO functions and features are described in greater detail in the sections below (0 - 1.18)
Table 2. Summary of new DLMtool features that were developed to maximize applicability to Canadian fisheries
Feature Description
Dynamic B0 Unfished biomass is now dynamic (stochastic) in keeping with the new StochasticSRA
function and assessments of iSCAM and Stock Synthesis.
Blow reference
The runMSE() function now includes arguments that can switch on the estimation of a new
reference point Blow that is the biomass at which it takes HZN mean generation times to
reach Bfrac fraction of BMSY (where the user specifies HZN and Bfrac). This allows for
evaluation by conservation criteria relating to conservation frameworks and rebuilding
strategies. For example this can be used to define suitable biomass levels for rebuilding /
COSEWIC analyses.
Implementation
error
Since many BC fisheries often fail to meet their management limit is necessary to model
implementation error. DLMtool now includes a class of object Imp that can account for
variability and bias in the adherence to management recommendations for
both catch limits, effort limits (e.g. an average 20% underage +/- 10%, year on year) and
size limits.
Extended custom
parameters
Previous versions of the toolkit included rudimentary options for users to specify their own
distributions for operating model parameters. This has been updated and now allows the
user to pre-specify any internal variable to the MSE (e.g. historical fleet selectivity).
Robust MSE
Many Canadian case studies are extremely long-lived stocks (e.g. 160+ years for rougheye
rockfish). Additional code was included to allow MSEs to be initialized in situations where
users specify unrealistic values for parameters (e.g. unrealistic stock depletion for a short
fishery).

6
1.1 DFO_hist - Historical simulations framed in DFO limit and target reference points
Given the DFO biomass Limit Reference Point of 40% BMSY and Target Reference Point of 80% BMSY, and an
overfishing threshold of F/FMSY = 1, a series of custom DFO plots was designed. The first is DFO_hist that
describes what happened in historical simulations (Figure 1). This provides an intuitive description of the
simulated conditions before testing of management procedures under projection using MSE.
Figure 1. Historical simulations with respect to DFO limit and target reference points, DFO_hist. The left-hand panel
shows the current (most recent year) distribution of simulated fisheries in the space of the DFO limit and target
reference points. For each of the six sectors a percentage score is returned that represents the fraction of
simulations in each sector. The right-hand plot shows the transition from the unfished stock (crosses) to the current
fishery (points) including both the mean (black line and points) and two simulations (red and blue lines).

7
1.2 DFO_proj - Projected MSE results frame in DFO limit and target reference points
Similarly to DFO_hist, the function DFO_proj produces similar outputs to but provides these over the
projected years of the MSE for each MP (Figure 2).
Figure 2. Projected simulations subject to various MPs, DFO_proj(). As Figure 1 but for projected years. Each row
represents the projection for an individual MP.

8
1.3 iSCAM2DLM - Stock assessments inform DLMtool operating models
Operating models can take a long time to specify as they include over 95 separate slots (e.g. natural mortality
rate, historical fishing effort trajectory etc.). For a number of DFO stocks however, data-rich assessments
have been undertaken that serve as a peer-reviewed foundation for constructing operating models. Rather
than go through each slot and manually enter the correct values from the assessment, a more efficient
solution is to design a function that automatically creates a DLMtool operating model from the standardized
outputs of a stock assessment.
Once developed, such an approach can be rapidly applied to new Canadian stocks. A related opportunity is
that patterns in historical fishing can be borrowed from data-rich stocks to inform data-limited stocks (a
Robin Hood approach, Punt et al. 2011).
iSCAM2DLM is one of two new functions that can specify an operating model based on the output / input
files of an iSCAM stock assessment (Martell et al. 2011). The function is very concise and requires a single line
of code (Figure 3). The approach relies on code produced by Chris Grandin (DFO PBS)
Figure 3. Example usage of iSCAM2DLM. Based on just a directory where an assessment is stored ‘iSCAMdir’, the
function constructs a fully specified operating model from which an MSE can be run.
1.4 iSCAM2Data - Stock assessments inform DLMtool data objects
Similarly to iSCAM2DLM, an iSCAM stock assessment files can be used to populate a DLMtool Data object
that is used for calculating real management recommendations.

9
1.5 SS2DLM - Stock assessments inform DLMtool operating models
Stocks such as Pacific hake are subject to assessment by both Canadian and US governments. Additionally
several other transboundary stocks such as Halibut and rockfish also have US stock assessments. The most
commonly applied software for assessing US fisheries is Stock Synthesis 3 (Methot and Wetzel 2013). In
many cases it may be desirable to use a US assessment or borrow part of the assessment to specify an
operating model for a Canadian stock. SS2DLM is similar to iSCAM2DLM but uses the outputs of a data-rich
SS3 assessment.
Figure 4. Example usage of SS2DLM. Based on a directory where an SS3 assessment is stored ‘SSdir’, the function
constructs a fully specified operating model from which an MSE can be run. In this case, fewer messages are
reported by setting the argument verbose = F.
1.6 SS2Data - Stock assessments inform DLMtool data objects
Similarly to iSCAM2Data, SS2Data uses the outputs of the SS3 model to automatically create a DLMtool Data
object that can be used to calculate real management recommendations using DLMtool (e.g. a TAC, TAE or
size limit).
1.7 StochasticSRA - Stock reduction analysis informs DLMtool operating models
In many data-limited settings only a full series of historical annual catches may be available. In situations
where catch composition data (e.g. an age or length sample) can be collected today, or are available in
historical years, stochastic stock reduction analysis (Walters et al. 2007) may be used to construct various
historical patterns in fishing mortality rate and stock biomass. A custom MCMC version of this approach was
designed for DFO fisheries that estimates unfished stock size, historical recruitment deviations and logistic
selectivity (Figure 5).

10
Figure 5. The outputs of the StochasticSRA function for Rougheye Rockfish including trends in stock biomass,
depletion, fishing mortality rate, selectivity, recruitment strength and predicted age composition. The left-hand
panels are individuals samples, the right hand plots are all posterior samples. The dark grey shaded region is the
50% probability interval. The light grey shaded region is the 95% probability interval.
1.8 SRAsim - Simulator for testing StochasticSRA
There may be life history and fishery dynamics that Stochastic SRA is not suitable for. A good example is a
rapidly depleted stock that has held its current stock size for many years. In such situations stock reduction
analyses can often provide an overestimate of current stock depletion (an overly optimistic view of stock
status). Similarly, very short lived species that have high recruitment variability may not lead to a strong
connection between stock depletion and current catch composition, again making these unsuitable for
Stochastic SRA. A stock and fishery dynamics simulator SRAsim, was developed that uses a DLMtool operating
model to generate example catch and catch composition data to examine potential biases in the
StochasticSRA estimator (Figure 6).

11
Figure 6. A simulated time series of abundance, fisheries exploitation, selectivity, recruitment and catch
composition observations for testing of the StochasticSRA function.
1.9 SRAcomp - Simulation evaluation of StochasticSRA
In order to rapidly evaluate the suitability of the StochasticSRA function for a given life-history and fleet type,
a comparison plot was included called SRAcomp. This plots the true simulated values (solid black line of
Figure 7) against the posterior estimates of the StochasticSRA function.

12
Figure 7. A comparison plot of simulation (solid block line) and posterior estimates of the StochasticSRA function.
The left hand panels show individual simulations, the right hand panels show posterior estimates. The white line is
the median, the dark and light grey regions are the 50th and 95th probability intervals, respectively.
1.10 plot.OM - A detailed plot of operating model conditions
Following feedback from TESA members at the TESA ecosystems approach workshop meeting (21-25 Nov
2016, Nanaimo) a much more detailed series of plots have been produced to graph the various properties of
the operating models (Figures 8-12). These allow users to validate reading from stock assessments and
rapidly visualize the conditions of new operating models.
An added benefit of these graphing routines is that they identify all of the various slots in an operating model
and therefore provide a more intuitive account of operating model specification.

13
Figure 8. Standard plotting output for DLMtool operating model Stock objects (This code was produced in
collaboration with Adrian Hordyk with in kind support from NRDC)

14
Figure 9. Standard plotting output for DLMtool operating model Obs objects. These are the observation model
properties that control the quality of simulated data (non time-series data) (This code was produced in
collaboration with Adrian Hordyk with in kind support from NRDC)
15
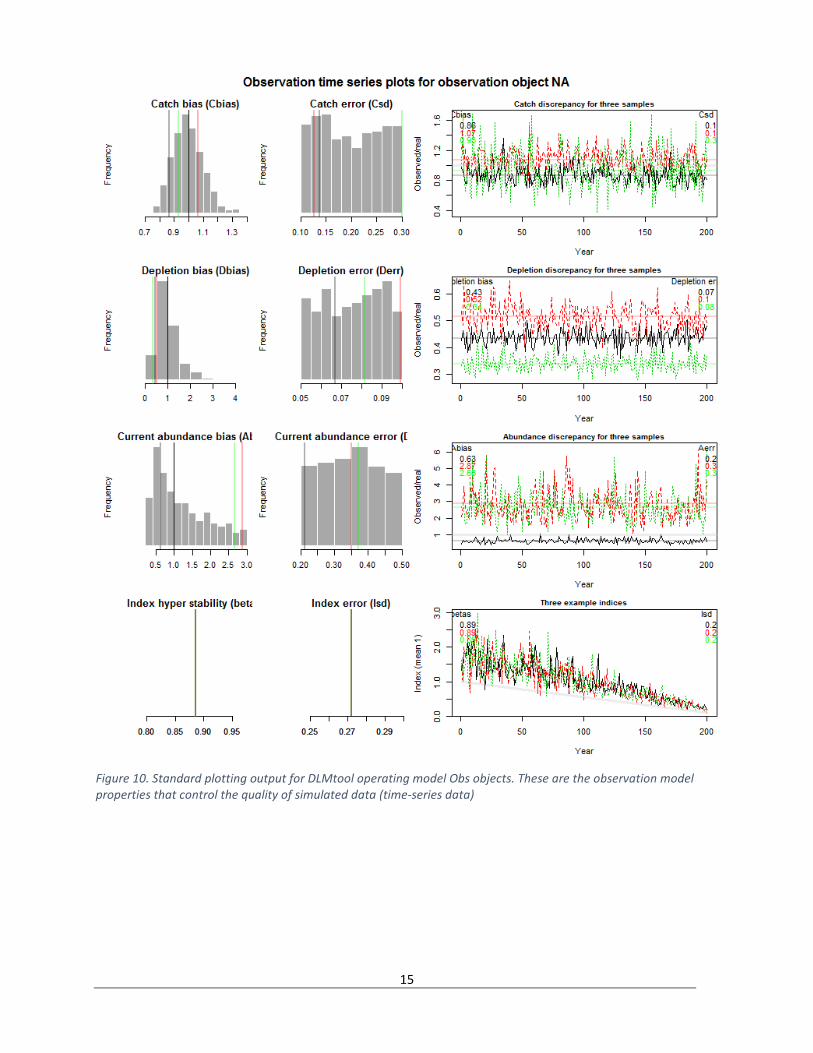
Figure 10. Standard plotting output for DLMtool operating model Obs objects. These are the observation model
properties that control the quality of simulated data (time-series data)

16
Figure 11. Standard plotting output for DLMtool operating model Imp objects. These are the implementation model
properties that control overages / underages in TACs, TAE (effort limit)

17
Figure 12. Standard plotting output for operating models showing time series of biomass, depletion, catches
recruitment and selectivity.

18
1.11 ForceCor - Impose realistic correlations among life-history parameters
There are reasons to expect parameter cross correlation among various life-history characteristics. Following
feedback from TESA members at the TESA ecosystems approach workshop meeting (21-25 Nov 2016,
Nanaimo) a function ForceCor, was included in DLMtool to sample correlated parameter values rather than
assuming uncorrelated uniform random variables, for each of the following parameters: natural mortality
rate (M), growth rate (K), length at 50% maturity (L50) and maximum length (Linf).
Figure 13. The results of ForceCor; a function that preserves correlation among life-history parameters (simulations
are the black dots) rather than the simple uniform random variable (purple squares and vertical lines).

19
1.12 SubCpars - Subset custom parameters
The addition of custom parameters to operating models provides a large degree of flexibility, for example
allowing users to link DLMtool with tailored stock assessments. However there may be a need to subset
these simulations in situations where they are not deemed credible. For example it may be desirable to
remove all simulations where stock depletion dropped to less than 1% depletion. In such a scenario the
function SubCpars provides the necessary tools to strip an operating model down to certain simulations.
1.13 COSEWIC_plot - Plot performance to inform COSEWIC evaluation
A conservation projection plot COSEWIC_plot was developed to frame historical stock status and future stock
status in terms of zero fishing, fishing at FMSY and fishing at the current exploitation rate (Figure 14). The
diagnostic plot provides probabilities of the stock declining below a low reference biomass level Blow which
is considerate of life history and defined by the user (see Section 1.15 below)
Figure 14. A projection plot using COSEWIC_plot() comparing the probability of biomass dropping below the Blow
reference point over a 50 year projection. In this example, Blow is the biomass level that takes 2 mean generation
times to reach 50% BMSY given zero catches.

20
1.14 Dynamic B0 - Initial biomass is uncertain
In order to accurately represent stock assessments in a DLMtool operating model it is necessary for stock
dynamics to be below mean unfished stock levels before the first historical year of catch. This reflects the
situation in many fish stocks where, due to variable recruitment strength, unfished biomass can fluctuate
widely and can be substantially lower or higher than mean unfished levels in any given year prior to the
development of the fishery.
To achieve this the central population dynamics model of DLMtool was overhauled to include recruitment
strength prior to the initial historical year.
1.15 Blow reference - Biomass reference points for conservation performance metrics
When considering the conservation status of a fishery it may be helpful to develop working definitions for
concepts such as ‘extinction’ and ‘recovery’. An option now exists in DLMtool to calculate a low biomass
reference point Blow, which is the biomass it take a stock HZN mean generation times to reach Bfrac fraction
of BMSY given zero fishing. The default setting is HZN = 2 and Bfrac = 0.5 (Blow is the biomass where it takes
2 mean generation times to recover to half of BMSY given zero catches). The benefit of such a reference
point is that it is considerate of biology and accounts for longevity, recruitment variability and stock resilience
(recruitment compensation rate, steepness).
1.16 Implementation error - MSE now includes imperfect adherence to management
A significant extension of DLMtool for Canadian purposes is the addition of the implementation error class
object Imp. This addition radically overhauls the operating model definition and the internal working of the
MSE. Operating models are now constructed from four objects: Stock, Fleet, Obs and Imp, and include slots to
specify uncertainty and biases in the adherence to management recommendations. This allows overages and
underages in TAC and TAE to be simulated. Also included are disparities in size limits and the length
vulnerability of the stock. Although basic in this initial form, the implementation error class object paves the
way for more complex implementation models which include post-release mortality, high grading and bio-
economic models that control exploitation as catch rates decline below profitable levels.
Similarly to Stock, Fleet and Obs objects, the Imp object can be saved in, and created from a .csv file.

21
Figure 15. The contents of the Imp class object. TACFrac is the average fraction of the TAC that is taken. TACSD is
the inter-annual variability in take (lognormal St.Dev.). Similarly to TACFrac, EFrac is the average fraction of the TAE
that is taken and ESD is the inter-annual variability in effort around this fraction (lognormal St.Dev.). In this
example an average of 80%-90% of the recommended TAC and TAE are taken. In reality this varies with a CV of
between 5% and 20% among years.
1.17 Extended custom parameters – users can fully customize MSEs
In order to maximize the flexibility of DLMtool so that it may be applied in as many Canadian fisheries as
possible, the MSE framework was overhauled to allow all internal parameters of the MSE function to be
overridden by the user. For most parameters (e.g. natural mortality rate M), by default the operating model
contains a lower and upper bound which is assumed to represent the bounds of a uniform random variable
(Figure 16).
Figure 16. Simple bounds on the operating model parameter slot for natural mortality rate, M.
It follows that in each MSE replicate simulations are drawn from this random uniform variable. However the
user may want to assume another distribution or specify correlation among sampled parameter values. To do
this they use the @cpars slot of the operating model (Figure 17).

22
Figure 17. Example of a custom parameter @cpars specification. The 48 user-specified values for natural mortality
rate will now be used in the MSE function rather than the bounds.
The @cpars slot can contain any user-specified sample of parameters, they may be correlated and can
include time series of recruitment, growth, vulnerability and fishing mortality rate.
1.18 Robust MSE
Additional checks and error tests were incorporated into the runMSE function to allow MSEs to be run for
atypical life history types for which users are more likely to specify unrealistic bounds on parameters. This
was necessary to allow for rougheye rockfish population dynamics which include a maximum age of 164
years.
2 Provisional Limit Reference Points for a pilot set of Pacific groundfish
species.
2.1 Arrowtooth Flounder
Based closely on the iSCAM stock assessment, the Arrowtooth Flounder operating models describe a stock
that is at around 50-70% of unfished levels, a biomass well above BMSY and commensurate with historical
underfishing (Figure 18).
Figure 18. Historical operating model trajectories for biomass and depletion (year 50 is 2014).

23
Since the assessment predicts a stock that is currently in a healthy state, a relatively large number of
prospective management procedures can be considered for management, many of which would not be well
suited to a scenario where rebuilding was required (Figure 19 and Figure 20). For example, DCAC (MacCall
2009) performs similarly to DD_es (delay difference model providing TAE recommendations) achieving both
high probability of being above 50% BMSY (~ 93%) and over 85% of FMSY yields (Figure 20). Where
recovering is required these MPs diverge strongly since DCAC is an average catch MP that will follow the
same historical levels of exploitation. Even using a static approach such as average historical catches AvC,
(B50 = 90, LTY = 83, Figure 20) performs well in MSE.
Figure 19. DFO trade-off plot (‘DFO_plot’) for Arrowtooth flounder. Plotted are the mean biomass relative to BMSY
(B/BMSY) and Fishing mortality rate relative to FMSY (F/FMSY) for 74 MPs included in DLMtool. Note that these
metrics are calculated over the last 5 years (46-50) of the projection and relate to longer term expected
performance.

24
Figure 20. DFO performance plot (‘DFO_plot2’) for Arrowtooth flounder. Note that the biomass and yield cut-offs were increased to 80% for clarity.

25
Figure 21. Projection plots for Arrowtooth flounder showing 3 high ranking MPs at the end point of the projections
relative to DFO limit and target reference points. GB_target is an index target MP designed to achieve stable
indices of relative abundance. DDes is a stablilized delay-difference assessment that prescribes effort limits up to a
maximim 10% change among updates. Fadapt is an adaptive fishing rate MP that aims to maximize surplus
production by making adjustments to the fishing mortality rate.

26
2.2 Canary rockfish
Unlike Arrowtooth Flounder, Canary Rockfish operating models describe a stock that is more heavily
exploited and is currently likely to be at lower levels relative to MSY reference points (depletion in the range
of 0.05 – 0.45, 95% PI). It follows that MSE is more discriminatory and favours a smaller subset of prospective
management procedures (Figure 23 and Figure 24).
In general, simple stock assessments performed well for Canary rockfish particularly those based on the
delay-difference equations (DD, DDe, DD4010) (Figure 25). There was no particular performance advantage
of either input or output controls.
Figure 22. Historical simulations of the Canary rockfish operating model (Historical year 68 is 2006).

27
Figure 23. DFO trade-off plot for Canary rockfish MSE. Plotted are the mean biomass relative to BMSY (B/BMSY)
and Fishing mortality rate relative to FMSY (F/FMSY) for 74 MPs included in DLMtool. Note that these metrics are
calculated over the last 5 years (46-50) of the projection and relate to longer term expected performance.

28
Figure 24. DFO performance plot (‘DFO_plot2’) for BC canary rockfish.

29
Figure 25. Projection plots for Canary Rockfish showing 3 high ranking MPs at the end point of the projections
relative to DFO limit and target reference points. All three MPs are deterministic delay-difference (DD) assessments
that made effort limit recommendations (DDe) or incorporate a 40-10 harvest control rule (DD4010).

30
2.3 Rougheye rockfish
Similarly to Canary rockfish, simple assessments such as delay-difference MPs, could satisfy both Target Limit
Points (Figure 27) and other performance metrics relating to yield (Figure 28).
The similarity in selected MPs among the rockfish pilot species suggests that the initial level of stock
depletion (which was relative under exploited for Rougheye compared with Canary Rockfish) may not
relevant to longer-lived species such as rockfishes and general recommendations about suitable the suitable
class of MP may be available.
Figure 26. Historical simulations of the Rougheye Rockfish operating model (Historical year 68 is 2006).

31
Figure 27. DFO trade-off plot for Rougheye Rockfish MSE. Plotted are the mean biomass relative to BMSY (B/BMSY)
and Fishing mortality rate relative to FMSY (F/FMSY) for 74 MPs included in DLMtool. Note that these metrics are
calculated over the last 5 years (46-50) of the projection and relate to longer term expected performance.

32
Figure 28. DFO performance plot (‘DFO_plot2’) for BC Rougheye Rockfish.

33
Figure 29. Projection plots for Rougheye Rockfish showing 3 high ranking MPs at the end point of the projections
relative to DFO limit and target reference points. The MPs DDe and DDe75 are effort control versions of the delay-
difference MP. SBT2 is the Southern Bluefin Tuna MP that uses a recruitment index and a spawning biomass index
to adjust TACs.

34
3 Risk-based catch advice for all pilot species.
3.1 Arrowtooth flounder
Since MPs were selected based on their long-term performance (over the final 5 years of projections) it is not
surprising to see very strong divergence in TAC recommendation over the short-term as some MPs aim to
rapidly ‘fish down’ the underexploited Arrowtooth Flounder stock. For example Fadapt aims to take a fixed
fraction of the available biomass that is adjusted depending on depletion level. In this case Arrowtooth
Flounder is not strongly depleted and Fadapt takes a large fraction of the available stock (~260,000t).
GB_target on the other hand takes a fraction of previous catches and is limited to small changes in TAC (i.e. it
is forced to be close to the vertical dashed line of Figure 30). This provides a good example of how MPs can
diverge in the short-term but provide similar long-term expected performance.
Figure 30. Arrowtooth TAC calculation for four high-ranking output control MPs. Boxes represent interquartile
ranges, whiskers represent 95th percentiles, black solid bar is the median TAC recommendation. The vertical blue
dashed line is the most recent catch of 10 679 tonnes. Note that since Arrowtooth is believed to be significantly
underexploited TAC MPs vary to a large extent in the short term, some opting to fish relatively hard (e.g. Fadapt)
others ramping up the TAC slowly (e.g. GB_target). Fadapt is an adaptive fishing rate MP that modifies exploitation
rate to maximise surplus production.
Input control MPs universally aim to increase fishing effort where possible up to the maximum allowed by
their specific control rules (Figure 31). In general, the risk-based advice for Arrowtooth Flounder reflects the
simulated conditions of the operating model: a currently underexploited stock subject to pronounced
underfishing.

35
Figure 31. DLMtool input control advice for Arrowtooth data. Note that DDes (stable effort MP) recommends a 10%
increase in fishing effort. Unlimited, the delay-difference MP DDe, recommends a very large increase in fishing
effort of over 815%. SL50 and SL95 refer to prescribed size limits that are the lengths at 50% and 95% selectivity.
Upper limit refers to a knife-edge maximum size limit (length).
3.2 Canary rockfish
In contrast to the Arrowtooth flounder case study, the Canary Rockfish TAC and effort advice is more
consistent among MPs and generally in favour of reductions. The five high-ranking output control MPs all
recommend reductions in TAC of between 30% and 80% (median TAC recommendation, Figure 32)
Figure 32. Canary Rockfish TAC calculation for five high-ranking output control MPs. Boxes represent interquartile
ranges, whiskers represent 95th percentiles, black solid bar is the median TAC recommendation. The vertical blue
dashed line is the 2006 catch of 779 tonnes. Itarget1 is an index target approach that incrementally modifies TAC to
stabilize a relative abundance index. Itarget4 is similar but more aggressive, generally favouring higher exploitation
rates. DAAC is depletion adjusted average catch, which is DCAC but with a linear harvest control rule that throttles
DCAC with depletion. DD is a standard deterministic delay-difference stock assessment. DD4010 is a delay
difference stock assessment coupled with a 40-10 harvest control rule.

36
Input control MPs are more punitive in their recommended reductions, for example the delay-difference MP
DDe suggests current effort at a tiny fraction of current levels while the input control MPs that include
maximum rates of change all bottom-out at their lowest possible reduction (e.g. 85% of current effort for
index target MP ItargetE1) (Figure 33).
Figure 33. DLMtool input control advice for Canary rockfish data. Note most input controls that vary effort call for
either a strong reduction (delay difference MPs DDe and DDe75) or the maximum reduction (e.g. DTe40 and
DTe50). SL50 and SL95 refer to prescribed size limits that are the lengths at 50% and 95% selectivity. Upper limit
refers to a knife-edge maximum size limit (length).
3.3 Rougheye rockfish
Similarly to Arrowtooth Flounder, the TAC recommendations for Rougheye Rockfish varied strongly among
MPs principally because the operating models simulate an underexploited stock and the MPs have varying
restrictions on how fast TACs can change among years. The delay-difference assessment DD, is unconstrained
and recommends a median TAC that is 300% of current catches while the IT10 MP can only recommend a
maximum increase of 10% among years (Figure 34).
Figure 34. Rougheye Rockfish TAC calculation for three high-ranking output control MPs. Boxes represent inter
quartile ranges, whiskers represent 95th percentiles, black solid bar is the median TAC recommendation. The vertical
blue dashed line is the 2006 catch of 779 tonnes.IT10 is an index target MP that aims for a relative abundance
index near MSY using up to 10% changes in the TAC.

37
Interestingly, stable index MPs such as ItargetE1, struggle to interpret the current versus historical index
trends and erroneously recommend decreases in fishing effort (Figure 35). This can be attributed to recent
increases in the relative abundance indices, a pattern that cannot be dealt with by the stable index MPs,
explaining their failure to meet performance metrics in the simulations.
Index target MPs such as ITe10 and ITe5 both recommend increases in effort up to the maximum permitted
due to use of an index target level that is decoupled from recent trends.
Figure 35. DLMtool input control advice for Rougheye rockfish data. Input controls that met the performance
criteria call for increases in effort (e.g. index target MPs ITe5 and ITe10) while those that did not call for decreased
effort (e.g. ItargetE1). SL50 and SL95 refer to prescribed size limits that are the lengths at 50% and 95% selectivity.
Upper limit refers to a knife-edge maximum size limit (length).

38
4 Technical Report to be incorporated into a CSAS working paper
documenting methods and results.
The intention of this report is to meet the requirements of this deliverable.
5 Peer reviewed publication.
The methodological framework developed in this project provides a compelling backdrop to a peer-reviewed
paper “Using operating models to test management strategies in a complex multispecies fishery”. The paper
includes numerous related threads including species prioritization, appropriate investment in data collection
among species, establishing suitable stock assessment complexity and developing multispecies performance
metrics that reflect both biological, fishery and management trade-offs. This paper considers operating
models in the broadest sense: as transparent working models for informing management decisions where
resources are limited. The research can inform the design of tiered approaches to fisheries management and
represents a relevant contribution to the emerging literature on how MSE can guide management decision
making.
At a minimum the paper requires at 8 case studies in order to produce results that can be generalized to
other fisheries. Unfortunately a stated risk to this project occurred: insufficient data were provided by DFO to
conduct such an analysis. In the interim, various functions were developed that make including additional
case studies much easier, such as the functions for automatically reading stock assessments into DLMtool.
The paper is being drafted and its publication is a priority and will be pursued as data and case studies
become available.
6 Discussion and Conclusions
6.1 Findings
- Stock assessments and data can be rapidly incorporated into the simulation framework using
automatic functions
- Fisheries can be evaluated with respect to DFO performance metrics relating to Target and Limit
Reference Points.
- Long lived species such as Rockfish may be suitably managed by simple assessments (e.g. delay
difference assessment models) and that the success of this approach may not be strongly dependent
on current stock depletion (similar results for Canary and Rougheye Rockfishes)
- There can be dramatic divergence in short-term management advice among MPs in situations where
stocks are underexploited and MPs have varying restrictions on the maximum rate of change in
recommendations among years
- Performance metrics (e.g. based on yield) can provide additional discrimination among MPs if a large
number satisfy the requirements of the DFO Target and Limit Reference Points.
- Stable index based MPs (e.g. ItargetE1) may not be suitable for stocks that have increased in relative
abundance over the period where catch data are available.
- Releasing software publicly has resulted in feedback, improvements and debugging from a much
wider range fisheries scientists

39
6.2 Limitations
A core concern relating to the risk-based advice in this report has been raised in other DLMtool applications
such as the NMFS data-limited assessment processes in the Caribbean (SEDAR 46) and Gulf of Mexico (SEDAR
49). The concern is that the management advice is still calculated from data that requires similar quality of
review as a conventional stock assessment. In this report, operating models were specified and data
converted to DLMtool format without peer-review. It follows that the TAC and TAE advice included in this
report should be seen as demonstrative and preliminary (I am no expert in the collection, interpretation of
data for BC ground fisheries). Arrowtooth Flounder provides an example. The assessment includes four
relative abundance indices. Since no DLMtool MP currently uses more than a single spawning abundance
index, these real data had to be combined into a single index. I achieved this by developing a new DLMtool
function that uses generalized linear modelling to combine multiple indices. This however is ad-hoc and
again, not subject to a suitable level of peer review.
The current iSCAM2DLM function does not find unfished recruitment deviations that allow for an increasing
stock trend since the mid-1900s (I simply could not find these outputs in the standard files reported by iSCAM
if indeed they exist). This limitation should be addressed in the next revision of the package (v4.3).
The DFO performance metrics that are frame in terms of the Target and Limit Reference Points may not
provide suitable contrast among MPs to satisfactorily select a single MP. DFO should consider either a 1
variable synthesis metric or additional performance metrics to help in MP selection. In this report I adopt a
convention first used by NMFS in the Caribbean (e.g. fraction of simulations obtaining yield over half FMSY
yield) but this is ad-hoc and has not been approved by DFO.
It was difficult to properly evaluate the consequence of status-quo management in the MSEs since
representative data-rich MPs (e.g. a statistical catch-at-age assessment such as iSCAM) are currently not
included in DLMtool. A priority is to develop rapid data-rich assessments to provide more realistic status quo
yard stick for comparison with simpler MPs.
6.3 Short-term future DLMtool extensions (DLMtool v4.3)
The work in this project points to a number of important but attainable short-term additions to DLMtool:
- The iSCAM2DLM functions should be expanded to incorporate the correlated outputs of MCMC
samples where available
- At least 5 more Canadian case studies
- Convert all applicable MPs to a generic standard that has parameters that determine harvest control
rules and maximum change in TAC among years. For example, rather than needed several MPs that
all allow for varying change in TAC among years, a single applicable rate can be specified that is
adhered to by all MPs in the MSE.
- Proper accounting for discard rate and post release mortality to model size limits more realistically
- An ‘assessment mode’ for all MPs that are fitted to data which includes diagnostics of model fit,
retrospective bias, projections and sensitivity analyses.

40
6.4 Long-term future DLMtool extensions (Phase II project, DLMtool v4.4+)
As part of a second DFO proposal 2017-2020, a number of large and significant extensions have been
identified that would greatly expand the usefulness of DLMtool for Canadian fisheries:
- Additional data-rich stock assessments to identify when additional complexity of assessments is
necessary and the circumstances where costs can be reduced by using more simplistic approaches.
- Accounting for climate change impacts by allowing for changes in growth, mortality, condition factor
and recruitment in order to identify management options that are robust to these uncertainties.
- Multispecies operating models to allow mixed stock management strategies to be evaluated (e.g.,
east and west coast groundfish fisheries)
- Multiple fleet operating models to allow evaluation of fishery management systems that adjust
allocation among fishery types
- Fine-scale spatial models for the evaluation of time-area closures that may provide a powerful tool in
the protection of “choke” species (i.e., low quota species in multispecies fisheries), while allowing
sustainable exploitation of other stocks.
- Parsimonious ecosystem models based on the concept of Models of Intermediate Complexity (MICE)
for identifying indicators, management systems and data collection programs that are robust to
potential shifts in marine community structure in response to changes in ecosystem conditions.
- Simulating alternative options for data collection supporting value-of-information analysis to identify
those types of data that are likely to lead to the greatest improvement in management performance,
and those that could be used as triggers that a new assessment is necessary.
7 Acknowledgments
Many thanks to Robyn Forrest and Greg Workman for providing data and guidance on DFO performance
metrics. Thanks also to Chris Grandin for sharing code to extract data and model estimates from iSCAM
assessments which paved the way for the iSCAM2DLM and iSCAM2Data functions.
8 References
Butterworth, D.S., Punt, A.E., 1999. Experiences in the evaluation and implementation of management
procedures. ICES J. Mar. Sci. J. Cons. 56,985–998, http://dx.doi.org/10.1006/jmsc.1999.0532.
Carruthers, T.R., Hordyk, A.R., 2017. DLMtool: data-limited methods toolkit. Version 4.1 Available at:
https://cran.r-project.org/web/packages/DLMtool/index.html.
Carruthers, T.R., Kell, L.T., Butterworth, D.D.S., Maunder, M.N., Geromont, H.F., Walters, C., McAllister, M.K.,
Hillary, R., Levontin, P., Kitakado, T., Davies, C.R.,2015. Performance review of simple management
procedures. ICES J. Mar. Sci.J. Cons., http://dx.doi.org/10.1093/icesjms/fsv212.
Harford, W.J., Carruthers, T.R. 2017. Interim and long-term performance of static and adaptive management
procedures. Fish. Res. 190: 84-94.
MacCall, A.D., 2009. Depletion-corrected average catch: a simple formula for estimating sustainable yields in
data-poor situations. ICES J. Mar. Sci. J. Cons.66, 2267–2271, http://dx.doi.org/10.1093/icesjms/fsp209.

41
Martell, S.J.D., Schweigert, J.F., Haist, V., Cleary, J.S. 2011. Moving towards the sustainable fisheries
framework for Pacific herring: data, models, and alternative assumptions; Stock Assessment and
Management Advice for the British Columbia Pacific Herring Stocks: 2011 Assessment and 2012
Forecasts. Research Document 2011/136.
Methot, R.D. and Wetzel, C.R. 2013. Stock synthesis: a biological and statistical framework for fish stock
assessment and fishery management. Fish. Res. 142: 86-99.
Punt, A.E., Butterworth, D.S., de Moor, C.L., De Oliveira, J.A.A., Haddon, M., 2016.Management strategy
evaluation: best practices. Fish. Fish. 17, 303–334, http://dx.doi.org/10.1111/faf.12104.
Punt, A.E., Smith, D.C., and Smith, A.D.M. 2011. Among-stock comparisons for improving stock assessments
of data-poor stocks: the “Robin Hood” approach. ICES J. Mar. Sci. J. Cons. 68(5): 972–981.
doi:10.1093/icesjms/fsr039.
SEDAR 46. 2016. South East Data, Assessment and Review. NOAA South-East. San Juan, Puerto Rico.
November 2-5, 2015. Available at: http://sedarweb.org/sedar-46 [accessed April 2017]
SEDAR 49. 2016. South East Data, Assessment and Review. NOAA South-East. New Orleans. May 2-6, 2016.
Available at: http://sedarweb.org/sedar-49 [accessed April 2017]
Walters, C.J., Martell, S.J.D., Korman, J. 2006. A stochastic approach to stock reduction analysis. Can. J. Fish.
Aqua. Sci. 63: 212-223.