customization of starfish technology in the production of cotton-knit fabrics
TRANSCRIPT

International Journal of Engineering & Technology IJET-IJENS Vol: 11 No: 01 125
117801-6464 IJET-IJENS © February 2011 IJENS
I J E N S
Customization of Starfish Technology in
the Production of Cotton-Knit Fabrics: A Practical Approach
A.K.M. Mobarok Hossain1, Dr.A.B.M. Zohrul Kabir
2
1 Assistant Professor, Department of Textile Technology, Ahsanullah University of
Science and Technology, Dhaka, Bangladesh 2 Professor,Islamic University of Technology,Gazipur,Bangladesh
Abstract-- Demands for Cotton-knitted garments have been
increasing steadily since 70s as consumers worldwide recognized
their comfort and adaptability for all types of regular, leisure and
sportswear. While processing order for the buyer, knit-garment makers generally specify their requirements in terms of grams
per square meter (GSM), fabric width and shrinkage (both
length and width),based on mostly buyer’s requirements and
processing capability; for a finished knitted fabric of a particular
shade. The fabric suppliers (particularly the knitters), on their part, have to choose knitting variables like machine gauge
(defined by no. of loop-forming needles per unit circumference of
the machine), yarn count (a measure of yarn fineness) & stitch
length (length of yarn in a loop).The choice of these knitting variables is important in order to meet the quality specification of
the buyers.
Sometimes the combination of the requirements as demanded on
the finished knitted fabric, is quite impossible to achieve. For this
reason it is very common for knitted-fabric manufacturers to carry out a fairly large numbers of sample trials when they are
required to develop a new product. These trials can consume
considerable amount of time and raw materials, and cause
considerable disruption to production schedules, before a
satisfactory solution is found. Research works have been carried out worldwide for developing a practical system for reliably
predicting the shrinkage and dimensional properties of finished
Cotton–knitted fabrics. The most recognized effort may be that
of IIC (Recent CTI) termed as STARFISH. It is a computer
program, and a body of know-how which can demonstrate how to engineer cotton circular knits so that the quality and the
performance can be right first and on time.
To use STARFISH with the simplest option , the user has to give
input variables of machine gauge, yarn count and stitch length mainly as well as specifying a target value of GSM and fabric
width or shrinkage. In case of target GSM and fabric width, the
STARFISH gives shrinkage as outputs and in case of target
shrinkage; the software gives GSM and fabric width as outputs.
But as STARFISH outputs represent the results developed from many industrial trials of different countries, the user just gets the
standard average values of GSM, Width and Shrinkage of a
particular fabric from STARFISH. So to customize this software
in a particular factory, the results given by STARFISH has to be
calibrated according to the factory results. Though the software provides a self-calibration method which is more experimental, a
quick calibration procedure will definitely be more users friendly
and support the application of this software more practically in a
real factory situation.
In this work, first, the relationship between STARFISH inputs
(yarn count and stitch length) and outputs (GSM/Width) has
been established through a set of multiple linear regression models for each specific machine gauge. The models thus
developed have a high degree of correlation ship. Consequently,
the regression models can be used as a substitute of STARFISH
to predict outputs with a high accuracy under similar
environment. Secondly STARFISH predicted results have been compared with recorded results of Beximco Knitting Limited (A
renowned knitting factory of Bangladesh) using standard
statistical measures in order to customize STARFISH as a real
factory case. It was observed that the mean absolute percentage
error (MAPE) is less than 5% for all machine gauges. The findings thus clearly establish a quite advantageous approach for
applying such technology for the selection of decision variables.
Index Term-- Knitting, Gauge, Yarn Count, Stitch Length,
GSM, Shrinkage
1. INTRODUCTION
Knitting is a process of fabric manufacturing by interlocking
series of loops of one or more yarns. Knitted fabrics are used
to produce garments that cover every part of the human body,
in a wide range of garment types from socks, caps, gloves and
underwear to upper and lower body garments varying from T-
shirts to formal jackets. The dramatic increase in the
popularity of knit fabrics during the last three decades
provides a vivid example of the interrelationships between
lifestyle, technology and fashion. The high degree of stretch
and comfort that knit cloth brings to close-fitting garments,
coupled with excellent wrinkle resistance, makes them
eminently suitable to the modern consumer s demands.
Unlike weaving, knitting cannot commence with any type of
yarn. Knitting requires a relatively fine, smooth , strong yarn
with good elastic recovery properties. Cotton yarn is proven
worldwide as particularly suitable for knit garments like
underwear, outerwear, sportswear and socks. Though the
development of synthetic fibers brought revolution to the
clothing industry, cotton-knitted fabrics have always enjoyed
great popularity among all kinds of knitted fabrics. Due to
unprecedented competition in the global apparel indust ry
customers are demanding better quality in terms of improved
performance (e.g. lower shrinkage and better retention of
shape and performance). The International Institute for Cotton
International Journal of Engineering & Technology IJET-IJENS Vol: 11 No: 01 126
117801-6464 IJET-IJENS © February 2011 IJENS
I J E N S
in1988 introduced to the industry the results of an extensive
research program into the shrinkage and dimensional
properties of finished knitted cotton fabrics. The package is
marketed as a computer program called STARFISH.
2. OBJECTIVES
The objectives of this study can be summarized as
follow:
To study the STARFISH Technology and its relevance
with knit manufacturing.
To search for any type of possible relationship between
input and output parameters by analyzing STARFISH
results.
To compare some relevant R&D (Research and
Development) records of a standard knit factory with
STARFISH outputs with the help of statistical
analysis.
To propose the calibration for customization of
STARFISH for that factory and thus establishing a
feasible general way for customization of this technology
for all circular weft-knit plants under similar production
environment.
3. THEORITICAL BACKGROUND
3.1.FLOW CHART OF KNITTED GARMENTS
MANUFACTURING
All knitted garments can be classified into four categories
according to general
Production methods:
(1)Fully cut
(2)Stitch shaped cut
(3)Fully fashioned
(4)Integral
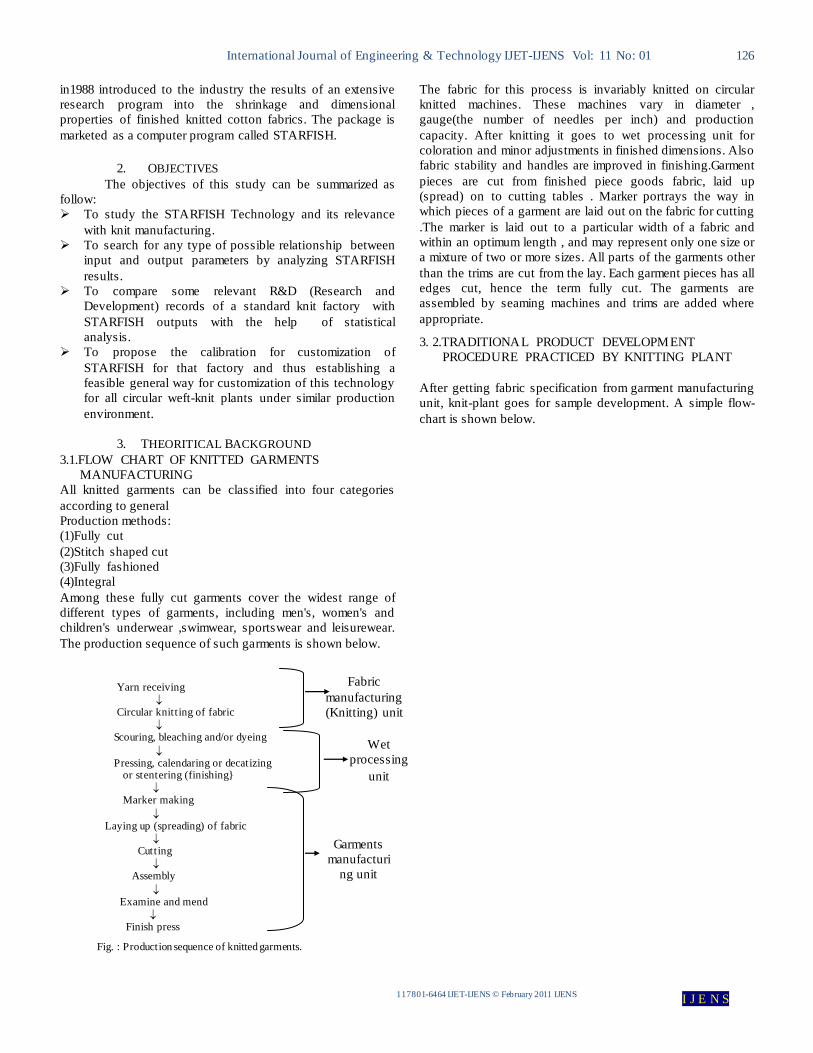
Among these fully cut garments cover the widest range of
different types of garments, including men's, women's and
children's underwear ,swimwear, sportswear and leisurewear.
The production sequence of such garments is shown below.
Yarn receiving
Circular knitting of fabric
Scouring, bleaching and/or dyeing
Pressing, calendaring or decatizing or stentering (finishing}
Marker making
Laying up (spreading) of fabric
Cutting
Assembly
Examine and mend
Finish press
Fig. : Production sequence of knitted garments.
The fabric for this process is invariably knitted on circular
knitted machines. These machines vary in diameter ,
gauge(the number of needles per inch) and production
capacity. After knitting it goes to wet processing unit for
coloration and minor adjustments in finished dimensions. Also
fabric stability and handles are improved in finishing.Garment
pieces are cut from finished piece goods fabric, laid up
(spread) on to cutting tables . Marker portrays the way in
which pieces of a garment are laid out on the fabric for cutting
.The marker is laid out to a particular width of a fabric and
within an optimum length , and may represent only one size or
a mixture of two or more sizes. All parts of the garments other
than the trims are cut from the lay. Each garment pieces has all
edges cut, hence the term fully cut. The garments are
assembled by seaming machines and trims are added where
appropriate.
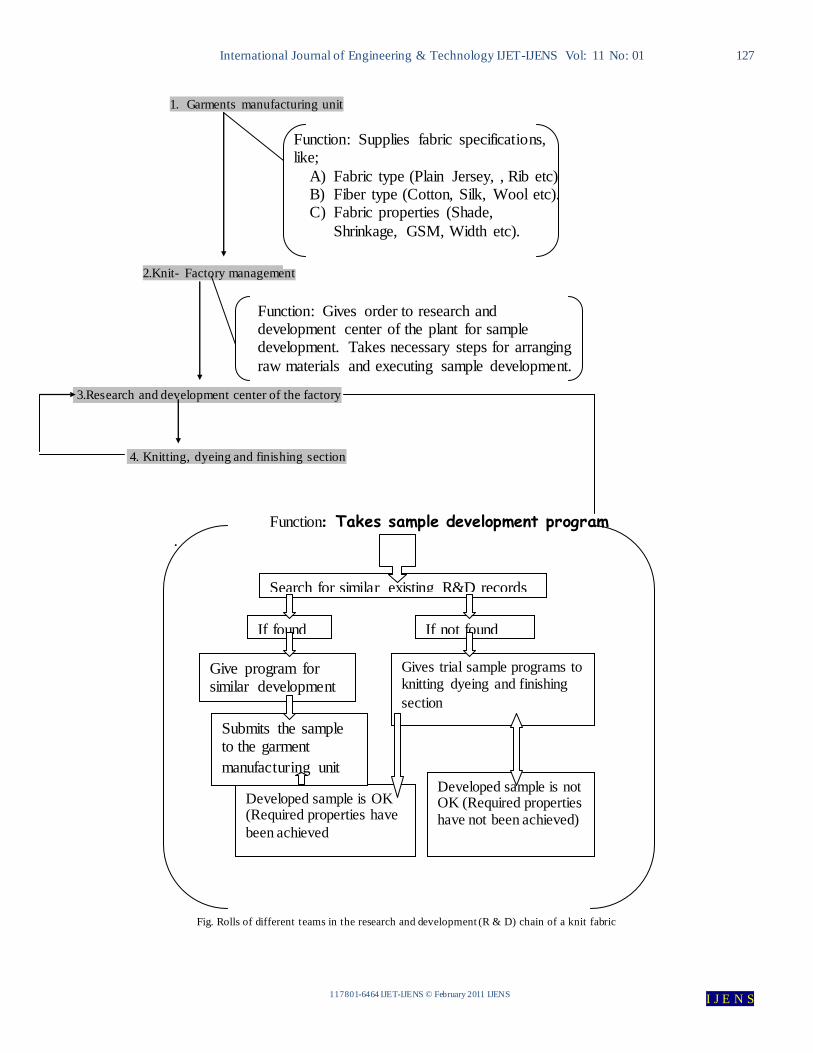
3. 2.TRADITIONAL PRODUCT DEVELOPMENT
PROCEDURE PRACTICED BY KNITTING PLANT
After getting fabric specification from garment manufacturing
unit, knit-plant goes for sample development. A simple flow-
chart is shown below.
Fabric
manufacturing
(Knitting) unit
Wet
processing
unit
Garments
manufacturi
ng unit
International Journal of Engineering & Technology IJET-IJENS Vol: 11 No: 01 127
117801-6464 IJET-IJENS © February 2011 IJENS
I J E N S
1. Garments manufacturing unit
2.Knit- Factory management
3.Research and development center of the factory
4. Knitting, dyeing and finishing section
Fig. Rolls of different teams in the research and development (R & D) chain of a knit fabric
Function: Supplies fabric specifications, like;
A) Fabric type (Plain Jersey, , Rib etc) B) Fiber type (Cotton, Silk, Wool etc). C) Fabric properties (Shade,
Shrinkage, GSM, Width etc).
Function: Gives order to research and development center of the plant for sample development. Takes necessary steps for arranging
raw materials and executing sample development.
Function: Takes sample development program
.
Give program for similar development
Gives trial sample programs to knitting dyeing and finishing
section
Developed sample is OK (Required properties have
been achieved
Developed sample is not OK (Required properties have not been achieved)
Submits the sample to the garment
manufacturing unit
Search for similar existing R&D records
If found If not found

International Journal of Engineering & Technology IJET-IJENS Vol: 11 No: 01 128
117801-6464 IJET-IJENS © February 2011 IJENS
I J E N S
Note : Sample development programs are totally controlled by
factory management for factories which do not have R&D
centers
4. EXPERIMENTAL STEPS
The work progressed by completing the following steps
sequentially.
-Searching records of those specific samples from R&D
Department of Beximco Knitting Limited (a renowned and
standard Knit factory of Bangladesh), processing of which are
very much similar to STARFISH guided processing sequence.
-Obtaining simulated test results from STARFISH for two
output variables (i.e. GSM and Width) keeping the third
output (i.e. Shrinkage) same as the factory result.
-Finding out the deviations between STARFISH results and
factory results by standard statistical measures.
- Finding out mathematical relations between input and output
variables by analyzing the STARFISH results with the help of
MATLAB and WINQSB software so that those can be used
anywhere for prediction without the help of a computer.
- Forecasting the possible factory outputs with the help of
calibrated STARFISH outputs
5. STARFISH COMPUTER PROGRAM
The name STARFISH is contracted from the phrase “START
as you mean to FINISH” .It embodies the principle that, in
order to know how to produce a knitted fabric with the desired
dimensions and performance, we must first have an accurate
knowledge of the finished product. The STARFISH Kit was
first made commercially available in 1988 after several years
of preliminary testing and development in the industry. The
collection of new data and the development of improved
analytical techniques for the interpretation of the data base is
being continued by Cotton Technology International (CTI). A
simplified operational procedure of STARFISH software
(Version 5.03) is shown below
Software Operation
Presetting :
- Units
- Targets (Shrinkage/ GSM & Width)
Giving Inputs:
- Fabric type
- Yarn type (combed, carded etc.)
- Knitting machine (specified by gauge,
diameter & no. of needles)
- Yarn count
- Stitch length
- Wet process route (Dyeing machine type:
Jet, Winch etc.)
- Nominal depth of shade (White, medium,
deep etc.)
Target values specified: (Values of GSM& Width /Shrinkage)
Getting outputs: (Values of Shrinkage /GSM& Width)
Note:
►For a particular fabric of a specified shade, major and
dominating inputs are yarn count, stitch length and knitting
machine.
►Generally buyer's requirement is more rigid on Shrinkage as
it is the most sensitive issue from the consumer's point of
view. So shrinkage is generally selected as target.
6. CUSTOMERS SPECIFICATION AND STARFISH
For a finished knitted fabric, the “customer” is the person or
organization, which decides the final performance of the
product. It may be a store group, a garment maker, a converter
or a retail division of a vertical company. The customer
usually sets out his requirement in the form of a specification,
which calls for combination of properties
like-
* GSM
* Width and
* Shrinkage
Sometimes this combination of properties is quite impossible
to achieve in practice. It is a well-known fact that the demands
of customers are often based largely upon wishful thinking
rather than solid experience of the product that they have in
mind. In the case of a new product this is almost inevitably the
case and is to be accepted as a fact of life – part of the process
of product evolution and improvement in response to market
opportunities. But problem arises when the demanded weight,
width and shrinkage values are mutually incompatible. Even
the customer may ask for better shrinkage on an existing
quality without allowing any changes in weight and width! If
the manufacturer has access to STARFISH and thus has the
calibrated result, then the specification can be checked and the
customer can be informed of what it is possible to achieve
without depending on sample making. Also the customer may
be offered various practical alternatives to choose if he
wishes.
7. DATA COLLECTION
7.1 DATA SORTING FROM EXISTING R&D RECORDS
OF BEXIMCO KNITTING LIMITED
For customization of STARFISH, the first step is to find out
those production or sample records, processing of which are
very much similar to STARFISH guided processing sequence.
For this purpose the most standard and popular knitted fabric-
PLAIN JERSEY was selected and the recent production and
sample records of Beximco Knitting Limited were considered.
MS Excel Auto filter Option was used for doing this Also Log
books were checked manually for accuracy. The other unique
characteristics of these records are-
1) The fabrics were knitted and processed in Beximco
Knitting Limited with the yarn of Padma Textiles
Limited- a sister concern of Beximco. So a high
consistency is expected in measuring production variables
and outputs.

International Journal of Engineering & Technology IJET-IJENS Vol: 11 No: 01 129
117801-6464 IJET-IJENS © February 2011 IJENS
I J E N S
2) Samples were knitted in four type of knitting machines
and one type of dyeing machine. Knitting machines are of
18G30D (18 Gauge and 30” Diameter}, 20G30D,
24G30D and 28G30D respectively. Dyeing machines
are of jet type.
3) Samples were only solid dyed in medium deep shade
(between 4-6% dyestuff) and no reprocess or additional
chemical treatment was carried out.
4) Samples were subjected to a reference relaxation
procedure (similar to that of STARFISH
recommendation) for property measurements in standard
atmospheric conditions. Therefore, the results achieved
are comparable with STARFISH generated results.
7.2 CHART OF APPLICABLE PRACTICAL DATA FROM
BEXIMCO KNITTING LIMITED
The following tables show the list of all data that were found
as standards for the desired purpose .The collected data was
arranged knit-machine wise as shown in table (i)to table
(iv)for better understanding and implementation.
T ABLE I DATA FROM KNITTING MACHINE TYPE: 18G, 30”D, 1728 NEEDLES
Knitting Machine Type: 18G, 30"
Dia., 1728 Needles 1 2 3 4 5 6 7 8
Yarn Count 15/1 16/1 17/1 17/1 20/1 20/1 20/1 20/1
Stitch Length 3.32 3.31 3.26 3.38 3.14 3.02 3.07 2.78
GSM 272 231 231 222 195 205 202 217
Width 56 59.5 56 58 54 53 54.5 51
Length Shrinkage (%) 5.3 3.6 4.3 4 2 5 2.7 3.5
Width Shrinkage (%) 4.3 4.2 6 5 7 5 6.3 6.8
T ABLE II
DATA FROM KNITTING MACHINE TYPE: 20G, 30”D, 1944 NEEDLES
Knitting Machine Type : 20G, 30"
Dia., 1944 Needles 1 2 3 4 5 6
Yarn Count 20 20 20 20 20 22
Stitch Length 2.83 2.79 2.94 3.01 2.9 2.8
GSM 217 216 200 190 209 200
Width 58 56 58 60 57.5 56
Length Shrinkage (%) 5 5 5 5 2.4 5
Width Shrinkage (%) 5 5 5 5 6.3 5
T ABLE III
DATA FROM KNITTING MACHINE TYPE: 24G, 30”D, 2256 NEEDLES
Knitting Machine Type: 24G, 30"
Dia., 2256Needles 1 2 3 4 5 6 7 8
Yarn Count 20 20 20 20 22 24 24 26
Stitch Length 3.02 2.96 3.15 2.91 3.1 2.77 3 2.63
GSM 207 202 198 218 198 174 157 177.5
Width 64 64 69 67 69.5 64.5 70.5 61
Length Shrinkage (%) 5 5 7 2.3 6 1.7 6.8 5
Width Shrinkage (%) 2.3 5 7 7 7.7 7.5 8.6 5

International Journal of Engineering & Technology IJET-IJENS Vol: 11 No: 01 130
117801-6464 IJET-IJENS © February 2011 IJENS
I J E N S
T ABLE IV DATA FROM KNITTING MACHINE TYPE: 28G, 30”D, 2640 NEEDLES
Knitting Machine Type: 28G, 30"
Dia., 2640 Needles
1 2 3 4 5
Yarn Count 26 30 30 34 40
Stitch Length 2.61 2.77 2.85 2.69 2.45
GSM 180 146 144 120 129
Width 69 68 73.5 72 63
Length Shrinkage (%) 4.9 5 3.2 8.4 9.3
Width Shrinkage (%) 4.2 4 7.2 12.5 7
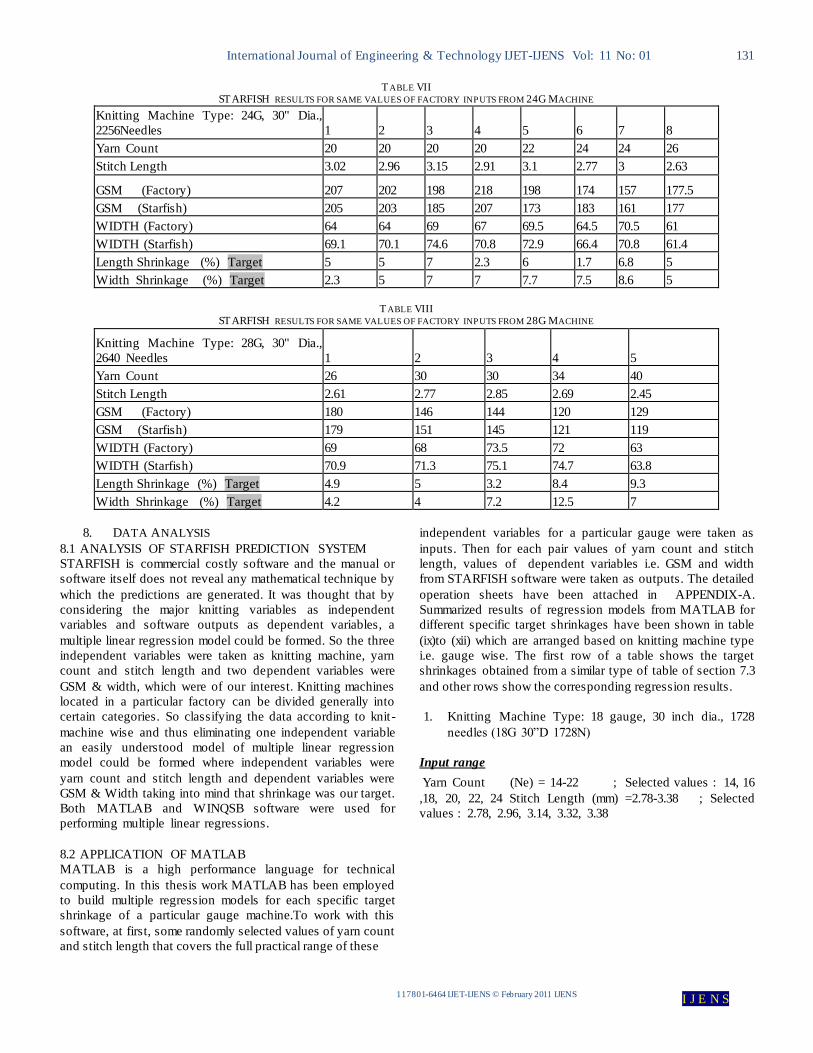
7.3 STARFISH GENERATED RESULTS.
For making a comparison between original factory output and
STARFISH output, similar values of inputs and target to the
software were given to get values of outputs. It may be
mentioned that as shrinkage is the most sensitive issue from
the consumer’s point of view it has been specified as target in
this project work rather than GSM & width. Tables (v) to (viii)
show the STARFISH outcomes for the sorted applicable data
obtained from the factory as mentioned in section 7.2 .
T ABLE V
STARFISH RESULTS FOR SAME VALUES OF FACTORY INPUTS FROM 18G MACHINES
Knitting Machine Type: 18G, 30" Dia.,
1728 Needles 1 2 3 4 5 6 7 8
Yarn Count 15/1 16/1 17/1 17/1 20/1 20/1 20/1 20/1
Stitch Length 3.32 3.31 3.26 3.38 3.14 3.02 3.07 2.78
GSM (Factory) 272 231 231 222 195 205 202 217
GSM (Starfish) 240 232 216 213 196 200 199 213
WIDTH (Factory) 56 59.5 56 58 54 53 54.5 51
WIDTH (Starfish) 61 60 58.8 60.6 57.1 54.4 55.8 52.5
Length Shrinkage (%) Target 5.3 3.6 4.3 4 2 5 2.7 3.5
Width Shrinkage (%) Target 4.3 4.2 6 5 7 5 6.3 6.8
T ABLE VI
STARFISH RESULTS FOR SAME VALUES OF FACTORY INPUTS FROM 20G MACHINES
Knitting Machine Type: 20G, 30" Dia.,
1944 Needles 1 2 3 4 5 6
Yarn Count 20 20 20 20 20 22
Stitch Length 2.83 2.79 2.94 3.01 2.9 2.8
GSM (Factory) 217 216 200 190 209 200
GSM (Starfish) 210 213 204 200 209 195
WIDTH (Factory) 58 56 58 60 57.5 56
WIDTH (Starfish) 58.6 58.1 60.1 61.1 60.4 57.1
Length Shrinkage (%) Target 5 5 5 5 2.4 5
Width Shrinkage (%) Target 5 5 5 5 6.3 5
International Journal of Engineering & Technology IJET-IJENS Vol: 11 No: 01 131
117801-6464 IJET-IJENS © February 2011 IJENS
I J E N S
T ABLE VII STARFISH RESULTS FOR SAME VALUES OF FACTORY INPUTS FROM 24G MACHINE
Knitting Machine Type: 24G, 30" Dia.,
2256Needles 1 2 3 4 5 6 7 8
Yarn Count 20 20 20 20 22 24 24 26
Stitch Length 3.02 2.96 3.15 2.91 3.1 2.77 3 2.63
GSM (Factory) 207 202 198 218 198 174 157 177.5
GSM (Starfish) 205 203 185 207 173 183 161 177
WIDTH (Factory) 64 64 69 67 69.5 64.5 70.5 61
WIDTH (Starfish) 69.1 70.1 74.6 70.8 72.9 66.4 70.8 61.4
Length Shrinkage (%) Target 5 5 7 2.3 6 1.7 6.8 5
Width Shrinkage (%) Target 2.3 5 7 7 7.7 7.5 8.6 5
T ABLE VIII
STARFISH RESULTS FOR SAME VALUES OF FACTORY INPUTS FROM 28G MACHINE
Knitting Machine Type: 28G, 30" Dia.,
2640 Needles 1 2 3 4 5
Yarn Count 26 30 30 34 40
Stitch Length 2.61 2.77 2.85 2.69 2.45
GSM (Factory) 180 146 144 120 129
GSM (Starfish) 179 151 145 121 119
WIDTH (Factory) 69 68 73.5 72 63
WIDTH (Starfish) 70.9 71.3 75.1 74.7 63.8
Length Shrinkage (%) Target 4.9 5 3.2 8.4 9.3
Width Shrinkage (%) Target 4.2 4 7.2 12.5 7
8. DATA ANALYSIS
8.1 ANALYSIS OF STARFISH PREDICTION SYSTEM
STARFISH is commercial costly software and the manual or
software itself does not reveal any mathematical technique by
which the predictions are generated. It was thought that by
considering the major knitting variables as independent
variables and software outputs as dependent variables, a
multiple linear regression model could be formed. So the three
independent variables were taken as knitting machine, yarn
count and stitch length and two dependent variables were
GSM & width, which were of our interest. Knitting machines
located in a particular factory can be divided generally into
certain categories. So classifying the data according to knit-
machine wise and thus eliminating one independent variable
an easily understood model of multiple linear regression
model could be formed where independent variables were
yarn count and stitch length and dependent variables were
GSM & Width taking into mind that shrinkage was our target.
Both MATLAB and WINQSB software were used for
performing multiple linear regressions.
8.2 APPLICATION OF MATLAB
MATLAB is a high performance language for technical
computing. In this thesis work MATLAB has been employed
to build multiple regression models for each specific target
shrinkage of a particular gauge machine.To work with this
software, at first, some randomly selected values of yarn count
and stitch length that covers the full practical range of these
independent variables for a particular gauge were taken as
inputs. Then for each pair values of yarn count and stitch
length, values of dependent variables i.e. GSM and width
from STARFISH software were taken as outputs. The detailed
operation sheets have been attached in APPENDIX-A.
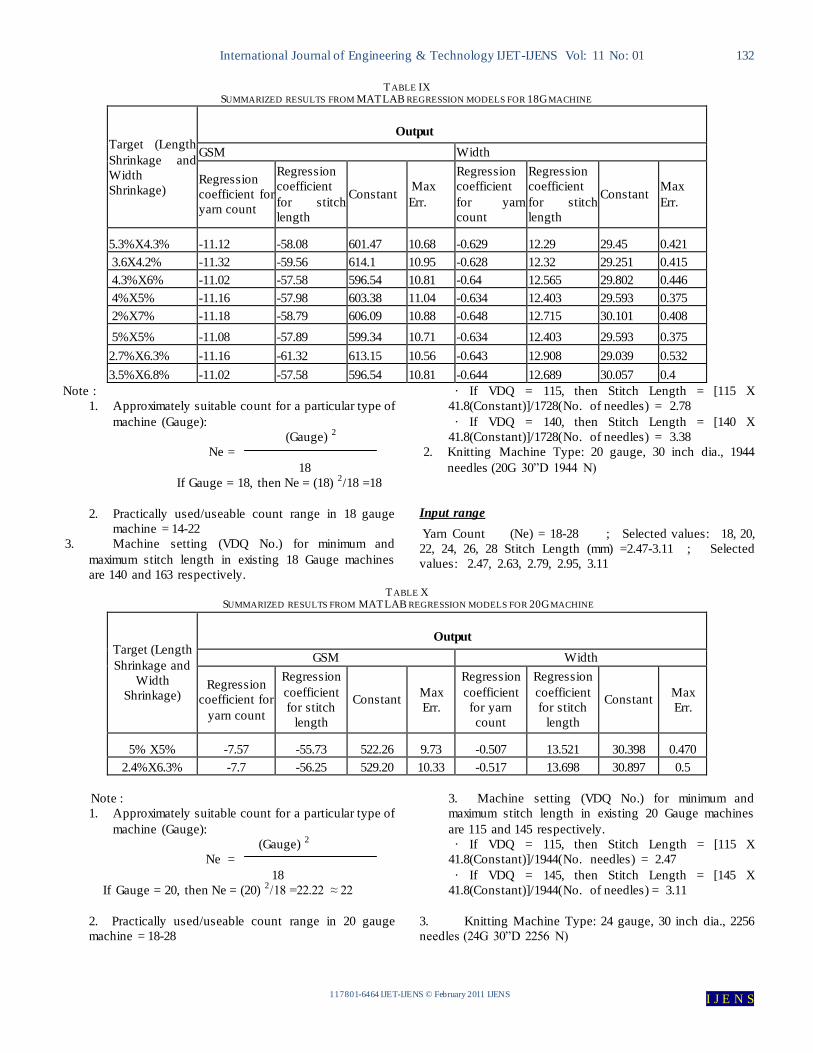
Summarized results of regression models from MATLAB for
different specific target shrinkages have been shown in table
(ix)to (xii) which are arranged based on knitting machine type
i.e. gauge wise. The first row of a table shows the target
shrinkages obtained from a similar type of table of section 7.3
and other rows show the corresponding regression results.
1. Knitting Machine Type: 18 gauge, 30 inch dia., 1728
needles (18G 30”D 1728N)
Input range
Yarn Count (Ne) = 14-22 ; Selected values : 14, 16
,18, 20, 22, 24 Stitch Length (mm) =2.78-3.38 ; Selected
values : 2.78, 2.96, 3.14, 3.32, 3.38
International Journal of Engineering & Technology IJET-IJENS Vol: 11 No: 01 132
117801-6464 IJET-IJENS © February 2011 IJENS
I J E N S
T ABLE IX SUMMARIZED RESULTS FROM MATLAB REGRESSION MODELS FOR 18G MACHINE
Target (Length
Shrinkage and
Width
Shrinkage)
Output
GSM Width
Regression
coefficient for
yarn count
Regression
coefficient
for stitch
length
Constant Max
Err.
Regression
coefficient
for yarn
count
Regression
coefficient
for stitch
length
Constant Max
Err.
5.3%X4.3% -11.12 -58.08 601.47 10.68 -0.629 12.29 29.45 0.421
3.6X4.2% -11.32 -59.56 614.1 10.95 -0.628 12.32 29.251 0.415
4.3%X6% -11.02 -57.58 596.54 10.81 -0.64 12.565 29.802 0.446
4%X5% -11.16 -57.98 603.38 11.04 -0.634 12.403 29.593 0.375
2%X7% -11.18 -58.79 606.09 10.88 -0.648 12.715 30.101 0.408
5%X5% -11.08 -57.89 599.34 10.71 -0.634 12.403 29.593 0.375
2.7%X6.3% -11.16 -61.32 613.15 10.56 -0.643 12.908 29.039 0.532
3.5%X6.8% -11.02 -57.58 596.54 10.81 -0.644 12.689 30.057 0.4
Note :
1. Approximately suitable count for a particular type of
machine (Gauge):
(Gauge) 2
Ne =
18
If Gauge = 18, then Ne = (18) 2
/18 =18
2. Practically used/useable count range in 18 gauge
machine = 14-22
3. Machine setting (VDQ No.) for minimum and
maximum stitch length in existing 18 Gauge machines
are 140 and 163 respectively.
· If VDQ = 115, then Stitch Length = [115 X
41.8(Constant)]/1728(No. of needles) = 2.78
· If VDQ = 140, then Stitch Length = [140 X
41.8(Constant)]/1728(No. of needles) = 3.38
2. Knitting Machine Type: 20 gauge, 30 inch dia., 1944
needles (20G 30”D 1944 N)
Input range
Yarn Count (Ne) = 18-28 ; Selected values: 18, 20,
22, 24, 26, 28 Stitch Length (mm) =2.47-3.11 ; Selected
values: 2.47, 2.63, 2.79, 2.95, 3.11
T ABLE X
SUMMARIZED RESULTS FROM MATLAB REGRESSION MODELS FOR 20G MACHINE
Target (Length
Shrinkage and
Width
Shrinkage)
Output
GSM Width
Regression
coefficient for
yarn count
Regression
coefficient
for stitch
length
Constant Max
Err.
Regression
coefficient
for yarn
count
Regression
coefficient
for stitch
length
Constant Max
Err.
5% X5% -7.57 -55.73 522.26 9.73 -0.507 13.521 30.398 0.470
2.4%X6.3% -7.7 -56.25 529.20 10.33 -0.517 13.698 30.897 0.5
Note :
1. Approximately suitable count for a particular type of
machine (Gauge):
(Gauge) 2
Ne =
18
If Gauge = 20, then Ne = (20) 2
/18 =22.22 ≈ 22
2. Practically used/useable count range in 20 gauge
machine = 18-28
3. Machine setting (VDQ No.) for minimum and
maximum stitch length in existing 20 Gauge machines
are 115 and 145 respectively.
· If VDQ = 115, then Stitch Length = [115 X
41.8(Constant)]/1944(No. needles) = 2.47
· If VDQ = 145, then Stitch Length = [145 X
41.8(Constant)]/1944(No. of needles) = 3.11
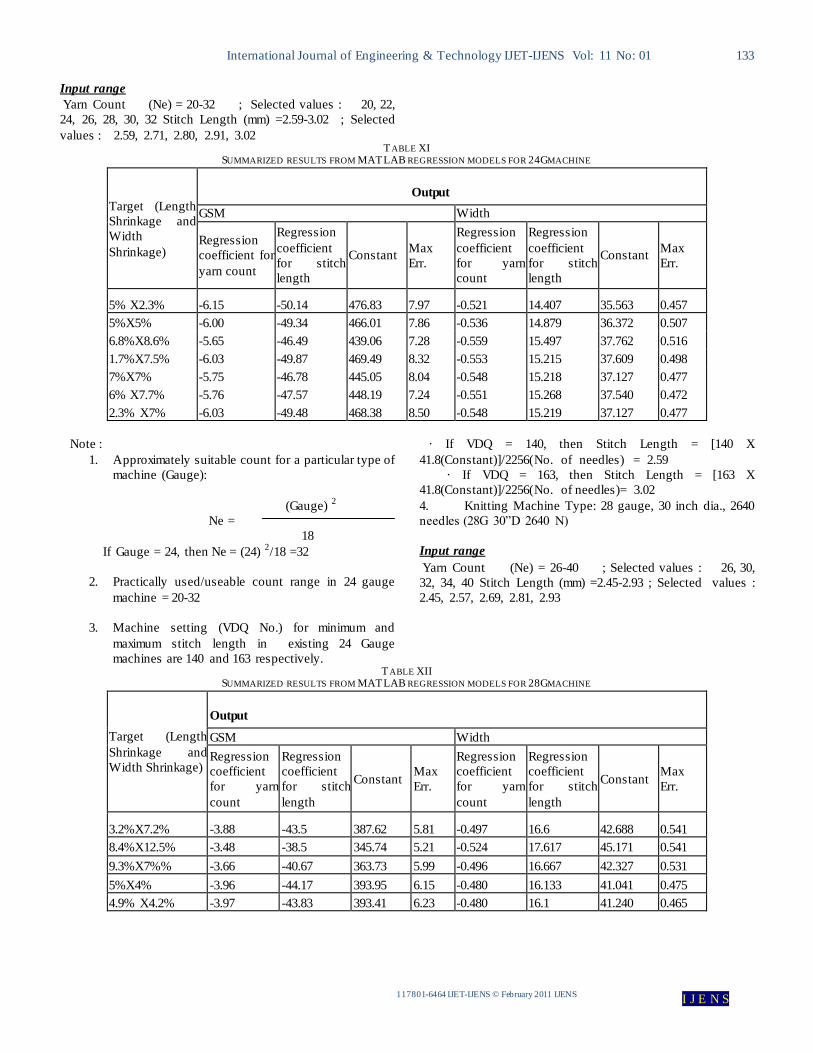
3. Knitting Machine Type: 24 gauge, 30 inch dia., 2256
needles (24G 30”D 2256 N)
International Journal of Engineering & Technology IJET-IJENS Vol: 11 No: 01 133
117801-6464 IJET-IJENS © February 2011 IJENS
I J E N S
Input range
Yarn Count (Ne) = 20-32 ; Selected values : 20, 22,
24, 26, 28, 30, 32 Stitch Length (mm) =2.59-3.02 ; Selected
values : 2.59, 2.71, 2.80, 2.91, 3.02
T ABLE XI SUMMARIZED RESULTS FROM MATLAB REGRESSION MODELS FOR 24GMACHINE
Target (Length
Shrinkage and
Width
Shrinkage)
Output
GSM Width
Regression
coefficient for
yarn count
Regression
coefficient
for stitch
length
Constant Max
Err.
Regression
coefficient
for yarn
count
Regression
coefficient
for stitch
length
Constant Max
Err.
5% X2.3% -6.15 -50.14 476.83 7.97 -0.521 14.407 35.563 0.457
5%X5% -6.00 -49.34 466.01 7.86 -0.536 14.879 36.372 0.507
6.8%X8.6% -5.65 -46.49 439.06 7.28 -0.559 15.497 37.762 0.516
1.7%X7.5% -6.03 -49.87 469.49 8.32 -0.553 15.215 37.609 0.498
7%X7% -5.75 -46.78 445.05 8.04 -0.548 15.218 37.127 0.477
6% X7.7% -5.76 -47.57 448.19 7.24 -0.551 15.268 37.540 0.472
2.3% X7% -6.03 -49.48 468.38 8.50 -0.548 15.219 37.127 0.477
Note :
1. Approximately suitable count for a particular type of
machine (Gauge):
(Gauge) 2
Ne =
18
If Gauge = 24, then Ne = (24) 2
/18 =32
2. Practically used/useable count range in 24 gauge
machine = 20-32
3. Machine setting (VDQ No.) for minimum and
maximum stitch length in existing 24 Gauge
machines are 140 and 163 respectively.
· If VDQ = 140, then Stitch Length = [140 X
41.8(Constant)]/2256(No. of needles) = 2.59
· If VDQ = 163, then Stitch Length = [163 X
41.8(Constant)]/2256(No. of needles)= 3.02
4. Knitting Machine Type: 28 gauge, 30 inch dia., 2640
needles (28G 30”D 2640 N)
Input range
Yarn Count (Ne) = 26-40 ; Selected values : 26, 30,
32, 34, 40 Stitch Length (mm) =2.45-2.93 ; Selected values :
2.45, 2.57, 2.69, 2.81, 2.93
T ABLE XII SUMMARIZED RESULTS FROM MATLAB REGRESSION MODELS FOR 28GMACHINE
Target (Length
Shrinkage and
Width Shrinkage)
Output
GSM Width
Regression
coefficient
for yarn
count
Regression
coefficient
for stitch
length
Constant Max
Err.
Regression
coefficient
for yarn
count
Regression
coefficient
for stitch
length
Constant Max
Err.
3.2%X7.2% -3.88 -43.5 387.62 5.81 -0.497 16.6 42.688 0.541
8.4%X12.5% -3.48 -38.5 345.74 5.21 -0.524 17.617 45.171 0.541
9.3%X7%% -3.66 -40.67 363.73 5.99 -0.496 16.667 42.327 0.531
5%X4% -3.96 -44.17 393.95 6.15 -0.480 16.133 41.041 0.475
4.9% X4.2% -3.97 -43.83 393.41 6.23 -0.480 16.1 41.240 0.465

International Journal of Engineering & Technology IJET-IJENS Vol: 11 No: 01 134
117801-6464 IJET-IJENS © February 2011 IJENS
I J E N S
Note :
1. Approximately suitable count for a particular type of
machine (Gauge):
(Gauge) 2
Ne =
18
If Gauge = 28, then Ne = (28) 2
/18 = 43.5 ≈ 43 or 44
2. Practically used/useable count range in 28 gauge
machine = 26-40
3. Machine setting (VDQ No.) for minimum and
maximum stitch length in
existing 28 Gauge machines are 155 and 185
respectively.
· If VDQ = 155, then Stitch Length = [155 X
41.8(Constant)]/2640(No. of needles) = 2.45
· If VDQ = 185, then Stitch Length = [185 X
41.8(Constant)]/2640(No. of needles) =2.93
8.3Exploring means of MATLAB result 1.By using the
values of regression co-efficient for yarn count and stitch
length, and intercept a regression equation can be
formed .For example, for a target length shrinkage of
2.7% and width shrinkage of 6.3% if existing 18 Gauge
machines are used then regression equations for GSM
and Width will be GSM = 613.15-11.16 Y.C(Yarn
Count).- 61.32 S.L(Stitch Length) Width=29.039- 0.643
Y.C.+12.908 S.L.2. Maximum error represents the
maximum deviation between the predicted outputs by
MATLAB regression equations and STARFISH original
outputs. For example, for a target shrinkage of 7%X7%
if existing 24 Gauge machines are used then maximum
error for GSM will be 8.04 and maximum error for width
will be 0.477.It should be noted that MATLAB does not
indicate the point where the maximum error occurs. But
putting the values from input range into the regression
equation it is found that maximum error occurs for the
extreme values of outputs. For example consider the
regression equations for GSM and Width at 5%X5%
shrinkage target in 20 Gauge machines.
GSM = 522.26 - 7.57 Y.C. – 55.73 S.L∙ ∙ ∙ ∙ ∙ ∙ ∙ (1)
Width = 30.398 - 0.507 Y.C. +13.521 S.L ∙ ∙ ∙ ∙ (2)
When yarn count (Y.C.) is minimum, i.e. 18 and stitch length
is minimum, i.e. 2.47 STARFISH gives GSM = 258
(maximum value)
Equation (1) gives
GSM = 522.26 - 7.57 X 18 – 55.73 X 2.47 = 248.35
(maximum value)
Now error (deviation) = 258-248.35= 9.65 (Maximum value)
[most accurately 9.7286 ≈9.73: see APPENDIX-A]=3.74 %
only
Again when yarn count (Y.C.) is minimum, i.e. 18 and stitch
length (S.L.) is maximum, i.e. 3.11 STARFISH gives Width
= 63.8 (maximum value)
Equation (2) gives Width = 30.398 - 0.507 X 18 + 13.521 X
3.11= 63.32 (maximum value)
Now error (deviation) = 63.8-63.32 = 0.48 (Maximum
value) [most accurately 0.4705≈0.470: see APPENDIX-A]
= 0.75 % only
8.4 Application of WINQSB
WINQSB is an another advanced mathematical software. It
gives a detailed Regression summary with analysis of
variance. Regression equation can also be found directly from
here. A typical example has been shown in table (xiii)

International Journal of Engineering & Technology IJET-IJENS Vol: 11 No: 01 135
117801-6464 IJET-IJENS © February 2011 IJENS
I J E N S
T ABLE XVIII AN EXAMPLE OF WINQSB GENERATED REGRESSION RESULTS
Knitting Machine Type : 18G 30"D 1728N
Target : L.S.Х W.S.=2.7% Х 6.3%
Y.C. S.L. GSM WIDTH Regression Summary - GSM
14 2.78 297 55.6 Variable Mean Standard Regression Standard
14 2.96 282 58.2 Name Deviation Coefficient Error
14 3.14 269 60.7 GSM 221.2 35.42598
14 3.32 257 63.1 Constant 613.1526 15.05345
14 3.38 250 64.2 Y.C. 18 2.886751 -11.16 0.3461706
16 2.78 263 54.4 S.L. 3.116 0.2278157 -61.31984 4.386477
16 2.96 250 56.9 Se=4.895592 R-square = 0.9824944 R-adjusted = 0.9809029
16 3.14 239 59.2
16 3.32 228 61.5
16 3.38 222 62.6 Analysis of Variance (ANOVA) -GSM
18 2.78 237 53.3 Source of Degree of Sum of Mean
18 2.96 225 55.6 Variability Freedom Square Square
18 3.14 215 57.9 Regression 2 29592.73 14796.37
18 3.32 205 60.1 Error 22 527.2701 23.96682
18 3.38 200 61.1 Total 24 30120
20 2.78 216 52.2
20 2.96 205 54.5 Reg. Eq. (GSM) : 613.1526 - 11.16 Y.C. - 61.31984 S.L.
20 3.14 196 56.6
20 3.32 187 58.7
20 3.38 182 59.7 Variable Mean Standard Regression Standard
22 2.78 198 51.2 Name Deviation Coefficient Error
22 2.96 188 53.4 WIDTH 57.688 3.484408
22 3.14 180 55.5 Constant 29.03919 0.7011116
22 3.32 172 57.5 Y.C. 18 2.886751 -0.6429999 1.61E-02
22 3.38 167 58.5 S.L. 3.116 0.2278157 12.90847 0.2042993
Se =0.2280113 R-square = 0.9960747 R-adjusted = 0.9957179
Analysis of Variance (ANOVA) - Width
Source of Degree of Sum of Mean
Variability Freedom Square Square
Regression 2 290.2426 145.1213
Error 22 1.143761 5.20E-02
Total 24 291.3863
Reg. Eq. (Width) :29.03919-0.6429999Y.C.+12.90847 S.L.
8.5 EXPLORING MEANS OF WINQSB RESULTS
1) Regression equation gives a forecasted output value of
GSM or Width for a target shrinkage.
2) The coefficient of variation “ R-Square ” value is a
“goodness of fit” measure. R2
is defined as: R2=SSR/SST
Where SSR= Regression sum of squares
SST= Total sum of squares
SSE= Sum of square error.
It ranges in value from 0 to 1.
In our case, R2 is giving a measure of the amount of
reduction in the variability of GSM or Width obtained by
using the regressor variables yarn count and stitch length
in the model . For example, R2=0.9960747 (from
Regression Summary – GSM of shown in the table (xiii)

International Journal of Engineering & Technology IJET-IJENS Vol: 11 No: 01 136
117801-6464 IJET-IJENS © February 2011 IJENS
I J E N S
meaning approximately 99.61% of the variation in the
GSM values can be explained by using the mentioned
two explanatory variables. However a large value of R2
does not necessarily imply that the regression model is a
good one. Adding a variable to the model will always
increase R2 meaning the SSR has increased. In order to
keep from over massaging the data,an eye must be kept
on the adjusted R2 statistic as the more reliable indication
of the true goodness of fit because it compensates for the
reduction in the SSE due to the addition of more
independent variables. Thus it may report a decreased
adjusted R2 value even though R
2 has increased, unless
the improvement in SSR is more than compensated for
by the addition of the new independent variables. In fact,
if unnecessary terms are added, the value of R2
adj will
often decrease. For example consider the GSM
regression model of the table(xiii). The adjusted R2 for
the model (R2
adj=0.9957179)
is very close to the
ordinary R2 (R
2=0.9960407)indicating a true goodness of
fit. When R
2 and R
2adj differ dramatically there is a good
chance that non-significant terms have
been included in the model.
3) Standard Error (Se) represents the amount of scatter in the
actual data around the regression line and is very similar
in concept to the SSE . Once we have Se value, we can
take advantage of a rough thumb rule that is based on the
normal distribution and states that we have 68%
confidence the actual value of GSM or Width would be
within +/-1 Se of our predictable value. Likewise we have
95% confidence that the actual value of GSM or Width
would be within +/- 2 Se of our predicted value. As from
the example of table (xiii) of section 8.4, the
predicted value for Width (when yarn count is18 and
stitch length is 2.78) is : 29.03919-0.6429999X
18+12.90847 X 2.78 or 53.35 [by putting input
values in reg. equation : (Width) =29.03919-
0.6429999Y.C.+12.90847 S.L] Our 68% confidence
interval would be [53.35 – 1(0.23); 53.35+1(0.23)] or
[53.12, 53.58] Our 95% confidence interval would be
[53.35 – 2(0.23); 53.35+2(0.23)] or [52.89, 53.81]
8.6 REMARK ON THE APPLICATION OF MATLAB AND
WINQSB
It is now clear that a multiple regression model satisfactorily
supports the STARFISH prediction system. If we calculate the
R2 and R
2adj for each individual trial then it may be found that
the values lie within the range 0.97-0.99 both for GSM and
Width. Once the outputs from the practical range of inputs for
a particular target from the software are obtained, then
regression equation can be established so that it can be used
confidently for prediction of outputs without the use of
computer. This may save time and help taking instant decision
while the knitter is outside his normal desk. Also these
equations may provide valuable support to other knitters
which are still out of the reach of such technology.
9. DETERMINATION OF ERROR RANGE FOR
CUSTOMIZATION OF STARFISH
9.1 STARFISH GUIDELINE AND ITS APPLICABILITY
It has been already mentioned earlier that STARFISH model
prediction equations have been developed from many
industrial trials and represent average values for typical wet
processing routes from the actual values for yarn count and
stitch length which the operator has chosen to enter. So
calibration is required to give predictions which apply directly
to own industrial situation. STARFISH prediction model
provides calibration routines which allow to modify the
predictions which STARFISH makes by establishing
calibration factor through increasing or decreasing courses and
wales per unit found in the reference state. But it is too much
experimental and consumes significant resources for
monitoring no. of courses and wales found practically in the
reference state. So to follow STARFISH guideline a sufficient
number of new developments have to be made which will then
be subjected to deep examination for reliable estimates of
reference courses and Wales. Though it will give the most
accurate calibration but factory people generally don’t
observe or keep recods of such parameters. They are also
generally not interested to work with such outputs which are
not major concern of most buyers.. So it will be a better
approach if STARFISH customization is done by determining
error range from available practical outputs with that of
STARFISH outputs. Such customization will also be easily
understood and welcomed by most knitters.
9.2 COMPARISON OF STARFISH PREDICTION WITH
PRACTICAL RESULTS
Tables (xiv)-(xvii) show the deviations between STARFISH
predictions and practical outputs for similar values of target
shrinkage(obtained from section 7.3 ).
Based on such statistical measures calibration can be done
according to knit machine (gauge) wise.

International Journal of Engineering & Technology IJET-IJENS Vol: 11 No: 01 138
117801-6464 IJET-IJENS © February 2011 IJENS
I J E N S
T ABLE XIV DETERMINING CALIBRATION FOR STARFISH PREDICTION FOR KNITTING
MACHINE TYPE: 18 GAUGE, 30 INCH DIA., 1728 NEEDLES (18G 30”D 1728N)
Obs.No.
GSM
WIDTH
STARFI
SH
(Original
)
Predictio
n
Practica
l
(Factory
)
AE MA
E
APE MAP
E
STARFI
SH
(Original
)
Predictio
n
Practical
(Factory)
AE MA
E
APE MAP
E
1 240 272 32
8.75
13.3
3.88
61 56 5
2.27
8.2
3.91
2 232 231 1 0.4 60 59.5 0.5 0.83
3 216 231 15 6.9 58.8 56 2.8 4.77
4 213 222 9 4.2 60.6 58 2.6 4.29
5 196 195 1 0.5 57.1 54 3.1 5.43
6 200 205 5 2.5 54.4 53 1.4 2.57
7 199 202 3 1.5 55.8 54.5 1.3 2.33
8 213 217 4 1.88 52.5 51 1.5 2.86
AE = Absolute Error
MAE = Mean Absolute Error
APE = Absolute Percentage Error
MAPE = Mean Absolute Percentage Error
Discussion of the results:
For GSM
● While achieving target shrinkage by existing 18G machines,
STARFISH calibration should be considered as +/-8.75 or +/-
3.88%
●Ignoring factory results for data no.1 (which is quite
unexpected and may be due to some catastrophic situations or
improper process monitoring ) we get revised
MAE=5.43 and MAPE=2.54. So revised STARFISH
calibration is +/-5.43 or +/-2.54%
For Width
● While achieving target shrinkage by existing 18G machines,
STARFISH (original) calibration should be considered as +/-
2.27 or +/-3.91%
●Ignoring factory results for data no.1 we get revised
MAE=1.88 and MAPE=3.3%. So revised STARFISH
calibration is +/-1.88 or +/-3.
T ABLE XV DETERMINING CALIBRATION FOR STARFISH PREDICTION FOR KNITTING MACHINE TYPE: 20G GAUGE, 30 INCH DIA., 1944 NEEDLES (20G 30”D
1944N)
Obs.No.
GSM
WIDTH
STARFI
SH
(Original
)
Predictio
n
Practica
l
(Factory
)
AE MA
E
APE MAP
E
STARFI
SH
(Original
)
Predictio
n
Practical
(Factory)
AE MA
E
APE MAP
E
1 210 217 7
4.83
3.33
2.38
58.6 58 0.6
1.65
1.02
2.77
2 213 216 3 1.41 58.1 56 2.1 3.61
3 204 200 4 1.96 60.1 58 2.1 3.49
4 200 190 10 5 61.1 60 1.1 1.80
5 209 209 0 0 60.4 57.5 2.9 4.8
6 195 200 5 2.56 57.1 56 1.1 1.93
Discussion of the results:
For GSM
● While achieving target shrinkage by existing 20G machines,
STARFISH calibration should be considered as +/-4.83 or +/-
2.38%
For Width
● While achieving target shrinkage by existing 28G machines,
STARFISH calibration should be considered as +/-1.65 or +/-
2.77%
International Journal of Engineering & Technology IJET-IJENS Vol: 11 No: 01 138
117801-6464 IJET-IJENS © February 2011 IJENS
I J E N S
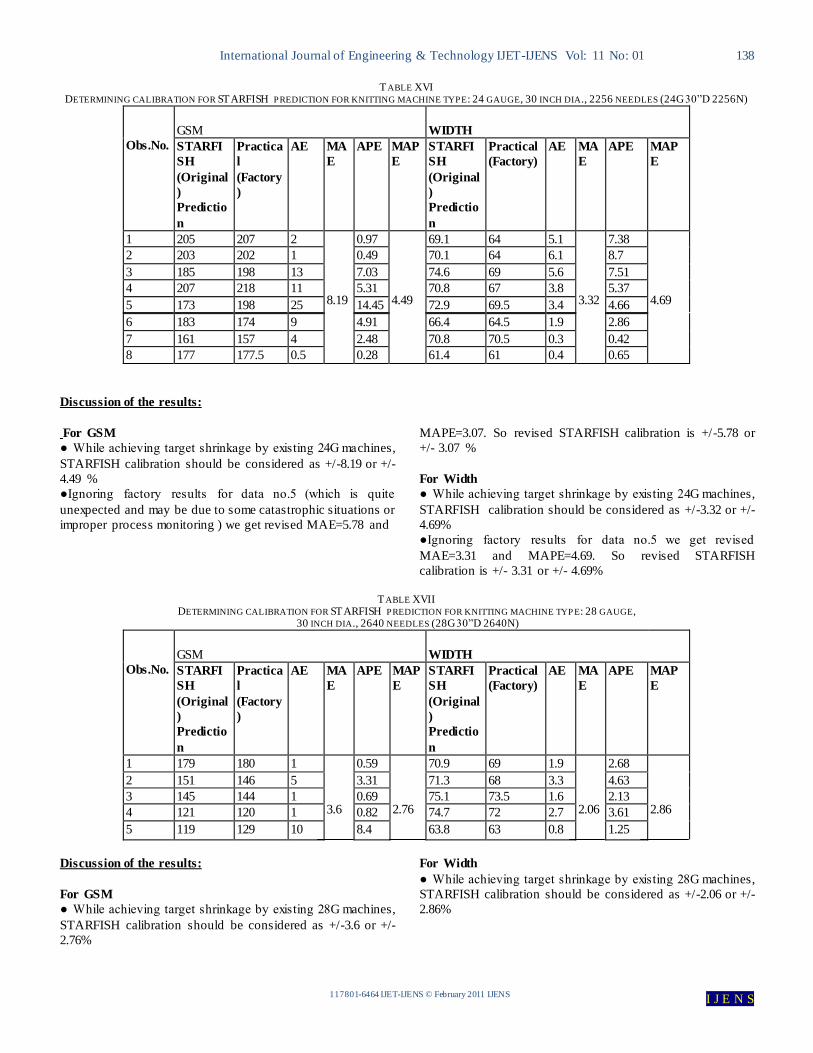
T ABLE XVI DETERMINING CALIBRATION FOR STARFISH PREDICTION FOR KNITTING MACHINE TYPE: 24 GAUGE, 30 INCH DIA., 2256 NEEDLES (24G 30”D 2256N)
Obs.No.
GSM
WIDTH
STARFI
SH
(Original
)
Predictio
n
Practica
l
(Factory
)
AE MA
E
APE MAP
E
STARFI
SH
(Original
)
Predictio
n
Practical
(Factory)
AE MA
E
APE MAP
E
1 205 207 2
8.19
0.97
4.49
69.1 64 5.1
3.32
7.38
4.69
2 203 202 1 0.49 70.1 64 6.1 8.7
3 185 198 13 7.03 74.6 69 5.6 7.51
4 207 218 11 5.31 70.8 67 3.8 5.37
5 173 198 25 14.45 72.9 69.5 3.4 4.66
6 183 174 9 4.91 66.4 64.5 1.9 2.86
7 161 157 4 2.48 70.8 70.5 0.3 0.42
8 177 177.5 0.5 0.28 61.4 61 0.4 0.65
Discussion of the results:
For GSM
● While achieving target shrinkage by existing 24G machines,
STARFISH calibration should be considered as +/-8.19 or +/-
4.49 %
●Ignoring factory results for data no.5 (which is quite
unexpected and may be due to some catastrophic situations or
improper process monitoring ) we get revised MAE=5.78 and
MAPE=3.07. So revised STARFISH calibration is +/-5.78 or
+/- 3.07 %
For Width
● While achieving target shrinkage by existing 24G machines,
STARFISH calibration should be considered as +/-3.32 or +/-
4.69%
●Ignoring factory results for data no.5 we get revised
MAE=3.31 and MAPE=4.69. So revised STARFISH
calibration is +/- 3.31 or +/- 4.69%
T ABLE XVII
DETERMINING CALIBRATION FOR STARFISH PREDICTION FOR KNITTING MACHINE TYP E: 28 GAUGE, 30 INCH DIA., 2640 NEEDLES (28G 30”D 2640N)
Obs.No.
GSM
WIDTH
STARFI
SH
(Original
)
Predictio
n
Practica
l
(Factory
)
AE MA
E
APE MAP
E
STARFI
SH
(Original
)
Predictio
n
Practical
(Factory)
AE MA
E
APE MAP
E
1 179 180 1
3.6
0.59
2.76
70.9 69 1.9
2.06
2.68
2.86
2 151 146 5 3.31 71.3 68 3.3 4.63
3 145 144 1 0.69 75.1 73.5 1.6 2.13
4 121 120 1 0.82 74.7 72 2.7 3.61
5 119 129 10 8.4 63.8 63 0.8 1.25
Discussion of the results:
For GSM
● While achieving target shrinkage by existing 28G machines,
STARFISH calibration should be considered as +/-3.6 or +/-
2.76%
For Width
● While achieving target shrinkage by existing 28G machines,
STARFISH calibration should be considered as +/-2.06 or +/-
2.86%
International Journal of Engineering & Technology IJET-IJENS Vol: 11 No: 01 139
117801-6464 IJET-IJENS © February 2011 IJENS
I J E N S
10. APPLYING CALIBRATION PRACTICALLY:
ACHIEVING TARGET SHRINKAGES
Now the question arises-how one should compare the practical
outputs with STARFISH as it is impossible to guess before
production what shrinkage value will be obtained from the
finished product. The answer lies on the mathematical
definition of shrinkage. It is well known that GSM, width and
shrinkages are dependent on knitting variables. One cannot
alter them without changing knitting variables but conditional
adjustments could be made with the help of finishing
technology. For example, if a finished fabric sample has a
length of 200 cm and width of 100 cm showing shrinkage 7%
Х 2% then one can say that fabric sample will show 5%Х5%
shrinkage if length and width are adjusted to (200-200X
0.07)X (100/95) and (100-100X 0.02)X (100/95) i.e. 195.79
cm and 103.16 cm. As consumers and so customers always
take shrinkage as the most rigid issue one has to adjust the
shrinkage level to customer's standard (e.g.5%Х5% for Plain
Jersey) before predicting through calibrated STARFISH. In
this way one can also avoid storing so many regression
equations for GSM and width keeping the most preferred
ones.
11. CONCLUSION OF THE WORK
The results of analysis obtained from this thesis work are:
1. STARFISH prediction system can be explained through a
multiple regression model very satisfactorily. The values of R2
and R2
adj found through the regression analysis lie above 0.95
both for GSM and Width. This means that the regression
models can be used as a substitute of this software very
effectively for any type (gauge) of knitting machine.
2. As STARFISH predictions may not coincide with a
particular factory result, some standard statistical measures
like MAE , MAPE may be adopted to determine the error
range as a part of STARFISH customization .During this
project thesis MAE and MAPE for each gauge machine of
Beximco Knitting Limited were calculated and the findings
are summarized below.
i) While using 18G machines , MAPE for STARFISH
would lie within 2.5% in case of GSM and within
3.3% in case of width
ii) While using 20G machines , MAPE for STARFISH
would lie within 2.4% in case of GSM and within
2.8% in case of width .
iii) While using 24G machines , MAPE for STARFISH
would lie within 3.1% in case of GSM and within
4.7% in case of width .
iv) While using 28G machines, MAPE for STARFISH
would lie within 2.8 % in case of GSM and within
2.9% in case of width.
12. END WORDS
Although cotton-knit fabrics have been manufactured for
decades, prediction of GSM, width and shrinkage is still
regarded as the most widespread and difficult problem with
the performance of such fabrics. In fact, very few people in the
industry know how to calculate the weight, width and
shrinkage after dyeing and finishing of a given quality of
knitted fabric before it has ever been manufactured. The result
is that, all over the world, product development of cotton
knits is carried out on a “ trial and error” basis followed by
adjustment and re-adjustment during successive batches of
bulk production. By customization of STARFISH
Technology, the factory management of a knit plant can save a
great deal of time and money by answering many questions
and eliminating unworkable ideas before financial, physical
and human resources are committed. As shown in this work,
the production management of Beximco Knitting Limited now
can predict satisfactorily about its factory outputs with the
help of calibrated STARFISH results. Though the calibration
was done only for Plain Jersey fabric of medium deep shade
but the calibration procedure is similar for all types of cotton-
knitted fabric of every shade. Again the regression model of
STARFISH software, developed in this work, would be a
fantastic tool for a knit-manufacturer as he can consult it
confidently outside of the computer desk. Though calibration
task involved in this work was based on limited data, the
factory management can utilize the software to find what
GSM and width will be derived from a typical knitting
machine for a particular dyed fabric. The predictions would be
more accurate if the management generates more STARFISH
recommended data for upgrading calibrations. As the last
words it must be remembered that STARFISH does not
remove the need for production of a sample prior to full-scale
manufacturing. So it is necessary to make a trial piece or two
and have them processed. One needs to make sure that they
conform to what is expected by taking measurements. Then he
should get the customer to approve the samples, examining
both performance and aesthetics. Also during full-scale
production, samples from the bulk should be tested. The
customer is demanding for a particular output and the
manufacturer can not go without submitting practically what
the customer wants.
ACKNOWLEDGMENTS
The present work was supported by Beximco Knitting
Limited.The authors would like to thank the employees of
Beximco Knitting Limited for their co-operative hands.
REFERENCES [1] STARFISH Manual and the software (version 5.03)-Cotton Technology
International (CTI); U.K., 1992 [2] The STARFISH Approach to High Quality Cotton Knitgoods (User-
manual Version 88:1)-International Institute for Cotton (IIC); U.K.,
1988 [3] The Production of High Quality Cotton Knitgoods-UNIDO Seminar
Report; U.K., 1984
[4] Brackenbury,T.: Knitted Clothing Technology -1st Edition,Blackwell
Science Limited;U.K.,1992 [5] Spencer,D.J.: Knitting Technology -3
rd Edition, Woodhead Publishing
Limited; U.K., 2001
[6] Eppen,G.D,Gould,F.J,Schmidt,C.P.,Moore,J.F.,Weatherford:Introductory Management Science-5
th Edition,Decisioneering Inc.;U.S.,1998
[7] Montgomery, Douglas C: Design and Analysis of Experiments-5th
Edition, John Wiley and Sons, Inc., U.S., 2001.
[8] Mackridakis,S,Wheel Wright,S.C.,Mcgee,V.E.:Forecasting :Methods and Application -2
nd Edition, J ohn Wiley and Sons, Inc.,U.S