customer service expectations in retail banking in africa
TRANSCRIPT

Research Report
Customer Service Expectations in Retail Banking in Africa
Diedré Möller
A Research Report submitted to the Faculty of Commerce, Law and
Management, University of the Witwatersrand, Johannesburg, in partial
fulfilment of the requirements for the degree of Master of Business
Administration.
Johannesburg July 2007
ABSTRACT
Customer satisfaction and retention are critical for retail banks. Service quality
is a major determinant of customer satisfaction, and is increasingly being seen
as a key strategic differentiator within the financial services sector worldwide.
However, little is known about service quality in an African context for retail
banking.
This research assesses customer expectations based on service quality factors
for retail banks across ten countries in Africa. Specifically, the objectives are to
determine whether cross-national differences in customer service expectations
exist in the African retail banking sector, what the relative importance of key
service dimensions in African retail banking are, and whether these service
expectations are constant over time.
A questionnaire based survey of 4035 respondents across ten African countries
was used. The determinants of external service quality were identified, which
include service quality dimensions and respective underlying attributes. The
SERVQUAL model developed by Parasuraman, Zeithaml & Berry (1990) was
adopted for modelling the data. The results were rescaled to interval data and
then analysed by way of ANOVA testing, t-testing and rank ordering.
The research shows, with the exception of the Responsiveness service
expectation dimension, that there are no commonalities of service expectations
among the African countries of this study. The implications of this are significant
for managers of multinational retail banks in Africa wishing to improve the
quality of service delivery.
The Responsiveness service expectation dimension was found to consistently
be the most important expectation across all countries. Thereafter, the relative
importance of subsequent service dimensions varied considerably for each
country, but, on average, ranked as follows: Responsiveness, Reliability,
Tangibles, Assurance and, finally, Empathy.

For most countries the underlying service attributes of efficient staff, shorter
queues, service reliability and convenient locations are most important to
customers. Furthermore, these attributes appeared to be increasingly important
over time. Any efforts to increase the speed of processing information and
customers are likely to have an important and positive effect on customer
satisfaction.
The results suggest that core dimensions such as responsiveness (driven by
staff efficiency and shorter queues), and reliability (performing dependably and
accurately) are more important while relational issues surrounding assurance
and empathy are of less importance.
Insignificant attributes with a below average importance included appearance of
facilities, providing a welcoming environment, after sales service, good advice,
good product knowledge, feedback on processes, feedback provided timeously,
and building long term relationships.
Finally, the research demonstrates that service expectations in Africa are not
static. Service expectations do change over time, and this change is evident
over a relatively short period of time (< 1 year).
These findings emphasise the need for conducting frequent assessments of
customer expectations in order to proactively understand and address changing
needs in an effort to improve service quality, and ultimately customer
satisfaction and profitability.

DECLARATION
I, Diedré Möller, declare that this research is my own, unaided work. It is
submitted in partial fulfilment of the requirements for the degree of Masters of
Business Administration, University of the Witwatersrand, Johannesburg. It has
not been submitted for any degree or examination in this or any other university.
Diedré Möller
30 July 2007

DEDICATION
This research is dedicated to the wonderful memories of my Father,
Anton Möller (1949 – 1991)
ACKNOWLEDGEMENTS
My sincere thanks and appreciation to the following people:
Alana Moller, Anne Du Plessis, Michael Franze and Carl Grim, for your
incredible wisdom, leadership and unremitting love.
Dr. Geoff Bick, and Dr. Anthony Stacey of the University of the Witwatersrand,
Graduate School of Business Administration.
This research would not have been possible without their support, guidance and
mentorship.

i
TABLE OF CONTENTS
1 INTRODUCTION.........................................................................1
1.1 PURPOSE OF STUDY ........................................................................................1 1.2 CONTEXT OF STUDY ........................................................................................2 1.3 PROBLEM STATEMENT .....................................................................................2
1.3.1 SUB-PROBLEM ONE:.............................................................................................. 2 1.3.2 SUB-PROBLEM TWO: ............................................................................................. 3 1.3.3 SUB-PROBLEM THREE: .......................................................................................... 3
1.4 SIGNIFICANCE OF STUDY..................................................................................3 1.5 DELIMITATIONS AND LIMITATIONS......................................................................3
1.5.1 DELIMITATIONS ..................................................................................................... 3 1.5.2 LIMITATIONS ......................................................................................................... 4
2 LITERATURE REVIEW ..............................................................5
2.1 INTRODUCTION ................................................................................................5 2.2 CUSTOMER SATISFACTION ...............................................................................5 2.3 SERVICE QUALITY AND THE SERVICE-PROFIT CHAIN..........................................6 2.4 SERVICE QUALITY AS A DIFFERENTIATOR..........................................................9 2.5 CROSS-NATIONAL DIFFERENCES IN SERVICE EXPECTATIONS ...........................10
2.5.1 CONCLUSION ...................................................................................................... 12 2.6 SERVICE QUALITY AND SERVICE EXPECTATIONS .............................................13
2.6.1 MANAGING CUSTOMER EXPECTATIONS.................................................................. 13 2.6.2 MEASURING SERVICE QUALITY AND CUSTOMER EXPECTATIONS ............................... 16 2.6.3 SERVICE QUALITY EXPECTATIONS IN THE RETAIL BANKING SECTOR .......................... 23 2.6.4 CONCLUSION ...................................................................................................... 24
2.7 CHANGES IN SERVICE EXPECTATIONS OVER TIME ...........................................25 2.7.1 CONCLUSION ...................................................................................................... 25
2.8 SUMMARY OF RESEARCH PROPOSITIONS........................................................25 2.8.1 PROPOSITION 1................................................................................................... 25 2.8.2 PROPOSITION 2................................................................................................... 26 2.8.3 PROPOSITION 3................................................................................................... 26
3 RESEARCH METHODOLOGY ................................................27
3.1 RESEARCH DESIGN .......................................................................................27 3.2 POPULATION AND SAMPLE .............................................................................31
3.2.1 POPULATION....................................................................................................... 31 3.2.2 SAMPLE.............................................................................................................. 33
3.3 DATA COLLECTION ........................................................................................34 3.4 DATA ANALYSIS AND INTERPRETATION............................................................36 3.5 VALIDITY AND RELIABILITY..............................................................................38
3.5.1 EXTERNAL VALIDITY............................................................................................. 38 3.5.2 INTERNAL VALIDITY.............................................................................................. 39 3.5.3 RELIABILITY ........................................................................................................ 40

ii
4 PRESENTATION, ANALYSIS AND INTERPRETATION OF RESULTS...........................................................................................41
4.1 DEMOGRAPHIC DATA .....................................................................................41 4.2 CROSS NATIONAL DIFFERENCES ....................................................................43 4.3 IMPORTANCE RANKING OF SERVICE DIMENSIONS AND ATTRIBUTES...................46
4.3.1 SIGNIFICANCE OF ATTRIBUTE MEANS.................................................................... 53 4.4 CHANGES IN SERVICE EXPECTATIONS OVER TIME (Q1 AND Q4 2006)..............62
5 CONCLUSIONS AND RECOMMENDATIONS ........................66
5.1 RESPONSES TO PROPOSITIONS......................................................................66 5.1.1 RESEARCH PROPOSITION 1:................................................................................. 66 5.1.2 RESEARCH PROPOSITION 2:................................................................................. 67 5.1.3 RESEARCH PROPOSITION 3:................................................................................. 71
5.2 RECOMMENDATIONS TO ORGANISATIONS........................................................73 5.3 RECOMMENDATIONS FOR FUTURE RESEARCH.................................................74
REFERENCES...................................................................................75
APPENDIX A: INTERVIEW QUESTIONNAIRES..............................84
Q4 2006 INTERVIEW QUESTIONNAIRE, (15 SERVICE ATTRIBUTES) ...............................84 Q1 2006 INTERVIEW QUESTIONNAIRE, (11 SERVICE ATTRIBUTES) ...............................85
APPENDIX B: DETAILED PRESENTATION OF RESULTS ............86
APPENDIX B.1: SUMMARY STATS – Q4 2006 .............................................................86 APPENDIX B.2: SUMMARY STATS – Q1 2006 .............................................................90 APPENDIX B.3: ONE-WAY ANOVA TESTING – Q4 2006 ............................................93 APPENDIX B.4: T TEST: SIGNIFICANCE OF COUNTRY MEANS – Q4 2006 .....................98 APPENDIX B.5: T TEST: SIGNIFICANCE OF DIFFERENCES BETWEEN COUNTRY MEANS
OVER TIME (Q1 – Q4 2006).........................................................................102
APPENDIX C: DATA FREQUENCY TABLES ................................105
APPENDIX C.1: DATA FREQUENCY TABLES – Q4 2006.............................................105 APPENDIX C.2: DATA FREQUENCY TABLES – Q1 2006.............................................109
iii
LIST OF TABLES
TABLE 1: SERVQUAL DIMENSIONS..........................................................................19 TABLE 2: DEFINITIONS OF SERVQUAL DIMENSIONS .................................................20 TABLE 3: CLASSIFICATION OF ATTRIBUTES FOR RETAIL BANKS....................................22 TABLE 4: RANKING OF SERQUAL DIMENSIONS BY CUSTOMERS IN THE RETAIL BANKING
SECTOR........................................................................................................24 TABLE 5: MAPPING OF SERVICE ATTRIBUTES TO SERVQUAL DIMENSIONS ................29 TABLE 6: SURVEYED COUNTRIES AND RESPECTIVE RETAIL BANKS..............................32 TABLE 7: SAMPLE SIZE BY COUNTRY .........................................................................33 TABLE 8: QUESTIONNAIRE TRANSLATION BY COUNTRY ...............................................35 TABLE 9: RESULTS OF ONE-WAY ANOVA, Q4 2006 .................................................45 TABLE 10: IMPORTANCE RANKING OF OVERALL MEANS, BY SERVICE DIMENSIONS AND
ATTRIBUTES, Q4 2006 ..................................................................................47 TABLE 11: IMPORTANCE RANKING OF STANDARDISED MEANS, BY COUNTRY..................52 TABLE 12: SIGNIFICANCE OF ATTRIBUTE MEANS BY COUNTRY, Q4 2006.....................55 TABLE 13: T-TEST FOR SIGNIFICANCE OF DIFFERENCES BETWEEN OVERALL SERVICE
ATTRIBUTE MEANS OVER TIME (Q1 - Q4 2006) ................................................63 TABLE 14: T-TEST FOR SIGNIFICANCE OF DIFFERENCES BETWEEN COUNTRY ATTRIBUTE
MEANS OVER TIME (Q1 - Q4 2006) .................................................................64 TABLE 15: IMPORTANCE RANKING OF SERQUAL DIMENSIONS...................................67 TABLE 16: IMPORTANCE RANKING OF SERVICE ATTRIBUTES .......................................69 TABLE 17: IMPORTANCE RANKING OF SERVICE ATTRIBUTES – Q1 2006 VS Q4 2006...71 TABLE 18: SIGNIFICANT CHANGES IN MEAN IMPORTANCE BETWEEN Q1 2006 – Q4 2006
....................................................................................................................72
i
LIST OF FIGURES FIGURE 1: THE SERVICE-PROFIT CHAIN.......................................................................8 FIGURE 2: EXPECTATIONS MANAGEMENT MODEL.......................................................15 FIGURE 3: SERVICE GAP MODEL OF THE SERVICE PROCESS ......................................17 FIGURE 4: CLASSIFICATION OF SERVQUAL SERVICE DIMENSIONS ............................21 FIGURE 5: DATA ANALYSIS SPIRAL ............................................................................38 FIGURE 6: RESPONDENT REPRESENTATION BY COUNTRY, Q1 2006 ...........................42 FIGURE 7: RESPONDENT REPRESENTATION BY COUNTRY, Q4 2006 ...........................42 FIGURE 8: RESPONDENT REPRESENTATION BY BANK, Q4 2006..................................43 FIGURE 9: IMPORTANCE RANKING OF POSITIVE OVERALL MEANS BY SERVICE
DIMENSION, Q4 2006 ....................................................................................48 FIGURE 10: SIGNIFICANT SERVICE DIMENSIONS AND ATTRIBUTES FOR BOTSWANA ......57 FIGURE 11: SIGNIFICANT SERVICE DIMENSIONS AND ATTRIBUTES FOR EGYPT .............57 FIGURE 12: SIGNIFICANT SERVICE DIMENSIONS AND ATTRIBUTES FOR GHANA ............58 FIGURE 13: SIGNIFICANT SERVICE DIMENSIONS AND ATTRIBUTES FOR KENYA .............58 FIGURE 14: SIGNIFICANT SERVICE DIMENSIONS AND ATTRIBUTES FOR MAURITIUS.......59 FIGURE 15: SIGNIFICANT SERVICE DIMENSIONS AND ATTRIBUTES FOR SEYCHELLES....59 FIGURE 16: SIGNIFICANT SERVICE DIMENSIONS AND ATTRIBUTES FOR TANZANIA.........60 FIGURE 17: SIGNIFICANT SERVICE DIMENSIONS AND ATTRIBUTES FOR UGANDA ..........60 FIGURE 18: SIGNIFICANT SERVICE DIMENSIONS AND ATTRIBUTES FOR ZAMBIA ............61 FIGURE 19: SIGNIFICANT SERVICE DIMENSIONS AND ATTRIBUTES FOR ZIMBABWE .......61
- 1 -
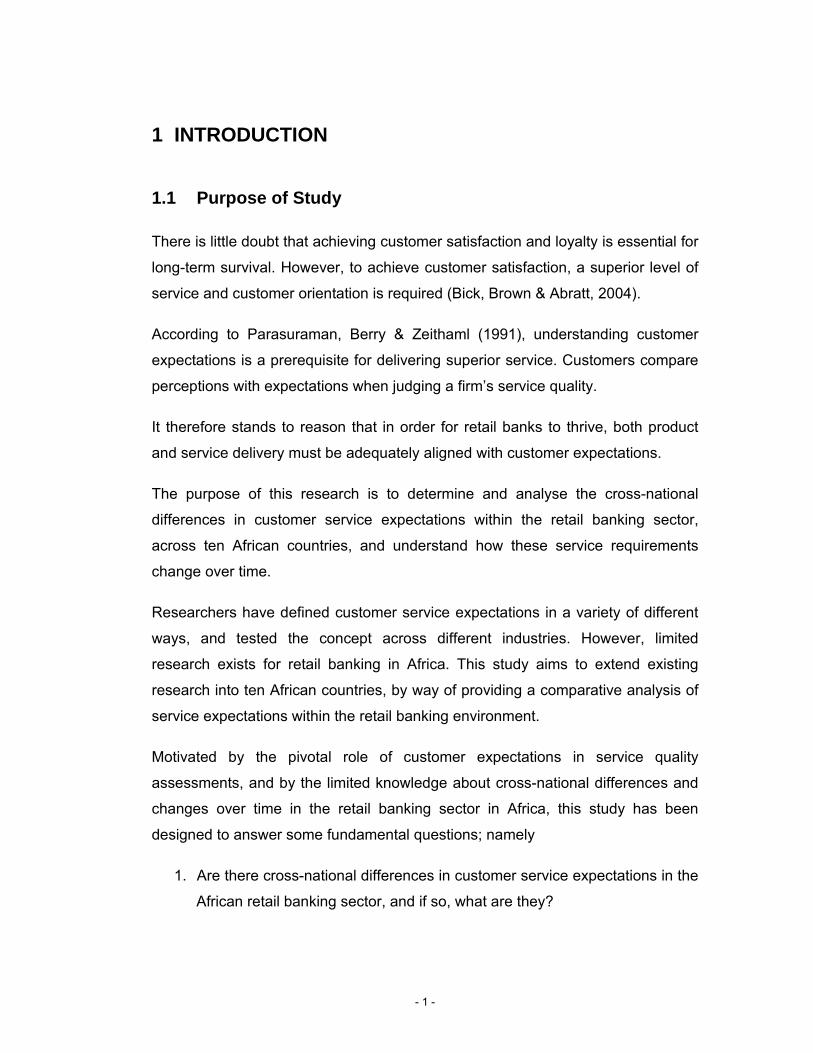
1 INTRODUCTION
1.1 Purpose of Study
There is little doubt that achieving customer satisfaction and loyalty is essential for
long-term survival. However, to achieve customer satisfaction, a superior level of
service and customer orientation is required (Bick, Brown & Abratt, 2004).
According to Parasuraman, Berry & Zeithaml (1991), understanding customer
expectations is a prerequisite for delivering superior service. Customers compare
perceptions with expectations when judging a firm’s service quality.
It therefore stands to reason that in order for retail banks to thrive, both product
and service delivery must be adequately aligned with customer expectations.
The purpose of this research is to determine and analyse the cross-national
differences in customer service expectations within the retail banking sector,
across ten African countries, and understand how these service requirements
change over time.
Researchers have defined customer service expectations in a variety of different
ways, and tested the concept across different industries. However, limited
research exists for retail banking in Africa. This study aims to extend existing
research into ten African countries, by way of providing a comparative analysis of
service expectations within the retail banking environment.
Motivated by the pivotal role of customer expectations in service quality
assessments, and by the limited knowledge about cross-national differences and
changes over time in the retail banking sector in Africa, this study has been
designed to answer some fundamental questions; namely
1. Are there cross-national differences in customer service expectations in the
African retail banking sector, and if so, what are they?
- 2 -
2. How stable are the service expectations? Are they constant or do they
change over time?
1.2 Context of Study
According to Reichheld & Sasser (1990) the cost of gaining a new customer is
about five times greater than the cost of retaining a current customer through the
use of relationship marketing. Newman & Cowling (1996: 106) noted that, "for UK
financial institutions, it is estimated that an increase of 5 per cent in customer
retention is potentially worth £100 million a year. Realisations such as these have
attracted in the mid-1990s the attention of directors of retail banks to measuring
their service quality and customer satisfaction and initiating major service quality
change programmes".
Understanding customer expectations in order to achieve service quality in Africa
has become a widespread objective, driven by some of the high growth
economies in developing countries and a general lack of information readily
available.
1.3 Problem Statement
The purpose of the research is to determine whether cross-national differences in
customer service expectations exist in the African retail banking sector, to identify
the relative importance of key service dimensions in African retail banking, and to
determine whether these service expectations are constant over time.
1.3.1 Sub-problem One:
To determine if there are cross-national differences in customer
service expectations in the African retail banking sector.

- 3 -
1.3.2 Sub-problem Two:
To identify the relative importance of service quality dimensions in
the African retail banking sector.
1.3.3 Sub-problem Three:
To determine whether these service expectations are constant over
time.
1.4 Significance of Study
The research provides an increased body of knowledge surrounding the service
expectations that underpin service quality, with specific focus on the African retail
banking sector. Furthermore, the adaptation of the SERVQUAL model by
Parasuraman, Berry & Zeithaml (1990) adds further insight to the measurement of
cross-national service quality in African retail banking. This is valuable, as the
increased knowledge base will enable future researchers to build upon the
concepts determined by this study.
The research also provides guidance for commercial bank managers wanting to
understand the dynamics of customer service expectations in Africa, and improve
the quality of service delivered, in order to enhance customer satisfaction and
customer loyalty.
1.5 Delimitations and Limitations
1.5.1 Delimitations
The scope of this study is limited to customers from the top five/ six commercial
banks within the following ten countries:
Botswana
Egypt

- 4 -
Ghana
Kenya
Mauritius
Seychelles
Tanzania
Uganda
Zambia
Zimbabwe
1.5.2 Limitations
The study is limited to retail banks, and excludes corporate and merchant banks.
Research was only conducted in principal cities of each country.
The research only explores service expectations of retail banking customers, and
does not explore the service gaps that exist between customer expectations and
customer experience (perceived services).

- 5 -
2 LITERATURE REVIEW
2.1 Introduction
The literature review investigates the following areas of interest;
- Customer satisfaction as a key success factor
- Service quality and the service profit chain
- The cross-national differences in service quality
- The relationship between service quality and service expectations
- Managing service expectations
- Measuring service quality expectations - models, classification and
dimensions
- Service expectations in retail banking
- Whether service expectations change over time
2.2 Customer Satisfaction
The African financial services sector has recently seen a growing intensity of
competition within the marketplace. No organisation can afford to overlook the
importance of customer satisfaction, which is essential for developing customer
loyalty and subsequent profitability within the banking sector.
Customer satisfaction is generally defined as the full meeting of one's
expectations (Oliver, 1980). According to East (1997), customer satisfaction is the
feeling or attitude of a customer towards a product or service after it has been
used. For example, if customers are satisfied with a particular service offering
after its use, then they are likely to engage in repeat purchase and try line
extensions. It is widely recognised that customer satisfaction plays a key role in
the formation of customers' future purchase intentions (Taylor & Baker, 1994).
Satisfied customers are also likely to share their favourable experiences with
others and thus engage in positive word of mouth advertising (Richens, 1983; File
& Prince, 1992). Furthermore, behaviours such as repeat purchase and word-of-
- 6 -
mouth directly affect the viability and profitability of a firm (Dabholkar, Thorpe &
Rentz, 1996).
A study conducted by Levesque & McDougall (1996) confirmed that unsatisfactory
customer service leads to a drop in customer satisfaction and willingness to
recommend the service to a friend. This would in turn lead to an increase in the
rate of switching by customers. Hallowell (1996) suggests that in the retail banking
sector, attainable increases in satisfaction could dramatically improve profitability.
Thus, it can be deduced that supplier performance is directly related to customer
satisfaction and loyalty, which is linked to customer retention and profitability.
Customer satisfaction and loyalty – secured through high-quality products and
services providing value for money for the consumer – are essential for long-term
survival, let alone long-term success (Parasuraman et al., 1985, 1990; Cina, 1990;
Reichheld & Sasser, 1990; Daniel, 1992; Shycon, 1992; Gale, 1994; Robledo,
1996).
Customer satisfaction, and related retention rates, can come from a range of
activities available to the firm. Levesque et al (1996) points out that for retail
banks, major gains in customer satisfaction are likely to come from improvements
in: (i) service quality; (ii) service features; and (iii) customer complaint handling.
For this investigation, service quality is used as the key measure towards
improving customer satisfaction.
2.3 Service Quality and the Service-Profit Chain
Customer satisfaction is often closely related to the measurement of service
quality (Cronin & Taylor, 1992; Anderson & Sullivan, 1993; Bitner & Hubbert,
1994; Taylor & Baker, 1994; Rust & Oliver, 1994; Levesque & McDougall, 1996).
While satisfaction is a feeling or an attitude of a customer towards a service after it
has been used, service quality relates to “the customers' overall impression of the
relative inferiority/superiority of the organization and its services” (Bitner &
Hubbert, 1994: 77).

- 7 -
Service quality is widely recognised as being a critical determinant for the success
of an organisation in today’s competitive environment. Any decline in customer
satisfaction due to poor service quality would be a matter of concern. “Consumers
being more aware of rising standards in service, prompted by competitive trends,
have developed higher expectations” (Marshall, Baker & Finn, 1998: 381).
As a result, there has been a growing interest in service quality issues, which are
both internal and external to an organisation. For example, Heskett, Jones,
Loveman, Sasser, & Schlesinger (1994) proposed a “service-profit chain” (SPC)
that integrates these perspectives into a model that establishes relationships
between internal service quality and employee satisfaction, external service
quality and customer satisfaction, and profitability.
The links in the SPC are as follows: profit and growth are stimulated primarily by
customer loyalty. Loyalty is a direct result of customer satisfaction. Satisfaction is
largely influenced by the value of services provided to customers. Value is created
by satisfied, loyal, and productive employees. Employee satisfaction, in turn,
results primarily from high-quality support services and policies that enable
employees to deliver results to customers. (See Figure 1).

- 8 -
Figure 1: The Service-Profit Chain
Operating Strategy and Service Delivery System
Internal Service Quality
Retention Repeat
Business Referral
Employee Satisfaction
Employee Productivity
Employee Retention
External Service Value
Customer Satisfaction
Customer Loyalty
Profitability
Revenue Growth
Service designed and delivered to meet targeted customers’ needs
Workplace design Job design Employee selection and development Employee rewards and recognition Tools for serving customers
Service concept; results for customers
Source: Heskett et al (1994)
The SPC perspective means that service quality should be an integrated
approach implemented along the entire supplier-customer chain, reflecting “a
basic business strategy that provides goods and services that completely satisfy
both internal and external customers by meeting their explicit and implicit
expectations” (Tenner & DeToro, 1992: 31).
The SPC provides a framework for understanding how a firm's operational
investments into service operations are related to customer perceptions and
behaviours, and how these translate into profits.
The popularity of the SPC framework is evident in the numerous case studies
reported by practitioners, the most notable being its application at Sears (Rucci,
Kirn & Quinn, 1998).

- 9 -
Rust, Zahorik & Keiningham (1995) proposed another framework; "Return on
Quality". This model is similar, although it differentiates itself by explicitly
modelling the cost and benefits of quality related investments. In the SPC
framework, the focus is on revenue rather than profitability, while the ROQ model
focuses on the cost (and return) of quality.
However, both the SPC and ROQ have several commonalities, the most notable
being an emphasis on driving the firm's operations based on statistical analyses of
customer surveys. Thus, customer surveys are used to identify key service
attributes (and expectations) that impact overall quality and retention, which in
turn drive financial outcomes. In this respect, they can provide actionable
guidance to management (Kamakura, Mittal, De Rosa & Mazzon, 2002).
There is a need for approaches that combine data such as measures of
operational inputs, customer perceptions and behaviours, and financial outcomes.
(Kamakura et al, 2002).
This research focuses on external customer service quality requirements, and
provides links between the SPC “internal service quality” and “customer value”, by
exploring how different countries might vary in the importance they place on
different service dimensions. This will enable managers to build customer
satisfaction, loyalty and corresponding profitability and growth.
2.4 Service Quality as a Differentiator
Quality is nowadays among the most critical aspects for the strategic
management of service firms (Robledo, 2001). Perceived quality reflects the
opinion of the customer regarding the superiority or global excellence of a product
or service (Zeithaml, Berry & Parasuraman, 1988)
According to Venetis & Ghauri (2004), service quality is regarded as one of the
few means of services differentiation, attracting new customers and increasing
market share. It is also viewed as an important means of customer retention. The
lifetime value of a loyal customer can be astronomical, especially when referrals

- 10 -
are added to the economics of customer retention and repeat purchases of related
products (Heskett et al, 1994)
In one case, a retail bank that increased its customer retention rates by 5 per cent
increased its profits by 85 per cent (Reichheld & Sasser, 1990). The cost of
gaining a new customer is about five times greater than the cost of retaining a
current customer through the use of relationship marketing. Newman & Cowling
(1996: 106) noted that, "for UK financial institutions, it is estimated that an
increase of 5 per cent in customer retention is potentially worth £100 million a
year.
The ability to provide a quality service will, therefore, improve a commercial banks’
ability to increase market share and profitability, whilst at the same time reducing
their existing customer’s switching propensity to another institution. Thus the
ability to consistently provide a high quality service offering may well act as a key
strategic differentiator.
Furthermore, successful organisations perusing quality have realised that quality
improvements must be focused where most productive (Keiningham, Zahorik &
Rust, 1995). Improved quality has a three-fold pay-off; namely reduced costs,
increased customer retention, and attracting new customers drawn to the quality
service provider (Keiningham et al, 1995).
In order to achieve service quality, it is important to identify key service
expectations and focus efforts at the most beneficial point in the customer value-
chain.
2.5 Cross-national Differences in Service Expectations
Johnson & Mathews (1997) emphasise the importance of understanding customer
expectations as a first step in improving service quality. Johnson, et al (1997) also
points out that expectations can vary according to culture, for example his study
“The influence of experience on service expectations” finds that "security" was

- 11 -
perceived as the highest expectation based on research undertaken in the UK,
whilst "reliability" was the most important quality dimension to US consumers.
While Webster (1989) discovered the importance of demographics on
expectations in the USA, Johnson et al (1997) argue that there are other factors
that could influence expectations which have yet to be investigated empirically.
Davidow & Uttal (1989: 25) note: “Service expectations are formed by many
uncontrollable factors, from the experience of customers … to a customer’s
psychological state at the time of service delivery.”
A number of authors have identified cross-national differences in service
expectations. Knight (1999: 356), identified the growing importance of
international services and highlighted the need for additional research into the
international marketing of services. In particular, he highlights “a key challenge is
overcoming hurdles associated with the unique characteristics of each country
and the fact that services are particularly prone to culture and other country-
specific influences. Services are fundamentally people-centered and are therefore
highly culture-sensitive." Stauss & Mang (1999) identified the possibility that the
perceived service encounter differs among customers from different cultures.
Stauss & Mang (1999) points out that there is hardly any prior discussion about
the fact that customers with different cultural backgrounds may have different
expectations toward service encounters and that they may perceive these
situations differently.
Smith & Reynolds (2001: 405) state that "Cultural differences may also explain
variations in consumers' reported perceptions of a service".
The importance of taking cross-national differences in service expectations into
consideration when designing and implementing a marketing strategy is critical for
multinational companies expanding into new markets or facing increasing
competition in existing international operations. Lovelock (1999) shows that in
developing a transnational service strategy, management must decide which, if
any, supplementary elements should be consistent across all markets and which
might be tailored to meet local needs, expectations and competitive dynamics.

- 12 -
Speece & Pinkaeo (2002) described the differences in customer expectations
based on ethnocentrism in Thailand compared to other countries. Espinoza (1999)
indicates that service managers need to be cognizant of the parts of the service
delivery experience that are open to cultural influences as contrasted with those
that remain stable across cultures. For example, in his study “Assessing the
cross-cultural applicability of a service quality measure”, he finds “responsiveness”
was the most important dimension for Quebecers while “tangibles” was the most
important for Peruvians. Differences in service expectations are relevant and need
to be considered when designing a marketing strategy.
In considering the growing importance of understanding cross-cultural difference,
it is useful to consider Tersine & Harvey (1998: 45), who points out that "Trade
liberalization, expanding global markets, and technology proliferation" require
organisations to "confront the need for a fundamental change in the way products
and services are designed, produced, and delivered to customers". This
importance is growing with the ongoing growth of global business and global
service business in particular. International trade in services has shown a growth
rate of 18% percent and today makes one-fifth of all world trade (World Trade
Organisation, 2005). Increasing globalisation results in more service companies
who conduct their business with customers of different cultures. For these
multinational companies it is becoming increasingly important to determine
whether there are differences among the service expectations and what form
these differences take.
2.5.1 Conclusion
In summary, the literature suggests that cross-national differences exist and are
key to designing a marketing strategy, however little research has been done in
Africa on this topic.
Proposition 1: Customer service expectations differ significantly between
countries in Africa

- 13 -
2.6 Service Quality and Service Expectations
In response to the growing importance of services in the worldwide economy, and
the recognition by firms for the need to compete on the service dimensions of the
augmented product, several researchers have examined the problems of
measuring and managing service quality (Bitner 1990; Parasuraman, Berry, &
Zeithaml 1985, 1988, 1990, 1991; Bolton & Drew 1991a, 1991b; Boulding, Klara,
Staelin & Zeithaml 1993, Robledo 2001).
2.6.1 Managing customer expectations
Customer expectations constitute an integral part of service quality evaluations. In
order to manage service quality, a strategic effort should be made at company
level to understand and manage their customer’s expectations and perceptions
regarding the quality of service delivered in daily interactions.
Robledo (2001) suggests that perceived quality constitutes two components;
namely customer perceptions and expectations.
Perceptions of the dimensions of service quality are viewed to be a function of a
customer’s prior expectations of what will and what should transpire during a
service encounter, as well as the customer’s most recent contact with the service
delivery system (Boulding, Klara, Staelin & Zeithaml, 1993).
Parasuraman et al (1991) and Robledo (2001) suggests that understanding
customer expectations is a prerequisite for delivering superior service, since
customers evaluate a firm’s service quality by comparing their perceptions of the
service with their expectations. As a result, Robledo (2001) proposed a model to
manage expectations (Figure 2).
The model depicts the relationship between customer expectations and
perceptions, and describes the different sources that can influence customer
expectations. It shows that in order to understand expectations, one needs to
investigate perceived service quality and the level of expectations (i.e. where

- 14 -
customer expectations may be too high relative to performance, or vice versa).
Doing this requires an understanding of the sources of customer expectations.
Sources of expectations:
Zeithaml et al. (1990) only mention five sources of expectations: word-of-mouth
communications, promotion, price, personal needs, and past experience. Robledo
(2001) argues that there are many others, namely; past experience, reputation,
informal and formal recommendations, personal needs, the promotional mix, and
price. According to Robledo (2001), the sources of expectations in the diagram
are ranked from most influential to least influential - on customer expectations.
Thus the influence of past experience on expectations is significant, whilst pricing
has the lowest influence. It is important to manage the attributes that will deliver
maximum benefit toward client’s expectations.
An understanding of customer expectations and the source of those expectations
is critical in managing perceptions and, therefore delivering service quality.

- 15 -
Figure 2: Expectations Management Model

- 16 -
2.6.2 Measuring service quality and customer expectations
Much literature exists on quality measurement. This section discusses the models
used to measure service quality and the classification of quality dimensions.
Service quality, as noted earlier, is generally used to measure customer’s
perception of services rendered (Zeithaml et al, 1990).
Available models: SERVQUAL vs. SERVPERF
The most common models used for measuring service quality are SERVQUAL,
developed by Parasuraman, Zeithaml & Berry (1985, 1988, 1990, 1993), and
SERVPERF, developed by and Cronin & Taylor (1992).
SERVQUAL provides a framework for analysing quality failures by identifying the
“service gaps” that arise, which cause a mismatch between customer expectation
and customer experience (perceived service), shown in Figure 3. SERVPERF is
based only on perceptions of performance, and is a performance-based measure
of the service delivered.

- 17 -
Figure 3: Service Gap Model of the Service Process
Management perception of expected service
Service quality specification
Service Delivery Communication to customer
Perceived service
Expected Service Gap 1
Gap 2
Gap 3
Gap 4
Gap 5
Source: Parasuraman, Zeithaml & Berry (1985)
SERVQUAL is currently the most widely reported framework, although it has
come under some criticism, highlighted by Cronin & Taylor (1992), Teas (1993),
and Nel, Pitt & Berthon (1997).
Parasuraman et al (1994) acknowledged the shortcomings of SERVQUAL, and
developed an augmented model, SERVQUAL; the Zone-of-Tolerance model. An
alternative model by Cronin & Taylor (1992) called SEVPERF was developed but
has not been widely adopted.

- 18 -
Quester & Romaniuk (1997) found that little difference existed between the
SERVQUAL and SERVPERF models, based on a comparative study conducted in
the Australian advertising industry.
According to Stone (2006), the dimensional stability of SERVQUAL model are
generally stable although not completely generic (Carman, 1990). The reliability
and validity of the SERVQUAL model were analysed in a South African context by
Boshoff & Nel (1992) and Nel et al (1997). Reliability, convergent validity, content
validity and nomological validity were retained. However, discriminant validity was
rejected, implying that regional factors differed. Carmen (1990), Buttle (1996), and
Nel et al (1997) found this to be a criticism of the SERVQUAL model.
Classification and dimensions of service quality
The classification of service quality has been addressed by a number of authors.
Most agree that service consists of an outcome and a process element, where
outcome is the achievement (or not) of some end by the customer (for example,
cash from a cash dispenser, an appropriate insurance policy or loan) and process
is the interaction between the customer and the service unit. The variation in
tangibility of the service, and the presence of the customer in the process,
frequently make it difficult to define the boundary between the two (Blanchard &
Galloway, 1994). Lehtinen & Lehtinen (in Le Blanc & Nguyen, 1988) identify the
three dimensions of service quality:
physical quality – equipment, premises, tangibles;
corporate quality – image and profile of the organization;
interactive quality – customer contact with service personnel and other
customers.
Grönroos (1988) identifies the five key determinants of service quality as:
professionalism and skills (technical (outcome related));
reputation and credibility (image related);
behaviour and attitudes;

- 19 -
accessibility and flexibility; and
reliability and trustworthiness.
The first of these are technical (outcome related) and the last four are functional
(process related).
The most extensively reported framework is that proposed by Parasuraman,
Zeithaml & Berry (1988); SERVQUAL, which measures the difference between
customers' perceptions of a service and their expectations of the service. The
model consists of five dimensions of service quality;
reliability
tangibles
responsiveness
assurance
empathy
These are a consolidation of ten dimensions as shown in Table 1. The definitions
of the SERVQUAL dimensions are discussed in Table 2.
Table 1: SERVQUAL Dimensions
SERVQUAL Components
Tangibles Tangibles
Reliability Reliability
Responsiveness Responsiveness
Assurance
Competence Courtesy Credibility Security
Empathy Access Communication Understanding
Source: Parasuraman, Zeithaml & Berry (1988)
- 20 -
Table 2: Definitions of SERVQUAL Dimensions
SERVQUAL Dimensions of
Service
Definition
Tangibles The appearance of physical facilities, equipment, personnel, and communication material
Reliability The ability to perform the promised service dependable and accurately
Responsiveness The willingness to help customers and provide prompt service
Assurance
The knowledge and courtesy of employees, and their ability to convey trust and confidence.
Competence Courtesy Credibility Security
Empathy
The caring individualised attention provided to the customer. Understanding Communication Access
Source: Parasuraman, Zeithaml & Berry (1988)
Blanchard & Galloway (1994) describe an alternative basis for modelling service
quality. As a result of the possible overlap and ambiguity in the SERVQUAL
dimensions, Blanchard et al (1994) proposed a model based on the three
dimensions of process/outcome, subjective/objective, and soft/hard. These are, in
the authors′ opinion “probably orthogonal”. Subjective/objective provides a
measure of the degree to which the quality of an aspect of service can be
objectively specified. For example, cash availability in machines is objective,
whereas “politeness of staff” is more subjective. The terminology Soft/hard
describes hard as physical aspects of the service while soft represents
interpersonal interaction. Typically, soft issues (e.g. staff attitude) are more difficult
to manage and measure (Vandermerwe, 1993).
The classification of these service dimensions relative to the SERVQUAL
dimensions are shown in Figure 4, and the classification of service attributes
based on the model is shown in Table 3 below.

- 21 -
Blanchard & Galloway (1994) demonstrate that process is far more important
than outcome in determining customer perceptions of service quality. They also
demonstrates that, objective and hard aspects in retail banking services are as
important as the subjective and soft aspects, but can be much more readily
identified and specified. Thus “addressing the hard and objective issues could
more readily provide, and monitor, a high quality service in a fairly prescriptive and
reproducible manner” (Blanchard et al, 1994: 14).
Figure 4: Classification of SERVQUAL Service Dimensions
Outcome Expectation
Process
AssurancePremises Professionalism and skill Accessibility and flexibility Reliability and trustworthiness Tangibles Reliability
Interactive behaviour and attitudes Responsiveness Empathy
Corporate image Reputation and credibility Tangibles
Source: Grönroos (1988)

- 22 -
Table 3: Classification of Attributes for Retail Banks
Process/ Subjective/ Soft/ Attribute
outcome objective hard
Privacy of discussions P 0 H
Politeness of counter staff P SIO S Willingness to help P SIO S Way staff treat customers P S S Cash in machines 0 0 H Speed and efficiency of transactions P/O SIO SIH Staff listen P S S Tills open at busy times P 0 H Staff available to help P SIO H Informing of account changes P/O 0 H Way mistakes are handled P/O S S Clarity of staff answers P/O S S Charges clear and explained 0 SIO SIH Attitude of bank when lending P S S Person for questions P 0 H Availability of enquiries desk P 0 H Return/replace cash card 0 0 H Queue at branch P SIO H Opening hours P 0 H Appearance of branch P SIO H Taking time to match product/need P SIO SIH Staff's product knowledge P 0 SIH Overdraft charges 0 0 H Ease of getting to branch P SIO H Queues at cash machines P SIO H Ease of understanding letters P SIO SIH Informed of progress of applications P/O SIO H Relevant direct mail 0 SIO H Telephones answered quickly P 0 H Getting right person on phone P 0 SIH Speed of mortgage confirmation P SIO H
Source: Blanchard & Galloway (1994)
Parasuraman et al (1990) points out that while reliability is largely concerned with
the service outcome, tangibles, responsiveness, assurance and empathy are
more concerned with the service process. He reported in his quantitative

- 23 -
research that regardless of the service being studied, customers have always
favoured reliability when asked to indicate the relative importance of the five
dimensions in judging service.
Zeithaml et al. (1990) also maintained that the “highest” expectation is reliability.
“Reliability of service comes in first regardless of how we measure salience, or
which specific service we study”. This has led them to the conclusion that because
reliability scores the highest, it must be the most important.
However, Johnson & Mathews (1997) found that “Security” comes out as the
highest service quality expectation. Other research undertaken in the UK has also
identified this discrepancy. For example, Mathews (1995) finds that reliability does
not come out as the most important expectation score, while Berry et al. (1985)
and Johnston (1995) identified responsiveness as an important factor.
2.6.3 Service quality expectations in the retail banking sector
The Parasuraman et al. (1990) study asked users of credit cards and retail
banking services, amongst users of other products/ services, to rate the
importance of each service dimensions. The results indicated that reliability of
service was the most important requirement of these financial service customers.
The second most important requirement for credit card customers was
responsiveness and bank customers’ empathy.
However Bitner, Booms & Tetreault (1990) identified employees’ willingness to
respond to a problem and their employees’ responsiveness to customer needs as
key factors in service quality. Avkiran (1994), in a study of an Australian trading
bank, found elements of credibility and responsiveness to be the most important.
According to a study in the UK by Blanchard & Galloway (1994), the breakdown of
the SERVQUAL dimensions also show responsiveness as the most important
service dimension (Table 4). Johnston (1997) later confirmed this, whom identified
responsiveness to be the most important service dimension in the UK retail
banking sector.

- 24 -
Table 4: Ranking of SERQUAL Dimensions by Customers in the Retail Banking Sector
SERVQUAL Dimension
Relative Weight
1. Responsiveness 100
2. Assurance 70
3. Empathy 52
4. Tangibles 47
5. Reliability 44
Source: Blanchard & Galloway (1994)
2.6.4 Conclusion
In summary, the literature suggests that service quality is derived from service
expectations, and highlights the importance of service quality as a strategic
differentiator in facilitating customer satisfaction and retention. Responsiveness
has been shown to be an important factor, supported by previous work from Berry
et al. (1985), Johnston (1995) and Bitner et al. (1990). Furthermore, Avkiran
(1994), Blanchard et al (1994), and Johnston (1997) recognise responsiveness as
the most important service dimension in the retail banking sector.
Proposition 2: The importance ranking of service dimensions in African retail
banking are:
1. Responsiveness
2. Assurance
3. Empathy
4. Tangibles
5. Reliability

- 25 -
2.7 Changes in Service Expectations over Time
Parasuraman et al (1994) found that neither expectations nor perceptions of
service quality are constant with time, acknowledging that these change with
experience. Supporting this, DeCarvalho & Leite (1999) argue that while desired
levels (expectations) are generally stable in the short term they do change with
accumulated experience. Adding to this, Buttle (1996) recognised that perceptions
do change with time and tend to be more situational in nature.
Quality of service is not an absolute concept. Quality of service changes with time,
experience and attitude, and can be linked to customer value (Woodruff, 1997).
2.7.1 Conclusion
The literature suggests that perceptions of service quality and related
expectations are therefore situational and do change over time.
Proposition 3: Customer service expectations in the African retail banking sector
change over time.
2.8 Summary of Research Propositions
In order to assess whether cross-national differences in customer service
expectations in the African retail banking sector exist, to determine the relative
importance of service attributes in retail banking across Africa, and to assess
whether these change over time, propositions based on the research sub-
problems and on the literature review were formulated as follows:
2.8.1 Proposition 1
Customer service expectations in retail banking differ significantly
between countries in Africa
This proposition is based on the research by Johnson & Mathews (1997), Webster
(1989), Davidow & Uttal (1989), Knight (1999), Stauss & Mang (1999), Smith &

- 26 -
Reynolds (2001), Lovelock (1999), and Speece & Pinkaeo (2002) who
acknowledge cross-national cultural differences.
2.8.2 Proposition 2
The importance ranking of the service dimensions in African retail
banking are:
1. Responsiveness
2. Assurance
3. Empathy
4. Tangibles
5. Reliability
Parasuraman et al. (1985, 1988, 1990, 1993, 1994), indicated that quality of
service delivered can be classified in five major dimensions, namely; tangibles,
reliability, responsiveness, assurance and empathy.
Responsiveness has been shown to be an important factor, supported by previous
work from Berry et al. (1985), Johnston (1995) and Bitner et al. (1990).
Furthermore, Avkiran (1994), and Johnston (1997) recognise responsiveness as
the most important service dimension in the retail banking sector. This proposition
is based on the research by Blanchard & Galloway (1994), who reported that
responsiveness was the most critical dimension for retail banks in the UK,
followed by assurance, empathy, tangibles, and reliability. The relative importance
of these attributes will be determined in the African retail banking context.
2.8.3 Proposition 3
Customer service expectations in the African retail banking sector
change over time
This proposition is based on the research by Parasuraman et al (1994), Buttle
(1996) and DeCarvalho & Leite (1999), who found that service quality perceptions
and related expectations are variable over time.

- 27 -
3 RESEARCH METHODOLOGY
This chapter describes the methodology that will be used to answer the research
propositions posed in the previous section. The chapter starts off with a
description of the chosen method and its implications for this research. The
research design, population description and sample selection are then discussed.
This is followed by descriptions of the processes used for data collection, analysis
and interpretation. The chapter is concluded with a discussion on validity and
reliability of the chosen research method.
3.1 Research Design
This research follows a quantitative research methodology based on the
functionalist paradigm in order to ensure consistency between the research
methodology and the nature of the study being undertaken.
Quantitative research using nomothetic commitments was best suited for this
research as the study follows on from previous empirical data (SERVQUAL,
Blanchard & Galloway (1994), which identifies what the key service attributes are
in retail banking. Hence a qualitative interpretive approach in order to capture the
subject’s perspectives is not required. Rather, the objective of the research
methodology was to ensure that the outcomes have a greater degree of reliability
and objectivity, and are less impressionistic, which can be achieved through the
usage of quantitative research (Denzin & Lincoln, 1998).
The measuring instrument was a survey questionnaire adapted from the
SERVQUAL model (Parasuraman et al, 1994) in order to ensure a valid construct.
The output from the adapted questionnaire plus the literature review formed the
basis of this research.
A comparative scaling technique applying a partial rank order scale was used in
the questionnaire to determine the top three most important service attributes (in
order of importance), out of fifteen attributes.

- 28 -
The use of rank ordering of survey items in the questionnaire is suitable since it is
both intuitive for respondents and is independent of any particular response scale.
However, a disadvantage of rank order scales is the complexity of rigorous
analysis (Stacey, 2006). In order to appropriately apply parametric statistics
(which assumes interval data), the ordinal data derived from this scaling technique
was rescaled using the algorithmic approach to analysing rank ordered survey
items (Stacey, 2006). This allowed for a more accurate estimation of the
population item means and standard deviations.
The data was collected commercially, commissioned by Barclays Bank PLC.
Barclays Bank is one of the largest retail banks in Africa, with branches in twelve
African countries.
The data was collected in Q1 2006 and Q4 2006 by Synovate (leading market
research consultants). The initial study was conducted under the supervision of
the researcher.
Banks, in seeking to provide a high quality service, should identify needs and
expectations and establish the way in which customers prioritise them (Blanchard
& Galloway, 1994). Parasuraman et al. (1990) proposes a model of the
determinants of service quality. The model provides a framework for analysing
quality failures by identifying the “service gaps” that arise, which cause a
mismatch between customer expectation and customer experience (perceived
service), shown in Figure 3. This study focuses purely on the understanding and
prioritisation of customer service expectations, which forms the fundamental base
level of the model.
The SERVQUAL model proposed by Parasuraman et al. (1990), as described in
the literature review is considered the most widely verified and applicable model
and was therefore used as a framework for the questionnaire design and
analysing the data. The SERVQUAL model has been applied to South African
conditions and found to be generally both valid and reliable (Boshoff & Nel, 1992;
Nel et al., 1997).

- 29 -
The questionnaire was adapted from the SERVQUAL dimensions i.e. reliability,
tangibles, responsiveness, assurance, and empathy. Table 5 below shows the
mapping of the fifteen service attributes to the SERVQUAL dimensions.
Table 5: Mapping of Service Attributes to SERVQUAL Dimensions
SERVQUAL dimensions of
Service
Definition Mapping of the SERVQUAL service dimensions to the questionnaire’s
15 service attributes
Appearance of facilities
Convenient locations Tangibles
The appearance of physical
facilities, equipment,
personnel, and
communication material
Provides a welcoming environment
Reliability The ability to perform the
promised service dependable
and accurately
Reliability – Able to perform service
dependably and accurately
Efficient staff
Shorter queues
Provides feedback on processes
Feedback is provided timeously
Responsiveness
The willingness to help
customers and provide
prompt service
Fast response time to information
requests
Friendly Staff
Good After sales service
Provides good advice
Assurance
The knowledge and courtesy
of employees, and their ability
to convey trust and
confidence.
- Competence
- Courtesy
- Credibility
- Security
Good product knowledge

- 30 -
Focus on building long term
relationships
Empathy
The caring individualised
attention provided to the
customer.
- Understanding
- Communication
- Access
Understands my personal banking
needs
The surveys comprised a structured questionnaire, administered face-to-face
using intercept interviews as the primary methodology.
The first part of the questionnaire addressed demographic data which will be used
for narrative purposes only.
The second part of the questionnaire used a partial rank order scale, which lists
fifteen key service attributes in accordance with the SERVQUAL requirements
(Parasuraman et al, 1994). Respondents were asked to rank the top three
attributes in order of importance.
A partial rank order scale is suitable for hypothesis testing once rescaled using the
algorithmic approach presented by Stacey (2006). Furthermore, it was selected in
order to avoid respondent fatigue. The task of rank ordering large numbers of
items can be unduly onerous for respondents, which has a negative impact on the
validity and reliability of the data (Stacey, 2006).
Hypothesis testing using analysis of variance (ANOVA) was used to compare the
means of ten different populations; where :
Ho: µ1 = µ2 = µ3 = µ4 = µ5 = µ6 = µ7 = µ8 = µ9 = µ10
Ha: At least one pair of means are not equal,
and therefore to accept or reject propositions.
Assumptions:
The samples must be independent random samples

- 31 -
The samples must be selected from normally distributed populations
Populations have the same standard deviations: σ²1 = σ²2 = σ²2
3.2 Population and Sample
3.2.1 Population
The targeted population for this study was limited to retail banking customers,
from the capital cities of the following ten countries and respective banks, listed
overleaf:
- 32 -
Table 6: Surveyed Countries and Respective Retail Banks
Access to the primary population was achieved by selected in-country market
research consultancy companies specialising in the financial sector. In-country
research vendors were coordinated from South Africa by a leading market
research group.
Country Bank 1 Bank 2 Bank 3 Bank 4 Bank 5 Bank 6
Botswana Barclays Bank
First National Bank
Standard Chartered Stanbic BBS
Egypt Barclays Bank MISR NSGB Citigroup HSBC CIB
Ghana Barclays Bank
Ecobank Standard Chartered
Ghana Commercial Bank SSB
Kenya Barclays Bank Standard
Chartered KCB Co-Operative Bank
National Bank of Kenya
Mauritius Barclays Bank
Mauritius Commercial Bank
State Bank Mauritius HSBC
First City Bank
Seychelles Barclays Bank
Seychelles Savings Bank
Nouvobanq MCB
Tanzania Barclays Bank
National Micro-financial Bank
Standard Chartered
Co-operative Rural Development Bank
National Bank of Commerce
Uganda Barclays Bank DFCU Bank
Standard Chartered Stanbic Nile Bank
Zambia Barclays Bank
Standard Chartered Stanbic Zanaco
Citibank
Zimbabwe Barclays Bank
Standard Chartered Stanbic
Zimbabwe Amalgamated Banking Group Zimbank Jewel Bank

- 33 -
3.2.2 Sample
A minimum sample of 75 surveys in Q1 2006 and 200 surveys in Q4 2006 with
retail banking customers in each country was carried out for the purposes of
obtaining data for this study.
Table 7: Sample Size by Country
Country Total No. Interviews Q1 2006
Total No. Interviews Q4 2006
Botswana 300 540
Egypt 150 315
Ghana 250 490
Kenya 300 550
Mauritius 200 380
Seychelles 75 200
Tanzania 150 250
Uganda 150 330
Zambia 250 490
Zimbabwe 250 490
Total 2075 4035
A random sample of retail banking customers was selected in each country by
bank branch intercepts. The above mentioned main retail banks in each country
were sampled.
Sample Selection
The use of some basic selection rules guided the intercepts. The interviews were
done mainly during the week. The day was then divided into time slots and a time
slot was randomly selected to start interviewing in. A person was intercepted
every nth minute for an interview to ensure randomness.

- 34 -
Sampling Substitution:
If a respondent was unwilling / unavailable to assist in the case of the intercept
interviewing, the interviewer was instructed to interview the next respondent
exiting the branch.
Sampling Contingency:
Some over-sampling was done for the surveys in order to meet the required
samples for each country. This catered for questionnaires which are incomplete.
This was managed with local suppliers to ensure standard errors (at 90% level of
confidence) at regional level.
Sampling Error
The phenomenon of sampling error is that there is unavoidable and random error
or difference between the true (unknown) population parameters and those
parameters which have been estimated or inferred from the sample (Stacey,
2006). In this case, the larger sample sizes ensured a better representation of the
population as a whole and hence reduce the potential for sampling error.
3.3 Data Collection
Since customer databases were not available for the envisaged samples, it was
necessary to use face-to-face interviews as a means of contact. This technique
allowed for a higher response rate and is more convenient for the respondent.
However, apart from the economical and logistical disadvantages of this
technique, it should be kept in mind that some respondents would still give biased
responses when face-to-face with a researcher. Furthermore, language translation
may reduce face validity.
Face-to-face intercept interviewing was conducted in every country. Respondents
were recruited in banking halls or as they leave the premises of the above
mentioned banks by first intercepting them and then conducting the face-to-face

- 35 -
interview. A short structured questionnaire not longer than 15 minutes was used.
Please refer to Appendix 1 which contains an outline of the questionnaire.
The following quality controls were put in place;
• Face-to-face briefings were done in every country; project representatives
were encouraged to meet fieldworkers.
• Pilot interviews were conducted in each country
• Five random questionnaires were faxed to Synovate/ Barclays South Africa
to check that questions are answered correctly and data input is correct
• Test data files were sent to South Africa after the first few interviews for
centralised checking of data input
• 20% telephonic back checks were conducted in every country
• Coding was centralised in South Africa to produce a standardised code
frame
• The interview / information quality was greatly enhanced as the interviews
could be conducted in English or the local language, depending on the
respondent’s preference. The questionnaires were translated into the
languages depicted in the table below:
Table 8: Questionnaire Translation by Country
Country Translation
Botswana English / Setswana Egypt Arabic Ghana English / Twi Kenya English / Kiswahili Mauritius English / French and Mauritian Creole Seychelles English / Seychelles Creole Tanzania English / Kiswahili Uganda English / No translation Zambia English / No translation Zimbabwe English / No translation

- 36 -
Research was conducted in accordance with the code of ethics prescribed
by the European Society for Opinion and Marketing Research (ESOMAR),
and the South African Marketing research Association (SAMRA).
3.4 Data Analysis and Interpretation
Respondents were required to rank order (in order of importance) the top three
most important service attributes relating to their bank, out of 15 service attributes
in total. The data was summarised by tabulating the frequency (and proportion) of
occurrence of each preference permutation.
Rank ordered data are only ordinal in nature because respondents give no
indication of the magnitude of the difference between consecutively ranked items.
However the use of parametric techniques using at least interval data are required
to compare mean rankings of the partially rank ordered survey items.
In order to overcome this, the algorithmic approach presented by Stacey (2006)
was used to estimate underlying parameters (means and standard deviations) of
survey items that have been partially rank ordered by respondents.
This approach enables researchers to take advantage of partial rank ordering
techniques that reduce respondent fatigue for large numbers of survey items,
while retaining a high degree of analytical rigour. The algorithm (Shotgun
stochastic parameter estimation algorithm) iteratively and asymptotically estimates
the population means and standard deviations of the 15 survey items from which
the observed data sample is drawn.
Once the mean and standard deviations are derived, the proposed methodology
makes use of hypothesis ANOVA testing, t-tests and importance ranking to
determine whether cross-national differences in service expectations exist, and
what service attributes proposed by retail banks are considered most important to
customers. Hypothesis t-testing is used to determine whether service expectations
are constant over time.

- 37 -
In summary, data analysis was conducted as follows:
- Tables were developed to capture response frequencies (and proportion) of
occurrence of each preference permutation
- The ordinal data derived from this scaling technique (partial rank order)
was rescaled using the algorithmic approach to analysing partial rank
ordered survey items (Stacey, 2006). This allowed for the estimation of the
population item means and standard deviations in order to perform
hypothesis testing
- Hypothesis ANOVA testing was used to understand if cross national
differences exist in service expectations
- Importance ranking of the question was conducted
- Hypothesis t-tests were then conducted on the standardised means. This
analysis identified what service attributes are significant within each
country, delineating what the differences and similarities in significant
service expectations are.
- Two sample hypothesis t-tests were carried out for each attribute in order
to determine the significance of differences between country means over
time
The above steps were integrated with Creswell’s data analysis spiral as described
in Leedy & Ormrod (2001:161).

- 38 -
Figure 5: Data Analysis Spiral
Source: Creswell (1998)
3.5 Validity and Reliability
Validity is concerned with whether the instrument (in this case surveys) “measures
what it is supposed to measure” (Leedy & Ormrod, 2001: 31) and whether it will
lead to valid conclusions about cross-national service expectations in retail
banking. Since quantitative survey research was conducted, the following issues
around validity are evident. These issues are addressed below in the discussion
on the various types of validity.
3.5.1 External validity
External validity refers to generalisability, i.e. the ability for the research to be
generalised across persons, settings and times.

- 39 -
Large sample sizes were used in conjunction with a random sampling
methodology which is probability based (Leedy & Ormrod, 2001), thus it is
possible to generalise the results of the study.
The author did not have direct control over the collection of the data, which may
be a limitation in the research. However quality controls were put in place (as
discussed above) in order to ensure validity.
3.5.2 Internal validity
Internal validity refers to the extent to which the instrument allows inferences
about the causal relationships between data elements (Leedy & Ormrod, 2001).
There are various types of internal validity, namely: content validity, construct
validity and criterion-related validity (Leedy & Ormrod, 2001). Content and
construct validity is relevant and therefore discussed here.
Content validity was addressed by ensuring that there were adequate questions to
completely cover all the relevant aspects identified in the literature review.
Questionnaire wording / understanding across different cultural boundaries may
weaken face validity. This was addressed by translating and conducting face-to-
face interviews in English or the home language, depending on the respondent’s
choice, in an effort to reduce misinterpretations.
Construct validity was addressed by means of questionnaire piloting. This ensured
that constructs were clear, unambiguous and did not result in bias as a result of
phrasing. Each construct is developed to add value to the survey, and is selected
to ensure convergence with the literature review.
The task of rank ordering large numbers of items can be unduly onerous for
respondents, which has a negative impact on the validity and reliability of the data
(Stacey, 2006). This was addressed by using partial rank ordering in the
questionnaire in order to reduce respondent fatigue.

- 40 -
3.5.3 Reliability
Reliability is defined as the extent to which similar research conducted in future
will result in similar outcomes (Leedy & Ormrod, 2001).
Equivalence: bias may be introduced by contact between researcher and
respondent. This was reduced by using a structured, closed questionnaire.
By constructing the survey questionnaire derived from the SERVQUAL model, as
well as the literature review, it was possible to enhance internal consistency
through the use of rank order scales (Leedy & Ormrod 2001) rather than content
analysis resulting from open questions. Errors of equivalence and stability were
also reduced since responses were selected from a limited range of clearly
defined service attributes.
The quality controls (discussed above) also ensured that the research is
administered consistently throughout all the countries.
A quantitative research methodology using a random sampling technique and
adequate sample sizes reduced the potential for sampling error and ensured that
the outcomes have a greater degree of reliability. Furthermore, by rescaling the
ordinal data using the algorithmic approach, the potential for type II error was
reduced.
A possible limitation was that the sample chosen was more heavily weighted
towards Barclay’s customers vs. the other bank’s customers, since the study was
commissioned by Barclays PLC. In addition, the study was only conducted in the
capital cities of each country.

- 41 -
4 PRESENTATION, ANALYSIS AND INTERPRETATION OF RESULTS
The results of the analysis are presented in this chapter. A more detailed
breakdown of the results is presented in Appendix B.
Section 4.1 provides a description of the demographic data. Thereafter, each
research problem is addressed. Section 4.2 addresses whether cross national
differences exist, by way of ANOVA testing. Section 4.3 discusses the relative
importance of service quality dimensions, using rank order and t-testing. This is
segmented by major service dimensions, individual service attributes, and by
country. The chapter is concluded with a discussion on changes in service
expectations over time (section 4.4), which tests for differences between two
means using a two sample t-test for Q1 2006 and Q4 2006.
4.1 Demographic Data
The distribution of respondents by country for Q1 and Q4 2006 is given in Figure 6
and Figure 7. Respondent proportions were not weighted according to country
population size. Seychelles represents the smallest proportion of respondents for
both surveys.
Sample sizes for all countries were large enough to ensure adequate
representation of the total population, thus reducing the potential for sampling
error.
A segmentation of respondent representation by Barclays bank vs. other banks is
given in Figure 8. This shows that the sample chosen is more heavily weighted
towards Barclay’s customers vs. the other bank’s customers.

- 42 -
Figure 6: Respondent Representation by Country, Q1 2006
Respondent Demographics by Country, Q1 2006
Botswana15%
Egypt7%
Ghana12%
Kenya14%
Mauritius10%
Seychelles4%
Tanzania7%
Uganda7%
Zambia12%
Zimbabwe12%
Figure 7: Respondent Representation by Country, Q4 2006
Respondent Demographics by Country, Q4 2006
Botswana13%
Egypt8%
Ghana12%
Kenya15%Mauritius
9%Seychelles
5%
Tanzania6%
Uganda8%
Zambia12%
Zimbabwe12%
Total Sample: 2075
Total Sample: 4035

- 43 -
Figure 8: Respondent Representation by Bank, Q4 2006
Respondent Demographics by Bank, Q4 2006
Barclays74%
Other Banks26%
Barclays Other Banks
4.2 Cross National Differences
For multinational companies, it is becoming increasingly important to determine
whether there are differences across countries in service expectations, and what
form these differences take.
Users of retail banking services were read a list of 15 service attributes relating to
their bank, and asked to rank the top three most important service attributes. The
data was summarised by tabulating the frequency (and proportion) of occurrence
of each preference permutation, as illustrated in Appendix C.
In order to apply parametric testing, the ordinal data derived from the partial rank
order was rescaled using the algorithmic approach to analysing partial rank
ordered survey items (Stacey, 2006). The shotgun stochastic parameter
estimation algorithm iteratively and asymptotically estimates the population means
and standard deviations of the 15 survey items from which the observed data
sample was drawn.
This allowed for the estimation of underlying parameters (population item means
and standard deviations) of partially ranked survey items in order to perform
hypothesis testing.

- 44 -
ANOVA testing on the rescaled standardised means and standard deviations was
used to determine if there are differences across the ten African countries in the
perceived importance for each attribute.
The results are based on the assumptions that each population is approximately
normally distributed and there are equal population variances. Central Limit
theorem can be used as the basis for normality due to large sample sizes. The
samples were independent and selected at random. A significance level of 5%
was used.
The findings in Table 9 below show that in all cases (15 attributes), the zero
hypothesis is reject based on the low p values. Thus, there is sufficient evidence
to indicate that for every service attribute, one or more of the population (country)
means are not equal to the others. Every attribute had some significant difference
between countries. This implies that different cultural groups give different
importance to service quality dimensions.
This finding supports the proposition that customer service expectations in retail
banking differ significantly between countries in Africa. It is therefore critical to
take cross-national differences into consideration when designing and
implementing a marketing strategy for multinational companies. In order to
achieve this, country-specific customer expectations must be investigated and
prioritised as a first step towards improving service quality.

- 45 -
Table 9: Results of One-Way ANOVA, Q4 2006
Service Attributes Sample Means P Value Bots Egypt Ghana Kenya Maur Seych Tanz Ugan Zam Zim 1. Efficient staff 1.101 0.988 0.800 0.779 0.518 0.882 0.864 0.836 0.905 0.769 0.000
2. Shorter queues 0.416 0.925 0.403 0.249 0.409 0.259 0.544 0.278 0.245 0.399 0.000
3. Convenient locations 0.015 0.161 0.354 0.481 -0.065 -0.068 0.285 0.475 0.419 0.318 0.000
4. Friendly staff 0.022 0.117 0.586 0.069 0.299 0.019 0.480 0.203 0.191 -0.141 0.000
5. After sales service -0.313 0.048 -0.360 -0.282 0.043 0.513 -0.453 -0.343 -0.201 -0.165 0.000
6. Response time to info requests -0.066 0.428 0.165 0.322 0.303 0.510 -0.119 0.094 0.037 0.167 0.000
7. Reliability 0.419 0.066 0.234 0.761 0.114 -0.022 0.097 0.342 0.422 0.610 0.000
8. Appearance of facilities -0.357 -0.477 -0.303 -0.250 -0.173 -0.370 -0.168 -0.375 -0.326 -0.571 0.000
9. Building long term relationships -0.356 -0.222 -0.249 0.088 -0.257 -0.254 -0.224 -0.190 0.030 0.018 0.000
10. Understands personal banking needs 0.236 0.352 -0.080 0.383 0.173 0.176 -0.299 0.304 0.127 0.438 0.000
11. Provides good advice -0.232 -0.348 -0.255 -0.166 0.063 0.269 -0.399 -0.324 -0.172 -0.318 0.000
12. Provides a welcoming environment -0.487 -0.810 -0.447 -0.542 -0.177 -0.266 -0.299 -0.672 -0.288 -0.799 0.000
13. Provides feedback on processes -0.178 -0.204 -0.241 -0.190 -0.169 -0.044 -0.004 -0.334 -0.585 0.089 0.000
14. Feedback is provided timeously -0.181 -0.716 -0.167 -1.023 -0.534 -0.838 0.059 0.109 -0.446 -0.269 0.000
15. Good product knowledge -0.040 -0.309 -0.440 -0.677 -0.547 -0.766 -0.364 -0.404 -0.359 -0.546 0.000
Note assumptions:
The data has been standardised, therefore the overall mean = 0, and the overall standard deviation = 1
Each of the samples are drawn from a normal population
Central Limit theorem can be used as the basis for normality due to large sample sizes
The samples are independent and selected at random
Variance (or standard deviation) of the items (populations) are equal
Significance level: 5% (α = 0.05)

- 46 -
4.3 Importance Ranking of Service dimensions and Attributes
In order to better understand what form these cross-national differences take, the
following tests were carried out in order to highlight the similarities and differences in
customer service expectations.
Respondents ranked in descending order (i.e. first most important, second most
important and third most important) the top three most important service attributes
relating to their bank, out of 15 service attributes in total. The data was summarised by
tabulating the frequency (and proportion) of occurrence of each preference permutation,
as illustrated in Appendix C.
These results were converted into standardised sample means using the Stochastic
Search Algorithm (Stacey, 2006). The data was then ranked by service attribute and the
underlying service dimension. In the ranking, the higher the mean, the more important
that aspect of service delivery is to the respondents. Negative means have a less than
average importance. An overall mean was derived from the individual country means. No
weighting was applied to the overall mean in order to give each country equal
importance.
The individual attributes have been clustered into the underlying SERVQUAL
dimensions, and the overall mean for all countries is presented in Table 10 below. Figure
9 represents positive overall means and respective service dimensions graphically.
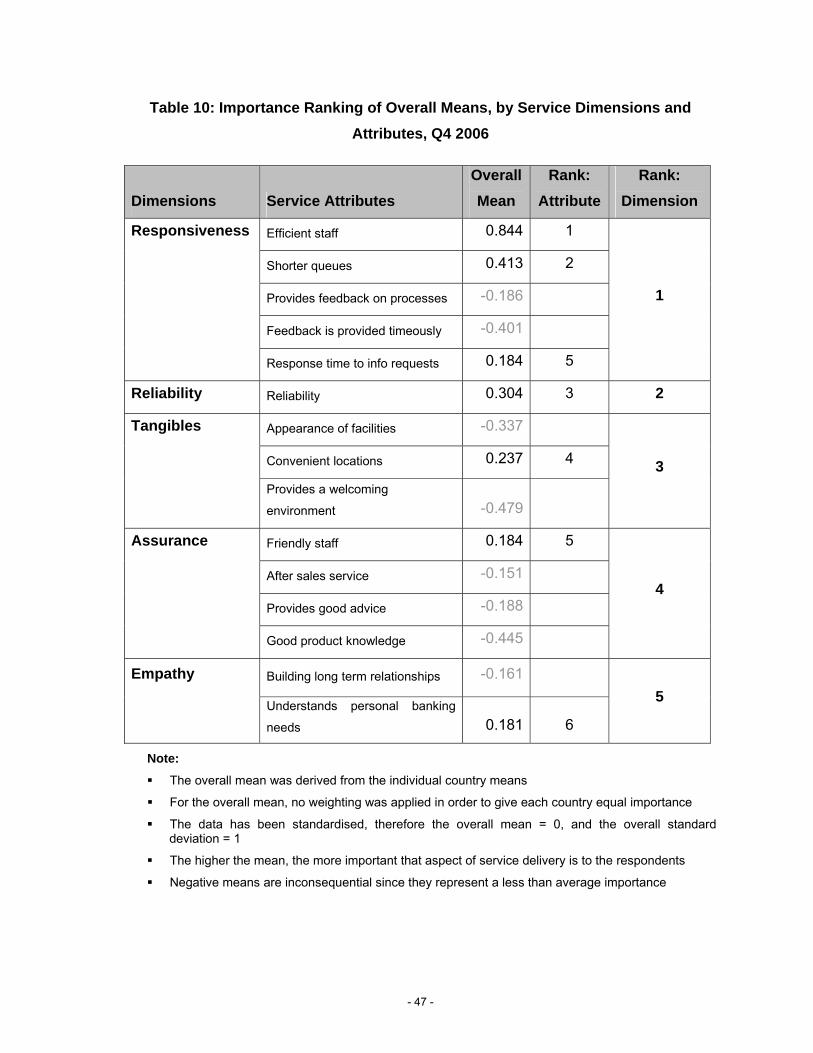
- 47 -
Table 10: Importance Ranking of Overall Means, by Service Dimensions and Attributes, Q4 2006
Dimensions Service Attributes Overall Mean
Rank: Attribute
Rank: Dimension
Responsiveness Efficient staff 0.844 1
Shorter queues 0.413 2
Provides feedback on processes -0.186
Feedback is provided timeously -0.401
Response time to info requests 0.184 5
1
Reliability Reliability 0.304 3 2
Tangibles Appearance of facilities -0.337
Convenient locations 0.237 4
Provides a welcoming
environment -0.479
3
Assurance Friendly staff 0.184 5
After sales service -0.151
Provides good advice -0.188
Good product knowledge -0.445
4
Empathy Building long term relationships -0.161
Understands personal banking
needs 0.181 6
5
Note:
The overall mean was derived from the individual country means
For the overall mean, no weighting was applied in order to give each country equal importance
The data has been standardised, therefore the overall mean = 0, and the overall standard deviation = 1
The higher the mean, the more important that aspect of service delivery is to the respondents
Negative means are inconsequential since they represent a less than average importance

- 48 -
Figure 9: Importance Ranking of Positive Overall Means by Service Dimension, Q4 2006
0.000
0.100
0.200
0.300
0.400
0.500
0.600
0.700
0.800
0.900
Effic
ient
sta
ff
Shor
ter q
ueue
s
Res
pons
e tim
e to
info
requ
ests
Rel
iabi
lity
Con
veni
ent l
ocat
ions
Frie
ndly
sta
ff
Und
erst
ands
per
sona
lba
nkin
g ne
eds
Responsiveness Reliability Tangibles Assurance Empathy
Note:
Negative means have been excluded since they represent a less than average importance
The overall mean was derived from the individual country means
No weighting was applied to the overall mean in order to give each country equal importance
Responsiveness Reliability Tangibles Assurance Empathy

- 49 -
Overall results (for Africa)
Results from the analysis of the SERVQUAL dimensions clearly indicate that
“responsiveness” is the most important service requirement for retail banking customers,
followed by “reliability of service”, “tangibles”, “assurance” and “empathy”. This is based
on the visual interpretation from Figure 9, where it is evident that most of the items
relating to “responsiveness” have the largest values. We can therefore assume that
“responsiveness” has the most important rating.
Analysis of the individual attributes indicate that staff efficiency is by far the most
important service criteria for retail banking customers in Africa. Shorter queues, service
reliability and convenient locations are the second, third and fourth most important
attributes respectively.
Dimension “Responsiveness”
The underlying service dimension “responsiveness” is essentially the time dimension of
service quality, and reflects issues relating to the banks willingness to help customers
and provide prompt service.
Three out of five “responsiveness” attributes are ranked in the top 5. It is interesting to
note that respondents assign considerably more importance to staff efficiency than any
other attribute. On average, respondents perceive staff efficiency to be twice as
important in comparison to the second highest ranked attribute (shorter queues).
“Responsiveness” as a dimension is perceived to be of serious importance, ranked first
out of the five service dimensions. This reflects the statements in the literature review,
which indicate that “responsiveness” would attract the highest rating in the retail banking
sector.
While responsiveness is typically process based, one could argue that in this case both
attributes driving this dimension relate to the time aspect of service delivery (rather than
willingness to help). Thus, this dimension is more outcomes based, and could be
classified as an objective hard issue.

- 50 -
Dimension “Reliability”
The underlying service dimension “reliability” reflects issues relating to the bank’s ability
to perform the promised service dependably and accurately.
While the literature review showed that “reliability” as a dimension is typically ranked fifth
in a retail banking environment, the research results show that in an African
environment, this dimension is ranked second most important by users of retail banking
services.
Reliability is outcome based (Gronroos, 1998) and can be classified as an objective hard
issue since it can be much more readily identified and specified to that of soft and
subjective “relational” issues. This implies that addressing the hard objective issues
could more readily provide, and monitor, a high quality service in a fairly prescriptive and
reproducible manner. (Blanchard & Galloway, 1994)
Dimension “Tangibles”
The underlying service dimension “tangibles” reflects issues relating to the appearance
of physical facilities, location and personnel.
Respondents identified convenient locations to be very important, however they were
less concerned with appearance of facilities and a welcoming environment, which
received a below average rating.
The “tangibles” dimension is ranked third, whilst the literature review suggests this
dimension is typically ranked fourth.
Dimension “Assurance”
The underlying service dimension “assurance” reflects issues relating to the knowledge
and courtesy of employees, and their ability to convey trust and confidence i.e. friendly
staff, good advice, product knowledge and after sales service.
Of all the “assurance” attributes, respondents only perceived friendly staff to be of some
importance (slightly above average), whilst good advice, product knowledge and after
sales service was of little importance.

- 51 -
Contrary to the proposition which suggests that “assurance” is the second most
important service attribute in retail banking, the results show that “assurance” is only
ranked fourth in an African context.
Dimension “Empathy”
The underlying service dimension “empathy” reflects issues relating to the caring,
individualised attention provided to the customer; i.e. understanding the customer’s
personal banking needs, and building long term relationships.
Understanding personal banking needs was the only “empathy” attribute to be of some
importance.
Once again, the relative importance of this dimension was not consistent with previous
research. The literature review showed that “empathy” is typically ranked third in a retail
banking environment. The results indicate that in an African context, this dimension is
the least important, ranked fifth by users of retail banking services.
Country-specific results
When analysing the results by country (Table 11), clear similarities and differences
emerge. Efficient staff was rated as the most important service attribute for all ten
countries. Thereafter, the second and third most important service attributes varied
significantly by country.
By implication, “responsiveness” is therefore the most important dimension for every
country. However subsequent rankings of service dimensions also vary by country.
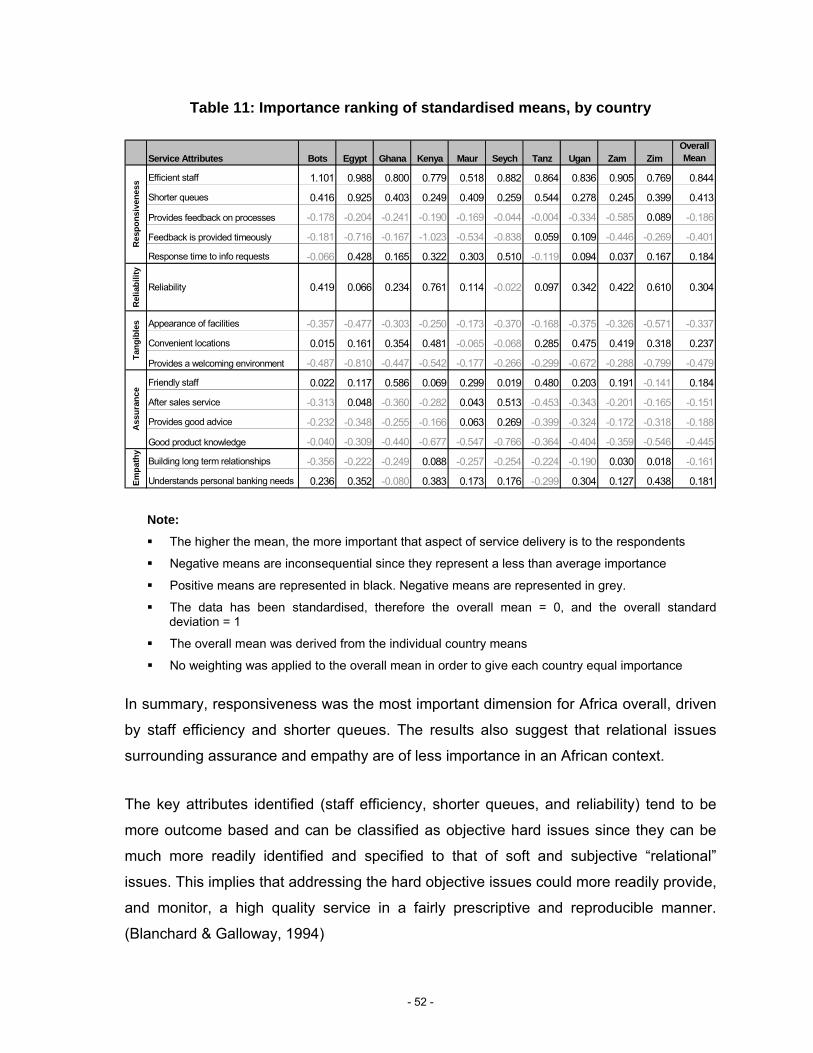
- 52 -
Table 11: Importance ranking of standardised means, by country
Service Attributes Bots Egypt Ghana Kenya Maur Seych Tanz Ugan Zam ZimOverall Mean
Efficient staff 1.101 0.988 0.800 0.779 0.518 0.882 0.864 0.836 0.905 0.769 0.844
Shorter queues 0.416 0.925 0.403 0.249 0.409 0.259 0.544 0.278 0.245 0.399 0.413
Provides feedback on processes -0.178 -0.204 -0.241 -0.190 -0.169 -0.044 -0.004 -0.334 -0.585 0.089 -0.186
Feedback is provided timeously -0.181 -0.716 -0.167 -1.023 -0.534 -0.838 0.059 0.109 -0.446 -0.269 -0.401
Response time to info requests -0.066 0.428 0.165 0.322 0.303 0.510 -0.119 0.094 0.037 0.167 0.184
Rel
iabi
lity
Reliability 0.419 0.066 0.234 0.761 0.114 -0.022 0.097 0.342 0.422 0.610 0.304
Appearance of facilities -0.357 -0.477 -0.303 -0.250 -0.173 -0.370 -0.168 -0.375 -0.326 -0.571 -0.337
Convenient locations 0.015 0.161 0.354 0.481 -0.065 -0.068 0.285 0.475 0.419 0.318 0.237
Provides a welcoming environment -0.487 -0.810 -0.447 -0.542 -0.177 -0.266 -0.299 -0.672 -0.288 -0.799 -0.479
Friendly staff 0.022 0.117 0.586 0.069 0.299 0.019 0.480 0.203 0.191 -0.141 0.184
After sales service -0.313 0.048 -0.360 -0.282 0.043 0.513 -0.453 -0.343 -0.201 -0.165 -0.151
Provides good advice -0.232 -0.348 -0.255 -0.166 0.063 0.269 -0.399 -0.324 -0.172 -0.318 -0.188
Good product knowledge -0.040 -0.309 -0.440 -0.677 -0.547 -0.766 -0.364 -0.404 -0.359 -0.546 -0.445
Building long term relationships -0.356 -0.222 -0.249 0.088 -0.257 -0.254 -0.224 -0.190 0.030 0.018 -0.161
Understands personal banking needs 0.236 0.352 -0.080 0.383 0.173 0.176 -0.299 0.304 0.127 0.438 0.181Empa
thy
Res
pons
iven
ess
Tang
ible
sA
ssur
ance
Note:
The higher the mean, the more important that aspect of service delivery is to the respondents
Negative means are inconsequential since they represent a less than average importance
Positive means are represented in black. Negative means are represented in grey.
The data has been standardised, therefore the overall mean = 0, and the overall standard deviation = 1
The overall mean was derived from the individual country means
No weighting was applied to the overall mean in order to give each country equal importance
In summary, responsiveness was the most important dimension for Africa overall, driven
by staff efficiency and shorter queues. The results also suggest that relational issues
surrounding assurance and empathy are of less importance in an African context.
The key attributes identified (staff efficiency, shorter queues, and reliability) tend to be
more outcome based and can be classified as objective hard issues since they can be
much more readily identified and specified to that of soft and subjective “relational”
issues. This implies that addressing the hard objective issues could more readily provide,
and monitor, a high quality service in a fairly prescriptive and reproducible manner.
(Blanchard & Galloway, 1994)
- 53 -
Furthermore, cross-country analysis shows partial indifferences in the relative
importance regarding dimensions and attributes. Staff efficiency/ responsiveness is the
most important attribute/ dimension for each and every country, indicating that partial
similarities of relative importance across countries do exist.
This would suggest that efforts to increase speed of processing information and
customers are likely to have an important and positive effect on customer satisfaction.
4.3.1 Significance of Attribute Means
Hypothesis t-tests were used to determine the significance of each attribute, for the
overall mean and for each country. The tests show if there is a significant difference from
0 for each attribute. If there is, then the attribute is significantly above average
importance and thus should be taken into consideration.
The results are based on the assumptions that each population is approximately
normally distributed and there are equal population variances. Central Limit theorem can
be used as the basis for normality due to large sample sizes. The samples were
independent and selected at random. A one tail t-test was used at a significance level of
5%. Therefore, if the p value is less than 0.05, the zero hypothesis is rejected, and the
attribute is of significant importance. These results are presented in Table 12, where
significant attributes are represented in black, and insignificant attributes are represented
in grey.
Significant attributes: for Africa
For the overall mean of each service attribute, the findings in Table 12 show that
only seven (out of fifteen) service attributes proved to be of significant importance
(p < 0.05). These were:
efficient staff
shorter queues
fast response times
service reliability
convenient locations
- 54 -
friendly staff
understanding personal banking needs
Conversely, insignificant attributes with a negative overall mean or a p value
greater than 0.05 included:
Appearance of facilities
Welcoming environment
After sales service
Good advice
Good product knowledge
Feedback on processes,
Feedback provided timeously,
Building long term relationships
Significant attributes: by country
When delineating what the similarities in significant attributes are across the ten
countries, only efficient staff and shorter queues were significant for each and
every country, based on the low p values for these two attributes in Table 12.
Appearance of facilities, providing a welcoming environment and good product
knowledge proved to be insignificant attributes for all ten countries.
On average, the countries tended to only have 6 significant attributes, out of the
15 total attributes.

- 55 -
Table 12: Significance of Attribute Means by Country, Q4 2006
Service Attributes (Q4 2006) Bots Egypt Ghana Kenya MaurP Value P Value P Value P Value P Value
Efficient staff 1.101 0.000 0.988 0.000 0.800 0.000 0.779 0.000 0.518 0.000Shorter queues 0.416 0.000 0.925 0.000 0.403 0.000 0.249 0.000 0.409 0.000Provides feedback on processes -0.178 NA -0.204 NA -0.241 NA -0.190 NA -0.169 NA
Feedback is provided timeously -0.181 NA -0.716 NA -0.167 NA -1.023 NA -0.534 NA
Response time to info requests -0.066 NA 0.428 0.000 0.165 0.000 0.322 0.000 0.303 0.000
Rel
iabi
lity
Reliability 0.419 0.000 0.066 0.092 0.234 0.000 0.761 0.000 0.114 0.010
Appearance of facilities -0.357 NA -0.477 NA -0.303 NA -0.250 NA -0.173 NA
Convenient locations 0.015 0.344 0.161 0.001 0.354 0.000 0.481 0.000 -0.065 NA
Provides a welcoming environment -0.487 NA -0.810 NA -0.447 NA -0.542 NA -0.177 NA
Friendly staff 0.022 0.279 0.117 0.009 0.586 0.000 0.069 0.032 0.299 0.000After sales service -0.313 NA 0.048 0.164 -0.360 NA -0.282 NA 0.043 0.191Provides good advice -0.232 NA -0.348 NA -0.255 NA -0.166 NA 0.063 0.101Good product knowledge -0.040 NA -0.309 NA -0.440 NA -0.677 NA -0.547 NA
Building long term relationships -0.356 NA -0.222 NA -0.249 NA 0.088 0.009 -0.257 NA
Understands personal banking needs 0.236 0.000 0.352 0.000 -0.080 NA 0.383 0.000 0.173 0.000
Res
pons
iven
ess
Tang
ible
sA
ssur
ance
Empa
thy
xxxxx
Service Attributes (Q4 2006) Seych Tanz Ugan Zam ZimP Value P Value P Value P Value P Value
Efficient staff 0.882 0.000 0.864 0.000 0.836 0.000 0.905 0.000 0.769 0.000Shorter queues 0.259 0.000 0.544 0.000 0.278 0.000 0.245 0.000 0.399 0.000Provides feedback on processes -0.044 NA -0.004 NA -0.334 NA -0.585 NA 0.089 0.014Feedback is provided timeously -0.838 NA 0.059 0.149 0.109 0.016 -0.446 NA -0.269 NA
Response time to info requests 0.510 0.000 -0.119 NA 0.094 0.031 0.037 0.191 0.167 0.000
Rel
iabi
lity
Reliability -0.022 NA 0.097 0.045 0.342 0.000 0.422 0.000 0.610 0.000
Appearance of facilities -0.370 NA -0.168 NA -0.375 NA -0.326 NA -0.571 NA
Convenient locations -0.068 NA 0.285 0.000 0.475 0.000 0.419 0.000 0.318 0.000Provides a welcoming environment -0.266 NA -0.299 NA -0.672 NA -0.288 NA -0.799 NA
Friendly staff 0.019 0.383 0.480 0.000 0.203 0.000 0.191 0.000 -0.141 NA
After sales service 0.513 0.000 -0.453 NA -0.343 NA -0.201 NA -0.165 NA
Provides good advice 0.269 0.000 -0.399 NA -0.324 NA -0.172 NA -0.318 NA
Good product knowledge -0.766 NA -0.364 NA -0.404 NA -0.359 NA -0.546 NA
Building long term relationships -0.254 NA -0.224 NA -0.190 NA 0.030 0.237 0.018 0.327Understands personal banking needs 0.176 0.003 -0.299 NA 0.304 0.000 0.127 0.001 0.438 0.000
Res
pons
iven
ess
Tang
ible
sA
ssur
ance
Empa
thy
x x x x xxxxxx
Note assumptions: One tail t-test, Significance level: 5% (α = 0.05). X bar = mean. Significant attributes are represented in black. Insignificant attributes are represented in grey NA (Not Applicable): The P value results relating to negative means would imply the attribute is
insignificant and therefore not applicable, since we are testing for above average (0) importance using a one tail t-test.
The data has been standardised, therefore the overall mean = 0, and the overall standard deviation = 1

- 56 -
The above results highlight some of the key determinants of service quality in Africa, and
provide managers of multinational companies with a framework of similarities that exist
across countries when assessing service quality.
Significant dimensions: by country
Based on Table 12, the significant service attributes and respective service
dimensions are shown graphically for each country, in Figure 10 to Figure 19 below,
(ranked by dimensional importance).
Analysis of significant dimensions by country demonstrates the following similarities
and differences. As mentioned previously, the most critical dimension
“responsiveness” is consistently the same for all countries, and supports the
proposition which proposes that “responsiveness” is the most important dimension.
Thereafter, the dimensional rankings vary by country, showing minor similarities.
Kenya and Zambia followed the same service dimensional ranking as the overall
ranking for Africa i.e. (1) responsiveness, (2) reliability, (3) tangibles, (4) assurance,
and (5) empathy.
Ghana and Tanzania were the only other two countries displaying an identical
dimensional ranking i.e.: (1) responsiveness, (2) assurance, (3) tangibles, (4)
reliability. None of the African countries followed the full ranking proposed in the
second proposition: (1) responsiveness, (2) assurance, (3) empathy, (4) tangibles, (5)
reliability.
While partial similarities are evident, it is clear that cross-national differences across
most countries are prevalent. Furthermore, “responsiveness” being the most important
dimension is the only similarity between African countries and the UK.

- 57 -
Figure 10: Significant Service Dimensions and Attributes for Botswana
0.000
0.200
0.400
0.600
0.800
1.000
1.200
Effic
ient
staf
f
Shor
ter
queu
es
Rel
iabi
lity
Und
erst
ands
pers
onal
bank
ing
need
s
Responsiveness Reliability Empathy
Mea
n
Figure 11: Significant Service Dimensions and Attributes for Egypt
0.000
0.200
0.400
0.600
0.800
1.000
1.200
Effic
ient
staf
f
Shor
ter
queu
es
Res
pons
etim
e to
info
requ
ests
Und
erst
ands
pers
onal
bank
ing
need
s
Con
veni
ent
loca
tions
Frie
ndly
staf
f
Responsiveness Empathy Tangibles Assurance
Mea
n

- 58 -
Figure 12: Significant Service Dimensions and Attributes for Ghana
0.000
0.100
0.200
0.300
0.400
0.500
0.600
0.700
0.800
0.900
Effic
ient
staf
f
Shor
ter
queu
es
Res
pons
etim
e to
info
requ
ests
Frie
ndly
staf
f
Con
veni
ent
loca
tions
Rel
iabi
lity
Responsiveness Assurance Tangibles Reliability
Mea
n
Figure 13: Significant Service Dimensions and Attributes for Kenya
0.000
0.100
0.200
0.300
0.400
0.500
0.600
0.700
0.800
0.900
Effic
ient
sta
ff
Shor
ter
queu
es
Res
pons
etim
e to
info
requ
ests
Rel
iabi
lity
Con
veni
ent
loca
tions
Frie
ndly
sta
ff
Build
ing
long
term
rela
tions
hips
Und
erst
ands
pers
onal
bank
ing
need
s
Responsiveness Reliability Tangibles Assurance Empathy
Mea
n

- 59 -
Figure 14: Significant Service Dimensions and Attributes for Mauritius
0.000
0.100
0.200
0.300
0.400
0.500
0.600
Effic
ient
staf
f
Shor
ter
queu
es
Res
pons
etim
e to
info
requ
ests
Frie
ndly
staf
f
Rel
iabi
lity
Und
erst
ands
pers
onal
bank
ing
need
s
Responsiveness Assurance Reliability Empathy
Mea
n
Figure 15: Significant Service Dimensions and Attributes for Seychelles
0.000
0.100
0.200
0.300
0.400
0.500
0.600
0.700
0.800
0.900
1.000
Effic
ient
staf
f
Shor
ter
queu
es
Res
pons
etim
e to
info
requ
ests
Afte
r sal
esse
rvic
e
Prov
ides
good
adv
ice
Und
erst
ands
pers
onal
bank
ing
need
s
Responsiveness Assurance Empathy
Mea
n

- 60 -
Figure 16: Significant Service Dimensions and Attributes for Tanzania
0.000
0.100
0.200
0.300
0.400
0.500
0.600
0.700
0.800
0.900
1.000
Effic
ient
staf
f
Shor
ter
queu
es
Frie
ndly
staf
f
Con
veni
ent
loca
tions
Rel
iabi
lity
Responsiveness Assurance Tangibles Reliability
Mea
n
Figure 17: Significant Service Dimensions and Attributes for Uganda
0.000
0.100
0.200
0.300
0.400
0.500
0.600
0.700
0.800
0.900
Effic
ient
staf
f
Shor
ter
queu
es
Feed
back
ispr
ovid
edtim
eous
ly
Res
pons
etim
e to
info
requ
ests
Con
veni
ent
loca
tions
Rel
iabi
lity
Und
erst
ands
pers
onal
bank
ing
need
s
Frie
ndly
staf
f
Responsiveness Tangibles Reliability Empathy Assurance
Mea
n

- 61 -
Figure 18: Significant Service Dimensions and Attributes for Zambia
0.000
0.100
0.200
0.300
0.400
0.500
0.600
0.700
0.800
0.900
1.000
Effic
ient
staf
f
Shor
ter
queu
es
Rel
iabi
lity
Con
veni
ent
loca
tions
Frie
ndly
staf
f
Und
erst
ands
pers
onal
bank
ing
need
s
Responsiveness Reliability Tangibles Assurance Empathy
Mea
n
Figure 19: Significant Service Dimensions and Attributes for Zimbabwe
0.000
0.100
0.200
0.300
0.400
0.500
0.600
0.700
0.800
0.900
Effic
ient
staf
f
Shor
ter
queu
es
Prov
ides
feed
back
on
proc
esse
s
Res
pons
etim
e to
info
requ
ests
Rel
iabi
lity
Und
erst
ands
pers
onal
bank
ing
need
s
Con
veni
ent
loca
tions
Responsiveness Reliability Empathy Tangibles
Mea
n

- 62 -
4.4 Changes in Service Expectations over Time (Q1 and Q4 2006)
In order to determine whether customer expectations for retail banking services in Africa
are constant over time, hypothesis t-testing was used to test for the significance of
differences between country means over time, comparing data from Q1 2006 with Q4
2006.
The results are based on the assumptions that each population for both data sets are
approximately normally distributed and there are equal population variances. Central
Limit theorem can be used as the basis for normality due to large sample sizes. The
samples were independent and selected at random for both dips. A two tail t-test was
conducted at a 5% level of significance. If the p value is less than 0.05, the zero
hypothesis is rejected, and there is a significant change in sample means over time.
These results are shown in Table 13 and 14.
Analysis of the overall means (Table 13) show that the Ho is rejected for ten out of
eleven attributes based on a 5% level of significance. This implies that significant
changes in (mean) importance from Q1 2006 to Q4 2006 were evident across almost all
attributes. The only attribute that remained consistent over time was “understands
personal banking needs”.
Therefore, there is sufficient reason to believe that customer service expectations in the
African retail banking sector do change over time, and that contrary to the statement by
deCarvalho & Leite (1999), these changes are evident over a relatively short period of
time (i.e. less than one year).
However, in terms of changes in the relative importance ranking of attributes between
Q1 and Q4, the top three attributes remained unchanged; namely; (1) efficient staff, (2)
shorter queues, and (3) reliability.

- 63 -
Table 13: T-test for Significance of differences between overall service attribute means over time (Q1 - Q4 2006)
Service Attributes Overall Means
P Value 1. Efficient staff Q4 2006 0.844 0.000 Q1 2006 0.691 2. Shorter queues Q4 2006 0.413 0.000 Q1 2006 0.322 3. Convenient locations Q4 2006 0.237 0.000 Q1 2006 -0.041 4. Friendly staff Q4 2006 0.184 0.000 Q1 2006 0.067 5. After sales service Q4 2006 -0.151 0.000 Q1 2006 -0.307 6. Response time to info requests Q4 2006 0.184 0.008 Q1 2006 0.119 7. Reliability Q4 2006 0.304 0.000 Q1 2006 0.186 8. Appearance of facilities Q4 2006 -0.337 0.000 Q1 2006 -0.520 9. Building long term relationships Q4 2006 -0.161 0.000 Q1 2006 -0.384 10. Understands personal banking needs Q4 2006 0.181 0.053 Q1 2006 0.134 11. Provides good advice Q4 2006 -0.188 0.002 Q1 2006 -0.265
Note:
Two tail-t test was used
Significance level: 5% (α = 0.05)
The data has been standardised, therefore the overall mean = 0, and the overall standard deviation = 1
The overall mean was derived from the individual country means
No weighting was applied to the overall mean in order to give each country equal importance
Further analysis of significant changes in service expectations segmented by country is
shown in Table 14 below. These results indicate that on an individual country basis, the
following trends emerged for each service attribute:
For “efficient staff”, only four out of ten countries displayed a significant difference
between country means over time, which tells us that for most countries, “efficient staff”
was consistently perceived to be the most important attribute over time. It is also
x

- 64 -
interesting to note however that of those four countries that showed a significant change,
an upward mean trend for all four countries was evident i.e. having “efficient staff” is
becoming increasingly important for retail banking customers in Africa.
A similar trend was true for the attribute “shorter queues”, where only four out of ten
countries showed a significant difference in mean importance over time; however most of
these changes displayed a tendency towards increasing importance for shorter queues.
Nine out of ten countries demonstrated a significant difference in means between Q1
and Q4 2006 for the attribute “convenient locations”. In all nine countries, this attribute is
becoming more important for users of retail banking services.
Egypt and Kenya were the most volatile countries regarding changes in service
expectations, representing the highest number of attributes (i.e. 8) that changed
significantly over time. This is most likely linked to changes in customer experience and
attitude (Woodruff, 1997). Conversely, Seychelles represented the least change (3
attributes) in service expectations over time.
Table 14: T-test for significance of differences between country attribute means over time (Q1 - Q4 2006)
Service Attributes Bots Egypt Ghana Kenya MaurP Value P Value P Value P Value P Value
1. Efficient staff Q4 2006 1.101 0.000 0.988 0.133 0.800 0.000 0.779 0.123 0.518 0.098Q1 2006 0.875 0.859 0.471 0.681 0.654
2. Shorter queues Q4 2006 0.416 0.506 0.925 0.076 0.403 0.013 0.249 0.000 0.409 0.119Q1 2006 0.459 0.772 0.224 -0.004 0.280
3. Convenient locations Q4 2006 0.015 0.047 0.161 0.000 0.354 0.238 0.481 0.000 -0.065 0.002Q1 2006 -0.112 -0.263 0.439 0.200 -0.326
4. Friendly staff Q4 2006 0.022 0.240 0.117 0.111 0.586 0.000 0.069 0.200 0.299 0.000Q1 2006 0.098 -0.020 0.279 -0.012 -0.029
5. After sales service Q4 2006 -0.313 0.000 0.048 0.000 -0.360 0.866 -0.282 0.000 0.043 0.143Q1 2006 -0.603 -0.285 -0.348 -0.507 -0.078
6. Response time to info requests Q4 2006 -0.066 0.002 0.428 0.026 0.165 0.399 0.322 0.000 0.303 0.183Q1 2006 0.134 0.237 0.105 -0.182 0.413
7. Reliability Q4 2006 0.419 0.401 0.066 0.000 0.234 0.612 0.761 0.000 0.114 0.265Q1 2006 0.365 -0.527 0.271 0.399 0.206
8. Appearance of facilities Q4 2006 -0.357 0.000 -0.477 0.000 -0.303 0.000 -0.250 0.000 -0.173 0.000Q1 2006 -0.866 0.472 -0.645 -0.988 -0.700
9. Building long term relationships Q4 2006 -0.356 0.322 -0.222 0.000 -0.249 0.003 0.088 0.022 -0.257 0.000Q1 2006 -0.292 -0.630 -0.462 -0.056 -0.611
10. Understands personal banking needs Q4 2006 0.236 0.840 0.352 0.008 -0.080 0.912 0.383 0.037 0.173 0.618Q1 2006 0.223 0.123 -0.088 0.515 0.214
11. Provides good advice Q4 2006 -0.232 0.450 -0.348 0.000 -0.255 0.901 -0.166 0.058 0.063 0.295Q1 2006 -0.280 -0.738 -0.246 -0.047 -0.024
x xxxx

- 65 -
Service Attributes Seych Tanz Ugan Zam ZimP Value P Value P Value P Value P Value
1. Efficient staff Q4 2006 0.882 0.098 0.864 0.000 0.836 0.000 0.905 0.453 0.769 0.140Q1 2006 0.678 0.383 0.472 0.959 0.872
2. Shorter queues Q4 2006 0.259 0.217 0.544 0.555 0.278 0.003 0.245 0.035 0.399 0.745Q1 2006 0.107 0.599 0.005 0.397 0.377
3. Convenient locations Q4 2006 -0.068 0.001 0.285 0.000 0.475 0.000 0.419 0.001 0.318 0.003Q1 2006 -0.486 -0.222 0.063 0.184 0.110
4. Friendly staff Q4 2006 0.019 0.067 0.480 0.000 0.203 0.741 0.191 0.136 -0.141 0.018Q1 2006 0.246 -0.170 0.174 0.083 0.024
5. After sales service Q4 2006 0.513 0.712 -0.453 0.004 -0.343 0.153 -0.201 0.000 -0.165 0.000Q1 2006 0.467 -0.177 -0.472 -0.499 -0.568
6. Response time to info requests Q4 2006 0.510 0.081 -0.119 0.000 0.094 0.702 0.037 0.050 0.167 0.000Q1 2006 0.295 0.251 0.129 -0.104 -0.083
7. Reliability Q4 2006 -0.022 0.157 0.097 0.220 0.342 0.113 0.422 0.047 0.610 0.814Q1 2006 -0.197 -0.019 0.486 0.279 0.594
8. Appearance of facilities Q4 2006 -0.370 0.027 -0.168 0.088 -0.375 0.130 -0.326 0.001 -0.571 0.052Q1 2006 -0.644 -0.329 -0.238 -0.561 -0.706
9. Building long term relationships Q4 2006 -0.254 0.000 -0.224 0.005 -0.190 0.207 0.030 0.000 0.018 0.000Q1 2006 -0.774 0.044 -0.304 -0.403 -0.350
10. Understands personal banking needs Q4 2006 0.176 0.825 -0.299 0.000 0.304 0.000 0.127 0.548 0.438 0.000Q1 2006 0.203 0.146 -0.075 0.084 -0.010
11. Provides good advice Q4 2006 0.269 0.183 -0.399 0.258 -0.324 0.355 -0.172 0.001 -0.318 0.390Q1 2006 0.105 -0.506 -0.240 -0.419 -0.258
xxxxx x x x x x
Note assumptions:
Two tail t-test
Significance level: 5% (α = 0.05)
The data has been standardised, therefore the overall mean = 0, and the overall standard deviation = 1
Thus we can deduce that while no changes were evident in the relative importance
ranking of the top three attributes over time, i.e. (efficient staff, shorter queues, and
reliability), results from the t-test show significant changes in (mean) importance between
Q1 2006 to Q4 2006 for ten out of eleven attributes. Furthermore, these changes are
evident in service expectations over a short term period. (i.e. 8 months). Egypt and
Kenya demonstrated the highest level of volatility in expectations. Of interest, efficient
staff, shorter queues and convenient locations are becoming increasingly important for
customers. This calls for continuous short term assessments of changing customer
expectations. This will help managers concentrate their efforts in service quality
improvements where most beneficial.
The following chapter presents an interpretation of the results and an analysis of the
possible implications for management wishing to improve the quality of service delivery.

- 66 -
5 CONCLUSIONS AND RECOMMENDATIONS
From the results presented in Chapter 4, the following conclusions and
recommendations with respect to the research propositions can be drawn.
5.1 Responses to Propositions
The objective of this research was to analyse customer service expectations in retail
banking in Africa. In order to assess this, propositions based on the research sub-
problems and on the literature review were formulated as follows:
To determine whether cross-national differences in customer service expectations
in the African retail banking sector exist,
Establish the relative importance of service attributes in retail banking across
Africa, and
Assess whether these service expectations change over time.
The following conclusions were derived from this research for the respective
propositions:
5.1.1 Research Proposition 1:
Customer service expectations in retail banking differ significantly between
countries in Africa
The research clearly shows that customer service expectations in retail banking do differ
significantly between countries in Africa: Accept Proposition One.
ANOVA testing presents sufficient evidence to indicate that for every service
attribute, one or more of the population (country) means are not equal to the
others. Every attribute had some significant difference between countries. This
implies that different cultural groups give different importance to service quality
dimensions.

- 67 -
It is therefore critical to take cross-national differences into consideration when
designing and implementing a marketing strategy for multinational companies. In
order to achieve this, country-specific customer expectations must be determine
and prioritised as a first step towards improving service quality.
5.1.2 Research Proposition 2:
The importance ranking of the service dimensions in African retail banking are:
1. Responsiveness
2. Assurance
3. Empathy
4. Tangibles
5. Reliability
The relative importance of the underlying SERVQUAL dimensions in this survey show
partial variance to those identified by past research: Partially Accept Proposition Two.
Ranking: service dimensions
Blanchard & Galloway (1994) identified responsiveness, assurance, empathy,
tangibles and reliability as the most important service dimensions respectively for
retail banks in the UK. This research has determined that in an African context,
responsiveness, reliability, tangibles, assurance and empathy are the most
important dimensions relating to retail banking services.
Table 15: Importance Ranking of SERQUAL Dimensions
Retail Banks in UK Retail Banks in Africa
1. Responsiveness 1. Responsiveness
2. Assurance 2. Reliability
3. Empathy 3. Tangibles
4. Tangibles 4. Assurance
5. Reliability 5. Empathy

- 68 -
This assessment is based on the ranking of individual attributes collapsed into the
underlying dimensions. The data from the survey is derived from a partial rank
ordering technique. Rescaling of the results using the Stochastic Search
Algorithm (Stacey, 2006) converted the results into standardised sample means,
in order to compare mean rankings.
Customers overwhelmingly perceive responsiveness (the time dimension of
service quality) to be of vital importance, ranked first out of the five service
dimensions. This supports previous research by Avkiran (1994), Blanchard et al
(1994), and Johnston (1997) which indicates that responsiveness would attract
the highest rating in the retail banking sector. Of interest though is that the relative
importance ranking of subsequent service dimensions was not consistent with
previous research. The results suggest that relational issues surrounding
assurance and empathy are of less importance in an African context, while core
dimensions such as responsiveness (driven by staff efficiency and shorter
queues), and reliability (performing dependably and accurately) are more
important.
Both dimensions (responsiveness and reliability) tend to be more outcome based
and can be classified as objective hard issues since they can be much more
readily identified and specified to that of soft and subjective “relational” issues.
This implies that addressing the hard objective issues could more readily provide,
and monitor, a high quality service in a fairly prescriptive and reproducible manner
(Blanchard & Galloway, 1994).
Ranking: service attributes
This research also identifies the individual attributes that collectively drive the
underlying dimensions. Staff efficiency is not only the most important attribute (on
average) for retail banking customers in Africa, but it is perceived to be twice as
important as having “shorter queues”, ranked second. Service reliability and
convenient locations are rated as the third and fourth most important attributes
respectively (out of 15 attributes in total). Of least importance is having a
welcoming environment and good product knowledge.

- 69 -
Table 16: Importance Ranking of Service Attributes
Service Attributes Mean Rating
1. Efficient staff 0.844
2. Shorter queues 0.413
3. Reliability 0.304
4. Convenient locations 0.237
5. Friendly staff 0.184
Ranking: by country
Cross-country analysis shows partial indifferences in the relative importance
regarding dimensions and attributes. Staff efficiency (responsiveness) is the most
important attribute (dimension) for each and every country, indicating that partial
similarities of relative importance do exist across countries. This would suggest
that efforts to increase speed of processing information and customers are likely
to have an important and positive effect on customer satisfaction.
Furthermore, only one attribute (staff efficiency) appears to be stable cross-
culturally. This demonstrates that clear differences are evident for each country,
which calls for an understanding of cultural differences when designing country-
specific marketing strategies.
Significant attributes: for Africa
Results from the t-tests used to determine the significance of attributes indicate
that only seven (out of fifteen) service attributes proved to be of significant
importance (i.e. significantly above average importance). These were efficient
staff, shorter queues, fast response times, service reliability, convenient locations,
friendly staff, and understanding personal banking needs.
Conversely, insignificant attributes with a below average importance included
appearance of facilities, providing a welcoming environment, after sales service,
good advice, good product knowledge, feedback on processes, feedback
provided timeously, and building long term relationships.

- 70 -
Significant attributes: by country
When delineating what the similarities in significant attributes are across the ten
countries, only efficient staff and shorter queues were significant for each and
every country. Appearance of facilities, providing a welcoming environment and
good product knowledge proved to be insignificant attributes for all ten countries.
Any time and money put into these areas (over and above the standard offering)
might be better redirected elsewhere.
The above results highlight some of the key determinants of service quality in
Africa, and provide managers of multinational companies with a framework of
similarities that exist across countries. If detailed branch analysis is not available,
this research highlights two general areas that banks need to focus their attention
on in order to achieve an advantage.
Significant dimensions: by country
Analysis of significant dimensions by country reiterates that “responsiveness” is
consistently the most important for all countries. Thereafter, the dimensional
rankings vary by country, showing minor similarities.
Kenya and Zambia followed the same dimensional ranking as the overall ranking
for Africa i.e. (1) responsiveness, (2) reliability, (3) tangibles, (4) assurance, (5)
empathy. Ghana and Tanzania were the only other two countries displaying an
identical dimensional ranking i.e.: (1) responsiveness, (2) assurance, (3)
tangibles, and (4) reliability. None of the African countries followed the full ranking
proposed in the second proposition, i.e. (1) responsiveness, (2) assurance, (3)
empathy, (4) tangibles, and (5) reliability.
While partial similarities are evident, it is clear that cross-national differences
across most countries are prevalent. Furthermore, responsiveness being the most
important dimension is the only similarity between African countries and the UK.

- 71 -
5.1.3 Research Proposition 3:
Customer service expectations in the African retail banking sector change over
time
This survey shows that while there were no changes in the ranking of customer service
expectations over time, there were significant changes in the importance of these
expectations. Partially Accept Proposition Three.
While no changes were observed in the relative importance ranking of the top
three attributes over time, i.e. (efficient staff, shorter queues, and reliability),
results from the t-test show significant changes in (mean) importance between Q1
2006 to Q4 2006 were evident for ten out of eleven attributes. Thus we can
conclude that not only are there significant changes in customer service
expectations over time, but that significant changes are evident in service
expectations over a short term period. (i.e. 8 months). Egypt and Kenya
demonstrated the highest level of volatility in expectations, while Seychelles
remained relatively consistent for the period.
Table 17: Importance Ranking of Service Attributes – Q1 2006 vs Q4 2006
Importance Ranking: Q1 2006
Importance Ranking: Q4 2006
1. Efficient staff 1. Efficient staff
2. Shorter queues 2. Shorter queues
3. Reliability 3. Reliability

- 72 -
Table 18: Significant Changes in Mean Importance between Q1 2006 – Q4 2006
Overall Means
Changes in Mean Importance:
(Q1 and Q4 2006) P Value Efficient staff Q4 2006 0.844 0.000 Q1 2006 0.691 Shorter queues Q4 2006 0.413 0.000 Q1 2006 0.322 Convenient locations Q4 2006 0.237 0.000 Q1 2006 -0.041 Friendly staff Q4 2006 0.184 0.000 Q1 2006 0.067 After sales service Q4 2006 -0.151 0.000 Q1 2006 -0.307 Response time to info requests Q4 2006 0.184 0.008 Q1 2006 0.119 Reliability Q4 2006 0.304 0.000 Q1 2006 0.186 Appearance of facilities Q4 2006 -0.337 0.000 Q1 2006 -0.520 Building long term relationships Q4 2006 -0.161 0.000 Q1 2006 -0.384 Understands personal banking needs Q4 2006 0.181 0.053 Q1 2006 0.134 Provides good advice Q4 2006 -0.188 0.002 Q1 2006 -0.265
Of interest, efficient staff, shorter queues and convenient locations are becoming
increasingly important for customers.
These results highlight the importance of conducting continuous short term
assessments of changing customer expectations in order to proactively
understand and address changing needs. This will help managers concentrate
their efforts in service quality improvements where most beneficial, thus having a
greater impact on achieving customer satisfaction, retention and ultimately
profitability.
In summary, this research provides managers with an understanding of the similarities
and differences in customer service expectations that exist in Africa, and helps them
assess the likely impact of any service quality initiative in terms of its relative importance
in an African context.
x
No significant change

- 73 -
5.2 Recommendations to Organisations
The results of this research provide a number of clear implications for the management
of customer service expectations.
Cross-national differences are clearly evident across countries in Africa, which
calls for customised marketing strategies based on the unique customer service
expectations that exist for each country.
However some similarities are evident for certain dimensions and attributes, which
can be leveraged off for a pan African strategy.
Customers of retail banks in Africa are clearly seeking a responsive service, with a
high level of staff efficiency. This would suggest that efforts to increase speed of
processing information and customers are likely to have an important and positive
effect on customer satisfaction. Addressing this issue through regular staff training
should improve service quality.
Shorter queues, service reliability and convenient locations are also considered to
be very important by customers. Furthermore, these attributes (including staff
efficiency) are becoming increasingly important over time. For retail banks in
Africa wanting to enhance customer satisfaction, these would be key areas for
improvement. These are areas where well-designed routines and responses could
be used to gain maximum impact.
Time and money, beyond a basic provision, invested in providing a welcoming
environment, appearance of facilities and good product knowledge can be better
redirected elsewhere.
Service expectations in Africa do change over time, and are evident over a
relatively short period of time (< 1 year). It is recommended that short term
assessments of changes in customer expectations are done in order to accurately
meet customer needs and improve service quality.

- 74 -
5.3 Recommendations for Future Research
Concerning future investigations, further research must be conducted in order to explore
how cultural differences shape perceptions and expectations of service quality, by way of
exploring psychometric properties and culture value orientations.
Researchers should also consider taking a broader view towards identifying the
components of service quality and the overall service offering. The components should
encompass not only the recently identified external constructs relating to customer
expectations, but also the internal issues relating to employee satisfaction that drive
service quality (i.e. the full service profit chain).
Furthermore, investigations in this area might focus on measuring customer expectations
as well as customer experience (perceived service) in order to determine the service gap
that exists. Also, by including more countries in the survey to verify service expectation
rank ordering will help avoid the occurrence of Type II error.
Future research of a case study nature into the key service attributes delivered by retail
banks in Africa would provide valuable data for the improvement of the questionnaire
format.

- 75 -
REFERENCES
Avkiran, N.K. (1994), "Developing an instrument to measure customer service in branch
banking", International Journal of Bank Marketing, Vol. 12 (6), pp.10-18.
Anderson, E.A. & Sullivan, M.W. (1993), "The antecedents and consequences of
customer satisfaction for firms", Marketing Science, Vol. 12, pp. 125-43.
Berry, L.L., Zeithaml, V.A., Parasuraman, A. (1985), "Quality counts in services, too",
Business Horizons, May-June, pp.44-52.
Bick, G., Brown A.G. & Abratt R. (2004), “Customer perceptions of the value delivered by
retail banks in South Africa”, The International Journal of Bank Marketing, Vol. 22 (4/5);
pg. 300
Bitner, M.J., Booms, B.H., Tetreault, M.S. (1990), "The service encounter: diagnosing
favorable and unfavorable incidents", Journal of Marketing, Vol. 54 pp.71-84.
Bitner, M.J., & Hubbert, A.R. (1994), "Encounter satisfaction versus overall satisfaction
versus quality", in Rust, R.T. & Oliver, R.L. (Eds), “Service Quality: New Directions in
Theory and Practice”, Sage, London.
Blanchard, R.F & Galloway, R.L (1994), “Quality in Retail Banking”, International Journal
of Service Industry Management, Vol. 5 (4), pp. 5-23.
Boshoff, C. & Nel, D. (1992), “Influence of Demographic Variables on Service Quality
Perceptions in Three Industries, South African Journal of Business Management, Vol. 23
(3/4), pp.69-74.

- 76 -
Boulding, W., Kalra, A., Staelin, R. & Zeithaml, V.A. (1993), “A Dynamic Process Model
of Service Quality: From Expectations to Behavioural Intentions”, Journal of Marketing
Research, Vol. 30 (1), pp. 7-27.
Buttle, F. (1996), “SERVQUAL: Review, Critique, Research Agenda”, European Journal
of Marketing, Vol. 30 (1), pp. 8-35.
Carman, J.M. (1990), "Consumer perceptions of service quality: an assessment of the
SERVQUAL dimensions", Journal of Retailing, Vol. 66 (1), pp. 33-55.
Cina, C. (1990), "Five steps to service excellence", The Journal of Services Marketing,
Vol. 4 pp. 39-47.
Creswell, J.W. (1994), Research design: qualitative & quantitative approaches,
Thousand Oaks, California, Sage Publications.
Cronin, J.J. Jr. & Taylor, S.A. (1992), Measuring Service Quality: a re-examination and
extension, Journal of Marketing, Vol. 56 (3), pp. 55-69
Dabholkar, P.A., Thorpe, D.I. & Rentz, J.O. (1996), "A measure of service quality for
retail stores: scale development and validation", Journal of the Academy of Marketing
Science, Vol. 24, Winter, pp. 3-16.
Daniel, A.L. (1992), "Overcome the barriers to superior customer service", Business and
Society Review, pp. 53-5.
Davidow, W.H. & Uttal, B. (1989), “Service companies: focus or falter”, Harvard Business
Review, July/August, pp. 17-34.
DeCarvalho, F.A. & Leite, V.F. (1999), “Attribute Importance in Service Quality: An
empirical test of the PZB conjecture in Brazil”, International Journal of Service Industry
Management, Vol.10 (5), pp. 487-499

- 77 -
Denzin, N.K., & Lincoln, Y.S. (1998), The landscape of qualitative research: theories and
issues, Thousand Oaks, California, Sage Publications.
East, R. (1997), “Consumer Behaviour: Advances and Applications in Marketing”,
Prentice-Hall, London.
Espinoza, M.M. (1999), “Assessing the cross-cultural applicability of a service quality
measure - A comparative study between Quebec and Peru”, International Journal of
Service Industry Management, Vol. 10 (5), pp. 449-468.
File, K.M. & Prince, R.A. (1992), "Positive word of mouth: customer satisfaction and
buyer behaviour", International Journal of Bank Marketing, Vol. 10 (1), pp. 25-9.
Gale, B.T. (1994), Managing Customer Value, Free Press, New York, NY.
Grönroos, C. (1988), “Service quality: The six criteria of good perceived service”, Review
of Business, Vol. 9 (3), pp.10-14
Hallowell, R (1996), “The relationships of customer satisfaction, customer loyalty, and
profitability: an empirical study”, International Journal of Service Industry Management,
Vol. 7 (4), pp. 27 - 42
Heskett, J.L., Jones, T.O., Loveman, G.W., Sasser, W.E. Jr, & Schlesinger, L.A. (1994),
“Putting the Service-Profit Chain to Work”, Harvard Business Review, March-April, pp.
164-74
Heskett, J.L., Sasser, W.E., & Schlesinger, L.A. (1997), “The Service Profit Chain”, New
York: Free Press, pp 302
Johnston, R. (1995), "The determinants of service quality: satisfiers and dissatisfiers",
International Journal of Service Industry Management, Vol. 6 (5), pp.53-71.

- 78 -
Johnston, R. (1997), “Identifying the critical determinants of service quality in retail
banking: importance and effect”, International Journal of Bank Marketing, Vol. 15 (4), pp.
111-116.
Johnson, C. & Mathews, BP. (1997), “The influence of experience on service
expectations”, International Journal of Service Industry Management, Vol. 8 (4), pp. 290-
305.
Kamakura, W.A., Mittal, V., De Rosa, F., & Mazzon, J. (2002), “Assessing the Service-
Profit Chain”, Marketing Science; Vol. 21 (3), pp. 294-317
Keiningham, T., Zahorik, A.J., & Rust, R.T. (1995), “Getting return on equity”, Journal of
Retail Banking, 16 (4), 7-13.
Knight, G. (1999), “International services marketing: review of research, 1980-1998”
International Journal of Services Marketing, Vol. 13 (4/5), pp. 347-360
Leedy, P.D. & Ormrod, J.E. (2001), “Practical Research: Planning and Design”, Seventh
Edition, Upper Saddle River: Merrill Prentice Hall.
Levesque, T. & McDougall, G.H.G. (1996), "Determinants of customer satisfaction in
retail banking", International Journal of Bank Marketing, Vol. 14 (7), pp. 12-20.
Lovelock, CH. (1999), “Developing marketing strategies for transnational service
operations”, Journal of Services Marketing, Vol.13 (4/5) 1999, pp. 278-289.
Mathews, B.P. (1995), “Quality determinants revisited: or is it satisfaction determinants?”,
Proceedings of the Workshop on Quality Management in Services V, Tilburg, Holland,
pp. 355-365.
- 79 -
Marshall, G.W., Baker, J., & Finn D.W. (1998), “Exploring internal customer service
quality”, Journal of Business & Industrial Marketing, Vol. 13 (4/5) pp. 381.
Nel, D., Pitt, L.F. & Berthon, P.R. (1997), “The SERVQUAL Instrument: reliability and
validity in South Africa, South African Journal of Business Management, Vol. 28 (3), pp.
113-122.
Newman, K. & Cowling, A. (1996), "Service quality in retail banking: the experience of
two British clearing banks", International Journal of Bank Marketing, Vol. 14, pp. 3-11.
Oliver, R.L. (1980), "Cognitive model of the antecedents and consequences of
satisfaction decisions", Journal of Marketing Research, Vol. 17, pp. 460-9.
Parasuraman, A., Zeithaml, V.A., & Berry, L.L. (1985), “A Conceptual Model of Service
Quality and its Implications for Future Research”, Journal of Marketing, Vol. 58, January,
pp. 111-24.
Parasuraman, A., Zeithaml, V.A., & Berry, LL. (1985), "Guidelines for Conducting Service
Quality Research”, Marketing Research, December, pp. 33-34.
Parasuraman, A., Berry, LL., & Zeithaml, V.A. (1985), "A conceptual model of service
quality and its implications for future research", Journal of Marketing, Vol. 49, pp. 41-50.
Parasuraman, A., Zeithaml, V.A., & Berry, L.L. (1988), “SERVQUAL: A Multiple-Item
Scale for Measuring Consumer Perceptions of Service Quality”, Journal of Retailing, Vol.
64 (1), 12-40
Parasuraman, A., Zeithaml, V.A., & Berry, LL. (1990), "A Conceptual Model of Service
Quality and its Implications for Future Study”, Journal of Marketing, Vol. 49 (Fall), pp. 41-
50.

- 80 -
Parasuraman, A., Berry, L.L., & Zeithaml, V.A. (1990), “Delivering Quality Service”, The
Free Press, New York, NY, Ch 2.
Parasuraman, A., Berry, L.L., & Zeithaml, V.A. (1991), “Understanding Customer
Expectations of Service”, Sloan Management Review; ABI/INFORM Global; pp 39.
Parasuraman, A., Zeithaml, V.A., & Berry, LL. (1993), "Refinement and Reassessment of
the SERVQUAL Scale”, Journal of Retailing, Vol. 69 (Spring), pp. 140-147.
Parasuraman, A., Zeithaml, V.A., & Berry, L.L. (1994), “Reassessment of Expectations
as a Comparison Standard in Measuring Service Quality: Implication for further
research”, Journal of Marketing, Vol. 58 (1), pp 111-125.
Quester, P. & Romaniuk, S. (1997), “Service Quality in the Australian Advertising
Industry: A methodological study”, Journal of Services Marketing, Vol. 11 (3), pp. 80-89.
Reichheld, F.F. & Sasser, W.E. Jr (1990), "Defections: quality comes to services", The
Harvard Business Review, pp. 106-7.
Richens, M.L. (1983), "Negative word of mouth by dissatisfied consumers: a pilot study",
Journal of Marketing, Winter, p. 69.
Robledo, M.A. (1996), "The importance of customer expectations in measuring service
quality", in Richards, G (Eds),Tourism in Central and Eastern Europe: Educating for
Quality, Tilburg University Press, pp. 241-6.
Robledo, M.A. (2001), “Measuring and Managing Service Quality: Integrating Customer
Expectations”, Managing Service Quality, Vol. 11 (1), pp. 22-31.
Rucci, A.J. Kirn, S.P., & Quinn, R.T. “The employee-customer-profit chain at Sears”.
Harvard Business Review (Jan-Feb) pp 83-97.

- 81 -
Rust, R.T. & Oliver, R.L. (1994), “Service Quality: New Dimensions in Theory and
Practice”, Sage, London.
Rust, R.T., Zahorik A.J., & Keiningham, T.L. (1995), “Return on Quality (ROQ): Making
Service Quality Financially Accountable”, Journal of Marketing, Vol. 59 (Apr), pp 58-70
Shycon, H.N. (1992), "Improving Customer Service: Measuring the Payoff", The Journal
of Business Strategy, pp. 13-17.
Smith, A.M. & Reynolds, N.L. (2001), “Measuring Cross-National Service Quality - A
Framework for assessment”, International Marketing Review, Vol. 19 (5), pp. 450-481.
Speece, M. & Pinkaeo K. (2002), “Service Expectations and Consumer Ethnocentrism”,
Australasian Marketing Journal, Vol. 10 (3), pp. 59-75.
Stacey, A. (2006), “Estimating the Means and Standard Deviations of Rank Ordered
Survey Items”, Journal of Management Dynamics, Vol. 15 (3), pp1-14.
Stauss, B. & Mang, P. (1999), “Culture Shocks'' in Inter-Cultural Service Encounters”,
Journal of Services Marketing, Vol. 13 (4/5), pp. 329-346.
Stone, J.R. (2006), “Assessing the Quality of Service Delivered by South African
Consulting Engineers”, Unpublished MBA Research Report, Johannesburg: University of
the Witwatersrand.
Taylor, S.A. & Baker, T.L. (1994), "An Assessment of the Relationship between Service
Quality and Customer Satisfaction in the Formation of Consumers' Purchase Intentions",
Journal of Retailing, Vol. 70 (2), pp. 163-78.
Teas, R.K. (1993), “Expectations, Performance Evaluation and Consumer Perceptions of
Quality”, Journal of Marketing, Vol. 57 (October), pp. 18-34.

- 82 -
Tenner, A.R. & DeToro, I.J. (1992), “Total Quality Management”, Addison-Wesley
Publishing Co, Inc., Reading, MA.
Tersine, R. & Harvey, M. (1998), “Global Customerization of Markets has Arrived!”
European Management Journal, Vol. 16 (1), pp. 45-57.
Vandermerwe, S. (1993), “Tin Soldiers to Russian Dolls”, Butterworth-Heinemann,
Oxford, pp.106.
Venetis, K.A and Ghauri, P.N. (2004), “Service quality and Customer retention: building
long-term relationships”, European Journal of Marketing, Vol. 38 (11/12), pp.1577-1593.
Webster, C. (1989), “Can consumers be segmented on the basis of their service quality
expectations?”, Journal of Services Marketing, Vol. 2 (3), pp. 35-53.
Woodruff, R.B. (1997), “Customer value: The next source of competitive advantage”,
Journal of the Academy of Marketing Science, Vol. 25 (2), pp.139-154
World Trade Organisation, (2005), “International trade statistics 2005”, By Sector (Pdf)
http://www.wto.org/english/res_e/statis_e/its2005_e/its05_bysector_e.pdf
Yeo, G. & Böckenholt, U. (1999), “Bayesian estimation of Thurstonian ranking models
based on the Gibbs sampler”, British Journal of Mathematical and Statistical Psychology,
Vol. 52, pp. 79-92
Zeithaml, V.A, Berry, L.L, Parasuraman, A. (1988), "Communication and control
processes in the delivery of service", Journal of Marketing, Vol. 52, pp. 35-48.
Zeithaml, V.A., Parasuraman, A., & Berry, L.L. (1990), “Delivering Quality Service”, The
Free - Press, New York, NY.

- 83 -
Zeithaml, V., Berry, L.L., & Parasuraman, A. (1993), “The nature and determinants of
customer expectations of a service”, Journal of the Academy of Marketing Science, Vol.
21 (1), pp. 1-12.

- 84 -
APPENDIX A: INTERVIEW QUESTIONNAIRES
Q4 2006 Interview Questionnaire, (15 service attributes)
1. I am going to read to you a list of service areas relating to your bank. After I read the
whole list (there are eleven service areas) please say which three service areas are most
important to you and place them in order of First Most Important, Second Most Important
and Third Most Important.
(Interviewer note: The respondent can only answer after you read the whole list. Tick one block only for
‘First Most Important’, tick one block only for ‘Second Most Important’ and tick one block only for ‘Third
Most Important’.)
First Most Important
Second Most Important
Third Most Important
Q1.1 Q1.2 Q1.3
1. Efficient staff
2. Shorter queues
3. Convenient locations
4. Friendly Staff
5. Good After sales service
6. Fast response time to information requests
7. Reliability – Able to perform service dependably and accurately
8. Appearance of facilities
9. Focus on building long term relationships
10. Understands my personal banking needs
11. Provides good advice
12. Provides a welcoming environment
13. Provides me with promised feedback on key steps in processes.
E.g. letting you know about loan approvals or if your account opening has been approved.
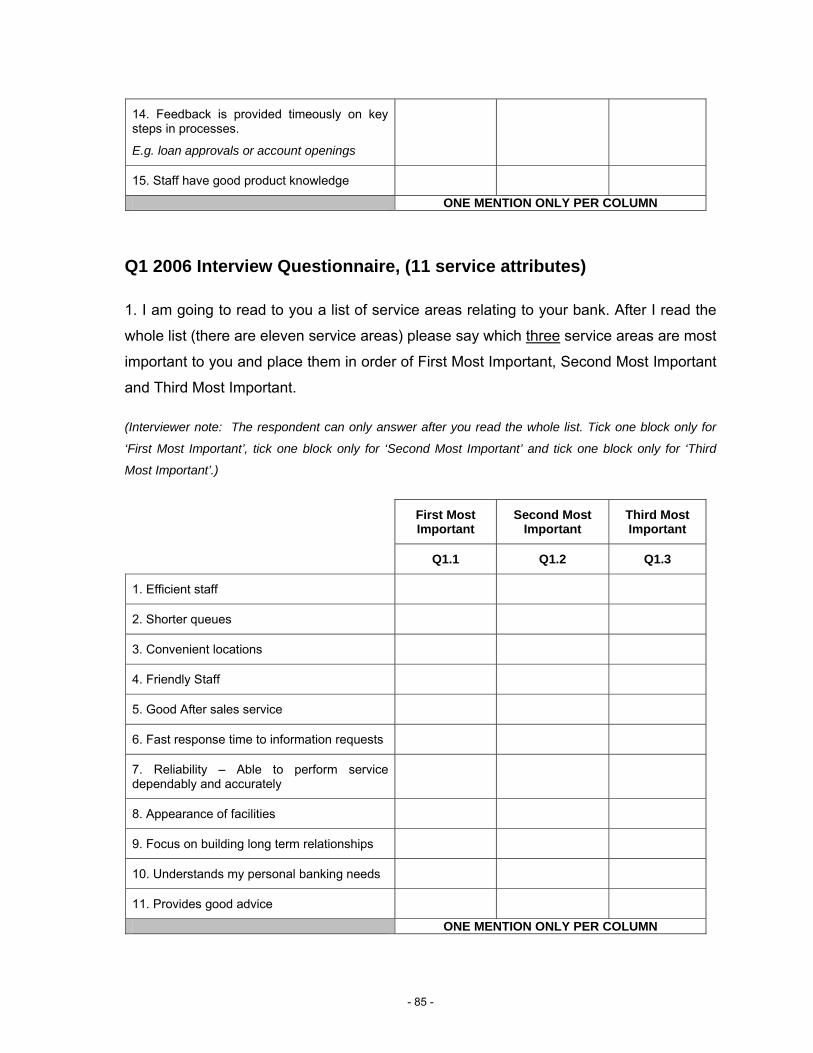
- 85 -
14. Feedback is provided timeously on key steps in processes.
E.g. loan approvals or account openings
15. Staff have good product knowledge
ONE MENTION ONLY PER COLUMN
Q1 2006 Interview Questionnaire, (11 service attributes)
1. I am going to read to you a list of service areas relating to your bank. After I read the
whole list (there are eleven service areas) please say which three service areas are most
important to you and place them in order of First Most Important, Second Most Important
and Third Most Important.
(Interviewer note: The respondent can only answer after you read the whole list. Tick one block only for
‘First Most Important’, tick one block only for ‘Second Most Important’ and tick one block only for ‘Third
Most Important’.)
First Most Important
Second Most Important
Third Most Important
Q1.1 Q1.2 Q1.3
1. Efficient staff
2. Shorter queues
3. Convenient locations
4. Friendly Staff
5. Good After sales service
6. Fast response time to information requests
7. Reliability – Able to perform service dependably and accurately
8. Appearance of facilities
9. Focus on building long term relationships
10. Understands my personal banking needs
11. Provides good advice
ONE MENTION ONLY PER COLUMN

- 86 -
APPENDIX B: DETAILED PRESENTATION OF RESULTS
Appendix B.1: Summary Stats – Q4 2006
Table B 1.1: Summary Stats, Q4 2006 - Efficient Staff
Summary stats for Q4 2006Bots Egypt Ghana Kenya Maur Seych Tanz Ugan Zam Zim
Sample sizes 560 316 496 571 380 200 248 330 488 494Sample means 1.101 0.988 0.800 0.779 0.518 0.882 0.864 0.836 0.905 0.769Sample standard deviations 0.908 0.875 0.925 0.884 0.953 0.911 0.894 0.918 0.938 0.898Sample variances 0.824 0.766 0.856 0.781 0.908 0.829 0.799 0.843 0.880 0.806Weights for pooled variance 0.137 0.077 0.122 0.140 0.093 0.049 0.061 0.081 0.120 0.121
ITEM 1: EFFICIENT STAFF
Table B 1.2: Summary Stats, Q4 2006 – Shorter Queues
Summary stats for Q4 2006Bots Egypt Ghana Kenya Maur Seych Tanz Ugan Zam Zim
Sample sizes 560 316 496 571 380 200 248 330 488 494Sample means 0.416 0.925 0.403 0.249 0.409 0.259 0.544 0.278 0.245 0.399Sample standard deviations 0.908 0.875 0.925 0.884 0.953 0.911 0.894 0.918 0.938 0.898Sample variances 0.824 0.766 0.856 0.781 0.908 0.829 0.799 0.843 0.880 0.806Weights for pooled variance 0.137 0.077 0.122 0.140 0.093 0.049 0.061 0.081 0.120 0.121
ITEM 2: SHORTER QUEUES
Table B 1.3: Summary Stats, Q4 2006 – Convenient Locations
Summary stats for Q4 2006Bots Egypt Ghana Kenya Maur Seych Tanz Ugan Zam Zim
Sample sizes 560 316 496 571 380 200 248 330 488 494Sample means 0.015 0.161 0.354 0.481 -0.065 -0.068 0.285 0.475 0.419 0.318Sample standard deviations 0.908 0.875 0.925 0.884 0.953 0.911 0.894 0.918 0.938 0.898Sample variances 0.824 0.766 0.856 0.781 0.908 0.829 0.799 0.843 0.880 0.806Weights for pooled variance 0.137 0.077 0.122 0.140 0.093 0.049 0.061 0.081 0.120 0.121
ITEM 3: CONVENIENT LOCATIONS
Table B 1.4: Summary Stats, Q4 2006 – Friendly Staff
Summary stats for Q4 2006Bots Egypt Ghana Kenya Maur Seych Tanz Ugan Zam Zim
Sample sizes 560 316 496 571 380 200 248 330 488 494Sample means 0.022 0.117 0.586 0.069 0.299 0.019 0.480 0.203 0.191 -0.141Sample standard deviations 0.908 0.875 0.925 0.884 0.953 0.911 0.894 0.918 0.938 0.898Sample variances 0.824 0.766 0.856 0.781 0.908 0.829 0.799 0.843 0.880 0.806Weights for pooled variance 0.137 0.077 0.122 0.140 0.093 0.049 0.061 0.081 0.120 0.121
ITEM 4: FRIENDLY STAFF
Table B 1.5: Summary Stats, Q4 2006 – After Sales Service

- 87 -
Summary stats for Q4 2006Bots Egypt Ghana Kenya Maur Seych Tanz Ugan Zam Zim
Sample sizes 560 316 496 571 380 200 248 330 488 494Sample means -0.313 0.048 -0.360 -0.282 0.043 0.513 -0.453 -0.343 -0.201 -0.165Sample standard deviations 0.908 0.875 0.925 0.884 0.953 0.911 0.894 0.918 0.938 0.898Sample variances 0.824 0.766 0.856 0.781 0.908 0.829 0.799 0.843 0.880 0.806Weights for pooled variance 0.137 0.077 0.122 0.140 0.093 0.049 0.061 0.081 0.120 0.121
ITEM 5: GOOD AFTER SALES SERVICE
Table B 1.6: Summary Stats, Q4 2006 – Response Time
Summary stats for Q4 2006Bots Egypt Ghana Kenya Maur Seych Tanz Ugan Zam Zim
Sample sizes 560 316 496 571 380 200 248 330 488 494Sample means -0.066 0.428 0.165 0.322 0.303 0.510 -0.119 0.094 0.037 0.167Sample standard deviations 0.908 0.875 0.925 0.884 0.953 0.911 0.894 0.918 0.938 0.898Sample variances 0.824 0.766 0.856 0.781 0.908 0.829 0.799 0.843 0.880 0.806Weights for pooled variance 0.137 0.077 0.122 0.140 0.093 0.049 0.061 0.081 0.120 0.121
ITEM 6: FAST RESPONSE TIME TO INFO REQUESTS
Table B 1.7: Summary Stats, Q4 2006 - Reliability
Summary stats for Q4 2006Bots Egypt Ghana Kenya Maur Seych Tanz Ugan Zam Zim
Sample sizes 560 316 496 571 380 200 248 330 488 494Sample means 0.419 0.066 0.234 0.761 0.114 -0.022 0.097 0.342 0.422 0.610Sample standard deviations 0.908 0.875 0.925 0.884 0.953 0.911 0.894 0.918 0.938 0.898Sample variances 0.824 0.766 0.856 0.781 0.908 0.829 0.799 0.843 0.880 0.806Weights for pooled variance 0.137 0.077 0.122 0.140 0.093 0.049 0.061 0.081 0.120 0.121
ITEM 7: RELIABILITY
Table B 1.8: Summary Stats, Q4 2006 – Appearance of Facilities
Summary stats for Q4 2006Bots Egypt Ghana Kenya Maur Seych Tanz Ugan Zam Zim
Sample sizes 560 316 496 571 380 200 248 330 488 494Sample means -0.357 -0.477 -0.303 -0.250 -0.173 -0.370 -0.168 -0.375 -0.326 -0.571Sample standard deviations 0.908 0.875 0.925 0.884 0.953 0.911 0.894 0.918 0.938 0.898Sample variances 0.824 0.766 0.856 0.781 0.908 0.829 0.799 0.843 0.880 0.806Weights for pooled variance 0.137 0.077 0.122 0.140 0.093 0.049 0.061 0.081 0.120 0.121
ITEM 8: APPEARANCE OF FACILITIES
Table B 1.9: Summary Stats, Q4 2006 – Long Term Relationships
Summary stats for Q4 2006Bots Egypt Ghana Kenya Maur Seych Tanz Ugan Zam Zim
Sample sizes 560 316 496 571 380 200 248 330 488 494Sample means -0.356 -0.222 -0.249 0.088 -0.257 -0.254 -0.224 -0.190 0.030 0.018Sample standard deviations 0.908 0.875 0.925 0.884 0.953 0.911 0.894 0.918 0.938 0.898Sample variances 0.824 0.766 0.856 0.781 0.908 0.829 0.799 0.843 0.880 0.806Weights for pooled variance 0.137 0.077 0.122 0.140 0.093 0.049 0.061 0.081 0.120 0.121
ITEM 9: FOCUS ON BUILDING LONG TERM RELATIONSHIPS
Table B 1.10: Summary Stats, Q4 2006 – Understands Personal Banking Needs
- 88 -
Summary stats for Q4 2006Bots Egypt Ghana Kenya Maur Seych Tanz Ugan Zam Zim
Sample sizes 560 316 496 571 380 200 248 330 488 494Sample means 0.236 0.352 -0.080 0.383 0.173 0.176 -0.299 0.304 0.127 0.438Sample standard deviations 0.908 0.875 0.925 0.884 0.953 0.911 0.894 0.918 0.938 0.898Sample variances 0.824 0.766 0.856 0.781 0.908 0.829 0.799 0.843 0.880 0.806Weights for pooled variance 0.137 0.077 0.122 0.140 0.093 0.049 0.061 0.081 0.120 0.121
ITEM 10: UNDERSTANDS MY PERSONAL BANKING NEEDS
Table B 1.11: Summary Stats, Q4 2006 – Provides Good Advice
Summary stats for Q4 2006Bots Egypt Ghana Kenya Maur Seych Tanz Ugan Zam Zim
Sample sizes 560 316 496 571 380 200 248 330 488 494Sample means -0.232 -0.348 -0.255 -0.166 0.063 0.269 -0.399 -0.324 -0.172 -0.318Sample standard deviations 0.908 0.875 0.925 0.884 0.953 0.911 0.894 0.918 0.938 0.898Sample variances 0.824 0.766 0.856 0.781 0.908 0.829 0.799 0.843 0.880 0.806Weights for pooled variance 0.137 0.077 0.122 0.140 0.093 0.049 0.061 0.081 0.120 0.121
ITEM 11: PROVIDES GOOD ADVICE
Table B 1.12: Summary Stats, Q4 2006 – Welcoming Environment
Summary stats for Q4 2006Bots Egypt Ghana Kenya Maur Seych Tanz Ugan Zam Zim
Sample sizes 560 316 496 571 380 200 248 330 488 494Sample means -0.487 -0.810 -0.447 -0.542 -0.177 -0.266 -0.299 -0.672 -0.288 -0.799Sample standard deviations 0.908 0.875 0.925 0.884 0.953 0.911 0.894 0.918 0.938 0.898Sample variances 0.824 0.766 0.856 0.781 0.908 0.829 0.799 0.843 0.880 0.806Weights for pooled variance 0.137 0.077 0.122 0.140 0.093 0.049 0.061 0.081 0.120 0.121
ITEM 12: PROVIDES A WELCOMING ENVIRONMENT
Table B 1.13: Summary Stats, Q4 2006 – Feedback on Processes
Summary stats for Q4 2006Bots Egypt Ghana Kenya Maur Seych Tanz Ugan Zam Zim
Sample sizes 560 316 496 571 380 200 248 330 488 494Sample means -0.178 -0.204 -0.241 -0.190 -0.169 -0.044 -0.004 -0.334 -0.585 0.089Sample standard deviations 0.908 0.875 0.925 0.884 0.953 0.911 0.894 0.918 0.938 0.898Sample variances 0.824 0.766 0.856 0.781 0.908 0.829 0.799 0.843 0.880 0.806Weights for pooled variance 0.137 0.077 0.122 0.140 0.093 0.049 0.061 0.081 0.120 0.121
ITEM 13: PROVIDES FEEDBACK ON KEY STEPS IN PROCESSES eg. Loan Appro
Table B 1.14: Summary Stats, Q4 2006 – Feedback Provided Timeously
Summary stats for Q4 2006Bots Egypt Ghana Kenya Maur Seych Tanz Ugan Zam Zim
Sample sizes 560 316 496 571 380 200 248 330 488 494Sample means -0.181 -0.716 -0.167 -1.023 -0.534 -0.838 0.059 0.109 -0.446 -0.269Sample standard deviations 0.908 0.875 0.925 0.884 0.953 0.911 0.894 0.918 0.938 0.898Sample variances 0.824 0.766 0.856 0.781 0.908 0.829 0.799 0.843 0.880 0.806Weights for pooled variance 0.137 0.077 0.122 0.140 0.093 0.049 0.061 0.081 0.120 0.121
ITEM 14: PROMISED FEEDBACK IS PROVIDED TIMEOUSLY
Table B 1.15: Summary Stats, Q4 2006 – Knowledge of Product Range

- 89 -
Summary stats for Q4 2006Bots Egypt Ghana Kenya Maur Seych Tanz Ugan Zam Zim
Sample sizes 560 316 496 571 380 200 248 330 488 494Sample means -0.040 -0.309 -0.440 -0.677 -0.547 -0.766 -0.364 -0.404 -0.359 -0.546Sample standard deviations 0.908 0.875 0.925 0.884 0.953 0.911 0.894 0.918 0.938 0.898Sample variances 0.824 0.766 0.856 0.781 0.908 0.829 0.799 0.843 0.880 0.806Weights for pooled variance 0.137 0.077 0.122 0.140 0.093 0.049 0.061 0.081 0.120 0.121
ITEM 15: STAFF HAVE GOOD KNOWLEDGE OF THE FULL PRODUCT RANGE
- 90 -
Appendix B.2: Summary Stats – Q1 2006
Table B 2.1: Summary Stats, Q1 2006 - Efficient Staff
Summary stats for Q1 2006Bots Egypt Ghana Kenya Maur Seych Tanz Ugan Zam Zim
Sample sizes 300 152 250 302 200 75 152 155 250 251Sample means 0.875 0.859 0.471 0.681 0.654 0.678 0.383 0.472 0.959 0.872Sample standard deviations 0.882 0.856 0.934 0.896 0.920 0.901 0.953 0.959 0.901 0.892Sample variances 0.777 0.732 0.872 0.803 0.846 0.813 0.909 0.920 0.811 0.795Weights for pooled variance 0.144 0.073 0.120 0.145 0.096 0.036 0.073 0.074 0.120 0.120
ITEM 1: EFFICIENT STAFF
Table B 2.2: Summary Stats, Q1 2006 – Shorter Queues
Summary stats for Q1 2006Bots Egypt Ghana Kenya Maur Seych Tanz Ugan Zam Zim
Sample sizes 300 152 250 302 200 75 152 155 250 251Sample means 0.459 0.772 0.224 -0.004 0.280 0.107 0.599 0.005 0.397 0.377Sample standard deviations 0.882 0.856 0.934 0.896 0.920 0.901 0.953 0.959 0.901 0.892Sample variances 0.777 0.732 0.872 0.803 0.846 0.813 0.909 0.920 0.811 0.795Weights for pooled variance 0.144 0.073 0.120 0.145 0.096 0.036 0.073 0.074 0.120 0.120
ITEM 2: SHORTER QUEUES
Table B 2.3: Summary Stats, Q1 2006 – Convenient Locations
Summary stats for Q1 2006Bots Egypt Ghana Kenya Maur Seych Tanz Ugan Zam Zim
Sample sizes 300 152 250 302 200 75 152 155 250 251Sample means -0.112 -0.263 0.439 0.200 -0.326 -0.486 -0.222 0.063 0.184 0.110Sample standard deviations 0.882 0.856 0.934 0.896 0.920 0.901 0.953 0.959 0.901 0.892Sample variances 0.777 0.732 0.872 0.803 0.846 0.813 0.909 0.920 0.811 0.795Weights for pooled variance 0.144 0.073 0.120 0.145 0.096 0.036 0.073 0.074 0.120 0.120
ITEM 3: CONVENIENT LOCATIONS
Table B 2.4: Summary Stats, Q1 2006 – Friendly Staff
Summary stats for Q1 2006Bots Egypt Ghana Kenya Maur Seych Tanz Ugan Zam Zim
Sample sizes 300 152 250 302 200 75 152 155 250 251Sample means 0.098 -0.020 0.279 -0.012 -0.029 0.246 -0.170 0.174 0.083 0.024Sample standard deviations 0.882 0.856 0.934 0.896 0.920 0.901 0.953 0.959 0.901 0.892Sample variances 0.777 0.732 0.872 0.803 0.846 0.813 0.909 0.920 0.811 0.795Weights for pooled variance 0.144 0.073 0.120 0.145 0.096 0.036 0.073 0.074 0.120 0.120
ITEM 4: FRIENDLY STAFF
Table B 2.5: Summary Stats, Q1 2006 – After Sales Service

- 91 -
Summary stats for Q1 2006Bots Egypt Ghana Kenya Maur Seych Tanz Ugan Zam Zim
Sample sizes 300 152 250 302 200 75 152 155 250 251Sample means -0.603 -0.285 -0.348 -0.507 -0.078 0.467 -0.177 -0.472 -0.499 -0.568Sample standard deviations 0.882 0.856 0.934 0.896 0.920 0.901 0.953 0.959 0.901 0.892Sample variances 0.777 0.732 0.872 0.803 0.846 0.813 0.909 0.920 0.811 0.795Weights for pooled variance 0.144 0.073 0.120 0.145 0.096 0.036 0.073 0.074 0.120 0.120
ITEM 5: GOOD AFTER SALES SERVICE
Table B 2.6: Summary Stats, Q1 2006 – Response Time
Summary stats for Q1 2006Bots Egypt Ghana Kenya Maur Seych Tanz Ugan Zam Zim
Sample sizes 300 152 250 302 200 75 152 155 250 251Sample means 0.134 0.237 0.105 -0.182 0.413 0.295 0.251 0.129 -0.104 -0.083Sample standard deviations 0.882 0.856 0.934 0.896 0.920 0.901 0.953 0.959 0.901 0.892Sample variances 0.777 0.732 0.872 0.803 0.846 0.813 0.909 0.920 0.811 0.795Weights for pooled variance 0.144 0.073 0.120 0.145 0.096 0.036 0.073 0.074 0.120 0.120
ITEM 6: FAST RESPONSE TIME TO INFO REQUESTS
Table B 2.7: Summary Stats, Q1 2006 – Reliability
Summary stats for Q1 2006Bots Egypt Ghana Kenya Maur Seych Tanz Ugan Zam Zim
Sample sizes 300 152 250 302 200 75 152 155 250 251Sample means 0.365 -0.527 0.271 0.399 0.206 -0.197 -0.019 0.486 0.279 0.594Sample standard deviations 0.882 0.856 0.934 0.896 0.920 0.901 0.953 0.959 0.901 0.892Sample variances 0.777 0.732 0.872 0.803 0.846 0.813 0.909 0.920 0.811 0.795Weights for pooled variance 0.144 0.073 0.120 0.145 0.096 0.036 0.073 0.074 0.120 0.120
ITEM 7: RELIABILITY
Table B 2.8: Summary Stats, Q1 2006 – Appearance of Facilities
Summary stats for Q1 2006Bots Egypt Ghana Kenya Maur Seych Tanz Ugan Zam Zim
Sample sizes 300 152 250 302 200 75 152 155 250 251Sample means -0.866 0.472 -0.645 -0.988 -0.700 -0.644 -0.329 -0.238 -0.561 -0.706Sample standard deviations 0.882 0.856 0.934 0.896 0.920 0.901 0.953 0.959 0.901 0.892Sample variances 0.777 0.732 0.872 0.803 0.846 0.813 0.909 0.920 0.811 0.795Weights for pooled variance 0.144 0.073 0.120 0.145 0.096 0.036 0.073 0.074 0.120 0.120
ITEM 8: APPEARANCE OF FACILITIES
Table B 2.9: Summary Stats, Q1 2006 – Long Term Relationships
Summary stats for Q1 2006Bots Egypt Ghana Kenya Maur Seych Tanz Ugan Zam Zim
Sample sizes 300 152 250 302 200 75 152 155 250 251Sample means -0.292 -0.630 -0.462 -0.056 -0.611 -0.774 0.044 -0.304 -0.403 -0.350Sample standard deviations 0.882 0.856 0.934 0.896 0.920 0.901 0.953 0.959 0.901 0.892Sample variances 0.777 0.732 0.872 0.803 0.846 0.813 0.909 0.920 0.811 0.795Weights for pooled variance 0.144 0.073 0.120 0.145 0.096 0.036 0.073 0.074 0.120 0.120
ITEM 9: FOCUS ON BUILDING LONG TERM RELATIONSHIPS
Table B 2.10: Summary Stats, Q1 2006 – Understands Personal Banking Needs

- 92 -
Summary stats for Q1 2006Bots Egypt Ghana Kenya Maur Seych Tanz Ugan Zam Zim
Sample sizes 300 152 250 302 200 75 152 155 250 251Sample means 0.223 0.123 -0.088 0.515 0.214 0.203 0.146 -0.075 0.084 -0.010Sample standard deviations 0.882 0.856 0.934 0.896 0.920 0.901 0.953 0.959 0.901 0.892Sample variances 0.777 0.732 0.872 0.803 0.846 0.813 0.909 0.920 0.811 0.795Weights for pooled variance 0.144 0.073 0.120 0.145 0.096 0.036 0.073 0.074 0.120 0.120
ITEM 10: UNDERSTANDS MY PERSONAL BANKING NEEDS
Table B 2.11: Summary Stats, Q1 2006 – Provides Good Advice
Summary stats for Q1 2006Bots Egypt Ghana Kenya Maur Seych Tanz Ugan Zam Zim
Sample sizes 300 152 250 302 200 75 152 155 250 251Sample means -0.280 -0.738 -0.246 -0.047 -0.024 0.105 -0.506 -0.240 -0.419 -0.258Sample standard deviations 0.882 0.856 0.934 0.896 0.920 0.901 0.953 0.959 0.901 0.892Sample variances 0.777 0.732 0.872 0.803 0.846 0.813 0.909 0.920 0.811 0.795Weights for pooled variance 0.144 0.073 0.120 0.145 0.096 0.036 0.073 0.074 0.120 0.120
ITEM 11: PROVIDES GOOD ADVICE

- 93 -
Appendix B.3: One-Way ANOVA Testing – Q4 2006
Table B 3.1: One-Way ANOVA Results, Q4 2006 - Efficient Staff
Results of one-way ANOVANumber of samples 10Total sample size 4083Grand mean 0.846Pooled variance 0.830Pooled standard deviation 0.911
Source SS df MS F p-valueBetween variation 92.520 9 10.280 12.386 0.0000Within variation 3380.559 4073 0.830Total variation 3473.079 4082
Table B 3.2: One-Way ANOVA Results, Q4 2006 – Shorter Queues
Results of one-way ANOVANumber of samples 10Total sample size 4083Grand mean 0.396Pooled variance 0.830Pooled standard deviation 0.911
Source SS df MS F p-valueBetween variation 125.751 9 13.972 16.834 0.0000Within variation 3380.559 4073 0.830Total variation 3506.310 4082
Table B 3.3: One-Way ANOVA Results, Q4 2006 – Convenient Locations
Results of one-way ANOVANumber of samples 10Total sample size 4083Grand mean 0.260Pooled variance 0.830Pooled standard deviation 0.911
Source SS df MS F p-valueBetween variation 159.799 9 17.755 21.392 0.0000Within variation 3380.559 4073 0.830Total variation 3540.357 4082
Table B 3.4: One-Way ANOVA Results, Q4 2006 – Friendly Staff

- 94 -
Results of one-way ANOVANumber of samples 10Total sample size 4083Grand mean 0.173Pooled variance 0.830Pooled standard deviation 0.911
Source SS df MS F p-valueBetween variation 187.733 9 20.859 25.132 0.0000Within variation 3380.559 4073 0.830Total variation 3568.292 4082
Table B 3.5: One-Way ANOVA Results, Q4 2006 – After Sales Service
Results of one-way ANOVANumber of samples 10Total sample size 4083Grand mean -0.193Pooled variance 0.830Pooled standard deviation 0.911
Source SS df MS F p-valueBetween variation 190.192 9 21.132 25.461 0.0000Within variation 3380.559 4073 0.830Total variation 3570.751 4082
Table B 3.6: One-Way ANOVA Results, Q4 2006 – Response Time
Results of one-way ANOVANumber of samples 10Total sample size 4083Grand mean 0.167Pooled variance 0.830Pooled standard deviation 0.911
Source SS df MS F p-valueBetween variation 126.368 9 14.041 16.917 0.0000Within variation 3380.559 4073 0.830Total variation 3506.927 4082
Table B 3.7: One-Way ANOVA Results, Q4 2006 - Reliability

- 95 -
Results of one-way ANOVANumber of samples 10Total sample size 4083Grand mean 0.365Pooled variance 0.830Pooled standard deviation 0.911
Source SS df MS F p-valueBetween variation 231.092 9 25.677 30.936 0.0000Within variation 3380.559 4073 0.830Total variation 3611.651 4082
Table B 3.8: One-Way ANOVA Results, Q4 2006 – Appearance of Facilities
Results of one-way ANOVANumber of samples 10Total sample size 4083Grand mean -0.341Pooled variance 0.830Pooled standard deviation 0.911
Source SS df MS F p-valueBetween variation 56.507 9 6.279 7.565 0.0000Within variation 3380.559 4073 0.830Total variation 3437.066 4082
Table B 3.9: One-Way ANOVA Results, Q4 2006 – Long Term Relationships
Results of one-way ANOVANumber of samples 10Total sample size 4083Grand mean -0.143Pooled variance 0.830Pooled standard deviation 0.911
Source SS df MS F p-valueBetween variation 100.798 9 11.200 13.494 0.0000Within variation 3380.559 4073 0.830Total variation 3481.357 4082
Table B 3.10: One-Way ANOVA Results, Q4 2006 – Personal Banking Needs
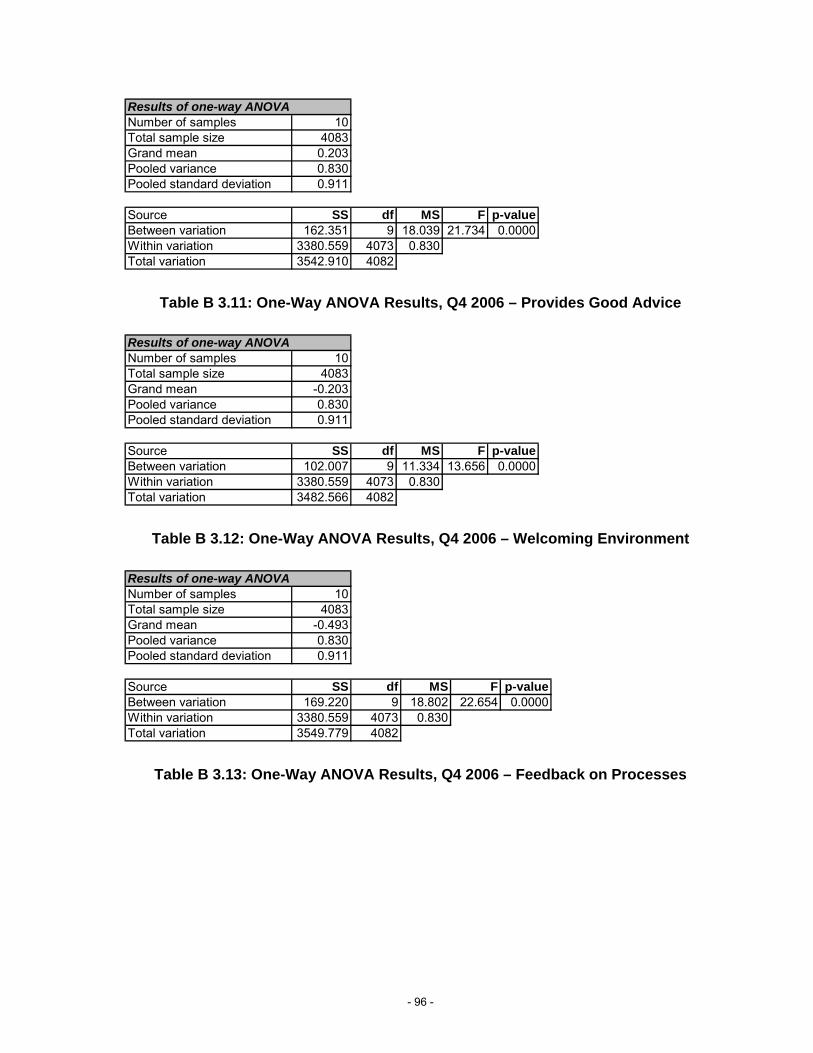
- 96 -
Results of one-way ANOVANumber of samples 10Total sample size 4083Grand mean 0.203Pooled variance 0.830Pooled standard deviation 0.911
Source SS df MS F p-valueBetween variation 162.351 9 18.039 21.734 0.0000Within variation 3380.559 4073 0.830Total variation 3542.910 4082
Table B 3.11: One-Way ANOVA Results, Q4 2006 – Provides Good Advice
Results of one-way ANOVANumber of samples 10Total sample size 4083Grand mean -0.203Pooled variance 0.830Pooled standard deviation 0.911
Source SS df MS F p-valueBetween variation 102.007 9 11.334 13.656 0.0000Within variation 3380.559 4073 0.830Total variation 3482.566 4082
Table B 3.12: One-Way ANOVA Results, Q4 2006 – Welcoming Environment
Results of one-way ANOVANumber of samples 10Total sample size 4083Grand mean -0.493Pooled variance 0.830Pooled standard deviation 0.911
Source SS df MS F p-valueBetween variation 169.220 9 18.802 22.654 0.0000Within variation 3380.559 4073 0.830Total variation 3549.779 4082
Table B 3.13: One-Way ANOVA Results, Q4 2006 – Feedback on Processes
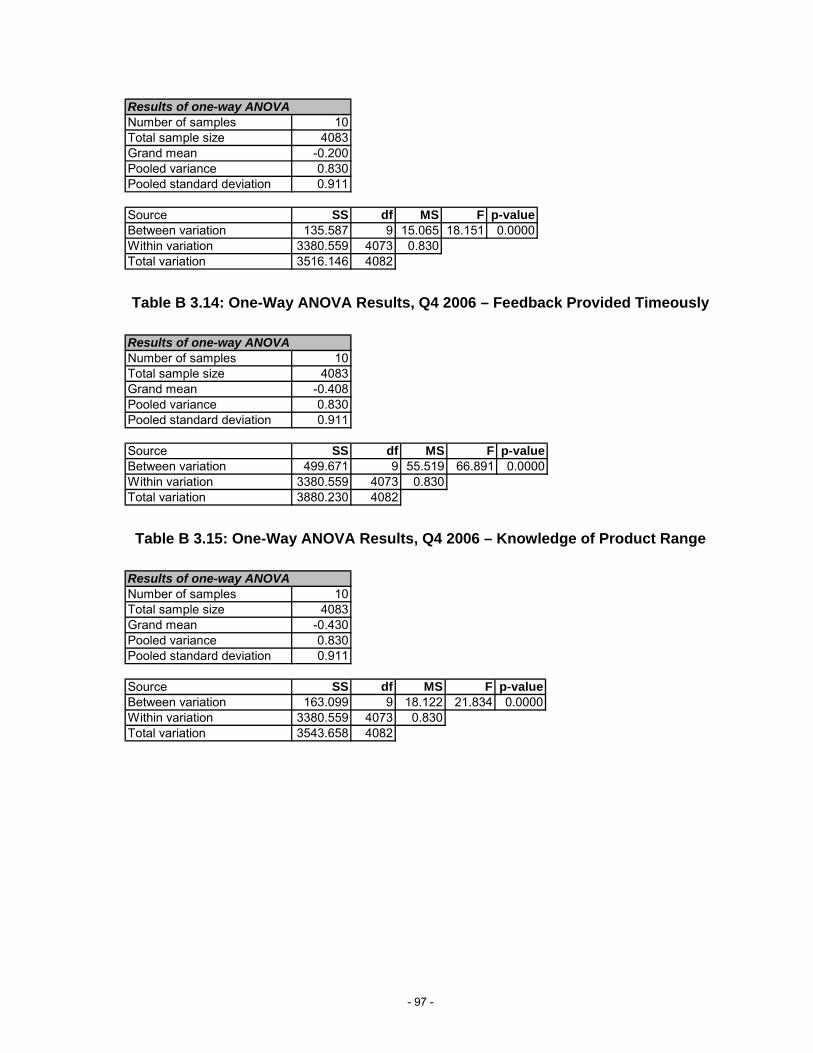
- 97 -
Results of one-way ANOVANumber of samples 10Total sample size 4083Grand mean -0.200Pooled variance 0.830Pooled standard deviation 0.911
Source SS df MS F p-valueBetween variation 135.587 9 15.065 18.151 0.0000Within variation 3380.559 4073 0.830Total variation 3516.146 4082
Table B 3.14: One-Way ANOVA Results, Q4 2006 – Feedback Provided Timeously
Results of one-way ANOVANumber of samples 10Total sample size 4083Grand mean -0.408Pooled variance 0.830Pooled standard deviation 0.911
Source SS df MS F p-valueBetween variation 499.671 9 55.519 66.891 0.0000Within variation 3380.559 4073 0.830Total variation 3880.230 4082
Table B 3.15: One-Way ANOVA Results, Q4 2006 – Knowledge of Product Range
Results of one-way ANOVANumber of samples 10Total sample size 4083Grand mean -0.430Pooled variance 0.830Pooled standard deviation 0.911
Source SS df MS F p-valueBetween variation 163.099 9 18.122 21.834 0.0000Within variation 3380.559 4073 0.830Total variation 3543.658 4082

- 98 -
Appendix B.4: T Test: Significance of Country Means – Q4 2006
Table B 4.1: T Test: Significance of Country Means, Q4 2006 - Efficient Staff
t Test: Significance of country meansBots Egypt Ghana Kenya Maur Seych Tanz Ugan Zam Zim
Std sample mean - pop mean 1.101 0.988 0.800 0.779 0.518 0.882 0.864 0.836 0.905 0.769Square Root of n 23.7 17.8 22.3 23.9 19.5 14.1 15.7 18.2 22.1 22.2Std dev / SQRT n 0.038 0.049 0.042 0.037 0.049 0.064 0.057 0.051 0.042 0.040t = 28.709 20.069 19.256 21.056 10.588 13.706 15.226 16.536 21.317 19.038df = (n-1) 559 315 495 570 379 199 247 329 487 493p-value 0.0000 0.0000 0.0000 0.0000 0.0000 0.0000 0.0000 0.0000 0.0000 0.0000
Table B 4.2: T Test: Significance of Country Means, Q4 2006 – Shorter Queues
t Test: Significance of country meansBots Egypt Ghana Kenya Maur Seych Tanz Ugan Zam Zim
Std Sample mean - pop mean 0.416 0.925 0.403 0.249 0.409 0.259 0.544 0.278 0.245 0.399Square Root of n 23.7 17.8 22.3 23.9 19.5 14.1 15.7 18.2 22.1 22.2Std dev / SQRT n 0.038 0.049 0.042 0.037 0.049 0.064 0.057 0.051 0.042 0.040t = 10.846 18.779 9.698 6.744 8.358 4.028 9.577 5.511 5.774 9.884df = (n-1) 559 315 495 570 379 199 247 329 487 493p-value 0.0000 0.0000 0.0000 0.0000 0.0000 0.0000 0.0000 0.0000 0.0000 0.0000
Table B 4.3: T Test: Significance of Country Means, Q4 2006 – Convenient Locations
t Test: Significance of country meansBots Egypt Ghana Kenya Maur Seych Tanz Ugan Zam Zim
Std Sample mean - pop mean 0.015 0.161 0.354 0.481 -0.065 -0.068 0.285 0.475 0.419 0.318Square Root of n 23.7 17.8 22.3 23.9 19.5 14.1 15.7 18.2 22.1 22.2Std dev / SQRT n 0.038 0.049 0.042 0.037 0.049 0.064 0.057 0.051 0.042 0.040t = 0.403 3.278 8.517 12.993 -1.330 -1.059 5.016 9.392 9.874 7.879df = (n-1) 559 315 495 570 379 199 247 329 487 493p-value 0.3436 0.0006 0.0000 0.0000 #NUM! #NUM! 0.0000 0.0000 0.0000 0.0000
Table B 4.4: T Test: Significance of Country Means, Q4 2006 – Friendly Staff
t Test: Significance of country meansBots Egypt Ghana Kenya Maur Seych Tanz Ugan Zam Zim
Std Sample mean - pop mean 0.022 0.117 0.586 0.069 0.299 0.019 0.480 0.203 0.191 -0.141Square Root of n 23.7 17.8 22.3 23.9 19.5 14.1 15.7 18.2 22.1 22.2Std dev / SQRT n 0.038 0.049 0.042 0.037 0.049 0.064 0.057 0.051 0.042 0.040t = 0.585 2.374 14.097 1.856 6.119 0.298 8.453 4.027 4.488 -3.499df = (n-1) 559 315 495 570 379 199 247 329 487 493p-value 0.2793 0.0091 0.0000 0.0320 0.0000 0.3828 0.0000 0.0000 0.0000 #NUM!
Table B 4.5: T Test: Significance of Country Means, Q4 2006 – After Sales Service

- 99 -
t Test: Significance of country meansBots Egypt Ghana Kenya Maur Seych Tanz Ugan Zam Zim
Std Sample mean - pop mean -0.313 0.048 -0.360 -0.282 0.043 0.513 -0.453 -0.343 -0.201 -0.165Square Root of n 23.7 17.8 22.3 23.9 19.5 14.1 15.7 18.2 22.1 22.2Std dev / SQRT n 0.038 0.049 0.042 0.037 0.049 0.064 0.057 0.051 0.042 0.040t = -8.159 0.978 -8.672 -7.638 0.877 7.960 -7.986 -6.780 -4.743 -4.091df = (n-1) 559 315 495 570 379 199 247 329 487 493p-value #NUM! 0.1643 #NUM! #NUM! 0.1906 0.0000 #NUM! #NUM! #NUM! #NUM!
Table B 4.6: T Test: Significance of Country Means, Q4 2006 – Response Time
t Test: Significance of country meansBots Egypt Ghana Kenya Maur Seych Tanz Ugan Zam Zim
Std Sample mean - pop mean -0.066 0.428 0.165 0.322 0.303 0.510 -0.119 0.094 0.037 0.167Square Root of n 23.7 17.8 22.3 23.9 19.5 14.1 15.7 18.2 22.1 22.2Std dev / SQRT n 0.038 0.049 0.042 0.037 0.049 0.064 0.057 0.051 0.042 0.040t = -1.729 8.686 3.980 8.694 6.194 7.922 -2.089 1.866 0.874 4.146df = (n-1) 559 315 495 570 379 199 247 329 487 493p-value #NUM! 0.0000 0.0000 0.0000 0.0000 0.0000 #NUM! 0.0315 0.1911 0.0000
Table B 4.7: T Test: Significance of Country Means, Q4 2006 – Reliability
t Test: Significance of country meansBots Egypt Ghana Kenya Maur Seych Tanz Ugan Zam Zim
Std Sample mean - pop mean 0.419 0.066 0.234 0.761 0.114 -0.022 0.097 0.342 0.422 0.610Square Root of n 23.7 17.8 22.3 23.9 19.5 14.1 15.7 18.2 22.1 22.2Std dev / SQRT n 0.038 0.049 0.042 0.037 0.049 0.064 0.057 0.051 0.042 0.040t = 10.931 1.330 5.640 20.567 2.333 -0.342 1.701 6.772 9.942 15.109df = (n-1) 559 315 495 570 379 199 247 329 487 493p-value 0.0000 0.0922 0.0000 0.0000 0.0101 #NUM! 0.0451 0.0000 0.0000 0.0000
Table B 4.8: T Test: Significance of Country Means, Q4 2006 – Appearance of Facilities
t Test: Significance of country meansBots Egypt Ghana Kenya Maur Seych Tanz Ugan Zam Zim
Std Sample mean - pop mean -0.357 -0.477 -0.303 -0.250 -0.173 -0.370 -0.168 -0.375 -0.326 -0.571Square Root of n 23.7 17.8 22.3 23.9 19.5 14.1 15.7 18.2 22.1 22.2Std dev / SQRT n 0.038 0.049 0.042 0.037 0.049 0.064 0.057 0.051 0.042 0.040t = -9.315 -9.689 -7.303 -6.759 -3.538 -5.747 -2.955 -7.424 -7.675 -14.148df = (n-1) 559 315 495 570 379 199 247 329 487 493p-value #NUM! #NUM! #NUM! #NUM! #NUM! #NUM! #NUM! #NUM! #NUM! #NUM!
Table B 4.9: T Test: Significance of Country Means, Q4 2006 – Long Term Relationships

- 100 -
t Test: Significance of country meansBots Egypt Ghana Kenya Maur Seych Tanz Ugan Zam Zim
Std Sample mean - pop mean -0.356 -0.222 -0.249 0.088 -0.257 -0.254 -0.224 -0.190 0.030 0.018Square Root of n 23.7 17.8 22.3 23.9 19.5 14.1 15.7 18.2 22.1 22.2Std dev / SQRT n 0.038 0.049 0.042 0.037 0.049 0.064 0.057 0.051 0.042 0.040t = -9.286 -4.504 -6.002 2.387 -5.251 -3.944 -3.939 -3.756 0.718 0.449df = (n-1) 559 315 495 570 379 199 247 329 487 493p-value #NUM! #NUM! #NUM! 0.0087 #NUM! #NUM! #NUM! #NUM! 0.2366 0.3268
Table B 4.10 T Test: Significance of Country Means, Q4 2006 – Understands Personal Banking Needs
t Test: Significance of country meansBots Egypt Ghana Kenya Maur Seych Tanz Ugan Zam Zim
Std Sample mean - pop mean 0.236 0.352 -0.080 0.383 0.173 0.176 -0.299 0.304 0.127 0.438Square Root of n 23.7 17.8 22.3 23.9 19.5 14.1 15.7 18.2 22.1 22.2Std dev / SQRT n 0.038 0.049 0.042 0.037 0.049 0.064 0.057 0.051 0.042 0.040t = 6.142 7.153 -1.916 10.365 3.543 2.737 -5.273 6.008 2.997 10.850df = (n-1) 559 315 495 570 379 199 247 329 487 493p-value 0.0000 0.0000 #NUM! 0.0000 0.0002 0.0034 #NUM! 0.0000 0.0014 0.0000
Table B 4.11 T Test: Significance of Country Means, Q4 2006 – Provides Good Advice
t Test: Significance of country meansBots Egypt Ghana Kenya Maur Seych Tanz Ugan Zam Zim
Std Sample mean - pop mean -0.232 -0.348 -0.255 -0.166 0.063 0.269 -0.399 -0.324 -0.172 -0.318Square Root of n 23.7 17.8 22.3 23.9 19.5 14.1 15.7 18.2 22.1 22.2Std dev / SQRT n 0.038 0.049 0.042 0.037 0.049 0.064 0.057 0.051 0.042 0.040t = -6.038 -7.071 -6.131 -4.499 1.279 4.182 -7.031 -6.414 -4.051 -7.876df = (n-1) 559 315 495 570 379 199 247 329 487 493p-value #NUM! #NUM! #NUM! #NUM! 0.1008 0.0000 #NUM! #NUM! #NUM! #NUM!
Table B 4.12: T Test: Significance of Country Means, Q4 2006 – Welcoming Environment
t Test: Significance of country meansBots Egypt Ghana Kenya Maur Seych Tanz Ugan Zam Zim
Std Sample mean - pop mean -0.487 -0.810 -0.447 -0.542 -0.177 -0.266 -0.299 -0.672 -0.288 -0.799Square Root of n 23.7 17.8 22.3 23.9 19.5 14.1 15.7 18.2 22.1 22.2Std dev / SQRT n 0.038 0.049 0.042 0.037 0.049 0.064 0.057 0.051 0.042 0.040t = -12.706 -16.442 -10.751 -14.663 -3.623 -4.129 -5.262 -13.293 -6.777 -19.790df = (n-1) 559 315 495 570 379 199 247 329 487 493p-value #NUM! #NUM! #NUM! #NUM! #NUM! #NUM! #NUM! #NUM! #NUM! #NUM!
Table B 4.13: T Test: Significance of Country Means, Q4 2006 – Feedback on Processes

- 101 -
t Test: Significance of country meansBots Egypt Ghana Kenya Maur Seych Tanz Ugan Zam Zim
Std Sample mean - pop mean -0.178 -0.204 -0.241 -0.190 -0.169 -0.044 -0.004 -0.334 -0.585 0.089Square Root of n 23.7 17.8 22.3 23.9 19.5 14.1 15.7 18.2 22.1 22.2Std dev / SQRT n 0.038 0.049 0.042 0.037 0.049 0.064 0.057 0.051 0.042 0.040t = -4.632 -4.139 -5.798 -5.131 -3.449 -0.690 -0.065 -6.613 -13.778 2.215df = (n-1) 559 315 495 570 379 199 247 329 487 493p-value #NUM! #NUM! #NUM! #NUM! #NUM! #NUM! #NUM! #NUM! #NUM! 0.0136
Table B 4.14: T Test: Significance of Country Means, Q4 2006 – Feedback Provided Timeously
t Test: Significance of country meansBots Egypt Ghana Kenya Maur Seych Tanz Ugan Zam Zim
Std Sample mean - pop mean -0.181 -0.716 -0.167 -1.023 -0.534 -0.838 0.059 0.109 -0.446 -0.269Square Root of n 23.7 17.8 22.3 23.9 19.5 14.1 15.7 18.2 22.1 22.2Std dev / SQRT n 0.038 0.049 0.042 0.037 0.049 0.064 0.057 0.051 0.042 0.040t = -4.721 -14.531 -4.014 -27.672 -10.920 -13.020 1.042 2.162 -10.517 -6.651df = (n-1) 559 315 495 570 379 199 247 329 487 493p-value #NUM! #NUM! #NUM! #NUM! #NUM! #NUM! 0.1493 0.0157 #NUM! #NUM!
Table B 4.15: T Test: Significance of Country Means, Q4 2006 – Knowledge of Product Range
t Test: Significance of country meansBots Egypt Ghana Kenya Maur Seych Tanz Ugan Zam Zim
Std Sample mean - pop mean -0.040 -0.309 -0.440 -0.677 -0.547 -0.766 -0.364 -0.404 -0.359 -0.546Square Root of n 23.7 17.8 22.3 23.9 19.5 14.1 15.7 18.2 22.1 22.2Std dev / SQRT n 0.038 0.049 0.042 0.037 0.049 0.064 0.057 0.051 0.042 0.040t = -1.030 -6.269 -10.601 -18.301 -11.180 -11.902 -6.413 -7.995 -8.445 -13.516df = (n-1) 559 315 495 570 379 199 247 329 487 493p-value #NUM! #NUM! #NUM! #NUM! #NUM! #NUM! #NUM! #NUM! #NUM! #NUM!
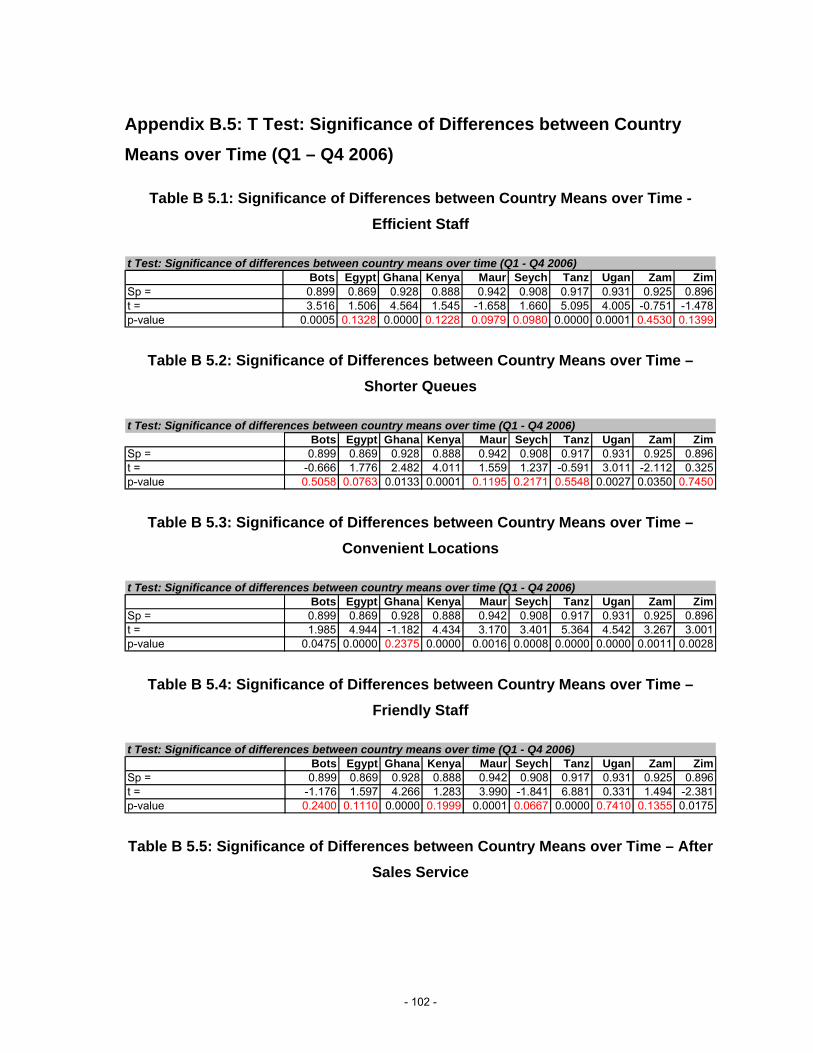
- 102 -
Appendix B.5: T Test: Significance of Differences between Country Means over Time (Q1 – Q4 2006)
Table B 5.1: Significance of Differences between Country Means over Time - Efficient Staff
t Test: Significance of differences between country means over time (Q1 - Q4 2006)Bots Egypt Ghana Kenya Maur Seych Tanz Ugan Zam Zim
Sp = 0.899 0.869 0.928 0.888 0.942 0.908 0.917 0.931 0.925 0.896t = 3.516 1.506 4.564 1.545 -1.658 1.660 5.095 4.005 -0.751 -1.478p-value 0.0005 0.1328 0.0000 0.1228 0.0979 0.0980 0.0000 0.0001 0.4530 0.1399
Table B 5.2: Significance of Differences between Country Means over Time – Shorter Queues
t Test: Significance of differences between country means over time (Q1 - Q4 2006)Bots Egypt Ghana Kenya Maur Seych Tanz Ugan Zam Zim
Sp = 0.899 0.869 0.928 0.888 0.942 0.908 0.917 0.931 0.925 0.896t = -0.666 1.776 2.482 4.011 1.559 1.237 -0.591 3.011 -2.112 0.325p-value 0.5058 0.0763 0.0133 0.0001 0.1195 0.2171 0.5548 0.0027 0.0350 0.7450
Table B 5.3: Significance of Differences between Country Means over Time – Convenient Locations
t Test: Significance of differences between country means over time (Q1 - Q4 2006)Bots Egypt Ghana Kenya Maur Seych Tanz Ugan Zam Zim
Sp = 0.899 0.869 0.928 0.888 0.942 0.908 0.917 0.931 0.925 0.896t = 1.985 4.944 -1.182 4.434 3.170 3.401 5.364 4.542 3.267 3.001p-value 0.0475 0.0000 0.2375 0.0000 0.0016 0.0008 0.0000 0.0000 0.0011 0.0028
Table B 5.4: Significance of Differences between Country Means over Time – Friendly Staff
t Test: Significance of differences between country means over time (Q1 - Q4 2006)Bots Egypt Ghana Kenya Maur Seych Tanz Ugan Zam Zim
Sp = 0.899 0.869 0.928 0.888 0.942 0.908 0.917 0.931 0.925 0.896t = -1.176 1.597 4.266 1.283 3.990 -1.841 6.881 0.331 1.494 -2.381p-value 0.2400 0.1110 0.0000 0.1999 0.0001 0.0667 0.0000 0.7410 0.1355 0.0175
Table B 5.5: Significance of Differences between Country Means over Time – After Sales Service
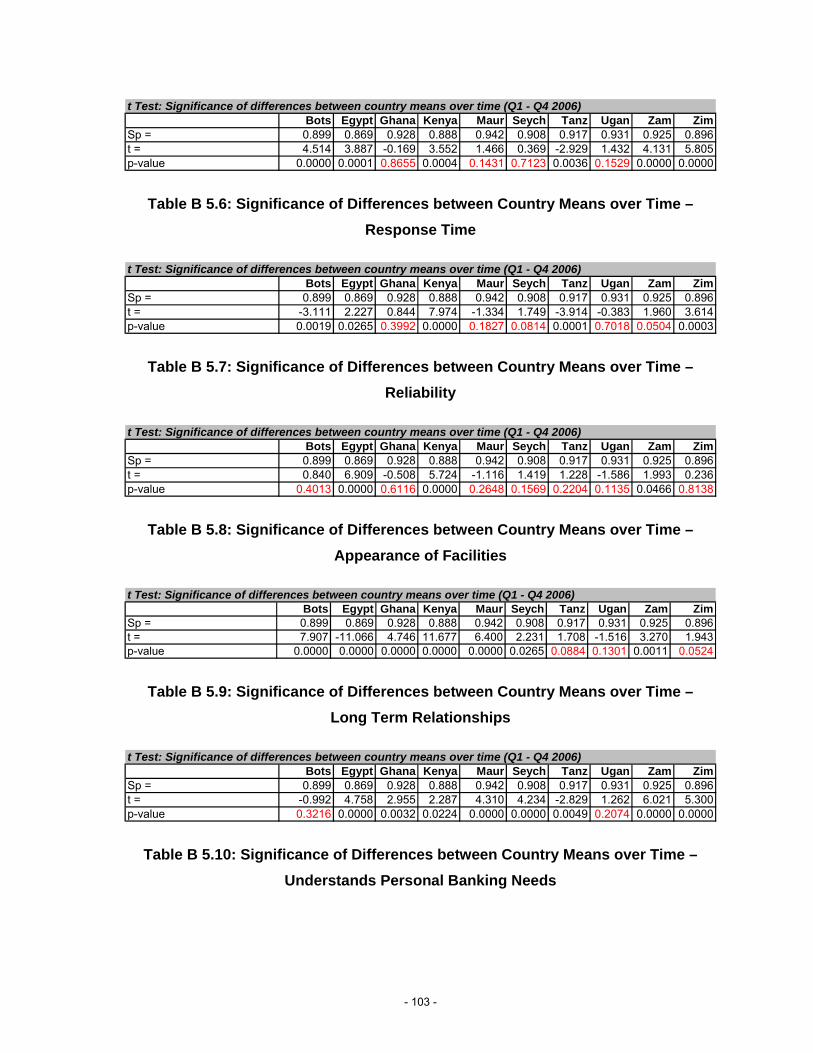
- 103 -
t Test: Significance of differences between country means over time (Q1 - Q4 2006)Bots Egypt Ghana Kenya Maur Seych Tanz Ugan Zam Zim
Sp = 0.899 0.869 0.928 0.888 0.942 0.908 0.917 0.931 0.925 0.896t = 4.514 3.887 -0.169 3.552 1.466 0.369 -2.929 1.432 4.131 5.805p-value 0.0000 0.0001 0.8655 0.0004 0.1431 0.7123 0.0036 0.1529 0.0000 0.0000
Table B 5.6: Significance of Differences between Country Means over Time – Response Time
t Test: Significance of differences between country means over time (Q1 - Q4 2006)Bots Egypt Ghana Kenya Maur Seych Tanz Ugan Zam Zim
Sp = 0.899 0.869 0.928 0.888 0.942 0.908 0.917 0.931 0.925 0.896t = -3.111 2.227 0.844 7.974 -1.334 1.749 -3.914 -0.383 1.960 3.614p-value 0.0019 0.0265 0.3992 0.0000 0.1827 0.0814 0.0001 0.7018 0.0504 0.0003
Table B 5.7: Significance of Differences between Country Means over Time – Reliability
t Test: Significance of differences between country means over time (Q1 - Q4 2006)Bots Egypt Ghana Kenya Maur Seych Tanz Ugan Zam Zim
Sp = 0.899 0.869 0.928 0.888 0.942 0.908 0.917 0.931 0.925 0.896t = 0.840 6.909 -0.508 5.724 -1.116 1.419 1.228 -1.586 1.993 0.236p-value 0.4013 0.0000 0.6116 0.0000 0.2648 0.1569 0.2204 0.1135 0.0466 0.8138
Table B 5.8: Significance of Differences between Country Means over Time – Appearance of Facilities
t Test: Significance of differences between country means over time (Q1 - Q4 2006)Bots Egypt Ghana Kenya Maur Seych Tanz Ugan Zam Zim
Sp = 0.899 0.869 0.928 0.888 0.942 0.908 0.917 0.931 0.925 0.896t = 7.907 -11.066 4.746 11.677 6.400 2.231 1.708 -1.516 3.270 1.943p-value 0.0000 0.0000 0.0000 0.0000 0.0000 0.0265 0.0884 0.1301 0.0011 0.0524
Table B 5.9: Significance of Differences between Country Means over Time – Long Term Relationships
t Test: Significance of differences between country means over time (Q1 - Q4 2006)Bots Egypt Ghana Kenya Maur Seych Tanz Ugan Zam Zim
Sp = 0.899 0.869 0.928 0.888 0.942 0.908 0.917 0.931 0.925 0.896t = -0.992 4.758 2.955 2.287 4.310 4.234 -2.829 1.262 6.021 5.300p-value 0.3216 0.0000 0.0032 0.0224 0.0000 0.0000 0.0049 0.2074 0.0000 0.0000
Table B 5.10: Significance of Differences between Country Means over Time – Understands Personal Banking Needs
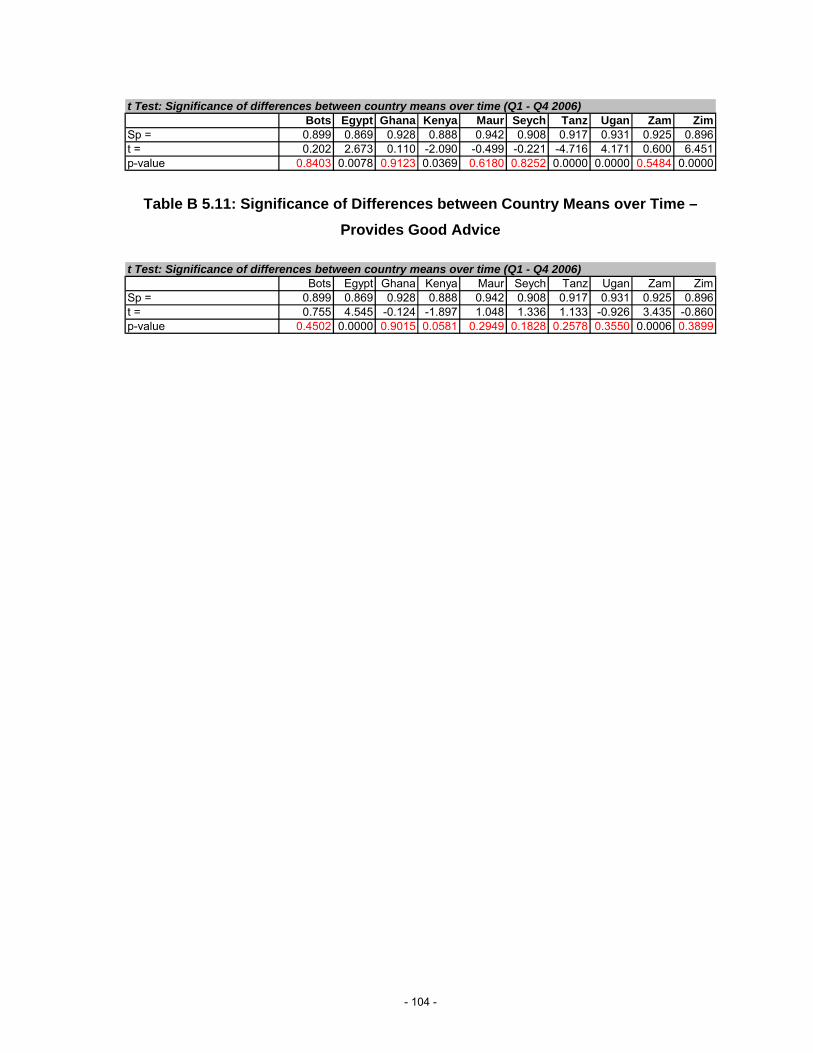
- 104 -
t Test: Significance of differences between country means over time (Q1 - Q4 2006)Bots Egypt Ghana Kenya Maur Seych Tanz Ugan Zam Zim
Sp = 0.899 0.869 0.928 0.888 0.942 0.908 0.917 0.931 0.925 0.896t = 0.202 2.673 0.110 -2.090 -0.499 -0.221 -4.716 4.171 0.600 6.451p-value 0.8403 0.0078 0.9123 0.0369 0.6180 0.8252 0.0000 0.0000 0.5484 0.0000
Table B 5.11: Significance of Differences between Country Means over Time – Provides Good Advice
t Test: Significance of differences between country means over time (Q1 - Q4 2006)Bots Egypt Ghana Kenya Maur Seych Tanz Ugan Zam Zim
Sp = 0.899 0.869 0.928 0.888 0.942 0.908 0.917 0.931 0.925 0.896t = 0.755 4.545 -0.124 -1.897 1.048 1.336 1.133 -0.926 3.435 -0.860p-value 0.4502 0.0000 0.9015 0.0581 0.2949 0.1828 0.2578 0.3550 0.0006 0.3899

- 105 -
APPENDIX C: DATA FREQUENCY TABLES
Appendix C.1: Data Frequency Tables – Q4 2006
The data was summarised by tabulating the frequency (and proportion) of occurrence of
each preference permutation, as illustrated below.
Table C 1.1: Botswana - Frequency Count and Proportions of Attributes
BotswanaRank (Count) 1 2 3 4 5 6 7 8 9 10 11 12 13 14 15
1 216 77 29 32 18 15 41 6 16 37 13 4 27 6 232 85 66 40 47 7 36 58 19 15 65 33 12 36 16 253 57 40 43 21 15 37 76 26 21 57 28 22 41 33 434 202 377 448 460 520 472 385 509 508 401 486 522 456 505 469
Rank (Proportion) 1 2 3 4 5 6 7 8 9 10 11 12 13 14 151 0.4 0.1 0.1 0.1 0 0 0.1 0 0 0.1 0 0 0 0 02 0.2 0.1 0.1 0.1 0 0.1 0.1 0 0 0.1 0.1 0 0.1 0 03 0.1 0.1 0.1 0 0 0.1 0.1 0 0 0.1 0.1 0 0.1 0.1 0.14 0.4 0.7 0.8 0.8 0.9 0.8 0.7 0.9 0.9 0.7 0.9 0.9 0.8 0.9 0.8
Attribute
Table C 1.2: Egypt - Frequency Count and Proportions of Attributes
EgyptRank (Count) 1 2 3 4 5 6 7 8 9 10 11 12 13 14 15
1 99 86 19 23 10 24 11 0 5 25 1 1 4 2 62 53 55 23 26 19 38 19 7 11 29 12 4 13 1 63 27 31 25 20 22 44 29 8 20 38 16 4 15 10 74 137 144 249 247 265 210 257 301 280 224 287 307 284 303 297
Rank (Proportion) 1 2 3 4 5 6 7 8 9 10 11 12 13 14 151 0.3 0.3 0.1 0.1 0 0.1 0 0 0 0.1 0 0 0 0 02 0.2 0.2 0.1 0.1 0.1 0.1 0.1 0 0 0.1 0 0 0 0 03 0.1 0.1 0.1 0.1 0.1 0.1 0.1 0 0.1 0.1 0.1 0 0 0 04 0.4 0.5 0.8 0.8 0.8 0.7 0.8 1 0.9 0.7 0.9 1 0.9 1 0.9
Attribute
Table C 1.3: Ghana - Frequency Count and Proportions of Attributes

- 106 -
GhanaRank (Count) 1 2 3 4 5 6 7 8 9 10 11 12 13 14 15
1 128 52 61 76 17 34 35 9 7 33 13 5 8 11 72 65 64 39 68 16 54 45 25 27 23 14 19 16 9 123 47 41 43 40 26 35 52 23 28 26 49 24 22 19 214 256 339 353 312 437 373 364 439 434 414 420 448 450 457 456
Rank (Proportion) 1 2 3 4 5 6 7 8 9 10 11 12 13 14 151 0.3 0.1 0.1 0.2 0 0.1 0.1 0 0 0.1 0 0 0 0 02 0.1 0.1 0.1 0.1 0 0.1 0.1 0.1 0.1 0 0 0 0 0 03 0.1 0.1 0.1 0.1 0.1 0.1 0.1 0 0.1 0.1 0.1 0 0 0 04 0.5 0.7 0.7 0.6 0.9 0.8 0.7 0.9 0.9 0.8 0.8 0.9 0.9 0.9 0.9
Attribute
Table C 1.4: Kenya - Frequency Count and Proportions of Attributes
KenyaRank (Count) 1 2 3 4 5 6 7 8 9 10 11 12 13 14 15
1 138 58 74 31 9 34 106 6 26 59 14 5 6 4 12 66 49 68 41 15 50 97 23 47 61 31 12 4 4 33 73 43 56 32 22 81 71 27 45 50 30 19 7 7 84 294 421 373 467 525 406 297 515 453 401 496 535 554 556 559
Rank (Proportion) 1 2 3 4 5 6 7 8 9 10 11 12 13 14 151 0.2 0.1 0.1 0.1 0 0.1 0.2 0 0 0.1 0 0 0 0 02 0.1 0.1 0.1 0.1 0 0.1 0.2 0 0.1 0.1 0.1 0 0 0 03 0.1 0.1 0.1 0.1 0 0.1 0.1 0 0.1 0.1 0.1 0 0 0 04 0.5 0.7 0.7 0.8 0.9 0.7 0.5 0.9 0.8 0.7 0.9 0.9 1 1 1
Attribute
Table C 1.5: Mauritius - Frequency Count and Proportions of Attributes
MauritiusRank (Count) 1 2 3 4 5 6 7 8 9 10 11 12 13 14 15
1 64 56 15 47 25 32 33 13 10 31 23 19 2 3 72 45 48 26 30 27 44 22 16 13 35 25 18 11 8 123 31 27 19 34 28 38 25 21 15 38 40 25 13 10 164 240 249 320 269 300 266 300 330 342 276 292 318 354 359 345
Rank (Proportion) 1 2 3 4 5 6 7 8 9 10 11 12 13 14 151 0.2 0.1 0 0.1 0.1 0.1 0.1 0 0 0.1 0.1 0.1 0 0 02 0.1 0.1 0.1 0.1 0.1 0.1 0.1 0 0 0.1 0.1 0 0 0 03 0.1 0.1 0.1 0.1 0.1 0.1 0.1 0.1 0 0.1 0.1 0.1 0 0 04 0.6 0.7 0.8 0.7 0.8 0.7 0.8 0.9 0.9 0.7 0.8 0.8 0.9 0.9 0.9
Attribute
Table C 1.6: Seychelles - Frequency Count and Proportions of Attributes

- 107 -
SeychellesRank (Count) 1 2 3 4 5 6 7 8 9 10 11 12 13 14 15
1 52 14 11 10 27 32 6 4 4 12 15 8 3 1 12 24 21 13 19 26 26 11 3 11 17 13 8 2 6 03 26 18 8 16 16 16 13 7 7 28 26 7 1 4 74 98 147 168 155 131 126 170 186 178 143 146 177 194 189 192
Rank (Proportion) 1 2 3 4 5 6 7 8 9 10 11 12 13 14 151 0.3 0.1 0.1 0.1 0.1 0.2 0 0 0 0.1 0.1 0 0 0 02 0.1 0.1 0.1 0.1 0.1 0.1 0.1 0 0.1 0.1 0.1 0 0 0 03 0.1 0.1 0 0.1 0.1 0.1 0.1 0 0 0.1 0.1 0 0 0 04 0.5 0.7 0.8 0.8 0.7 0.6 0.9 0.9 0.9 0.7 0.7 0.9 1 0.9 1
Attribute
Table C 1.7: Tanzania - Frequency Count and Proportions of Attributes
TanzaniaRank (Count) 1 2 3 4 5 6 7 8 9 10 11 12 13 14 15
1 75 41 17 24 4 6 14 10 10 11 6 7 9 5 92 30 38 26 39 6 16 27 7 14 7 8 9 8 8 53 27 21 26 44 10 20 18 17 9 12 11 14 3 6 104 116 148 179 141 228 206 189 214 215 218 223 218 228 229 224
Rank (Proportion) 1 2 3 4 5 6 7 8 9 10 11 12 13 14 151 0.3 0.2 0.1 0.1 0 0 0.1 0 0 0 0 0 0 0 02 0.1 0.2 0.1 0.2 0 0.1 0.1 0 0.1 0 0 0 0 0 03 0.1 0.1 0.1 0.2 0 0.1 0.1 0.1 0 0 0 0.1 0 0 04 0.5 0.6 0.7 0.6 0.9 0.8 0.8 0.9 0.9 0.9 0.9 0.9 0.9 0.9 0.9
Attribute
Table C 1.8: Uganda - Frequency Count and Proportions of Attributes
UgandaRank (Count) 1 2 3 4 5 6 7 8 9 10 11 12 13 14 15
1 86 24 48 29 3 11 35 4 13 38 9 4 6 5 152 49 39 31 30 17 26 35 11 14 29 7 6 13 12 113 45 32 34 24 9 23 30 13 18 27 15 10 11 15 244 150 235 217 247 301 270 230 302 285 236 299 310 300 298 280
Rank (Proportion) 1 2 3 4 5 6 7 8 9 10 11 12 13 14 151 0.3 0.1 0.1 0.1 0 0 0.1 0 0 0.1 0 0 0 0 02 0.1 0.1 0.1 0.1 0.1 0.1 0.1 0 0 0.1 0 0 0 0 03 0.1 0.1 0.1 0.1 0 0.1 0.1 0 0.1 0.1 0 0 0 0 0.14 0.5 0.7 0.7 0.7 0.9 0.8 0.7 0.9 0.9 0.7 0.9 0.9 0.9 0.9 0.8
Attribute
Table C 1.9: Zambia - Frequency Count and Proportions of Attributes
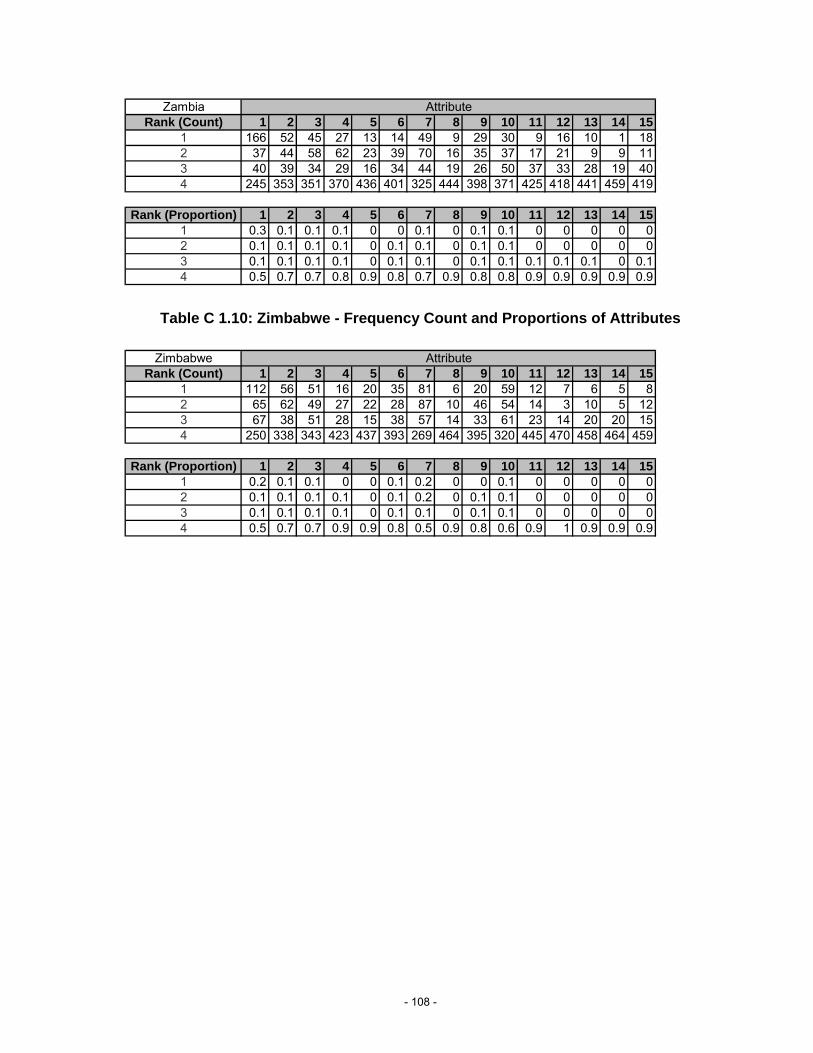
- 108 -
ZambiaRank (Count) 1 2 3 4 5 6 7 8 9 10 11 12 13 14 15
1 166 52 45 27 13 14 49 9 29 30 9 16 10 1 182 37 44 58 62 23 39 70 16 35 37 17 21 9 9 113 40 39 34 29 16 34 44 19 26 50 37 33 28 19 404 245 353 351 370 436 401 325 444 398 371 425 418 441 459 419
Rank (Proportion) 1 2 3 4 5 6 7 8 9 10 11 12 13 14 151 0.3 0.1 0.1 0.1 0 0 0.1 0 0.1 0.1 0 0 0 0 02 0.1 0.1 0.1 0.1 0 0.1 0.1 0 0.1 0.1 0 0 0 0 03 0.1 0.1 0.1 0.1 0 0.1 0.1 0 0.1 0.1 0.1 0.1 0.1 0 0.14 0.5 0.7 0.7 0.8 0.9 0.8 0.7 0.9 0.8 0.8 0.9 0.9 0.9 0.9 0.9
Attribute
Table C 1.10: Zimbabwe - Frequency Count and Proportions of Attributes
ZimbabweRank (Count) 1 2 3 4 5 6 7 8 9 10 11 12 13 14 15
1 112 56 51 16 20 35 81 6 20 59 12 7 6 5 82 65 62 49 27 22 28 87 10 46 54 14 3 10 5 123 67 38 51 28 15 38 57 14 33 61 23 14 20 20 154 250 338 343 423 437 393 269 464 395 320 445 470 458 464 459
Rank (Proportion) 1 2 3 4 5 6 7 8 9 10 11 12 13 14 151 0.2 0.1 0.1 0 0 0.1 0.2 0 0 0.1 0 0 0 0 02 0.1 0.1 0.1 0.1 0 0.1 0.2 0 0.1 0.1 0 0 0 0 03 0.1 0.1 0.1 0.1 0 0.1 0.1 0 0.1 0.1 0 0 0 0 04 0.5 0.7 0.7 0.9 0.9 0.8 0.5 0.9 0.8 0.6 0.9 1 0.9 0.9 0.9
Attribute

- 109 -
Appendix C.2: Data Frequency Tables – Q1 2006
The data was summarised by tabulating the frequency (and proportion) of occurrence of
each preference permutation, as illustrated below.
Table C 2.1: Botswana - Frequency Count and Proportions of Attributes
BotswanaRank (Count) 1 2 3 4 5 6 7 8 9 10 11
1 102 51 15 27 6 16 33 3 13 28 62 49 53 24 23 10 42 48 6 9 29 73 35 28 22 32 10 34 37 6 23 42 314 114 168 239 218 274 208 182 285 255 201 256
Rank (Proportion) 1 2 3 4 5 6 7 8 9 10 111 0.3 0.2 0.1 0.1 0 0.1 0.1 0 0 0.1 02 0.2 0.2 0.1 0.1 0 0.1 0.2 0 0 0.1 03 0.1 0.1 0.1 0.1 0 0.1 0.1 0 0.1 0.1 0.14 0.4 0.6 0.8 0.7 0.9 0.7 0.6 1 0.9 0.7 0.9
Attribute
Table C 2.2: Egypt - Frequency Count and Proportions of Attributes
EgyptRank (Count) 1 2 3 4 5 6 7 8 9 10 11
1 51 32 6 6 3 9 3 22 5 13 22 21 35 8 16 9 24 4 21 0 13 13 19 26 10 12 10 15 7 24 5 18 64 61 59 128 118 130 104 138 85 142 108 143
Rank (Proportion) 1 2 3 4 5 6 7 8 9 10 111 0.3 0.2 0 0 0 0.1 0 0 0 0.1 02 0.1 0.2 0.1 0.1 0.1 0.2 0 0.1 0 0.1 03 0.1 0.2 0.1 0.1 0.1 0.1 0 0.2 0 0.1 04 0.4 0.4 0.8 0.8 0.9 0.7 0.9 0.6 0.9 0.7 0.9
Attribute
Table C 2.3: Ghana - Frequency Count and Proportions of Attributes
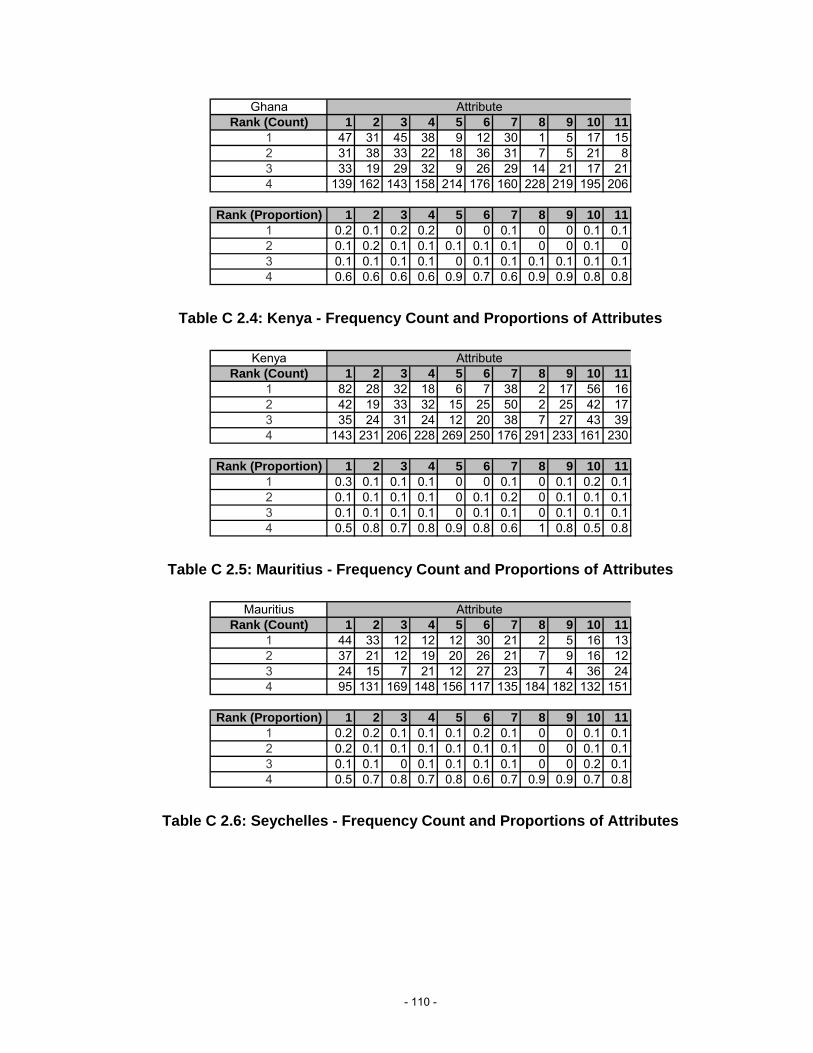
- 110 -
GhanaRank (Count) 1 2 3 4 5 6 7 8 9 10 11
1 47 31 45 38 9 12 30 1 5 17 152 31 38 33 22 18 36 31 7 5 21 83 33 19 29 32 9 26 29 14 21 17 214 139 162 143 158 214 176 160 228 219 195 206
Rank (Proportion) 1 2 3 4 5 6 7 8 9 10 111 0.2 0.1 0.2 0.2 0 0 0.1 0 0 0.1 0.12 0.1 0.2 0.1 0.1 0.1 0.1 0.1 0 0 0.1 03 0.1 0.1 0.1 0.1 0 0.1 0.1 0.1 0.1 0.1 0.14 0.6 0.6 0.6 0.6 0.9 0.7 0.6 0.9 0.9 0.8 0.8
Attribute
Table C 2.4: Kenya - Frequency Count and Proportions of Attributes
KenyaRank (Count) 1 2 3 4 5 6 7 8 9 10 11
1 82 28 32 18 6 7 38 2 17 56 162 42 19 33 32 15 25 50 2 25 42 173 35 24 31 24 12 20 38 7 27 43 394 143 231 206 228 269 250 176 291 233 161 230
Rank (Proportion) 1 2 3 4 5 6 7 8 9 10 111 0.3 0.1 0.1 0.1 0 0 0.1 0 0.1 0.2 0.12 0.1 0.1 0.1 0.1 0 0.1 0.2 0 0.1 0.1 0.13 0.1 0.1 0.1 0.1 0 0.1 0.1 0 0.1 0.1 0.14 0.5 0.8 0.7 0.8 0.9 0.8 0.6 1 0.8 0.5 0.8
Attribute
Table C 2.5: Mauritius - Frequency Count and Proportions of Attributes
MauritiusRank (Count) 1 2 3 4 5 6 7 8 9 10 11
1 44 33 12 12 12 30 21 2 5 16 132 37 21 12 19 20 26 21 7 9 16 123 24 15 7 21 12 27 23 7 4 36 244 95 131 169 148 156 117 135 184 182 132 151
Rank (Proportion) 1 2 3 4 5 6 7 8 9 10 111 0.2 0.2 0.1 0.1 0.1 0.2 0.1 0 0 0.1 0.12 0.2 0.1 0.1 0.1 0.1 0.1 0.1 0 0 0.1 0.13 0.1 0.1 0 0.1 0.1 0.1 0.1 0 0 0.2 0.14 0.5 0.7 0.8 0.7 0.8 0.6 0.7 0.9 0.9 0.7 0.8
Attribute
Table C 2.6: Seychelles - Frequency Count and Proportions of Attributes
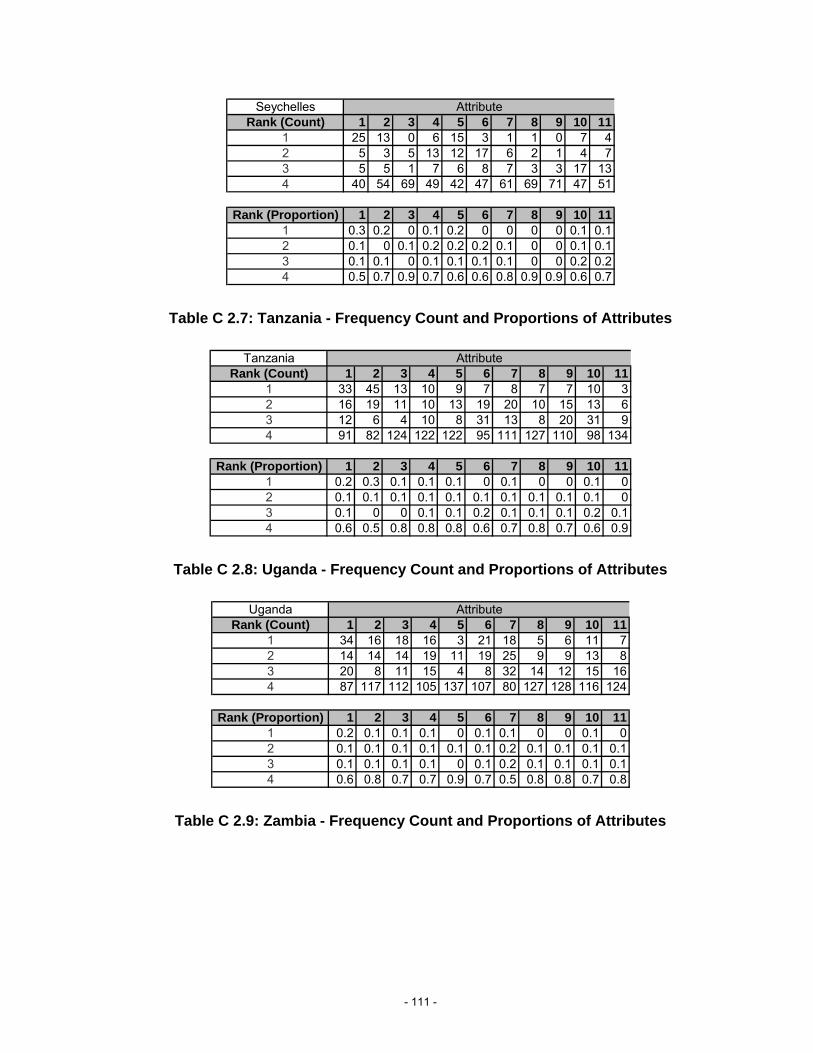
- 111 -
SeychellesRank (Count) 1 2 3 4 5 6 7 8 9 10 11
1 25 13 0 6 15 3 1 1 0 7 42 5 3 5 13 12 17 6 2 1 4 73 5 5 1 7 6 8 7 3 3 17 134 40 54 69 49 42 47 61 69 71 47 51
Rank (Proportion) 1 2 3 4 5 6 7 8 9 10 111 0.3 0.2 0 0.1 0.2 0 0 0 0 0.1 0.12 0.1 0 0.1 0.2 0.2 0.2 0.1 0 0 0.1 0.13 0.1 0.1 0 0.1 0.1 0.1 0.1 0 0 0.2 0.24 0.5 0.7 0.9 0.7 0.6 0.6 0.8 0.9 0.9 0.6 0.7
Attribute
Table C 2.7: Tanzania - Frequency Count and Proportions of Attributes
TanzaniaRank (Count) 1 2 3 4 5 6 7 8 9 10 11
1 33 45 13 10 9 7 8 7 7 10 32 16 19 11 10 13 19 20 10 15 13 63 12 6 4 10 8 31 13 8 20 31 94 91 82 124 122 122 95 111 127 110 98 134
Rank (Proportion) 1 2 3 4 5 6 7 8 9 10 111 0.2 0.3 0.1 0.1 0.1 0 0.1 0 0 0.1 02 0.1 0.1 0.1 0.1 0.1 0.1 0.1 0.1 0.1 0.1 03 0.1 0 0 0.1 0.1 0.2 0.1 0.1 0.1 0.2 0.14 0.6 0.5 0.8 0.8 0.8 0.6 0.7 0.8 0.7 0.6 0.9
Attribute
Table C 2.8: Uganda - Frequency Count and Proportions of Attributes
UgandaRank (Count) 1 2 3 4 5 6 7 8 9 10 11
1 34 16 18 16 3 21 18 5 6 11 72 14 14 14 19 11 19 25 9 9 13 83 20 8 11 15 4 8 32 14 12 15 164 87 117 112 105 137 107 80 127 128 116 124
Rank (Proportion) 1 2 3 4 5 6 7 8 9 10 111 0.2 0.1 0.1 0.1 0 0.1 0.1 0 0 0.1 02 0.1 0.1 0.1 0.1 0.1 0.1 0.2 0.1 0.1 0.1 0.13 0.1 0.1 0.1 0.1 0 0.1 0.2 0.1 0.1 0.1 0.14 0.6 0.8 0.7 0.7 0.9 0.7 0.5 0.8 0.8 0.7 0.8
Attribute
Table C 2.9: Zambia - Frequency Count and Proportions of Attributes

- 112 -
ZambiaRank (Count) 1 2 3 4 5 6 7 8 9 10 11
1 94 30 24 21 5 12 26 6 6 23 32 34 41 34 28 11 18 29 8 14 18 153 31 36 22 23 12 26 35 12 12 28 134 91 143 170 178 222 194 160 224 218 181 219
Rank (Proportion) 1 2 3 4 5 6 7 8 9 10 111 0.4 0.1 0.1 0.1 0 0 0.1 0 0 0.1 02 0.1 0.2 0.1 0.1 0 0.1 0.1 0 0.1 0.1 0.13 0.1 0.1 0.1 0.1 0 0.1 0.1 0 0 0.1 0.14 0.4 0.6 0.7 0.7 0.9 0.8 0.6 0.9 0.9 0.7 0.9
Attribute
Table C 2.10: Zimbabwe - Frequency Count and Proportions of Attributes
ZimbabweRank (Count) 1 2 3 4 5 6 7 8 9 10 11
1 81 37 17 14 3 8 55 3 13 16 42 41 48 34 24 10 22 31 6 10 13 123 35 14 20 29 9 25 43 9 12 31 244 94 152 180 184 229 196 122 233 216 191 211
Rank (Proportion) 1 2 3 4 5 6 7 8 9 10 111 0.3 0.1 0.1 0.1 0 0 0.2 0 0.1 0.1 02 0.2 0.2 0.1 0.1 0 0.1 0.1 0 0 0.1 03 0.1 0.1 0.1 0.1 0 0.1 0.2 0 0 0.1 0.14 0.4 0.6 0.7 0.7 0.9 0.8 0.5 0.9 0.9 0.8 0.8
Attribute