customer segmentation with r - user! 2015 aalborguser2015.math.aau.dk/presentations/129.pdf · ·...
TRANSCRIPT

Customer Segmentation with R
Deep dive into flexclust
Jim Porzak
Data Science for Customer Insights
useR! 2015
Aalborg, Denmark
July 1, 2015
7/1/2015 1

7/1/2015 2
Outline
1. Why and how to segment?
2. Segmenting “binary choice” surveys.
3. flexclust deep dive.
4. Solving issues of numbering and stability.
5. Picking the “best” number of clusters.
6. Wrap-up.
Appendix has real-world examples, references, and links to learn more.
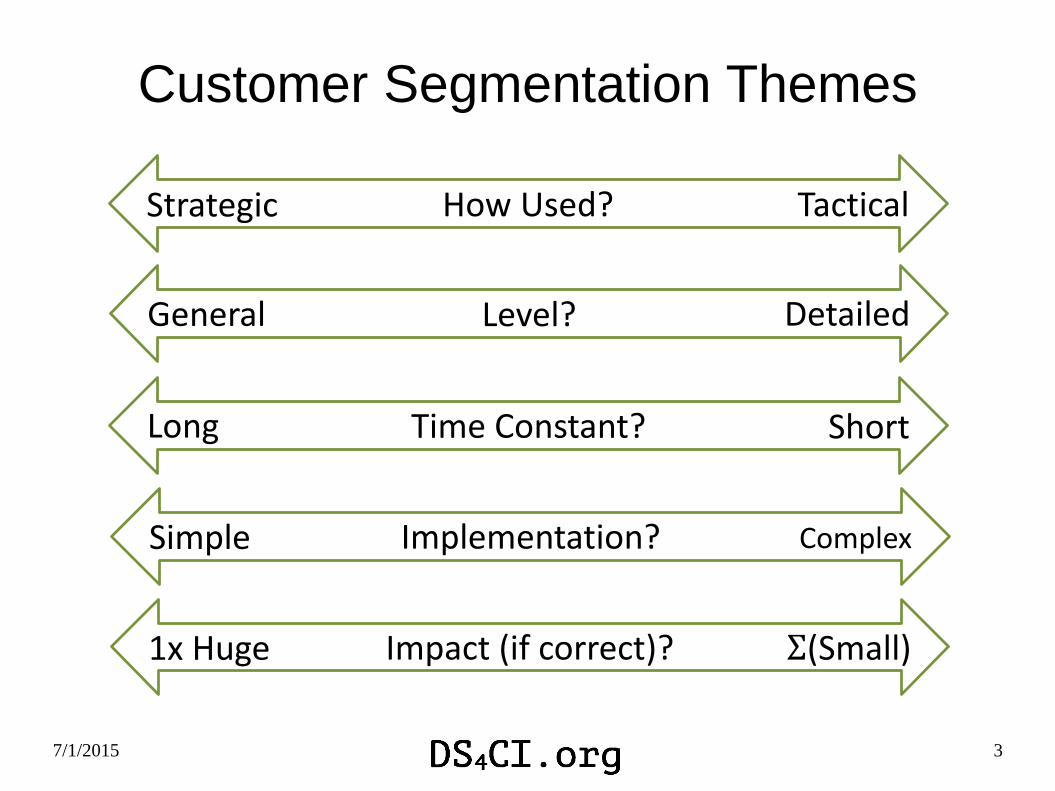
Customer Segmentation Themes
7/1/2015 3
How Used?Strategic Tactical
Level?General Detailed
Time Constant?Long Short
Impact (if correct)?1x Huge Σ(Small)
Implementation?Simple Complex

7/1/2015 4
How to Segment?Do I believe these?
How can I use them?What will be impact?
Many Segmentation Methods!
Today’s Focus: Binary choice surveys
– Simplest of surveys to design & take.
– Cluster analysis is a great tool to understand how
respondents fall into natural segments
– Methods also apply to any binary choice behavioral
data sets.
For examples of other segmentation methods see archives at DS4CI.org.
7/1/2015 5
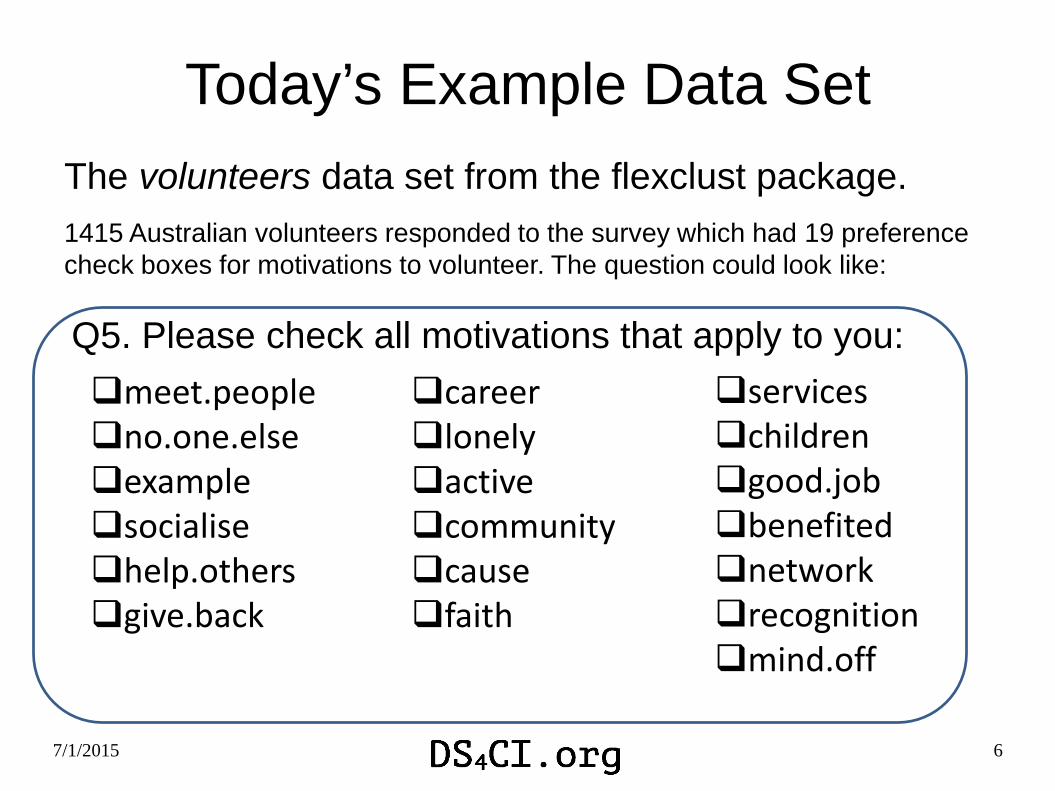
Today’s Example Data Set
The volunteers data set from the flexclust package.
1415 Australian volunteers responded to the survey which had 19 preference
check boxes for motivations to volunteer. The question could look like:
Q5. Please check all motivations that apply to you:
7/1/2015 6
meet.peopleno.one.elseexamplesocialisehelp.othersgive.back
careerlonelyactivecommunitycausefaith
serviceschildrengood.jobbenefitednetworkrecognitionmind.off

7/1/2015 7
Segmenting Binary Choice Data
● “Pick all that apply” type question.
– Not picking is not the opposite of picking an attribute.
● (item checked) <> NOT (item unchecked)
● Totally unsupervised. We only specify the number of
clusters we want.
● Two necessary criteria for a “good” solution:
1. The cluster solution is stable
~ Repeatable with different random starts
2. The segments make sense to the business
- Believable story AND is actionable AND has anticipated impact.

7/1/2015 8
Tool we use: flexclust by Fritz Leisch
● Allows different distance measures
– In particular, the Jaccard distance which is suited for binary
survey data or optional properties lists.
– 1 is a “yes” to the question - it is significant.
– 0 is a “does not apply” – not opposite of “yes”
● Predict(kcca_object, newdata) to segment new customers.
● Additionally flexclust has very good diagnostic and
visualization tools. As an R package, it leverages the
rest of the R ecosystem.
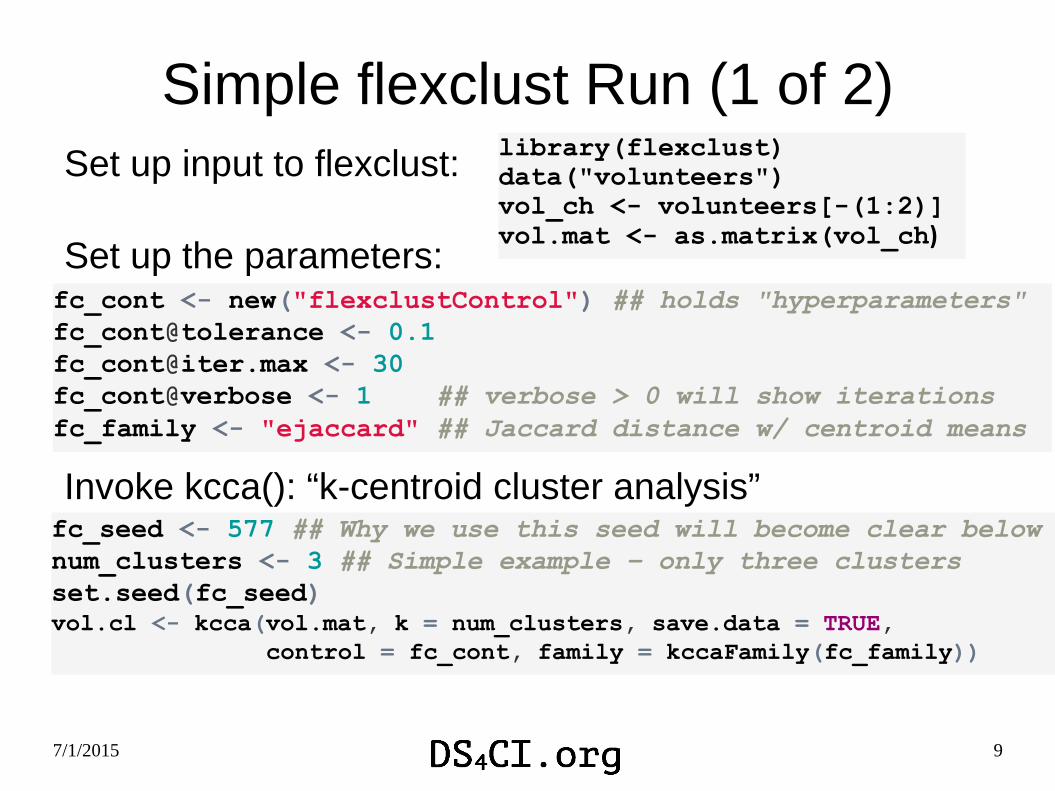
Simple flexclust Run (1 of 2)
7/1/2015 9
Set up input to flexclust:
Set up the parameters:
Invoke kcca(): “k-centroid cluster analysis”
library(flexclust)
data("volunteers")
vol_ch <- volunteers[-(1:2)]
vol.mat <- as.matrix(vol_ch)
fc_seed <- 577 ## Why we use this seed will become clear below
num_clusters <- 3 ## Simple example – only three clusters
set.seed(fc_seed)
vol.cl <- kcca(vol.mat, k = num_clusters, save.data = TRUE,
control = fc_cont, family = kccaFamily(fc_family))
fc_cont <- new("flexclustControl") ## holds "hyperparameters"
fc_cont@tolerance <- 0.1
[email protected] <- 30
fc_cont@verbose <- 1 ## verbose > 0 will show iterations
fc_family <- "ejaccard" ## Jaccard distance w/ centroid means

First few iterations:
Results:
## 1 Changes / Distsum : 1415 / 951.9513
## 2 Changes / Distsum : 138 / 997.9507
## 3 Changes / Distsum : 39 / 998.6126
● ● ●
Simple flexclust Run (2 of 2)
7/1/2015 10
summary(vol.cl)
## kcca object of family 'ejaccard'
## call:
## kcca(x = vol.mat, k = num_clusters, family = kccaFamily(fc_family),
## control = fc_cont, save.data = TRUE)
##
## cluster info:
## size av_dist max_dist separation
## 1 1078 0.6663440 1.0000000 0.6455246
## 2 258 0.7388715 1.0000000 0.6568168
## 3 79 0.8962851 0.9569892 0.8284482
##
## no convergence after 30 iterations
## sum of within cluster distances: 979.7542

Segment Separation Plot
7/1/2015 11
Each respondent plotted against the first two principal components of data. Color is cluster assignment.
Centroid of each cluster. A thin line to other centroid indicates better separation (in real problem space)
Solid line encloses 50% of respondents in cluster; dotted 95%.
vol.pca <- prcomp(vol.mat) ## plot on first two principal components
plot(vol.cl, data = vol.mat, project = vol.pca, main = . . .)
Also known as “neighborhood plot.”
Purpose: Help business partners visualize clusters and how respondents fall within cluster boundaries. IOW, are clusters “real”?

Segment Profile Plot
7/1/2015 12
Header: segment #,
Count, & % total
Bar: proportion of response in
cluster.
Red line/dot: overall proportion
Greyed out when response not
important to differentiate from
other clusters.
BUT, can still be an important
characteristic of cluster
Tick-box labels
barchart(vol.cl, strip.prefix = "#", shade = TRUE,
layout = c(vol.cl@k, 1), main = . . .)
Purpose: Help business partners translate clusters into segment stories. IOW, describe the clusters in business friendly terms.

7/1/2015 13
So far: we’ve used standard flexclust techniques.
See appendix for references and links.
Now, we’ll address three practical issues:
1. Different starting seeds will number ~ equal
clusters differently. The numbering problem.
2. Different starting seeds will result in quite
different clusters. The stability problem.
3. There is no automatic way to pick optimum k.
The “best” k problem.

The Numbering Problem
fc_reorder {CustSegs}
Reorder clusters in a kcca object.
Usage: fc_reorder(x, orderby = "decending size")
7/1/2015 14
Two different seeds have nearly equal solutions, but are labeled differently:

The Stability Problem
7/1/2015 15
Three different seeds have quite different solutions:
We need a simple way to classify each solution – just use sizes of two biggest clusters:

Simple Method to Explore Stability
● For a given k, run a few hundred solutions
(incrementing seed each time):
– Re-order clusters in descending size order
– Save: k, seed, cluster #, & count
● Call Size_1 the count for 1st cluster;
Size_2 the count for 2nd cluster.
● Scatter plot w/ 2D density curves: Size_2 x Size_1
● Solve for peak location
7/1/2015 16

Stability Plot of kcca Solutions for k=3
7/1/2015 17
fc_rclust {CustSegs}
Generate a List of Random kcca Objects.Usage: fc_rclust(x, k, fc_cont, nrep = 100,
fc_family, verbose = FALSE, FUN = kcca,
seed = 1234, plotme = TRUE)
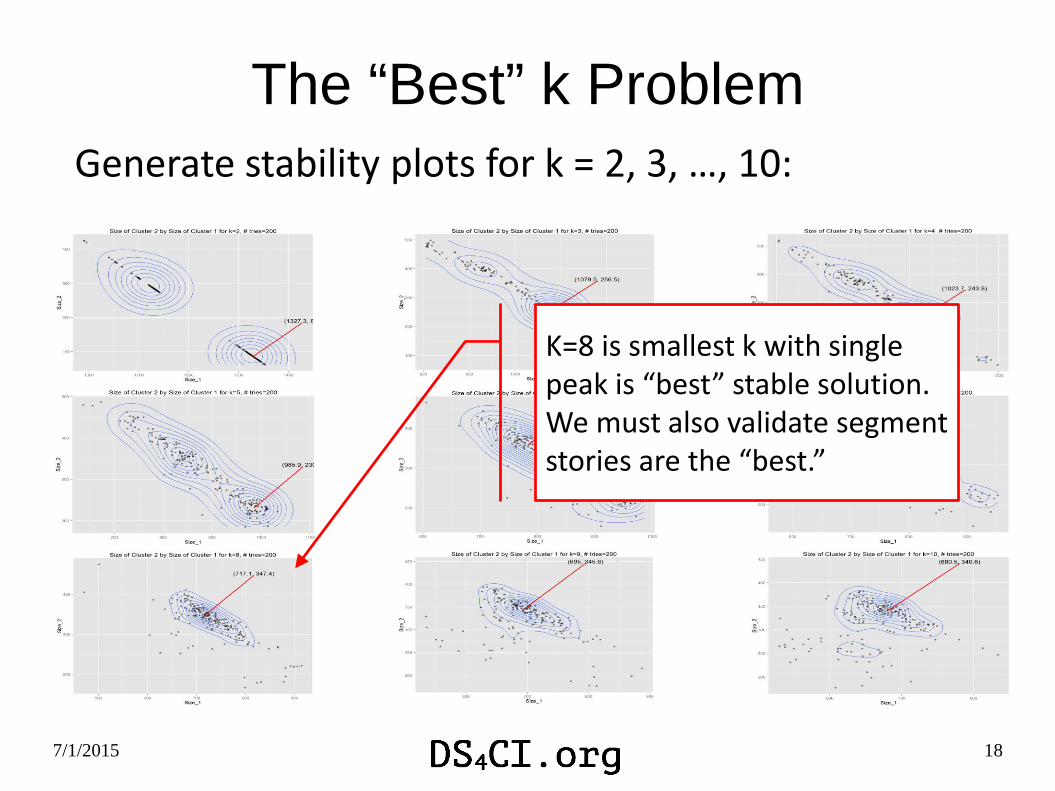
The “Best” k Problem
7/1/2015 18
K=8 is smallest k with single peak is “best” stable solution.We must also validate segment stories are the “best.”
Generate stability plots for k = 2, 3, …, 10:

Segment Separation for “best” k = 8 (seed = 1333)
7/1/2015 19
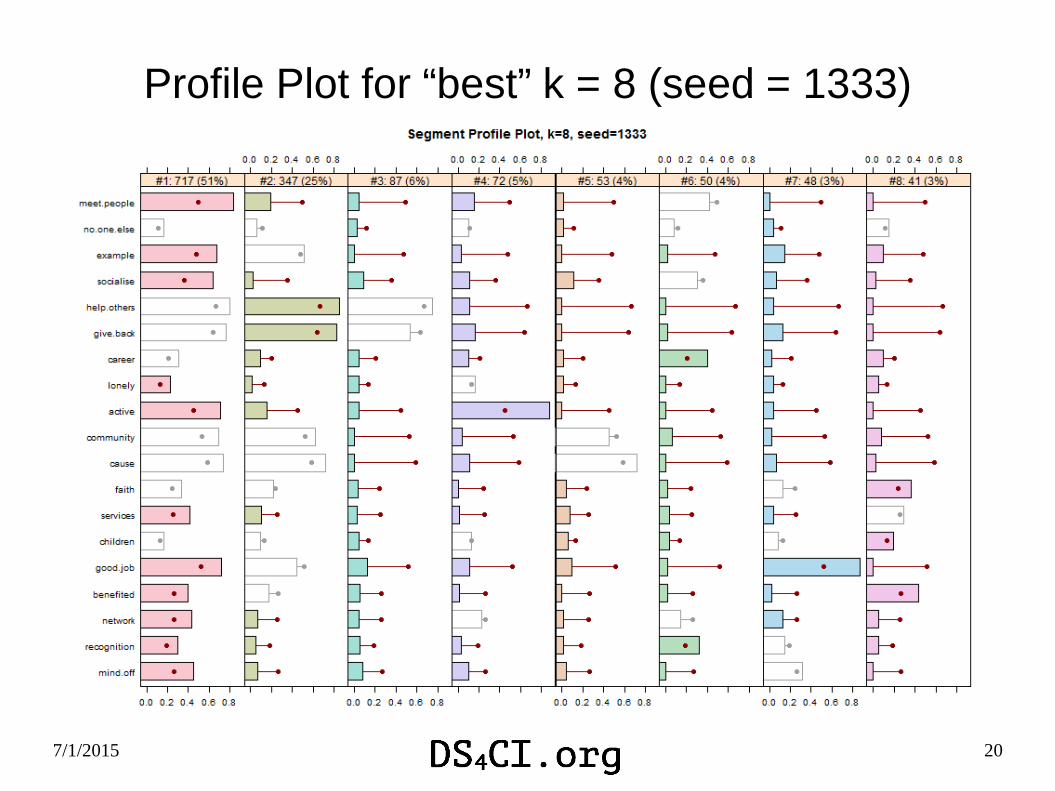
Profile Plot for “best” k = 8 (seed = 1333)
7/1/2015 20
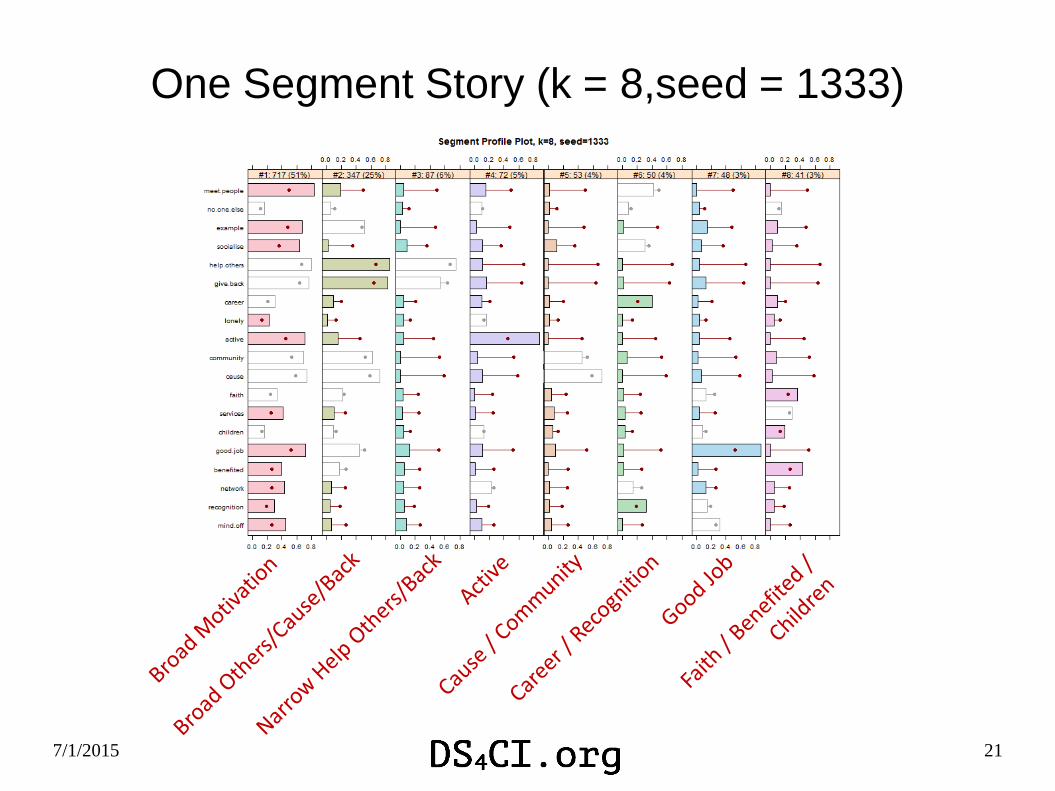
One Segment Story (k = 8,seed = 1333)
7/1/2015 21

What We Covered
● Customer segmentation background.
● Deep dive into using flexclust on “binary choice” type data
– Example kcca() run
– The numbering problem.
– The stability problem
– Provisional rule-of-thumb that “best” k is min(k, for single peak contours)
● Next Steps
– Get typical respondent(s) closest to each centroid.
– Respondent flow plot between segments.
7/1/2015 22
Questions? Comments?Now is the time!

APPENDIX
7/1/2015 23

References
Flexclust details – start here:
Leisch, F. A Toolbox for K-Centroids Cluster Analysis. Computational Statistics and Data Analysis, 51 (2), 526-544, 2006.
Leisch, F. Package ‘flexclust’, CRAN, 2013
Leisch, F. Neighborhood graphs, stripes and shadow plots for cluster visualization. Statistics and Computing, 20 (4), 457-
469, 2010.
Application to marketing – start here:
Dolnicar, S. A review of data-driven market segmentation in tourism, Faculty of Commerce - Papers(2002)
Dolnicar, S., Leisch, F. Winter Tourist Segments in Austria - Identifying Stable Vacation Styles for Target Marketing
Action, Faculty of Commerce - Papers (2003)
Dolnicar, S., Leisch, F. Using graphical statistics to better understand market segmentation solutions. International Journal
of Market Research (2013)
For all of Sara and Fritz’s work see: http://works.bepress.com/sdolnicar/doctype.html#other
7/1/2015 24
7/1/2015 25
Learning More
● Jim’s CustSegs package development at https://github.com/ds4ci/CustSegs
● Tenure based segmentation & subscription survival
– Subscription Survival for Fun & Profit:
https://ds4ci.files.wordpress.com/2013/05/paw_sf2012_subscriptionsurvivalforfunandprofit.pdf
● RFM based segmentation
– Workshop at N Cal DMA lunch group
https://ds4ci.files.wordpress.com/2015/03/rfmb_dmanc_200905201.pdf
– Using R for Customer Segmentation workshop at useR! 2008 Dortmund
https://ds4ci.files.wordpress.com/2013/09/user08_jimp_custseg_revnov08.pdf
● Also has sample data set & flexclust example
● Customer Classification
– See above useR! 2008 workshop for details on flexclust
● Jim’s Archives www.ds4ci.org/archives
● Contact: [email protected]

A couple of real world examples
7/1/2015 26
7/1/2015 27
Example 1 – Survey Responses
● 20k respondents to technical product use survey
● 35 check boxes or radio buttons
– None are required, coded as binary responses
● Goal: come up with “a few” segments which can be
used to segment new respondents for follow up sales
actions.
● 5-cluster solution: OS loyalists, Other brand
responders, Other brand non-responders, Students
● See https://ds4ci.files.wordpress.com/2013/05/paw_09-sun-
microsystems-case-study.pdf

7/1/2015 28
Example 1 - The 5-cluster solutionThe 20k subjects plotted over the first two principal components:
The 5 clusters showing distribution of responses to each question:

7/1/2015 29
Example 2 – Business Attributes
● ~1k respondents to “nature of your business” survey
● 62 check boxes or radio buttons
– In six topics
– Some are required
– Coded as binary responses
● Goal: come up with “a few” segments to characterize
the fundamental nature of the on-line business.
● 6-cluster solution: Enterprise, Freemium, Marketplace,
Ads/Leadgen, Ecommerce, SAAS.

7/1/2015 30
Example 2 – the 6-cluster solution