customer satisfaction with catering services in … · 2015-05-04 · customer satisfaction with...
TRANSCRIPT

ISSN 2029-9370. Regional FoRmation and development StudieS, no. 3 (11)
75
C U S TO M E R S AT I S FA C T I O N W I T H C AT E R I N G S E RV I C E S I N L I T H U A N I A
Viktorija GriGaliūnaitė1, lina Pilelienė2
Vytautas Magnus University (Lithuania)
ABSTRACTCustomer satisfaction is considered as key factor determining organization’s success in today’s competitive market place. The growth of popularity of catering services in Lithuania substantiates the necessity of evaluation of their customer loyalty. Accordingly, the research was provided endeavouring to evaluate customer satisfaction with catering services in Lithuania. The obtained results reveal that evaluating either customer satisfaction with overall catering services in Lithuania, or customer satisfaction with particular caterer, Customer Expectations and Image has no direct effect on Customer Satisfaction, in addition Complaints has no direct neither indirect effect on Loyalty. Furthermore, the created model of Customer Satisfaction with catering services in Lithuania can be used for any type of research that evaluates customer satisfaction with catering services in Lithuania: any the place in Lithuania and / or the type of catering facility.KEYWORDS: catering services, customer satisfaction, ECSI.
JEL CODES: L660, M310.
Introduct ion
Customer satisfaction is considered as key factor determining organization’s success in today’s competitive market place. Knowing the level of customer satisfaction can help an organization to assess the efficiency of its activities, set future goals, and take necessary actions to maintain or increase it. In scientific literature (Cassel, Eklöf, 2001; Yew-Wing, Bellman, 2008 et al.), customer satisfaction is often measured and analyzed as an antecedent of customer loyalty; moreover, to measure satisfaction, its determinants (factors influencing customer satisfaction) have to be evaluated. Therefore, I. Ferreira et al. (2010) suggest that it is necessary to develop reliable and independent ways of assessing customer satisfaction, allowing the comparison between companies within the same sector and/or that operate in the same country, or at a macroeconomic level. In scientific researches (Ferreira et al., 2010; Leite, Filho, 2007; Lopes et al., 2009; Yew-Wing, Bellman, 2008 et al.), one of the mostly applied and analyzed ways for satisfaction assessment is the estimation of Customer Satisfaction Index (CSI). According to H. Lopes et al. (2009), the attention to customer satisfaction emerged with the origination of Swedish Customer Satisfaction Index (SCSI) in 1980’s; many countries such as Germany, Israel, Taiwan or New Zealand started developing their national customer satisfaction indexes. Nowadays, worldwide mostly known and applied customer satisfaction indexes are American Customer 1 Viktorija Grigaliūnaitė – master student, Vytautas Magnus University, Economic and Management Faculty, Marketing
Department. Scientific field: customer satisfaction, mathematical methods in marketing Tel.: +370 37 327 856 E-mail: [email protected].
2 Lina Pilelienė – associate professor, doctor, Vytautas Magnus University, Economic and Management Faculty, Marketing Department. Scientific field: customer satisfaction, place marketingTel.: +370 37 327 856E-mail: [email protected].

Viktorija grigaliūnaitė, lina PilelienėCUSTOMER SATISFACTION WITH CATERING SERVICES IN LITHUANIA
76
Satisfaction Index (ACSI) created in 1994 and European Customer Satisfaction Index (ECSI) presented in 1999.
Despite the three decades of worldwide scientific discussions about customer satisfaction measurement techniques, Lithuania still lacks its national customer satisfaction index. Several authors (Dovalienė et al., 2007; Kačinskaitė, 2011; Virvilaite, Dailydiene, 2012; Žūkaitė, 2011) have published the results of their researches in satisfaction-related fields; however, no attempts of creating Lithuanian Customer Satisfaction Index were introduced. Our previous research (see Grigaliūnaitė, Pilelienė, 2012; Pilelienė, Grigaliūnaitė, 2012) gave a course for further studies. Starting with customer satisfaction with a particular pizzeria, then with pizzerias as a whole, our current research was meant to measure customer satisfaction with catering services in Lithuania. Accordingly, scientific problem solved in this article is: what is customer satisfaction with catering services in Lithuania and what are the factors determining their satisfaction.
The aim of the article is to evaluate customer satisfaction with catering services in Lithuania.The object of the article is customer satisfaction with catering services in Lithuania.To meet the aim of the article following tasks were set:
• To reveal models of customer satisfaction.• To perform the research on customer satisfaction with catering services in Lithuania.• To design the model of customer satisfaction with catering services in Lithuania.
Research methods. On purpose of developing a research model for satisfaction, theoretical analysis and synthesis was provided. Customers’ attitudes and evaluations towards catering services in Lithuania were determined providing the questionnaire research. Structural equation modelling (SEM) using partial least squares (PLS) path modelling methodology was applied for statistical analysis.
1 . Scient i f ic substant ia t ion
H. Lopes et al. (2009) suggest that interest in customer satisfaction emerged with the origination of Swedish Customer Satisfaction Index (SCSI) in 1980’s. According to O. Calleros et al. (2012) the first National Satisfaction Index was the Swedish Customer Satisfaction Barometer, developed in 1989; and this index was the basis for the development of national indexes in different countries including the Deutsche Kunden-barometer (DK) in Germany in 1992; the American Customer Satisfaction Index (ACSI) in 1994; the European Customer Satisfaction Index (ECSI) in 1999, Malaysian Customer Satisfaction Index (MCSI) in 1999, and the Hong Kong Consumer Satisfaction Index (HKCSI) in 1998–2000. The SCSB and DK measured the satisfaction of customers of 31 industries. The ACSI measures satisfaction with 200 companies and government agencies in 40 industries and seven sectors of the economy.
Nowadays, worldwide mostly known and applied customer satisfaction indexes are American Customer Satisfaction Index (ACSI) and European Customer Satisfaction Index (ECSI).
Provided scientific analysis suggests that many national customer satisfaction indexes apply ACSI or ECSI as their background. A. D. Al-Nasser et al. (2011) developed the first national CSI in Arabian world – Jordanian Customer Satisfaction Index (JCSI). O. Calleros et al. (2012) presented Mexican User Satisfaction Index (IMSU) which is based on ACSI. Other countries currently developing national satisfaction indexes include New Zealand, Austria, Korea, Taiwan and Chile. All these indexes have in common the development of a theoretical model of satisfaction, where they measure not only the level of satisfaction, but its causes (antecedents) and consequences as well.
Scientific analysis reveals that different customer satisfaction antecedents and consequences are evaluated by different CSIs (see Table 1).

ISSN 2029-9370. Regional FoRmation and development StudieS, no. 3 (11)
77
Table 1. Comparison of Customer Satisfaction Indexes
Satisfaction IndexAffecting factors SCSB ACSI ECSI HKCSI MCSI JCSI IMSU
Antecedent of CSPerceived quality + + + + +Perceived value + + + + +Customer expectations + + + + + + +Corporate image + +Customer characteristics +Assessed performance +
Consequences of CSCustomer loyalty + + + + + + +Trust +Complaints + + + +Perceived image +
Source: self elaboration based on M. Abdullah et al. (2001), M. D. Johnson et al. (2001), A. D. Al-Nasser et al. (2011), O. Calleros et al. (2012).
As it can be seen in Table 1, different CSI estimate different causes (antecedents) and effects (consequences) of customer satisfaction. An assumption can be made that such structural deviances can be determined by cultural differences.
2. Research methodology
2.1. Data collection method
For the research it was decided to apply the adjusted European Customer Satisfaction Index model, which involves latent variables that are excluded by American Customer Satisfaction Index and European Customer Satisfaction Index models (Customer Complaints and Image) and is expressed by six structural equations representing the adjusted ECSI model (Bayol et al., 2000):
(1) Customer Expectations = β20 + β21Image + ζ2(2) Perceived Quality = β30 + β32Customer Expectations + ζ3(3) Perceived Value = β40 + β42Customer Expectations + β43Perceived Quality + ζ4(4) Customer Satisfaction = β50 + β51Image + β52Customer Expectations + β53Perceived Quality +
β54Perceived Value + ζ5(5) Customer Complaints = β60 + β65Customer Satisfaction + ζ6(6) Customer Loyalty = β70 + β71Image + β75Customer Satisfaction + β76Customer Complaints + ζ77 latent variables are measured by the manifest variables. In the research 21 manifest variables are
assigned to corresponding latent variable (see Table 2).
Table 2. Latent and manifest variables
Latent variables Manifest variables Indication
Image
Positive public image IMAG1Innovative IMAG2Customer-oriented IMAG3Characterized by good service IMAG4Complete confidence in the catering services IMAG5
Customer expectations Overall expectations of product CUEX1Overall expectations of service CUEX2

Viktorija grigaliūnaitė, lina PilelienėCUSTOMER SATISFACTION WITH CATERING SERVICES IN LITHUANIA
78
Latent variables Manifest variables Indication
Perceived quality
Overall perceived quality of products PERQ1Overall perceived quality of service PERQ2Quality of product completely meets customer‘s requirements PERQ3Quality of service completely meets customer‘s requirements PERQ4Assortment of the products PERQ5Comparison with competitors PERQ6
Perceived value Rating of quality given price PERV1Rating of price given quality PERV2
Customer satisfactionThe overall satisfaction with the catering services CUSA1Satisfaction compared with expectations CUSA2Comparison to an ideal CUSA3
Customer complaints Complaint handling extent (imaginary extent if never complained) CUSCO1
Customer loyaltyIntention to buy the same services again CUSL1
Intention to recommend CUSL2
Questionnaire is based on the requirements for the ECSI model, opinions of various authors (Kristensen et al., 1999; Bayol et al., 2000; O’Loughlin, Coenders, 2004; Turkyilmaz, Ozkan, 2007; Eklof, Selivanova, 2008; Alireza, 2011) and catering services’ specifications.
10-point evaluation scale was applied for respondents’ evaluations towards catering services in Lithuania. The choice of 10-point scale is based on the recommendations to use the 10-point scale when applying the ECSI model for the customer satisfaction research (Eklof, Selivanova, 2008).
2.2. The sample
In view of the fact that the research contains Lithuania’s level, and Lithuania is divided into 10 counties with different population, the number of respondents was estimated according to the population in each county given that the total sample size is 250.
The survey was conducted on February, 2013. In order to increase the diversity of the respondents, the survey was handled both, in person and via the Internet. 52 percent of male and 48 percent of female participated in the survey. 37 percent of the respondents were at the age group of 18–25 years old, 36 percent – at the age group of 26–35, 16 percent – at the age group of 36–45, 8 percent – at the age group of 46–55 years old, and 2 percent and 1 percent of respondents were respectively more than 55 years old and less than 18 years old.
3. Analysis of the research resul ts
Respondents could select all of their usually chosen caterers. Distribution of usually chosen caterers identified by respondents is shown in Figure 1. According to the results, the most popular caterers are cafes, bars, pizzerias and restaurants. One respondent selected the option “Other” and identified “Maxima’s Café”.
Most of the respondents (90 percent) stated that their expenditure for the catering services is under 20 percent of their whole expenditure per month. The weighted average of households’ expenditure for the catering services per month is 10 percent.

ISSN 2029-9370. Regional FoRmation and development StudieS, no. 3 (11)
79
Figure 1. Distribution of usually chosen caterer identified by respondents, N = 250
The validity of the used theoretical adjusted European Customer Satisfaction Index model’s measurement model with 21 manifest variables was unacceptable to interpret the results. Despite the fact that all AVE values showed the appropriate degree of convergent validity, the discriminant validity was not attained. In order to obtain discriminant validity, the lowest indicators’ outer loadings were removed from the model. Removed loadings contained two manifest variables: IMAG1 (positive public image) and IMAG5 (complete confidence in the catering services). The new PLS Path model with 2 eliminated manifest variables is shown in Figure 2.
Figure 2. PLS Path model

Viktorija grigaliūnaitė, lina PilelienėCUSTOMER SATISFACTION WITH CATERING SERVICES IN LITHUANIA
80
Assessing the new PLS Path model with two removed outer loadings, it could be stated that AVE values indicated the sufficient degree of convergent validity (all AVE values higher than 0.5). The degree of internal consistency reliability is acceptable too (all composite reliability values are above 0.8). All Cronbach’s Alpha and Communality values were above 0.7, so the manifest variables are unidimensional and the quality of the measurement model for each block was accomplished. The highest R Squared value was obtained variable’s Customer Satisfaction (81 percent) and the lowest – Complaints (27 percent); hence the regression lines represent the data properly (see Table 3).
Table 3. AVE, Composite Reliability, R Square, Cronbach’s Alpha and Communality values of latent variables
Variable AVE Composite Reliability R Square Cronbach’s
Alpha Communality
Complaints 1 1 0.2673 1 1Customer Expectations 0.8823 0.9375 0.406 0.8668 0.8823Customer Satisfaction 0.8253 0.9341 0.8107 0.8941 0.8253
Image 0.7514 0.9006 0 0.8356 0.7514Loyalty 0.8971 0.9457 0.4839 0.8857 0.8971
Perceived Quality 0.7517 0.9478 0.3091 0.9339 0.7517Perceived value 0.8532 0.9208 0.6453 0.828 0.8532
Considering that discriminant validity is assessed by two criteria, the new PLS Path model’s measurement
model obtains discriminant validity at both criteria. In view of the first criterion, the lowest value of AVE is greater than the latent construct‘s highest correlation (see Table 4) with any other latent construct.
Table 4. Latent variables’ correlations
Variable Complaints Customer Expectations
Customer Satisfaction Image Loyalty Perceived
QualityPerceived
valueComplaints 1Customer
Expectations 0.3204 1
Customer Satisfaction 0.517 0.4443 1
Image 0.3534 0.6372 0.5538 1Loyalty 0.4281 0.3877 0.6787 0.485 1
Perceived Quality 0.513 0.556 0.8565 0.6736 0.7061 1
Perceived value 0.4052 0.3637 0.8495 0.5279 0.6209 0.7976 1
In view of the second discriminant validity assessment criterion, all manifest variables’ loadings of their corresponding latent variables are higher than its’ cross loadings (see Table 5). Accordingly, the elimination of two manifest variables from the measurement model allowed to assess measurement model as reliable and valid pertaining to discriminant validity.
Table 5. Cross loadings
Variables Complaints Customer Expectations
Customer Satisfaction Image Loyalty Perceived
QualityPerceived
valueCUEX1 0.3112 0.9337 0.3977 0.5778 0.3814 0.5097 0.2959CUEX2 0.2917 0.9449 0.4355 0.6177 0.3486 0.534 0.3836
ISSN 2029-9370. Regional FoRmation and development StudieS, no. 3 (11)
81
Variables Complaints Customer Expectations
Customer Satisfaction Image Loyalty Perceived
QualityPerceived
valueCUSA1 0.5013 0.4543 0.932 0.5163 0.6331 0.8364 0.828CUSA2 0.4542 0.4071 0.9147 0.5207 0.647 0.7957 0.7794CUSA3 0.4522 0.3426 0.8778 0.4702 0.566 0.6941 0.7012
CUSCO1 1 0.3204 0.517 0.3534 0.4281 0.513 0.4052CUSL1 0.4053 0.3462 0.5972 0.4109 0.9399 0.63 0.534CUSL2 0.406 0.3859 0.6833 0.5022 0.9543 0.7032 0.6359IMAG2 0.3349 0.4921 0.4252 0.8324 0.3377 0.5096 0.356IMAG3 0.3 0.544 0.439 0.8766 0.4023 0.5506 0.4783IMAG4 0.292 0.6086 0.559 0.8904 0.5011 0.672 0.5203PERQ1 0.4153 0.5253 0.7304 0.6502 0.6437 0.8595 0.703PERQ2 0.4175 0.4985 0.72 0.6437 0.5962 0.8724 0.6703PERQ3 0.4678 0.4752 0.7671 0.5417 0.5806 0.877 0.7003PERQ4 0.4683 0.4668 0.7149 0.5639 0.6128 0.8673 0.6769PERQ5 0.4214 0.5121 0.7477 0.5408 0.5745 0.8696 0.6861PERQ6 0.4786 0.4135 0.7737 0.5647 0.665 0.8561 0.711PERV1 0.331 0.3608 0.7712 0.4983 0.5976 0.7426 0.9225PERV2 0.417 0.3115 0.798 0.4771 0.5498 0.7309 0.9248
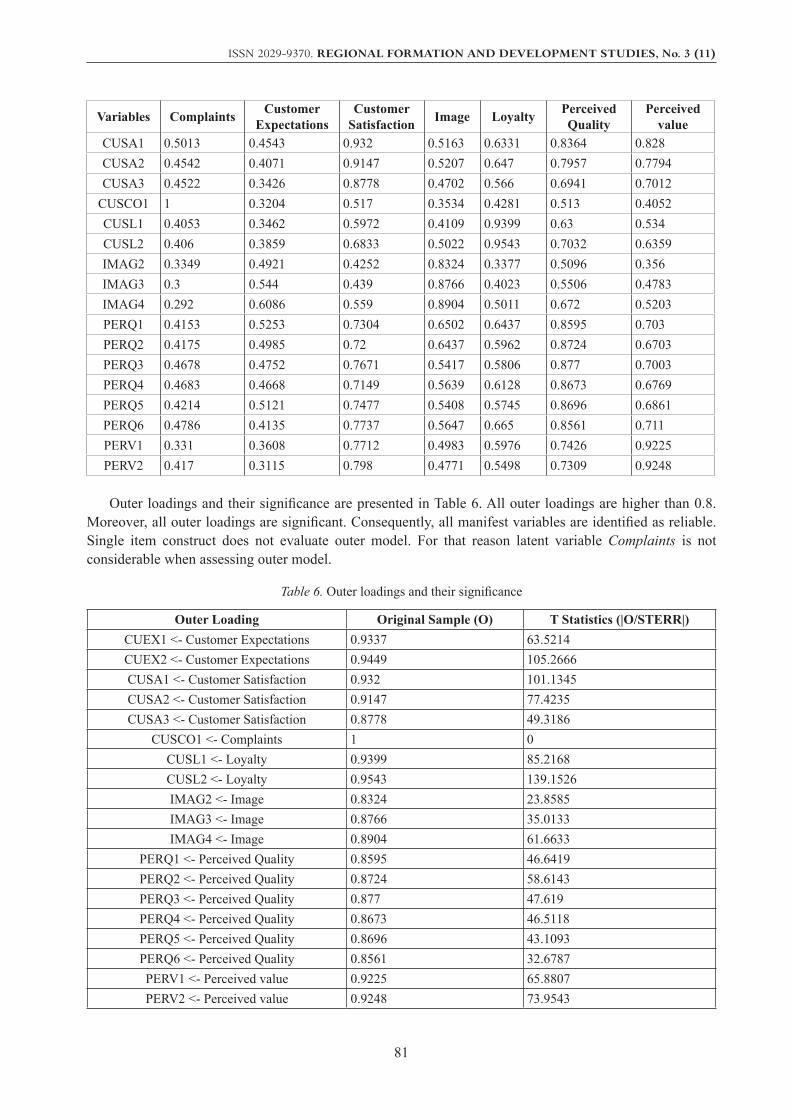
Outer loadings and their significance are presented in Table 6. All outer loadings are higher than 0.8. Moreover, all outer loadings are significant. Consequently, all manifest variables are identified as reliable. Single item construct does not evaluate outer model. For that reason latent variable Complaints is not considerable when assessing outer model.
Table 6. Outer loadings and their significance
Outer Loading Original Sample (O) T Statistics (|O/STERR|)CUEX1 <- Customer Expectations 0.9337 63.5214CUEX2 <- Customer Expectations 0.9449 105.2666CUSA1 <- Customer Satisfaction 0.932 101.1345CUSA2 <- Customer Satisfaction 0.9147 77.4235CUSA3 <- Customer Satisfaction 0.8778 49.3186
CUSCO1 <- Complaints 1 0CUSL1 <- Loyalty 0.9399 85.2168CUSL2 <- Loyalty 0.9543 139.1526IMAG2 <- Image 0.8324 23.8585IMAG3 <- Image 0.8766 35.0133IMAG4 <- Image 0.8904 61.6633
PERQ1 <- Perceived Quality 0.8595 46.6419PERQ2 <- Perceived Quality 0.8724 58.6143PERQ3 <- Perceived Quality 0.877 47.619PERQ4 <- Perceived Quality 0.8673 46.5118PERQ5 <- Perceived Quality 0.8696 43.1093PERQ6 <- Perceived Quality 0.8561 32.6787PERV1 <- Perceived value 0.9225 65.8807PERV2 <- Perceived value 0.9248 73.9543

Viktorija grigaliūnaitė, lina PilelienėCUSTOMER SATISFACTION WITH CATERING SERVICES IN LITHUANIA
82
Evaluating cross-validated redundancy measures for the endogenous latent variables, the chosen omission distance was 7. All cross-validated redundancy values (Q2) for endogenous latent variables are above zero (see Table 7). Consequently, structural model is assessed as displaying predictive relevance.
Table 7. Stone-Geisser’s Q2
Total SSO SSE 1-SSE/SSOComplaints 250 183.6073 0.2656
Customer Expectations 500 322.4104 0.3552Customer Satisfaction 750 252.0095 0.664
Loyalty 500 287.0593 0.4259Perceived Quality 1500 1152.7218 0.2315Perceived value 500 226.7742 0.5465
The value of global criterion of goodness-of-fit (GoF = 2communality R× ) is 0.5962. Hence, GoF index value is appropriately large. As a result, the global model evaluation is positive. Then again, outer model involves single indicator construct, thus the appropriateness of assessing GoF value is uncertain.
Latent variables’ index values are shown in Table 8. The values are in the range of 63 to 73 scores evaluating on a scale from 0 to 100. Judging from the scores, catering services in Lithuania are at the average level, because none of the indexes are under 60 scores (what would indicate the low level) and above 75 scores (what would indicate the high level of catering services). The Image of catering services in Lithuania encounters customers’ Perceived Quality. Customers Expectations are much higher than Perceived Quality as well as Perceived Value, besides Perceived Quality is a little higher than Perceived Value. Customer Satisfaction is lower than Customers Expectations, Perceived Quality, Perceived Value, Image and Loyalty. Loyalty has the highest index value in the model; despite this it still does not achieve the higher level than average.
Table 8. Latent variables’ index values
Variables LV Index ValuesComplaints 63
Customer Expectations 71Customer Satisfaction 66
Image 68Loyalty 73
Perceived Quality 68Perceived value 67
Path Coefficients, Total Effects and their significance are shown in Table 9. In connection with the Total Effects and their significance, the only non-significant effect is Complaints influence on Loyalty. All the other Total Effects are significant (T Statistics > 1.96). The highest Total Effects are: Perceived Quality to Perceived Value, Perceived Quality to Customer Satisfaction, Image to Customer Expectations.
The size of the Path Complaints to Loyalty is the same size as the Total Effect of Complaints to Loyalty and it is non-significant. The size of the path Customer Expectations to Customer Satisfaction is very low and non-significant when assessing the significance level of 95 percent. The size of the path Customer Expectations to Perceived Quality is large and it is significant. The size of the path Customer Expectations to Perceived Value is low although significant (T Statistics > 1.96). Path’s Customer Satisfaction to Complaints size is large and significant, as well as Customer Satisfaction to Loyalty. Image has a large direct effect on

ISSN 2029-9370. Regional FoRmation and development StudieS, no. 3 (11)
83
Customer Expectations and this effect is significant. The direct effect of Image to Customer Satisfaction is very low and non-significant. The direct effect of Image to Loyalty is very low, but significant (T Statistics > 1.96). The path size of Perceived Quality to Customer Satisfaction is average level and this path is significant. Perceived Quality to Perceived Value has the largest direct effect which is significant. Perceived Value has a large and significant direct effect on Customer Satisfaction.
Table 9. Path Coefficients, Total Effects and their significance
Variables Path Coefficients
T Statistics (|O/STERR|) Total Effects T Statistics
(|O/STERR|)Complaints -> Loyalty 0.0918 1.1968 0.0918 1.1968
Customer Expectations -> Complaints 0.245 4.6257Customer Expectations -> Customer
Satisfaction 0.0247 0.4938 0.4739 6.5904
Customer Expectations -> Loyalty 0.2826 6.0278Customer Expectations -> Perceived Quality 0.556 8.3324 0.556 8.3324Customer Expectations -> Perceived value -0.1154 2.0583 0.3637 5.0757
Customer Satisfaction -> Complaints 0.517 8.3147 0.517 8.3147Customer Satisfaction -> Loyalty 0.549 6.778 0.5964 8.6391
Image -> Complaints 0.1321 3.322Image -> Customer Expectations 0.6372 13.2965 0.6372 13.2965Image -> Customer Satisfaction -0.0464 1.0769 0.2555 4.1372
Image -> Loyalty 0.1486 2.2101 0.301 4.5181Image -> Perceived Quality 0.3543 5.7947Image -> Perceived value 0.2317 4.1403
Perceived Quality -> Complaints 0.4672 7.5721Perceived Quality -> Customer Satisfaction 0.506 5.7264 0.9037 18.1398
Perceived Quality -> Loyalty 0.539 7.4294Perceived Quality -> Perceived value 0.8617 20.7556 0.8617 20.7556
Perceived value -> Complaints 0.2386 5.2626Perceived value -> Customer Satisfaction 0.4615 6.3907 0.4615 6.3907
Perceived value -> Loyalty 0.2752 5.1347
Figure 3 shows latent variables’ indexes and significance of path coefficients of Satisfaction with catering services in Lithuania. Variable Complaints has no significant Total Effect on Loyalty, so the arrow marked with the asterisk could absolutely be removed from the model. Customer Expectations and Image has no significant direct effect on Customer Satisfaction, so these two dotted arrows could be removed from the model too, because the arrows in the model shows only direct effects.
Designed model of customer satisfaction with pizzerias in Kaunas (Grigaliūnaitė, Pilelienė, 2012) showed the same results about the direct effects; accordingly, it could be stated that evaluating either customer satisfaction with overall catering services in Lithuania, or customer satisfaction with particular caterer, Customer Expectations and Image has no direct effect on Customer Satisfaction, in addition Complaints has no direct neither indirect effect on Loyalty. Furthermore, this proves the ability to adapt the model that is shown in Figure 3 for any Customer satisfaction with catering services in Lithuania research, despite the town or catering facility that research is about.
Model contains all seven latent variables that were used in the theoretical model, because all latent variables directly or indirectly affect or are affected by other latent variables; although, two manifest variables were removed from the measurement model. In the case of changing removed variables with other

Viktorija grigaliūnaitė, lina PilelienėCUSTOMER SATISFACTION WITH CATERING SERVICES IN LITHUANIA
84
manifest variables, the discriminant validity of the model must be assessed again. Otherwise, the model shows appropriate degree of discriminant validity.
Figure 3. Latent variables’ indexes and significance of path coefficients of Satisfaction with catering services in Lithuania
Customer satisfaction with catering services in Lithuania is at the average level. The Image of catering services in Lithuania encounters customers Perceived Quality. Customers’ Expectations are much higher than Perceived Quality and because of the highest direct effect of Perceived Quality to Perceived Value as well as deviance among customer Expectations and Perceived Quality, Perceived Value is lower than Perceived Quality. These deviances affect Customer Satisfaction and because of this the index of Customer Satisfaction is the lowest in the whole model after index of Complaints.
Conclusions
Different Customer Satisfaction Indexes estimate different causes (antecedents) and effects (consequences) of customer satisfaction. An assumption can be made that such structural deviances can be determined by cultural differences. Nowadays, worldwide mostly known and applied customer satisfaction indexes are American Customer Satisfaction Index (ACSI) and European Customer Satisfaction Index (ECSI).
In accordance with research results, the most popular caterers in Lithuania are cafes, bars, pizzerias and restaurants. Most of the respondents indicated that their expenditure for the catering services is fewer than 20 percent of the whole expenditure per month. The weighted average of households’ expenditure for the catering services per month is 10 percent. Consequently, it could be stated that a part of the households’ expenditure that goes for the caterers is quite large, bearing in mind that this is not a basic commodity.
The obtained results reveal that evaluating either customer satisfaction with overall catering services in Lithuania, or customer satisfaction with particular caterer, Customer Expectations and Image has no direct effect on Customer Satisfaction, in addition Complaints has no direct neither indirect effect on Loyalty. Furthermore, the created model of Customer Satisfaction with catering services in Lithuania can be used for

ISSN 2029-9370. Regional FoRmation and development StudieS, no. 3 (11)
85
any type of research that evaluates customer satisfaction with catering services in Lithuania: any the place in Lithuania and / or the type of catering facility.
The obtained results imply the average customer satisfaction level with catering services in Lithuania. Taking under consideration that the deviances among customers’ Expectations, Perceived Quality and Perceived Value are too large and the highest direct effect is from Perceived Quality to Perceived Value, the index of Customer Satisfaction is too low.
The average customer satisfaction level with catering services in Lithuania could be increased by three processes: first of all, the image of catering services in Lithuania should be improved. Promotion and communication are possible methods of improving image. Secondly, the quality of catering services also should be improved. Last, but not least is improving of customer perceived value; this could be done by customer cost management or different marketing sales strategy.
References
Abdullah, M., Husain, N., Al-Nasser, A. D. (2001). Theory and statistical development of national customer satisfaction index: the Malaysian customer satisfaction index. The Sixth TQM World Congress. Saint Petersburg, p. 227–283.
Al-Nasser, A. D., Al-Rawwash, M. Y., Alakhras, A. S. (2011). An approach to setting up a national customer satisfaction index: the Jordan case study. Journal of Applied Statistics, Vol. 38, No. 9, p. 1977–1993.
Alireza, F. (2011). How Quality, Value, Image, and Satisfaction Create Loyalty at an Iran Telecom. International Journal of Business and Management, Vol. 6, No. 8, p. 271–279.
Bayol, M. P., Foye, A., Tellier, C., Tenenhaus, M. (2000). Use of PLS Path Modelling to estimate the European Consumer Satisfaction Index (ECSI) model. Statistica Applicata, Vol. 12, No. 3, p. 361–375.
Calleros, O., Rivera, H., Serrato, H., Delgado, M., León, C., Acevedo, A., Ramírez, I. (2012). Development of the Mexican User Satisfaction Index (Imsu) to Evaluate Social Government Programs in Mexico: The Case of the Daycare Social Program. Journal of Consumer Satisfaction, Dissatisfaction & Complaining Behavior, No. 25, p. 118–129.
Cassel, C., Eklöf, J. A. (2001). Modelling customer satisfaction and loyalty on aggregate levels: Experience from the ECSI pilot study. Total Quality Management, Vol. 12, No. 7, p. 834–841.
Dovalienė, A., Gadeikienė, A., Piligrimienė, Ž. (2007). Customer Satisfaction and its Importance for Long-Term Relationships with Service Provider: the Case of Odontology Services. Engineering Economics, Vol. 55, No. 5, p. 59–67.
Eklof, J., Selivanova, I. (2008). Human aspect in service quality: EPSI benchmark studies. Total Quality Management, Vol. 19, No. 7/8, p. 827–841.
Ferreira, I., Cabral, J., Saraiva, P. (2010). An integrated framework based on the ECSI approach to link mould customers’ satisfaction and product design. Total Quality Management & Business Excellence, Vol. 21, No. 12, p. 1383–1401.
Grigaliūnaitė, V., Pilelienė, L. (2012). Vartotojų pasitenkinimo Kauno miesto picerijomis nustatymas. Regional Formation and Development Studies, No. 2 (7), p. 19–32.
Johnson, M. D., Gustafsson, A., Andreassen, T. W., Lervik, L., Cha, J. (2001). The evolution and future of national customer satisfaction index models. Journal of Economic Psychology, Vol. 22, p. 217–245.
Kačinskaitė, E. (2011). Naujos statybos daugiabučių namų gyventojų pasitenkinimo tyrimas. 14-osios Lietuvos jaunųjų mokslininkų konferencijos „Mokslas – Lietuvos ateitis“ 2011 metų teminės konferencijos „Statyba“ straipsnių rinkinys. Available at: <http://dspace.vgtu.lt/bitstream/1/961/1/E.%20Kacinskaite.pdf>
Kristensen, K., Martensen, A., Gronholdt, L. (1999). Measuring the impact of buying behaviour on customer satisfaction. Total Quality Management, Vol. 10, No. 4/5, p. 602–614.
Leite, R., Filho, C. (2007). Um Estudo Empírico da Aplicação do Índice Europeu de Satisfação de Clientes (ECSI) no Brasil. Revista De Administração Mackenzie, Vol. 8, No. 4, p. 178–200.
Lopes, H., Pereira, C., Vieira, A. (2009). Comparação entre os Modelos Norteamericano (ACSI) e Europeu (ECSI) de Satisfação do Cliente: um Estudo no Setor de Serviços. Revista de Administração Mackenzie, Vol. 10, No. 1, p. 161–187.
O’Loughlin, C., Coenders, G. (2004). Estimation of the European Customer Satisfaction Index: Maximum Likelihood versus Partial Least Squares. Application to Postal Services. Total Quality Management and Business Excellence, Vol. 15, No. 9, p. 1231–1255.
Pilelienė, L., Grigaliūnaitė, V. (2012). Vartotojų pasitenkinimo „Čili pica“ picerijų paslaugomis nustatymas. Management of Organizations: Systematic Research, Vol. 64, p. 69–85.

Viktorija grigaliūnaitė, lina PilelienėCUSTOMER SATISFACTION WITH CATERING SERVICES IN LITHUANIA
86
Turkyilmaz, A., Ozkan, C. (2007). Development of a customer satisfaction index model, An application to the Turkish mobile phone sector. Industrial Management and Data Systems, Vol. 107, No. 5, p. 672–687.
Virvilaite, R., Dailydiene, M. (2012). Strengthening of a Private Brand: the Aspect of a Store’s Image. Engineering Economics, Vol. 23, No. 1, p. 90–98.
Yew-Wing, L., Bellman, S. (2008). An Augmented Model of Customer Loyalty for Organizational Purchasing of Financial Services. Journal of Business-To-Business Marketing, Vol. 15, No. 3, p. 290–322.
Žūkaitė, G. (2011). Vartotojų pasitenkinimo Lietuvos pastatų ūkio valdymo sektoriaus paslaugomis tyrimas. 14-osios Lietuvos jaunųjų mokslininkų konferencijos „Mokslas – Lietuvos ateitis“ 2011 metų teminės konferencijos „Statyba“ straipsnių rinkinys. Available at: <http://dspace.vgtu.lt/bitstream/1/962/1/G.%20Zukaite.pdf>
VA RTO TO J Ų PA S I T E N K I N I M A S M A I T I N I M O PA S L A U G O M I S L I E T U VO J E
Viktorija GriGaliūnaitė, lina Pilelienė
Vytauto Didžiojo universitetas (Lietuva)
Santrauka
Vartotojų pasitenkinimas traktuojamas kaip vienas pagrindinių organizacijos sėkmės veiksnių šiuolaikinėje konkurencijos varžomoje rinkoje. Žinojimas, kiek vartotojai yra patenkinti, gali padėti organizacijai įvertinti veiklos efektyvumą, nustatyti ateities tikslus, taip pat numatyti būtinus veiksmus, kurie padėtų išlaikyti ar padidinti pasitenkinimą. Mokslinėje literatūroje (Cassel, Eklöf, 2001; Yew-Wing, Bellman, 2008 ir kt.) vartotojų pasitenkinimas dažniausiai matuojamas ir analizuojamas kaip vartotojų lojalumo padarinys. Be to, siekiant išmatuoti vartotojų pasitenkinimą, būtina nustatyti ir įvertinti jo determinantus (veiksnius, kurie daro įtaką vartotojų pasitenkinimo lygiui). Analizuodami vartotojų pasitenkinimą, I. Ferreira ir kt. (2010) teigia, kad būtina nustatyti patikimus ir nepriklausomus vartotojų pasitenkinimo vertinimo būdus, kurie leis palyginti organizacijas, veikiančias tame pačiame sektoriuje ir / ar toje pačioje šalyje, ar makroekonominiame lygmenyje. Vienas tokių būdų, bene dažniausiai taikomas vartotojų pasitenkinimo moksliniams tyrimams (Ferreira ir kt., 2010; Leite, Filho, 2007; Lopes ir kt., 2009; Yew-Wing, Bellman, 2008 ir kt.), – išmatuoti vartotojų pasitenkinimo indeksą (VPI). H. Lopes ir kt. (2009) teigimu, vartotojų pasitenkinimo tyrimais susidomėta, kai devintajame praėjusio amžiaus dešimtmetyje pristatytas Švedijos vartotojų pasitenkinimo indeksas (SCSI), kitos valstybės, tokios kaip Vokietija, Izraelis, Taivanas, Naujoji Zelandija, taip pat suskubo kurti nacionalinius vartotojų pasitenkinimo indeksus. Šiuo metu geriausiai pasaulyje žinomi ir plačiausiai taikomi vartotojų pasitenkinimo indeksai yra Amerikos vartotojų pasitenkinimo indeksas (ACSI), sukurtas 1994 metais, ir Europos vartotojų pasitenkinimo indeksas (ECSI), pristatytas 1999 metais.
Nors pasaulyje jau tris dešimtmečius vyksta mokslinės diskusijos dėl vartotojų pasitenkinimo matavimo, Lietuva vis dar neturi nacionalinio vartotojų pasitenkinimo indekso. Keli autoriai (Dovalienė ir kt., 2007; Kačinskaitė, 2011; Virvilaite, Dailydiene, 2012; Žūkaitė, 2011) publikavo tyrimų, atliktų giminingose vartotojų pasitenkinimui srityse, rezultatus, tačiau siūlymų sukurti Lietuvos vartotojų pasitenkinimo indeksą aptikti nepavyko. Taigi šio tyrimo būtinumą ir reikšmingumą pagrindžia šio straipsnio autorių atlikti tyrimai (plačiau žr. Grigaliūnaitė, Pilelienė, 2012; Pilelienė, Grigaliūnaitė, 2012). Pradėjus vartotojų pasitenkinimo tyrimus nuo vartotojų pasitenkinimo konkrečios picerijos paslaugomis, vėliau picerijų bendrąja prasme matavimo, tampa aktualu nustatyti vartotojų pasitenkinimą maitinimo paslaugomis Lietuvoje. Tyrimu sprendžiama mokslinė problema keliama klausimu: koks yra vartotojų pasitenkinimas maitinimo paslaugomis Lietuvoje ir kokie veiksniai jį lemia?
Straipsnio t ikslas – įvertinti vartotojų pasitenkinimą maitinimo paslaugomis Lietuvoje.Straipsnio objektas – vartotojų pasitenkinimas maitinimo paslaugomis Lietuvoje.

ISSN 2029-9370. Regional FoRmation and development StudieS, no. 3 (11)
87
Siekiant straipsnio tikslo keliami šie uždaviniai:• apžvelgti vartotojų pasitenkinimo modelius;• atlikti vartotojų pasitenkinimo maitinimo paslaugomis Lietuvoje tyrimą;• sudaryti vartotojų pasitenkinimo maitinimo paslaugomis Lietuvoje modelį.
Tyrimo metodai. Siekiant sudaryti vartotojų pasitenkinimo tyrimo modelį, atlikta mokslinės literatūros analizė ir sintezė. Vartotojų požiūriai į maitinimo paslaugas Lietuvoje ir jų vertinimas nustatyti atlikus anketinę apklausą. Statistinei apklausos duomenų analizei atlikti pasirinkti struktūrinių lygčių modeliavimas (SEM), mažiausių dalinių kvadratų (PLS) metodas, regresinė, koreliacinė ir loginė analizės.
Tyrimo rezultatai atskleidė, kad populiariausios maitinimo įstaigos tarp Lietuvos vartotojų yra kavinės, barai, picerijos ir restoranai. Dauguma respondentų nurodė, kad jų išlaidos viešojo maitinimo įstaigose sudaro mažiau nei dvidešimt procentų visų mėnesio išlaidų. Apskaičiuotas namų ūkio išlaidų maitinimo paslaugoms vidurkis per mėnesį yra dešimt procentų. Apibendrinant galima teigti, kad namų ūkio išlaidų dalis, tenkanti maitinimo paslaugoms, yra gana didelė – viešojo maitinimo paslaugos nėra pirmojo būtinumo produktas.
Tyrimo rezultatai atskleidė, kad nei vertinant vartotojų pasitenkinimą maitinimo paslaugomis Lietuvoje, nei pasitenkinimą konkrečios maitinimo įstaigos paslaugomis, vartotojų lūkesčiai ir įvaizdis vartotojų pasitenkinimo tiesiogiai neveikia. Vartotojų nusiskundimai nei tiesiogiai, nei netiesiogiai neveikia jų lojalumo. Taip pat nustatyta, kad sudarytas vartotojų pasitenkinimo maitinimo paslaugomis Lietuvoje modelis gali būti taikomas visiems tyrimams, kuriais siekiama nustatyti vartotojų pasitenkinimą maitinimo paslaugomis Lietuvoje: pasitenkinimą maitinimo paslaugomis bet kurioje Lietuvos vietovėje ir / ar vartotojų pasitenkinimą bet kuria maitinimo paslaugų rūšimi.
Tyrimu nustatyta, kad vartotojų pasitenkinimas maitinimo paslaugomis Lietuvoje yra vidutinio lygio. Atsižvelgiant į tai, kad atotrūkiai tarp vartotojų lūkesčių, suvokiamos kokybės ir suvokiamos vertės yra dideli, o didžiausias tiesioginis poveikis nustatytas suvokiamos kokybės suvokiamai vertei, apskaičiuotas vartotojų pasitenkinimas yra per žemas.
Vidutinis vartotojų pasitenkinimo maitinimo paslaugomis lygis Lietuvoje gali būti padidintas trim procesais. Pirma, turi būti pagerintas maitinimo paslaugų Lietuvoje įvaizdis. Tinkamiausi įvaizdžio gerinimo būdai – tinkamas rėmimo veiksmų taikymas ir suderinta marketingo komunikacija. Antra, būtina gerinti maitinimo paslaugų kokybę. Galiausiai turi būti didinama vartotojų suvokiama vertė. Vertę galima didinti peržiūrint sąnaudų valdymo metodus ir keičiant marketingo bei pardavimų strategijas.
PAGRINDINIAI ŽODŽIAI: ECSI, maitinimo paslaugos, vartotojų pasitenkinimas.
JEL KLASIFIKACIJA: L660, M310

Copyright of Region Formation & Development Studies is the property of KlaipedaUniversity and its content may not be copied or emailed to multiple sites or posted to alistserv without the copyright holder's express written permission. However, users may print,download, or email articles for individual use.