customer satisfaction survey conducted for the texas department
TRANSCRIPT

Customer Sa sfac on SurveyConducted for the
Texas Department of Insurance
Texas Legisla ve CouncilMay 2014
THE
STATE OF TEX
AS

Customer Satisfaction SurveyConducted for the
Texas Department of Insurance
Prepared by theSta s cal Research Sec on
Research DivisionTexas Legisla ve Council
May 2014

iii
Table of ContentsIntroduction ............................................................................................................................. 1Summary of Findings ............................................................................................................... 3Discussion of Survey Results .................................................................................................... 7
[Q10]. Overall satisfaction with the agency ....................................................................... 7[Q1]. Satisfaction with agency staff .................................................................................... 8[Q2.1]. Satisfaction with the agency’s process for handling complaints about TDI ........... 9[Q2.2]. Satisfaction with the agency’s process for handling complaints about regulated entities ..................................................................................................10[Q3, Q4]. Satisfaction with agency telephone communications ........................................11[Q5, Q6]. Satisfaction with the agency’s Internet sites .....................................................12[Q7]. Satisfaction with timeliness of the agency’s service .................................................14[Q8]. Satisfaction with the agency’s offices .......................................................................15[Q9]. Satisfaction with the agency’s printed information ..................................................16[Q11]. Customers’ self-reported descriptions ...................................................................16[Q12, Q13]. Primary reason customers contacted the agency ..........................................17[Q14]. Customers’ comments regarding how TDI can improve its service ........................19
Limitations of the Study ..........................................................................................................21Appendix A. Methodology ......................................................................................................23Appendix B. Tabular Summary of Survey Data by Question ....................................................27Appendix C. Graphical Summary of Survey Results by Program .............................................79Appendix D. Survey Instrument ..............................................................................................95Notes ....................................................................................................................................103
List of Figures
Figure 1. Overall Satisfaction With the Agency ........................................................................ 7Figure 2. Customer Satisfaction With Agency Staff .................................................................. 8Figure 3. Customer Satisfaction With the Agency’s Process for Handling Complaints
About TDI .................................................................................................................. 9Figure 4. Customer Satisfaction With the Agency’s Process for Handling Complaints
About Regulated Entities .........................................................................................10Figure 5. Customer Satisfaction With Agency Telephone Communications ............................11Figure 6. Customer Satisfaction With the Agency’s Internet Sites ..........................................13Figure 7. Customer Satisfaction With the Agency’s Timeliness of Service ..............................14Figure 8. Customer Satisfaction With the Agency’s Offices .....................................................15Figure 9. Customer Satisfaction With the Agency’s Printed Information ................................16Figure 10. Customer Satisfaction With the Agency’s Service Regarding the Primary
Reason for Contacting TDI ........................................................................................19
iv
List of Tables
Table 1. Percentage of Customers Satisfied With TDI Service .................................................. 4Table 2. Customers’ Self-Reported Descriptions .....................................................................17Table 3. Most Frequent Reasons for Contacting the Agency ...................................................18Table 4. Most Frequent Suggestions for Improving Agency Services ......................................20

1
IntroductionUnder Section 2056.002, Texas Government Code, each executive agency in the State
of Texas is required to submit a strategic plan that outlines specific and detailed elements for its operations. The instructions for preparing the strategic plan outlined by the Governor’s Office of Budget, Planning and Policy and the Legislative Budget Board require all agencies to assess and report on the quality of their customer service. Section 2114.002(b), Texas Government Code, instructs agencies to evaluate at least seven areas of customer service including the agency’s staff, complaint handling process, communications, Internet site, timeliness of service, facilities, and brochures or printed information.
In August 2013, the Texas Department of Insurance (TDI) requested the research division of the Texas Legislative Council (TLC) to evaluate the agency’s customer service and to produce a report to satisfy the requirements of its strategic plan. In response to this request, TLC statistical research staff designed and conducted a scientific survey of entities and individuals who were identified by TDI as customers of at least one of the agency’s 12 programs in the six-month period from February 1, 2013, through July 31, 2013. The 12 agency programs included:
• Agent’s Licensing (AL)
• Consumer Protection (CP)
• Division of Workers’ Compensation (DWC) Carriers
• DWC Employers
• DWC Health Care Providers
• DWC Injured Employees
• Enforcement
• Financial
• Fraud
• Life and Health (L&H)
• Property and Casualty (P&C)
• State Fire Marshal’s Office (SFMO)
This report summarizes the results of the customer satisfaction surveys that TLC received between September 2013 and January 2014 (hereafter referred to as the “2013 survey”). Based on commonly accepted survey standards, the survey response rates achieved in this study were sufficient to provide statistically valid results.1 The combined response rate for all programs for the survey was 40 percent. Response rates for programs ranged from 23 percent (DWC Employers) to 61 percent (L&H). The percentage of respondents who refused to participate in the survey ranged from zero percent (Enforcement) to 16 percent (DWC Carriers). The overall refusal rate for the survey was eight percent. (For additional detail regarding methodology and response rates, see Appendix A and Table A-1.)
In this report, the summary of findings presents an overview of results and a discussion of general patterns that are evident across all seven required measures of customer satisfaction. The discussion of survey results presents detailed results concerning overall satisfaction with TDI and in each of the seven measures of service, and it concludes with an analysis of respondents’

2
written comments. Survey methodology is described in Appendix A. Appendix B presents tabulated responses to each survey question (note that the appendix tables are numbered to correspond to the questions on the survey instrument). Appendix C presents a graphical summary of survey results by program. Each graph depicts customers’ satisfaction by service area arranged in descending order of satisfaction. The survey instrument, originally in booklet form, is reproduced in Appendix D.

3
Summary of FindingsCustomers were asked to rate their level of satisfaction with service provided by TDI in
the seven areas outlined in Section 2114.002(b), Texas Government Code. These areas include staff services, communication services, Internet sites, brochures or printed information, timeliness of service, satisfaction with the agency’s offices, and whether there is an effective process for lodging a complaint in the event there is a problem with customer service. Customers were also asked to rate their level of satisfaction with TDI service regarding complaints filed about entities that were regulated by the agency. In addition, each customer was asked to select a description that best applied to his or her role as a TDI customer (e.g., “agent/adjuster”; “injured employee”), state the primary reason for contacting TDI, rate the level of satisfaction with TDI regarding that issue, and suggest how TDI could improve its service.
Table 1 below summarizes customers’ satisfaction by program for each of these service areas. The “All Programs Combined” responses that are reported in this and subsequent tables are weighted estimates that compensate for the unequal sampling proportions of different customer groups. (See Appendix A for a more detailed discussion of sampling.)

4
Table 1. Percentage of Customers Sa sfi ed With TDI Service
ProgramOverall
Sa sfac on Staff
Complaints about TDI
Service
Complaints about
Regulated En es Telephone Internet Timeliness Offi ces Publica ons
All Programs Combined* 71 80 69 66 72 70 70 70 74Agent’s Licensing 82 84 80 79 77 80 78 77 83Consumer Protection 58 77 72 56 68 71 62 58 63Division of Workers’ Compensation (DWC)* 64 73 60 58 63 63 63 66 69
DWC Carriers 72 81 63 65 70 65 69 76 74 DWC Employers 76 83 71 69 73 74 74 72 74 DWC Health Care Providers 63 82 58 48 69 57 63 68 72 DWC Injured Employees 56 67 54 52 58 57 57 63 66Enforcement2 60 63 48 39 60 54 48 42 60Financial 82 85 68 67 80 72 81 75 77Fraud 74 85 75 64 80 77 79 71 83Life and Health 91 91 71 68 89 68 84 90 77Property and Casualty 74 87 68 66 83 66 76 68 74State Fire Marshal’s Office 90 93 82 76 87 79 87 84 88
*Weighted estimates

5
Each dimension of customer service is discussed in detail in the body of this report, but some of the notable findings are summarized below:
• Approximately 7 out of 10 customers reported that they were satisfied with the agency overall.
The overall level of satisfaction with TDI was 71 percent, while 15 percent of customers were neutral in their overall assessment of the agency and 14 percent were dissatisfied. Corresponding figures from the survey conducted in 2011 were 69 percent satisfied, 18 percent neutral, and 13 percent dissatisfied.
• Overall customer satisfaction was greater in 2013 than in 2011 in every service area, except handling of complaints about regulated entities (66 percent in both years).
The largest increase in the level of satisfaction with TDI service occurred in its Internet sites (70 percent in 2013 versus 65 percent in 2011).
• Across service areas, customers expressed the most satisfaction with the service they received from TDI staff (80 percent) and the least satisfaction with TDI’s handling of complaints about regulated entities (66 percent).
In 2011, customers were most satisfied with the service they received from TDI’s staff (79 percent) and least satisfied with TDI’s Internet services (65 percent).
• Customers of the L&H and SFMO programs indicated the highest overall levels of satisfaction with TDI (91 and 90 percent respectively).
• The program with the lowest level of customer satisfaction was DWC Injured Employees (56 percent), followed closely by the Consumer Protection (58 percent) and Enforcement2 (60 percent) programs.
• The largest increases in customer satisfaction from 2011 to 2013 occurred in the DWC Carriers (57 percent to 72 percent) and the DWC Health Care Providers (54 percent to 63 percent) programs.
• The Financial and Fraud programs experienced the largest decreases in overall satisfaction from 2011 to 2013. Satisfaction with the Financial program decreased from 89 percent to 82 percent, and satisfaction with the Fraud program decreased from 84 percent to 74 percent.
• Enforcement 2 program customers had the same overall level of satisfaction with TDI services in 2011 and 2013 (60 percent).

7
Discussion of Survey ResultsThe discussion of survey results begins with an analysis of the overall level of satisfaction
with TDI, followed by discussion of the seven areas of customer service mandated in Section 2114.002(b), Texas Government Code. In each area, we explain how the questions that appeared in the TDI Customer Satisfaction Survey are related to the sample questions recommended by the Governor’s Office of Budget, Planning and Policy and the Legislative Budget Board 3 or are suggested in the statute. Specific responses were combined to derive a composite level of satisfaction within a service area by customer group. Composite satisfaction levels are shown graphically for all programs combined (APC) and for the two programs with the highest level of satisfaction and the two programs with the lowest level of satisfaction. In the figures, the percentage of customers who gave an opinion on a topic is shown in parentheses next to the label for the respondent group, and the bars in the figures exclude respondents who did not give an opinion.
For overall satisfaction with TDI and for each of the seven service areas, programs that had a change in satisfaction of at least 10 percentage points between the 2013 survey and an identical survey TLC conducted for TDI in 2011 are identified. This is followed by discussion of programs that exhibited a difference of at least 10 percentage points between the overall satisfaction level with the program and the satisfaction level for particular questions within the service area. As the two programs that have the highest level of satisfaction and the two programs that have the lowest level of satisfaction often exhibit such differences, we restrict this discussion to programs not highlighted in the composite measure for the service area.
Finally, free response comments are summarized, and the limitations of the study are discussed.
[Q10]. Overall satisfaction with the agency
As shown in Figure 1 below, 71 percent of customers who responded were satisfied with the service they received from TDI. L&H and SFMO program customers expressed the highest levels of satisfaction with TDI. Additionally, approximately four out of five AL and Financial program customers were satisfied. CP, DWC Injured Employees, and Enforcement2 program customers were the least satisfied. (See Appendix B, Table B-10, for detailed data related to customers’ overall satisfaction with TDI for all programs.)
Figure 1. Overall Sa sfac on With the Agency
71
91
90
58
56
15
8
7
11
19
14
1
3
30
24
All Programs Combined* (94% gave opinion)
Life and Health (97% gave opinion)
State Fire Marshal's Office (96% gave opinion)
Consumer Protection (93% gave opinion)
DWC Injured Employees (94% gave opinion)
% Satisfied % Neutral % Dissatisfied
*Weighted estimates

8
In 2011, respondents from the SFMO and Financial programs were the most satisfied customers, while respondents from the DWC Injured Employees and the DWC Health Care Providers programs were the least satisfied. Overall satisfaction with the DWC Carriers program increased from 57 percent in 2011 to 72 percent in 2013.
[Q1]. Satisfaction with agency staff
The Instructions for Preparing and Submitting Agency Strategic Plans, Fiscal Years 2013-20173
recommends that agencies use questions regarding the following measures to gauge customer satisfaction with agency staff:
• Staff members were able to answer customer questions
• Staff members were courteous
• Staff members were knowledgeable and helpful
• Staff members were knowledgeable and demonstrated a willingness to assist
• Staff members identified themselves or wore a name tag
These suggestions formed the basis for a set of four survey questions that asked TDI customers whether agency staff were courteous, friendly, and knowledgeable about TDI services and whether staff identified themselves. As shown in Figure 2, 80 percent of customers were satisfied with the service they received from agency staff. (See Appendix B, Tables B-1 and B-1a through B-1d, for detailed data related to this section.)
Figure 2. Customer Sa sfac on With Agency Staff
93
91
67
63
14
7
8
18
34
7
1
1
15
3
All Programs Combined* (86% gave opinion)
State Fire Marshal's Office (89% gave opinion)
Life and Health (89% gave opinion)
DWC Injured Employees (94% gave opinion)
Enforcement² (98% gave opinion)
% Satisfied % Neutral % Dissatisfied
*Weighted estimates
Comparing results from 2013 to results from 2011, the data shows that:
• Satisfaction with TDI staff increased by 14 percentage points in the DWC Health Care Providers program

9
• Satisfaction with TDI staff decreased by 24 percentage points in the Enforcement2 program
At least three-fourths of customers in every program but Enforcement2 and DWC Injured Employees were satisfied with the service they received from TDI staff. Additional examination of the data shows that 87 percent of P&C program customers were satisfied with the friendliness of TDI staff versus the APC average of 76 percent.
[Q2.1]. Satisfaction with the agency’s process for handling complaints about TDI
The Instructions for Preparing and Submitting Agency Strategic Plans, Fiscal Years 2013-20173 recommends that agencies use questions regarding the following measures to gauge customer satisfaction with the agency’s process for handling complaints about the agency:
• Customers knew how to make a complaint regarding services at this agency
• If a customer complained, the customer believed the complaint would be addressed in a reasonable manner
These suggestions formed the basis for two survey questions that asked TDI customers whether complaints about TDI were easy to file and whether the agency’s responses to complaints were timely. As shown in Figure 3 below, more than two-thirds of customers were satisfied with the agency’s complaint-handling process. (See Appendix B, Tables B-2.1, B-2a, and B-2b, for detailed data related to this section.)
Figure 3. Customer Sa sfac on With the Agency’s Process for Handling Complaints About TDI
69
82
80
54
48
17
13
13
17
33
14
5
6
29
19
All Programs Combined* (6 % gave opinion)
State Fire Marshal's Office (40% gave opinion)
Agent's Licensing (49% gave opinion)
DWC Injured Employees (78% gave opinion)
Enforcement² (90% gave opinion)
% Satisfied % Neutral % Dissatisfied
*Weighted estimates
From 2011 to 2013, satisfaction with TDI’s handling of complaints about its service increased by 15 percentage points in the CP program and by 22 percentage points in the DWC Carriers program. The L&H and Enforcement2 programs showed decreases in customer satisfaction levels of 13 and 21 percentage points, respectively.

10
Additional examination of the data shows that compared to average satisfaction with each program, for individual questions:
• Fraud program customers were more satisfied with the ease of filing complaints about TDI (80 percent versus 69 percent overall) and DWC Carriers program customers were less satisfied (58 percent)
• DWC Health Care Providers program customers were less satisfied with the timeliness of TDI’s response to complaints (54 percent versus 69 percent overall)
[Q2.2]. Satisfaction with the agency’s process for handling complaints about regulated entities
TDI designed three questions that gauge customer satisfaction with the agency’s process for handling complaints about entities that it regulates. The survey asked customers to rate their level of agreement with the following statements:
• TDI handled complaints against insurers or regulated entities effectively
• TDI provided updates on the progress of insurance-related complaints
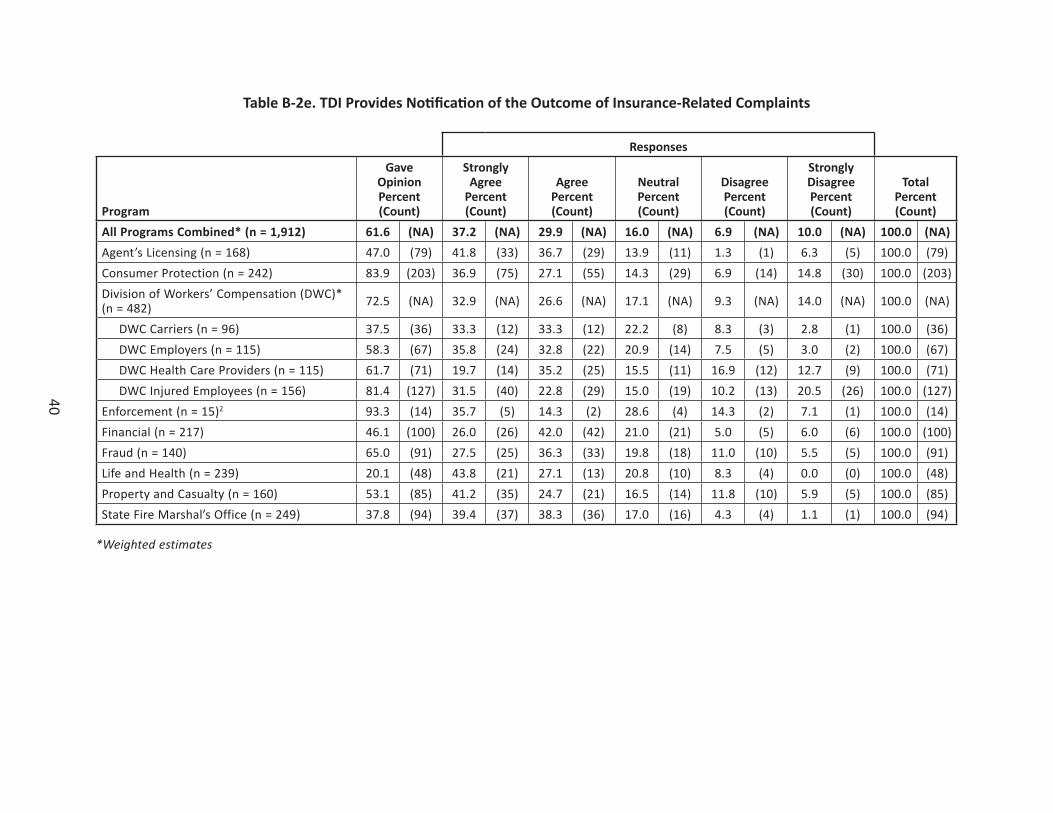
• TDI provided notification of the outcome of insurance-related complaints
As shown in Figure 4 below, approximately two-thirds of customers who responded to these questions were satisfied with the agency’s process for handling complaints about entities it regulates. In two programs (DWC Health Care Providers and Enforcement2), fewer than one-half of the surveyed customers who responded were satisfied. (See Appendix B, Tables B-2.2 and B-2c through B-2e, for detailed data related to this section.)
Figure 4. Customer Sa sfac on With the Agency’s Process for Handling Complaints About Regulated En es
66
79
76
48
39
17
14
18
19
39
18
7
6
34
22
All Programs Combined* (61% gave opinion)
Agent's Licensing (46% gave opinion)
State Fire Marshal's Office (38% gave opinion)
DWC Health Care Providers (64% gave opinion)
Enforcement² (91% gave opinion)
% Satisfied % Neutral % Dissatisfied
*Weighted estimates

11
Comparing results from 2013 to results from 2011, the only program with a decrease in customer satisfaction of at least 10 percentage points was Enforcement2 (50 percent in 2011 versus 39 percent in 2013). Customer satisfaction did not increase by 10 percentage points or more for any program.
For composite satisfaction, just over one-half of DWC Injured Employees program customers were satisfied with TDI service, and their satisfaction for each of the three measures listed above was at least 10 percentage points less than the APC average level of satisfaction for the measures. CP program customers were at least 10 percentage points less satisfied than the APC average level of satisfaction with both TDI’s effectiveness in handling complaints and in providing progress updates regarding complaints.
[Q3, Q4]. Satisfaction with agency telephone communications
Customers were asked five questions regarding gaining access to TDI staff by telephone. Section 2114.002(b), Texas Government Code, states, “Each agency shall gather information from customers … [that] may include evaluations of an agency’s … communications, including toll-free telephone access, the average time a customer spends on hold, call transfers, [and] access to a live person.” The TDI survey included questions that addressed each of these points. Customers were also asked about their satisfaction with the timeliness of TDI when agency staff returned their calls.
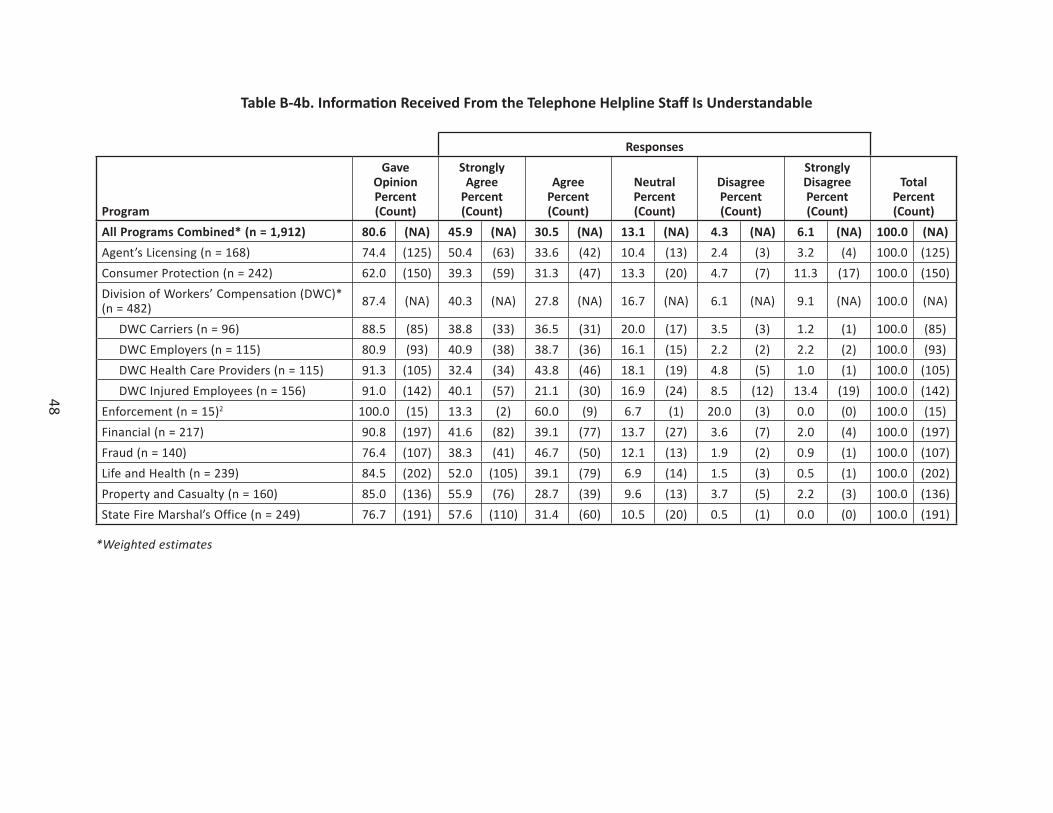
Four additional questions requested that customers evaluate the services provided by agency staff during telephone conversations. TDI customers were asked whether the information they received from staff was accurate, understandable, and helpful, and whether the staff themselves were friendly and helpful. As shown in Figure 5 below, about 7 in 10 TDI customers were satisfied with the service they received when calling the agency. (See Appendix B, Tables B-3 and 4, Tables B-3a through B-3e, and Tables B-4a through B-4d, for detailed data related to this section.)
Figure 5. Customer Sa sfac on With Agency Telephone Communica ons
72
89
87
60
58
17
10
11
24
19
12
1
3
16
23
All Programs Combined* (77% gave opinion)
Life and Health (66% gave opinion)
State Fire Marshal's Office (71% gave opinion)
Enforcement² (96% gave opinion)
DWC Injured Employees (88% gave opinion)
% Satisfied % Neutral % Dissatisfied
*Weighted estimates

12
Satisfaction of DWC Health Care Providers program customers with telephone communications increased from 59 percent in 2011 to 69 percent in 2013, and satisfaction of Enforcement2 program customers decreased from 74 percent to 60 percent.
The data also shows that:
• P&C program customers were at least 10 percentage points more satisfied than the APC average level of satisfaction with all five aspects of accessing TDI via telephone: toll-free access, ability to access a customer service representative, amount of time placed on hold, number of call transfers, and timeliness of returned calls; Financial program customers were likewise more satisfied on the last three aspects
• Satisfaction with TDI’s timeliness of returning calls was 54 percent for DWC Health Care Providers program customers compared to the APC customer satisfaction level of 64 percent
• Compared to the APC customer satisfaction level concerning the helpfulness of information provided during telephone conversations (75 percent), AL and Fraud program customers were at least 10 percentage points more satisfied (85 percent for both), while CP program customers were at least 10 percentage points less satisfied (64 percent)
• Satisfaction with the friendliness and helpfulness of TDI staff during telephone conversations was 87 percent for Fraud program customers compared to the APC customer satisfaction level of 77 percent
[Q5, Q6]. Satisfaction with the agency’s Internet sites
The Instructions for Preparing and Submitting Agency Strategic Plans, Fiscal Years 2013-20173 recommends that agencies use questions regarding the following measures to gauge customer satisfaction with the agency’s Internet sites:
• Customers were able to access information about services needed using the Internet
• The website was easy to use and well organized
• The website contained clear and accurate information on events, services, and contact information

13
These suggestions formed the basis for six survey questions that asked TDI customers whether the agency’s Internet sites were easy to use, clearly explained services, listed its office locations, gave contact persons, and had accurate and useful information. Additionally, TDI customers were asked whether the search feature was easy to use and helpful. As shown in Figure 6 below, 7 in 10 customers were satisfied with the agency’s Internet sites. (See Appendix B, Tables B-5 and 6, Tables B-5a through B-5f, and Tables B-6a through B-6b, for detailed data related to this section.)
Figure 6. Customer Sa sfac on With the Agency’s Internet Sites
70
80
79
57
54
20
14
16
27
31
10
7
5
16
15
All Programs Combined* (66% gave opinion)
Agent's Licensing (82% gave opinion)
State Fire Marshal's Office (74% gave opinion)
DWC Health Care Providers (86% gave opinion)
Enforcement² (78% gave opinion)
% Satisfied % Neutral % Dissatisfied
*Weighted estimates
Satisfaction with the CP program increased 14 percentage points between 2011 and 2013 (57 percent to 71 percent), and satisfaction with the Enforcement2 program decreased by the same amount (68 percent to 54 percent).
The data also shows that:
• DWC Injured Employees program customers were at least 10 percentage points less satisfied than the APC average level of satisfaction with every aspect of TDI’s Internet sites except the helpfulness of the search features and the ease of finding a list of office locations
• DWC Carriers were at least 10 percentage points less satisfied than the APC average level of satisfaction with the ease of using the search features and the helpfulness of the search features
• Among Fraud program customers, satisfaction with the accuracy of information on TDI’s Internet sites was 86 percent versus 75 percent APC, and their satisfaction with the usefulness of information was 87 percent versus 72 percent APC
• Satisfaction with the ease of using TDI’s Internet sites was 78 percent for DWC Employers program customers compared to the APC customer satisfaction level of 68 percent

14
[Q7]. Satisfaction with timeliness of the agency’s service
The Instructions for Preparing and Submitting Agency Strategic Plans, Fiscal Years 2013-20173 recommends that agencies use questions regarding the following measures to gauge customer satisfaction with the timeliness of an agency’s service:
• A customer’s telephone, letter, or e-mail inquiry was answered in a reasonable amount of time
• The time a customer waited to receive services was reasonable
• The time a customer waited for a concern or question to be addressed, whether by phone, in person, or by letter was reasonable
These concerns were addressed in the survey through questions that asked TDI customers whether they received timely service from the agency when making contact in person, by telephone, by mail, by e-mail, or through TDI’s Internet sites. As shown in Figure 7 below, 7 in 10 customers were satisfied with the timeliness of the agency’s service, while less than one-half of Enforcement2 program customers were satisfied. (See Appendix B, Table B-7 and Tables B-7a through B-7e, for detailed data related to this section.)
Figure 7. Customer Sa sfac on With the Agency’s Timeliness of Service
70
87
84
57
48
17
12
15
16
36
13
1
1
27
16
All Programs Combined* (61% gave opinion)
State Fire Marshal's Office (63% gave opinion)
Life and Health (56% gave opinion)
DWC Injured Employees (62% gave opinion)
Enforcement² (77% gave opinion)
% Satisfied % Neutral % Dissatisfied
*Weighted estimates
Satisfaction with timeliness of service increased from 55 percent in 2011 to 69 percent in 2013 for DWC Carriers program customers. Satisfaction decreased from 65 percent in 2011 to 48 percent in 2013 for the Enforcement2 program customers.
Financial program customers were the third most satisfied group (81 percent), and on three aspects, their satisfaction was at least 10 percentage points more than the APC average (timeliness of service in person, by telephone, and by e-mail). Other customer groups with satisfaction levels that were at least 10 percentage points more than the APC average regarding timeliness of service included customers of the AL (by e-mail and through TDI’s Internet sites), Fraud (in person and by e-mail), and P&C (by e-mail) programs. Two programs had satisfaction

15
levels that were at least 10 percentage points less than the APC average for certain aspects of timeliness of service: DWC Health Care Providers (by mail and through TDI’s Internet sites) and CP (in person).
[Q8]. Satisfaction with the agency’s offices
Section 2114.002(b)(1), Texas Government Code, provides that the evaluation of an agency’s facilities may include an assessment of the customer’s ability to access that agency and an assessment of the office location, signage, and cleanliness. These recommendations were implemented on the survey by asking TDI customers whether the agency’s offices are accessible, conveniently located, clearly identified with signs, and clean. As shown in Figure 8 below, 70 percent of customers were satisfied with the agency’s offices. (See Appendix B, Table B-8 and Tables B-8a through B-8d, for detailed data related to this section.)
Figure 8. Customer Sa sfac on With the Agency’s Offi ces
90
84
58
42
2
10
15
24
46
9
0
1
18
13
All Programs Combined* (43% gave opinion)
Life and Health (10% gave opinion)
State Fire Marshal's Office (38% gave opinion)
Consumer Protection (26% gave opinion)
Enforcement² (40% gave opinion)
% Satisfied % Neutral % Dissatisfied
*Weighted estimates
SFMO program customer satisfaction increased from 63 percent in 2011 to 84 percent in 2013, and L&H program customer satisfaction increased from 73 percent to 90 percent.* In contrast, Enforcement2 program customer satisfaction decreased from 53 percent in 2011 to 42 percent in 2013.
Financial program customer satisfaction with the accessibility of TDI offices was 84 percent compared to the APC average satisfaction level of 73 percent, and 74 percent of Financial program customers were satisfied that TDI offices were conveniently located compared to the APC average of 64 percent. The APC average satisfaction level with the cleanliness of TDI offices was 74 percent, and satisfaction among Fraud program customers was 85 percent. However, only 54 percent of DWC Health Care Providers program customers were satisfied that TDI offices were clearly identified with signs, compared to the APC average of 67 percent.
* Note that in 2013 only 10 percent of L&H program respondents provided an opinion, so these results shouldbe generalized with caution.

16
[Q9]. Satisfaction with the agency’s printed information
The Instructions for Preparing and Submitting Agency Strategic Plans, Fiscal Years 2013-20173 recommends that agencies use questions regarding the following measures to gauge customer satisfaction with the agency’s printed information:
• The customer received printed information (such as brochures, handouts, books, etc.) explaining the services available
• The printed information was clear and understandable
• Printed brochures or written material provided thorough and accurate information
These suggestions formed the basis for five survey questions that asked TDI customers whether the agency’s printed information is accurate, understandable, useful, well-designed, and interesting given the topic. As shown in Figure 9 below, 74 percent of customers were satisfied with the agency’s printed information. (See Appendix B, Tables B-9 and B-9a through B-9e, for detailed data related to this section.)
Figure 9. Customer Sa sfac on With the Agency’s Printed Informa on
74
88
83
63
60
19
11
13
22
36
7
0
4
15
4
All Programs Combined* (64% gave opinion)
State Fire Marshal's Office (61% gave opinion)
Agent's Licensing (61% gave opinion)
Consumer Protection (41% gave opinion)
Enforcement² (60% gave opinion)
% Satisfied % Neutral % Dissatisfied
*Weighted estimates
Regarding TDI’s printed information, none of the 12 programs experienced changes in satisfaction of at least 10 percentage points from 2011 to 2013.
Regarding how interesting TDI’s printed information was, the Fraud program customer group was the only group with a satisfaction level that was at least 10 percentage points greater than the APC average (83 percent compared to the APC average of 72 percent).
[Q11]. Customers’ self-reported descriptions
The survey presented each respondent with a list of customer descriptions and asked the respondent to select the description that best applied to his or her role as a customer of TDI. Respondents also could supply “Other” descriptions. Some customers selected multiple

17
descriptions, and some customers did not answer the question. TLC staff analyzed the “Other” descriptions and generated additional categories as needed. Table 2 below summarizes customers’ self-reported and “Other” descriptions.
Table 2. Customers’ Self-Reported Descrip ons
Originally Listed Description Count “Other” Descriptions CountInsurance Industry Representative 473 Supplied other job title/description 46Consumer 327 Investigator 27Agent/Adjuster 246 Infrequent or miscellaneous response 11Health Care Provider 215 Attorney/Legal Assistant/Paralegal 11Employer 173 Public Employee/Official 7State Fire Marshal’s Office Customer 169 Supplied company or business description 2Injured Employee 147Workers’ Compensation Carrier 84Law Enforcement Entity 30Workers’ Compensation Health Care Network 23Open Records Requestor 4
Although self-reported descriptions do not necessarily correspond to TDI’s programs, it is plausible to assume that self-reported employers, injured employees, health care providers, workers’ compensation carriers, and workers’ compensation health care network respondents were customers of a program within the DWC, and this subset accounted for 32 percent of the self-reported descriptions. Customers who are directly employed in the insurance industry (insurance industry representatives and agents/adjusters) accounted for 36 percent of the self-reported descriptions.
[Q12, Q13]. Primary reason customers contacted the agency
The agency asked customers to state the primary reason they contacted TDI and to rate their level of satisfaction with the service received from TDI regarding that issue. As Table 3 shows, the primary reason that a customer contacted TDI was closely related to the function of the TDI program division that was contacted. For example, respondents identified as having contacted DWC Employers, DWC Health Care Providers, and DWC Injured Employees (programs 4, 5, and 6) were most likely to contact the agency because of issues relating to workers’ compensation. Similar results are evident for the other program divisions. (See Appendix B, Table B-13, for detailed data related to this section.)

18
Table 3. Most Frequent Reasons for Contac ng the Agency
Texas Department of Insurance Programs*Comment Theme 1 2 3 4 5 6 7 8 9 10 11 12 TotalIssue related to licensing or certification 111 4 2 3 1 1 46 4 8 3 74 257
Issue related to filing rates, forms, or reports 11 1 2 42 1 174 13 12 256
Issue related to premium, coverage, or settling a claim 3 132 4 6 8 19 1 3 6 3 42 3 230
Issue related to workers’ compensation 2 4 12 35 44 97 10 12 4 7 227
Issue related to regulated entity 3 13 3 1 2 36 4 13 14 13 102Issue related to a complaint against a company or agent 50 5 6 4 8 7 7 1 1 89
Information request 1 13 10 7 10 1 10 4 7 6 9 78Miscellaneous or infrequent response 3 10 1 4 4 8 1 10 5 5 4 10 65
Issue related to insurance fraud 2 1 2 2 48 1 1 57
Did not contact TDI/don’t recall 3 2 8 5 1 3 7 4 3 4 40
Issue related to windstorm/TWIA 1 1 1 36 39
Issue related to SFMO 1 32 33Issue related to training or conference 1 1 2 2 18 2 1 4 31
Issue related to health insurance or providers 5 1 2 1 1 6 1 2 19
Issue related to arson or fire investigation 10 10
Total 125 226 61 72 81 128 14 175 118 226 127 180 1,533
*Key to TDI program divisions:
1. Agent’s Licensing 5. DWC Health Care Providers 9. Fraud2. Consumer Protection 6. DWC Injured Employees 10. Life & Health3. DWC Carriers 7. Enforcement 11. Property & Casualty4. DWC Employers 8. Financial 12. SFMO
1. Agent’s Licensing2. Consumer Protection3. DWC Carriers4. DWC Employers5. Design / Engineering
Procurement
5. DWC Health Care Providers6. DWC Injured Employees7. Enforcement8. Financial10. Letting Management
9. Fraud10. Life & Health11. Property & Casualty12. SFMO15. State Legislative Affairs

19
As shown in Figure 10 below, 7 in 10 customers were satisfied with the agency’s service regarding their primary reason for contacting TDI. However, 34 percent of the customers of the CP program and 30 percent of the DWC Injured Employees program who gave an opinion were very dissatisfied with the agency’s service regarding their primary reason for contacting TDI.
Figure 10. Customer Sa sfac on With the Agency’s Service Regarding the Primary Reason for Contac ng TDI
70
93
91
54
54
14
6
7
16
12
15
1
2
30
34
All Programs Combined* (89% gave opinion)
Life and Health (93% gave opinion)
State Fire Marshal's Office (90% gave opinion)
DWC Injured Employees (93% gave opinion)
Consumer Protection (91% gave opinion)
% Satisfied % Neutral % Dissatisfied
*Weighted estimates
DWC Carriers program customer satisfaction increased from 60 percent in 2011 to 76 percent in 2013.
In addition to L&H and SFMO program customers, Financial (83 percent) and AL (81 percent)program customers expressed satisfaction more than 10 percentage points above the APC average.
[Q14]. Customers’ comments regarding how TDI can improve its service
The final question of the survey asked TDI customers to suggest ways that the agency can improve its service. As shown in Table 4, many customers expressed unsolicited praise for the agency or agency staff. In addition, a large proportion of those who answered the question thought that no improvement was necessary or could think of no way that service could be improved. Some customers suggested that the agency website should be improved. DWC Injured Employees program customers most often suggested that the workers’ compensation system should be improved in various ways, and they also made the most suggestions to improve customer service. A substantial number of customers, particularly in the CP program, suggested that TDI needs more enforcement authority and/or to be more aggressive in its enforcement.

20
Table 4. Most Frequent Sugges ons for Improving Agency Services
Texas Department of Insurance Programs*
Comment Theme 1 2 3 4 5 6 7 8 9 10 11 12 TotalExpressed praise for TDI or agency staff 16 32 5 9 19 27 12 24 22 19 185
No improvement necessary; no suggestions 17 14 4 15 11 13 2 16 11 19 16 28 166
Website needs to be improved 3 5 4 2 13 2 17 4 17 6 9 82
Needs more enforcement authority or more aggressive enforcement 1 46 1 4 6 1 3 6 6 2 76
Improve staff training: courtesy, customer service 6 21 4 4 1 22 1 6 4 1 2 2 74
Miscellaneous or infrequent response 1 14 1 4 4 4 1 8 10 2 11 3 63Respond in a more timely manner 11 10 1 1 4 12 8 4 4 3 4 62
Provide more frequent updates or better information 4 12 4 1 5 2 7 2 6 3 3 49
Improve WC system 1 9 25 1 2 1 2 41Increase number of TDI employees 3 3 1 1 3 17 2 2 4 36
Improve telephone service 4 4 2 2 2 9 1 2 4 1 2 33
Improve licensing process 10 1 6 1 12 30
Improve forms, documentation, or reports 2 4 4 3 4 1 5 3 2 28
Improve filing process 1 1 4 17 2 1 26
Improve staff training: more substantive knowledge 1 2 1 6 3 1 8 1 1 1 25
TDI should be more impartial 9 1 2 5 3 2 2 24
Improve complaint process 12 1 1 2 1 3 2 22Negative assessment of entire agency 1 12 3 1 2 1 20Reduce costs to customers 1 4 1 1 3 3 13
Total 81 206 24 39 68 134 14 122 84 102 84 97 1,055
*Key to TDI program divisions:
1. Agent’s Licensing 5. DWC Health Care Providers 9. Fraud2. Consumer Protection 6. DWC Injured Employees 10. Life & Health3. DWC Carriers 7. Enforcement 11. Property & Casualty4. DWC Employers 8. Financial 12. SFMO
1. Agent’s Licensing2. Consumer Protection3. DWC Carriers4. DWC Employers5. Design / Engineering
Procurement
5. DWC Health Care Providers6. DWC Injured Employees7. Enforcement8. Financial10. Letting Management
9. Fraud10. Life & Health11. Property & Casualty12. SFMO15. State Legislative Affairs

21
Limitations of the StudyIt should be kept in mind that although the number of returned surveys is sufficient to
provide statistically valid results, on several measures the number of respondents who gave an opinion was sufficiently small that direct generalization of the findings to the overall population should be made with caution.

23
Appendix A.Methodology

25
The TDI Customer Satisfaction Survey was prepared by TLC statistical research staff according to established guidelines for scientific surveys.1, 4 To ensure content accuracy, thoroughness, and readability of the survey documents, the staff obtained comments and suggestions from representatives of TDI.
The surveys were fielded in two phases between September 2013 and February 2014. An online survey was conducted during the months of September and October 2013 that was directed to survey recipients who included an e-mail address in the information they filed with TDI. A subsequent paper survey was directed to recipients who did not report an e-mail address to TDI and to recipients who did not respond to the online survey. In accordance with commonly accepted standards, survey recipients were contacted with up to five separate mailings in different formats to obtain the highest possible response rates and to ensure that the findings could be generalized.1,4
From the complete listing of all customers who contacted TDI between February 1, 2013, and July 31, 2013, TLC selected 4,975 TDI customers to participate in the survey.* TDI is organized into 12 program areas, and each area supplied data for the project. Three customer groups (DWC Carriers, DWC Health Care Providers, and Enforcement2) had populations small enough to warrant surveying the entire population. Relatively few of these customers had used these programs in the six months before the survey, so excluding even a few of these individuals could have had a significant effect on the findings. For the other nine groups, the population of customers was large. To minimize cost, TLC staff selected a sample of customers from each of these groups to participate in the survey. These samples were drawn using probability-based random sampling, a standard technique that ensures impartiality and precise estimates.
The overall response rate was 40 percent, with a refusal rate of 8 percent. For five programs, less than one-third of the customers surveyed responded (AL, DWC Carriers, DWC Employers, DWC Injured Employees, and P&C). Response rates were 50 percent or greater for three programs (Financial, L&H, and SFMO).
The final survey response rates were sufficiently large to produce statistically valid results1,4 for each of the 12 program areas with 90 percent confidence and an overall margin of error of 6.5 percent. (See Table A-1 for a summary of survey responses, and see Appendix D for a copy of the survey instrument.)
* The initial mailing included one individual who is an employee of TDI, and who should have been excluded from the sample. We counted this individual as “undeliverable” in Table A-1 below, and the effect on our analysis of the survey results is negligible.

26
Table A-1. Summary of Survey Responses
Program
Number of Initial Mailing
Number Undeliverable
Number of Surveys Delivered
Number Responding
Response Rate
Number Refusing to Participate Refusal Rate
Margin of Error
All Programs Combined 4,975 236 4,739 1,912 40.3%* 383 8.1%* 6.5%*Agent’s Licensing 538 18 520 168 32.3% 50 9.6% 6.3%Consumer Protection 528 28 500 242 48.4% 29 5.8% 5.2%Division of Workers’ Compensation (DWC) 1,665 70 1,595 482 30.2%* 135 8.5%* 6.9%*
DWC Carriers 290 1 289 96 33.2% 45 15.6% 6.9% DWC Employers 534 41 493 115 23.3% 69 14.0% 7.6% DWC Health Care Providers 303 0 303 115 38.0% 7 2.3% 6.1% DWC Injured Employees 538 28 510 156 30.6% 14 2.7% 6.6%Enforcement2 38 1 37 15 40.5% 0 0.0% 16.7%Financial 430 34 396 217 54.8% 39 9.8% 5.0%Fraud 326 13 313 140 44.7% 18 5.8% 5.6%Life and Health 408 14 394 239 60.7% 21 5.3% 4.5%Property and Casualty 532 40 492 160 32.5% 64 13.0% 6.5%State Fire Marshal’s Office 510 18 492 249 50.6% 27 5.5% 5.1%
*Weighted estimates

27
Appendix B.Tabular Summary of Survey Data by Question

29
Table B-1. TDI Staff - Composite Results
Responses
Program
Gave Opinion Percent
Strongly Agree
PercentAgree
PercentNeutral Percent
Disagree Percent
Strongly Disagree Percent
TotalPercent
All Programs Combined* (n = 1,912) 85.6 48.6 30.9 13.8 2.8 3.8 100.0Agent’s Licensing (n = 168) 77.8 52.8 31.4 12.6 1.1 2.1 100.0Consumer Protection (n = 242) 75.9 44.1 33.2 11.8 4.2 6.7 100.0Division of Workers’ Compensation (DWC)* (n = 482) 90.7 43.4 29.3 17.2 4.2 6.0 100.0
DWC Carriers (n = 96) 90.4 40.6 40.1 17.6 1.7 0.0 100.0 DWC Employers (n = 115) 85.4 43.8 38.9 15.3 1.8 0.3 100.0 DWC Health Care Providers (n = 115) 94.3 45.2 36.9 13.1 3.7 1.2 100.0 DWC Injured Employees (n = 156) 93.6 43.2 23.5 18.3 5.7 9.4 100.0Enforcement (n = 15)2 98.3 35.6 27.1 33.9 3.4 0.0 100.0Financial (n = 217) 92.7 47.7 36.9 11.3 3.0 1.1 100.0Fraud (n = 140) 93.6 52.7 32.8 11.6 1.7 1.1 100.0Life and Health (n = 239) 88.7 58.4 32.8 8.0 0.8 0.0 100.0Property and Casualty (n = 160) 89.8 55.3 32.2 9.9 1.9 0.7 100.0State Fire Marshal’s Office (n = 249) 89.5 58.9 33.8 6.7 0.4 0.1 100.0
*Weighted estimates

30
Table B-1a. The Staff Are Courteous
Responses
Program
GaveOpinion Percent (Count)
Strongly Agree
Percent (Count)
Agree Percent (Count)
Neutral Percent (Count)
Disagree Percent (Count)
Strongly Disagree Percent (Count)
TotalPercent (Count)
All Programs Combined* (n = 1,912) 87.8 (NA) 47.0 (NA) 32.1 (NA) 14.7 (NA) 2.2 (NA) 4.0 (NA) 100.0 (NA)Agent’s Licensing (n = 168) 79.8 (134) 50.7 (68) 32.8 (44) 11.9 (16) 1.5 (2) 3.0 (4) 100.0 (134)Consumer Protection (n = 242) 78.1 (189) 43.9 (83) 36.0 (68) 10.6 (20) 3.7 (7) 5.8 (11) 100.0 (189)Division of Workers’ Compensation (DWC)* (n = 482) 92.8 (NA) 40.5 (NA) 30.7 (NA) 19.6 (NA) 2.9 (NA) 6.3 (NA) 100.0 (NA)
DWC Carriers (n = 96) 92.7 (89) 44.9 (40) 38.2 (34) 15.7 (14) 1.1 (1) 0.0 (0) 100.0 (89) DWC Employers (n = 115) 87.8 (101) 40.6 (41) 41.6 (42) 16.8 (17) 1.0 (1) 0.0 (0) 100.0 (101) DWC Health Care Providers (n = 115) 95.7 (110) 44.5 (49) 41.8 (46) 10.0 (11) 1.8 (2) 1.8 (2) 100.0 (110) DWC Injured Employees (n = 156) 95.5 (149) 40.3 (60) 24.2 (36) 21.5 (32) 4.0 (6) 10.1 (15) 100.0 (149)Enforcement (n = 15)2 100.0 (15) 40.0 (6) 20.0 (3) 40.0 (6) 0.0 (0) 0.0 (0) 100.0 (15)Financial (n = 217) 95.9 (208) 48.6 (101) 38.0 (79) 11.1 (23) 1.4 (3) 1.0 (2) 100.0 (208)Fraud (n = 140) 95.0 (133) 53.4 (71) 33.1 (44) 12.0 (16) 0.8 (1) 0.8 (1) 100.0 (133)Life and Health (n = 239) 93.3 (223) 61.0 (136) 33.6 (75) 4.9 (11) 0.4 (1) 0.0 (0) 100.0 (223)Property and Casualty (n = 160) 93.1 (149) 56.4 (84) 30.9 (46) 11.4 (17) 1.3 (2) 0.0 (0) 100.0 (149)State Fire Marshal’s Office (n = 249) 92.4 (230) 57.4 (132) 36.5 (84) 6.1 (14) 0.0 (0) 0.0 (0) 100.0 (230)
*Weighted estimates

31
Table B-1b. The Staff Are Friendly
Responses
Program
GaveOpinion Percent (Count)
Strongly Agree
Percent (Count)
Agree Percent (Count)
Neutral Percent (Count)
Disagree Percent (Count)
Strongly Disagree Percent (Count)
TotalPercent (Count)
All Programs Combined* (n = 1,912) 87.5 (NA) 46.7 (NA) 29.6 (NA) 16.6 (NA) 3.4 (NA) 3.8 (NA) 100.0 (NA)Agent’s Licensing (n = 168) 79.8 (134) 50.7 (68) 29.1 (39) 15.7 (21) 1.5 (2) 3.0 (4) 100.0 (134)Consumer Protection (n = 242) 77.7 (188) 42.6 (80) 36.2 (68) 11.7 (22) 3.2 (6) 6.4 (12) 100.0 (188)Division of Workers’ Compensation (DWC)* (n = 482) 92.0 (NA) 40.8 (NA) 26.8 (NA) 21.2 (NA) 5.7 (NA) 5.5 (NA) 100.0 (NA)
DWC Carriers (n = 96) 92.7 (89) 38.2 (34) 39.3 (35) 21.3 (19) 1.1 (1) 0.0 (0) 100.0 (89) DWC Employers (n = 115) 87.0 (100) 39.0 (39) 40.0 (40) 17.0 (17) 4.0 (4) 0.0 (0) 100.0 (100) DWC Health Care Providers (n = 115) 94.8 (109) 40.4 (44) 36.7 (40) 17.4 (19) 4.6 (5) 0.9 (1) 100.0 (109) DWC Injured Employees (n = 156) 94.9 (148) 41.9 (62) 18.9 (28) 23.6 (35) 6.8 (10) 8.8 (13) 100.0 (148)Enforcement (n = 15)2 100.0 (15) 33.3 (5) 20.0 (3) 40.0 (6) 6.7 (1) 0.0 (0) 100.0 (15)Financial (n = 217) 94.9 (206) 47.1 (97) 36.9 (76) 11.2 (23) 3.9 (8) 1.0 (2) 100.0 (206)Fraud (n = 140) 95.0 (133) 50.4 (67) 33.8 (45) 12.8 (17) 2.3 (3) 0.8 (1) 100.0 (133)Life and Health (n = 239) 91.6 (219) 58.4 (128) 32.9 (72) 7.8 (17) 0.9 (2) 0.0 (0) 100.0 (219)Property and Casualty (n = 160) 93.8 (150) 54.7 (82) 32.0 (48) 11.3 (17) 1.3 (2) 0.7 (1) 100.0 (150)State Fire Marshal’s Office (n = 249) 91.6 (228) 57.9 (132) 34.6 (79) 7.0 (16) 0.4 (1) 0.0 (0) 100.0 (228)
*Weighted estimates

32
Table B-1c. The Staff Are Knowledgeable About Services Off ered by TDI
Responses
Program
GaveOpinion Percent (Count)
Strongly Agree
Percent (Count)
Agree Percent (Count)
Neutral Percent (Count)
Disagree Percent (Count)
Strongly Disagree Percent (Count)
TotalPercent (Count)
All Programs Combined* (n = 1,912) 85.9 (NA) 46.5 (NA) 32.0 (NA) 14.0 (NA) 3.6 (NA) 3.9 (NA) 100.0 (NA)Agent’s Licensing (n = 168) 78.6 (132) 52.3 (69) 34.1 (45) 12.1 (16) 0.8 (1) 0.8 (1) 100.0 (132)Consumer Protection (n = 242) 77.7 (188) 41.5 (78) 27.7 (52) 15.4 (29) 8.0 (15) 7.4 (14) 100.0 (188)Division of Workers’ Compensation (DWC)* (n = 482) 90.9 (NA) 40.4 (NA) 30.7 (NA) 17.5 (NA) 4.7 (NA) 6.8 (NA) 100.0 (NA)
DWC Carriers (n = 96) 90.6 (87) 39.1 (34) 43.7 (38) 12.6 (11) 4.6 (4) 0.0 (0) 100.0 (87) DWC Employers (n = 115) 86.1 (99) 40.4 (40) 39.4 (39) 17.2 (17) 2.0 (2) 1.0 (1) 100.0 (99) DWC Health Care Providers (n = 115) 95.7 (110) 38.2 (42) 37.3 (41) 18.2 (20) 5.5 (6) 0.9 (1) 100.0 (110) DWC Injured Employees (n = 156) 93.6 (146) 40.4 (59) 25.3 (37) 17.8 (26) 6.2 (9) 10.3 (15) 100.0 (146)Enforcement (n = 15)2 93.3 (14) 14.3 (2) 42.9 (6) 35.7 (5) 7.1 (1) 0.0 (0) 100.0 (14)Financial (n = 217) 93.1 (202) 43.6 (88) 37.1 (75) 13.9 (28) 4.0 (8) 1.5 (3) 100.0 (202)Fraud (n = 140) 93.6 (131) 51.1 (67) 29.8 (39) 14.5 (19) 2.3 (3) 2.3 (3) 100.0 (131)Life and Health (n = 239) 85.8 (205) 52.7 (108) 35.6 (73) 10.7 (22) 1.0 (2) 0.0 (0) 100.0 (205)Property and Casualty (n = 160) 89.4 (143) 53.1 (76) 33.6 (48) 7.7 (11) 4.2 (6) 1.4 (2) 100.0 (143)State Fire Marshal’s Office (n = 249) 89.2 (222) 59.9 (133) 32.4 (72) 6.8 (15) 0.9 (2) 0.0 (0) 100.0 (222)
*Weighted estimates

33
Table B-1d. The Staff Iden fy Themselves
Responses
Program
GaveOpinion Percent (Count)
Strongly Agree
Percent (Count)
Agree Percent (Count)
Neutral Percent (Count)
Disagree Percent (Count)
Strongly Disagree Percent (Count)
TotalPercent (Count)
All Programs Combined* (n = 1,912) 80.9 (NA) 54.6 (NA) 30.1 (NA) 9.8 (NA) 2.0 (NA) 3.5 (NA) 100.0 (NA)Agent’s Licensing (n = 168) 73.2 (123) 57.7 (71) 29.3 (36) 10.6 (13) 0.8 (1) 1.6 (2) 100.0 (123)Consumer Protection (n = 242) 70.2 (170) 48.8 (83) 32.9 (56) 9.4 (16) 1.8 (3) 7.1 (12) 100.0 (170)Division of Workers’ Compensation (DWC)* (n = 482) 87.0 (NA) 52.3 (NA) 28.9 (NA) 9.9 (NA) 3.6 (NA) 5.3 (NA) 100.0 (NA)
DWC Carriers (n = 96) 85.4 (82) 40.2 (33) 39.0 (32) 20.7 (17) 0.0 (0) 0.0 (0) 100.0 (82) DWC Employers (n = 115) 80.9 (93) 55.9 (52) 34.4 (32) 9.7 (9) 0.0 (0) 0.0 (0) 100.0 (93) DWC Health Care Providers (n = 115) 91.3 (105) 58.1 (61) 31.4 (33) 6.7 (7) 2.9 (3) 1.0 (1) 100.0 (105) DWC Injured Employees (n = 156) 90.4 (141) 50.4 (71) 25.5 (36) 9.9 (14) 5.7 (8) 8.5 (12) 100.0 (141)Enforcement (n = 15)2 100.0 (15) 53.3 (8) 26.7 (4) 20.0 (3) 0.0 (0) 0.0 (0) 100.0 (15)Financial (n = 217) 87.1 (189) 51.9 (98) 35.4 (67) 9.0 (17) 2.6 (5) 1.1 (2) 100.0 (189)Fraud (n = 140) 90.7 (127) 55.9 (71) 34.6 (44) 7.1 (9) 1.6 (2) 0.8 (1) 100.0 (127)Life and Health (n = 239) 84.1 (201) 61.2 (123) 28.9 (58) 9.0 (18) 1.0 (2) 0.0 (0) 100.0 (201)Property and Casualty (n = 160) 83.1 (133) 57.1 (76) 32.3 (43) 9.0 (12) 0.8 (1) 0.8 (1) 100.0 (133)State Fire Marshal’s Office (n = 249) 84.7 (211) 60.7 (128) 31.3 (66) 7.1 (15) 0.5 (1) 0.5 (1) 100.0 (211)
*Weighted estimates

34
Table B-2.1. The Agency’s Handling of Complaints About TDI - Composite
Responses
Program
GaveOpinion Percent
Strongly Agree
PercentAgree
PercentNeutral Percent
Disagree Percent
Strongly Disagree Percent
Total Percent
All Programs Combined* (n = 1,912) 61.5 37.7 31.2 17.2 5.4 8.4 100.0Agent’s Licensing (n = 168) 48.5 40.5 39.9 13.5 1.2 4.9 100.0Consumer Protection (n = 242) 86.2 39.8 31.9 12.5 5.0 10.8 100.0Division of Workers’ Compensation (DWC)* (n = 482) 70.5 35.4 24.6 19.2 8.5 12.4 100.0
DWC Carriers (n = 96) 33.3 40.6 21.9 29.7 4.7 3.1 100.0 DWC Employers (n = 115) 58.3 34.3 36.6 22.4 4.5 2.2 100.0 DWC Health Care Providers (n = 115) 64.8 24.2 33.6 22.1 16.1 4.0 100.0 DWC Injured Employees (n = 156) 78.2 36.1 17.6 17.2 10.7 18.4 100.0Enforcement (n = 15)2 90.0 14.8 33.3 33.3 11.1 7.4 100.0Financial (n = 217) 41.9 26.4 41.2 23.6 6.0 2.7 100.0Fraud (n = 140) 63.2 40.1 35.0 17.5 4.5 2.8 100.0Life and Health (n = 239) 17.8 44.7 25.9 24.7 3.5 1.2 100.0Property and Casualty (n = 160) 54.1 38.2 29.5 21.4 5.8 5.2 100.0State Fire Marshal’s Office (n = 249) 39.6 40.6 41.6 13.2 3.0 1.5 100.0
*Weighted estimates

35
Table B-2a. Complaints About TDI Are Easy to File
Responses
Program
GaveOpinion Percent (Count)
Strongly Agree
Percent (Count)
Agree Percent (Count)
Neutral Percent (Count)
Disagree Percent (Count)
Strongly Disagree Percent (Count)
TotalPercent (Count)
All Programs Combined* (n = 1,912) 61.8 (NA) 38.7 (NA) 30.2 (NA) 18.1 (NA) 4.9 (NA) 8.1 (NA) 100.0 (NA)Agent’s Licensing (n = 168) 47.6 (80) 40.0 (32) 38.8 (31) 15.0 (12) 1.3 (1) 5.0 (4) 100.0 (80)Consumer Protection (n = 242) 87.2 (211) 43.6 (92) 31.3 (66) 12.3 (26) 5.2 (11) 7.6 (16) 100.0 (211)Division of Workers’ Compensation (DWC)* (n = 482) 70.5 (NA) 37.0 (NA) 22.9 (NA) 20.2 (NA) 7.5 (NA) 12.5 (NA) 100.0 (NA)
DWC Carriers (n = 96) 37.5 (36) 38.9 (14) 19.4 (7) 30.6 (11) 8.3 (3) 2.8 (1) 100.0 (36) DWC Employers (n = 115) 59.1 (68) 38.2 (26) 29.4 (20) 23.5 (16) 5.9 (4) 2.9 (2) 100.0 (68) DWC Health Care Providers (n = 115) 65.2 (75) 28.0 (21) 33.3 (25) 21.3 (16) 12.0 (9) 5.3 (4) 100.0 (75) DWC Injured Employees (n = 156) 77.6 (121) 36.4 (44) 19.0 (23) 18.2 (22) 8.3 (10) 18.2 (22) 100.0 (121)Enforcement (n = 15)2 93.3 (14) 21.4 (3) 28.6 (4) 35.7 (5) 7.1 (1) 7.1 (1) 100.0 (14)Financial (n = 217) 43.3 (94) 27.7 (26) 42.6 (40) 21.3 (20) 7.4 (7) 1.1 (1) 100.0 (94)Fraud (n = 140) 65.7 (92) 41.3 (38) 39.1 (36) 13.0 (12) 4.3 (4) 2.2 (2) 100.0 (92)Life and Health (n = 239) 17.6 (42) 42.9 (18) 26.2 (11) 26.2 (11) 4.8 (2) 0.0 (0) 100.0 (42)Property and Casualty (n = 160) 56.9 (91) 38.5 (35) 29.7 (27) 22.0 (20) 4.4 (4) 5.5 (5) 100.0 (91)State Fire Marshal’s Office (n = 249) 40.6 (101) 39.6 (40) 41.6 (42) 13.9 (14) 4.0 (4) 1.0 (1) 100.0 (101)
*Weighted estimates

36
Table B-2b. The Agency’s Responses to Complaints About TDI Are Timely
Responses
Program
GaveOpinion Percent (Count)
Strongly Agree
Percent (Count)
Agree Percent (Count)
Neutral Percent (Count)
Disagree Percent (Count)
Strongly Disagree Percent (Count)
TotalPercent (Count)
All Programs Combined* (n = 1,912) 61.2 (NA) 36.8 (NA) 32.3 (NA) 16.3 (NA) 6.0 (NA) 8.6 (NA) 100.0 (NA)Agent’s Licensing (n = 168) 49.4 (83) 41.0 (34) 41.0 (34) 12.0 (10) 1.2 (1) 4.8 (4) 100.0 (83)Consumer Protection (n = 242) 85.1 (206) 35.9 (74) 32.5 (67) 12.6 (26) 4.9 (10) 14.1 (29) 100.0 (206)Division of Workers’ Compensation (DWC)* (n = 482) 70.5 (NA) 33.7 (NA) 26.3 (NA) 18.2 (NA) 9.4 (NA) 12.3 (NA) 100.0 (NA)
DWC Carriers (n = 96) 29.2 (28) 42.9 (12) 25.0 (7) 28.6 (8) 0.0 (0) 3.6 (1) 100.0 (28) DWC Employers (n = 115) 57.4 (66) 30.3 (20) 43.9 (29) 21.2 (14) 3.0 (2) 1.5 (1) 100.0 (66) DWC Health Care Providers (n = 115) 64.3 (74) 20.3 (15) 33.8 (25) 23.0 (17) 20.3 (15) 2.7 (2) 100.0 (74) DWC Injured Employees (n = 156) 78.8 (123) 35.8 (44) 16.3 (20) 16.3 (20) 13.0 (16) 18.7 (23) 100.0 (123)Enforcement (n = 15)2 86.7 (13) 7.7 (1) 38.5 (5) 30.8 (4) 15.4 (2) 7.7 (1) 100.0 (13)Financial (n = 217) 40.6 (88) 25.0 (22) 39.8 (35) 26.1 (23) 4.5 (4) 4.5 (4) 100.0 (88)Fraud (n = 140) 60.7 (85) 38.8 (33) 30.6 (26) 22.4 (19) 4.7 (4) 3.5 (3) 100.0 (85)Life and Health (n = 239) 18.0 (43) 46.5 (20) 25.6 (11) 23.3 (10) 2.3 (1) 2.3 (1) 100.0 (43)Property and Casualty (n = 160) 51.3 (82) 37.8 (31) 29.3 (24) 20.7 (17) 7.3 (6) 4.9 (4) 100.0 (82)State Fire Marshal’s Office (n = 249) 38.6 (96) 41.7 (40) 41.7 (40) 12.5 (12) 2.1 (2) 2.1 (2) 100.0 (96)
*Weighted estimates

37
Table B-2.2. TDI’s Handling of Complaints About Regulated En es - Composite
Responses
Program
GaveOpinion Percent
Strongly Agree
PercentAgree
PercentNeutral Percent
Disagree Percent
Strongly Disagree Percent
Total Percent
All Programs Combined* (n = 1,912) 61.2 36.3 29.5 16.6 6.8 10.9 100.0Agent’s Licensing (n = 168) 46.4 42.7 36.3 13.7 1.3 6.0 100.0Consumer Protection (n = 242) 84.0 33.1 23.3 12.8 10.2 20.7 100.0Division of Workers’ Compensation (DWC)* (n = 482) 72.6 31.7 26.2 18.5 9.1 14.6 100.0
DWC Carriers (n = 96) 39.6 25.4 39.5 26.3 5.3 3.5 100.0 DWC Employers (n = 115) 57.1 34.0 34.5 22.8 5.6 3.0 100.0 DWC Health Care Providers (n = 115) 64.1 16.7 30.8 18.6 23.5 10.4 100.0 DWC Injured Employees (n = 156) 82.1 30.7 21.1 15.9 10.9 21.4 100.0Enforcement (n = 15)2 91.1 19.5 19.5 39.0 9.8 12.2 100.0Financial (n = 217) 44.7 25.4 41.9 20.6 5.8 6.2 100.0Fraud (n = 140) 65.5 28.7 35.3 21.5 7.6 6.9 100.0Life and Health (n = 239) 20.1 38.9 29.2 25.0 6.9 0.0 100.0Property and Casualty (n = 160) 51.9 39.4 26.9 16.9 9.6 7.2 100.0State Fire Marshal’s Office (n = 249) 37.8 40.1 36.2 18.1 4.3 1.4 100.0
*Weighted estimates

38
Table B-2c. TDI Handles Complaints About Regulated En es Eff ec vely
Responses
Program
GaveOpinion Percent (Count)
Strongly Agree
Percent (Count)
Agree Percent (Count)
Neutral Percent (Count)
Disagree Percent (Count)
Strongly Disagree Percent (Count)
TotalPercent (Count)
All Programs Combined* (n = 1,912) 60.9 (NA) 35.4 (NA) 29.9 (NA) 17.6 (NA) 5.8 (NA) 11.3 (NA) 100.0 (NA)Agent’s Licensing (n = 168) 46.4 (78) 43.6 (34) 37.2 (29) 12.8 (10) 0.0 (0) 6.4 (5) 100.0 (78)Consumer Protection (n = 242) 84.7 (205) 30.7 (63) 21.0 (43) 11.2 (23) 11.7 (24) 25.4 (52) 100.0 (205)Division of Workers’ Compensation (DWC)* (n = 482) 72.1 (NA) 29.9 (NA) 26.3 (NA) 21.7 (NA) 8.1 (NA) 13.9 (NA) 100.0 (NA)
DWC Carriers (n = 96) 44.8 (43) 23.3 (10) 37.2 (16) 34.9 (15) 2.3 (1) 2.3 (1) 100.0 (43) DWC Employers (n = 115) 55.7 (64) 29.7 (19) 40.6 (26) 25.0 (16) 1.6 (1) 3.1 (2) 100.0 (64) DWC Health Care Providers (n = 115) 67.0 (77) 15.6 (12) 31.2 (24) 20.8 (16) 22.1 (17) 10.4 (8) 100.0 (77) DWC Injured Employees (n = 156) 82.1 (128) 30.5 (39) 18.0 (23) 19.5 (25) 11.7 (15) 20.3 (26) 100.0 (128)Enforcement (n = 15)2 93.3 (14) 14.3 (2) 21.4 (3) 35.7 (5) 7.1 (1) 21.4 (3) 100.0 (14)Financial (n = 217) 44.2 (96) 24.0 (23) 43.8 (42) 20.8 (20) 6.3 (6) 5.2 (5) 100.0 (96)Fraud (n = 140) 66.4 (93) 29.0 (27) 35.5 (33) 21.5 (20) 4.3 (4) 9.7 (9) 100.0 (93)Life and Health (n = 239) 20.1 (48) 33.3 (16) 35.4 (17) 25.0 (12) 6.3 (3) 0.0 (0) 100.0 (48)Property and Casualty (n = 160) 50.0 (80) 38.8 (31) 28.8 (23) 17.5 (14) 7.5 (6) 7.5 (6) 100.0 (80)State Fire Marshal’s Office (n = 249) 37.8 (94) 40.4 (38) 34.0 (32) 20.2 (19) 3.2 (3) 2.1 (2) 100.0 (94)
*Weighted estimates

39
Table B-2d. TDI Provides Updates on the Progress of Insurance-Related Complaints
Responses
Program
GaveOpinion Percent (Count)
Strongly Agree
Percent (Count)
Agree Percent (Count)
Neutral Percent (Count)
Disagree Percent (Count)
Strongly Disagree Percent (Count)
TotalPercent (Count)
All Programs Combined* (n = 1,912) 61.3 (NA) 36.1 (NA) 28.8 (NA) 16.0 (NA) 7.7 (NA) 11.4 (NA) 100.0 (NA)Agent’s Licensing (n = 168) 45.8 (77) 42.9 (33) 35.1 (27) 14.3 (11) 2.6 (2) 5.2 (4) 100.0 (77)Consumer Protection (n = 242) 83.5 (202) 31.7 (64) 21.8 (44) 12.9 (26) 11.9 (24) 21.8 (44) 100.0 (202)Division of Workers’ Compensation (DWC)* (n = 482) 73.0 (NA) 32.1 (NA) 25.6 (NA) 16.7 (NA) 9.9 (NA) 15.7 (NA) 100.0 (NA)
DWC Carriers (n = 96) 36.5 (35) 20.0 (7) 48.6 (17) 20.0 (7) 5.7 (2) 5.7 (2) 100.0 (35) DWC Employers (n = 115) 57.4 (66) 36.4 (24) 30.3 (20) 22.7 (15) 7.6 (5) 3.0 (2) 100.0 (66) DWC Health Care Providers (n = 115) 63.5 (73) 15.1 (11) 26.0 (19) 19.2 (14) 31.5 (23) 8.2 (6) 100.0 (73) DWC Injured Employees (n = 156) 82.7 (129) 30.2 (39) 22.5 (29) 13.2 (17) 10.9 (14) 23.3 (30) 100.0 (129)Enforcement (n = 15)2 86.7 (13) 7.7 (1) 23.1 (3) 53.8 (7) 7.7 (1) 7.7 (1) 100.0 (13)Financial (n = 217) 43.8 (95) 26.3 (25) 40.0 (38) 20.0 (19) 6.3 (6) 7.4 (7) 100.0 (95)Fraud (n = 140) 65.0 (91) 29.7 (27) 34.1 (31) 23.1 (21) 7.7 (7) 5.5 (5) 100.0 (91)Life and Health (n = 239) 20.1 (48) 39.6 (19) 25.0 (12) 29.2 (14) 6.3 (3) 0.0 (0) 100.0 (48)Property and Casualty (n = 160) 52.5 (84) 38.1 (32) 27.4 (23) 16.7 (14) 9.5 (8) 8.3 (7) 100.0 (84)State Fire Marshal’s Office (n = 249) 37.8 (94) 40.4 (38) 36.2 (34) 17.0 (16) 5.3 (5) 1.1 (1) 100.0 (94)
*Weighted estimates
40
Table B-2e. TDI Provides No fi ca on of the Outcome of Insurance-Related Complaints
Responses
Program
GaveOpinion Percent (Count)
StronglyAgree
Percent (Count)
Agree Percent (Count)
Neutral Percent (Count)
Disagree Percent (Count)
Strongly Disagree Percent (Count)
TotalPercent (Count)
All Programs Combined* (n = 1,912) 61.6 (NA) 37.2 (NA) 29.9 (NA) 16.0 (NA) 6.9 (NA) 10.0 (NA) 100.0 (NA)Agent’s Licensing (n = 168) 47.0 (79) 41.8 (33) 36.7 (29) 13.9 (11) 1.3 (1) 6.3 (5) 100.0 (79)Consumer Protection (n = 242) 83.9 (203) 36.9 (75) 27.1 (55) 14.3 (29) 6.9 (14) 14.8 (30) 100.0 (203)Division of Workers’ Compensation (DWC)* (n = 482) 72.5 (NA) 32.9 (NA) 26.6 (NA) 17.1 (NA) 9.3 (NA) 14.0 (NA) 100.0 (NA)
DWC Carriers (n = 96) 37.5 (36) 33.3 (12) 33.3 (12) 22.2 (8) 8.3 (3) 2.8 (1) 100.0 (36) DWC Employers (n = 115) 58.3 (67) 35.8 (24) 32.8 (22) 20.9 (14) 7.5 (5) 3.0 (2) 100.0 (67) DWC Health Care Providers (n = 115) 61.7 (71) 19.7 (14) 35.2 (25) 15.5 (11) 16.9 (12) 12.7 (9) 100.0 (71) DWC Injured Employees (n = 156) 81.4 (127) 31.5 (40) 22.8 (29) 15.0 (19) 10.2 (13) 20.5 (26) 100.0 (127)Enforcement (n = 15)2 93.3 (14) 35.7 (5) 14.3 (2) 28.6 (4) 14.3 (2) 7.1 (1) 100.0 (14)Financial (n = 217) 46.1 (100) 26.0 (26) 42.0 (42) 21.0 (21) 5.0 (5) 6.0 (6) 100.0 (100)Fraud (n = 140) 65.0 (91) 27.5 (25) 36.3 (33) 19.8 (18) 11.0 (10) 5.5 (5) 100.0 (91)Life and Health (n = 239) 20.1 (48) 43.8 (21) 27.1 (13) 20.8 (10) 8.3 (4) 0.0 (0) 100.0 (48)Property and Casualty (n = 160) 53.1 (85) 41.2 (35) 24.7 (21) 16.5 (14) 11.8 (10) 5.9 (5) 100.0 (85)State Fire Marshal’s Office (n = 249) 37.8 (94) 39.4 (37) 38.3 (36) 17.0 (16) 4.3 (4) 1.1 (1) 100.0 (94)
*Weighted estimates

41
Tables B-3 and 4. Telephone Communica on - Composite
Responses
Program
GaveOpinion Percent
VerySa sfi ed Percent
Sa sfi ed Percent
Neutral Percent
Dissa sfi ed Percent
Very Dissa sfi ed
PercentTotal
PercentAll Programs Combined* (n = 1,912) 76.8 42.1 29.6 16.7 5.2 6.4 100.0Agent’s Licensing (n = 168) 72.1 44.3 32.8 15.0 4.3 3.6 100.0Consumer Protection (n = 242) 60.0 38.5 29.1 15.9 6.2 10.3 100.0Division of Workers’ Compensation (DWC)* (n = 482) 84.1 36.5 26.8 20.4 6.4 9.9 100.0
DWC Carriers (n = 96) 78.7 37.2 32.5 24.9 4.7 0.7 100.0 DWC Employers (n = 115) 77.3 34.1 38.9 22.3 2.4 2.4 100.0 DWC Health Care Providers (n = 115) 89.5 32.1 37.3 23.0 4.4 3.2 100.0 DWC Injured Employees (n = 156) 87.9 37.9 19.6 19.3 8.8 14.4 100.0Enforcement (n = 15)2 96.3 19.2 40.8 23.8 11.5 4.6 100.0Financial (n = 217) 77.1 42.3 37.9 14.6 3.3 1.8 100.0Fraud (n = 140) 69.1 38.5 41.7 13.7 3.8 2.4 100.0Life and Health (n = 239) 66.0 53.2 35.9 9.9 0.8 0.3 100.0Property and Casualty (n = 160) 77.8 53.5 29.0 12.1 3.7 1.6 100.0State Fire Marshal’s Office (n = 249) 71.0 53.9 32.9 10.6 2.1 0.5 100.0
*Weighted estimates

42
Table B-3a. Toll-Free Telephone Access
Responses
Program
GaveOpinion Percent (Count)
VerySa sfi ed Percent (Count)
Sa sfi ed Percent (Count)
Neutral Percent (Count)
Dissa sfi ed Percent (Count)
Very Dissa sfi ed
Percent (Count)
TotalPercent (Count)
All Programs Combined* (n = 1,912) 74.0 (NA) 46.7 (NA) 28.8 (NA) 17.1 (NA) 3.7 (NA) 3.7 (NA) 100.0 (NA)Agent’s Licensing (n = 168) 72.0 (121) 40.5 (49) 33.9 (41) 19.8 (24) 4.1 (5) 1.7 (2) 100.0 (121)Consumer Protection (n = 242) 57.4 (139) 43.9 (61) 29.5 (41) 15.8 (22) 4.3 (6) 6.5 (9) 100.0 (139)Division of Workers’ Compensation (DWC)* (n = 482) 80.2 (NA) 46.6 (NA) 24.6 (NA) 18.9 (NA) 3.7 (NA) 6.2 (NA) 100.0 (NA)
DWC Carriers (n = 96) 71.9 (69) 50.7 (35) 29.0 (20) 17.4 (12) 1.4 (1) 1.4 (1) 100.0 (69) DWC Employers (n = 115) 74.8 (86) 41.9 (36) 33.7 (29) 19.8 (17) 2.3 (2) 2.3 (2) 100.0 (86) DWC Health Care Providers (n = 115) 87.8 (101) 44.6 (45) 34.7 (35) 16.8 (17) 1.0 (1) 3.0 (3) 100.0 (101) DWC Injured Employees (n = 156) 83.3 (130) 49.2 (64) 19.2 (25) 18.5 (24) 4.6 (6) 8.5 (11) 100.0 (130)Enforcement (n = 15)2 86.7 (13) 23.1 (3) 46.2 (6) 23.1 (3) 0.0 (0) 7.7 (1) 100.0 (13)Financial (n = 217) 67.7 (147) 51.7 (76) 32.0 (47) 13.6 (20) 2.0 (3) 0.7 (1) 100.0 (147)Fraud (n = 140) 63.6 (89) 43.8 (39) 40.4 (36) 12.4 (11) 1.1 (1) 2.2 (2) 100.0 (89)Life and Health (n = 239) 51.0 (122) 58.2 (71) 30.3 (37) 11.5 (14) 0.0 (0) 0.0 (0) 100.0 (122)Property and Casualty (n = 160) 75.0 (120) 58.3 (70) 28.3 (34) 10.0 (12) 3.3 (4) 0.0 (0) 100.0 (120)State Fire Marshal’s Office (n = 249) 67.1 (167) 57.5 (96) 31.1 (52) 9.6 (16) 1.8 (3) 0.0 (0) 100.0 (167)
*Weighted estimates

43
Table B-3b. Access to a Representa ve When Calling the Agency
Responses
Program
GaveOpinion Percent (Count)
VerySa sfi ed Percent (Count)
Sa sfi ed Percent (Count)
Neutral Percent (Count)
Dissa sfi ed Percent (Count)
Very Dissa sfi ed
Percent (Count)
TotalPercent (Count)
All Programs Combined* (n = 1,912) 75.6 (NA) 41.6 (NA) 29.0 (NA) 18.1 (NA) 5.1 (NA) 6.1 (NA) 100.0 (NA)Agent’s Licensing (n = 168) 72.6 (122) 41.8 (51) 32.0 (39) 16.4 (20) 5.7 (7) 4.1 (5) 100.0 (122)Consumer Protection (n = 242) 59.9 (145) 38.6 (56) 31.7 (46) 15.2 (22) 7.6 (11) 6.9 (10) 100.0 (145)Division of Workers’ Compensation (DWC)* (n = 482) 83.0 (NA) 37.4 (NA) 25.2 (NA) 22.3 (NA) 5.0 (NA) 10.0 (NA) 100.0 (NA)
DWC Carriers (n = 96) 65.6 (63) 34.9 (22) 28.6 (18) 31.7 (20) 3.2 (2) 1.6 (1) 100.0 (63) DWC Employers (n = 115) 74.8 (86) 30.2 (26) 38.4 (33) 26.7 (23) 2.3 (2) 2.3 (2) 100.0 (86) DWC Health Care Providers (n = 115) 88.7 (102) 34.3 (35) 38.2 (39) 19.6 (20) 4.9 (5) 2.9 (3) 100.0 (102) DWC Injured Employees (n = 156) 87.8 (137) 41.6 (57) 17.5 (24) 19.7 (27) 6.6 (9) 14.6 (20) 100.0 (137)Enforcement (n = 15)2 86.7 (13) 7.7 (1) 46.2 (6) 30.8 (4) 7.7 (1) 7.7 (1) 100.0 (13)Financial (n = 217) 62.2 (135) 38.5 (52) 40.0 (54) 17.0 (23) 2.2 (3) 2.2 (3) 100.0 (135)Fraud (n = 140) 60.0 (84) 34.5 (29) 44.0 (37) 13.1 (11) 7.1 (6) 1.2 (1) 100.0 (84)Life and Health (n = 239) 44.4 (106) 54.7 (58) 31.1 (33) 14.2 (15) 0.0 (0) 0.0 (0) 100.0 (106)Property and Casualty (n = 160) 76.3 (122) 53.3 (65) 28.7 (35) 13.9 (17) 3.3 (4) 0.8 (1) 100.0 (122)State Fire Marshal’s Office (n = 249) 67.5 (168) 53.0 (89) 33.9 (57) 9.5 (16) 2.4 (4) 1.2 (2) 100.0 (168)
*Weighted estimates

44
Table B-3c. Time Placed on Hold When Calling the Agency
Responses
Program
GaveOpinion Percent (Count)
VerySa sfi ed Percent (Count)
Sa sfi ed Percent (Count)
Neutral Percent (Count)
Dissa sfi ed Percent (Count)
Very Dissa sfi ed
Percent (Count)
TotalPercent (Count)
All Programs Combined* (n = 1,912) 76.0 (NA) 32.4 (NA) 30.5 (NA) 21.6 (NA) 6.9 (NA) 8.6 (NA) 100.0 (NA)Agent’s Licensing (n = 168) 74.4 (125) 34.4 (43) 31.2 (39) 19.2 (24) 9.6 (12) 5.6 (7) 100.0 (125)Consumer Protection (n = 242) 60.3 (146) 31.5 (46) 28.8 (42) 20.5 (30) 8.9 (13) 10.3 (15) 100.0 (146)Division of Workers’ Compensation (DWC)* (n = 482) 82.9 (NA) 25.8 (NA) 29.0 (NA) 25.6 (NA) 6.0 (NA) 13.7 (NA) 100.0 (NA)
DWC Carriers (n = 96) 71.9 (69) 26.1 (18) 36.2 (25) 27.5 (19) 8.7 (6) 1.4 (1) 100.0 (69) DWC Employers (n = 115) 76.5 (88) 21.6 (19) 43.2 (38) 28.4 (25) 2.3 (2) 4.5 (4) 100.0 (88) DWC Health Care Providers (n = 115) 88.7 (102) 23.5 (24) 32.4 (33) 36.3 (37) 3.9 (4) 3.9 (4) 100.0 (102) DWC Injured Employees (n = 156) 86.5 (135) 28.1 (38) 20.7 (28) 23.7 (32) 8.1 (11) 19.3 (26) 100.0 (135)Enforcement (n = 15)2 100.0 (15) 33.3 (5) 20.0 (3) 33.3 (5) 13.3 (2) 0.0 (0) 100.0 (15)Financial (n = 217) 65.9 (143) 35.0 (50) 41.3 (59) 20.3 (29) 1.4 (2) 2.1 (3) 100.0 (143)Fraud (n = 140) 61.4 (86) 31.4 (27) 38.4 (33) 20.9 (18) 7.0 (6) 2.3 (2) 100.0 (86)Life and Health (n = 239) 49.4 (118) 43.2 (51) 34.7 (41) 22.0 (26) 0.0 (0) 0.0 (0) 100.0 (118)Property and Casualty (n = 160) 75.0 (120) 45.8 (55) 31.7 (38) 16.7 (20) 3.3 (4) 2.5 (3) 100.0 (120)State Fire Marshal’s Office (n = 249) 66.3 (165) 39.4 (65) 37.0 (61) 15.8 (26) 7.3 (12) 0.6 (1) 100.0 (165)
*Weighted estimates

45
Table B-3d. Number of Call Transfers When Calling the Agency
Responses
Program
GaveOpinion Percent (Count)
VerySa sfi ed Percent (Count)
Sa sfi ed Percent (Count)
Neutral Percent (Count)
Dissa sfi ed Percent (Count)
Very Dissa sfi ed
Percent (Count)
TotalPercent (Count)
All Programs Combined* (n = 1,912) 73.1 (NA) 35.5 (NA) 30.1 (NA) 21.7 (NA) 6.4 (NA) 6.3 (NA) 100.0 (NA)Agent’s Licensing (n = 168) 72.0 (121) 40.5 (49) 31.4 (38) 20.7 (25) 5.0 (6) 2.5 (3) 100.0 (121)Consumer Protection (n = 242) 57.4 (139) 36.7 (51) 25.9 (36) 23.7 (33) 5.8 (8) 7.9 (11) 100.0 (139)Division of Workers’ Compensation (DWC)* (n = 482) 79.6 (NA) 28.2 (NA) 27.0 (NA) 24.7 (NA) 9.1 (NA) 11.0 (NA) 100.0 (NA)
DWC Carriers (n = 96) 66.7 (64) 25.0 (16) 40.6 (26) 28.1 (18) 6.3 (4) 0.0 (0) 100.0 (64) DWC Employers (n = 115) 73.0 (84) 22.6 (19) 44.0 (37) 28.6 (24) 2.4 (2) 2.4 (2) 100.0 (84) DWC Health Care Providers (n = 115) 87.8 (101) 24.8 (25) 35.6 (36) 33.7 (34) 3.0 (3) 3.0 (3) 100.0 (101) DWC Injured Employees (n = 156) 83.3 (130) 31.5 (41) 16.9 (22) 22.3 (29) 13.1 (17) 16.2 (21) 100.0 (130)Enforcement (n = 15)2 93.3 (14) 14.3 (2) 35.7 (5) 35.7 (5) 14.3 (2) 0.0 (0) 100.0 (14)Financial (n = 217) 62.2 (135) 37.8 (51) 38.5 (52) 17.8 (24) 5.2 (7) 0.7 (1) 100.0 (135)Fraud (n = 140) 62.1 (87) 29.9 (26) 42.5 (37) 20.7 (18) 4.6 (4) 2.3 (2) 100.0 (87)Life and Health (n = 239) 48.5 (116) 49.1 (57) 31.9 (37) 17.2 (20) 1.7 (2) 0.0 (0) 100.0 (116)Property and Casualty (n = 160) 70.6 (113) 43.4 (49) 35.4 (40) 15.9 (18) 3.5 (4) 1.8 (2) 100.0 (113)State Fire Marshal’s Office (n = 249) 67.1 (167) 43.1 (72) 40.1 (67) 14.4 (24) 1.8 (3) 0.6 (1) 100.0 (167)
*Weighted estimates

46
Table B-3e. Timeliness of the Agency Returning Calls
Responses
Program
GaveOpinion Percent (Count)
VerySa sfi ed Percent (Count)
Sa sfi ed Percent (Count)
Neutral Percent (Count)
Dissa sfi ed Percent (Count)
Very Dissa sfi ed
Percent (Count)
TotalPercent (Count)
All Programs Combined* (n = 1,912) 68.9 (NA) 34.2 (NA) 29.5 (NA) 21.3 (NA) 5.9 (NA) 9.1 (NA) 100.0 (NA)Agent’s Licensing (n = 168) 60.7 (102) 38.2 (39) 31.4 (32) 22.5 (23) 3.9 (4) 3.9 (4) 100.0 (102)Consumer Protection (n = 242) 54.1 (131) 32.8 (43) 26.7 (35) 19.1 (25) 6.9 (9) 14.5 (19) 100.0 (131)Division of Workers’ Compensation (DWC)* (n = 482) 79.7 (NA) 25.5 (NA) 28.0 (NA) 24.9 (NA) 6.8 (NA) 14.8 (NA) 100.0 (NA)
DWC Carriers (n = 96) 78.1 (75) 26.7 (20) 30.7 (23) 32.0 (24) 10.7 (8) 0.0 (0) 100.0 (75) DWC Employers (n = 115) 73.0 (84) 20.2 (17) 39.3 (33) 34.5 (29) 2.4 (2) 3.6 (3) 100.0 (84) DWC Health Care Providers (n = 115) 87.8 (101) 24.8 (25) 28.7 (29) 28.7 (29) 7.9 (8) 9.9 (10) 100.0 (101) DWC Injured Employees (n = 156) 83.3 (130) 28.5 (37) 21.5 (28) 19.2 (25) 9.2 (12) 21.5 (28) 100.0 (130)Enforcement (n = 15)2 100.0 (15) 26.7 (4) 26.7 (4) 33.3 (5) 6.7 (1) 6.7 (1) 100.0 (15)Financial (n = 217) 74.2 (161) 40.4 (65) 39.1 (63) 13.0 (21) 3.7 (6) 3.7 (6) 100.0 (161)Fraud (n = 140) 67.9 (95) 35.8 (34) 35.8 (34) 17.9 (17) 5.3 (5) 5.3 (5) 100.0 (95)Life and Health (n = 239) 61.9 (148) 47.3 (70) 38.5 (57) 14.2 (21) 0.0 (0) 0.0 (0) 100.0 (148)Property and Casualty (n = 160) 64.4 (103) 47.6 (49) 29.1 (30) 12.6 (13) 7.8 (8) 2.9 (3) 100.0 (103)State Fire Marshal’s Office (n = 249) 63.9 (159) 46.5 (74) 34.6 (55) 13.8 (22) 3.8 (6) 1.3 (2) 100.0 (159)
*Weighted estimates

47
Table B-4a. Informa on Received From the Telephone Helpline Staff Is Accurate
Responses
Program
GaveOpinion Percent (Count)
Strongly Agree
Percent (Count)
Agree Percent (Count)
Neutral Percent (Count)
Disagree Percent (Count)
Strongly Disagree Percent (Count)
TotalPercent (Count)
All Programs Combined* (n = 1,912) 80.6 (NA) 46.4 (NA) 31.3 (NA) 12.2 (NA) 4.7 (NA) 5.3 (NA) 100.0 (NA)Agent’s Licensing (n = 168) 74.4 (125) 48.8 (61) 38.4 (48) 7.2 (9) 2.4 (3) 3.2 (4) 100.0 (125)Consumer Protection (n = 242) 62.0 (150) 41.3 (62) 29.3 (44) 11.3 (17) 6.7 (10) 11.3 (17) 100.0 (150)Division of Workers’ Compensation (DWC)* (n = 482) 87.4 (NA) 41.5 (NA) 27.3 (NA) 17.2 (NA) 6.6 (NA) 7.4 (NA) 100.0 (NA)
DWC Carriers (n = 96) 88.5 (85) 42.4 (36) 29.4 (25) 23.5 (20) 3.5 (3) 1.2 (1) 100.0 (85) DWC Employers (n = 115) 80.9 (93) 44.1 (41) 36.6 (34) 16.1 (15) 2.2 (2) 1.1 (1) 100.0 (93) DWC Health Care Providers (n = 115) 91.3 (105) 34.3 (36) 41.0 (43) 19.0 (20) 3.8 (4) 1.9 (2) 100.0 (105) DWC Injured Employees (n = 156) 91.0 (142) 40.1 (57) 21.8 (31) 17.6 (25) 9.2 (13) 11.3 (16) 100.0 (142)Enforcement (n = 15)2 100.0 (15) 20.0 (3) 46.7 (7) 6.7 (1) 13.3 (2) 13.3 (2) 100.0 (15)Financial (n = 217) 90.8 (197) 43.1 (85) 38.6 (76) 13.7 (27) 3.0 (6) 1.5 (3) 100.0 (197)Fraud (n = 140) 76.4 (107) 39.3 (42) 43.9 (47) 13.1 (14) 0.9 (1) 2.8 (3) 100.0 (107)Life and Health (n = 239) 84.9 (203) 52.7 (107) 39.9 (81) 5.4 (11) 1.5 (3) 0.5 (1) 100.0 (203)Property and Casualty (n = 160) 85.0 (136) 56.6 (77) 27.9 (38) 10.3 (14) 3.7 (5) 1.5 (2) 100.0 (136)State Fire Marshal’s Office (n = 249) 77.1 (192) 59.9 (115) 31.8 (61) 7.3 (14) 1.0 (2) 0.0 (0) 100.0 (192)
*Weighted estimates
48
Table B-4b. Informa on Received From the Telephone Helpline Staff Is Understandable
Responses
Program
GaveOpinion Percent (Count)
Strongly Agree
Percent (Count)
Agree Percent (Count)
Neutral Percent (Count)
Disagree Percent (Count)
Strongly Disagree Percent (Count)
TotalPercent (Count)
All Programs Combined* (n = 1,912) 80.6 (NA) 45.9 (NA) 30.5 (NA) 13.1 (NA) 4.3 (NA) 6.1 (NA) 100.0 (NA)Agent’s Licensing (n = 168) 74.4 (125) 50.4 (63) 33.6 (42) 10.4 (13) 2.4 (3) 3.2 (4) 100.0 (125)Consumer Protection (n = 242) 62.0 (150) 39.3 (59) 31.3 (47) 13.3 (20) 4.7 (7) 11.3 (17) 100.0 (150)Division of Workers’ Compensation (DWC)* (n = 482) 87.4 (NA) 40.3 (NA) 27.8 (NA) 16.7 (NA) 6.1 (NA) 9.1 (NA) 100.0 (NA)
DWC Carriers (n = 96) 88.5 (85) 38.8 (33) 36.5 (31) 20.0 (17) 3.5 (3) 1.2 (1) 100.0 (85) DWC Employers (n = 115) 80.9 (93) 40.9 (38) 38.7 (36) 16.1 (15) 2.2 (2) 2.2 (2) 100.0 (93) DWC Health Care Providers (n = 115) 91.3 (105) 32.4 (34) 43.8 (46) 18.1 (19) 4.8 (5) 1.0 (1) 100.0 (105) DWC Injured Employees (n = 156) 91.0 (142) 40.1 (57) 21.1 (30) 16.9 (24) 8.5 (12) 13.4 (19) 100.0 (142)Enforcement (n = 15)2 100.0 (15) 13.3 (2) 60.0 (9) 6.7 (1) 20.0 (3) 0.0 (0) 100.0 (15)Financial (n = 217) 90.8 (197) 41.6 (82) 39.1 (77) 13.7 (27) 3.6 (7) 2.0 (4) 100.0 (197)Fraud (n = 140) 76.4 (107) 38.3 (41) 46.7 (50) 12.1 (13) 1.9 (2) 0.9 (1) 100.0 (107)Life and Health (n = 239) 84.5 (202) 52.0 (105) 39.1 (79) 6.9 (14) 1.5 (3) 0.5 (1) 100.0 (202)Property and Casualty (n = 160) 85.0 (136) 55.9 (76) 28.7 (39) 9.6 (13) 3.7 (5) 2.2 (3) 100.0 (136)State Fire Marshal’s Office (n = 249) 76.7 (191) 57.6 (110) 31.4 (60) 10.5 (20) 0.5 (1) 0.0 (0) 100.0 (191)
*Weighted estimates

49
Table B-4c. Informa on Received From the Telephone Helpline Staff Is Helpful
Responses
Program
GaveOpinion Percent (Count)
Strongly Agree
Percent (Count)
Agree Percent (Count)
Neutral Percent (Count)
Disagree Percent (Count)
Strongly Disagree Percent (Count)
TotalPercent (Count)
All Programs Combined* (n = 1,912) 80.8 (NA) 45.4 (NA) 29.3 (NA) 13.0 (NA) 6.1 (NA) 6.3 (NA) 100.0 (NA)Agent’s Licensing (n = 168) 74.4 (125) 50.4 (63) 36.0 (45) 7.2 (9) 3.2 (4) 3.2 (4) 100.0 (125)Consumer Protection (n = 242) 62.8 (152) 38.2 (58) 25.7 (39) 13.8 (21) 7.9 (12) 14.5 (22) 100.0 (152)Division of Workers’ Compensation (DWC)* (n = 482) 87.8 (NA) 38.9 (NA) 24.6 (NA) 19.2 (NA) 8.6 (NA) 8.7 (NA) 100.0 (NA)
DWC Carriers (n = 96) 88.5 (85) 42.4 (36) 32.9 (28) 21.2 (18) 3.5 (3) 0.0 (0) 100.0 (85) DWC Employers (n = 115) 80.9 (93) 38.7 (36) 37.6 (35) 18.3 (17) 4.3 (4) 1.1 (1) 100.0 (93) DWC Health Care Providers (n = 115) 91.3 (105) 30.5 (32) 40.0 (42) 21.0 (22) 6.7 (7) 1.9 (2) 100.0 (105) DWC Injured Employees (n = 156) 91.7 (143) 39.2 (56) 16.8 (24) 19.6 (28) 11.2 (16) 13.3 (19) 100.0 (143)Enforcement (n = 15)2 100.0 (15) 6.7 (1) 53.3 (8) 13.3 (2) 20.0 (3) 6.7 (1) 100.0 (15)Financial (n = 217) 89.9 (195) 42.1 (82) 38.5 (75) 14.4 (28) 3.1 (6) 2.1 (4) 100.0 (195)Fraud (n = 140) 76.4 (107) 40.2 (43) 44.9 (48) 8.4 (9) 4.7 (5) 1.9 (2) 100.0 (107)Life and Health (n = 239) 84.1 (201) 54.7 (110) 38.8 (78) 5.0 (10) 1.0 (2) 0.5 (1) 100.0 (201)Property and Casualty (n = 160) 85.0 (136) 55.9 (76) 28.7 (39) 8.1 (11) 5.1 (7) 2.2 (3) 100.0 (136)State Fire Marshal’s Office (n = 249) 76.7 (191) 60.2 (115) 30.4 (58) 8.4 (16) 0.5 (1) 0.5 (1) 100.0 (191)
*Weighted estimates

50
Table B-4d. Telephone Helpline Staff Are Friendly and Helpful
Responses
Program
GaveOpinion Percent (Count)
Strongly Agree
Percent (Count)
Agree Percent (Count)
Neutral Percent (Count)
Disagree Percent (Count)
Strongly Disagree Percent (Count)
TotalPercent (Count)
All Programs Combined* (n = 1,912) 81.0 (NA) 49.2 (NA) 27.6 (NA) 13.8 (NA) 3.5 (NA) 5.9 (NA) 100.0 (NA)Agent’s Licensing (n = 168) 73.8 (124) 52.4 (65) 27.4 (34) 12.9 (16) 2.4 (3) 4.8 (6) 100.0 (124)Consumer Protection (n = 242) 64.0 (155) 43.2 (67) 32.3 (50) 11.6 (18) 3.2 (5) 9.7 (15) 100.0 (155)Division of Workers’ Compensation (DWC)* (n = 482) 88.6 (NA) 42.8 (NA) 27.4 (NA) 15.7 (NA) 5.6 (NA) 8.5 (NA) 100.0 (NA)
DWC Carriers (n = 96) 88.5 (85) 43.5 (37) 29.4 (25) 24.7 (21) 2.4 (2) 0.0 (0) 100.0 (85) DWC Employers (n = 115) 80.9 (93) 44.1 (41) 38.7 (36) 14.0 (13) 1.1 (1) 2.2 (2) 100.0 (93) DWC Health Care Providers (n = 115) 90.4 (104) 39.4 (41) 40.4 (42) 14.4 (15) 3.8 (4) 1.9 (2) 100.0 (104) DWC Injured Employees (n = 156) 92.9 (145) 42.1 (61) 20.7 (30) 16.6 (24) 8.3 (12) 12.4 (18) 100.0 (145)Enforcement (n = 15)2 100.0 (15) 26.7 (4) 33.3 (5) 33.3 (5) 6.7 (1) 0.0 (0) 100.0 (15)Financial (n = 217) 89.9 (195) 48.2 (94) 34.9 (68) 10.8 (21) 5.1 (10) 1.0 (2) 100.0 (195)Fraud (n = 140) 77.9 (109) 49.5 (54) 37.6 (41) 7.3 (8) 2.8 (3) 2.8 (3) 100.0 (109)Life and Health (n = 239) 84.9 (203) 62.1 (126) 32.5 (66) 4.4 (9) 0.5 (1) 0.5 (1) 100.0 (203)Property and Casualty (n = 160) 84.4 (135) 61.5 (83) 23.7 (32) 13.3 (18) 0.7 (1) 0.7 (1) 100.0 (135)State Fire Marshal’s Office (n = 249) 76.7 (191) 63.4 (121) 27.7 (53) 7.9 (15) 0.5 (1) 0.5 (1) 100.0 (191)
*Weighted estimates

51
Tables B-5 and 6. The Agency’s Internet Sites - Composite
Responses
Program
GaveOpinion Percent
Strongly Agree
PercentAgree
PercentNeutral Percent
Disagree Percent
Strongly Disagree Percent
Total Percent
All Programs Combined* (n = 1,912) 65.8 35.4 34.4 19.9 5.4 4.8 100.0Agent’s Licensing (n = 168) 82.4 40.2 39.5 13.8 4.9 1.6 100.0Consumer Protection (n = 242) 70.8 37.3 33.6 18.3 4.6 6.1 100.0Division of Workers’ Compensation (DWC)* (n = 482) 52.2 33.1 30.1 22.6 6.0 8.1 100.0
DWC Carriers (n = 96) 87.1 27.1 37.5 27.4 7.6 0.4 100.0 DWC Employers (n = 115) 70.0 33.9 39.9 20.5 4.3 1.4 100.0 DWC Health Care Providers (n = 115) 86.2 29.8 27.5 26.6 10.5 5.7 100.0 DWC Injured Employees (n = 156) 40.9 32.9 24.5 23.7 6.8 12.1 100.0Enforcement (n = 15)2 77.5 17.2 36.6 31.2 7.5 7.5 100.0Financial (n = 217) 86.1 27.1 45.1 19.1 5.4 3.2 100.0Fraud (n = 140) 80.4 31.6 45.1 17.3 5.2 0.8 100.0Life and Health (n = 239) 78.1 27.7 40.0 26.2 4.6 1.5 100.0Property and Casualty (n = 160) 63.3 31.9 34.6 25.6 5.6 2.5 100.0State Fire Marshal’s Office (n = 249) 74.4 41.1 38.1 15.8 4.5 0.5 100.0
*Weighted estimates

52
Table B-5a. The Internet Sites Are Easy to Use
Responses
Program
GaveOpinion Percent (Count)
Strongly Agree
Percent (Count)
Agree Percent (Count)
Neutral Percent (Count)
Disagree Percent (Count)
Strongly Disagree Percent (Count)
TotalPercent (Count)
All Programs Combined* (n = 1,912) 68.5 (NA) 33.6 (NA) 34.1 (NA) 20.2 (NA) 6.1 (NA) 5.9 (NA) 100.0 (NA)Agent’s Licensing (n = 168) 87.5 (147) 39.5 (58) 36.7 (54) 15.0 (22) 8.2 (12) 0.7 (1) 100.0 (147)Consumer Protection (n = 242) 75.2 (182) 39.6 (72) 37.4 (68) 13.2 (24) 4.9 (9) 4.9 (9) 100.0 (182)Division of Workers’ Compensation (DWC)* (n = 482) 52.9 (NA) 30.0 (NA) 30.5 (NA) 23.2 (NA) 4.7 (NA) 11.6 (NA) 100.0 (NA)
DWC Carriers (n = 96) 92.7 (89) 23.6 (21) 37.1 (33) 28.1 (25) 10.1 (9) 1.1 (1) 100.0 (89) DWC Employers (n = 115) 74.8 (86) 31.4 (27) 46.5 (40) 17.4 (15) 1.2 (1) 3.5 (3) 100.0 (86) DWC Health Care Providers (n = 115) 88.7 (102) 23.5 (24) 27.5 (28) 29.4 (30) 11.8 (12) 7.8 (8) 100.0 (102) DWC Injured Employees (n = 156) 39.1 (61) 29.5 (18) 21.3 (13) 26.2 (16) 6.6 (4) 16.4 (10) 100.0 (61)Enforcement (n = 15)2 80.0 (12) 33.3 (4) 33.3 (4) 8.3 (1) 16.7 (2) 8.3 (1) 100.0 (12)Financial (n = 217) 91.7 (199) 22.6 (45) 48.7 (97) 18.1 (36) 6.0 (12) 4.5 (9) 100.0 (199)Fraud (n = 140) 83.6 (117) 29.9 (35) 44.4 (52) 18.8 (22) 6.8 (8) 0.0 (0) 100.0 (117)Life and Health (n = 239) 83.3 (199) 23.1 (46) 42.7 (85) 29.6 (59) 3.5 (7) 1.0 (2) 100.0 (199)Property and Casualty (n = 160) 65.6 (105) 29.5 (31) 33.3 (35) 27.6 (29) 6.7 (7) 2.9 (3) 100.0 (105)State Fire Marshal’s Office (n = 249) 76.7 (191) 35.6 (68) 40.3 (77) 17.3 (33) 6.3 (12) 0.5 (1) 100.0 (191)
*Weighted estimates

53
Table B-5b. The Internet Sites Clearly Explain Services Off ered by the Agency
Responses
Program
GaveOpinion Percent (Count)
Strongly Agree
Percent (Count)
Agree Percent (Count)
Neutral Percent (Count)
Disagree Percent (Count)
Strongly Disagree Percent (Count)
TotalPercent (Count)
All Programs Combined* (n = 1,912) 67.3 (NA) 34.3 (NA) 35.1 (NA) 20.3 (NA) 4.9 (NA) 5.4 (NA) 100.0 (NA)Agent’s Licensing (n = 168) 85.1 (143) 42.0 (60) 39.2 (56) 12.6 (18) 4.2 (6) 2.1 (3) 100.0 (143)Consumer Protection (n = 242) 75.2 (182) 36.3 (66) 37.4 (68) 15.9 (29) 5.5 (10) 4.9 (9) 100.0 (182)Division of Workers’ Compensation (DWC)* (n = 482) 52.0 (NA) 30.9 (NA) 30.5 (NA) 24.1 (NA) 4.9 (NA) 9.5 (NA) 100.0 (NA)
DWC Carriers (n = 96) 89.6 (86) 31.4 (27) 33.7 (29) 30.2 (26) 4.7 (4) 0.0 (0) 100.0 (86) DWC Employers (n = 115) 71.3 (82) 31.7 (26) 41.5 (34) 20.7 (17) 4.9 (4) 1.2 (1) 100.0 (82) DWC Health Care Providers (n = 115) 87.0 (100) 23.0 (23) 31.0 (31) 31.0 (31) 11.0 (11) 4.0 (4) 100.0 (100) DWC Injured Employees (n = 156) 39.7 (62) 30.6 (19) 24.2 (15) 25.8 (16) 4.8 (3) 14.5 (9) 100.0 (62)Enforcement (n = 15)2 73.3 (11) 9.1 (1) 45.5 (5) 18.2 (2) 18.2 (2) 9.1 (1) 100.0 (11)Financial (n = 217) 88.9 (193) 25.9 (50) 44.0 (85) 21.2 (41) 6.2 (12) 2.6 (5) 100.0 (193)Fraud (n = 140) 83.6 (117) 28.2 (33) 48.7 (57) 17.9 (21) 3.4 (4) 1.7 (2) 100.0 (117)Life and Health (n = 239) 77.8 (186) 23.7 (44) 43.5 (81) 28.5 (53) 3.2 (6) 1.1 (2) 100.0 (186)Property and Casualty (n = 160) 65.6 (105) 29.5 (31) 35.2 (37) 27.6 (29) 5.7 (6) 1.9 (2) 100.0 (105)State Fire Marshal’s Office (n = 249) 75.5 (188) 37.2 (70) 40.4 (76) 17.6 (33) 3.7 (7) 1.1 (2) 100.0 (188)
*Weighted estimates

54
Table B-5c. The Internet Sites Provide Accurate Informa on
Responses
Program
GaveOpinion Percent (Count)
Strongly Agree
Percent (Count)
Agree Percent (Count)
Neutral Percent (Count)
Disagree Percent (Count)
Strongly Disagree Percent (Count)
TotalPercent (Count)
All Programs Combined* (n = 1,912) 67.7 (NA) 38.7 (NA) 36.1 (NA) 16.9 (NA) 4.0 (NA) 4.3 (NA) 100.0 (NA)Agent’s Licensing (n = 168) 86.3 (145) 43.4 (63) 42.1 (61) 11.0 (16) 2.1 (3) 1.4 (2) 100.0 (145)Consumer Protection (n = 242) 74.4 (180) 38.3 (69) 35.0 (63) 18.3 (33) 3.3 (6) 5.0 (9) 100.0 (180)Division of Workers’ Compensation (DWC)* (n = 482) 51.8 (NA) 36.1 (NA) 31.0 (NA) 20.2 (NA) 5.7 (NA) 7.1 (NA) 100.0 (NA)
DWC Carriers (n = 96) 92.7 (89) 31.5 (28) 42.7 (38) 24.7 (22) 1.1 (1) 0.0 (0) 100.0 (89) DWC Employers (n = 115) 73.0 (84) 38.1 (32) 44.0 (37) 14.3 (12) 1.2 (1) 2.4 (2) 100.0 (84) DWC Health Care Providers (n = 115) 87.8 (101) 37.6 (38) 30.7 (31) 23.8 (24) 7.9 (8) 0.0 (0) 100.0 (101) DWC Injured Employees (n = 156) 38.5 (60) 35.0 (21) 23.3 (14) 23.3 (14) 8.3 (5) 10.0 (6) 100.0 (60)Enforcement (n = 15)2 80.0 (12) 25.0 (3) 41.7 (5) 25.0 (3) 0.0 (0) 8.3 (1) 100.0 (12)Financial (n = 217) 90.3 (196) 33.2 (65) 51.5 (101) 12.8 (25) 0.0 (0) 2.6 (5) 100.0 (196)Fraud (n = 140) 82.9 (116) 34.5 (40) 51.7 (60) 12.9 (15) 0.9 (1) 0.0 (0) 100.0 (116)Life and Health (n = 239) 82.4 (197) 32.5 (64) 45.7 (90) 19.8 (39) 1.5 (3) 0.5 (1) 100.0 (197)Property and Casualty (n = 160) 66.3 (106) 36.8 (39) 36.8 (39) 18.9 (20) 4.7 (5) 2.8 (3) 100.0 (106)State Fire Marshal’s Office (n = 249) 75.1 (187) 44.9 (84) 37.4 (70) 15.5 (29) 2.1 (4) 0.0 (0) 100.0 (187)
*Weighted estimates

55
Table B-5d. The Internet Sites Provide Useful Informa on
Responses
Program
GaveOpinion Percent (Count)
Strongly Agree
Percent (Count)
Agree Percent (Count)
Neutral Percent (Count)
Disagree Percent (Count)
Strongly Disagree Percent (Count)
TotalPercent (Count)
All Programs Combined* (n = 1,912) 68.0 (NA) 38.2 (NA) 34.2 (NA) 19.8 (NA) 4.0 (NA) 3.7 (NA) 100.0 (NA)Agent’s Licensing (n = 168) 86.3 (145) 42.1 (61) 38.6 (56) 17.9 (26) 0.7 (1) 0.7 (1) 100.0 (145)Consumer Protection (n = 242) 74.8 (181) 38.7 (70) 34.8 (63) 16.6 (30) 4.4 (8) 5.5 (10) 100.0 (181)Division of Workers’ Compensation (DWC)* (n = 482) 52.6 (NA) 36.4 (NA) 29.5 (NA) 21.6 (NA) 6.0 (NA) 6.5 (NA) 100.0 (NA)
DWC Carriers (n = 96) 92.7 (89) 31.5 (28) 43.8 (39) 22.5 (20) 2.2 (2) 0.0 (0) 100.0 (89) DWC Employers (n = 115) 73.0 (84) 38.1 (32) 35.7 (30) 22.6 (19) 2.4 (2) 1.2 (1) 100.0 (84) DWC Health Care Providers (n = 115) 87.8 (101) 37.6 (38) 27.7 (28) 27.7 (28) 5.9 (6) 1.0 (1) 100.0 (101) DWC Injured Employees (n = 156) 39.7 (62) 35.5 (22) 25.8 (16) 21.0 (13) 8.1 (5) 9.7 (6) 100.0 (62)Enforcement (n = 15)2 80.0 (12) 25.0 (3) 41.7 (5) 25.0 (3) 0.0 (0) 8.3 (1) 100.0 (12)Financial (n = 217) 90.3 (196) 30.1 (59) 52.0 (102) 13.8 (27) 2.0 (4) 2.0 (4) 100.0 (196)Fraud (n = 140) 82.9 (116) 36.2 (42) 50.9 (59) 11.2 (13) 1.7 (2) 0.0 (0) 100.0 (116)Life and Health (n = 239) 82.8 (198) 30.8 (61) 46.5 (92) 20.7 (41) 1.5 (3) 0.5 (1) 100.0 (198)Property and Casualty (n = 160) 65.6 (105) 35.2 (37) 34.3 (36) 22.9 (24) 5.7 (6) 1.9 (2) 100.0 (105)State Fire Marshal’s Office (n = 249) 75.9 (189) 46.0 (87) 38.1 (72) 12.7 (24) 3.2 (6) 0.0 (0) 100.0 (189)
*Weighted estimates

56
Table B-5e. The Internet Sites Have Easy-to-Use Search Features
Responses
Program
GaveOpinion Percent (Count)
Strongly Agree
Percent (Count)
Agree Percent (Count)
Neutral Percent (Count)
Disagree Percent (Count)
Strongly Disagree Percent (Count)
TotalPercent (Count)
All Programs Combined* (n = 1,912) 67.1 (NA) 32.8 (NA) 31.6 (NA) 22.9 (NA) 7.8 (NA) 4.8 (NA) 100.0 (NA)Agent’s Licensing (n = 168) 85.1 (143) 39.2 (56) 37.1 (53) 14.0 (20) 8.4 (12) 1.4 (2) 100.0 (143)Consumer Protection (n = 242) 73.1 (177) 36.2 (64) 32.8 (58) 20.3 (36) 4.0 (7) 6.8 (12) 100.0 (177)Division of Workers’ Compensation (DWC)* (n = 482) 52.2 (NA) 29.6 (NA) 27.8 (NA) 26.8 (NA) 8.0 (NA) 7.7 (NA) 100.0 (NA)
DWC Carriers (n = 96) 90.6 (87) 16.1 (14) 36.8 (32) 26.4 (23) 19.5 (17) 1.1 (1) 100.0 (87) DWC Employers (n = 115) 73.0 (84) 27.4 (23) 39.3 (33) 25.0 (21) 7.1 (6) 1.2 (1) 100.0 (84) DWC Health Care Providers (n = 115) 88.7 (102) 27.5 (28) 21.6 (22) 28.4 (29) 10.8 (11) 11.8 (12) 100.0 (102) DWC Injured Employees (n = 156) 39.1 (61) 31.1 (19) 21.3 (13) 27.9 (17) 8.2 (5) 11.5 (7) 100.0 (61)Enforcement (n = 15)2 80.0 (12) 8.3 (1) 25.0 (3) 50.0 (6) 0.0 (0) 16.7 (2) 100.0 (12)Financial (n = 217) 90.3 (196) 22.4 (44) 39.8 (78) 24.0 (47) 10.2 (20) 3.6 (7) 100.0 (196)Fraud (n = 140) 82.1 (115) 27.8 (32) 44.3 (51) 20.0 (23) 7.0 (8) 0.9 (1) 100.0 (115)Life and Health (n = 239) 79.9 (191) 25.1 (48) 33.5 (64) 32.5 (62) 5.8 (11) 3.1 (6) 100.0 (191)Property and Casualty (n = 160) 64.4 (103) 29.1 (30) 28.2 (29) 31.1 (32) 8.7 (9) 2.9 (3) 100.0 (103)State Fire Marshal’s Office (n = 249) 75.1 (187) 35.8 (67) 38.5 (72) 17.1 (32) 7.5 (14) 1.1 (2) 100.0 (187)
*Weighted estimates

57
Table B-5f. The Internet Sites Have Helpful Search Features
Responses
Program
GaveOpinion Percent (Count)
Strongly Agree
Percent (Count)
Agree Percent (Count)
Neutral Percent (Count)
Disagree Percent (Count)
Strongly Disagree Percent (Count)
TotalPercent (Count)
All Programs Combined* (n = 1,912) 66.7 (NA) 33.1 (NA) 33.1 (NA) 22.1 (NA) 6.2 (NA) 5.5 (NA) 100.0 (NA)Agent’s Licensing (n = 168) 85.1 (143) 37.1 (53) 40.6 (58) 14.0 (20) 7.0 (10) 1.4 (2) 100.0 (143)Consumer Protection (n = 242) 72.3 (175) 34.9 (61) 32.0 (56) 21.7 (38) 5.7 (10) 5.7 (10) 100.0 (175)Division of Workers’ Compensation (DWC)* (n = 482) 51.6 (NA) 31.9 (NA) 27.9 (NA) 25.5 (NA) 4.9 (NA) 9.8 (NA) 100.0 (NA)
DWC Carriers (n = 96) 91.7 (88) 17.0 (15) 35.2 (31) 31.8 (28) 14.8 (13) 1.1 (1) 100.0 (88) DWC Employers (n = 115) 71.3 (82) 28.0 (23) 36.6 (30) 26.8 (22) 7.3 (6) 1.2 (1) 100.0 (82) DWC Health Care Providers (n = 115) 87.0 (100) 27.0 (27) 25.0 (25) 25.0 (25) 12.0 (12) 11.0 (11) 100.0 (100) DWC Injured Employees (n = 156) 39.1 (61) 34.4 (21) 23.0 (14) 24.6 (15) 3.3 (2) 14.8 (9) 100.0 (61)Enforcement (n = 15)2 80.0 (12) 8.3 (1) 25.0 (3) 50.0 (6) 8.3 (1) 8.3 (1) 100.0 (12)Financial (n = 217) 88.9 (193) 23.3 (45) 39.9 (77) 22.8 (44) 8.8 (17) 5.2 (10) 100.0 (193)Fraud (n = 140) 82.1 (115) 29.6 (34) 40.9 (47) 20.9 (24) 7.8 (9) 0.9 (1) 100.0 (115)Life and Health (n = 239) 79.1 (189) 25.4 (48) 32.3 (61) 31.7 (60) 7.9 (15) 2.6 (5) 100.0 (189)Property and Casualty (n = 160) 64.4 (103) 29.1 (30) 32.0 (33) 28.2 (29) 7.8 (8) 2.9 (3) 100.0 (103)State Fire Marshal’s Office (n = 249) 74.7 (186) 36.6 (68) 37.6 (70) 17.2 (32) 8.1 (15) 0.5 (1) 100.0 (186)
*Weighted estimates

58
Table B-6a. It Is Easy to Find the Agency’s Offi ce Loca ons on TDI’s Internet Sites
Responses
Program
GaveOpinion Percent (Count)
Strongly Agree
Percent (Count)
Agree Percent (Count)
Neutral Percent (Count)
Disagree Percent (Count)
Strongly Disagree Percent (Count)
TotalPercent (Count)
All Programs Combined* (n = 1,912) 60.3 (NA) 39.1 (NA) 36.6 (NA) 16.4 (NA) 3.8 (NA) 4.2 (NA) 100.0 (NA)Agent’s Licensing (n = 168) 71.4 (120) 40.8 (49) 41.7 (50) 11.7 (14) 3.3 (4) 2.5 (3) 100.0 (120)Consumer Protection (n = 242) 60.3 (146) 39.0 (57) 30.1 (44) 19.9 (29) 4.1 (6) 6.8 (10) 100.0 (146)Division of Workers’ Compensation (DWC)* (n = 482) 52.7 (NA) 39.2 (NA) 33.1 (NA) 16.6 (NA) 5.1 (NA) 6.0 (NA) 100.0 (NA)
DWC Carriers (n = 96) 69.8 (67) 40.3 (27) 34.3 (23) 23.9 (16) 1.5 (1) 0.0 (0) 100.0 (67) DWC Employers (n = 115) 61.7 (71) 40.8 (29) 40.8 (29) 14.1 (10) 4.2 (3) 0.0 (0) 100.0 (71) DWC Health Care Providers (n = 115) 80.9 (93) 34.4 (32) 30.1 (28) 20.4 (19) 11.8 (11) 3.2 (3) 100.0 (93) DWC Injured Employees (n = 156) 46.8 (73) 38.4 (28) 28.8 (21) 17.8 (13) 5.5 (4) 9.6 (7) 100.0 (73)Enforcement (n = 15)2 73.3 (11) 18.2 (2) 45.5 (5) 36.4 (4) 0.0 (0) 0.0 (0) 100.0 (11)Financial (n = 217) 70.5 (153) 35.3 (54) 43.1 (66) 17.0 (26) 2.6 (4) 2.0 (3) 100.0 (153)Fraud (n = 140) 70.7 (99) 36.4 (36) 40.4 (40) 17.2 (17) 6.1 (6) 0.0 (0) 100.0 (99)Life and Health (n = 239) 64.0 (153) 34.0 (52) 43.8 (67) 19.0 (29) 3.3 (5) 0.0 (0) 100.0 (153)Property and Casualty (n = 160) 55.6 (89) 34.8 (31) 39.3 (35) 22.5 (20) 1.1 (1) 2.2 (2) 100.0 (89)State Fire Marshal’s Office (n = 249) 71.1 (177) 45.8 (81) 37.9 (67) 14.1 (25) 2.3 (4) 0.0 (0) 100.0 (177)
*Weighted estimates

59
Table B-6b. It Is Easy to Find the Contact Persons on TDI’s Internet Sites
Responses
Program
GaveOpinion Percent (Count)
Strongly Agree
Percent (Count)
Agree Percent (Count)
Neutral Percent (Count)
Disagree Percent (Count)
Strongly Disagree Percent (Count)
TotalPercent (Count)
All Programs Combined* (n = 1,912) 61.0 (NA) 33.7 (NA) 34.0 (NA) 20.7 (NA) 6.3 (NA) 5.2 (NA) 100.0 (NA)Agent’s Licensing (n = 168) 72.0 (121) 37.2 (45) 40.5 (49) 14.0 (17) 5.0 (6) 3.3 (4) 100.0 (121)Consumer Protection (n = 242) 61.2 (148) 35.8 (53) 27.7 (41) 21.6 (32) 4.7 (7) 10.1 (15) 100.0 (148)Division of Workers’ Compensation (DWC)* (n = 482) 52.0 (NA) 31.2 (NA) 29.3 (NA) 23.6 (NA) 8.8 (NA) 7.1 (NA) 100.0 (NA)
DWC Carriers (n = 96) 77.1 (74) 28.4 (21) 35.1 (26) 31.1 (23) 5.4 (4) 0.0 (0) 100.0 (74) DWC Employers (n = 115) 61.7 (71) 36.6 (26) 33.8 (24) 22.5 (16) 7.0 (5) 0.0 (0) 100.0 (71) DWC Health Care Providers (n = 115) 81.7 (94) 27.7 (26) 26.6 (25) 26.6 (25) 12.8 (12) 6.4 (6) 100.0 (94) DWC Injured Employees (n = 156) 45.5 (71) 28.2 (20) 26.8 (19) 23.9 (17) 9.9 (7) 11.3 (8) 100.0 (71)Enforcement (n = 15)2 73.3 (11) 9.1 (1) 36.4 (4) 36.4 (4) 18.2 (2) 0.0 (0) 100.0 (11)Financial (n = 217) 77.4 (168) 25.6 (43) 40.5 (68) 23.8 (40) 7.1 (12) 3.0 (5) 100.0 (168)Fraud (n = 140) 75.7 (106) 31.1 (33) 37.7 (40) 19.8 (21) 8.5 (9) 2.8 (3) 100.0 (106)Life and Health (n = 239) 75.7 (181) 28.2 (51) 31.5 (57) 27.1 (49) 9.9 (18) 3.3 (6) 100.0 (181)Property and Casualty (n = 160) 58.8 (94) 30.9 (29) 38.3 (36) 25.5 (24) 3.2 (3) 2.1 (2) 100.0 (94)State Fire Marshal’s Office (n = 249) 71.5 (178) 47.2 (84) 34.3 (61) 15.2 (27) 2.2 (4) 1.1 (2) 100.0 (178)
*Weighted estimates

60
Table B-7. Timeliness of Service - Composite
Responses
Program
GaveOpinion Percent
VerySa sfi ed Percent
Sa sfi ed Percent
Neutral Percent
Dissa sfi ed Percent
Very Dissa sfi ed
Percent Total
Percent All Programs Combined* (n = 1,912) 61.1 39.6 30.9 16.7 5.4 7.4 100.0Agent’s Licensing (n = 168) 65.6 43.4 34.3 15.1 2.9 4.4 100.0Consumer Protection (n = 242) 52.2 35.6 26.7 17.6 6.5 13.6 100.0Division of Workers’ Compensation (DWC)* (n = 482) 59.9 34.9 28.5 18.4 7.6 10.5 100.0
DWC Carriers (n = 96) 67.7 35.1 33.8 28.6 2.5 0.0 100.0 DWC Employers (n = 115) 56.3 37.3 36.7 22.2 0.9 2.8 100.0 DWC Health Care Providers (n = 115) 70.4 28.1 35.1 23.5 9.1 4.2 100.0 DWC Injured Employees (n = 156) 61.7 33.7 23.7 16.0 11.4 15.2 100.0Enforcement (n = 15)2 77.3 22.4 25.9 36.2 3.4 12.1 100.0Financial (n = 217) 70.9 40.4 40.3 13.8 2.9 2.6 100.0Fraud (n = 140) 70.9 35.5 43.3 11.7 5.8 3.6 100.0Life and Health (n = 239) 56.3 44.3 39.5 14.7 1.3 0.1 100.0Property and Casualty (n = 160) 59.3 44.5 31.6 15.6 5.3 3.0 100.0State Fire Marshal’s Office (n = 249) 62.9 55.0 32.1 11.6 0.8 0.5 100.0
*Weighted estimates

61
Table B-7a. Timeliness of Service in Person
Responses
Program
GaveOpinion Percent (Count)
VerySa sfi ed Percent (Count)
Sa sfi ed Percent (Count)
Neutral Percent (Count)
Dissa sfi ed Percent (Count)
Very Dissa sfi ed
Percent (Count)
TotalPercent (Count)
All Programs Combined* (n = 1,912) 44.8 (NA) 45.8 (NA) 27.3 (NA) 15.8 (NA) 4.1 (NA) 7.0 (NA) 100.0 (NA)Agent’s Licensing (n = 168) 41.1 (69) 52.2 (36) 30.4 (21) 14.5 (10) 0.0 (0) 2.9 (2) 100.0 (69)Consumer Protection (n = 242) 24.4 (59) 30.5 (18) 18.6 (11) 23.7 (14) 6.8 (4) 20.3 (12) 100.0 (59)Division of Workers’ Compensation (DWC)* (n = 482) 53.1 (NA) 44.8 (NA) 24.5 (NA) 15.3 (NA) 6.3 (NA) 9.0 (NA) 100.0 (NA)
DWC Carriers (n = 96) 26.0 (25) 48.0 (12) 28.0 (7) 24.0 (6) 0.0 (0) 0.0 (0) 100.0 (25) DWC Employers (n = 115) 34.8 (40) 55.0 (22) 25.0 (10) 17.5 (7) 0.0 (0) 2.5 (1) 100.0 (40) DWC Health Care Providers (n = 115) 47.0 (54) 40.7 (22) 35.2 (19) 13.0 (7) 7.4 (4) 3.7 (2) 100.0 (54) DWC Injured Employees (n = 156) 64.1 (100) 39.0 (39) 24.0 (24) 14.0 (14) 10.0 (10) 13.0 (13) 100.0 (100)Enforcement (n = 15)2 46.7 (7) 14.3 (1) 14.3 (1) 57.1 (4) 0.0 (0) 14.3 (1) 100.0 (7)Financial (n = 217) 36.9 (80) 45.0 (36) 40.0 (32) 13.8 (11) 0.0 (0) 1.3 (1) 100.0 (80)Fraud (n = 140) 60.0 (84) 46.4 (39) 40.5 (34) 8.3 (7) 3.6 (3) 1.2 (1) 100.0 (84)Life and Health (n = 239) 15.1 (36) 47.2 (17) 33.3 (12) 16.7 (6) 2.8 (1) 0.0 (0) 100.0 (36)Property and Casualty (n = 160) 42.5 (68) 44.1 (30) 32.4 (22) 14.7 (10) 5.9 (4) 2.9 (2) 100.0 (68)State Fire Marshal’s Office (n = 249) 49.4 (123) 58.5 (72) 30.9 (38) 10.6 (13) 0.0 (0) 0.0 (0) 100.0 (123)
*Weighted estimates

62
Table B-7b. Timeliness of Service by Telephone
Responses
Program
GaveOpinion Percent (Count)
VerySa sfi ed Percent (Count)
Sa sfi ed Percent (Count)
Neutral Percent (Count)
Dissa sfi ed Percent (Count)
Very Dissa sfi ed
Percent (Count)
TotalPercent (Count)
All Programs Combined* (n = 1,912) 79.8 (NA) 40.5 (NA) 30.9 (NA) 15.0 (NA) 6.2 (NA) 7.3 (NA) 100.0 (NA)Agent’s Licensing (n = 168) 76.2 (128) 42.2 (54) 32.0 (41) 17.2 (22) 3.1 (4) 5.5 (7) 100.0 (128)Consumer Protection (n = 242) 57.9 (140) 37.9 (53) 29.3 (41) 14.3 (20) 7.1 (10) 11.4 (16) 100.0 (140)Division of Workers’ Compensation (DWC)* (n = 482) 85.7 (NA) 36.3 (NA) 28.8 (NA) 15.8 (NA) 8.5 (NA) 10.6 (NA) 100.0 (NA)
DWC Carriers (n = 96) 90.6 (87) 34.5 (30) 31.0 (27) 32.2 (28) 2.3 (2) 0.0 (0) 100.0 (87) DWC Employers (n = 115) 78.3 (90) 37.8 (34) 40.0 (36) 17.8 (16) 2.2 (2) 2.2 (2) 100.0 (90) DWC Health Care Providers (n = 115) 92.2 (106) 26.4 (28) 46.2 (49) 17.9 (19) 7.5 (8) 1.9 (2) 100.0 (106) DWC Injured Employees (n = 156) 89.7 (140) 35.7 (50) 22.1 (31) 14.3 (20) 12.1 (17) 15.7 (22) 100.0 (140)Enforcement (n = 15)2 100.0 (15) 26.7 (4) 26.7 (4) 26.7 (4) 6.7 (1) 13.3 (2) 100.0 (15)Financial (n = 217) 88.9 (193) 46.1 (89) 38.3 (74) 11.4 (22) 2.6 (5) 1.6 (3) 100.0 (193)Fraud (n = 140) 77.9 (109) 33.0 (36) 45.0 (49) 11.0 (12) 6.4 (7) 4.6 (5) 100.0 (109)Life and Health (n = 239) 84.9 (203) 50.2 (102) 38.9 (79) 10.3 (21) 0.5 (1) 0.0 (0) 100.0 (203)Property and Casualty (n = 160) 83.8 (134) 46.3 (62) 33.6 (45) 11.2 (15) 7.5 (10) 1.5 (2) 100.0 (134)State Fire Marshal’s Office (n = 249) 76.7 (191) 56.5 (108) 33.5 (64) 8.4 (16) 1.0 (2) 0.5 (1) 100.0 (191)
*Weighted estimates

63
Table B-7c. Timeliness of Service by Mail
Responses
Program
GaveOpinion Percent (Count)
VerySa sfi ed Percent (Count)
Sa sfi edPercent (Count)
Neutral Percent (Count)
Dissa sfi edPercent (Count)
Very Dissa sfi ed
Percent (Count)
TotalPercent (Count)
All Programs Combined* (n = 1,912) 71.8 (NA) 37.6 (NA) 32.1 (NA) 16.8 (NA) 5.6 (NA) 7.8 (NA) 100.0 (NA)Agent’s Licensing (n = 168) 70.2 (118) 37.3 (44) 35.6 (42) 15.3 (18) 4.2 (5) 7.6 (9) 100.0 (118)Consumer Protection (n = 242) 68.6 (166) 35.5 (59) 28.9 (48) 15.1 (25) 6.0 (10) 14.5 (24) 100.0 (166)Division of Workers’ Compensation (DWC)* (n = 482) 74.3 (NA) 34.7 (NA) 30.4 (NA) 18.0 (NA) 8.0 (NA) 8.9 (NA) 100.0 (NA)
DWC Carriers (n = 96) 70.8 (68) 33.8 (23) 33.8 (23) 32.4 (22) 0.0 (0) 0.0 (0) 100.0 (68) DWC Employers (n = 115) 61.7 (71) 31.0 (22) 40.8 (29) 25.4 (18) 0.0 (0) 2.8 (2) 100.0 (71) DWC Health Care Providers (n = 115) 81.7 (94) 23.4 (22) 30.9 (29) 30.9 (29) 10.6 (10) 4.3 (4) 100.0 (94) DWC Injured Employees (n = 156) 81.4 (127) 37.0 (47) 24.4 (31) 13.4 (17) 12.6 (16) 12.6 (16) 100.0 (127)Enforcement (n = 15)2 100.0 (15) 20.0 (3) 33.3 (5) 33.3 (5) 0.0 (0) 13.3 (2) 100.0 (15)Financial (n = 217) 76.5 (166) 37.3 (62) 38.6 (64) 18.1 (30) 3.0 (5) 3.0 (5) 100.0 (166)Fraud (n = 140) 70.7 (99) 33.3 (33) 41.4 (41) 11.1 (11) 8.1 (8) 6.1 (6) 100.0 (99)Life and Health (n = 239) 57.7 (138) 39.9 (55) 37.0 (51) 20.3 (28) 2.9 (4) 0.0 (0) 100.0 (138)Property and Casualty (n = 160) 70.6 (113) 44.2 (50) 31.0 (35) 18.6 (21) 2.7 (3) 3.5 (4) 100.0 (113)State Fire Marshal’s Office (n = 249) 66.7 (166) 54.8 (91) 33.1 (55) 11.4 (19) 0.6 (1) 0.0 (0) 100.0 (166)
*Weighted estimates

64
Table B-7d. Timeliness of Service by E-mail
Responses
Program
GaveOpinion Percent (Count)
VerySa sfi ed Percent (Count)
Sa sfi ed Percent (Count)
Neutral Percent (Count)
Dissa sfi ed Percent (Count)
Very Dissa sfi ed
Percent (Count)
TotalPercent (Count)
All Programs Combined* (n = 1,912) 53.9 (NA) 39.1 (NA) 28.7 (NA) 17.6 (NA) 5.4 (NA) 9.3 (NA) 100.0 (NA)Agent’s Licensing (n = 168) 64.9 (109) 47.7 (52) 31.2 (34) 14.7 (16) 3.7 (4) 2.8 (3) 100.0 (109)Consumer Protection (n = 242) 55.4 (134) 35.8 (48) 25.4 (34) 15.7 (21) 7.5 (10) 15.7 (21) 100.0 (134)Division of Workers’ Compensation (DWC)* (n = 482) 43.5 (NA) 27.5 (NA) 27.7 (NA) 22.7 (NA) 6.5 (NA) 15.6 (NA) 100.0 (NA)
DWC Carriers (n = 96) 87.5 (84) 34.5 (29) 35.7 (30) 25.0 (21) 4.8 (4) 0.0 (0) 100.0 (84) DWC Employers (n = 115) 51.3 (59) 33.9 (20) 37.3 (22) 23.7 (14) 0.0 (0) 5.1 (3) 100.0 (59) DWC Health Care Providers (n = 115) 66.1 (76) 31.6 (24) 32.9 (25) 25.0 (19) 6.6 (5) 3.9 (3) 100.0 (76) DWC Injured Employees (n = 156) 37.8 (59) 23.7 (14) 22.0 (13) 22.0 (13) 10.2 (6) 22.0 (13) 100.0 (59)Enforcement (n = 15)2 80.0 (12) 33.3 (4) 16.7 (2) 41.7 (5) 0.0 (0) 8.3 (1) 100.0 (12)Financial (n = 217) 90.8 (197) 44.2 (87) 42.6 (84) 8.6 (17) 2.5 (5) 2.0 (4) 100.0 (197)Fraud (n = 140) 78.6 (110) 39.1 (43) 43.6 (48) 9.1 (10) 5.5 (6) 2.7 (3) 100.0 (110)Life and Health (n = 239) 80.8 (193) 49.2 (95) 38.9 (75) 10.4 (20) 1.0 (2) 0.5 (1) 100.0 (193)Property and Casualty (n = 160) 52.5 (84) 51.2 (43) 27.4 (23) 11.9 (10) 6.0 (5) 3.6 (3) 100.0 (84)State Fire Marshal’s Office (n = 249) 62.2 (155) 59.4 (92) 26.5 (41) 12.3 (19) 1.3 (2) 0.6 (1) 100.0 (155)
*Weighted estimates

65
Table B-7e. Timeliness of Service Through TDI’s Internet Sites
Responses
Program
GaveOpinion Percent (Count)
VerySa sfi ed Percent (Count)
Sa sfi ed Percent (Count)
Neutral Percent (Count)
Dissa sfi ed Percent (Count)
Very Dissa sfi ed
Percent (Count)
TotalPercent (Count)
All Programs Combined* (n = 1,912) 55.0 (NA) 33.7 (NA) 33.6 (NA) 20.9 (NA) 5.0 (NA) 6.8 (NA) 100.0 (NA)Agent’s Licensing (n = 168) 75.6 (127) 41.7 (53) 40.2 (51) 13.4 (17) 2.4 (3) 2.4 (3) 100.0 (127)Consumer Protection (n = 242) 55.0 (133) 35.3 (47) 26.3 (35) 23.3 (31) 5.3 (7) 9.8 (13) 100.0 (133)Division of Workers’ Compensation (DWC)* (n = 482) 43.1 (NA) 27.0 (NA) 29.9 (NA) 24.7 (NA) 7.5 (NA) 10.9 (NA) 100.0 (NA)
DWC Carriers (n = 96) 63.5 (61) 32.8 (20) 37.7 (23) 26.2 (16) 3.3 (2) 0.0 (0) 100.0 (61) DWC Employers (n = 115) 55.7 (64) 35.9 (23) 34.4 (22) 26.6 (17) 1.6 (1) 1.6 (1) 100.0 (64) DWC Health Care Providers (n = 115) 65.2 (75) 24.0 (18) 26.7 (20) 28.0 (21) 13.3 (10) 8.0 (6) 100.0 (75) DWC Injured Employees (n = 156) 35.3 (55) 21.8 (12) 27.3 (15) 23.6 (13) 10.9 (6) 16.4 (9) 100.0 (55)Enforcement (n = 15)2 60.0 (9) 11.1 (1) 33.3 (3) 33.3 (3) 11.1 (1) 11.1 (1) 100.0 (9)Financial (n = 217) 61.3 (133) 27.8 (37) 42.1 (56) 19.5 (26) 5.3 (7) 5.3 (7) 100.0 (133)Fraud (n = 140) 67.1 (94) 26.6 (25) 45.7 (43) 19.1 (18) 5.3 (5) 3.2 (3) 100.0 (94)Life and Health (n = 239) 43.1 (103) 28.2 (29) 47.6 (49) 23.3 (24) 1.0 (1) 0.0 (0) 100.0 (103)Property and Casualty (n = 160) 46.9 (75) 34.7 (26) 33.3 (25) 24.0 (18) 4.0 (3) 4.0 (3) 100.0 (75)State Fire Marshal’s Office (n = 249) 59.4 (148) 45.9 (68) 35.8 (53) 16.2 (24) 0.7 (1) 1.4 (2) 100.0 (148)
*Weighted estimates

66
Table B-8. The Agency’s Offi ces - Composite
Responses
Program
GaveOpinion Percent
Strongly Agree
Percent Agree
Percent Neutral Percent
Disagree Percent
Strongly Disagree Percent
Total Percent
All Programs Combined* (n = 1,912) 43.3 42.1 27.5 21.4 4.0 4.9 100.0Agent’s Licensing (n = 168) 38.7 49.2 27.3 19.6 0.8 3.1 100.0Consumer Protection (n = 242) 26.3 42.7 15.3 23.9 7.1 11.0 100.0Division of Workers’ Compensation (DWC)* (n = 482) 55.3 38.7 27.8 21.4 5.8 6.3 100.0
DWC Carriers (n = 96) 24.0 32.6 43.5 19.6 4.3 0.0 100.0 DWC Employers (n = 115) 37.6 38.2 33.5 24.9 2.9 0.6 100.0 DWC Health Care Providers (n = 115) 51.1 37.0 31.1 20.9 7.2 3.8 100.0 DWC Injured Employees (n = 156) 66.0 39.1 24.3 19.4 7.5 9.7 100.0Enforcement (n = 15)2 40.0 20.8 20.8 45.8 0.0 12.5 100.0Financial (n = 217) 33.8 34.1 41.0 22.9 1.0 1.0 100.0Fraud (n = 140) 55.5 29.3 41.8 13.8 11.6 3.5 100.0Life and Health (n = 239) 9.8 48.9 41.5 9.6 0.0 0.0 100.0Property and Casualty (n = 160) 32.5 38.5 29.3 25.5 4.3 2.4 100.0State Fire Marshal’s Office (n = 249) 38.3 44.4 39.9 14.7 1.0 0.0 100.0
*Weighted estimates

67
Table B-8a. The Agency’s Offi ces Are Accessible
Responses
Program
GaveOpinion Percent (Count)
Strongly Agree
Percent (Count)
Agree Percent (Count)
Neutral Percent (Count)
Disagree Percent (Count)
Strongly Disagree Percent (Count)
TotalPercent (Count)
All Programs Combined* (n = 1,912) 47.6 (NA) 45.0 (NA) 28.3 (NA) 18.5 (NA) 3.6 (NA) 4.6 (NA) 100.0 (NA)Agent’s Licensing (n = 168) 42.9 (72) 51.4 (37) 27.8 (20) 16.7 (12) 1.4 (1) 2.8 (2) 100.0 (72)Consumer Protection (n = 242) 33.5 (81) 45.7 (37) 22.2 (18) 14.8 (12) 6.2 (5) 11.1 (9) 100.0 (81)Division of Workers’ Compensation (DWC)* (n = 482) 58.8 (NA) 41.0 (NA) 27.4 (NA) 20.0 (NA) 5.6 (NA) 5.9 (NA) 100.0 (NA)
DWC Carriers (n = 96) 29.2 (28) 32.1 (9) 46.4 (13) 17.9 (5) 3.6 (1) 0.0 (0) 100.0 (28) DWC Employers (n = 115) 42.6 (49) 42.9 (21) 30.6 (15) 22.4 (11) 4.1 (2) 0.0 (0) 100.0 (49) DWC Health Care Providers (n = 115) 55.7 (64) 40.6 (26) 29.7 (19) 18.8 (12) 6.3 (4) 4.7 (3) 100.0 (64) DWC Injured Employees (n = 156) 68.6 (107) 40.2 (43) 25.2 (27) 18.7 (20) 6.5 (7) 9.3 (10) 100.0 (107)Enforcement (n = 15)2 46.7 (7) 28.6 (2) 14.3 (1) 42.9 (3) 0.0 (0) 14.3 (1) 100.0 (7)Financial (n = 217) 36.4 (79) 38.0 (30) 45.6 (36) 15.2 (12) 0.0 (0) 1.3 (1) 100.0 (79)Fraud (n = 140) 61.4 (86) 33.7 (29) 38.4 (33) 12.8 (11) 10.5 (9) 4.7 (4) 100.0 (86)Life and Health (n = 239) 14.2 (34) 50.0 (17) 44.1 (15) 5.9 (2) 0.0 (0) 0.0 (0) 100.0 (34)Property and Casualty (n = 160) 37.5 (60) 43.3 (26) 30.0 (18) 23.3 (14) 1.7 (1) 1.7 (1) 100.0 (60)State Fire Marshal’s Office (n = 249) 43.4 (108) 49.1 (53) 39.8 (43) 10.2 (11) 0.9 (1) 0.0 (0) 100.0 (108)
*Weighted estimates

68
Table B-8b. The Agency’s Offi ces Are Conveniently Located
Responses
Program
GaveOpinion Percent (Count)
Strongly Agree
Percent (Count)
Agree Percent (Count)
Neutral Percent (Count)
Disagree Percent (Count)
Strongly Disagree Percent (Count)
TotalPercent (Count)
All Programs Combined* (n = 1,912) 44.3 (NA) 38.8 (NA) 25.2 (NA) 24.3 (NA) 6.5 (NA) 5.3 (NA) 100.0 (NA)Agent’s Licensing (n = 168) 39.3 (66) 47.0 (31) 25.8 (17) 22.7 (15) 1.5 (1) 3.0 (2) 100.0 (66)Consumer Protection (n = 242) 26.4 (64) 32.8 (21) 10.9 (7) 32.8 (21) 10.9 (7) 12.5 (8) 100.0 (64)Division of Workers’ Compensation (DWC)* (n = 482) 56.9 (NA) 35.2 (NA) 25.8 (NA) 23.4 (NA) 9.1 (NA) 6.5 (NA) 100.0 (NA)
DWC Carriers (n = 96) 22.9 (22) 27.3 (6) 45.5 (10) 22.7 (5) 4.5 (1) 0.0 (0) 100.0 (22) DWC Employers (n = 115) 37.4 (43) 34.9 (15) 32.6 (14) 30.2 (13) 2.3 (1) 0.0 (0) 100.0 (43) DWC Health Care Providers (n = 115) 53.0 (61) 32.8 (20) 34.4 (21) 21.3 (13) 6.6 (4) 4.9 (3) 100.0 (61) DWC Injured Employees (n = 156) 68.6 (107) 35.5 (38) 21.5 (23) 19.6 (21) 13.1 (14) 10.3 (11) 100.0 (107)Enforcement (n = 15)2 40.0 (6) 16.7 (1) 16.7 (1) 50.0 (3) 0.0 (0) 16.7 (1) 100.0 (6)Financial (n = 217) 34.1 (74) 33.8 (25) 40.5 (30) 23.0 (17) 1.4 (1) 1.4 (1) 100.0 (74)Fraud (n = 140) 56.4 (79) 25.3 (20) 36.7 (29) 16.5 (13) 16.5 (13) 5.1 (4) 100.0 (79)Life and Health (n = 239) 8.8 (21) 47.6 (10) 42.9 (9) 9.5 (2) 0.0 (0) 0.0 (0) 100.0 (21)Property and Casualty (n = 160) 33.8 (54) 38.9 (21) 24.1 (13) 25.9 (14) 7.4 (4) 3.7 (2) 100.0 (54)State Fire Marshal’s Office (n = 249) 39.8 (99) 36.4 (36) 42.4 (42) 19.2 (19) 2.0 (2) 0.0 (0) 100.0 (99)
*Weighted estimates

69
Table B-8c. The Agency’s Offi ces Are Clearly Iden fi ed With Signs
Responses
Program
GaveOpinion Percent (Count)
Strongly Agree
Percent (Count)
Agree Percent (Count)
Neutral Percent (Count)
Disagree Percent (Count)
Strongly Disagree Percent (Count)
TotalPercent (Count)
All Programs Combined* (n = 1,912) 41.4 (NA) 39.6 (NA) 27.6 (NA) 21.7 (NA) 4.9 (NA) 6.2 (NA) 100.0 (NA)Agent’s Licensing (n = 168) 36.9 (62) 46.8 (29) 29.0 (18) 21.0 (13) 0.0 (0) 3.2 (2) 100.0 (62)Consumer Protection (n = 242) 24.8 (60) 41.7 (25) 13.3 (8) 23.3 (14) 8.3 (5) 13.3 (8) 100.0 (60)Division of Workers’ Compensation (DWC)* (n = 482) 53.8 (NA) 37.1 (NA) 27.5 (NA) 19.2 (NA) 7.5 (NA) 8.7 (NA) 100.0 (NA)
DWC Carriers (n = 96) 21.9 (21) 28.6 (6) 42.9 (9) 23.8 (5) 4.8 (1) 0.0 (0) 100.0 (21) DWC Employers (n = 115) 35.7 (41) 36.6 (15) 39.0 (16) 19.5 (8) 4.9 (2) 0.0 (0) 100.0 (41) DWC Health Care Providers (n = 115) 49.6 (57) 35.1 (20) 19.3 (11) 28.1 (16) 12.3 (7) 5.3 (3) 100.0 (57) DWC Injured Employees (n = 156) 64.7 (101) 37.6 (38) 20.8 (21) 18.8 (19) 8.9 (9) 13.9 (14) 100.0 (101)Enforcement (n = 15)2 40.0 (6) 16.7 (1) 16.7 (1) 50.0 (3) 0.0 (0) 16.7 (1) 100.0 (6)Financial (n = 217) 32.3 (70) 31.4 (22) 38.6 (27) 28.6 (20) 0.0 (0) 1.4 (1) 100.0 (70)Fraud (n = 140) 52.9 (74) 27.0 (20) 39.2 (29) 16.2 (12) 14.9 (11) 2.7 (2) 100.0 (74)Life and Health (n = 239) 8.4 (20) 50.0 (10) 35.0 (7) 15.0 (3) 0.0 (0) 0.0 (0) 100.0 (20)Property and Casualty (n = 160) 29.4 (47) 31.9 (15) 29.8 (14) 29.8 (14) 6.4 (3) 2.1 (1) 100.0 (47)State Fire Marshal’s Office (n = 249) 35.7 (89) 42.7 (38) 40.4 (36) 15.7 (14) 1.1 (1) 0.0 (0) 100.0 (89)
*Weighted estimates

70
Table B-8d. The Agency’s Offi ces Are Clean
Responses
Program
GaveOpinion Percent (Count)
Strongly Agree
Percent (Count)
Agree Percent (Count)
Neutral Percent (Count)
Disagree Percent (Count)
Strongly Disagree Percent (Count)
TotalPercent (Count)
All Programs Combined* (n = 1,912) 39.8 (NA) 44.9 (NA) 29.0 (NA) 21.8 (NA) 0.9 (NA) 3.5 (NA) 100.0 (NA)Agent’s Licensing (n = 168) 35.7 (60) 51.7 (31) 26.7 (16) 18.3 (11) 0.0 (0) 3.3 (2) 100.0 (60)Consumer Protection (n = 242) 20.7 (50) 52.0 (26) 12.0 (6) 28.0 (14) 2.0 (1) 6.0 (3) 100.0 (50)Division of Workers’ Compensation (DWC)* (n = 482) 51.9 (NA) 41.2 (NA) 31.0 (NA) 22.9 (NA) 0.7 (NA) 4.1 (NA) 100.0 (NA)
DWC Carriers (n = 96) 21.9 (21) 42.9 (9) 38.1 (8) 14.3 (3) 4.8 (1) 0.0 (0) 100.0 (21) DWC Employers (n = 115) 34.8 (40) 37.5 (15) 32.5 (13) 27.5 (11) 0.0 (0) 2.5 (1) 100.0 (40) DWC Health Care Providers (n = 115) 46.1 (53) 39.6 (21) 41.5 (22) 15.1 (8) 3.8 (2) 0.0 (0) 100.0 (53) DWC Injured Employees (n = 156) 62.2 (97) 43.3 (42) 29.9 (29) 20.6 (20) 1.0 (1) 5.2 (5) 100.0 (97)Enforcement (n = 15)2 33.3 (5) 20.0 (1) 40.0 (2) 40.0 (2) 0.0 (0) 0.0 (0) 100.0 (5)Financial (n = 217) 32.3 (70) 32.9 (23) 38.6 (27) 25.7 (18) 2.9 (2) 0.0 (0) 100.0 (70)Fraud (n = 140) 51.4 (72) 30.6 (22) 54.2 (39) 9.7 (7) 4.2 (3) 1.4 (1) 100.0 (72)Life and Health (n = 239) 7.9 (19) 47.4 (9) 42.1 (8) 10.5 (2) 0.0 (0) 0.0 (0) 100.0 (19)Property and Casualty (n = 160) 29.4 (47) 38.3 (18) 34.0 (16) 23.4 (11) 2.1 (1) 2.1 (1) 100.0 (47)State Fire Marshal’s Office (n = 249) 34.1 (85) 49.4 (42) 36.5 (31) 14.1 (12) 0.0 (0) 0.0 (0) 100.0 (85)
*Weighted estimates

71
Table B-9. Publica ons and Printed Informa on - Composite
Responses
Program
GaveOpinion Percent
Strongly Agree
Percent Agree
Percent Neutral Percent
Disagree Percent
Strongly Disagree Percent
Total Percent
All Programs Combined* (n = 1,912) 64.2 39.8 34.2 19.2 3.4 3.4 100.0Agent’s Licensing (n = 168) 61.3 42.5 40.4 13.4 1.9 1.7 100.0Consumer Protection (n = 242) 41.2 39.4 23.7 21.9 5.2 9.8 100.0Division of Workers’ Compensation (DWC)* (n = 482) 75.9 38.1 30.9 23.1 4.0 3.9 100.0
DWC Carriers (n = 96) 75.4 26.5 47.5 25.7 0.3 0.0 100.0 DWC Employers (n = 115) 73.9 29.9 44.5 24.7 0.7 0.2 100.0 DWC Health Care Providers (n = 115) 70.8 35.4 36.9 21.6 4.2 2.0 100.0 DWC Injured Employees (n = 156) 77.2 43.0 22.8 22.1 6.0 6.1 100.0Enforcement (n = 15)2 60.0 17.8 42.2 35.6 2.2 2.2 100.0Financial (n = 217) 59.1 28.5 48.5 18.9 2.5 1.6 100.0Fraud (n = 140) 70.6 33.8 49.0 14.4 1.8 1.0 100.0Life and Health (n = 239) 41.6 37.6 39.4 21.3 0.8 0.8 100.0Property and Casualty (n = 160) 54.0 40.5 33.3 19.4 4.4 2.3 100.0State Fire Marshal’s Office (n = 249) 60.7 44.2 44.0 11.4 0.4 0.0 100.0
*Weighted estimates

72
Table B-9a. The Agency’s Printed Informa on Is Accurate
Responses
Program
GaveOpinion Percent (Count)
Strongly Agree
Percent (Count)
Agree Percent (Count)
Neutral Percent (Count)
Disagree Percent (Count)
Strongly Disagree Percent (Count)
TotalPercent (Count)
All Programs Combined* (n = 1,912) 64.6 (NA) 41.9 (NA) 34.9 (NA) 17.6 (NA) 2.6 (NA) 3.0 (NA) 100.0 (NA)Agent’s Licensing (n = 168) 62.5 (105) 43.8 (46) 41.9 (44) 10.5 (11) 2.9 (3) 1.0 (1) 100.0 (105)Consumer Protection (n = 242) 42.1 (102) 39.2 (40) 27.5 (28) 19.6 (20) 3.9 (4) 9.8 (10) 100.0 (102)Division of Workers’ Compensation (DWC)* (n = 482) 75.8 (NA) 40.6 (NA) 30.9 (NA) 23.3 (NA) 1.6 (NA) 3.7 (NA) 100.0 (NA)
DWC Carriers (n = 96) 76.0 (73) 34.2 (25) 47.9 (35) 17.8 (13) 0.0 (0) 0.0 (0) 100.0 (73) DWC Employers (n = 115) 73.9 (85) 32.9 (28) 43.5 (37) 23.5 (20) 0.0 (0) 0.0 (0) 100.0 (85) DWC Health Care Providers (n = 115) 70.4 (81) 42.0 (34) 34.6 (28) 19.8 (16) 2.5 (2) 1.2 (1) 100.0 (81) DWC Injured Employees (n = 156) 76.9 (120) 45.0 (54) 23.3 (28) 23.3 (28) 2.5 (3) 5.8 (7) 100.0 (120)Enforcement (n = 15)2 60.0 (9) 11.1 (1) 55.6 (5) 33.3 (3) 0.0 (0) 0.0 (0) 100.0 (9)Financial (n = 217) 59.4 (129) 34.1 (44) 48.8 (63) 14.0 (18) 2.3 (3) 0.8 (1) 100.0 (129)Fraud (n = 140) 70.7 (99) 34.3 (34) 48.5 (48) 14.1 (14) 2.0 (2) 1.0 (1) 100.0 (99)Life and Health (n = 239) 41.0 (98) 40.8 (40) 39.8 (39) 17.3 (17) 1.0 (1) 1.0 (1) 100.0 (98)Property and Casualty (n = 160) 54.4 (87) 44.8 (39) 32.2 (28) 16.1 (14) 4.6 (4) 2.3 (2) 100.0 (87)State Fire Marshal’s Office (n = 249) 61.0 (152) 44.7 (68) 45.4 (69) 9.2 (14) 0.7 (1) 0.0 (0) 100.0 (152)
*Weighted estimates

73
Table B-9b. The Agency’s Printed Informa on Is Understandable
Responses
Program
GaveOpinion Percent (Count)
Strongly Agree
Percent (Count)
Agree Percent (Count)
Neutral Percent (Count)
Disagree Percent (Count)
Strongly Disagree Percent (Count)
TotalPercent (Count)
All Programs Combined* (n = 1,912) 65.5 (NA) 41.0 (NA) 34.1 (NA) 16.7 (NA) 4.4 (NA) 3.7 (NA) 100.0 (NA)Agent’s Licensing (n = 168) 61.3 (103) 43.7 (45) 40.8 (42) 11.7 (12) 1.9 (2) 1.9 (2) 100.0 (103)Consumer Protection (n = 242) 43.4 (105) 38.1 (40) 27.6 (29) 16.2 (17) 7.6 (8) 10.5 (11) 100.0 (105)Division of Workers’ Compensation (DWC)* (n = 482) 77.7 (NA) 39.2 (NA) 30.0 (NA) 20.9 (NA) 5.5 (NA) 4.5 (NA) 100.0 (NA)
DWC Carriers (n = 96) 78.1 (75) 28.0 (21) 46.7 (35) 25.3 (19) 0.0 (0) 0.0 (0) 100.0 (75) DWC Employers (n = 115) 74.8 (86) 29.1 (25) 46.5 (40) 22.1 (19) 1.2 (1) 1.2 (1) 100.0 (86) DWC Health Care Providers (n = 115) 71.3 (82) 35.4 (29) 41.5 (34) 19.5 (16) 2.4 (2) 1.2 (1) 100.0 (82) DWC Injured Employees (n = 156) 79.5 (124) 45.2 (56) 20.2 (25) 20.2 (25) 8.1 (10) 6.5 (8) 100.0 (124)Enforcement (n = 15)2 60.0 (9) 22.2 (2) 44.4 (4) 22.2 (2) 11.1 (1) 0.0 (0) 100.0 (9)Financial (n = 217) 60.4 (131) 28.2 (37) 48.1 (63) 17.6 (23) 3.8 (5) 2.3 (3) 100.0 (131)Fraud (n = 140) 70.7 (99) 35.4 (35) 48.5 (48) 13.1 (13) 2.0 (2) 1.0 (1) 100.0 (99)Life and Health (n = 239) 43.5 (104) 39.4 (41) 40.4 (42) 18.3 (19) 1.0 (1) 1.0 (1) 100.0 (104)Property and Casualty (n = 160) 55.6 (89) 43.8 (39) 31.5 (28) 16.9 (15) 5.6 (5) 2.2 (2) 100.0 (89)State Fire Marshal’s Office (n = 249) 61.8 (154) 44.2 (68) 46.1 (71) 9.7 (15) 0.0 (0) 0.0 (0) 100.0 (154)
*Weighted estimates

74
Table B-9c. The Agency’s Printed Informa on Is Useful
Responses
Program
GaveOpinion Percent (Count)
Strongly Agree
Percent (Count)
Agree Percent (Count)
Neutral Percent (Count)
Disagree Percent (Count)
Strongly Disagree Percent (Count)
TotalPercent (Count)
All Programs Combined* (n = 1,912) 64.4 (NA) 40.5 (NA) 34.1 (NA) 18.3 (NA) 3.4 (NA) 3.8 (NA) 100.0 (NA)Agent’s Licensing (n = 168) 61.3 (103) 45.6 (47) 38.8 (40) 11.7 (12) 1.9 (2) 1.9 (2) 100.0 (103)Consumer Protection (n = 242) 41.7 (101) 40.6 (41) 22.8 (23) 22.8 (23) 4.0 (4) 9.9 (10) 100.0 (101)Division of Workers’ Compensation (DWC)* (n = 482) 75.8 (NA) 37.1 (NA) 32.3 (NA) 21.2 (NA) 4.6 (NA) 4.7 (NA) 100.0 (NA)
DWC Carriers (n = 96) 77.1 (74) 31.1 (23) 40.5 (30) 27.0 (20) 1.4 (1) 0.0 (0) 100.0 (74) DWC Employers (n = 115) 73.9 (85) 29.4 (25) 44.7 (38) 24.7 (21) 1.2 (1) 0.0 (0) 100.0 (85) DWC Health Care Providers (n = 115) 72.2 (83) 32.5 (27) 43.4 (36) 16.9 (14) 4.8 (4) 2.4 (2) 100.0 (83) DWC Injured Employees (n = 156) 76.9 (120) 41.7 (50) 25.0 (30) 19.2 (23) 6.7 (8) 7.5 (9) 100.0 (120)Enforcement (n = 15)2 60.0 (9) 22.2 (2) 55.6 (5) 22.2 (2) 0.0 (0) 0.0 (0) 100.0 (9)Financial (n = 217) 60.4 (131) 29.0 (38) 49.6 (65) 18.3 (24) 1.5 (2) 1.5 (2) 100.0 (131)Fraud (n = 140) 70.7 (99) 33.3 (33) 50.5 (50) 14.1 (14) 1.0 (1) 1.0 (1) 100.0 (99)Life and Health (n = 239) 42.3 (101) 37.6 (38) 37.6 (38) 23.8 (24) 0.0 (0) 1.0 (1) 100.0 (101)Property and Casualty (n = 160) 55.0 (88) 40.9 (36) 31.8 (28) 21.6 (19) 3.4 (3) 2.3 (2) 100.0 (88)State Fire Marshal’s Office (n = 249) 61.0 (152) 44.7 (68) 42.8 (65) 11.8 (18) 0.7 (1) 0.0 (0) 100.0 (152)
*Weighted estimates

75
Table B-9d. The Agency’s Printed Informa on Is Well-Designed
Responses
Program
GaveOpinion Percent (Count)
Strongly Agree
Percent (Count)
Agree Percent (Count)
Neutral Percent (Count)
Disagree Percent (Count)
Strongly Disagree Percent (Count)
TotalPercent (Count)
All Programs Combined* (n = 1,912) 63.8 (NA) 38.4 (NA) 32.7 (NA) 21.7 (NA) 3.9 (NA) 3.2 (NA) 100.0 (NA)Agent’s Licensing (n = 168) 61.3 (103) 39.8 (41) 37.9 (39) 17.5 (18) 2.9 (3) 1.9 (2) 100.0 (103)Consumer Protection (n = 242) 40.1 (97) 40.2 (39) 20.6 (20) 24.7 (24) 4.1 (4) 10.3 (10) 100.0 (97)Division of Workers’ Compensation (DWC)* (n = 482) 75.4 (NA) 37.7 (NA) 29.9 (NA) 24.0 (NA) 5.2 (NA) 3.2 (NA) 100.0 (NA)
DWC Carriers (n = 96) 74.0 (71) 16.9 (12) 50.7 (36) 32.4 (23) 0.0 (0) 0.0 (0) 100.0 (71) DWC Employers (n = 115) 73.9 (85) 29.4 (25) 43.5 (37) 25.9 (22) 1.2 (1) 0.0 (0) 100.0 (85) DWC Health Care Providers (n = 115) 70.4 (81) 33.3 (27) 30.9 (25) 27.2 (22) 7.4 (6) 1.2 (1) 100.0 (81) DWC Injured Employees (n = 156) 76.3 (119) 42.9 (51) 21.8 (26) 22.7 (27) 7.6 (9) 5.0 (6) 100.0 (119)Enforcement (n = 15)2 60.0 (9) 22.2 (2) 22.2 (2) 44.4 (4) 0.0 (0) 11.1 (1) 100.0 (9)Financial (n = 217) 58.1 (126) 26.2 (33) 46.8 (59) 22.2 (28) 2.4 (3) 2.4 (3) 100.0 (126)Fraud (n = 140) 70.7 (99) 32.3 (32) 48.5 (48) 16.2 (16) 2.0 (2) 1.0 (1) 100.0 (99)Life and Health (n = 239) 42.3 (101) 34.7 (35) 40.6 (41) 22.8 (23) 1.0 (1) 1.0 (1) 100.0 (101)Property and Casualty (n = 160) 53.8 (86) 37.2 (32) 33.7 (29) 23.3 (20) 3.5 (3) 2.3 (2) 100.0 (86)State Fire Marshal’s Office (n = 249) 60.2 (150) 43.3 (65) 42.0 (63) 14.0 (21) 0.7 (1) 0.0 (0) 100.0 (150)
*Weighted estimates

76
Table B-9e. The Agency’s Printed Informa on Is Interes ng Given the Topic
Responses
Program
GaveOpinion Percent (Count)
Strongly Agree
Percent (Count)
Agree Percent (Count)
Neutral Percent (Count)
Disagree Percent (Count)
Strongly Disagree Percent (Count)
TotalPercent (Count)
All Programs Combined* (n = 1,912) 62.8 (NA) 37.2 (NA) 35.1 (NA) 21.8 (NA) 2.7 (NA) 3.3 (NA) 100.0 (NA)Agent’s Licensing (n = 168) 60.1 (101) 39.6 (40) 42.6 (43) 15.8 (16) 0.0 (0) 2.0 (2) 100.0 (101)Consumer Protection (n = 242) 38.4 (93) 38.7 (36) 19.4 (18) 26.9 (25) 6.5 (6) 8.6 (8) 100.0 (93)Division of Workers’ Compensation (DWC)* (n = 482) 75.0 (NA) 35.9 (NA) 31.2 (NA) 26.0 (NA) 3.2 (NA) 3.7 (NA) 100.0 (NA)
DWC Carriers (n = 96) 71.9 (69) 21.7 (15) 52.2 (36) 26.1 (18) 0.0 (0) 0.0 (0) 100.0 (69) DWC Employers (n = 115) 73.0 (84) 28.6 (24) 44.0 (37) 27.4 (23) 0.0 (0) 0.0 (0) 100.0 (84) DWC Health Care Providers (n = 115) 69.6 (80) 33.8 (27) 33.8 (27) 25.0 (20) 3.8 (3) 3.8 (3) 100.0 (80) DWC Injured Employees (n = 156) 76.3 (119) 40.3 (48) 23.5 (28) 25.2 (30) 5.0 (6) 5.9 (7) 100.0 (119)Enforcement (n = 15)2 60.0 (9) 11.1 (1) 33.3 (3) 55.6 (5) 0.0 (0) 0.0 (0) 100.0 (9)Financial (n = 217) 57.1 (124) 25.0 (31) 49.2 (61) 22.6 (28) 2.4 (3) 0.8 (1) 100.0 (124)Fraud (n = 140) 70.0 (98) 33.7 (33) 49.0 (48) 14.3 (14) 2.0 (2) 1.0 (1) 100.0 (98)Life and Health (n = 239) 38.9 (93) 35.5 (33) 38.7 (36) 24.7 (23) 1.1 (1) 0.0 (0) 100.0 (93)Property and Casualty (n = 160) 51.3 (82) 35.4 (29) 37.8 (31) 19.5 (16) 4.9 (4) 2.4 (2) 100.0 (82)State Fire Marshal’s Office (n = 249) 59.4 (148) 43.9 (65) 43.9 (65) 12.2 (18) 0.0 (0) 0.0 (0) 100.0 (148)
*Weighted estimates

77
Table B-10. Overall Sa sfac on With the Agency
Responses
Program
GaveOpinion Percent (Count)
VerySa sfi ed Percent (Count)
Sa sfi ed Percent (Count)
Neutral Percent (Count)
Dissa sfi ed Percent (Count)
Very Dissa sfi ed
Percent (Count)
TotalPercent (Count)
All Programs Combined* (n = 1,912) 93.9 (NA) 36.7 (NA) 34.5 (NA) 15.0 (NA) 6.2 (NA) 7.6 (NA) 100.0 (NA)Agent’s Licensing (n = 168) 93.5 (157) 42.0 (66) 39.5 (62) 9.6 (15) 6.4 (10) 2.5 (4) 100.0 (157)Consumer Protection (n = 242) 92.6 (224) 31.7 (71) 26.8 (60) 11.2 (25) 12.1 (27) 18.3 (41) 100.0 (224)Division of Workers’ Compensation (DWC)* (n = 482) 94.5 (NA) 33.2 (NA) 30.5 (NA) 19.6 (NA) 5.5 (NA) 11.2 (NA) 100.0 (NA)
DWC Carriers (n = 96) 97.9 (94) 24.5 (23) 47.9 (45) 25.5 (24) 2.1 (2) 0.0 (0) 100.0 (94) DWC Employers (n = 115) 94.8 (109) 32.1 (35) 44.0 (48) 20.2 (22) 0.9 (1) 2.8 (3) 100.0 (109) DWC Health Care Providers (n = 115) 93.9 (108) 26.9 (29) 36.1 (39) 26.9 (29) 5.6 (6) 4.6 (5) 100.0 (108) DWC Injured Employees (n = 156) 94.2 (147) 34.0 (50) 22.4 (33) 19.0 (28) 8.2 (12) 16.3 (24) 100.0 (147)Enforcement (n = 15)2 100.0 (15) 20.0 (3) 40.0 (6) 20.0 (3) 6.7 (1) 13.3 (2) 100.0 (15)Financial (n = 217) 97.7 (212) 34.0 (72) 47.6 (101) 14.2 (30) 1.4 (3) 2.8 (6) 100.0 (212)Fraud (n = 140) 95.0 (133) 27.8 (37) 46.6 (62) 14.3 (19) 6.8 (9) 4.5 (6) 100.0 (133)Life and Health (n = 239) 97.1 (232) 36.2 (84) 54.3 (126) 8.2 (19) 1.3 (3) 0.0 (0) 100.0 (232)Property and Casualty (n = 160) 92.5 (148) 37.8 (56) 35.8 (53) 17.6 (26) 6.1 (9) 2.7 (4) 100.0 (148)State Fire Marshal’s Office (n = 249) 96.4 (240) 47.9 (115) 42.5 (102) 7.1 (17) 2.1 (5) 0.4 (1) 100.0 (240)
*Weighted estimates

78
Table B-13. Sa sfac on With Regard to Primary Reason for Contac ng the Agency
Responses
Program
GaveOpinion Percent (Count)
VerySa sfi ed Percent (Count)
Sa sfi ed Percent (Count)
Neutral Percent (Count)
Dissa sfi ed Percent (Count)
Very Dissa sfi ed
Percent (Count)
TotalPercent (Count)
All Programs Combined* (n = 1,912) 88.8 (NA) 40.7 (NA) 29.6 (NA) 14.3 (NA) 6.0 (NA) 9.3 (NA) 100.0 (NA)Agent’s Licensing (n = 168) 89.3 (150) 47.3 (71) 34.0 (51) 11.3 (17) 3.3 (5) 4.0 (6) 100.0 (150)Consumer Protection (n = 242) 91.3 (221) 29.9 (66) 24.0 (53) 12.2 (27) 9.0 (20) 24.9 (55) 100.0 (221)Division of Workers’ Compensation (DWC)* (n = 482) 86.8 (NA) 35.4 (NA) 25.9 (NA) 18.4 (NA) 7.8 (NA) 12.5 (NA) 100.0 (NA)
DWC Carriers (n = 96) 77.1 (74) 36.5 (27) 39.2 (29) 23.0 (17) 1.4 (1) 0.0 (0) 100.0 (74) DWC Employers (n = 115) 76.5 (88) 40.9 (36) 31.8 (28) 22.7 (20) 1.1 (1) 3.4 (3) 100.0 (88) DWC Health Care Providers (n = 115) 76.5 (88) 30.7 (27) 35.2 (31) 20.5 (18) 6.8 (6) 6.8 (6) 100.0 (88) DWC Injured Employees (n = 156) 92.9 (145) 32.4 (47) 22.1 (32) 15.9 (23) 11.7 (17) 17.9 (26) 100.0 (145)Enforcement (n = 15)2 100.0 (15) 13.3 (2) 53.3 (8) 13.3 (2) 0.0 (0) 20.0 (3) 100.0 (15)Financial (n = 217) 95.4 (207) 43.0 (89) 40.1 (83) 11.6 (24) 4.3 (9) 1.0 (2) 100.0 (207)Fraud (n = 140) 92.9 (130) 33.8 (44) 37.7 (49) 14.6 (19) 9.2 (12) 4.6 (6) 100.0 (130)Life and Health (n = 239) 93.3 (223) 46.6 (104) 46.2 (103) 5.8 (13) 1.3 (3) 0.0 (0) 100.0 (223)Property and Casualty (n = 160) 90.6 (145) 46.2 (67) 31.7 (46) 12.4 (18) 5.5 (8) 4.1 (6) 100.0 (145)State Fire Marshal’s Office (n = 249) 89.6 (223) 57.8 (129) 32.7 (73) 7.2 (16) 1.8 (4) 0.4 (1) 100.0 (223)
*Weighted estimates

79
Appendix C.Graphical Summary of Survey Results by Program

81
Appendix C-1. Customers’ Sa sfac on: All Programs Combined*
71
74
72
70
70
69
66
15
14
19
17
17
20
2
17
17
14
7
7
12
13
10
9
14
18
Overall (94% gave opinion)
Staff (86% gave opinion)
Publications (64% gave opinion)
Telephone Communication (77% gave opinion)
Timeliness of Service (61% gave opinion)
Internet Sites (66% gave opinion)
Offices (43% gave opinion)
Handling of Complaints About TDI (6 % gave opinion)
Handling of Complaints About Regulated Entities (61% gave opinion)
% Satisfied % Neutral % Dissatisfied
*Weighted estimates
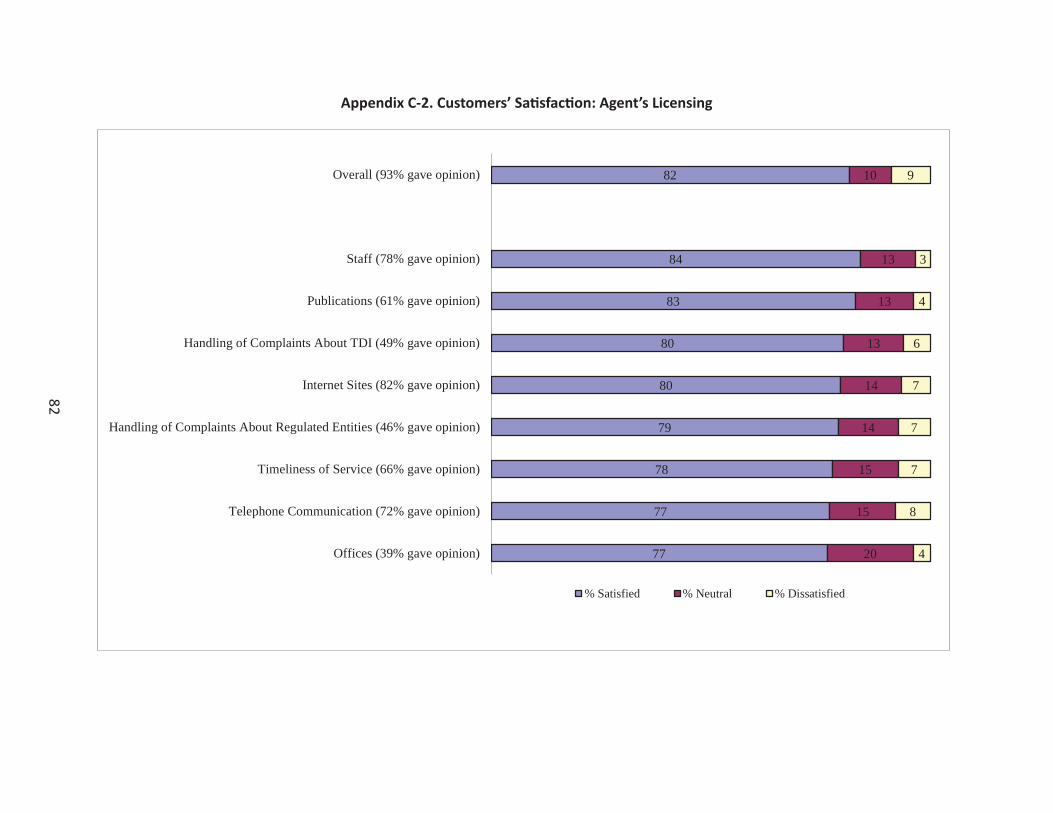
82
Appendix C-2. Customers’ Sa sfac on: Agent’s Licensing
82
84
83
80
80
79
78
77
77
10
13
13
13
14
14
15
15
20
9
3
4
6
7
7
7
8
4
Overall (93% gave opinion)
Staff (78% gave opinion)
Publications (61% gave opinion)
Handling of Complaints About TDI (49% gave opinion)
Internet Sites (82% gave opinion)
Handling of Complaints About Regulated Entities (46% gave opinion)
Timeliness of Service (66% gave opinion)
Telephone Communication (72% gave opinion)
Offices (39% gave opinion)
% Satisfied % Neutral % Dissatisfied

83
Appendix C-3. Customers’ Sa sfac on: Consumer Protec on
58
77
72
71
68
63
62
58
56
11
12
12
18
16
22
18
24
13
30
11
16
11
17
15
20
18
31
Overall (93% gave opinion)
Staff (76% gave opinion)
Handling of Complaints About TDI (86% gave opinion)
Internet Sites (71% gave opinion)
Telephone Communication (60% gave opinion)
Publications (41% gave opinion)
Timeliness of Service (52% gave opinion)
Offices (26% gave opinion)
Handling of Complaints About Regulated Entities (84% gave opinion)
% Satisfied % Neutral % Dissatisfied

84
Appendix C-4. Customers’ Sa sfac on: Division of Workers’ Compensa on (DWC)*
64
73
69
66
63
63
63
60
58
20
17
23
21
18
20
23
19
18
17
10
8
12
18
16
14
21
24
Overall (94% gave opinion)
Staff (91% gave opinion)
Publications (76% gave opinion)
Offices (55% gave opinion)
Timeliness of Service (60% gave opinion)
Telephone Communication (84% gave opinion)
Internet Sites (52% gave opinion)
Handling of Complaints About TDI (71% gave opinion)
Handling of Complaints About Regulated Entities (73% gave opinion)
% Satisfied % Neutral % Dissatisfied
*Weighted estimates

85
Appendix C-5. Customers’ Sa sfac on: DWC Carriers
72
81
76
74
70
69
65
65
63
26
18
20
26
25
29
26
27
30
2
2
4
0
5
2
9
8
8
Overall (98% gave opinion)
Staff (90% gave opinion)
Offices (24% gave opinion)
Publications (75% gave opinion)
Telephone Communication (79% gave opinion)
Timeliness of Service (68% gave opinion)
Handling of Complaints About Regulated Entities (40% gave opinion)
Internet Sites (87% gave opinion)
Handling of Complaints About TDI (33% gave opinion)
% Satisfied % Neutral % Dissatisfied

86
Appendix C-6. Customers’ Sa sfac on: DWC Employers
76
83
74
74
74
73
72
71
69
20
15
25
22
20
22
25
22
23
4
2
1
4
6
5
3
7
9
Overall (95% gave opinion)
Staff (85% gave opinion)
Publications (74% gave opinion)
Timeliness of Service (56% gave opinion)
Internet Sites (70% gave opinion)
Telephone Communication (77% gave opinion)
Offices (38% gave opinion)
Handling of Complaints About TDI (58% gave opinion)
Handling of Complaints About Regulated Entities (57% gave opinion)
% Satisfied % Neutral % Dissatisfied
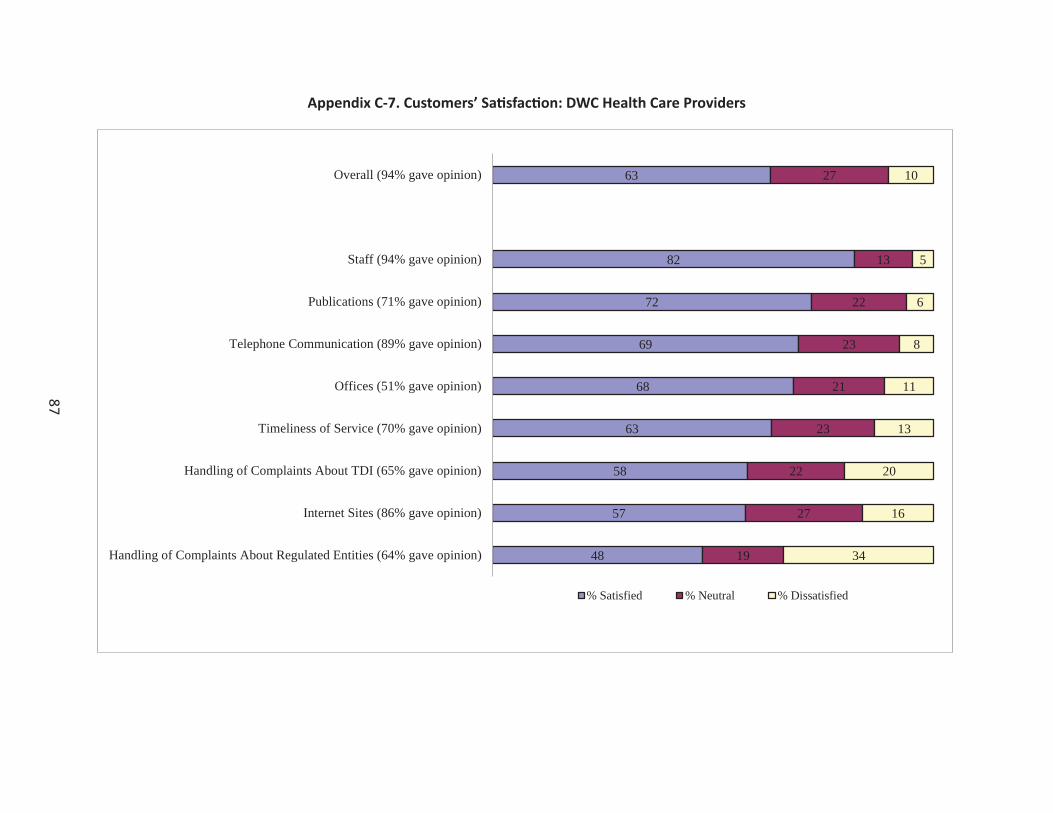
87
Appendix C-7. Customers’ Sa sfac on: DWC Health Care Providers
63
82
72
69
68
63
58
57
48
27
13
22
23
21
23
22
27
19
10
5
6
8
11
13
20
16
34
Overall (94% gave opinion)
Staff (94% gave opinion)
Publications (71% gave opinion)
Telephone Communication (89% gave opinion)
Offices (51% gave opinion)
Timeliness of Service (70% gave opinion)
Handling of Complaints About TDI (65% gave opinion)
Internet Sites (86% gave opinion)
Handling of Complaints About Regulated Entities (64% gave opinion)
% Satisfied % Neutral % Dissatisfied

88
Appendix C-8. Customers’ Sa sfac on: DWC Injured Employees
56
67
66
63
58
57
57
54
52
19
18
22
19
19
16
24
17
16
24
15
12
17
23
27
19
29
32
Overall (94% gave opinion)
Staff (94% gave opinion)
Publications (77% gave opinion)
Offices (66% gave opinion)
Telephone Communication (88% gave opinion)
Timeliness of Service (62% gave opinion)
Internet Sites (41% gave opinion)
Handling of Complaints About TDI (78% gave opinion)
Handling of Complaints About Regulated Entities (82% gave opinion)
% Satisfied % Neutral % Dissatisfied

89
Appendix C-9. Customers’ Sa sfac on: Enforcement2
60
63
60
54
48
48
42
39
20
34
24
31
36
33
46
39
20
3
16
15
16
19
13
22
Overall (100% gave opinion)
Staff (98% gave opinion)
Telephone Communication (96% gave opinion)
Internet Sites (78% gave opinion)
Timeliness of Service (77% gave opinion)
Handling of Complaints About TDI (90% gave opinion)
Offices (40% gave opinion)
Handling of Complaints About Regulated Entities (91% gave opinion)
% Satisfied % Neutral % Dissatisfied
60 3

90
Appendix C-10. Customers’ Sa sfac on: Financial
82
85
81
80
77
75
72
68
67
14
11
14
15
19
23
19
24
21
4
4
5
5
4
2
9
9
12
Overall (98% gave opinion)
Staff (93% gave opinion)
Timeliness of Service (71% gave opinion)
Telephone Communication (77% gave opinion)
Publications (59% gave opinion)
Offices (34% gave opinion)
Internet Sites (86% gave opinion)
Handling of Complaints About TDI (42% gave opinion)
Handling of Complaints About Regulated Entities (45% gave opinion)
% Satisfied % Neutral % Dissatisfied

91
Appendix C-11. Customers’ Sa sfac on: Fraud
74
85
83
80
79
77
75
71
64
14
12
14
14
12
17
18
14
21
11
3
3
6
9
6
7
15
15
Overall (95% gave opinion)
Staff (94% gave opinion)
Publications (71% gave opinion)
Telephone Communication (69% gave opinion)
Timeliness of Service (71% gave opinion)
Internet Sites (80% gave opinion)
Handling of Complaints About TDI (63% gave opinion)
Offices (56% gave opinion)
Handling of Complaints About Regulated Entities (65% gave opinion)
% Satisfied % Neutral % Dissatisfied
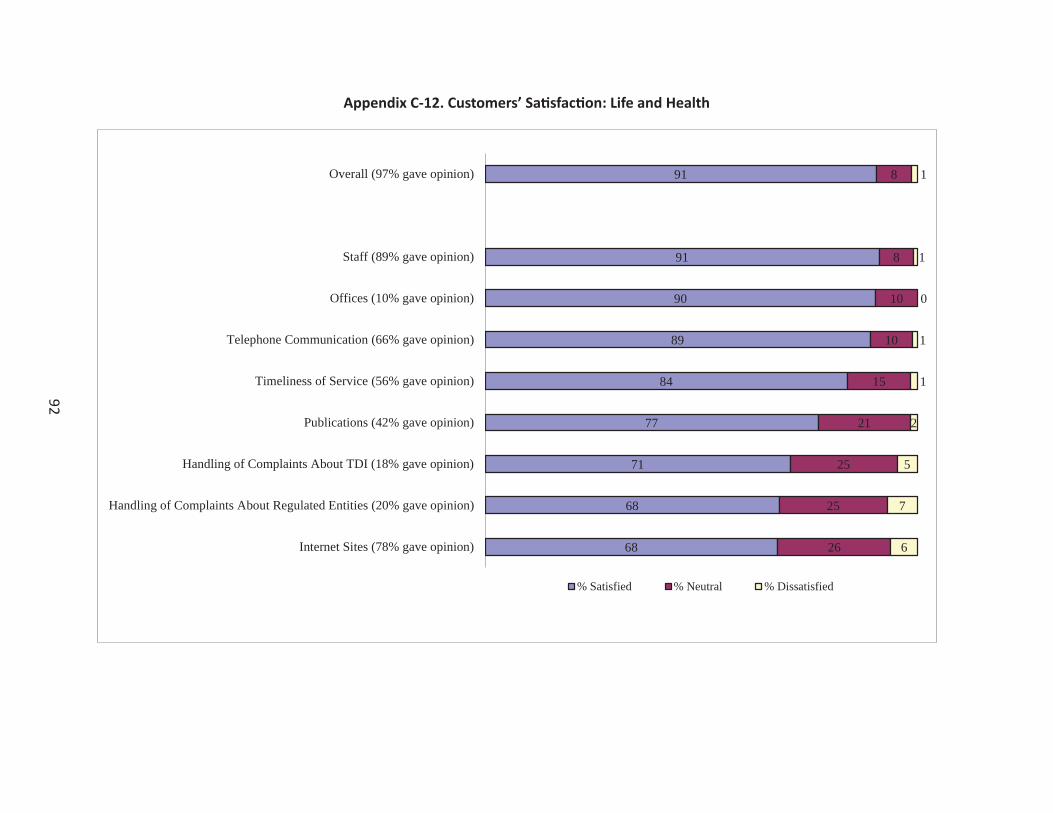
92
Appendix C-12. Customers’ Sa sfac on: Life and Health
91
91
90
89
84
77
71
68
68
8
8
10
10
15
21
25
25
26
1
1
0
1
1
2
5
7
6
Overall (97% gave opinion)
Staff (89% gave opinion)
Offices (10% gave opinion)
Telephone Communication (66% gave opinion)
Timeliness of Service (56% gave opinion)
Publications (42% gave opinion)
Handling of Complaints About TDI (18% gave opinion)
Handling of Complaints About Regulated Entities (20% gave opinion)
Internet Sites (78% gave opinion)
% Satisfied % Neutral % Dissatisfied
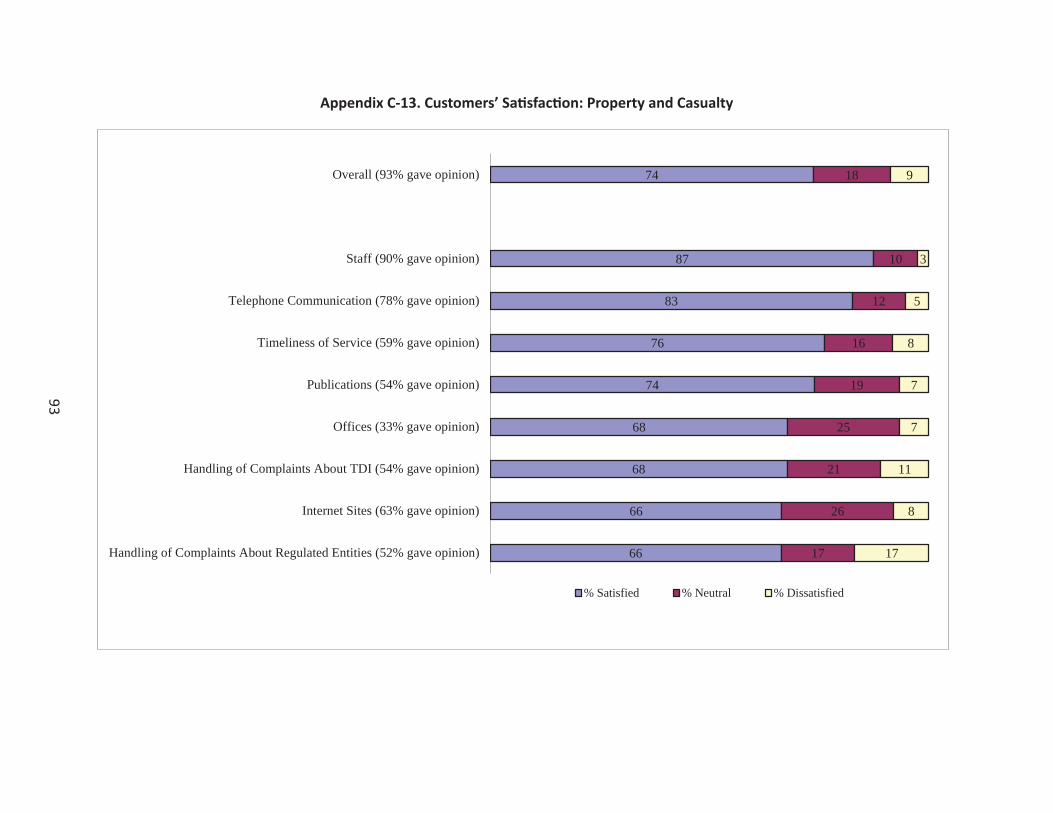
93
Appendix C-13. Customers’ Sa sfac on: Property and Casualty
74
87
83
76
74
68
68
66
66
18
10
12
16
19
25
21
26
17
9
3
5
8
7
7
11
8
17
Overall (93% gave opinion)
Staff (90% gave opinion)
Telephone Communication (78% gave opinion)
Timeliness of Service (59% gave opinion)
Publications (54% gave opinion)
Offices (33% gave opinion)
Handling of Complaints About TDI (54% gave opinion)
Internet Sites (63% gave opinion)
Handling of Complaints About Regulated Entities (52% gave opinion)
% Satisfied % Neutral % Dissatisfied

94
Appendix C-14. Customers’ Sa sfac on: State Fire Marshal’s Offi ce
90
93
88
87
87
84
82
79
76
7
7
11
12
11
15
13
16
18
3
1
0
1
3
1
5
5
6
Overall (96% gave opinion)
Staff (89% gave opinion)
Publications (61% gave opinion)
Timeliness of Service (63% gave opinion)
Telephone Communication (71% gave opinion)
Offices (38% gave opinion)
Handling of Complaints About TDI (40% gave opinion)
Internet Sites (74% gave opinion)
Handling of Complaints About Regulated Entities (38% gave opinion)
% Satisfied % Neutral % Dissatisfied

95
Appendix D.Survey Instrument

97
Texas Department of Insurance
Customer Satisfaction Survey
A Project of the Texas Legislative Council
The State of Texas expects its agencies and their employees to provide customers with quality services. Each
state agency is required to assess its customers’ satisfaction with the agency’s staff, complaint handling process,
telephone communication, Internet sites, timeliness of service, facilities, and printed information. Please
complete this survey with regard to your experience with the Texas Department of Insurance (TDI) or its
Division of Workers’ Compensation or its State Fire Marshal’s Office, and return it in the enclosed envelope.
Circle one number in each row. If you never had contact with the Texas Department of Insurance in the manner
described or if you do not have an opinion, circle “9”.
1. The Texas Department of Insurance’s staff ...
Strongly
Agree
Strongly
Disagree NA
are courteous............................................................... 5 4 3 2 1 9
are friendly.................................................................. 5 4 3 2 1 9
are knowledgeable about services offered by TDI...... 5 4 3 2 1 9
identify themselves by stating their names or using
name tags or plates...................................................... 5 4 3 2 1 9

98
2. When handling complaints, the Texas Department of Insurance ...
Strongly
Agree
Strongly
Disagree NA
provides an easy method for customers to file the
complaints about TDI’s service. ................................. 5 4 3 2 1 9
responds to complaints about TDI’s service in a
timely manner. ............................................................ 5 4 3 2 1 9
handles complaints against insurers or regulated
entities effectively....................................................... 5 4 3 2 1 9
provides updates on the progress of insurance-
related complaints. ...................................................... 5 4 3 2 1 9
provides notification of the outcome of insurance-
related complaints. ...................................................... 5 4 3 2 1 9
3. For telephone communications, rate your level of satisfaction with ...
Very
Satisfied
Very
Dissatisfied NA
toll-free telephone access to TDI. ............................... 5 4 3 2 1 9
your ability to access a customer service
representative when calling TDI’s toll-free line. ........ 5 4 3 2 1 9
the amount of time you are placed on hold................. 5 4 3 2 1 9
the number of call transfers you experience. .............. 5 4 3 2 1 9
the timeliness of TDI returning your calls. ................. 5 4 3 2 1 9

99
4. During telephone conversations, the Texas Department of Insurance’s staff ...
Strongly
Agree
Strongly
Disagree NA
provide accurate information. ..................................... 5 4 3 2 1 9
provide understandable information. .......................... 5 4 3 2 1 9
provide helpful information. ....................................... 5 4 3 2 1 9
are friendly and helpful............................................... 5 4 3 2 1 9
The Texas Department of Insurance maintains the following Internet sites: www.tdi.state.tx.us,
www.helpinsure.com, www.texashealthoptions.com, www.texassure.com, and www.haveanexitstrategy.com.
5. TDI’s Internet sites ...
Strongly
Agree
Strongly
Disagree NA
are easy to use............................................................. 5 4 3 2 1 9
clearly explain services offered by TDI...................... 5 4 3 2 1 9
provide accurate information. ..................................... 5 4 3 2 1 9
provide useful information.......................................... 5 4 3 2 1 9
have easy-to-use search features................................. 5 4 3 2 1 9
have helpful search features........................................ 5 4 3 2 1 9

100
6. It is easy to find a list of ...
Strongly
Agree
Strongly
Disagree NA
office locations on TDI’s Internet sites....................... 5 4 3 2 1 9
contact persons on TDI’s Internet sites....................... 5 4 3 2 1 9
7. Rate your level of satisfaction with the timeliness of service you receive from the Texas Department of
Insurance ...
Very
Satisfied
Very
Dissatisfied NA
in person. .................................................................... 5 4 3 2 1 9
by telephone................................................................ 5 4 3 2 1 9
by mail. ....................................................................... 5 4 3 2 1 9
by e-mail. .................................................................... 5 4 3 2 1 9
through TDI’s Internet sites. ....................................... 5 4 3 2 1 9
8. The Texas Department of Insurance’s offices are ...
Strongly
Agree
Strongly
Disagree NA
accessible. ................................................................... 5 4 3 2 1 9
conveniently located. .................................................. 5 4 3 2 1 9
clearly identified with signs. ....................................... 5 4 3 2 1 9
clean............................................................................ 5 4 3 2 1 9

101
9. The Texas Department of Insurance’s brochures, publications, and other printed information are ...
Strongly
Agree
Strongly
Disagree NA
accurate. ...................................................................... 5 4 3 2 1 9
understandable. ........................................................... 5 4 3 2 1 9
useful. ......................................................................... 5 4 3 2 1 9
well-designed.............................................................. 5 4 3 2 1 9
interesting given the topic........................................... 5 4 3 2 1 9
10. Rate your overall level of satisfaction with the Texas Department of Insurance.
Very
Satisfied
Very
Dissatisfied NA
5 4 3 2 1 9
11. Check the box that best describes you.
Agent / Adjuster Law Enforcement Entity
Consumer Open Records Requestor
Employer State Fire Marshal’s Office Customer
Health Care Provider Workers’ Compensation Carrier
Injured Employee Workers’ Compensation Health Care Network
Insurance Industry Representative Other; describe: ______________________

102
12. Indicate the primary reason you contacted the Texas Department of Insurance.
13. With regard to your primary reason for contacting the Texas Department of Insurance, rate your level of
satisfaction with the service you received from TDI.
Very
Satisfied
Very
Dissatisfied NA
5 4 3 2 1 9
14. How can the Texas Department of Insurance improve its services?
Thank you. Please return your completed survey in the envelope provided to:
Research Division, Texas Legislative Council
P.O. Box 12128, Capitol Station
Austin, TX 78711-2128
For assistance, please contact us at 1-888-286-0648 or [email protected].

103
Notes1 Don A. Dillman, Mail and Telephone Surveys: The Total Design Method (New York: John
Wiley and Sons, Inc., 1978).2 The small number of Enforcement program customers means that small differences in
the number of respondents across questions will have a large impact on the results. Generalization of the results from this group should be made with caution.
3 Governor’s Office of Budget, Planning and Policy and Legislative Budget Board, Instructions for Preparing and Submitting Agency Strategic Plans, Fiscal Years 2013-2017, (March 2012), 53.
4 Don A. Dillman, Mail and Internet Surveys: The Tailored Design Method, Second Edition (New York: John Wiley and Sons, Inc., 2007).