customer satisfaction at wisconsin’s one-stop job … · customer satisfaction at wisconsin...
TRANSCRIPT
CUSTOMER SATISFACTION AT WISCONSIN’S ONE-STOP JOB CENTERS: DEVELOPMENT AND IMPLEMENTATION OF A CUSTOMER SATISFACTION
INSTRUMENT
By
Nicholas J. Blanchette
A Research Paper
Submitted in Partial Fulfillment of the
Requirements for the
Master of Science Degree
With a Major in
Applied Psychology
Approved: 4 Semester Credits
Dr. Mitchell Sherman
Investigation Advisor
The Graduate College
University of Wisconsin-Stout
August 2001
Customer Satisfaction ii
The Graduate College
University of Wisconsin-Stout
Menomonie, WI 54751
ABSTRACT
Blanchette, Nicholas J Customer Satisfaction at Wisconsin One-Stop Job Centers: Development and Implementation of Customer Satisfaction Instrument M.S. Applied Psychology Dr. Mitchell Sherman 08/01 61pp American Psychological Association (APA) 4th edition The purpose of this research was to develop and implement a customer satisfaction
instrument that examined the satisfaction of walk-in clients using the programs, services,
and technical assistance provided by Wisconsin One-Stop Job Centers in Chippewa,
Dunn, and Eau Claire counties. Under the Workforce Investment Act of 1998, One-Stop
Job Centers are designed to meet the needs of the nation’s employers, job seekers, and
those who want to further their careers. Services provided by the Job Centers include
information on education and training opportunities, skill assessment, career planning,
and labor market information. Other services consist of job search programs, job listings,
Customer Satisfaction iii
and tools for resumes and cover letter preparation. The instrument developed and
implemented specifically focused on these services and staff assistance available at the
One-Stop Job Centers. Results of the study show that the majority of individuals used the
Job Centers for job searching purposes. Overall customers tended to be highly satisfied
with the Job Center’s programs, services, and staff. The professionalism and
approachability of the Job Center’s staff was rated the highest in satisfaction. Rated
lowest in satisfaction was the accuracy of the Job Center’s website and available
materials meeting the needs of the customers. This research also suggested that to
increase overall satisfaction, it is reasonable to focus improvement efforts on the
performance attributes relating to the confidence customers feel towards Job Center staff
when receiving assistance and fulfilling the needs of the customers. In addition, it was
found that the performance dimensions used in the survey showed high reliability and
validity overall and is consistent when used across different industries.
Customer Satisfaction iv
ACKNOWLEDGEMENT
I would like to express my appreciation to my advisor, Dr. Mitchell Sherman, for
his guidance, support and insight during the period of research and development of this
study. A sincere thanks is also extended to Dr. Thomas Franklin for his assistance and
direction with the preparation of this study.
I would also like to recognize and thank the Job Center staff for their assistance
and contributions towards the implementation of this project.
A very special thanks goes to Sharon Franklin for her encouragement and
continued interest that enabled me to begin and finish this study. I would also like to
express my appreciation to Matthew Pronschinske and Richard Best for the excellent
opportunity and wonderful environment that made it possible to complete this project.
And most of all I would like to express my deepest appreciation to my parents for their
love and support and for providing me with the opportunities in life that enabled me
pursue my Master’s Degree.
Customer Satisfaction v
TABLE OF CONTENTS Abstract ii Acknowledgement iv List of Tables vi Chapter 1: Statement of Purpose 8 Chapter 2: Introduction 11 Workforce Investment System 11 Customer Satisfaction 17 SERVQUAL Approach 20 Chapter 3: Methodology 23 Chapter 4: Results 25 Chapter 5: Discussion 52 References 55 Appendix A 57 Appendix B 59
Customer Satisfaction vi
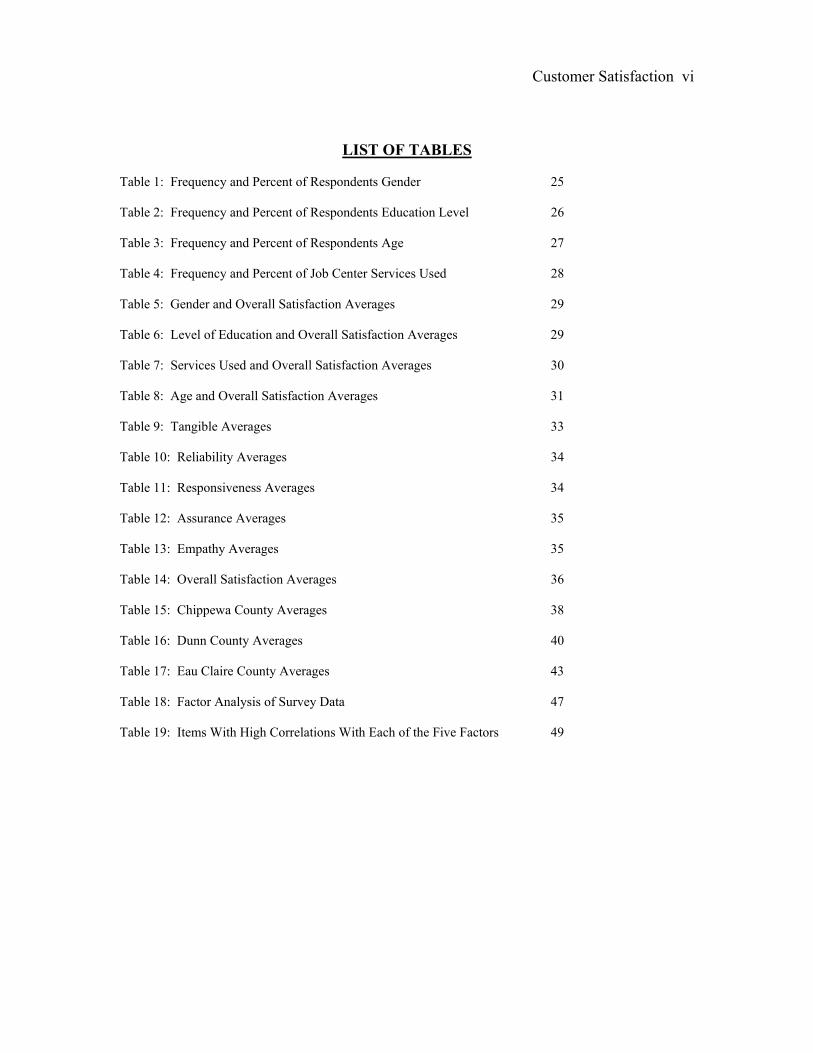
LIST OF TABLES Table 1: Frequency and Percent of Respondents Gender 25 Table 2: Frequency and Percent of Respondents Education Level 26 Table 3: Frequency and Percent of Respondents Age 27 Table 4: Frequency and Percent of Job Center Services Used 28 Table 5: Gender and Overall Satisfaction Averages 29 Table 6: Level of Education and Overall Satisfaction Averages 29 Table 7: Services Used and Overall Satisfaction Averages 30 Table 8: Age and Overall Satisfaction Averages 31 Table 9: Tangible Averages 33 Table 10: Reliability Averages 34 Table 11: Responsiveness Averages 34 Table 12: Assurance Averages 35 Table 13: Empathy Averages 35 Table 14: Overall Satisfaction Averages 36 Table 15: Chippewa County Averages 38 Table 16: Dunn County Averages 40 Table 17: Eau Claire County Averages 43 Table 18: Factor Analysis of Survey Data 47 Table 19: Items With High Correlations With Each of the Five Factors 49

Customer Satisfaction 8
CHAPTER ONE
STATEMENT OF THE PROBLEM
The purpose of this research is to develop and implement a customer satisfaction
instrument that will examine the satisfaction of walk-in clients using the programs,
services, and technical assistance provided by Wisconsin Job Centers in Chippewa,
Dunn, and Eau Claire counties. Under the Workforce Investment Act (WIA) of 1998,
Job Centers are designed to meet the needs of the nation’s employers, job seekers, and
those who want to advance their careers. These needs are met with services and
programs that include the assessment of skills, abilities, and needs; access to labor market
information, career counseling; job search and job placement assistance; and information
on training and education. Related supported services such as day care and transportation
are also available. Wisconsin Job Centers must focus on customer satisfaction, which is
measured by a continuous feedback model from the customer. Consistent with the WIA,
measures of customer satisfaction must:
• Address participants and employers
• Be able to track process toward improvements
• Be comparable across states
• Be examined at the conclusion of participation
Designing a customer satisfaction questionnaire requires the identifying of
customer requirements or quality dimensions. Customer requirements define the quality
of your products and services.
Customer Satisfaction 9
Defining quality dimensions provides a better understanding on the way customers
describe the quality of Job Center services and tools. The quality dimensions used in this
study were based on the SERVQUAL Approach developed in 1985 by Parasuraman,
Zeithaml and Berry (Donnelly, Hull, & Will, 2000). The five dimensions of the
SERVQUAL Approach are:
• Tangibles: the appearance of physical facilities, equipment, personnel, and
communication materials related to the service.
• Reliability: the ability of the service to perform the promised service dependably
and accurately.
• Responsiveness: the willingness of the service to help customers and provide
prompt service.
• Assurance: the competence of the service and its security, credibility and
courtesy.
• Empathy: the ease of access, approachability and effort taken to understand
customers’ requirements.
This study was done to determine what the local job centers quality dimensions
would be and use these dimensions to develop a customer satisfaction questionnaire that
was in compliance with the continuous improvement approach of the Workforce
Investment Act. This approach will foster development in performance levels desired by
the Job Centers in the workforce investment system. The customer satisfaction measure
developed will provide a structured process for listening to and learning from customers.
Customer Satisfaction 10
The research will provide insight to Job Center staff on the effectiveness and
relevance of services and tools used by customers. With this information, the Job Centers
included in this study will recognize areas that are utilized the most, need improvement,
and do not fulfill the needs of its customers. Results will also determine the strengths and
weaknesses of staff, indicate correct placement and design of hand out materials and
instructions, and inform staff on types of customers using the Job Centers. Statistical
analysis will also be done to determine the reliability and validity of the five service
quality dimensions identified through the SERVQUAL Approach. Analysis will help
determine if the dimensions are consistent when used in different industries.
Customer Satisfaction 11
CHAPTER TWO
INTRODUCTION
One-Stop Job Centers are at the heart of the new workforce investment system
emerging under the Workforce Investment Act (U.S. Department of Labor Employment
and Training Administration, DOLETA, 2001). As part of America’s Workforce
Network these centers provide an integrated array of high-quality services so that
workers, job seekers and businesses can find the services they need under one roof in
easy-to-reach locations (DOLETA). Wisconsin Job Centers house comprehensive
resource rooms with books, newspapers, paper listings of job openings and resumes, in
addition to the electronic resources (South, 2000). To meet the needs of customers, Job
Centers must focus on customer satisfaction, which can be measured by a continuous
feedback model (South). Using the information obtained, services can be fine-tuned to
meet the customers needs and expectations. Workforce Development leaders in
Chippewa, Dunn, and Eau Claire counties expressed a need for the design and
implementation of a customer satisfaction instrument that accurately gauges customer’s
attitudes and incorporates these attitudes into the quality improvement efforts of the
Wisconsin Job Centers and the Workforce Investment Act.
Workforce Investment System
The Workforce Investment Act (WIA) of 1998 was developed to provide the
framework for a reformed national workforce investment system designed to meet the
needs of the nation’s employers, job seekers and people who want to further their
Customer Satisfaction 12
careers (America’s Workforce Network, 2001). Clearly stated, the Act’s purpose is to
provide workforce investment activities that increase participants’ employment, retention,
earnings, and skill attainment, which in turn results in the improvement of quality in the
workforce, reduction in welfare dependency and the enhancement of the productivity and
competitiveness of the nation (America’s Workforce Network). A key reform contained
within the act is the establishment of a comprehensive accountability system to assess the
effectiveness of state and local areas in providing employment and training services
(America’s Workforce Network). The Act requires Job Centers to:
• Focus on results defined by core indicators.
• Measure customer satisfaction of programs and services.
• Put a strong emphasis on continuous improvement.
• Keep annual performance levels developed as a result of negotiations among
Federal, State, and local partners.
• Report performance results of programs and services.
A comprehensive performance accountability system focuses on achieving
continuous improvement of workforce investment activities (America’s Workforce
Network, 2001). The WIA uses the Malcolm Baldrige Criteria for Performance
Excellence as a proposed framework for enabling organizations within the workforce
investment system to advance toward high performance (America’s Workforce Network).
According to Malcolm Baldrige literature, continuous improvement is the systematic and
ongoing improvements of products, programs, services and processes by
Customer Satisfaction 13
small increments and major breakthroughs (America’s Workforce Network). The
process of continuous improvement is building dynamic, high achieving systems within
every organization, and becomes embedded in the way the organization conducts its daily
activities (America’s Workforce Network).
The Workforce Investment Act’s Continuous Improvement strategy is aimed at
improving outcomes for the customers of the workforce investment systems by
enhancing system-wide performance (America’s Workforce Network, 2001). A rigorous
approach to continuous improvement must be applied at all levels of the workforce
investment system in order for that system to achieve the high levels of performance
envisioned in the WIA (America’s Workforce Network). An integral part of a continuous
improvement strategy is the determination of customer expectations and satisfaction.
According to the WIA, customer satisfaction is both a process of identifying and listening
to customers, as well as an outcome for measuring program success (America’s
Workforce Network). The Workforce Investment Act emphasizes the importance of a
customer-driven workforce system by including customer satisfaction as a required
measure, along with core indicators of performance (America’s Workforce Network).
Customer satisfaction measures provide feedback to supervisors and staff about how their
actions affect customers, giving them critical information to motivate and guide
continuous improvement. Customer satisfaction feedback also sends a clear message to
Customer Satisfaction 14
staff, management, and customers that customers do matter (America’s Workforce
Network). The WIA uses the following guiding principles for measurement of customer
satisfaction:
• Customer satisfaction is the foundation of an organization’s strategy for
continuous improvement.
• Customer satisfaction should be measured after completion of service and
should be quantifiable.
• Customer satisfaction surveys need to contain a set of required questions to
form a customer satisfaction indicator.
• Comparability is an important element in negotiating customer satisfaction
performance levels and in providing opportunities for benchmarking and sharing
best practices.
• States and local organizations are encouraged to add customized questions to
inform their efforts to align resources or redesign processes to achieve better
results.
In requiring a customer satisfaction indicator for employers and participants, the
Act presents a general framework for developing a national approach (America’s
Workforce Network, 2001). Customer satisfaction indicators are the specific part of the
performance accountability system and are the foundation of an organization’s strategy
for continuous improvement (America’s Workforce Network).
Customer Satisfaction 15
The indicators provide a guide to achieving the vision and goals of the Act, and provide a
focused and structured process for Job Centers to listen and learn from their customers
(America’s Workforce Network). The WIA proposes the use of customer satisfaction
surveys to meet customer satisfaction requirements. Surveying customers serves two
purposes; first it produces an outcome measure for each state as part of the performance
accountability system (America’s Workforce Network). This is accomplished by a small
set questions that will form the customer satisfaction index.
The second purpose is to gain customer feedback to assist in improving processes and
services (America’s Workforce Network). This is done through a set of recommended
questions that address each service component offered and additional questions that state
and local areas choose to ask, depending on their particular needs and services.
Under Title I of the Workforce Investment Act, One Stop Job Centers were
assigned the responsibilities to ensure the creation and maintenance of a delivery system
that enhances the range and quality of workforce development services (DOLETA,
2001). There are currently seventy-eight job centers in the state of Wisconsin
(DOLETA). These centers provide an integrated array of high quality services for
workers, job seekers, and businesses so that services can be found in one location
(DOLETA). These services and programs include the assessment of skills, abilities, and
needs; access to labor market information, career counseling; job search and job
placement assistance; and information on training and education (DOLETA). Related
supportive services such as day care and transportation are also available (DOLETA).
Customer Satisfaction 16
Job Center self-service approaches allow access for all population groups to a broad array
of services and information (D’Amico, Fedrav, Kimball, Midling, & Soukamneuth,
1999). Customers are empowered to select those service offerings from which they think
they can derive the most benefit and do so at the times that are most convenient for them
(D’Amico et al, 1999).
According to the WIA, a thorough approach to continuous improvement must be
applied to Job Centers in order for the workforce investment system to achieve high
levels of performance pictured by the Act (DOLETA, 2001). This approach would
provide a regimen for achieving the systematic and ongoing improvement of Job Center
programs, services, and processes by small increments and major breakthroughs
(DOLETA). This regimen will foster development in performance levels desired by Job
Centers in the workforce investment system (DOLETA). The determination of
customer’s expectations and satisfaction is an integral part of a Job Center’s continuous
improvement strategy.
Emphasis on continuous improvement led the Connecticut Department of Labor
(CTDOL) to enhance its performance measurement systems. The primary focus of the
agency’s performance measurement efforts has been to develop a system to measure
services provided through the Connecticut Works Job Centers (Schack, 1999). This
initial emphasis on continuous improvement led to efforts linking desired outcomes of
services with key process measures in order to provide managers and staff with some
primary routes of exploration when attempting to improve outcomes (Schack). As a
Customer Satisfaction 17
result of these continued performance efforts, CTDOL’s customer satisfaction index has
remained stable during an intense transition period, as Job Centers transformed into One-
Stop Career Centers (Schack). The percentage of clients reporting they waited too long
for service decreased from 13 percent to 8 percent, while the percentage of clients
entering employment increased by over 50 percent to 15 percent over a two year span
(Schack). Information obtained through the use of the agencies performance
measurement system can be used to assist in future service and program planning and
resource allocations.
Customer Satisfaction
In the ‘new economy’ knowledge is a resource as well as, increasingly, a product:
with tangible goods becoming globally standardized and best practices travelling fast,
companies gain competitive advantages through constant innovation, better targeting of
customers and additional services (McColl-Kennedy & Schneider, 2000). In the face of
current economic realities, U.S. business organizations are searching for ways to remain
competitive (McColl-Kennedy & Schneider). One front on which these efforts have been
made is that of product and service quality improvement. This has been the case
particularly for organizations in the growing service sector (McColl-Kennedy &
Schneider). Many of these organizations are searching for practical ways to improve
customer satisfaction with both tangible and intangible products and services (Hayes,
1998).
Customer Satisfaction 18
The anticipated result of improved service quality is an improvement in the
bottom line of the organization (Tompkins, 1992; Weaver, 1994). To increase the quality
of products and services, there first needs to be a definition of quality. The definition
presented by Montgomery (1996) states that quality is the extent to which products meet
requirements of people who use them (Hayes, 1998). Aspects of quality can be
measured. Such measures give businesses an accurate indication of the “well-being” of
their business processes and determine the quality of products and services resulting from
these processes (Hayes). Measures allow a business to (1) Know how well the business
process is working, (2) Know where to make changes to create improvements, if changes
are needed, and (3) Determine if the changes led to improvements (Hayes). Various
techniques can index the quality of business processes, products, and services. Measures
of quality often focus on objective or hard indices (Hayes). However there have been
increased desires to utilize more subjective or soft measures as indicators of quality.
These measures are considered soft, because of their focus on perceptions and attitudes
rather than concrete, objective criteria (Hayes). Knowledge of customers’ perceptions
and attitudes about an organization’s business will greatly enhance its opportunity to
make better business decisions (Hayes). Organizations will know their customers’
requirements or expectations and will be able to determine if they are meeting those
requirements (Hayes). With accurate information about customers’ perceptions about the
quality of the services and products, organizations can make better decisions to better
serve their customers.
Customer Satisfaction 19
A 1994 survey conducted by the Juran Institute found that 90 percent of the top managers
of the more than 200 of America’s largest companies agreed with the statement,
“Maximizing customer satisfaction will maximize profitability and market share”. And,
about 90 percent of these companies evidenced their belief by funding some organized
effort for systematically tracking and improving customer satisfaction scores (Vavra,
1997). Satisfaction extends customers’ lifetimes and their lifetime values (Vavra). It has
been found that more than 90 percent of dissatisfied customers will not exert their own
effort to inform a company of complaints, they simply take their business to a competitor
while voicing their dissatisfaction to other potential customers (Vavra). If organizations
take the time and effort to assess their current customers’ satisfactions, they take a major
step towards having a business that is customer oriented, both for today’s current
customers and for future customers (Vavra).
Customer satisfaction represents one of several components used to examine the
quality of organizational staff and programs. In the private sector, organizations employ
both objective and subjective measures to assess the quality of their work (Weiler, Pigg,
& Morgan, 2000). Especially in business and industry, organizations often use client
satisfaction surveys to assess the quality of their programs, products, services, and
employee performance (Weiler, Pigg, & Morgan). According to Hayes (1998), measures
of customer satisfaction prove particularly useful when quality cannot be measured
completely through objective means.
Customer Satisfaction 20
Customer satisfaction surveys provide an indication of how customers perceive a
situation (Weiler, Pigg, & Morgan, 2000). Since perception often represents reality for
the individual, measures of client satisfaction provide a potentially valuable source of
information, both for administrators and evaluators (Weiler, Pigg, & Morgan). The
measurement of customers’ attitudes has been an important element in the quality
movement of American organizations (Hayes, 1998).
SERVQUAL Approach
The combination of a competitive marketplace and the Malcolm Baldridge
National Quality Award (MBNQA) has heightened the awareness of American
companies of the need to focus their quality improvement efforts on customer-related
issues (Hayes, 1998). There is both an intuitive belief and mounting empirical evidence
that improved customer satisfaction will increase organizational profitability (Vavra,
1997). Accounting Professor David Larcker of the Wharton Business School has
determined that companies in the top quartile of customer satisfaction (according to the
American Customer Satisfaction Index model) experience a higher appreciation in stock
values than did the overall S&P 500 (Vavra).
Customer satisfaction has been defined as the degree in which an organization or
agency meets or exceeds the expectations of the individual customer with whom
employees interact with (Bridge, Fischer, & Larisch, 1995). According to Reichfield and
Sasser (1990), high-quality products and associated services designed to meet customer
needs, will create high levels of customer satisfaction.
Customer Satisfaction 21
This high level of satisfaction will lead to greatly increased customer loyalty
(Vavra, 1997). Customers describe a product or service in terms of several dimensions or
characteristics. The purpose of determining customer requirements is to establish a
comprehensive list of all the important quality dimensions that describe the service or
product (Hayes, 1992). It is important to understand the quality dimensions so that
organizations will know how customers define the quality of their service or product
(Hayes, 1992). With evidence that service quality leads to customer satisfaction,
considerable practitioner interest has focused on programs to improve service quality
(Shepard, 1999). Researchers (Parasuraman, Zeithaml, & Berry, 1985) have concluded
that service quality can be described on the basis of 10 dimensions (Hayes, 1992).
Attempts to measure these 10 dimensions, however, reveal that customers can only
distinguish between five dimensions, suggesting that the original 10 dimensions overlap
each other (Hayes, 1992). These attempts lead to the development of the SERVQUAL
Approach (Parasuraman, Zeithaml, & Berry, 1985) which uses the five dimensions that
customers use to evaluate service quality. These dimensions are listed as:
• Tangibles: Appearance of the physical facilities, equipment, personnel, and
communication materials.
• Reliability: Ability to perform the promised service dependably and
accurately.
• Responsiveness: Willingness to help customers and provide prompt service.
Customer Satisfaction 22
• Assurance: Knowledge and courtesy of employees and their ability to convey
trust and confidence.
• Empathy: Caring, individualized attention the firm provides its customers.
The SERVQUAL model was designed to be a generic measure of service quality
that has cross-industry applicability (Shepard, 1999). With evidence that service quality
leads to satisfaction and customer loyalty, the SERVQUAL model can offer diagnostic
insights useful in efforts to assess and improve customer satisfaction (Shepard).
Identifying and quantifying customer perceptions by service dimension will support
better prioritization by an organization in developing future service improvements
(Donnelly and Shiu, 1999). Successful applications of the SERVQUAL approach
continue to be reported in professional and academic literature, indicating at least a
practical usefulness in providing supporting evidence to underpin management
intervention to improve service quality (Donnelly, Hull, and Will, 2000). The reliability
and validity of this model have been evaluated from numerous perspectives, and the
general conclusion is that the model and its five dimensions have sound psychometric
properties (Tomkovick and Al-Khatib, 1996).
Customer Satisfaction 23
CHAPTER THREE
METHODOLOGY
Participants The purpose of this research was to develop and implement a customer
satisfaction instrument that would examine the satisfaction of walk-in clients using the
programs, services, and technical assistance provided by Wisconsin Job Centers in
Chippewa, Dunn, and Eau Claire counties. Subjects from this study consisted of
individuals from the Chippewa Valley and surrounding area who used the Job Center
Resource Rooms in each county. There were 121 individuals who participated in the
study during the final week of June and the first three weeks of July, 2001.
Instrument
Data was collected using a customer satisfaction survey, an instrument designed
exclusively for this evaluation project. The customer satisfaction survey was developed
and conducted to gain insight from customers regarding the Job Center’s effectiveness in
providing programs, services, and assistance. The instrument was a modification of the
SERVQUAL customer satisfaction survey and was intended to correspond with the five
dimensions of service quality formed from the SERVQUAL Approach. Customers
responded to four items relating to demographics, twenty-four items concerning the five
service quality dimensions, and three questions involving overall satisfaction with the
resource rooms, staff, and Job Centers in general.
Customer Satisfaction 24
One open-ended question to elicit qualitative data was also included in the survey. A
copy of the comments is attached (Appendix A). Customers responded to the twenty-
seven items on a Likert-type scale ranging from Strongly Disagree (1) to Strongly Agree
(5). A copy of the instrument is attached (Appendix B).
Procedure
The instrument was distributed by staff to customers who used the Job Center
resource rooms in Chippewa, Dunn, and Eau Claire counties during the final week of
June and the first three weeks in July, 2001. Job Center staff approached customers using
the resource rooms explained the purpose of the survey and asked the customers to
participate. Customers who agreed to participate were given instructions on completing
the survey and where to return the surveys when completed. Completed surveys were
placed in an enclosed container used specifically for this study. Customers with multiple
visits to the Job Centers were instructed to complete the survey only once.
Customer Satisfaction 25
CHAPTER FOUR
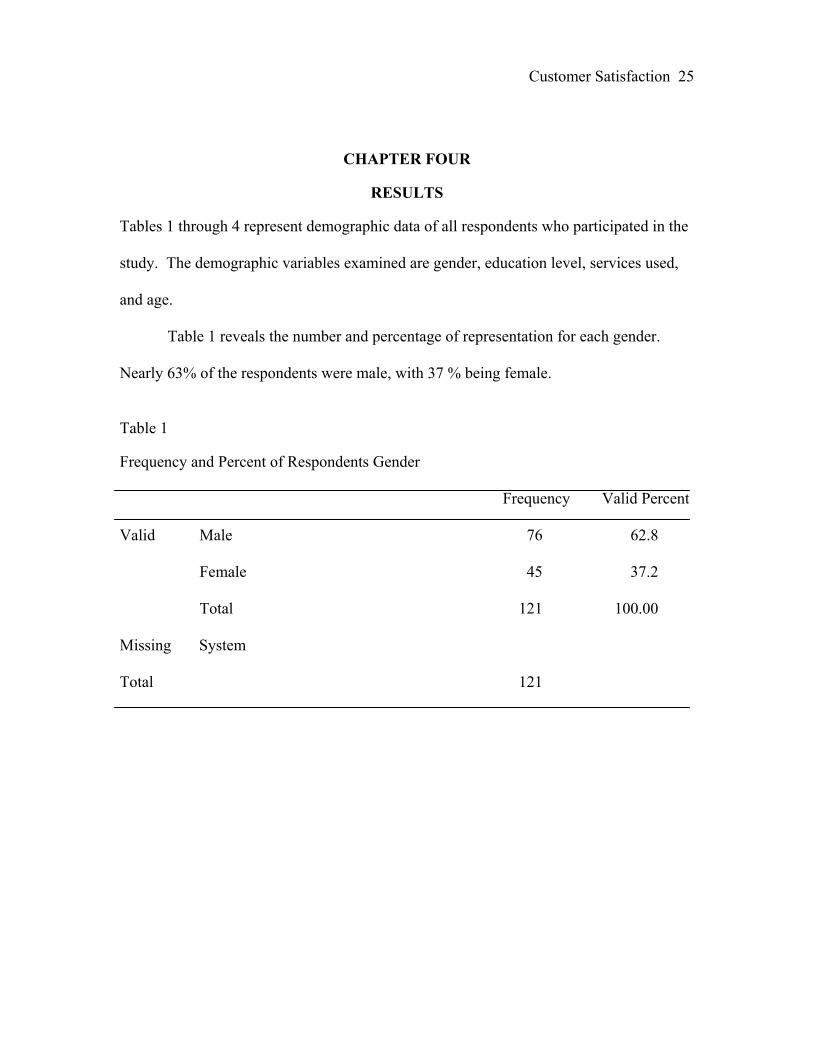
RESULTS Tables 1 through 4 represent demographic data of all respondents who participated in the
study. The demographic variables examined are gender, education level, services used,
and age.
Table 1 reveals the number and percentage of representation for each gender. Nearly 63% of the respondents were male, with 37 % being female. Table 1 Frequency and Percent of Respondents Gender Frequency Valid Percent Valid Male 76 62.8
Female 45 37.2 Total 121 100.00
Missing System Total 121
Customer Satisfaction 26
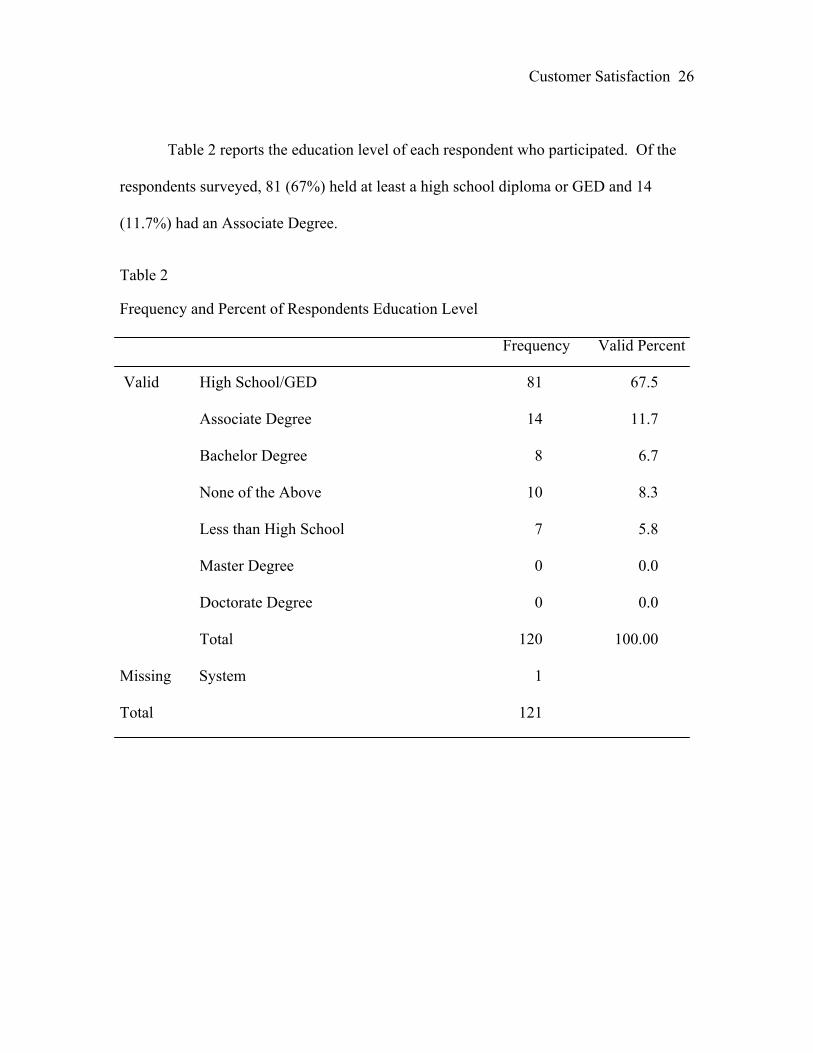
Table 2 reports the education level of each respondent who participated. Of the
respondents surveyed, 81 (67%) held at least a high school diploma or GED and 14
(11.7%) had an Associate Degree.
Table 2 Frequency and Percent of Respondents Education Level Frequency Valid Percent Valid High School/GED 81 67.5
Associate Degree 14 11.7
Bachelor Degree 8 6.7
None of the Above 10 8.3
Less than High School 7 5.8
Master Degree 0 0.0 Doctorate Degree 0 0.0
Total 120 100.00 Missing System 1 Total 121
Customer Satisfaction 27
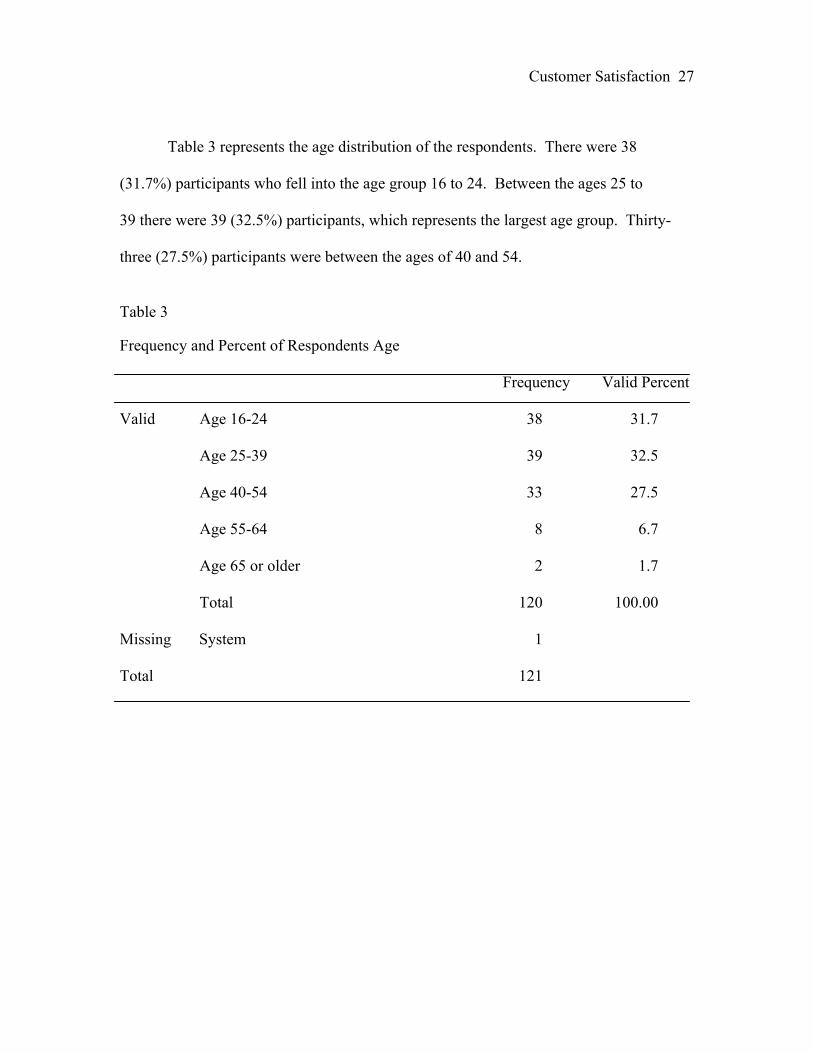
Table 3 represents the age distribution of the respondents. There were 38
(31.7%) participants who fell into the age group 16 to 24. Between the ages 25 to
39 there were 39 (32.5%) participants, which represents the largest age group. Thirty-
three (27.5%) participants were between the ages of 40 and 54.
Table 3 Frequency and Percent of Respondents Age Frequency Valid Percent Valid Age 16-24 38 31.7
Age 25-39 39 32.5
Age 40-54 33 27.5
Age 55-64 8 6.7
Age 65 or older 2 1.7
Total 120 100.00 Missing System 1 Total 121
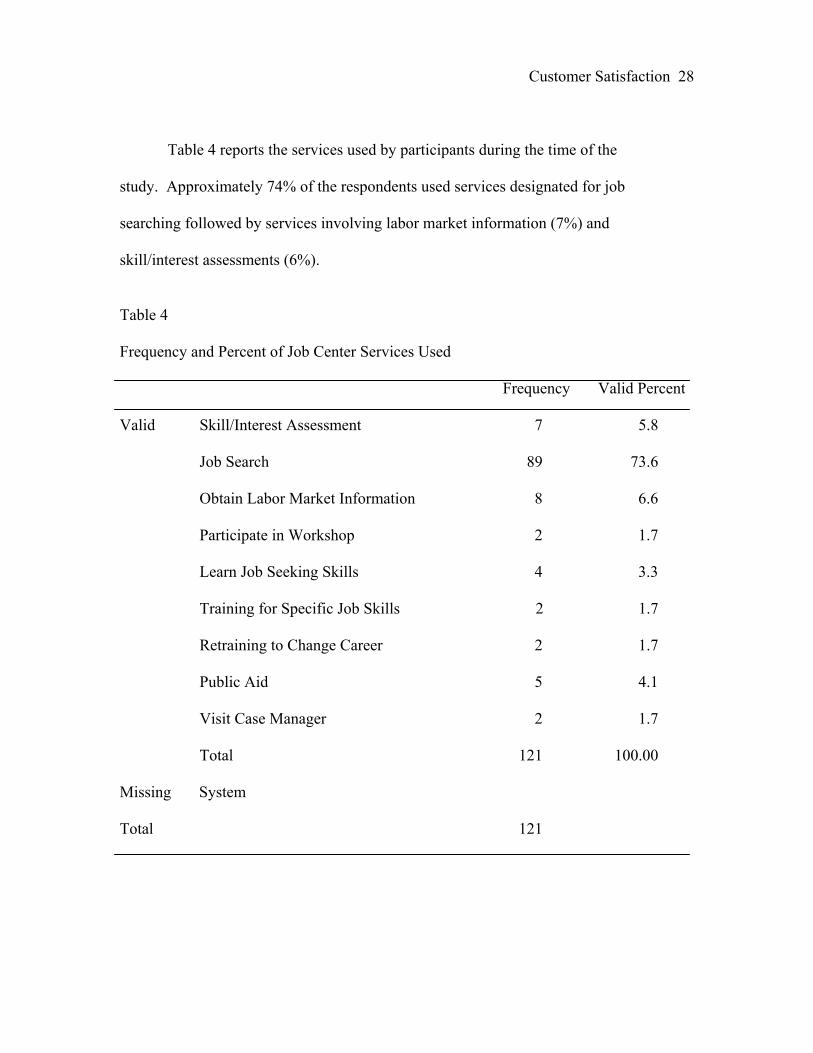
Customer Satisfaction 28 Table 4 reports the services used by participants during the time of the
study. Approximately 74% of the respondents used services designated for job searching followed by services involving labor market information (7%) and skill/interest assessments (6%).
Table 4 Frequency and Percent of Job Center Services Used Frequency Valid Percent Valid Skill/Interest Assessment 7 5.8
Job Search 89 73.6
Obtain Labor Market Information 8 6.6
Participate in Workshop 2 1.7
Learn Job Seeking Skills 4 3.3
Training for Specific Job Skills 2 1.7 Retraining to Change Career 2 1.7 Public Aid 5 4.1 Visit Case Manager 2 1.7
Total 121 100.00 Missing System Total 121
Customer Satisfaction 29
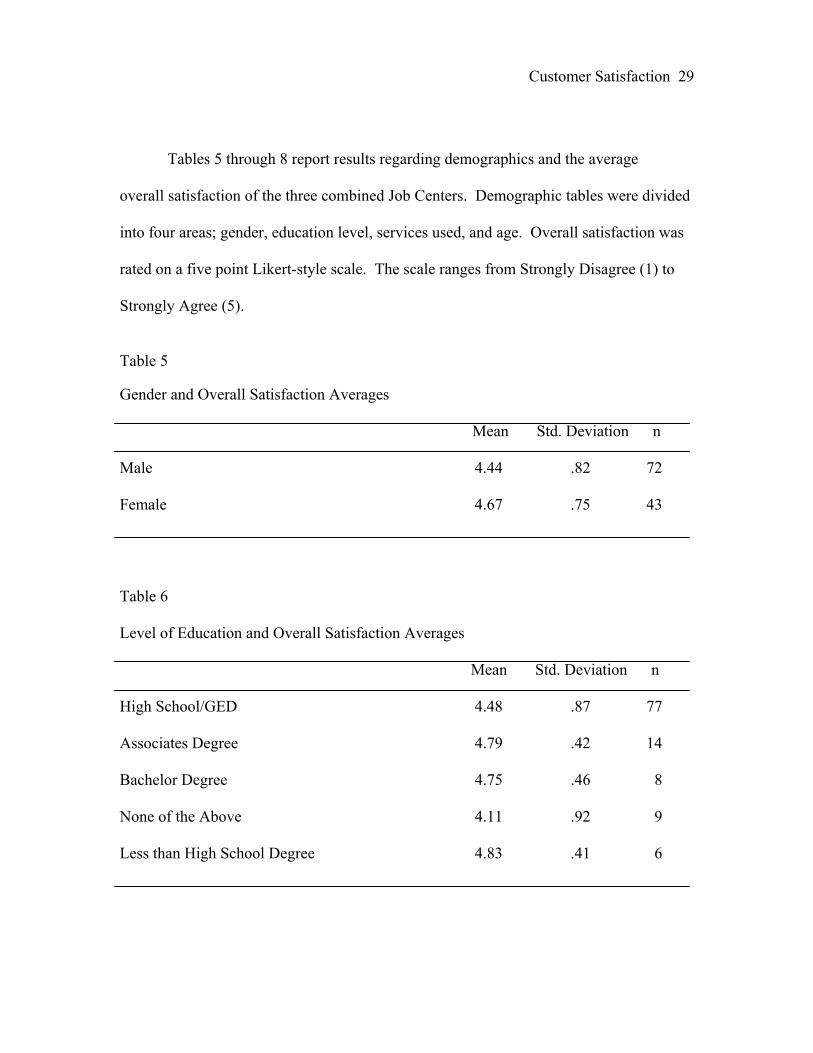
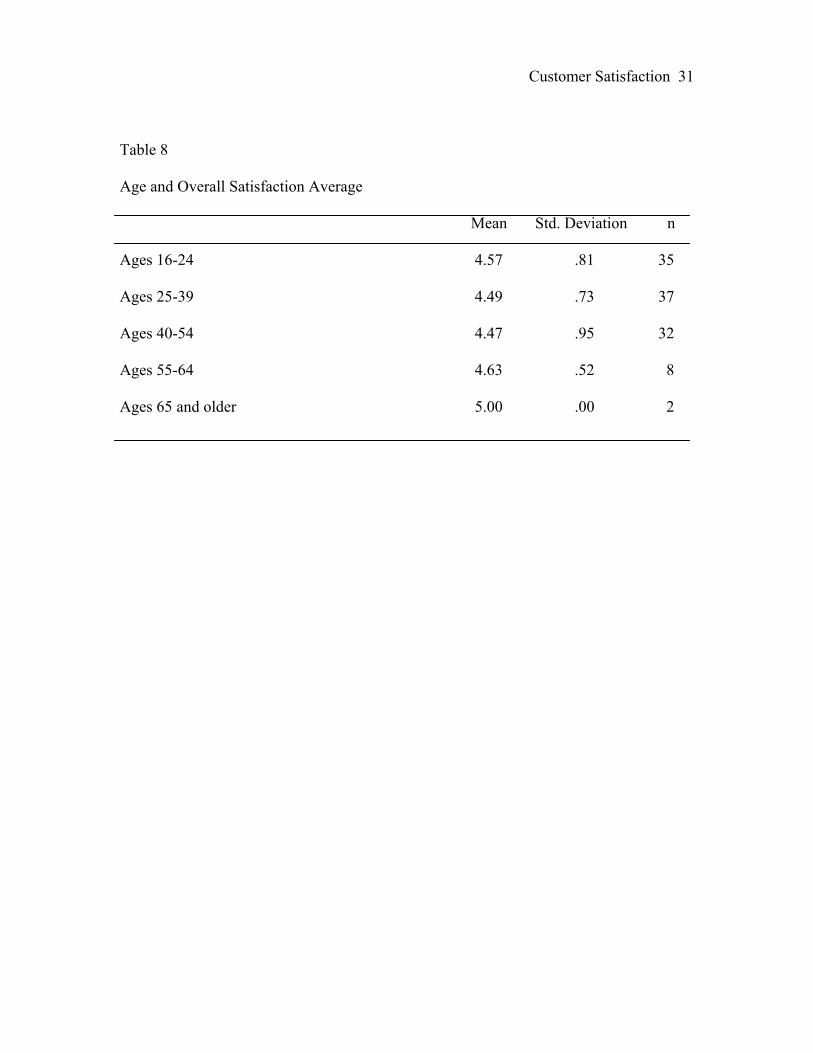
Tables 5 through 8 report results regarding demographics and the average
overall satisfaction of the three combined Job Centers. Demographic tables were divided
into four areas; gender, education level, services used, and age. Overall satisfaction was
rated on a five point Likert-style scale. The scale ranges from Strongly Disagree (1) to
Strongly Agree (5).
Table 5 Gender and Overall Satisfaction Averages
Mean Std. Deviation n Male 4.44 .82 72 Female 4.67 .75 43 Table 6 Level of Education and Overall Satisfaction Averages Mean Std. Deviation n High School/GED 4.48 .87 77 Associates Degree 4.79 .42 14 Bachelor Degree 4.75 .46 8 None of the Above 4.11 .92 9 Less than High School Degree 4.83 .41 6
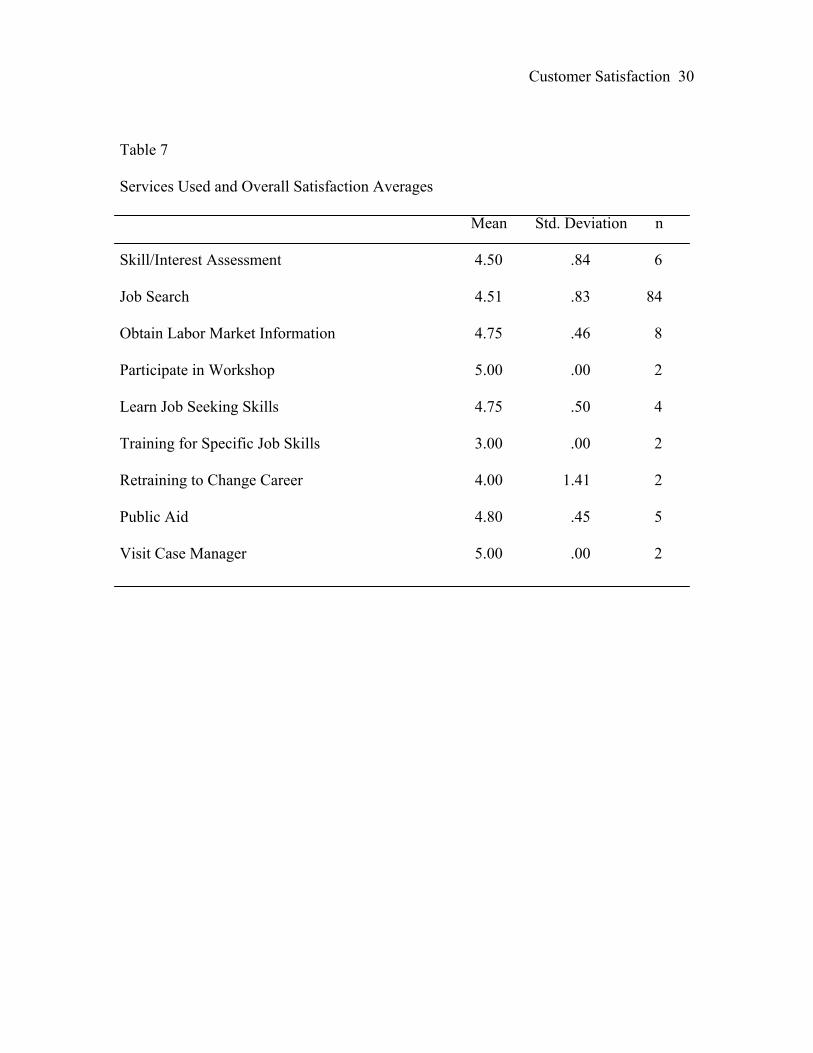
Customer Satisfaction 30 Table 7 Services Used and Overall Satisfaction Averages Mean Std. Deviation n Skill/Interest Assessment 4.50 .84 6 Job Search 4.51 .83 84 Obtain Labor Market Information 4.75 .46 8 Participate in Workshop 5.00 .00 2 Learn Job Seeking Skills 4.75 .50 4 Training for Specific Job Skills 3.00 .00 2 Retraining to Change Career 4.00 1.41 2 Public Aid 4.80 .45 5 Visit Case Manager 5.00 .00 2
Customer Satisfaction 31
Table 8 Age and Overall Satisfaction Average Mean Std. Deviation n Ages 16-24 4.57 .81 35 Ages 25-39 4.49 .73 37 Ages 40-54 4.47 .95 32 Ages 55-64 4.63 .52 8 Ages 65 and older 5.00 .00 2
Customer Satisfaction 32
Tables 9 through 13 report the measured results of the customer service
dimensions regarding overall satisfaction for the three Job Centers. Questions were
broken down into 1 of 5 dimensions, ‘Tangibles’, ‘Reliability’, ‘Responsiveness’,
‘Assurance’, or ‘Empathy’. Elements of each dimension consistently averaged between
Agree (4) and Strongly Agree (5) on a five point Likert-typed scale. The elements that
customers rated the highest in satisfaction are, ‘Staff was courteous and polite’ (M=4.70;
sd=.63), ‘Staff was easily approachable to answer questions’ (M=4.56; sd=.72), ‘Staff
was always willing to help’ (M=4.54; sd=.74), ‘Staff was knowledgeable in answering
questions’ (M=4.54; sd=.74), and ‘Staff gave prompt services’ (M=4.53; sd=.74). The
elements that customers rated the lowest in satisfaction are, ‘The online website is an
accurate source of information about services’ (M=4.21; sd=.91), ‘Job Center materials
met my needs’ (M=4.22; sd=.95), ‘Job listings provided were current and accurate’
(M=4.27; sd=.93), and ‘Staff understood my specific needs’ (M=4.30; sd=.84).
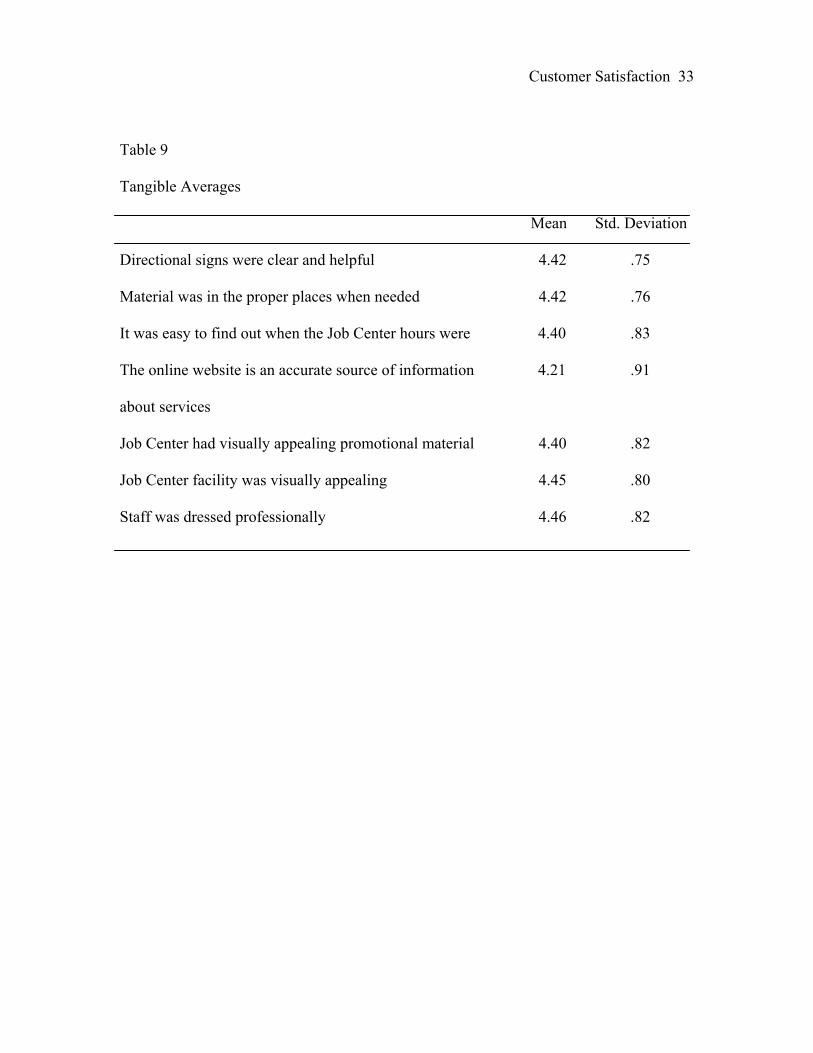
Customer Satisfaction 33 Table 9 Tangible Averages Mean Std. Deviation Directional signs were clear and helpful 4.42 .75 Material was in the proper places when needed 4.42 .76 It was easy to find out when the Job Center hours were 4.40 .83 The online website is an accurate source of information 4.21 .91 about services Job Center had visually appealing promotional material 4.40 .82 Job Center facility was visually appealing 4.45 .80 Staff was dressed professionally 4.46 .82
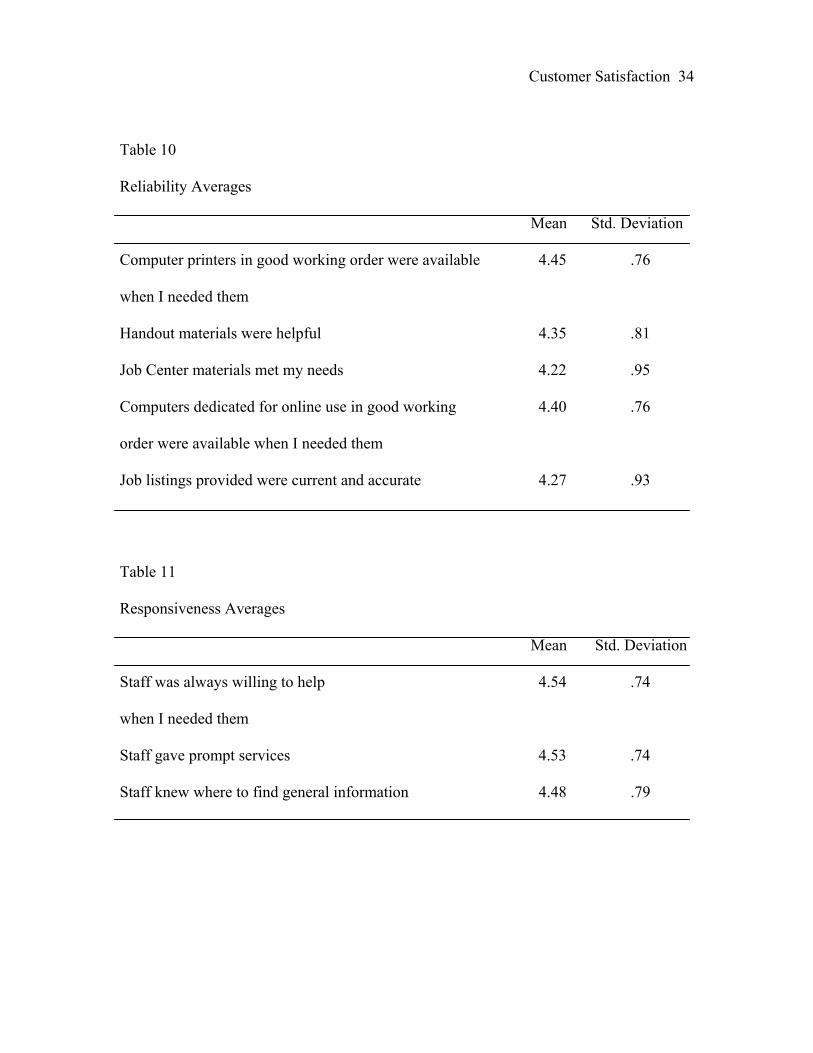
Customer Satisfaction 34 Table 10 Reliability Averages Mean Std. Deviation Computer printers in good working order were available 4.45 .76 when I needed them Handout materials were helpful 4.35 .81 Job Center materials met my needs 4.22 .95 Computers dedicated for online use in good working 4.40 .76 order were available when I needed them Job listings provided were current and accurate 4.27 .93 Table 11 Responsiveness Averages Mean Std. Deviation Staff was always willing to help 4.54 .74 when I needed them Staff gave prompt services 4.53 .74 Staff knew where to find general information 4.48 .79
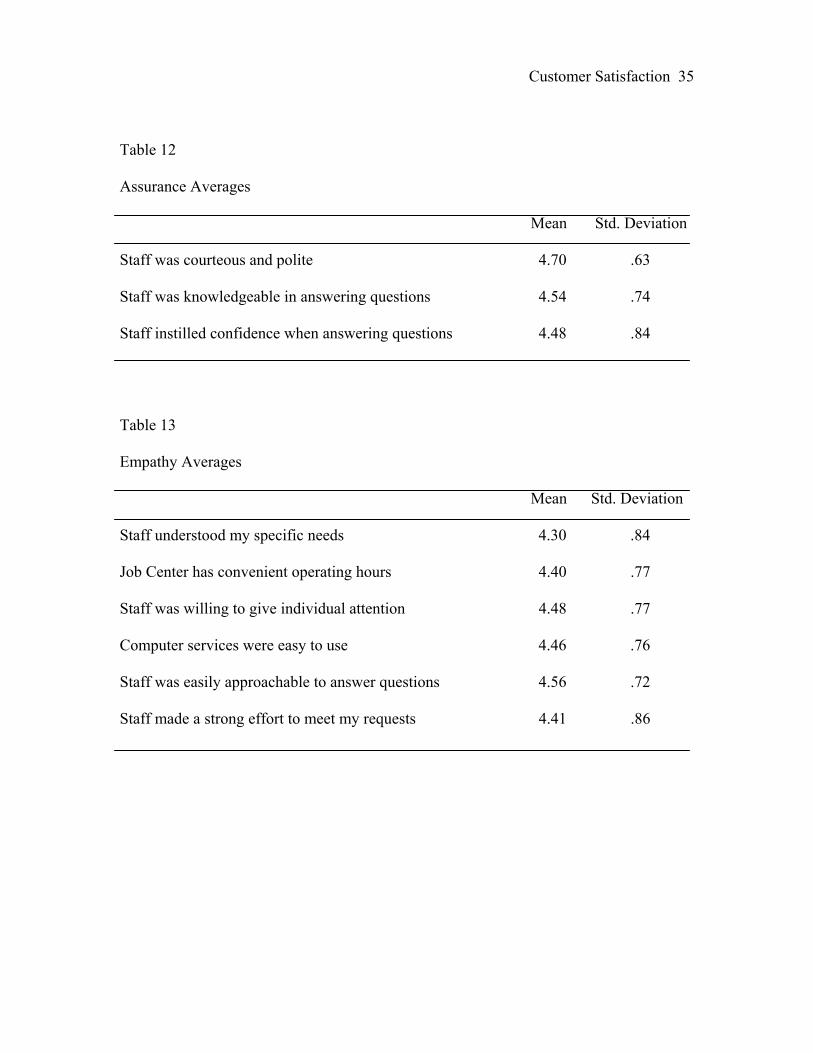
Customer Satisfaction 35 Table 12 Assurance Averages Mean Std. Deviation Staff was courteous and polite 4.70 .63 Staff was knowledgeable in answering questions 4.54 .74 Staff instilled confidence when answering questions 4.48 .84 Table 13 Empathy Averages Mean Std. Deviation Staff understood my specific needs 4.30 .84 Job Center has convenient operating hours 4.40 .77 Staff was willing to give individual attention 4.48 .77 Computer services were easy to use 4.46 .76 Staff was easily approachable to answer questions 4.56 .72 Staff made a strong effort to meet my requests 4.41 .86
Customer Satisfaction 36
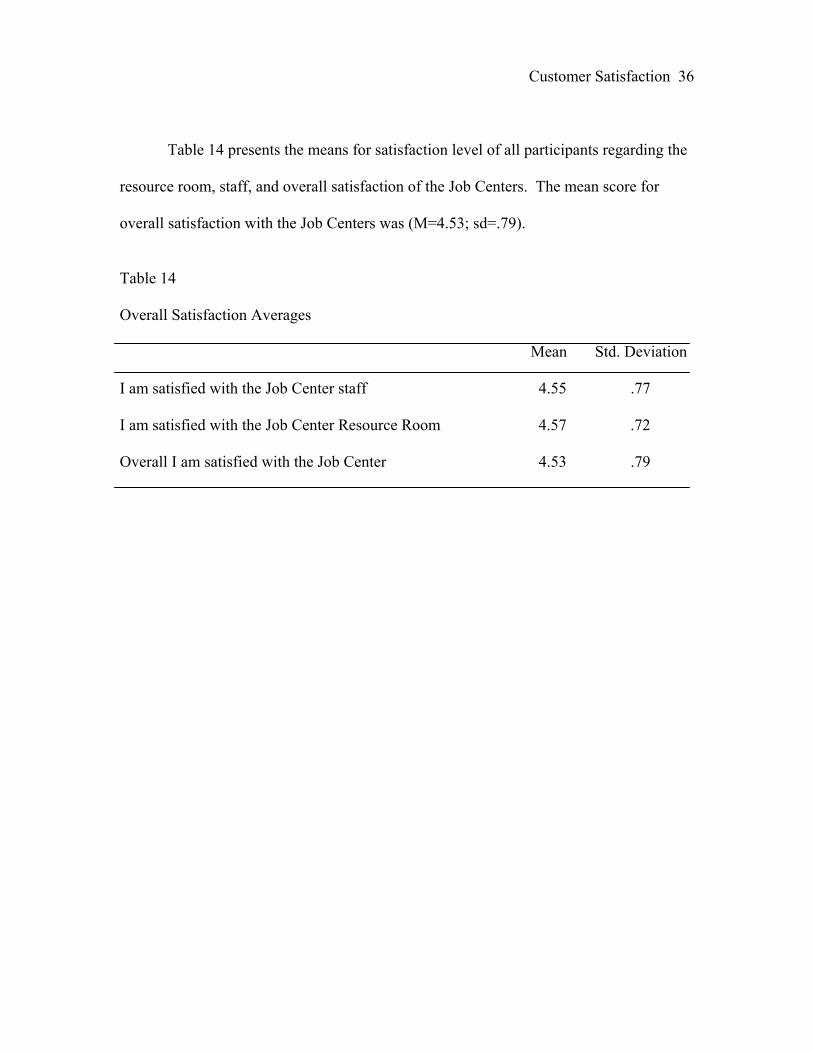
Table 14 presents the means for satisfaction level of all participants regarding the
resource room, staff, and overall satisfaction of the Job Centers. The mean score for
overall satisfaction with the Job Centers was (M=4.53; sd=.79).
Table 14 Overall Satisfaction Averages Mean Std. Deviation I am satisfied with the Job Center staff 4.55 .77 I am satisfied with the Job Center Resource Room 4.57 .72 Overall I am satisfied with the Job Center 4.53 .79
Customer Satisfaction 37 Tables 15 through 17 present the means for level of satisfaction for each
element at the three Job Centers. Table 15 reports the means for level of satisfaction for each element at the Chippewa County Job Center. The elements that customers rated the highest in satisfaction are, ‘Staff was courteous and polite’ (M=4.38; sd=1.02), ‘Directional signs
were clear and helpful’ (M=4.36; sd=.95), and ‘Computer printers in good working order
were available when I needed them’ (M=4.36; sd=1.00). The elements that customers
rated the lowest in satisfaction are, ‘Job listings provided were current and accurate’
(M=3.91; sd=1.27), ‘Job Center materials met my needs’ (M=4.05; sd=1.05), and ‘Job
Center had visually appealing promotional material’ (M=4.09; sd=1.11).

Customer Satisfaction 38 Table 15 Chippewa County Averages Mean Std. Deviation Directional signs were clear and helpful 4.36 .95 Material was in the proper places when needed 4.31 .99 It was easy to find out when the Job Center hours were 4.18 1.05 The online website is an accurate source of information 4.13 1.08 about services Job Center had visually appealing promotional material 4.09 1.11 Job Center facility was visually appealing 4.14 1.17 Staff was dressed professionally 4.18 1.01 Computer printers in good working order were available 4.36 1.00 when I needed them Handout materials were helpful 4.23 .92 Job Center materials met my needs 4.05 1.05 Computers dedicated for online use in good working order 4.32 .89 were available when I needed them Job Listings provided were current and accurate 3.91 1.27 Staff was always willing to help 4.23 1.09 Staff gave prompt services 4.24 1.04 Staff knew where to find general information 4.24 1.09
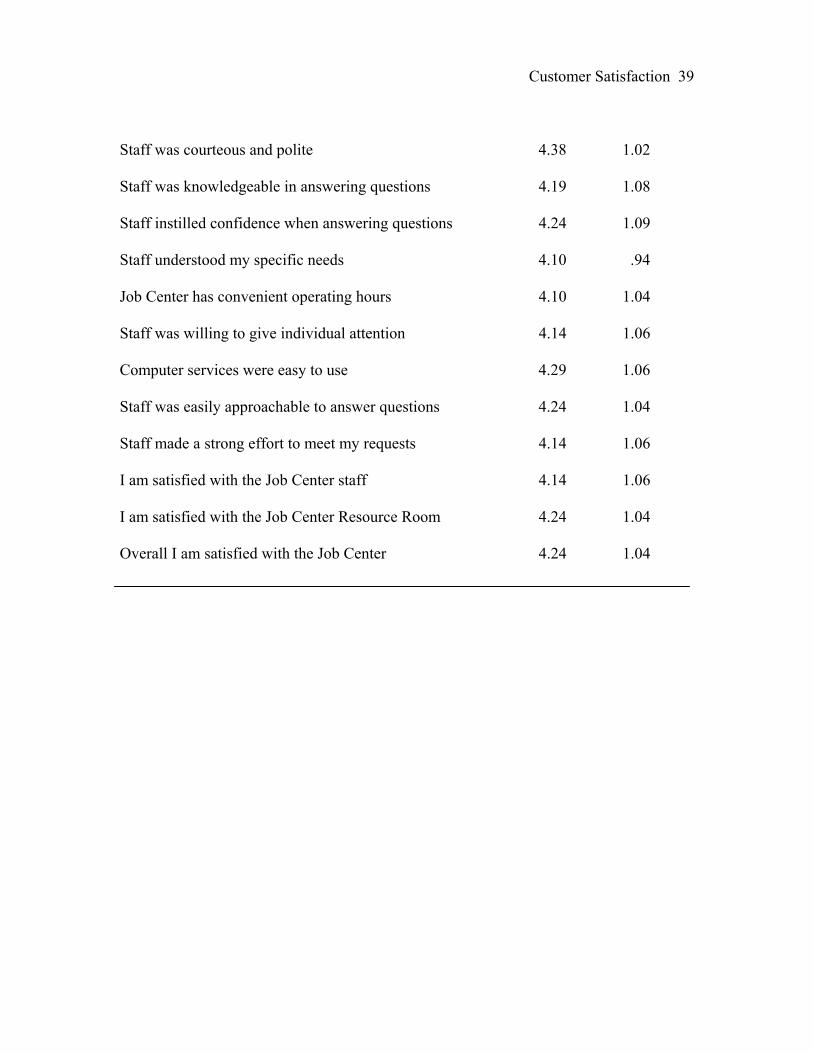
Customer Satisfaction 39 Staff was courteous and polite 4.38 1.02 Staff was knowledgeable in answering questions 4.19 1.08 Staff instilled confidence when answering questions 4.24 1.09 Staff understood my specific needs 4.10 .94 Job Center has convenient operating hours 4.10 1.04 Staff was willing to give individual attention 4.14 1.06 Computer services were easy to use 4.29 1.06 Staff was easily approachable to answer questions 4.24 1.04 Staff made a strong effort to meet my requests 4.14 1.06 I am satisfied with the Job Center staff 4.14 1.06 I am satisfied with the Job Center Resource Room 4.24 1.04 Overall I am satisfied with the Job Center 4.24 1.04
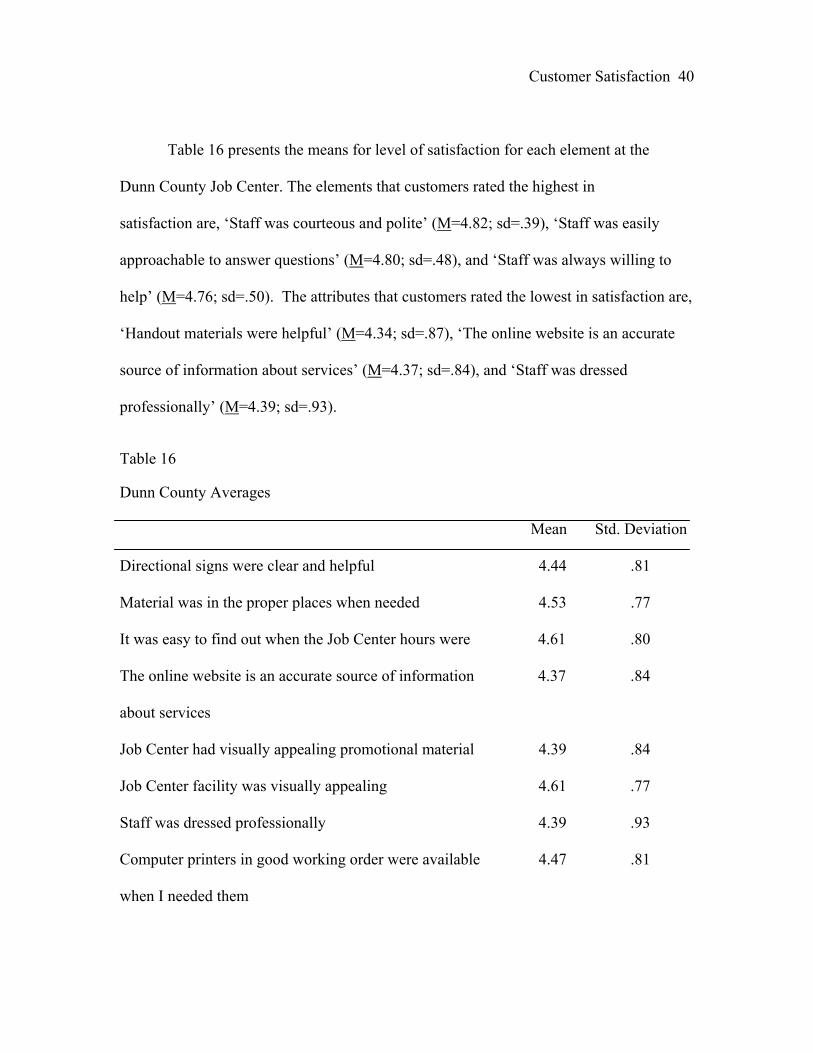
Customer Satisfaction 40 Table 16 presents the means for level of satisfaction for each element at the
Dunn County Job Center. The elements that customers rated the highest in satisfaction are, ‘Staff was courteous and polite’ (M=4.82; sd=.39), ‘Staff was easily
approachable to answer questions’ (M=4.80; sd=.48), and ‘Staff was always willing to
help’ (M=4.76; sd=.50). The attributes that customers rated the lowest in satisfaction are,
‘Handout materials were helpful’ (M=4.34; sd=.87), ‘The online website is an accurate
source of information about services’ (M=4.37; sd=.84), and ‘Staff was dressed
professionally’ (M=4.39; sd=.93).
Table 16 Dunn County Averages Mean Std. Deviation Directional signs were clear and helpful 4.44 .81 Material was in the proper places when needed 4.53 .77 It was easy to find out when the Job Center hours were 4.61 .80 The online website is an accurate source of information 4.37 .84 about services Job Center had visually appealing promotional material 4.39 .84 Job Center facility was visually appealing 4.61 .77 Staff was dressed professionally 4.39 .93 Computer printers in good working order were available 4.47 .81 when I needed them
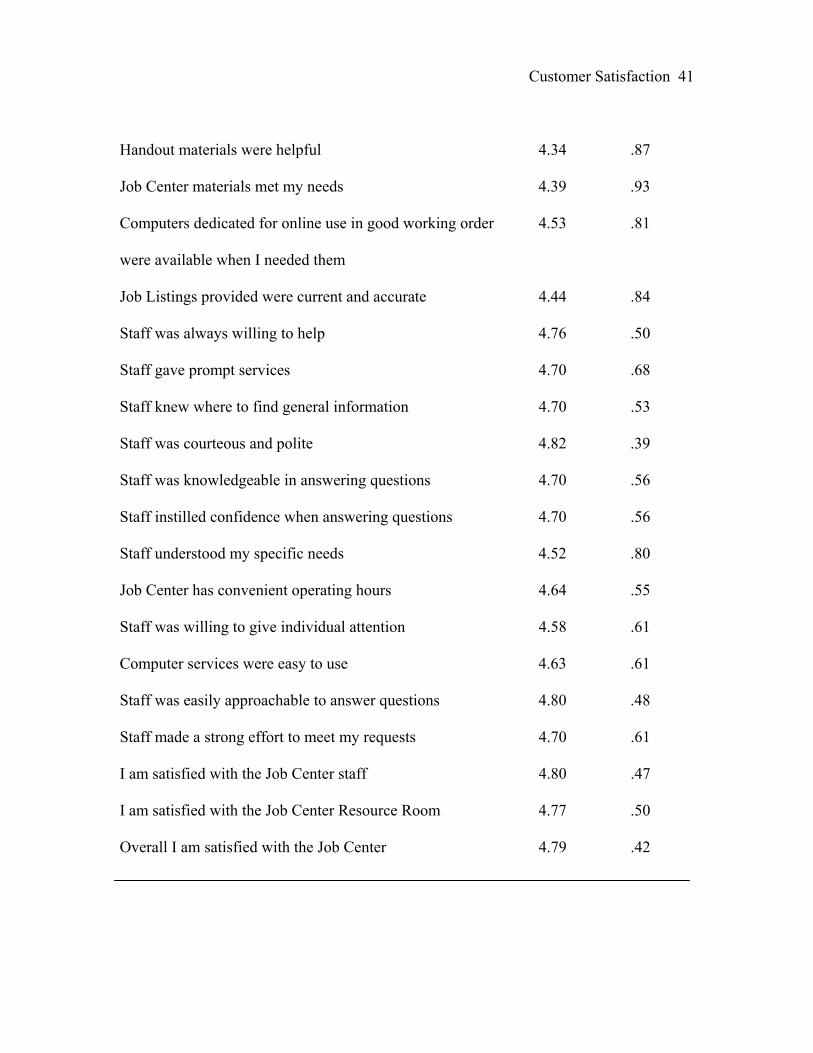
Customer Satisfaction 41 Handout materials were helpful 4.34 .87 Job Center materials met my needs 4.39 .93 Computers dedicated for online use in good working order 4.53 .81 were available when I needed them Job Listings provided were current and accurate 4.44 .84 Staff was always willing to help 4.76 .50 Staff gave prompt services 4.70 .68 Staff knew where to find general information 4.70 .53 Staff was courteous and polite 4.82 .39 Staff was knowledgeable in answering questions 4.70 .56 Staff instilled confidence when answering questions 4.70 .56 Staff understood my specific needs 4.52 .80 Job Center has convenient operating hours 4.64 .55 Staff was willing to give individual attention 4.58 .61 Computer services were easy to use 4.63 .61 Staff was easily approachable to answer questions 4.80 .48 Staff made a strong effort to meet my requests 4.70 .61 I am satisfied with the Job Center staff 4.80 .47 I am satisfied with the Job Center Resource Room 4.77 .50 Overall I am satisfied with the Job Center 4.79 .42
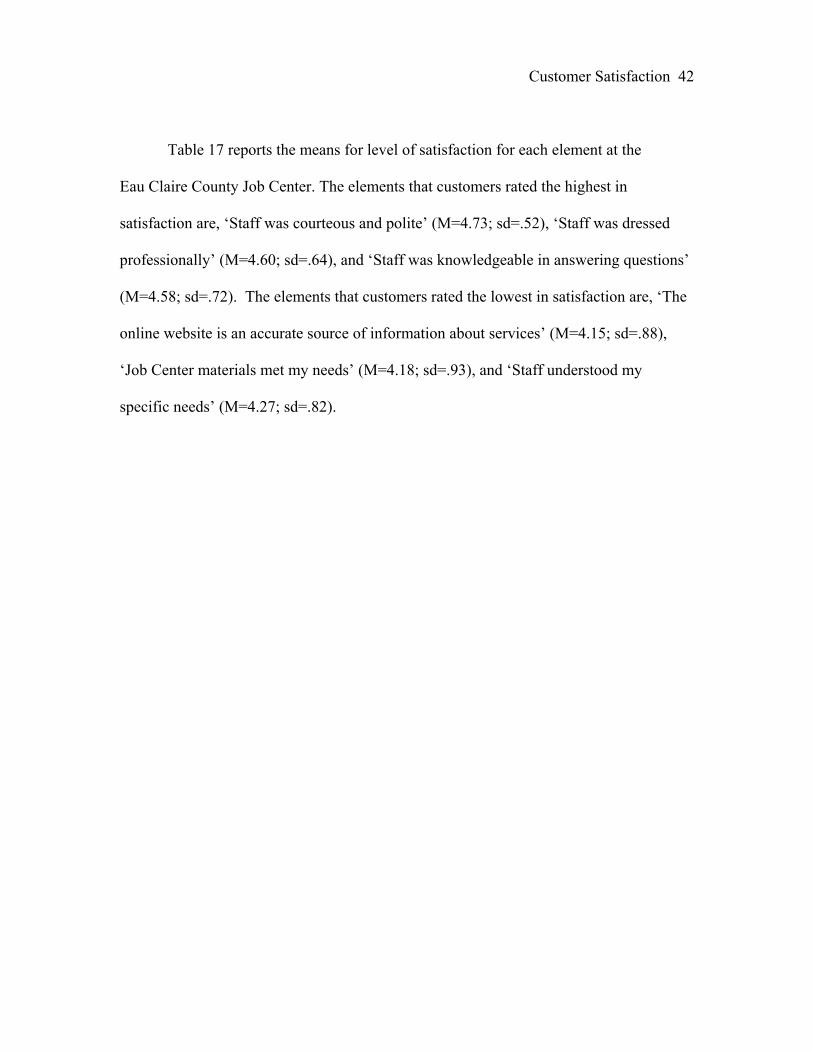
Customer Satisfaction 42 Table 17 reports the means for level of satisfaction for each element at the
Eau Claire County Job Center. The elements that customers rated the highest in satisfaction are, ‘Staff was courteous and polite’ (M=4.73; sd=.52), ‘Staff was dressed
professionally’ (M=4.60; sd=.64), and ‘Staff was knowledgeable in answering questions’
(M=4.58; sd=.72). The elements that customers rated the lowest in satisfaction are, ‘The
online website is an accurate source of information about services’ (M=4.15; sd=.88),
‘Job Center materials met my needs’ (M=4.18; sd=.93), and ‘Staff understood my
specific needs’ (M=4.27; sd=.82).
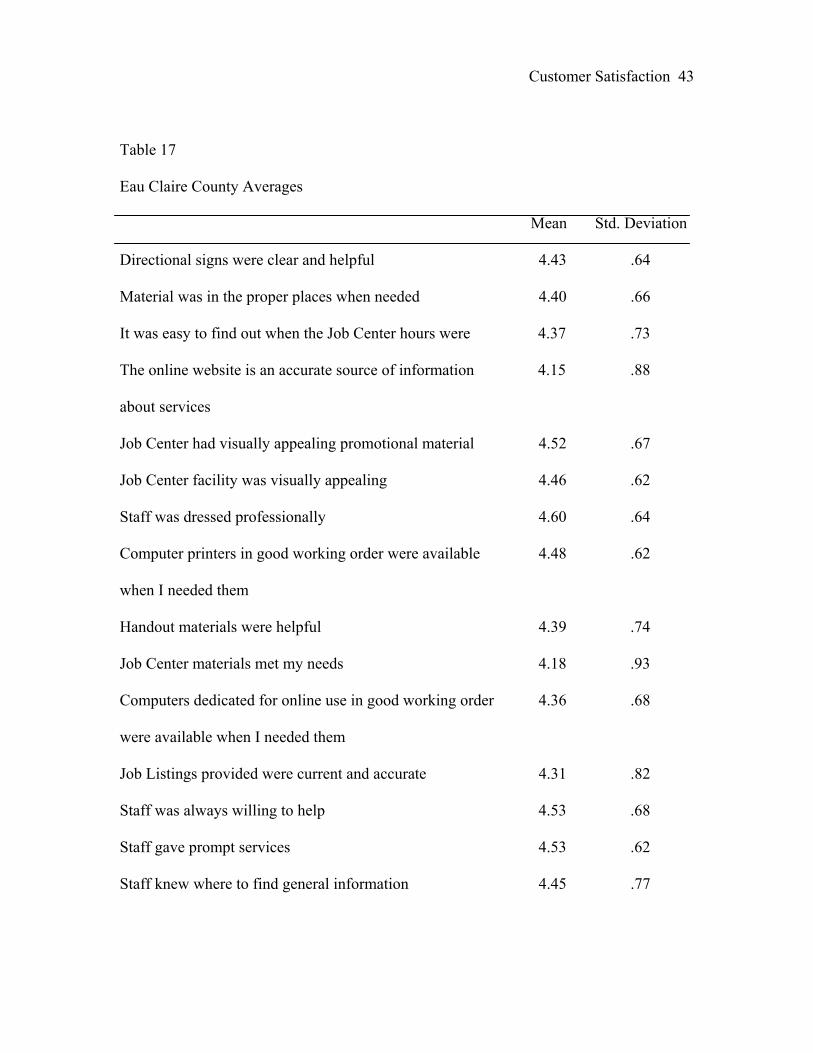
Customer Satisfaction 43 Table 17 Eau Claire County Averages Mean Std. Deviation Directional signs were clear and helpful 4.43 .64 Material was in the proper places when needed 4.40 .66 It was easy to find out when the Job Center hours were 4.37 .73 The online website is an accurate source of information 4.15 .88 about services Job Center had visually appealing promotional material 4.52 .67 Job Center facility was visually appealing 4.46 .62 Staff was dressed professionally 4.60 .64 Computer printers in good working order were available 4.48 .62 when I needed them Handout materials were helpful 4.39 .74 Job Center materials met my needs 4.18 .93 Computers dedicated for online use in good working order 4.36 .68 were available when I needed them Job Listings provided were current and accurate 4.31 .82 Staff was always willing to help 4.53 .68 Staff gave prompt services 4.53 .62 Staff knew where to find general information 4.45 .77
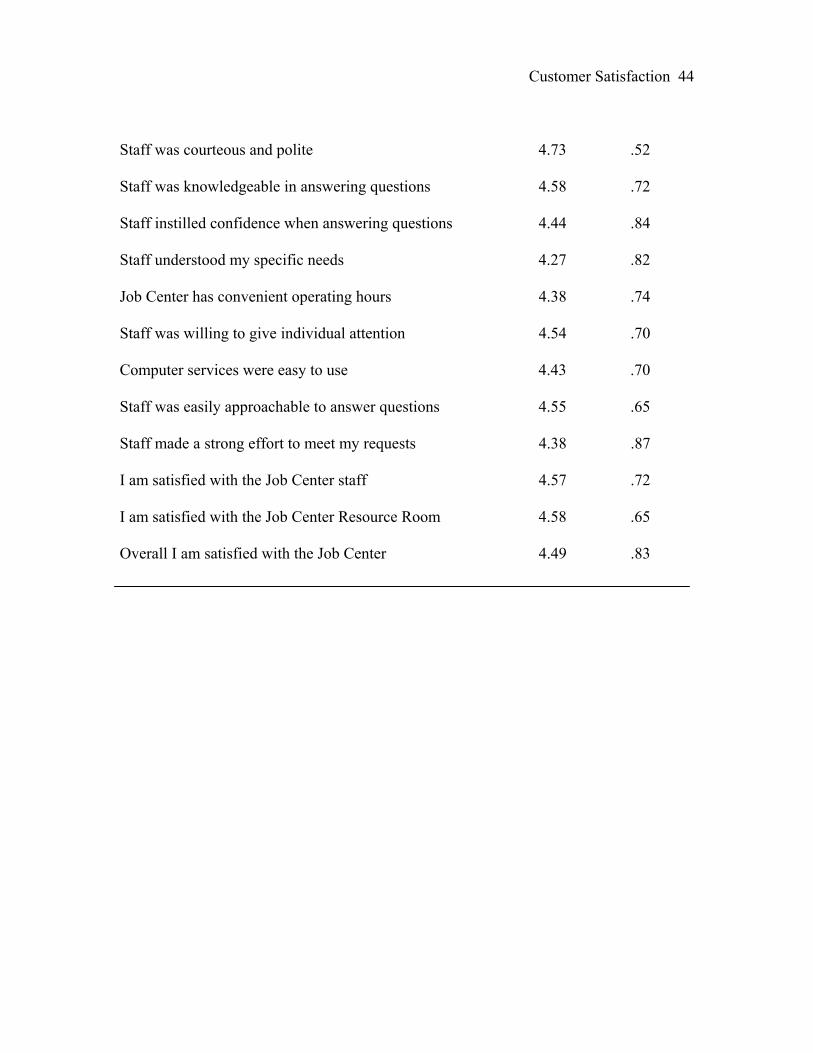
Customer Satisfaction 44 Staff was courteous and polite 4.73 .52 Staff was knowledgeable in answering questions 4.58 .72 Staff instilled confidence when answering questions 4.44 .84 Staff understood my specific needs 4.27 .82 Job Center has convenient operating hours 4.38 .74 Staff was willing to give individual attention 4.54 .70 Computer services were easy to use 4.43 .70 Staff was easily approachable to answer questions 4.55 .65 Staff made a strong effort to meet my requests 4.38 .87 I am satisfied with the Job Center staff 4.57 .72 I am satisfied with the Job Center Resource Room 4.58 .65 Overall I am satisfied with the Job Center 4.49 .83
Customer Satisfaction 45
A correlation analysis was used to identify linkages between the performance
attributes and overall satisfaction. Results revealed that all correlations were significant
and ranging from 0.64 to 0.86. The largest correlation found with overall satisfaction
was ‘Staff instilled confidence when answering questions’ (0.86). Other attributes highly
correlated with overall satisfaction were ‘Satisfaction with Job Center staff’ (0.84),
‘Satisfaction with resource room’ (0.84), and ‘Staff was easily approachable to answer
questions’ (0.81). Low correlation’s with overall satisfaction were ‘Computers dedicated
for online use in good working order were available when I needed them’ (0.64), ‘It was
easy to find out when the Job Center hours were’ (0.65), and ‘Job listings provided were
current and accurate’ (0.66). All five dimensions are well correlated with overall
satisfaction with ‘Assurance’ having the highest correlation.
To further explore and describe the relative importance of each performance
attribute’s influence on overall satisfaction, the twenty-four performance variables were
entered into the model regressed against overall satisfaction as the dependent variable.
The results showed that 74% of the variations in overall satisfaction can be explained by
the attribute, ‘Staff instilled confidence when answering questions’ (stepwise R=.858,
R2=.736, overall F=284.12 and significance of F=0.00). The attribute, ‘Job center
materials met my needs’ contributed a 6.8% change in variation of overall satisfaction
when regressed with the first variable.

Customer Satisfaction 46
The two predictors explain 80% of the variation in overall satisfaction (stepwise R=.897,
R2=.804, overall F=207.28 and significance of F=0.00). To increase overall satisfaction,
it is reasonable to focus the Job Center’s improvement efforts on these two attributes.
Customer Satisfaction 47
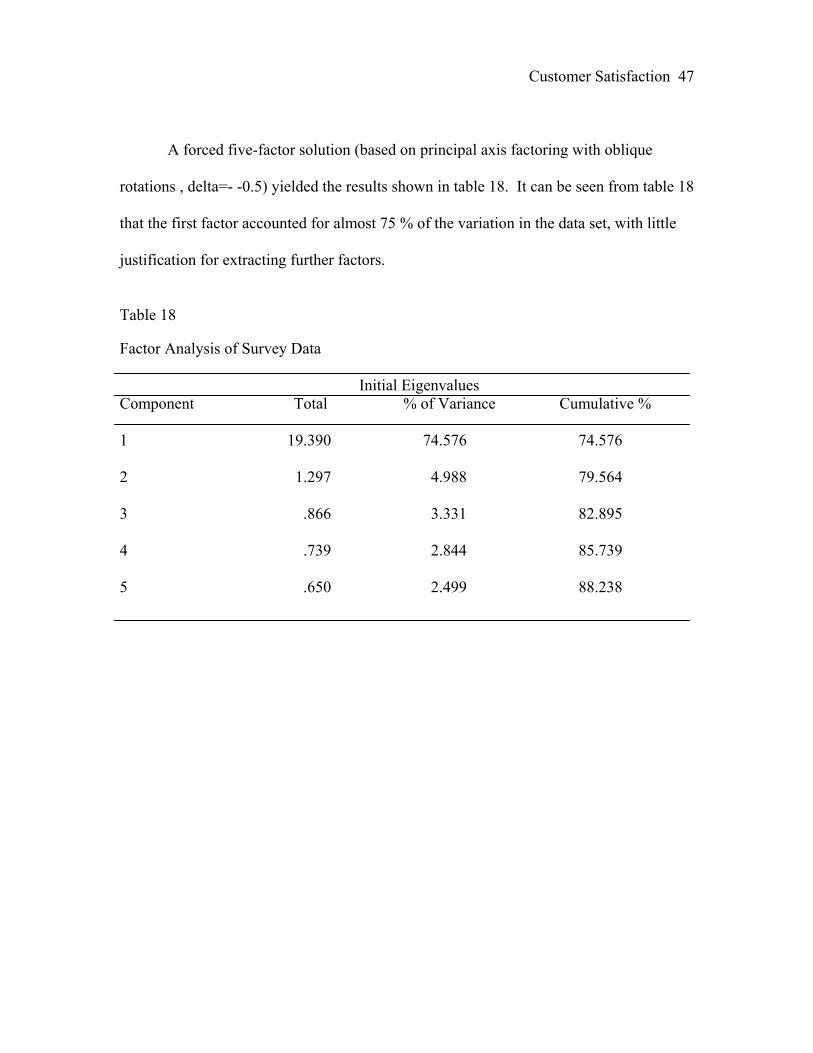
A forced five-factor solution (based on principal axis factoring with oblique
rotations , delta=- -0.5) yielded the results shown in table 18. It can be seen from table 18
that the first factor accounted for almost 75 % of the variation in the data set, with little
justification for extracting further factors.
Table 18 Factor Analysis of Survey Data Initial Eigenvalues Component Total % of Variance Cumulative % 1 19.390 74.576 74.576 2 1.297 4.988 79.564 3 .866 3.331 82.895 4 .739 2.844 85.739 5 .650 2.499 88.238

Customer Satisfaction 48
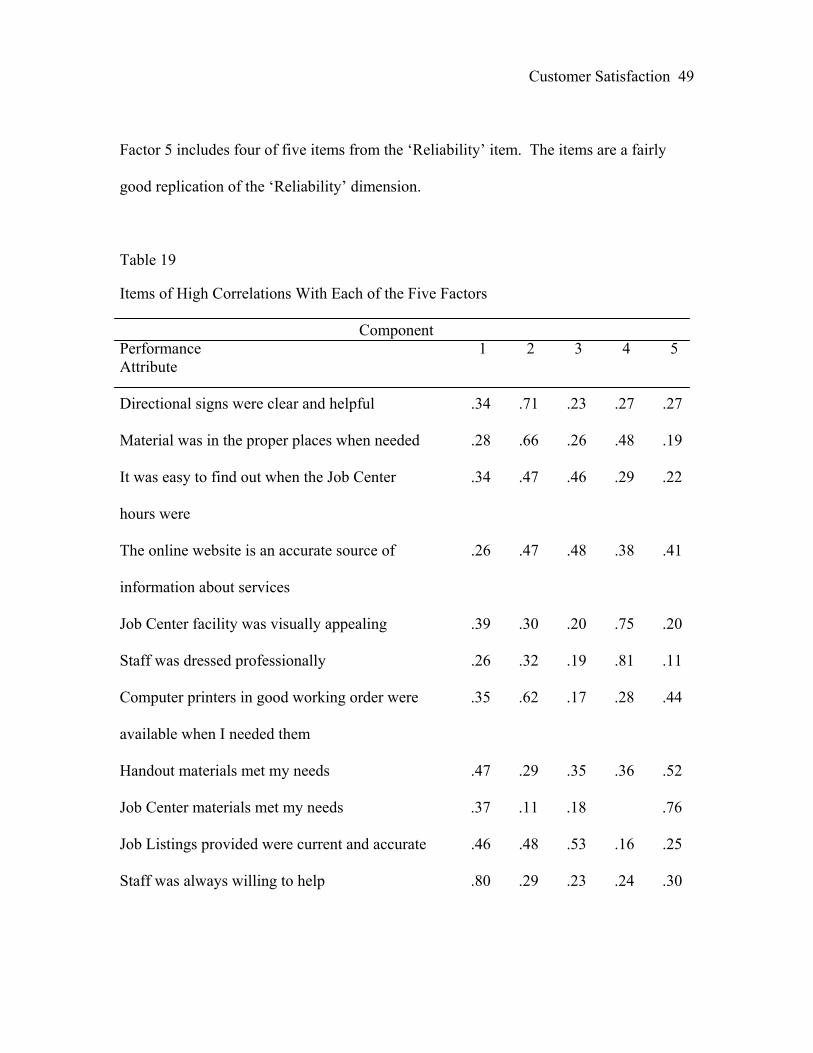
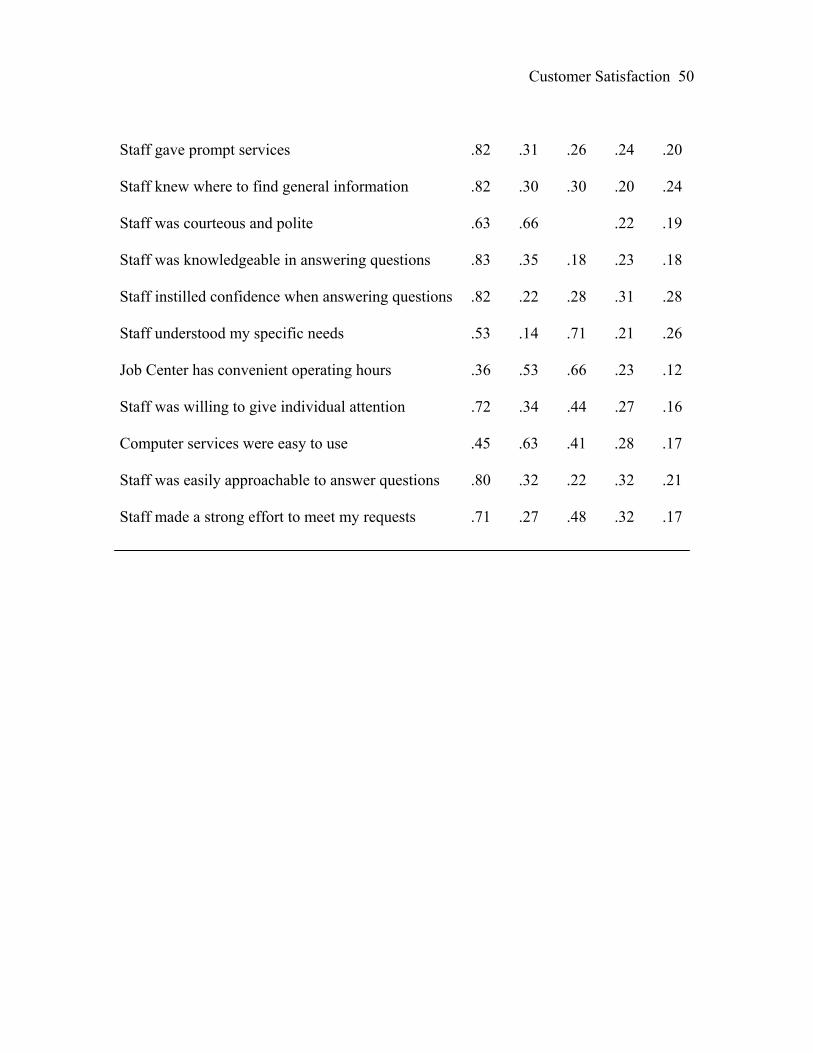
The factor analysis indicates that the loadings of factor 1 are very high. It revealed
(Table 19) that the ‘Empathy’ and ‘Reliability’ dimensions appear relatively
unambiguous but that there is an overlap between two of the a priori factors. The
‘Tangible’ dimension appears to split into two separate factors.
Factor 1 includes all of the ‘Responsiveness’ items along with three items from the
‘Assurance’ dimension and three from the ‘Empathy’ dimension. These nine dimensions
relate to staff responsiveness and insight into the customer’s needs.
Factor 2 includes two of seven items from the ‘Tangible’ dimension, one from the
‘Reliability’ dimension, and a item from the ‘Empathy’ dimension. Items relate to ease
of use and accessibility of resources and staff.
Factor 3 includes five of six items from the ‘Empathy’ dimension and an item from the
‘Reliability’ dimension.
Factor 4 includes four items from the ‘Tangible’ dimension and one item from the
‘Reliability dimension. Items relate to visual appearance of physical surroundings and
staff, which strongly associate with the ‘Tangible’ dimension.
Customer Satisfaction 49
Factor 5 includes four of five items from the ‘Reliability’ item. The items are a fairly
good replication of the ‘Reliability’ dimension.
Table 19 Items of High Correlations With Each of the Five Factors Component Performance 1 2 3 4 5 Attribute Directional signs were clear and helpful .34 .71 .23 .27 .27 Material was in the proper places when needed .28 .66 .26 .48 .19 It was easy to find out when the Job Center .34 .47 .46 .29 .22 hours were The online website is an accurate source of .26 .47 .48 .38 .41 information about services Job Center facility was visually appealing .39 .30 .20 .75 .20 Staff was dressed professionally .26 .32 .19 .81 .11 Computer printers in good working order were .35 .62 .17 .28 .44 available when I needed them Handout materials met my needs .47 .29 .35 .36 .52 Job Center materials met my needs .37 .11 .18 .76 Job Listings provided were current and accurate .46 .48 .53 .16 .25 Staff was always willing to help .80 .29 .23 .24 .30
Customer Satisfaction 50 Staff gave prompt services .82 .31 .26 .24 .20 Staff knew where to find general information .82 .30 .30 .20 .24 Staff was courteous and polite .63 .66 .22 .19 Staff was knowledgeable in answering questions .83 .35 .18 .23 .18 Staff instilled confidence when answering questions .82 .22 .28 .31 .28 Staff understood my specific needs .53 .14 .71 .21 .26 Job Center has convenient operating hours .36 .53 .66 .23 .12 Staff was willing to give individual attention .72 .34 .44 .27 .16 Computer services were easy to use .45 .63 .41 .28 .17 Staff was easily approachable to answer questions .80 .32 .22 .32 .21 Staff made a strong effort to meet my requests .71 .27 .48 .32 .17
Customer Satisfaction 51 These outcomes therefore suggest a slightly different orientation of the original
SERVQUAL dimensions, perhaps into the groupings:
• Responsiveness and Insight;
• Accessibility and Ease of Use;
• Reliability;
• Tangibles;
• Empathy Results concerning ‘Empathy’ and ‘Tangibles’ dimensions are consistent with a
previously reported study involving SERVQUAL in the business and marketing
sector (e.g. Donnelly, Hull, & Will, 2000).
Customer Satisfaction 52
CHAPTER FIVE
DISCUSSION
This paper examined the satisfaction of walk-in clients using the programs,
services, and technical assistance provided by One-Stop Job Centers in Chippewa, Dunn,
and Eau Claire counties. The reliability and validity of the five quality dimensions
identified through the SERVQUAL Approach and used for this paper was also examined.
Through this research we have identified the areas that customers rated high in
satisfaction and what variables essentially contribute to overall satisfaction. In addition,
based on demographic data taken, the investigator was able to report the characteristics of
the customers using the Job Centers and what services are being used.
Data was analyzed on each of the twenty-seven items used to initially determine a
customer’s satisfaction level. The purpose of this analysis was to establish what
programs, services, and assistance customers were satisfied and not satisfied with.
Consistent with past customer satisfaction research, satisfaction was rated fairly high
across all variables. Individuals rated staff responsiveness and effort of staff to assist
customers when needed highest in satisfaction. Individuals rated the accuracy of website
materials, such as employment listings lowest in satisfaction. In addition, meeting the
needs of the customers was rated lower in satisfaction. Overall customers were very
satisfied with Job Center staff, the resource rooms and the three Job Centers in general.
A regression analysis was employed on twenty-four performance variables used
to determine satisfaction. This was carried out to determine the relative weight each
Customer Satisfaction 53
performance attribute’s ratings have on overall satisfaction. Data suggested that to
increase satisfaction, it is reasonable to focus improvement efforts on the confidence
customer’s feel when helped by Job Center staff. This attribute has the strongest affect
on overall satisfaction. In addition, meeting the needs of the customers had a relatively
strong effect on overall satisfaction and should be noted when focusing on service
improvement.
To determine if the attributes based on performance ratings assigned to those
attributes are grouped into the correct dimensions a Factor Analysis was used. The
Factor Analysis can simplify the customer satisfaction instrument used, by identifying the
performance attributes that best represent the evaluative dimensions and eliminating
attributes that overlap. Results revealed that the ‘Empathy’ and ‘Reliability’ dimensions
emerge relatively accurate. The ‘Tangible’ dimension appears to split into two separate
factors and there seems to be overlap between the remaining two factors. The results
therefore recommend a slightly different orientation of the original SERVQUAL
dimensions, perhaps separated into dimensions: ‘Responsiveness and Insight’,
‘Accessibility and Ease of Use’, ‘Reliability’, ‘Tangibles’ and ‘Empathy’.
The modified SERVQUAL instrument shows high reliability in each dimension
as well as overall. However, data reveals an overlapping of the ‘Responsiveness’,
‘Accessibility’, and ‘Tangibles’ dimensions suggesting that further research is needed to
identify additional elements important to customer satisfaction.
Customer Satisfaction 54
There were 121 subjects who participated in this study, extending the data collection
period would be valuable in gathering a larger subject size and as a result discover more
variation among the ratings. The months of June and July are traditionally used for
vacations, conducting the study during a different time of the year may also increase the
number of individuals who could take part.
Additional research may include examining the remaining Job Centers that are
part of the Workforce Development Area in Northwestern Wisconsin. Further research
may involve looking into services such as Green Thump, youth groups, job coaching, and
individualized training more thoroughly. Improving the working relationships with local
employers and educational institutions could involve investigating organizational
recruitment success and training effectiveness when supported by the Job Centers.
Using the information obtained from this research, Job Center services can be
fine-tuned to meet the customers needs and expectations. The outcomes will provide
insight to Job Center staff on the effectiveness and relevance of services and tools used
by customers. With this information the Job Centers will be able to recognize areas that
are utilized the most, need improvement, and have not fulfilled the needs of its
customers.
Customer Satisfaction 55
References
America’s Workforce Network. (2001). Employment and Training Administration. Available: www.usworkforce.org. Bridge, B., Fischer, J., & Larisch, R., (1995). The Voice of the Customer. A Guide to Measuring Satisfaction with Employment and Training Programs. Employment and Training Administration. D’Amico, R., Fedrav, R., Kimball, M., Midling, M., & Soukamneuth, S., (1999). A evaluation of the self-service approach in One-stop Career Centers. U.S. Department of Labor, 1-10.
Donnelly, M., Hull, S., & Will, V., (2000). Assessing the quality of service
provided by market research agencies. Total Quality Management, 11, S490.
Donnelly, M., & Shiu, E., (1999). Assessing service quality and its link with
vaule for money in the UK local authority’s housing repair service using the
SERVQUAL Approach. Total Quality Management, 10, S498. Hayes, B., (1992). Measuring Customer Satisfaction. Development and Use of Questionnaires. Milwaukee, WI: ASQC Quality Press. Hayes, B., (1998). Measuring Customer Satisfaction. Survey Design, Use, and Statistical Analysis Methods. Milwaukee, WI: ASQC Quality Press. McColl-Kennedy, J., & Schneider, V., (2000). Measuring customer satisfaction: why, what, and how. Total Quality Management, 11, 7, S882.
Customer Satisfaction 56
National Association of State Workforce Agencies. (2001). Available: www.dwd.state.wi.us/dwepfe/TAG/TAG_introduction.htm. Schack, R., (1999). Performance measurement gets results at Connecticut Department of Labor. PA Times, 22, 5, 1. Schmit, M., & Allscheid, S., (1995). Employee attitudes and customer satisfaction: Making theoretical and empirical connections. Personnel Psychology, 48, 3, 521. Shepherd, D.C., (1999). Service quality and the sales force: A tool for competitive advantage. Journal of Personal Selling & Sales Management, 9, 3, 73. South, L. H., (2000). One Stop Job Centers. FDCH Congressional Testimony. Tomkovick, C., & Al-Khatib, J., (1996). An assessment of the service quality provided to foreign students at U.S. business schools. Journal of Education for Business, 71, 3, 130. Tompkins, N.C., (1992). Employee satisfaction leads to customer service. HR Magazine, 37, 93-95. U.S. Department of Labor Employment and Training Administration. (2001). One-Stop Employment and Training Services. Available: www.doleta.gov Vavra, T., (1997). Improving Your Measurement of Customer Satisfaction. Milwaukee, WI: ASQC Quality Press.
Weaver, J.J. (1994). Want customer satisfaction? Satisfy your employee’s first. HR Magazine, 39, 112, 110.
Customer Satisfaction 57
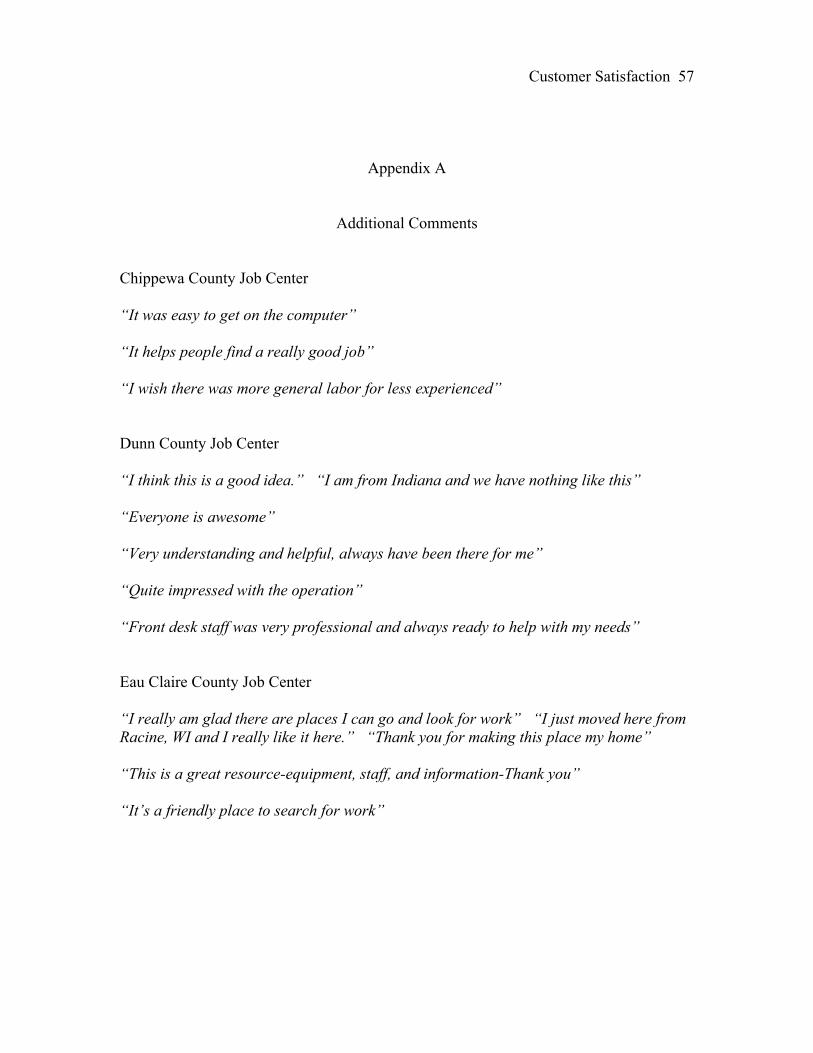
Appendix A
Additional Comments
Chippewa County Job Center “It was easy to get on the computer” “It helps people find a really good job” “I wish there was more general labor for less experienced” Dunn County Job Center “I think this is a good idea.” “I am from Indiana and we have nothing like this” “Everyone is awesome” “Very understanding and helpful, always have been there for me” “Quite impressed with the operation” “Front desk staff was very professional and always ready to help with my needs” Eau Claire County Job Center “I really am glad there are places I can go and look for work” “I just moved here from Racine, WI and I really like it here.” “Thank you for making this place my home” “This is a great resource-equipment, staff, and information-Thank you” “It’s a friendly place to search for work”
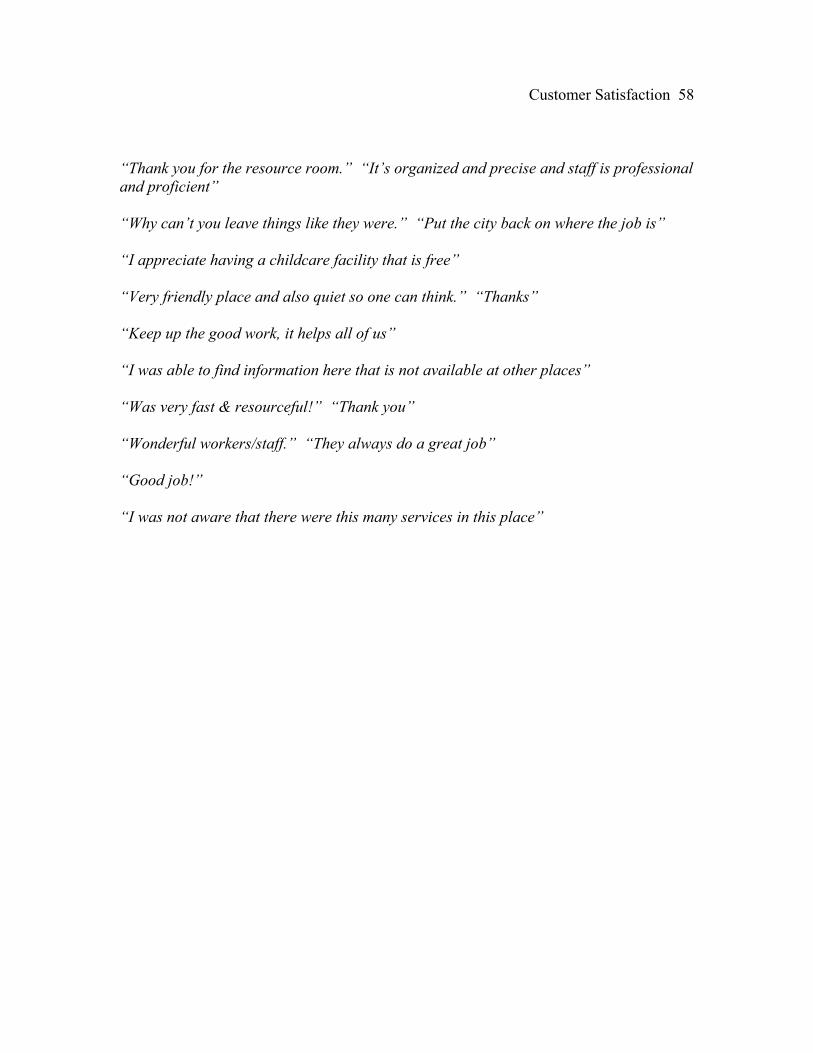
Customer Satisfaction 58
“Thank you for the resource room.” “It’s organized and precise and staff is professional and proficient” “Why can’t you leave things like they were.” “Put the city back on where the job is” “I appreciate having a childcare facility that is free” “Very friendly place and also quiet so one can think.” “Thanks” “Keep up the good work, it helps all of us” “I was able to find information here that is not available at other places” “Was very fast & resourceful!” “Thank you” “Wonderful workers/staff.” “They always do a great job” “Good job!” “I was not aware that there were this many services in this place”
Customer Satisfaction 59
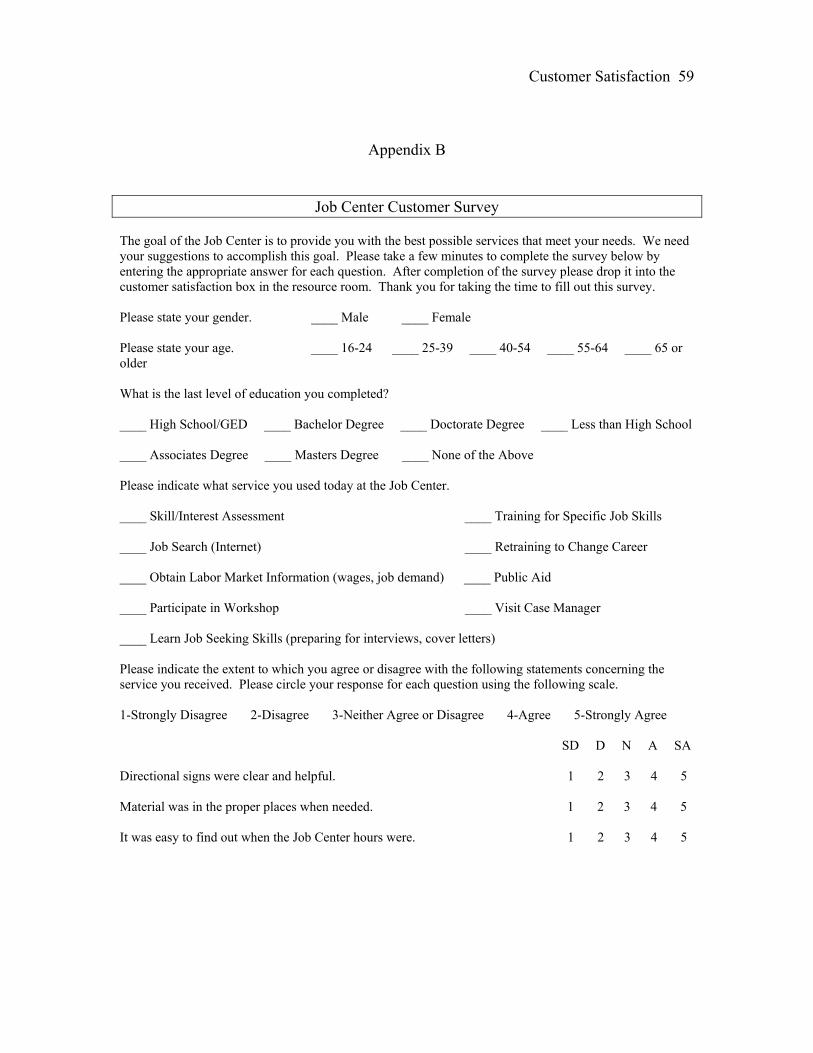
Appendix B
Job Center Customer Survey The goal of the Job Center is to provide you with the best possible services that meet your needs. We need your suggestions to accomplish this goal. Please take a few minutes to complete the survey below by entering the appropriate answer for each question. After completion of the survey please drop it into the customer satisfaction box in the resource room. Thank you for taking the time to fill out this survey. Please state your gender. ____ Male ____ Female Please state your age. ____ 16-24 ____ 25-39 ____ 40-54 ____ 55-64 ____ 65 or older What is the last level of education you completed? ____ High School/GED ____ Bachelor Degree ____ Doctorate Degree ____ Less than High School ____ Associates Degree ____ Masters Degree ____ None of the Above Please indicate what service you used today at the Job Center. ____ Skill/Interest Assessment ____ Training for Specific Job Skills ____ Job Search (Internet) ____ Retraining to Change Career ____ Obtain Labor Market Information (wages, job demand) ____ Public Aid ____ Participate in Workshop ____ Visit Case Manager ____ Learn Job Seeking Skills (preparing for interviews, cover letters) Please indicate the extent to which you agree or disagree with the following statements concerning the service you received. Please circle your response for each question using the following scale. 1-Strongly Disagree 2-Disagree 3-Neither Agree or Disagree 4-Agree 5-Strongly Agree SD D N A SA Directional signs were clear and helpful. 1 2 3 4 5 Material was in the proper places when needed. 1 2 3 4 5 It was easy to find out when the Job Center hours were. 1 2 3 4 5
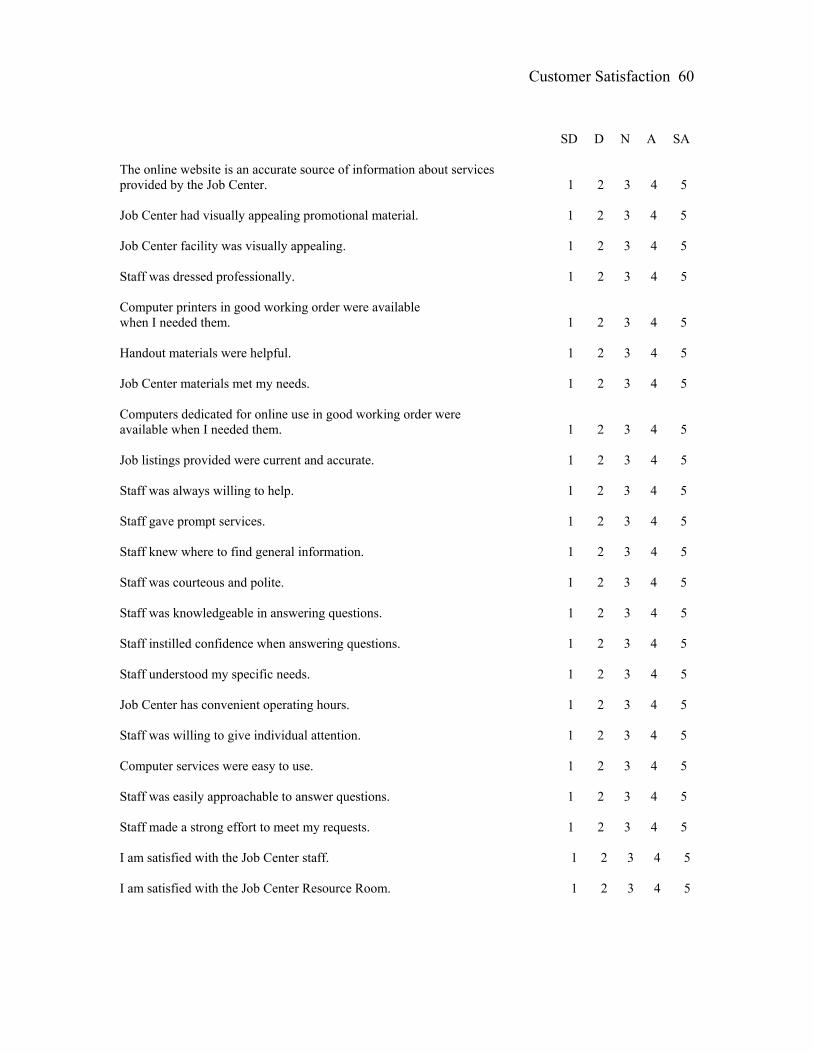
Customer Satisfaction 60 SD D N A SA The online website is an accurate source of information about services provided by the Job Center. 1 2 3 4 5 Job Center had visually appealing promotional material. 1 2 3 4 5 Job Center facility was visually appealing. 1 2 3 4 5 Staff was dressed professionally. 1 2 3 4 5 Computer printers in good working order were available when I needed them. 1 2 3 4 5 Handout materials were helpful. 1 2 3 4 5 Job Center materials met my needs. 1 2 3 4 5 Computers dedicated for online use in good working order were available when I needed them. 1 2 3 4 5 Job listings provided were current and accurate. 1 2 3 4 5 Staff was always willing to help. 1 2 3 4 5 Staff gave prompt services. 1 2 3 4 5 Staff knew where to find general information. 1 2 3 4 5 Staff was courteous and polite. 1 2 3 4 5 Staff was knowledgeable in answering questions. 1 2 3 4 5 Staff instilled confidence when answering questions. 1 2 3 4 5 Staff understood my specific needs. 1 2 3 4 5 Job Center has convenient operating hours. 1 2 3 4 5 Staff was willing to give individual attention. 1 2 3 4 5 Computer services were easy to use. 1 2 3 4 5 Staff was easily approachable to answer questions. 1 2 3 4 5 Staff made a strong effort to meet my requests. 1 2 3 4 5 I am satisfied with the Job Center staff. 1 2 3 4 5 I am satisfied with the Job Center Resource Room. 1 2 3 4 5
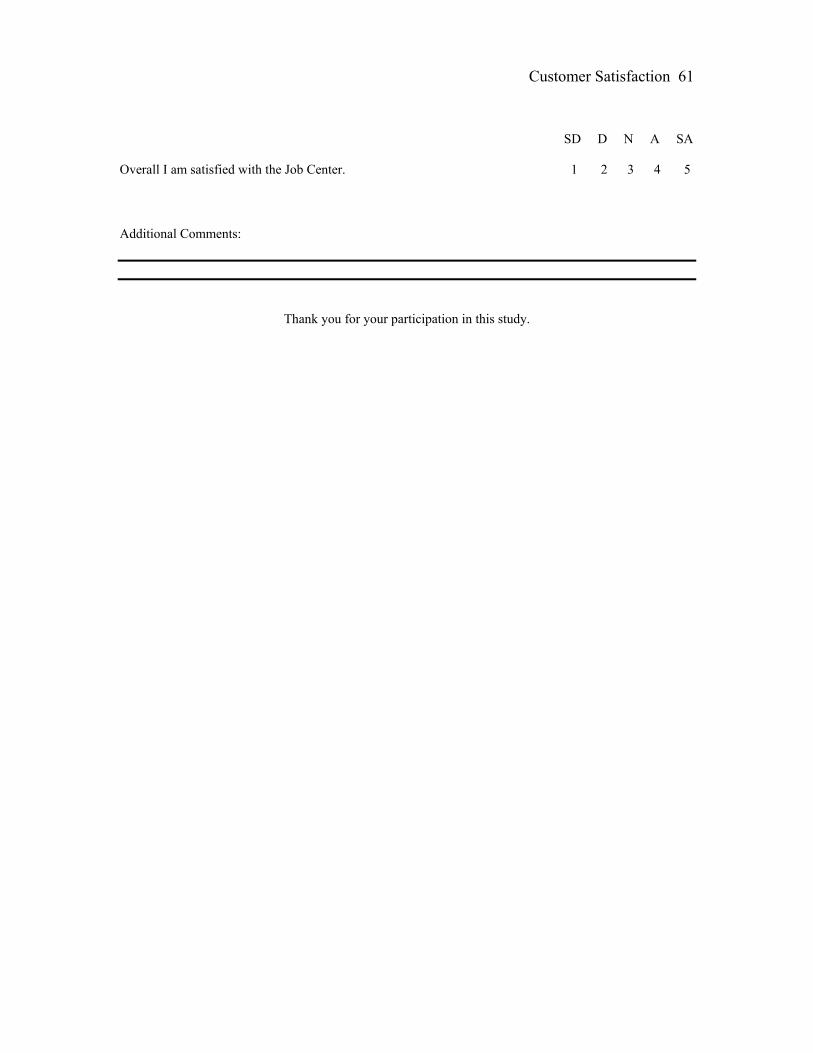
Customer Satisfaction 61
SD D N A SA Overall I am satisfied with the Job Center. 1 2 3 4 5
Additional Comments:
Thank you for your participation in this study.