customer satisfaction and customer loyalty in …gedu college of business studies royal university...
TRANSCRIPT

XXI Annual International Conference Proceedings; January 2020
ISBN No. 978-81-936606-2-1 http://www.internationalconference.in/XXI_AIC/INDEX.HTM Page 275
CUSTOMER SATISFACTION AND CUSTOMER LOYALTY IN ONLINE SHOPPING:
ASTUDY ON UNIVERSITY STUDENTS OF BHUTAN
Dr. Shad Ahmad Khan
Assistant Professor
College of Business
University of Buraimi
Al Buraimi
Sultanate of Oman
Dr. Thoudam Prabha Devi
Assistant Professor
College of Business
University of Buraimi
Al Buraimi
Sultanate of Oman
Dr. T. Antony. A. Ligori
Assistant Professor
Gedu College of Business Studies
Royal University of Bhutan
Gedu,
Bhutan
Mr. Muhammad Saleem,
Lecturer,
College of Business,
University of Buraimi,
Al Buraimi
Sultanate of Oman
Abstract
Purpose-Today with the advancement of e-commerce and online consumer shopping trends the
significance of creating and retaining e-loyalty in electronic market places has come into picture
in marketing theory and practice. Managing the consumer confidence, satisfaction, loyalty and
attitude of ecommerce services is necessary for growth in a long run for a business as the
competition in e-commerce is intense; it becomes more important for shopping online. This
paper attempts to seek out loyalty and satisfaction of university students of Bhutan in organized
ecommerce sites. Considering the factors acceptance of technology and quality of service in

XXI Annual International Conference Proceedings; January 2020
ISBN No. 978-81-936606-2-1 http://www.internationalconference.in/XXI_AIC/INDEX.HTM Page 276
online, the study seeks to check the relationship and impact of “e-satisfaction” and “e-loyalty” in
the context of online shopping among university students of Bhutan.
Design/methodology/ approach- This study uses a descriptive statistics, reliability and
correlation analysis through SPSS and structural equation modeling (SEM) through AMOS as an
analytical tool to explore the demographic frequencies and to explore how the students among
university of Bhutan are influence by external factors that is technology acceptance factors and
service qualities.
Findings: The research result of this study shows that the technology acceptance has a direct and
positive effect on customer satisfaction and customer loyalty. Further, the study reveals that
quality of service in online shoppinghas a direct and positive influence on customer e-
satisfaction and e-loyalty. When the influence of customer e-satisfaction was checked on
customer e-loyalty, the same was found to positive and direct. With the help of SEM, it was
found out that quality of service online has more influence on customer satisfaction as compared
to technology acceptance factors and this will ultimately lead to customer loyalty.
Research Limitation/Implications: This study is mainly focused on the online purchase
behavior among the university students of Royal University of Bhutan, thus the results of this
study cannot be generalized to the whole of the nation or demography that not related to the
university students like higher income groups, higher age group, people with negligible exposure
to technology etc. Further, the psychological factors are expected to change with the penetration
and usage of technology and subsequently change completely with advent of new technology.
Originality/value: This paper is an original paper based on the primary data collected from the
students of Royal University of Bhutan.
Paper type: Paper is based on descriptive and cross-sectional analysis
Key Words- Online shopping, TAM factors, online service quality, Customer Loyalty, Customer
Satisfaction, University Students.
.
XXI Annual International Conference Proceedings; January 2020
ISBN No. 978-81-936606-2-1 http://www.internationalconference.in/XXI_AIC/INDEX.HTM Page 277
Introduction
More than 50 percent of the world‟s population wasreported to be online in 2017. In the year
2018, the number of internet users was reported to be 4.021 billion with a social media users as
3.196 along with 5.135 billion number of mobile phone users, this clearly shows that the number
of internet users is increasing every year (Kemp, 2018). As the time passes the new technology is
upgraded and given many comfort and usefulness to the user as a result people tend to seek the
comfort and work performance as the main tools. “The advancement in internet and mobile
technology has not only enhanced communication and information sharing culture among the
Bhutanese but it has also led to an exhilarating growth of doing business online that was
unimaginable a few years ago” according to Pema Seldon, due to which it has boosted up the
online shopping among the Bhutanese people as the number of internet subscribers has increased
over 28% from 2016 to 2017 i.e. 5,65,557 to 7,26,138 which shows that many Bhutanese people
are now getting familiar with such technology.
The number of smart phone users‟ worldwide has reached 2.32 billion in the year 2017 and will
reach up to 2.87 billion by 2020. Likewise, shopping through online services using websites and
apps like Flip kart, Myntra, Snap deal, Amazon.com, AliExpress are used quite often by
Bhutanese society(Tshomo, 2015).
The use of such websites and apps has made Bhutanese people feel more convenient without
them having to physically visit the stores and they can just avail services from the sites where
ever they are and as per the report, 38% of the active internet users are of university students of
Bhutan (Lhamo, 2018) . This has ultimately led customer satisfaction among Bhutanese students
which in turn, has led to the loyalty towards the sites and apps that they avail. But, for the
satisfaction and loyalty to be obtained by the customers, it is the external factors that they have to
consider while availing the services in online websites and apps. External factors are the strength
that impact the business rapidly and those influences or the situations that the individuals cannot
control while taking decisions (Poll, 2017).
Sufficient numbers of researches have advocated the role of factors like acceptance of
technology and online service quality playing a significant role to influence customer satisfaction
and loyalty towards online shopping (Shih etal 2004).
XXI Annual International Conference Proceedings; January 2020
ISBN No. 978-81-936606-2-1 http://www.internationalconference.in/XXI_AIC/INDEX.HTM Page 278
Problem statement
There are many avenues for purchasing the goods that people want, through online websites.
Today in the internet driven world shopping is a field that everyone is attracted to, from the basic
human need to the unlimited desires of the people, purchases through online has become a
convenient one. Online shopping is considered convenient, if the services provided are upto the
satisfaction of the user. According to Lin and Sun (2009), the satisfaction is measured through a
post-activity measurement index that quantifies the inner state of being happy about the
customer's purchases in the past. Due to which when a consumer experiences satisfaction it
directly leads to customer loyalty. Bhutan is still considered as a new platform for online
shopping for both sellers and customers. And from it young people have been the majority
shoppers which mostly include university students who are going to be future customers of the
online world as a result they will define the fate of existing online shopping as well as upcoming
online shopping channels (Dey, 2014). But with no proper understanding on online shopping site
many problems are faced while entering into the world of online shopping in terms of online
service quality/ reliability on the website. Together with that the adoption of technology in the
area of online shopping is still growing and much aren‟t aware of it though (Seldon, 2017).
However, buying satisfaction and loyalty are directly influenced by considering the external
factors namely the acceptance of technology and online service quality. Hence, the present study
is to find the relationship between “customer satisfaction” and “customer loyalty”through online
shopping.
Significance of the study
This study stimulates growth of online shopping using technology and making right decision on
purchasing of goods and services through online placing an important e-commerce business in
the society. The study serves as a reference to other local researcher about the current knowledge
on satisfaction and loyalty of the Bhutanese college students. In addition to this, the present
study becomes more significant as:
Majority of the research on online shopping for loyalty and satisfaction has been
conducted for the developed countries; very limited study is available for developing
XXI Annual International Conference Proceedings; January 2020
ISBN No. 978-81-936606-2-1 http://www.internationalconference.in/XXI_AIC/INDEX.HTM Page 279
nations. Least developed economies like Bhutan have been ignored by researchers across
the globe.
Online Shopping being a new concept in Bhutan suffers non availability of online support
platforms, the perception towards online shopping may identify avenue through which
such platforms can be developed.
Literature review
Our study is concerned with the students driven towards online shopping by external factors that
have been identified from the review of conceptualized theories and related literatures. The main
factors considered for our study are technology acceptance factors and service qualities which
will be determining the influence towards customers‟ loyalty and satisfaction through online
shopping.
Customers in recent shopping online which increases over the recent years. According to Farber
(2016), shoppers now make 51 percent of their purchases online, compared to the purchases in
2015 and 2014. Internet shopping was invented and pioneered by Michael Aldrich in 1979 and
is still present till today‟s date. Many researchers have found that online shopping has enhanced
the shopping outcomes of its customer in Bhutan. The effort to infuse purchase behavior on
online shopping among college students is not recent. In case of Bhutan, telecommunication
network was launched in 1963 and computers during early 1980s and internet were introduced
later in 1999. The development of internet has led to the improved communication and
information and accelerated the growth of online shopping that was unimaginable a few years
ago among Bhutanese people(Selden, 2017).
Together with growth in internet it has also motivated college students in offering access to the
products of wide range beyond their desires had influenced many customer ranging from student
to other people in providing convenient space without having to physically visit the stores, and if
provided services are upto the standard of its consumer then it will be called as satisfaction.
Hence if provided with satisfaction the customer is bound to be resulted as loyal, as it has
resulted in positive emotional experience in buying the product from internet. But for a
developing country like Bhutan which still lacks in providing such convenience as it mostly deal
with the timely delivering issues་(Choezom, 2017). Our study is concerned with the students

XXI Annual International Conference Proceedings; January 2020
ISBN No. 978-81-936606-2-1 http://www.internationalconference.in/XXI_AIC/INDEX.HTM Page 280
driven towards online shopping by the factors that have been identified from the review of
conceptualized theories and related literatures. Several studies have dealt the role of internet
technology and quality of service that impacts customer satisfaction and loyalty and also the
emotional feelings, one‟s attitude and conduct on while shopping online (Flavian, Gurrea, &
Guinaliu, 2006).
Technology Acceptance Model
The main source of e-shopping is from websites. Customers get to create a platform where they
can have a wide variety of choice online based on their needs but to make use of e-shopping,
customers must make sure that the use of website is easier and useful for them.
Most of the researches have adopted the technology acceptance factors where it measures the
willingness of the customers to do online shopping. According to Davis (1989) and “The
Technology Acceptance Model (TAM)”explains how user adopts the Information Technology
(IT) or Information Systems (IS) for shopping online. TAM has two main drivers which act as
factors to influence user to accept the technology or information system that is “Perceived ease
of use (PEOU)” and “Perceived usefulness (PU)”.
In this context, PU is defined as,“the degree to which a person believes on IT towards his
shopping performance. If the students believe that the internet shopping use will benefit him or
her, they would be willing to make use of it”. It has known that perceived usefulness have a
direct influence over online purchase behavior. Davis (1989) mentioned that PEOU will have
indirect influence on system usage through PU, there is direct connection between the use and
usefulness as a result there is an intention for the user to accept the technology.Technology
acceptance factors were used by past researchers to determine how the users accept the
technology of online shopping and TAM has been tested for loyalty and satisfaction (Astuti,
2013)Likewise, our study is using technology acceptance factors for determining college
student‟s loyalty and satisfaction.
According to the results of past previously study, it has been confirmed that PEOU andPU have a
significant effect on user attitudes, that has an impact on user acceptance and satisfaction. The
study by Verhagen et al.,2009, suggest that customer satisfaction in the internet mode is
relatively higher than the conventional mode of purchase.
XXI Annual International Conference Proceedings; January 2020
ISBN No. 978-81-936606-2-1 http://www.internationalconference.in/XXI_AIC/INDEX.HTM Page 281
So,the following hypotheses are formulated based on above literatures for the purpose of this
study:
H1: Acceptance of Technology for shopping online improves the satisfaction among the
university students of Bhutan.
H2: Acceptance of Technology for shopping online improves loyalty among the university
students of Bhutan.
Online Service Quality
According to Sharma (2017), the SERVQUAL dimensions areused to measure the quality
ofservice provided by the website designs and the factors associated with the website usage to
evaluate customer e-satisfaction which further leads to customer e-loyalty(Sharma, 2017). The
perceptions towards the online service quality by the consumers are undefined because the value
it gives may exceed their need and make them prefer online channels. The accuracy in
accounting process, proper maintenance of records and performance of the service at the
appropriate time all represents an effort to achieve reliability and according to Idrisu (2015),
employee‟s knowledge, their courtesy of employees, their ability to convey confidence and trust
forms part of assurance.
The consumers use of E-commerce channel has grown considerably in Bhutan because the
online service that handicraft business provide has been considered the best options for the
consumers as they find more assurance in getting the varieties and people are more
dependable.The Bhutanese students perceives the value of service provided by the local online
websites like Druk-sell, Druk-Bees, Bbuying, Bhuanbuy.com, etc as a means objectives and they
find it more reliable and they get immediate responds of the feedbacks that they give and they
also go for online websites of other countries like Flipkart, Aliexpress, Myntra, Amazon, etc
(Tshomo, 2015).
According to Lai et al., 2012, customers perceive better online service quality and they feel more
loyal and ultimately influences the customer loyalty. Hence the following hypotheses are
formulated.
H3: Online service quality increases the satisfaction among university students of Bhutan

XXI Annual International Conference Proceedings; January 2020
ISBN No. 978-81-936606-2-1 http://www.internationalconference.in/XXI_AIC/INDEX.HTM Page 282
H4: Online service quality increase the loyalty among university students of Bhutan.
Customer satisfaction and loyalty
Satisfaction quantifies how products and services supplied by the company meets the expectation
of customers. When customers are satisfied, there is the high chance of leading towards
loyalty(Amin, 2014). It helps how the customers‟ feel about the product through their past
purchase experiences and it influences the decision of customers to continue or not using the
internet technology. It means that when customer meets the expectation of what they desired
then they experience the shopping where is the customer does not mean the expectation the they
tend to switch the brand as result they does not have loyalty toward the brand.As per the study of
Gajendra Sharma (2017), loyalty is influenced by satisfaction. Customer loyalty is defined as a
“deeply held commitment to repurchase a preferred product/service consistently in the future,
thereby causing repetitive same-brand or same brand-set purchasing”.
Earlier studies have determined that the e-satisfaction has an impact on e-loyalty and has some
level factors playing as moderating role that includes convenience, motivation, and purchase size
which has the higher impact of e-satisfaction on e-loyalty (Srinivasan, 2003).
With respect to that when the customer has more level of satisfaction; this in turn increases the
level of loyalty of a customer to re-visit the web-channel. As a result the advancement in
technology and the introduction of a new online platform and the Website online service quality
provided by online sites in Bhutan will be studied in this research as the influencing factors
towards-satisfaction and e-loyalty because of which the hypothesis is proposed for our study.
H5: if the satisfaction is improved, loyalty increases among university students of Bhutan.

XXI Annual International Conference Proceedings; January 2020
ISBN No. 978-81-936606-2-1 http://www.internationalconference.in/XXI_AIC/INDEX.HTM Page 283
Fig. 1 A proposed research model adopted from Lin & Sun (2009)
Research Methodology
The following paragraphs throw light on the methodology adopted for the purpose of this study.
Research Design
A quantitative research approach is adopted in this study so as to get an idea of the factors which
control the satisfaction and loyalty of the college students. This method will help in quantifying
the attitudes, opinions, behaviors and other defined variables.
Geographical area of study
The area of research was 5 colleges namely Paro College of Education (PCE), Gedu College of
Business Studies (GCBS), Samtse College of Education (SCE), College of Science and
Technology (CST) andRoyal Thimphu College(RTC), with a total sample size of 388 based on
Krejcie and Morgan (1970) sample size determination model.
Sampling Design
Among the colleges of Bhutan the sample for this research is done on (CST, RTC, GCBS, PCE
and SCE). For that the method of data collection was through google form. The sampling
procedure is non- probability sampling, where the recipients of the questionnaires will be

XXI Annual International Conference Proceedings; January 2020
ISBN No. 978-81-936606-2-1 http://www.internationalconference.in/XXI_AIC/INDEX.HTM Page 284
through email, facebook and wechat.The sample determination technique used is Krejcie
&Morgan (1970) formulae for a total population of the five sampled colleges of RUB i.e. 5393
(Royal University of Bhutan, 2017), the sample size was determined as 357 at 95% confidence
level whereas the actual administered sample reported at 388. In Bhutan this study is conducted
across five colleges of Royal University of Bhutan, namely, Royal Thimphu College (RTC),
College of Science and Technology (CST), Gedu College of Business Studies (GCBS), Samtse
College of Education (SCE) and Paro College of Education (PCE), in order to generalize the
responses gathered from the respondents. Sampling technique used was Convenience sampling
using google docs.
Data Collection
This study is a descriptive research based on primary data; online survey is conducted through
google docs. The data is collected through a questionnaire that is done through developing a 5
point likert scale survey questionnaires whereby the answer will be ranging from strongly
disagree to strongly agree that will be circulated through Google form by Email, facebook and
WeChat. We have distributed survey questionnaire to different colleges of RUB that is CST,
GCBS, RTC, PCEand SCE to make sure that we can obtain good quality of information as well
as maximum number of respondents. The following is shown in the table below:
Table 1 Demographic statistics of sampled population
Descriptive statistics N %
Gender Male 170 43.8
Female 214 55.2
prefer not to say 4 1.0
RUB College PCE 127 32.7
GCBS 86 22.2

XXI Annual International Conference Proceedings; January 2020
ISBN No. 978-81-936606-2-1 http://www.internationalconference.in/XXI_AIC/INDEX.HTM Page 285
RTC 87 22.4
CST 58 14.9
SCE 30 7.7
Year of Study 1st Year 73 18.8
2nd Year 87 22.4
3rd Year 141 36.3
4th Year 87 22.4
Income level(in Ngultrums) 1000-2000 166 42.8
2000-3000 94 24.2
3000-4000 68 17.5
Above 4000 60 15.5
Shopping frequency Once every 6 month 32 8.2
Once a year 121 31.2
Once in 2-3 months 111 28.6
once in a month 80 20.6
Once in a week 44 11.3
Preferred websites Amazon 133 34.3

XXI Annual International Conference Proceedings; January 2020
ISBN No. 978-81-936606-2-1 http://www.internationalconference.in/XXI_AIC/INDEX.HTM Page 286
Ali express 91 23.5
Flipkart 62 16.0
Myntra 56 14.4
Snapdeal 11 2.8
B buying and selling 17 4.4
Others 11 2.8
None 7 1.8
N=388
Analysis and Discussion
The following section exhibits the results of CFA (Table 2), Correlation analysis and SEM
Analysis.
Confirmatory factor Analysis, reliability and validity of the constructs
CFA is used to test whether measures of the constructs are consistent with researchers
understanding of the nature of that constructs. Table 2offers the results of CFA of the
measurement constructs along with Cronbach‟s Alpha (α), Average Variance Extracted (AVE),
and Composite Reliability (CR).
Table 2Confirmatory Factor Analysis of the measurement model
Code Name of the Variable Loading α AVE CR
1. Technology Acceptance Model Factor .815 0.600 0.818
TAM1 Shopping Via websites are
convenient 0.774
TAM2 Online shopping is easy to use 0.805

XXI Annual International Conference Proceedings; January 2020
ISBN No. 978-81-936606-2-1 http://www.internationalconference.in/XXI_AIC/INDEX.HTM Page 287
TAM3 Online shopping websites are
easy to understand 0.744
2. Online Service Quality Factors
2.1. Tangibility .721 0.516 0.762
TA1 I agree that the attractive design
of the website catches my
attention
0.734
TA2 The websites displays the product
in a visually appealing way 0.719
TA3 The websites provides detailed
description regarding the products 0.702
2.2 Empathy .781 0.442 0.760
EM2 I am satisfied with the concern
and care that online service give
to my needs and wants
0.654
EM3 The varieties of items were made
available of my choice 0.697
EM4 The online retailers behave with
me politely via electronic
communications
0.659
EM5 In physical interaction, the retailer
behaves well to me 0.647
2.3 Reliability .704 0.449 0.709
RL2 The product was delivered within 0.624

XXI Annual International Conference Proceedings; January 2020
ISBN No. 978-81-936606-2-1 http://www.internationalconference.in/XXI_AIC/INDEX.HTM Page 288
the promised time
RL4 The online retailers follows return
policies when the goods are not
up to your choice
0.680
RL5 Refund policies are followed
when your products are damaged 0.703
2.4. Assurance .724 0.469 0.726
AS1 I feel safe to buy product from
online websites 0.689
AS2 The websites of the retailers are
frequently updated 0.658
AS3 I am satisfied with the in time
delivery of goods I paid for 0.707
2.5. Responsiveness .733 0.412 0.677
RS2 The websites has quick response
to our search items 0.615
RS3 The online retailers responds
quickly to my complaints 0.663
RS4 The online retailers quickly
resolves my issues 0.646
3.Customer Satisfaction .802 0.579 0.804
CS1 I am satisfied with the shopping
website related business 0.837
CS2 I like the features and the layout 0.695

XXI Annual International Conference Proceedings; January 2020
ISBN No. 978-81-936606-2-1 http://www.internationalconference.in/XXI_AIC/INDEX.HTM Page 289
of the shopping websites
CS3 I am satisfied with the level of
service provided by website and
online dealers
0.744
4.Customer loyalty .850 0.662 0.853
CL1 I will recommend this shopping
websites to my close friends and
family.
0.756
CL2 I first think about this shopping
website whenever I think about
internet shopping
0.765
CL3 I would prefer this website for
future purchases 0.91
Cronbach‟s (1951) recommended that Alpha result of 0.5 to 0.7 is acceptable while higher than
0.7 is considered as scale of good internal consistency, based on which the data as given in table
2, is found to be reliable. The indicator of convergence is measured through AVE for all items
being calculated using factor loading on a single construct (Hair et al., 2010).
The rule of thumb for adequate convergence is an AVE > 0.50, indicating that more than half of
the indicator variance is included in the construct score (Hair et al., 2017c) in table 2 the
recommended level was achieved for TAM, Tangibility, customer satisfaction and customer
loyalty. However, the factors like empathy (.442), reliability(.449), assurance (.469),
responsiveness (.412) was found to be higher than .4 but couldn‟t achieve the recommended
value. According to Henseler et. al., 2015, the outer loadings need to exceed 0.708. In table 2,
all factors except responsiveness (.677) have exceeded the suggested values i.e. .708. The
indicator loadings in the model are above 0.6. This threshold is chosen based on the previous
researchers proposed such as Zainudin (2015), Hair et al (2006), Bollen & Pearl (2013), Bentler

XXI Annual International Conference Proceedings; January 2020
ISBN No. 978-81-936606-2-1 http://www.internationalconference.in/XXI_AIC/INDEX.HTM Page 290
(1990), and Meulener et al. (2003). Based on this value only 25 items were retained out of total
30 items administered in the research tool. This implies that the study reached convergent
validity.
Correlation Analysis
Correlation studies how strongly the pairs of variables are related. Table 3 presents the
relationship between the latent variables and the same has been used to test the proposed
hypothesis.
Table 3 Pearson Correlation Analysis
TAM SQ CS CL
TAM 1
SQ .721**
1
CS .621**
.776**
1
CL .580**
.713**
.773**
1
**. Correlation is significant at the 0.01 level (2-tailed).
N= 388
The table 3 shows the correlation between the variables in the study whereby the correlations are
positively significant between TAM and SQ by .721(72%), TAM and CS by .621(62%), TAM
and CL by .580(58%), SQ and CS by .776(77%), SQ and CL by .713(71%) and CS and CL by
.773(77%). This also signifies that the Customer satisfaction has the highest influence of 77.3%
on customer Loyalty and Technology acceptance factors has the lowest influence on Customer
loyalty i.e. of 58%. On the other hand Service quality factors has a high influence on Customer
satisfaction with a high positive correlation of 77.6% and likewise Technology acceptance
factors has a high positive influence of 72.1% on service quality. Hence, leading to the
acceptance of the hypotheses; H1, H2, H3, H4 and H5.

XXI Annual International Conference Proceedings; January 2020
ISBN No. 978-81-936606-2-1 http://www.internationalconference.in/XXI_AIC/INDEX.HTM Page 291
Measurement Model :
This model studies the relationship between the latent variables and their measures.
Measurement model studies the constructs based on global fit indices and the same has been
analyzed in table 4.
Table 4Measurement Model Summary
Constructs CMIN/DF
<.5
GFI
(>.90)
TLI
(>.90)
CFI
(>.90)
(RMSEA)
(0.08)
Comments
OnlineService
Quality 2.322 .932 .938 .953 .058 Achieved
TAM .421 .999 1.000 1.000 .000 Achieved
Customer
Satisfaction 3.920 .993 .992 .976 .087 Achieved
Customer
Loyalty .183 1.000 1.000 1.000 .000 Achieved
The measurement model was studied using the following indices: 2/DF, and its significant level,
the root mean square error of approximation (RMSEA), and the Comparative Fit Index (CFI).
For a satisfactory model fit, the 2 statistics must have a low value of less than 5 (Hair et al,
2006). The indicator CFI and GFI must exceed 0.9 and RMSEA must be below 0.05 (Hair et al,
2006). However, for RMSEA less than 0.5 is referred as close fit and less than 0.8 is considered
to be reasonable (Browne & Cudeck, 1993; Byrne, 2001). The 2 test is sensitive to sample size
even if the model fit is good (Bentler and Bonett,1980). However, the results of the modified
model complies with all the recommended values as suggested by literatures.

XXI Annual International Conference Proceedings; January 2020
ISBN No. 978-81-936606-2-1 http://www.internationalconference.in/XXI_AIC/INDEX.HTM Page 292
SEM Analysis
SEM analysis is used on the proposed model to check the impact of independent variables (TAM
Factors and Online service quality) on dependent variables (customer satisfaction and customer
loyalty). The modified model (Figure 2) is given below:
Fig. 2
Path
diagram for the proposed model
The model fit coefficients i.e. CMIN/DF (2.526), GFI (0.940), CFI (0.969), TLI(0.960), RMSEA
(0.063), indicates a good fit for the proposed model. The p value for the two-path coefficient i.e
CMIN/DF: 2.526
GFI: .940
TLI: .960
CFI:.969
RMSEA: .063
XXI Annual International Conference Proceedings; January 2020
ISBN No. 978-81-936606-2-1 http://www.internationalconference.in/XXI_AIC/INDEX.HTM Page 293
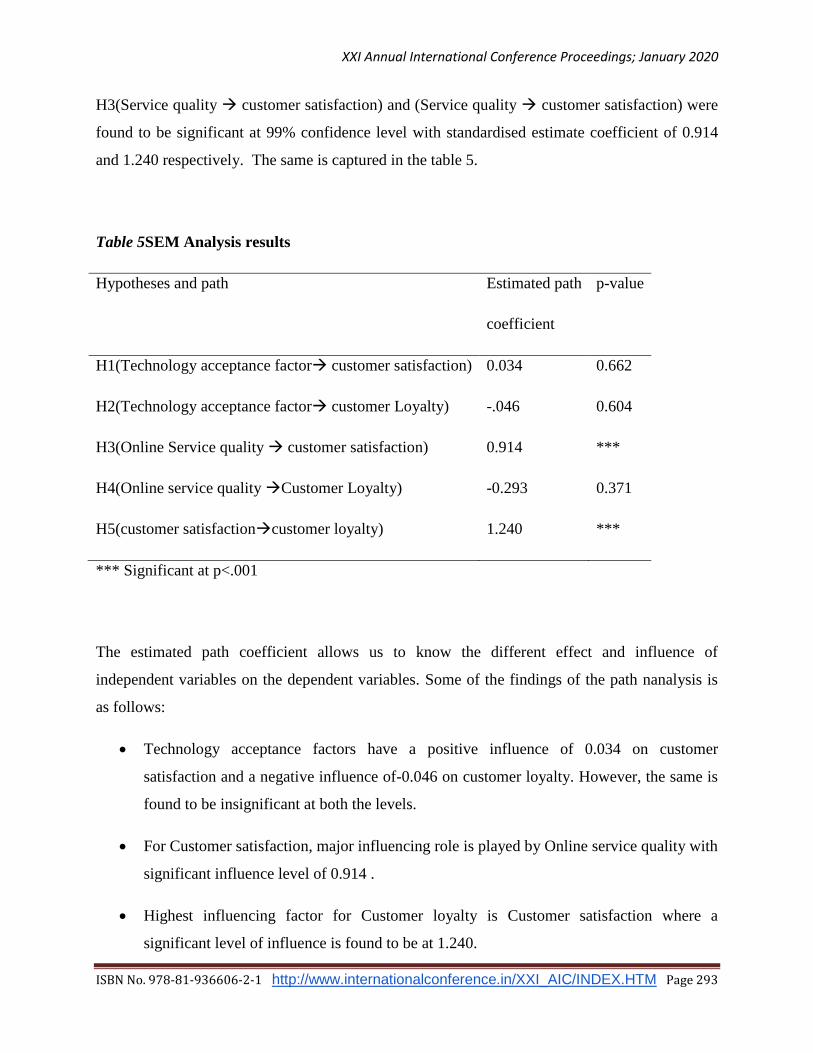
H3(Service quality customer satisfaction) and (Service quality customer satisfaction) were
found to be significant at 99% confidence level with standardised estimate coefficient of 0.914
and 1.240 respectively. The same is captured in the table 5.
Table 5SEM Analysis results
Hypotheses and path Estimated path
coefficient
p-value
H1(Technology acceptance factor customer satisfaction) 0.034 0.662
H2(Technology acceptance factor customer Loyalty) -.046 0.604
H3(Online Service quality customer satisfaction) 0.914 ***
H4(Online service quality Customer Loyalty) -0.293 0.371
H5(customer satisfactioncustomer loyalty) 1.240 ***
*** Significant at p<.001
The estimated path coefficient allows us to know the different effect and influence of
independent variables on the dependent variables. Some of the findings of the path nanalysis is
as follows:
Technology acceptance factors have a positive influence of 0.034 on customer
satisfaction and a negative influence of-0.046 on customer loyalty. However, the same is
found to be insignificant at both the levels.
For Customer satisfaction, major influencing role is played by Online service quality with
significant influence level of 0.914 .
Highest influencing factor for Customer loyalty is Customer satisfaction where a
significant level of influence is found to be at 1.240.
XXI Annual International Conference Proceedings; January 2020
ISBN No. 978-81-936606-2-1 http://www.internationalconference.in/XXI_AIC/INDEX.HTM Page 294
The SEM analysis concludes that online service quality leads to customer satisfaction and
customer satisfaction henceforth leads to customer loyalty. In other words, without satisfaction
of customers, loyalty of customer cannot be achieved. However, the correlation analysis
suggests that all the factors have a positive correlation between them and increasing in
independent factors will lead to increase in dependent factors namely customer satisfaction and
customer loyalty. The study suggests, to improve the quality of services online in order to gain
customer satisfaction and subsequently customer loyalty.
References
Amin, M. (2014). User satisfaction with mobile websites: the impact of perceived
usefulness(PU) , perceived ease of use(PEOU) and trust.
Astuti, E. T. (2013, January). Statistical modeling for mortality data using local
generalized poisson regression model. Retrieved from researchgate.
Bentler, P. M. (1990). Comparative fit indexes in structural models. Psychological
bulletin, 107(2), 238.
Bentler, P.M., & Bonnet, D.G.(1980). Significance test and goodness of fit in the analysis
of covariance structures. Psychological bulleting. 88, 586-606
Bollen, K.A., & Pearl, J. (2013). Eight myths about causality and structural equation
models. In Handbook of causal analysis for social research (pp 301-328). Springer
Netherlands.
Browne, M.W., & Cudeck, R. (1993). Alternative ways of assessing model fit. In Bollen,
K.A. & Long, J.S. (Eds.). Testing structural equations models. Newbury Park, CA: Sage.
Choezom, P. (2017). People increasingly cashing in on online shopping. (P. Selden,
Interviewer)
Cronbach, L. J. (1951). Coefficient Alpha and the internal structure of tests.
Psychometrica, 16(3), 297-334.
Davis, F.D. (1989). “Perceived Usefulness, perceived ease of use, and user acceptance of
information technology”, MIS Quarterly, 13 (3), 319-340
Dey, A. (2014, 1). Retrieved from Online shopping attitude among the youth: A study on
university students.
Farber, M. (2016, june 8). Fortune. Retrieved from Consumers are now doing most their
shopping online: http://fortune.com/2016/06/08/online-shopping-increases/
Flavian, C., Gurrea, R., & Guinaliu, M. (2006). The role played by perceived usability,
satisfaction and consumer trust on website loyalty. In C. Flavian, R. Gurrea, & M.
Guinaliu, Information and Management, volume 43 No.1 pp. 1-14.
Grace T.R.,& Sun, C.C. (2009). Factor influencing satisfaction and loyalty in online
shopping . Emeraldinsight , 458-475.
XXI Annual International Conference Proceedings; January 2020
ISBN No. 978-81-936606-2-1 http://www.internationalconference.in/XXI_AIC/INDEX.HTM Page 295
Hair, J.F., Bush R & Ortinau, D. (2006). Marketing Research. McGraw-Hill, Boston
Hair, J.F., Black, W.C., Babin, B.J. and Anderson, R.E. (2010) Multivariate Data
Analysis, 7th ed., Prentice Hall, Upper Saddle River, NJ.
Hair, J.F., Hult, G.T.M., Ringle, C.M. and Sarstedt, M. (2017) A Primer on Partial Least
Squares Structural Equation Modeling (PLS-SEM), 2nd ed., SAGE, Thousand Oaks, CA.
Henseler, J., Ringle, C.M. and Sarstedt, M. (2015) „A new criterion for assessing
discriminant validity in variance-based structural equation modeling‟.Journal of the
Academy of Marketing Science, Vol. 43, No. 1, pp.115–135.
Idrisu, A. (2015). Assessing the impact of service quality on customer loyalty: A case
study of the cellular industry of Ghana. British journal of Marketing studies , 15-30.
Kemp, S. (2018, january 30). Digital in2018:world's internet user pass the 4 billion
mark. Retrieved from we are social: http://wearesocial.com>2018/01
Krejcie, R.V., & Morgan, D.W. (1970). Determining Sample Size for
ResearchActivities. Educational and Psychological Measurement, 30, 607-610
Lai, C. H., Kuo, N. T., Chang, K. C., & Cheng, Y. S. (2012). how service quality affect
customer loyalty in the travel agecy : the effects of customer satisfication, service
recovery and percieved value. Asia Pacific Journal of Tourism research , 803-822.
Lhamo, P. (2018, November 13). Kuensel Online. Retrieved from Bhutan's internet
addiction among the youth: www.kuenselonline.com/Bhutan
Meuleneres, L.B., Lee, A. H., Binns, C.W. & Lower, A (2003). Quality of life for
adolescents: Assessing measurement properties using structural equation modelling.
Quality of Life Research, 12(3), 283-290.
Poll. (2017). onliine business. Retrieved from https://www.futurelearn.com>steps
Royal University of Bhutan. (2017). Annual Report,2017. Thimphu
Seldon, P. (2017, 10 25). Business Bhutan. Retrieved from People increasingly cashing in
on online shopping: https://www.businessbhutan.bt/2017/10/25/people-increasingly-
cashing-in- on-online-shopping/
Sharma, G. (2017). Service quality, satisfaction and loyalty in online marketing: An
emirical investigation. Global journalsof management and Business research .
Shih, H.P. (2004). An empirical study on predicting user acceptance of e-shopping on the
web. ScienceDirect , 351-368.
Srinivasan, A. d. (2003, February). E-Satisfaction and E-loyalty: a contigency
Framework. Retrieved from https://www.researchgate.net/publication/227605244_E-
satisfaction_and_E-loyalty_A_Contigency_Framework

XXI Annual International Conference Proceedings; January 2020
ISBN No. 978-81-936606-2-1 http://www.internationalconference.in/XXI_AIC/INDEX.HTM Page 296