customer loyalty and its antecedents in...
TRANSCRIPT

303
CHAPTER 7
CUSTOMER LOYALTY AND ITS
ANTECEDENTS IN COOPERATIVES
Under the current liberalisation, privatisation, and globalisation era in
India the central government has encouraged the private sector to enter
housing finance market. More and more private sector housing finance
companies and banks have emerged in the scene with their state-of-the art
technology and highly personalised services and products. The competition
has become fierce. This increased competition has posed the biggest
challenge to PHCs which are the important source of housing finance to the
weaker sections and low income groups in rural areas. In the context of these
developments in the housing finance market the PHCs are forced to reinvent
their competitive advantages vis-à-vis private housing finance companies and
commercial banks. They recognise the inherent characteristic of a co-
operative (co-operative identity) as a platform to build member loyalty. There
are striking similarities between the bases of loyalty and co-operative identity.
Like co-operative identity customer satisfaction is linked with loyalty.
Customer satisfaction serves as antidote for customer defection. Hence there
is a strong need for PHCs to focus on gaining and sustaining member loyalty.
The objective of this chapter is to propose and to examine empirically
a model that considers cooperative identity, service quality, customer
satisfaction and switching costs as antecedents of customer loyalty in PHCs.
The rest of this chapter is organized as follows. The first section shows the
conceptual model and research hypotheses that test the relationship between
service quality and customer satisfaction, service quality and customer
loyalty, customer satisfaction and customer loyalty, co-operative identity and
customer loyalty and switching costs and customer loyalty. Section two

304
describes measurement and measures of the constructs. While the Section
three analyses the empirical data on customer loyalty and its antecedents in
PHCs the Section four tests the hypotheses.
7.1 Conceptual model and hypothesis development
Figure 7.1 presents the customer loyalty model in co-operative
organizations which identifies the key constructs included in the study. The
hypothesized model shows loyalty as anteceded by co-operative identity,
service quality, satisfaction and switching costs. The proposed model analyses
the effects of co-operative identity, service quality, customer satisfaction and
switching costs on customer loyalty in the primary housing co-operatives.
The present study focuses on the proposal that framework of loyalty
and its antecedents shown in Fig. 7.1 are the drivers of customer loyalty in
housing finance co-operatives. The rationale for the proposed conceptual
model is drawn, in part, from the theories and findings in earlier studies (e.g.
Cronin et al. 2000; Anderson and Mittal, 2000; Oliver, 1997; Cronin and
Taylor, 1992; Parasuraman et al. 1994). The rationale for the relationship
between the constructs and proposed hypotheses are outlined below.
Figure 7.1: Conceptual Model
Co-operative Identity
Switching
Costs
Customer Satisfaction
Customer Loyalty

305
7.1.1The relationship between Service Quality and Customer Satisfaction
“Perhaps the most intriguing issue facing service marketers today is the
interplay between quality, satisfaction, and value. Specifically, which are
antecedents, which are mediating and which are consequent? To date, no
definitive answer exists” (Rust and Oliver, 1994). Taylor and Baker (1994)
have observed “our understanding of the specific nature of the relationship
between service quality and customer satisfaction, as well as how these two
constructs combine to impact consumer purchase intentions, continues to
perplex marketing scholars”. Rust and Oliver’s call for research into
interrelationships did not go unanswered. Later, several studies have
examined the “antecedent, mediating and consequent” relationships among
these three variables (e.g. Fornell et al., 1996; Zeithaml, Berry and
Parasuraman, 1996; Hallowell, 1996; Spreng, Mackenzie and Olshavsky,
1996). The result is that at least partial consensus has emerged.
Perceived service quality is believed to precede satisfaction, which in
turn precedes customer loyalty. Service quality is considered to be an
important factor in enhancing customer satisfaction and loyalty in a financial
service organisation. When the PHC provides high quality services to its
customers, the customers become satisfied which leads to customer being
loyal to PHC. Thus service quality and customer satisfaction are antecedents
of customer loyalty in PHCs. The investigation into the relationship between
service quality and its consequences including customer satisfaction may
provide a strong ground for further research on service quality (Zeithaml,
Berry and Parasuraman, 1996). This leads to suggest the following
hypotheses.
H1a: Service quality is positively related to customer satisfaction.
H1b: Service quality is positively related to customer loyalty.

306
7.1.2The relationship between customer satisfaction and customer loyalty
The link between customer satisfaction and customer loyalty has
gained much attention in the service marketing literature. Many researchers,
based on empirical evidence, propose that higher satisfaction levels lead to
higher purchase intentions (Anderson and Sullivan, 1993; Zeithaml, Berry
and Parasuraman, 1996). Satisfied customers are often willing to pay more
and stay with a firm that meets their needs rather than take the risk associated
with lower-priced service (Hoffman and Bateson, 1997). Bolton (1998)
affirms that satisfied customers stay longer with the service provider.
Cronin, Brady and Hult (2000) found considerable evidence linking
satisfaction to customer’s behavioural intentions. The two items they used to
measure behavioural intentions included (1) repurchase intentions and (2)
intentions to stay with the same service provider. Thus, in effect, these
intentions lead to customer loyalty. Customer satisfaction functions as an
antecedent of customer loyalty. It prevents customer churn and consolidates
retention, thereby constituting an important cause of customer loyalty
(Fornell, 1992; Reichheld, 1996). As a result, organizations strive to enhance
customer loyalty by increasing the level of customer satisfaction. Other
researchers, however, observed that satisfied customers may not be sufficient
to create loyal customers (Cronin and Taylor, 1992; Fornell, 1992). Their
observations are consistent with the notion that customer satisfaction is not a
surrogate for customer retention or customer loyalty (Reicheld, 1993).
Primary housing co-operative customers may be considered loyal to
their co-operative if they hold favourable attitude towards it. Positive attitudes
could manifest itself in a number of ways, e.g. as recommendations of the
company to others (Zeithaml et al., 1996; Parasuraman et al., 1994; Butcher et
al., 2001), a low sensitivity to price increases (Zeithaml et al., 1996;
Parasuraman et al., 1994), preferences for a particular provider (Zeithaml et

307
al., 1996; Butcher et al., 2001), and a high resistance to the change of the
service provider (Parasuraman et al.,1994; Zeithaml et al.,1996; Butcher et al.,
2001). Nevertheless customer satisfaction is an important factor which leads
to customer loyalty, its relationship with loyalty is inconsistent. Thus, the
present study advances the following hypothesis.
H2: Customer satisfaction is positively related to customer loyalty.
7.1.3 The relationship between co-operative identity and customer loyalty
Co-operative identity is considered as an inherent characteristic of any
co-operative organization. When a group of people decide to set up a co-
operative organization it should adhere to co-operative principles and respect
co-operative values of the International Co-operative Alliance (1995). All the
principles and values contribute to enhance commitment level of members
(Morales, 1996). The double role of member-customer in a co-operative leads
to an increase in commitment by the people involved in building the
organisation. A positive relationship exists between participation and the level
of satisfaction and commitment on the part of the members (Locke and
Schwiger, 1979; Schwiger and Leana, 1986). Although the degree of loyalty
of the member-customer is not the same for every co-operative, it is generally
agreed that organizations that have a higher degree of commitment on the
part of members or customers due to co-operative principles and values,
generate a higher level of loyalty. This reasoning leads to suggest the
following hypothesis.
H3: Co-operative identity is positively related to customer loyalty.
7.1.4 The relationship between switching costs and customer loyalty
Switching cost are those costs which are associated with changing
from one service provider to another (Guiltinan, 1989; Zeithaml, 1981).

308
Switching costs include investments of time, money, or effort, perceived by
customers as factors that make it difficult to purchase from a different firm
(Guiltinan, 1989). Switching costs may enhance customer loyalty by making
it difficult for the customer to switch to another provider. This may lead to a
positive relationship between switching costs and customer loyalty.
According to Gronhang and Gilly (1991) dissatisfied customer may remain
loyal because of high switching costs. The perception of switching costs is
considered a significant factor affecting customer loyalty (Andreasen, 1985;
Storbacka et al., 1994; Sharma and Patterson, 2000). Dissatisfied customers
stay with their co-operatives because time, money and effort involved in
choosing a new housing finance agency are perceived high. Hence the
following hypothesis is proposed.
H4: Switching costs are positively related to customer loyalty.
7.2 Measurement
Scale development was based on a review of relevant literature.
Service quality was operationalised using the SERVPERF model because of
its superiority over SERVQUAL. SERVPERF scale performs better when
measuring service quality directly than estimating it as the result of the gap
between expectations and perceptions (Cronin and Taylor, 1992; Teas, 1993;
Brady, Cronin and Brand, 2002; Carman, 1990). As to the nature of
measurement, the method used in the present study was similar to that of
Cronin et al. (2000). Minor alterations in the form of re-classification and re-
phrasing were made to this measurement to meet the specific requirements of
the present research. Various dimensions of service quality were measured by
nine point Likert-type agreement scales with anchors of “strongly disagree”
(1) and “strongly agree” (9).

309
Even though the satisfaction with a service provider is perceived as
being both an evaluative and emotion based response to a service encounter
(Olive, 1997), the study used evaluative set of measurements of customer
satisfaction and measured the satisfaction construct by three items (Cronin
and Taylor, 1992; Cronin, Brady and Hult, 2000). The scoring format for the
first two questions of customer satisfaction construct was a 9 point Likert-
type agreement scales with anchors “strongly disagree” (1) and “strongly
agree” (9), where as the third question was of a nine point Likert-type format
with anchors of “not at all dissatisfied” (1) and “very much satisfied” (9).
Co-operative identity of a co-operative organisation emanates from co-
operative principles and values. Therefore cooperative identity was measured
using two items construct on a nine point Likert-type scale. Switching costs
include investments of time, money, or effort perceived by customers as
factors that make it difficult to change from one service provider to another
(Guiltinan, 1989). Thus a three items switching costs construct was developed
to assess the switching costs based on the customers’ perception of cost, time
and effort associated with changing primary housing co-operatives.
A three items customer loyalty construct was developed to gauge the
range of customers’ behavioural consequences to service quality, cooperative
identity, customer satisfaction and switching costs. Customer loyalty was
assessed by multi-dimensional scale measuring the behavioural and attitudinal
dimensions of the construct on nine point Likert scale (e.g. Zeithaml et al.,
1996; Nguyen and Blanc, 1998; Oliver, 1999). Agreement scale of the
constructs cooperative identity, switching costs and customer loyalty were
anchored by “strongly disagree” (1) and “strongly agree” (9). Constructs and
indicators are presented in Table 7.1.

310
Table 7.1
Measurement Scales of Constructs
Q. No. Cooperative identity measures
1 My society adheres to the cooperative principles.
2 My society respects cooperative values.
Service quality measures
3 Employees of the society provide service reliably, consistently and dependably.
4 Employees of the society are willing and able to provide service in a timely manner.
5 Employees of the society are competent (i.e. knowledgeable and skillful).
6 Employees of the society are approachable and easy to contact.
7 Employees of the society are courteous, polite and respectful.
8 Employees of the society listen to me and speak in a language that I can understand.
9 Employees of the society are trustworthy, believable, and honest.
10 Employees of the society make the effort to understand my needs.
11 The forms in the society are legible and are in local language.
12 The Physical facilities and employees of the society are neat and clean.
Customer satisfaction measures
13 My choice to take loan from the society is a wise one.
14 I think I did the right thing when I took the loan from the society.
15 My overall feelings towards the services provided by the society can be described as ----.
Switching cost measures
16 It would cost me a lot of money to switch from the society to another housing finance provider.
17 It would take a lot of effort to switch from the society to another housing finance provider.

311
Q. No. Cooperative identity measures
18 It would take a lot of time to switch from the society to another housing finance provider.
Customer loyalty measures
19 I have the intention to continue being a customer of the society in the future.
20 I would positively recommend the society to my friends and relatives.
21 I would stay with the society, although I would have to incur a somewhat higher cost.
7. 2.1 Basic Statistics on Customer Responses
Out of 21 question on customer loyalty and its antecedents in PHCs
there are two indicators in the questionnaire for measuring co-operative
identity (Q1 and Q 2), ten on service quality (Q3 – Q 12), three on customer
satisfaction (Q 13, Q14 and Q 15), three on switching cost (Q 16, Q 17, and Q
18) and three on customer loyalty (Q19, Q 20 and Q 21).
Table 7. 2
Distribution of Questions by Level of Score
Level of Score
No. of Qns. Question No. CI SQ CS SC CL
Low (<6) 1 21
Moderate (6,7) 14 1, 2, 3, 4, 5, 7, 8, 9, 10, 13,
14, 15, 19, 20 2 7 3 2
High (>7) 6 6, 11, 12, 16, 17, 18 3 3 Source: Survey data.
It is seen from the Table 7.2 only Q21 (CL) has evoked low score.
While most of the questions on SQ, two questions on (CL) and all the

312
questions on CI and CS have secured moderate score, all the questions on SC
and three questions on SQ have bagged high score on the Likert Scale. Figure
7.2 shows the mean scores of all the questions. Looking at the numbers
presented in the figure, it can be observed that while Q11 has the highest
mean score (8.1), the Q21 has the lowest mean score (5.3).
Figure 7.2
Mean Scores for SQ, CS, CI, SC, and CL
Source: Survey data.
Table 7.3 reveals the descriptive statistics of the factors of customer
loyalty. It is observed from the table a majority questions have generated
moderate scores. While Q3, Q6, Q11, Q12, and Q17 have minimum standard
deviations indicating consistent response, Q20, Q15 and Q10 have high
standard deviations showing fluctuations in the responses of customers.

313
Table 7.3
Descriptive Statistics on Variables for Factors of Customer Loyalty in PHCs
Question No. Mean SD Median Mode
Q1 6.8 1.1 7.0 7.0
Q2 6.9 1.2 7.0 7.0
Q3 6.3 0.9 6.0 6.0
Q4 6.5 1.1 7.0 7.0
Q5 6.2 1.0 6.0 6.0
Q6 7.7 0.9 8.0 8.0
Q7 6.3 1.1 6.0 6.0
Q8 6.9 1.1 7.0 7.0
Q9 6.5 1.2 7.0 7.0
Q10 6.6 1.5 7.0 7.0
Q11 8.1 0.8 8.0 8.0
Q12 7.9 0.9 8.0 8.0
Q13 6.8 1.0 7.0 7.0
Q14 6.9 1.2 7.0 7.0
Q15 6.1 1.3 6.0 7.0
Q16 7.0 1.0 7.0 7.0
Q17 7.8 0.9 8.0 8.0
Q18 7.0 1.1 7.0 7.0
Q19 6.2 1.2 6.0 6.0
Q20 6.2 1.3 6.0 6.0
Q21 5.3 1.2 5.0 5.0 Source: Survey data.

314
7.3 Analysis of Factors of Customer Loyalty in PHCs
7.3.1 Cronbach’s Alpha Test of Reliability
In order to test the internal reliability of the loyalty model used in the
study Cronbach’s Alpha Test of Reliability has been conducted. While
performing the test different factors pertaining to loyalty are grouped and
performed the test on each factor. Table 7.4 shows the alpha scores of the
different factors of loyalty.
Table 7.4
Cronbach’s Alpha Scores
Factor Cronbach’s Alpha
Service Quality (SQ) Co-operative Identity (CI) Customer Satisfaction (CS) Switching Cost (SC) Customer Loyalty (CL)
0.7598 0.6302 0.8005 0.5044 0.8662
Source: Survey data.
The Cronbach’s Alpha scores of all the factors range from 0.50 to 0.87.
Alpha scores for service quality, customer satisfaction and customer loyalty
exceed 0.7 which indicates high internal reliability of the scale items.
Although the reliability score for switching costs is less than the reliable score
of 0.6, considering its importance in the study, it is retained for the purpose of
factor analysis.
In order to analyse the responses collected from the sample customers,
Factor Analysis has been performed on the variables of the model with the
Principal Component Analysis as extraction method and varimax as rotation
method with Kaiser Normalization. Performing factor analysis by the usual
method and adjusting some components with their significance and observing

315
Cronbach’s Alpha scores of the duplicate components in each case, the
following factors are fixed.
The first factor is labeled as service quality (SQ). SQ is composed of
components Q3, Q4, Q5, Q6, Q8, Q9, Q10 and Q12 with Cronbach’s Alpha
score of 0.7233. But in the empirical SQ factor there are 10 components (Q3 –
Q12) with Cronbach’s Alpha score of 0.7590. As Q7 and Q11 have some
adverse effect on the empirical SQ factor they are considered as probable
candidates for exclusion. However, considering the significance of the
component Q7 in the service quality, it is retained and Q11 is eliminated.
After the exclusion of Q11, Cronbach’s Alpha score has increased to
0.7598. The modified SQ factor in the theoretical model has Q3, Q4, Q5, Q6,
Q7, Q8, Q9, Q10 and Q12 as its components with a mean of 61.13 (SD =
5.16).The results of Bartlett’s test of sphericity has indicated that data are
appropriate for factor analysis (p=0.00<0.05). Moreover, Kaiser-Meyer-Olkin
(KMO) measure of sampling adequacy is 0.805 which exceeds the minimum
level of 0.4 for good factor analysis.
Co-operative Identity (CI) is diagnosed by factor analysis as second
factor in the model. It has two components viz., Q1 and Q2. Its Cronbach’s
Alpha score is 0.6302. The mean of the factor is 13.64 (SD=1.97). There is
significant correlation between the components of co-operative identity.
These components also satisfy KMO measure of sampling adequacy
(0.50>0.4) and Bartlett’s test of sphericity (p=0.00<0.05). This model is
highly suitable for co-operative identity as 100 % of variance is explained by
the model (CI=1.464*Q1+0.536*Q2).
The third factor is Customer Satisfaction which is fully explained by
the components Q13, Q14 and Q15. The Cronbach’s Alpha score of this
factor is 0.8005 showing high internal consistency. It has a mean of 19.79

316
with standard deviation of 3.016. There is a reasonable correlation between
these components. This factor satisfies both KMO (0.692>0.4) and Bartlett’s
test of sphericity (p=0.00<0.05).
The linear component factor CS=2.153*Q13+0.516*Q14+0.331*Q15.
Switching Cost is the fourth factor developed by the factor analysis. It
is composed of Q16, Q17 and Q18. The Cronbach’s Alpha score (0.5044)
shows moderate consistency among the variable. Its mean and standard
deviations are 21.90 and 2.15 respectively. The Bartlett’s test of sphericity
(p=0.00<0.05) has indicated the statistical probability that the correlation
matrix has significant correlations among at least some of the variables and
KMO measure of sampling adequacy (0.571) has shown required sampling
adequacy.
The Customer Loyalty is the last factor of the model identified by the
factor analysis and which is composed of Q19, Q20 and Q21. This factor has
a very high Cronbach’s Alpha score of 0.8662 indicating high internal
consistency. The mean of the factor is 17.73 with standard deviation of 3.304.
KMO and Bartlett’s test are satisfied by the data for sampling adequacy and
variability as K=0.723 and p=0.00<0.05. The components explained are –
2.369 * Q19 + 0.382 * Q20 + 0.249 * Q21.
7.3.2 Analysis of Variables of Service Quality
7.3.2.1 Reliable, consistent and dependable service by employees (Q3)
It is evident from Table 7.3 that Q3 has median and mode of 6. A
median of 6 means that service quality on this variable as perceived by 50%
of customers is moderate. Similarly a mode of 6 indicates that majority of
customers have anchored their opinion at 6. The mean score of this variable is
6.3 (SD=0.9), implying that customers get the level of service quality which

317
they consider what the service ‘should be’. Looking at the Figure 7.3, it can
be observed that only 8.33% of the customers have stated 8 or 9 on the Likert
scale, meaning that only 8.33 % of the customers have perceived high quality
on this aspect of service quality in PHCs. These results reveal that quality on
this variable as perceived by customers is moderate.
Figure 7.3
Percentage of Customers with High Scores
Source: Survey data.
7.3.2.2 Willingness and ability of employees in providing service in a
timely manner (Q4)
Referring to the variable Q4, the Table 7.3 shows its median and mode
value as 7 which means that most of the customers perceive quality on this
variable more than the desired level. A mean score of 6.5 (SD=1.1) also
suggest that the PHCs have just exceeded the expectations of the majority of
the customers on this aspect of service quality. Furthermore, nearly 83% of
the customers have received desired level of quality or above on this variable.
However the Figure 7.4 shows that 16.43% of the customers have answered 5
or below indicating that they do not receive desired level of quality as far as

318
the willingness and ability of employees in providing service in a timely
manner is concerned. This finding leads to the conclusion that there is still
some deficiency in the delivery of quality service to the customers in PHCs.
Table 7.5
Percentage of Customers by Service Quality (SQ) Score Group
Score Group SQ Variables
Low (<6) Moderate (6,7) High (>7)
Q3 14.52 77.14 8.33
Q4 16.43 67.86 15.71
Q5 25.71 62.62 11.67
Q6 2.14 33.57 64.29
Q7 23.57 62.14 14.29
Q8 9.29 58.57 32.14
Q9 22.62 55.00 22.38
Q10 24.76 44.76 30.48
Q12 0.71 30.00 69.29
SQ^ 14.00 50.98 35.02 Source: Survey data.
7.3.2.3 Competence of the employees (Q5)
According to the data presented in the Table 7.3 this variable has a
median of 6 which implies that 50% of the customers have received the
desired level of quality on this aspect of service quality in PHCs. Looking at
the numbers presented in Figure 7.3, it can be observed that the quality
perceived by customers is not high on this item, which can also be concluded
from the fact that the mode of the variable is 6. Moreover, the Figure 7.4
shows that 25.71% of the customers have answered 5 or below on this

319
question. This indicates that the expectations of more than one fourth of the
customers about this variable are not met on a desired level.
Figure 7.4
Percentage of Customers with Low Scores
Source: Survey data.
From this finding it becomes clear that PHCs should try to improve the
employee competence aspect of service quality. Not improving this aspect of
service quality in PHCs might lead to the deterioration of quality of
relationship with customers and hence increases the risk of losing customers.
7.3.2.4 Approachable and easy to contact employees (Q6)
This variable of service quality has a median value of 8 indicating that
50% customers strongly agree that employees of PHCs are approachable and
easy to contact. The mode of the variable is 8. It signals that most of
customers have perceived high quality on this variable. The mean score of
this variable is 7.7 (SD=0.9) which also confirms the relatively high quality
on this variable. These results lead to the conclusion that in general
employees of PHCs are easy to contact and approachable. Furthermore, from

320
the Table 7.5 it is seen that only 2.14% of the customers have perceived low
quality (see Figure 7.4), 64.29% of customers have perceived very high
quality (see Figure 7.3), and 33.57% of customers have perceived moderate
quality (see Figure 7.5).
7.3.2.5 Courteous, polite and respectful employees (Q7)
In a highly interactive service environment such that of housing
finance customers often evaluate service quality on the basis of attitude of
staff towards them. The reason for this can be attributed to the fact that in an
environment where housing finance products are considered as equal, the only
differentiating factor is the service provided by the employees who are not
equal. Therefore it is pertinent to analyse the scores assigned by the customers
to this variable of service quality.
As per Table 7.3 both median and mode values for the variable are 6.
A median of 6 suggests that 50% of customers perceive service quality on this
variable as moderate. The value 6 for mode means that the highest number of
the customers has assigned the score 6 for this variable. The mean score of 6.3
(SD=1.1) also suggests that the level of quality on this variable as perceived
by customers is moderate. In other words, the quality on this variable is equal
to what the customers consider the quality ‘should be’. The Table 7.5 reveals
that the percentage of customers who have chosen 6 or 7 on the Likert scale
as 62.14, which supports the above findings. Moreover, the figure 7.4 displays
that 23.57% of the customers have perceived low quality on this variable. In
comparison only 14.29% of the customers have perceived high quality. The
finding that 23.57% have perceived low quality on this variable of service
quality is of high importance to PHCs as this variable needs improvement so
that the total perceived service quality would increase.
321
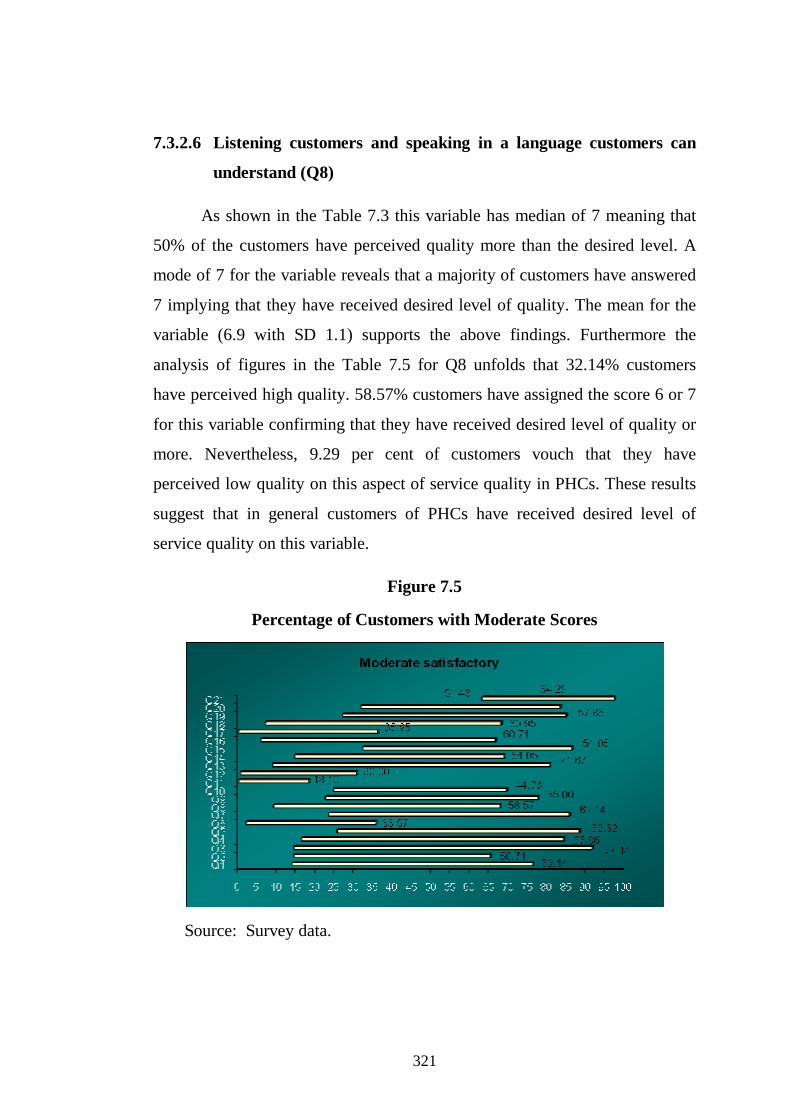
7.3.2.6 Listening customers and speaking in a language customers can
understand (Q8)
As shown in the Table 7.3 this variable has median of 7 meaning that
50% of the customers have perceived quality more than the desired level. A
mode of 7 for the variable reveals that a majority of customers have answered
7 implying that they have received desired level of quality. The mean for the
variable (6.9 with SD 1.1) supports the above findings. Furthermore the
analysis of figures in the Table 7.5 for Q8 unfolds that 32.14% customers
have perceived high quality. 58.57% customers have assigned the score 6 or 7
for this variable confirming that they have received desired level of quality or
more. Nevertheless, 9.29 per cent of customers vouch that they have
perceived low quality on this aspect of service quality in PHCs. These results
suggest that in general customers of PHCs have received desired level of
service quality on this variable.
Figure 7.5
Percentage of Customers with Moderate Scores
Source: Survey data.
322
7.3.2.7 Trustworthy, believable and honest employees (Q9)
This variable reflects one of the core components of service quality in
financial service organizations. The three attributes of this variable –
‘trustworthy’ ‘believable’ and ‘honest’ are important traits that customers
seek in the employees of PHCs. The reason is simple. Customers are reluctant
to transact with organisations that have employees who lack the above
qualities. This variable of service quality in PHCs has median and mode of 7.
A median of 7 implies that 50% of customers agree that the employees of the
PHCs are trustworthy, believable and honest. A mode of 7 indicates that a
highest number of customers have assigned the score 7 for this variable. This
would mean that a majority of customers have received more than the desired
level quality on this variable. The mean score of the variable is 6.5 (SD=1.2)
which confirms that the quality as perceived by the most of the customers has
exceeded the desired level. The data in Table 7.3 and the Figure 7.5 support
the above results. While 55% of customers have answered 6 or 7 on this
variable 22.38% have perceived high quality (8 or 9). However, 22.62% of
customers have perceived low quality on the variable. From these results it
becomes clear that PHCs need to improve this core component of service
quality because employees who are not trustworthy, believable and honest
may lead to risk of losing customers.
7.3.2.8 Understanding Customer Needs (Q10)
Employees making effort to understand customer needs may enhance
the performance quality of service delivered to the customers. If the
employees are not making efforts to understand the customer needs, the
customers may perceive quality as poor. Poor quality puts PHCs at a
competitively disadvantageous position. Moreover, if the customers perceive
quality as poor they would engage in unfavourable behavioural responses
(show tendency to switch).

323
It is observed from the Table 7.3 that both median and mode values for
the variable are 7. Median value of 7 implies that 50% of customers have
agreed that the employees of PHCs are making effort to understand their
needs and that their expectations on this aspect of service quality have been
exceeded. The value of mode supports this finding, indicating that the highest
number of customers have assigned the score 7. The fact that quality on this
variable has exceeded the expectations of customers is also supported by the
value of mean score which is 6.6 (SD=1.5).
But the Table 7.5 shows that 24.76% of the customers have answered 5
or below on the Likert scale. This would mean that nearly one fourth of the
customers are dissatisfied with this attribute of service quality in CHFSs.
Although high percentage of customers receive either desired level or above,
still 24.76% is a relatively high percentage for customers not being satisfied
with the efforts made by the employees to understand customer needs. This is
very dangerous in the competitive housing finance environment in Kerala
because customers can easily switch to another housing finance agency.
7.3.2.9 Legible Forms in Local Language (Q11)
This attribute of service quality is a key factor which is recognized for
its importance on the performance quality of PHCs. It is a factor of tangible
nature and is better linked to customer memory and ultimately influences
customer behavioural responses. This variable of service quality in PHCs has
median and mode of 8 indicating that a majority of customers have perceived
high service quality. The mean value of 8.1 with standard deviation of 0.8 for
this factor confirms the above findings. Furthermore, the Table 7.3 shows
that only 0.24% of customers have stated 5 or below on Likert-Scale for this
variable. This indicates that only 0.24% of the customers are dissatisfied with
this feature of service quality in PHCs which implies that in general most of
the customers (81.67%) are highly satisfied with the forms of PHCs which are

324
legible and in local language. These results can be considered rewarding for
PHCs as this feature differentiates PHCs from other housing finance agencies.
7.3.2.10 Physical facilities and employees (Q12)
This attribute of service quality is key factor which is recognised for its
importance on the performance quality of PHCs. It is a factor of tangible
nature and is better linked to customer memory and thus influences customer
behaviour. This variable of service quality in PHCs has median and mode of 8
indicating that a majority of customers have perceived high quality. The mean
value of 7.9 with standard deviation of 0.9 for this variable confirms the
above findings. Moreover, the Table 7.5 shows that only 0.71% of the
customers has assigned 5 or below on the Likert scale. This indicates that only
0.71% of the customers are dissatisfied with this feature of service quality in
PHCs which implies that in general physical facilities and employees are neat
and clean.
7.3.2.11 Evaluation of Service Quality on the basis Different Quality
Variables
An analysis of the percentage of customers who have chosen 5 or
below, 6 or 7 and 8 or 9 on the Likert scale unfolds how many customers in
percentage of the total number of customers have perceived poor service
quality, minimum, moderate and high level of service quality. The Figure 7.4
shows that 'most' customers have received low service quality on the
following variables of service quality in PHCs: ‘competence of employees’
(Q5) – 25.71%; ‘making the efforts to understand customer needs’ (Q10) -
24.76%; ‘courteous, polite and respectful employees’ (Q7) – 23.57%; and
‘trustworthy, believable and honest employees’ (Q9) – 22.62%. As these
features of service quality in PHCs have evoked poor scores they demand
immediate improvement so that total service quality would increase.

325
Figure 7.6
Mean Scores of SQ and its Variables
Source: Survey data.
On the other hand, the variables (dimensions) of service quality on
which most customers have perceived moderate level of quality are the
following: ‘Employees providing service reliably, consistently and
dependably’ (Q3) – 77.14%; ‘willingness and ability of employees to provide
service in a timely manner’ (Q4) – 67.86%; ‘competence of employees’ (Q5)
– 62.62%; and ‘courteous, polite and respectful employees’ (Q7) – 62.14%.
Since these features of service quality are of high importance to PHCs, they
need attention of the management to improve the total service quality. In
comparison most customers have perceived highest level of quality on ‘neat
and clean physical facilities and employees’ (Q12) – 69.29% and
‘approachable and easy to contact employees’ (Q 6) – 64.29%. These results
may be considered rewarding for PHCs as they may take competition on these
features of service quality.

326
Figure 7.7
Percentage of Customers with High, Moderate and Low SQ Scores
Source: Survey data.
Looking at the descriptive statistics on service quality presented in
Table 7.3 it is inferred from the values of median and mode that most of the
customers of PHCs have perceived service quality more than the desired
level. A mean score of 6.9 (SD=1.3) for service quality confirms that the
service quality as perceived by the majority of customers have just exceeded
their expectations. These findings are supported by the percentage of
customers who have received low service quality (14%), moderate service
quality (50.98%) and high service quality (35.02%) (see Figure 7.7)
7.3.3 Customer Satisfaction
A high service quality leads to greater customer satisfaction or delight
which in turn leads to customer loyalty. Customer satisfaction (CS) depends
on how customer needs and expectations are being fulfilled. The customer
satisfaction in PHCs is measured using three variables viz., Q13, Q14 and
Q15.

327
Figure 7.8
Mean Scores of CS and its Variables
Source: Survey data.
The median of Q13 and Q14 is 7 which means that 50% of customers
are satisfied with the services and products provided by PHCs. Their values
for mode are 7 implying that highest number of customers has answered 7 on
the Likert scale. Mean values for Q13 and Q14 are 6.8 (SD=1.0) and 6.9
(SD=1.2) respectively (see Figure 7.8). Furthermore, it is seen from the Table
7.6 that 71.67% of the customers for Q13 and 54.05% for Q14 have received
moderate level of satisfaction, supporting the above results.
Table 7.6
Percentage of Customers by CS Score Group
Q13 Q14 Q15 CS^
<6 9.05 14.76 32.38 18.73
6,7 71.67 54.05 54.05 59.92
>7 19.29 31.19 13.57 21.35 Source: Survey data.

328
Q15 is the variable for measuring the overall feelings of the customers
towards the services provided by PHCs. Median and mode values of Q15 are
6 and 7 respectively. A median of 6 would mean that the overall feelings of
one half of the customers towards the services provided by PHCs are ‘just
satisfied’. A mode of 7 implies that the highest number of customers assigned
the score 7 for this variable, indicating moderate level of satisfaction. These
results are supported by the mean value which is only 6.1 (SD=1.3).
Moreover, Table 7.6 reveals that 54.05% of the customers have experienced
moderate level of satisfaction.
Figure 7.9
Percentage of Customers with High, Moderate and Low CS Scores
Source: Survey data.
Conclusively, median and mode values of all the variables of customer
satisfaction construct taken together are 7, indicating that the customers of
PHCs have been experiencing only moderate level of satisfaction. The mean
score for customer satisfaction is 6.6 (SD=1.2) which supports the above
results. These results are, further confirmed by the percentage of customers
who have shown low level of satisfaction (18.73%), moderate level of
satisfaction (59.92%) and high level of satisfaction (21.35%) (see Figure 7.9).

329
7.3.4 Co-operative Identity
Co-operative identity (CI) is a unique characteristic of a co-operative
organisation. Co-operative identity has its roots in co-operative principles and
values (CPV). The co-operative principles and values were developed by
International Co-operative Alliance (1995) in order to form the structural
setting for promoting membership and loyalty. The co-operative identity thus
has a profound impact on the member/customer loyalty. It is in this context an
attempt is made here to analyse the strength of co-operative identity in the
PHCs.
Table 7.7
Percentage of Customers by CI Score Group
Q1 Q2 CI
<6 14.05 14.52 14.29
6,7 62.14 50.71 56.43
>7 23.81 34.76 29.29 Source: Survey data.
Co-operative identity is measured using two variables viz., Q1 and Q2.
Q1 has a median and mode value of 7 meaning that a majority of customers
moderately agree with the statement that PHCs adhere to the co-operative
principles. Mean value of the variable is 6.8 (SD=1.1) supporting the above
result. These results are consistent with the percentage of customers who have
moderately agreed i.e. 62.14%.

330
Figure 7.10
Percentage of Customers with High, Moderate and Low CI Scores
Source: Survey data.
Referring to the variable Q2, it can be inferred from its median value
of 7 and mode of 8 that in general customers have agreed with the statement
that PHCs respect co-operative values. The mean value of 6.9 also lends
support to the above finding. Moreover the percentages of customers who
have strongly agreed (34.76%) and moderately agreed (50.71%) confirm the
findings. Nevertheless Table 7.7 reveals that 14.52% of the customers have
answered 5 or below on the Likert scale, indicating that they do not agree
with the statement.

331
Figure 7.11
Mean Scores of CI and its Variables
Source: Survey data.
Conclusively, looking at co-operative identity (taking the two variables
of co-operative identity together) it is observed that it has a median and mode
of 7 vouching that the strength of co-operative identity in PHCs is moderate.
A mean score of 6.8 with standard deviation 1.0 confirms that the strength of
co-operative identity is not very strong in PHCs. The percentages of
customers who have disagreed (14.29%), moderately agreed (56.43%) and
strongly agreed (29.29%) lend support to the above findings. These results
assume significance in that 14.29% of customers believe that the basic
premise of a co-operative organization is being defeated and they find no
difference between co-operative and other organizations and therefore when
they have inferior perceptions about service quality they would switch to
another housing finance agency.
7.3.5 Switching Costs
Switching cost (SC) refers to the cost involved in terminating the
relationship with the current housing finance provider and acquiring new
CI^ Q2 Q1

332
relationship with another housing finance provider. Analysing switching costs
is important for PHCs because these costs stand as a barrier to customer
switching and hence lead to customer loyalty. Costs of switching from PHCs
to another housing finance agency are measured using three variables viz.,
Q16, Q17 and Q18.
Table 7.8
Percentage of Customers by SC Score Group
Q16 Q17 Q18 SC^
<6 5.95 0.24 7.14 4.44
6,7 60.71 35.95 60.95 52.54
>7 33.33 63.81 31.90 43.02 Source: Survey data.
Both Q16 and Q18 have median value of 7 meaning that 50% of
customers moderately agree that it would take a lot of time and cost them a lot
of money to switch from the PHCs to another housing finance company.
Similarly their values for mode are 7 indicating that highest number of
customers has answered 7. Moreover, their values for mean are 7 confirming
that in general switching costs are moderate. Percentages of customers who
have moderately agreed with Q16 (60.71%) and Q18 (60.95%) support the
above findings (see Table 7.8)

333
Figure 7.12
Percentage of Customers with High, Moderate and Low SC Scores
Source: Survey data.
It is seen from the Table 7.3 that while Q17 has a median and mode of
8, it has a mean of 7.8 with standard deviation 0.9. These numbers imply that
a majority of the customers have strongly agreed that it would take a lot of
effort to switch from PHCs to another housing finance company. This finding
is further supported by the percentage of customers who have very strongly
agreed with Q17 (63.81%).
Figure 7.13
Mean Scores of SC and its Variables
Source: Survey data.
Q16 Q17 Q18 SC^

334
However, an anlysis of descriptive statistics on switching cost in Table
7.3 reveals that both median and mode values for the overall switching costs
(taking all the three variables of SC together) are 7 and mean score is 7.3
(SD=1.1). It can be inferred from the above results that the switching cost in
CHFSs is high and it would serve as blockade to customer switching. The
percentage of customers who have disagreed with high overall switching cost
(4.44%) lends support to the above finding.
7.3.6 Customer Loyalty
Customer loyalty is the positive attitude that a customer shows towards
the product or service of a service provider and resorts only to the use of the
product or service from the same provider. A member/customer loyalty of a
PHCs is described as a loyal customer when the customer spreads good word-
of-mouth about the co-operative to other potential customers who then
become customers of the co-operative. A loyal customer of PHCs will not
switch to other housing finance providers even when the customer is
dissatisfied or when the product or service does not meet the expectations of
the customers. Member/customer loyalty in a PHCs is measured by using
three variables viz, Q19, Q20 and Q21. These variables of loyalty capture the
behavioural and attitudinal loyalty reposed by the customers in the PHCs.
Table 7.9
Percentage of Customers by CL Score Group
Q19 Q20 Q21 CL^
<6 27.14 31.90 63.10 40.71
6,7 57.86 51.43 34.29 47.86
>7 15.00 16.67 2.62 11.43 Source: Survey data.

335
It is observed from the Table 7.3 that Q19 and Q20 of the variables of
loyalty have median and mode values of 6. These values indicate that a
majority of customers have shown moderate degree of loyalty towards PHCs.
Mean value of both the variable is 6.2 which confirms the above finding.
These results are further supported by the percentage of customers who have
shown moderate level of loyalty – 57.86% (Q19) and 51.43% (Q20).
However, it is important to note that 15% of the customers for Q19 and
16.67% of the customers for Q20 have shown higher degree of loyalty (see
Table 7. 9)
Figure 7.14
Percentage of Customers with High, Moderate and Low CL Scores
Source: Survey data.
On the other hand, referring to Q21, most customers PHCs have shown
low level of loyalty. The median and mode value of 5 for Q21 shows that
majority of customers are indifferent to this aspect of loyalty i.e. customers
would stay with the co-operative, although they would have to incur a
somewhat higher cost. Mean of the variable is 5.3 (SD=1.2), supporting the
above finding. The percentage of customers who have answered 5 or below is
63.10 which also lends support to the finding (see Table 7.9). It appears from

336
the Table 7.9 that only 2.62% of customers are willing to incur higher cost to
stay with the co-operative.
Figure 7.15
Mean Scores of CL and its Variables
Source: Survey data.
Conclusively, median and mode value of customer loyalty (taking all
the variables together) are 6, revealing that the customers of PHCs in general
show moderate level of loyalty. The mean score for loyalty is 5.9 with
standard deviation 1.3 confirms the above results. Furthermore, these results
are supported by the percentage of customers who have shown low level of
loyalty (40.71%), moderate level of loyalty (47.86%) and high level of loyalty
(11.43%) (see Figure 7.14)
Q19 Q20 Q21 CL^

337
7.3.7 Service quality, Customer satisfaction, Co-operative identity,
Switching cost and Customer Loyalty – Region, Gender, Age, and
Education wise Analysis
Table 7. 10
Factors of Customer Loyalty: Descriptive Statistics (Region wise analysis)
Region N Mean Std. Deviation Trivandrum 100 14.3600 1.54737 Ernamulam 180 13.1278 2.07951 Kozhikode 140 13.7929 1`92483
Co-op. Identity
Total 420 13.6429 1.97141 Trivandrum 100 68.7800 4.66260 Ernamulam 180 68.4333 6.42716 Kozhikode 140 70.7286 6.24078
Service Quality
Total 420 69.2762 6.06448 Trivandrum 100 19.7200 2.25666 Ernamulam 180 19.5000 3.00744 Kozhikode 140 20.2071 3.44431
Customer Satisfaction
Total 420 19.7881 3.01632 Trivandrum 100 21.6100 2.14568 Ernamulam 180 21.8167 2.10312 Kozhikode 140 22.2000 2.08868
Switching Costs
Total 420 21.8952 2.15475 Trivandrum 100 17.5100 2.07191 Ernamulam 180 17.5055 3.73792 Kozhikode 140 18.1714 3.39899
Customer Loyalty
Total 420 17.7266 3.30367 Trivandrum 100 141.9600 9.34298 Ernamulam 180 140.3833 13.33979 Kozhikode 140 145.1000 14.55295
Total Score
Total 420 142.3310 13.12970 Source: Survey data.

338
Mean scores of the factors of customer loyalty in PHCs are further analysed on the basis of regions. As provided in the Table 7.10 mean scores of all the factors of customer loyalty are different in the three sample regions. Mean scores for service quality, customer satisfaction, switching cost and customer loyalty are highest in Kozhikkode region followed by Thiruvananthapuram. However, the mean score for switching cost in Ernakulam region is higher than Thiruvananthapuram. These results indicate that there are differences in the perception of customers in the different regions. Therefore F-test has been conducted to test whether there is any significant difference in the perceptions of customers in the three regions of Kerala.
Table 7.11 Results of Analysis Variance
(ANOVA)
Sum of squares D.F. Mean-
Square F-
value P-
value Between Groups 102.335 2 51.167 Within Groups 1526.094 417 3.660 Co-op.
Identity Total 1628.429 419
13.981 .000
Between Groups 449.836 2 224.918 Within Groups 14960.126 417 35.876 Service
Quality Total 419 419
6.269 .002
Between Groups 39.988 2 19.994 Within Groups 3772.153 417 9.046 Customer
Satisfaction Total 3812.140 419
2.210 .111
Between Groups 22.250 2 11.125 Within Groups 1923.140 417 4.612 Switching
Costs Total 1945.390 419
2.412 0.091
Between Groups 41.187 2 20.593 Within Groups 4531.570 417 10.868 Customer
Loyalty Total 4573.057 419
1.895 .152
Between Groups 1770.008 2 885.004 Within Groups 1526.094 417 3.660 Total Score Total 1628.429 419
5.238 .006
Source: Survey data.

339
Results indicate that significant differences exists for service quality
(p<0.05) and co-operative identity (p<0.05). But there exist no significant
differences (p>0.05) in the case of customer satisfaction, switching cost and
customer loyalty (7.11). Moreover a Post HOC Test has been conducted to
study the significance of differences in the perception of customers on service
quality, customer satisfaction, co-operative identity, switching cost and
customer loyalty in the three sample regions using Fisher’s Least Significant
Difference (LSD) method.
Table 7.12
Factors of Customer Loyalty in Regions (Results of Post-Hoc Tests)
Dependent Variables (I) Region (J) Region
Mean Difference
(W)
Std. Error Sig.
Trivandrum Ernakiulam Kozhikde
1.23222* .56714*
.23860
.25047 .000 .024
Eranakulam Trivandrum Kozhikode
-1.23222* -.66508*
.23860
.21557 .000 .002 Co-op. Identity
Kozhikode Trivandrum Ernakuam
-.56713* .66508*
.25047
.21557 .024 .002
Trivandrum Ernakiulam Kozhikde
.32667 -1.96857*
.74704
.78423 .662 .012
Eranakulam Trivandrum Kozhikode
-.32667 -2.29524*
.74704
.67495 .662 .001 Service Quality
Kozhikode Trivandrum Ernakulam
1.968576* 2.29524*
.78423
.67495 .012 .001
Trivandrum Ernakiulam Kozhikde
.22000 -.48714
.37512
.36379 .558 .217
Eranakulam Trivandrum Kozhikode
-.22000 -.70714*
.37512
.33892 .558 .038
Customer Satisfaction
Kozhikode Trivandrum Ernakulam
.48714 .70714*
.39379
.33892 .217 .038

340
Dependent Variables (I) Region (J) Region
Mean Difference
(W)
Std. Error Sig.
Trivandrum Ernakiulam Kozhikde
-.20667 -.59000*
.26784
.28118 .441 .036
Eranakulam Trivandrum Kozhikode
.20667 -.38333
.26784
.24200 .441 .114
Switching Costs
Kozhikode Trivandrum Ernakulam
.59000* .38333
.28118
.24200 .036 .154
Trivandrum Ernakiulam Kozhikde
.00444 -.66143
.41116
.43163 .991 .126
Eranakulam Trivandrum Kozhikode
-.00444 -.66587
.41116
.37149 .991 .074
Customer Loyalty
Kozhikode Trivandrum Ernakulam
.66143 .665897
.43163
.37149 .128 .074
Trivandrum Ernakiulam Kozhikde
1.57667 -3.14000
1.62125 1.70195
.31 .066
Eranakulam Trivandrum Kozhikode
-1.57667 -4.71667*
1.62125 1.46461
.331
.001 Total Score
Kozhikode Trivandrum Ernakulam
3.14000 4.71667*
1.70195 1.45481
.066
.001 *The mean difference is significant at 0.05 level Source: Survey data.
The results of Post HOC Test are presented in Table7.12. Table 7.12
shows that in the case of co-operative identity mean differences between
Thiruvananthapuram – Ernakulam, Thiruvananthapuram – Kozhikkode, and
Ernakulam – Kozhikkode regions are significant. In the case of service
quality, differences between Thiruvannathapuram – Kozhikkode regions are
significant. In the case of customer satisfaction difference is significant
between Ernakulam and Kozhikkode and in the case of switching cost
between Thiruvananthapuram – Kozhikkode regions. However no significant
differences are found among regions on customer loyalty.
341
Table 7.13
Factors of Customer Loyalty (Gender Wise Analysis)
N Mean Std. Deviation Std. Error Male 301 13.5714 1.95082 0.11244
Female 119 13.8235 2.01959 0.18514 Co-op. Identity
Total 420 13.6429 1.97141 0.09620
Male 301 69.1395 5.97889 0.34462
Female 119 69.6218 6.28826 0.57644 Service Quality
Total 420 69.2762 6.06448 0.29592
Male 301 19.7010 3.06109 0.17644
Female 119 20.0084 2.90089 0.26592 Customer Satisfaction
Total 420 19.7881 3.01632 0.14718
Male 301 21.8870 2.16653 0.12488
Female 119 21.9160 2.13359 0.19559 Switching Costs
Total 420 21.8952 2.15475 0.10514
Male 301 17.4983 3.29102 0.18969
Female 119 18.3109 3.27742 0.30044 Customer Loyalty
Total 420 17.7286 3.30367 0.16120
Male 301 141.7973 12.75077 0.73494
Female 119 143.6807 14.00783 1.28410 Total Score
Total 420 142.3310 13.12970 0.64066 Source: Survey data.
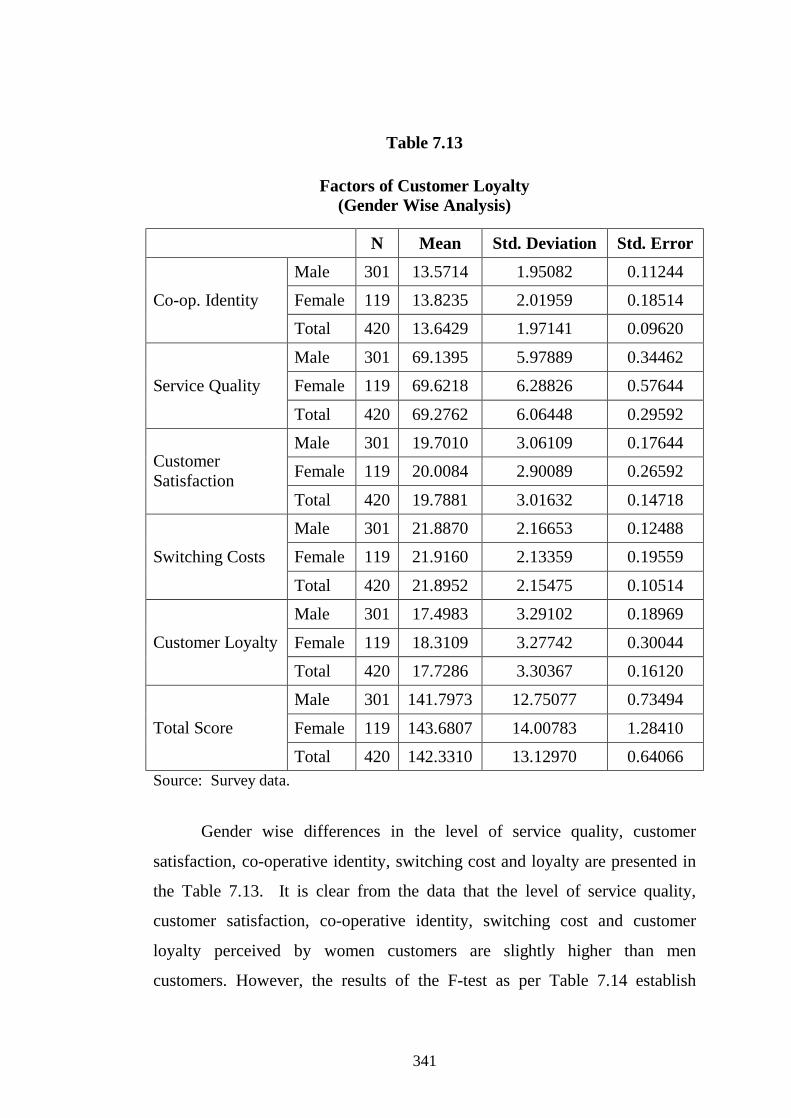
Gender wise differences in the level of service quality, customer
satisfaction, co-operative identity, switching cost and loyalty are presented in
the Table 7.13. It is clear from the data that the level of service quality,
customer satisfaction, co-operative identity, switching cost and customer
loyalty perceived by women customers are slightly higher than men
customers. However, the results of the F-test as per Table 7.14 establish

342
significant difference only in the case of loyalty as the obtained ‘P’ value is
less than 0.05. This would mean that the strength loyalty shown by women is
stronger than men.
Table 7.14
Result of Analysis of Variance
Sum of Squares Df Mean
Square F-
value P-
value
Between groups 5.420 1 5.420 1.396 0.238
Within groups 1623.008 418 3.883 Co-op. Identity
Total 1628.429 419
Between groups 19.839 1 19.839 0.539 0.463
Within groups 15390.123 418 36.818 Service Quality
Total 15409.962 419
Between groups 8.059 1 8.059 0.886 0.347
Within groups 3804.081 418 9.101 Customer Satisfaction
Total 3812.140 419
Between groups 0.071 1 0.071 0.015 0.902
Within groups 1945.319 418 4.654 Switching Costs
Total 1945.390 419
Between groups 56.312 1 56.312 5.211 0.023
Within groups 4516.745 418 10.806 Customer Loyalty
Total 4573.057 419
Between groups 302.494 1 302.494 1.758 0.186
Within groups 71928.503 418 172.078 Total Score
Total 82230.998 419 Source: Survey data.

343
Table 7.15 Factors of Customer Loyalty (Age wise Analysis)
N Mean Std. Deviation
1 9 13.7778 1.48137 2 85 14.0118 1.75590 3 170 13.6588 2.01505 4 124 13.4274 2.00476 5 32 13.3750 2.21068
Co-op. Identity
Total 420 13.6429 1.97141 1 9 68.6667 5.14782 2 85 69.5412 5.41944 3 170 69.5647 5.98212 4 124 69.0484 6.30377 5 32 68.0938 7.45031
Service Quality
Total 420 69.2762 6.06448 1 9 19.6667 2.82843 2 85 20.1529 2.52372 3 170 19.8824 3.08043 4 124 19.5565 3.14501 5 32 19.2500 3.42665
Customer Satisfaction
Total 420 19.7881 3.01632 1 9 20.7778 2.58736 2 85 22.1412 2.04795 3 170 21.8941 2.17856 4 124 21.9032 2.14673 5 32 21.5313 2.19948
Switching Costs
Total 420 21.8952 2.15475 1 9 18.0000 2.12132 2 85 18.2471 2.95565 3 170 17.6882 3.24582 4 124 17.4919 3.67478 5 32 17.4063 3.25140
Customer loyalty
Total 420 17.7286 3.30367 1 9 140.8889 10.77549 2 85 144.0941 11.75506 3 170 142.6882 13.22014 4 124 141.4274 13.60904 5 32 139.6563 14.74867
Total score
Total 420 142.3310 13.12970 Source: Survey data.
344
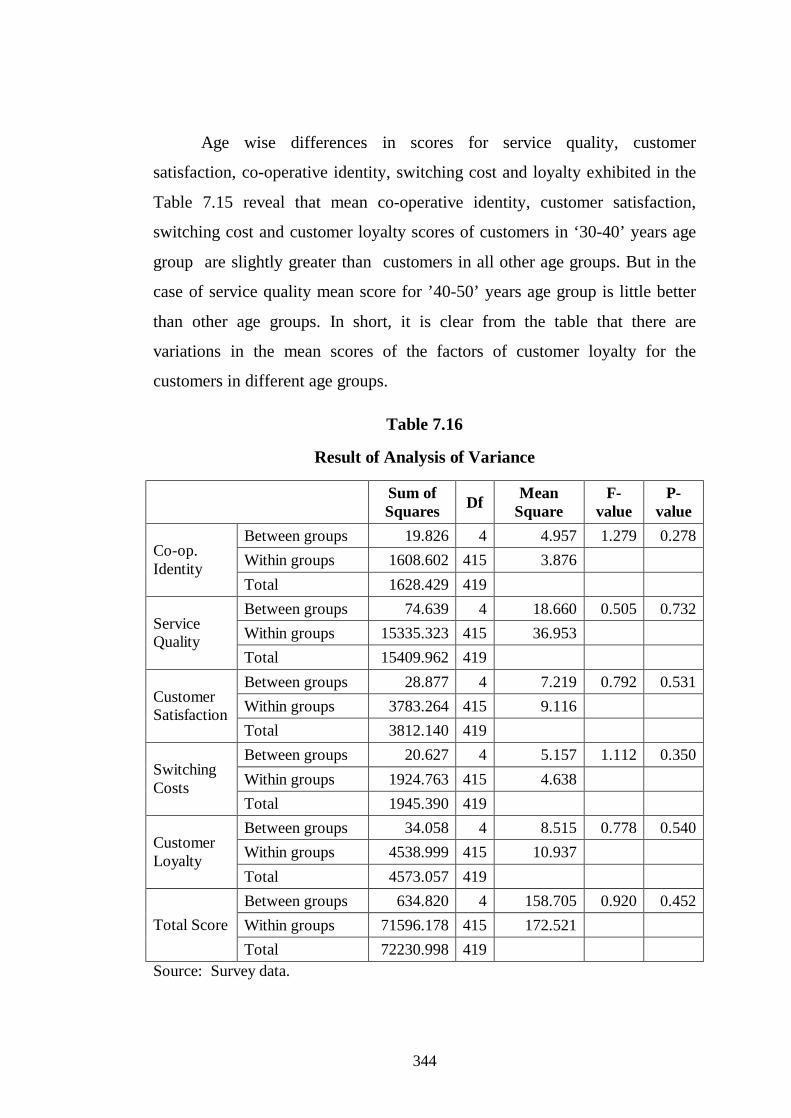
Age wise differences in scores for service quality, customer
satisfaction, co-operative identity, switching cost and loyalty exhibited in the
Table 7.15 reveal that mean co-operative identity, customer satisfaction,
switching cost and customer loyalty scores of customers in ‘30-40’ years age
group are slightly greater than customers in all other age groups. But in the
case of service quality mean score for ’40-50’ years age group is little better
than other age groups. In short, it is clear from the table that there are
variations in the mean scores of the factors of customer loyalty for the
customers in different age groups.
Table 7.16
Result of Analysis of Variance
Sum of Squares Df Mean
Square F-
value P-
value Between groups 19.826 4 4.957 1.279 0.278 Within groups 1608.602 415 3.876 Co-op.
Identity Total 1628.429 419 Between groups 74.639 4 18.660 0.505 0.732 Within groups 15335.323 415 36.953 Service
Quality Total 15409.962 419 Between groups 28.877 4 7.219 0.792 0.531 Within groups 3783.264 415 9.116 Customer
Satisfaction Total 3812.140 419 Between groups 20.627 4 5.157 1.112 0.350 Within groups 1924.763 415 4.638 Switching
Costs Total 1945.390 419 Between groups 34.058 4 8.515 0.778 0.540 Within groups 4538.999 415 10.937 Customer
Loyalty Total 4573.057 419 Between groups 634.820 4 158.705 0.920 0.452 Within groups 71596.178 415 172.521 Total Score Total 72230.998 419
Source: Survey data.

345
The results of analysis of variance (Table 7.16) indicate that there no
significant differences in the perceptions of customers in the different age
groups on service quality, customer satisfaction, co-operative identity,
switching cost and loyalty as the ‘P’ values of the factors are greater than
0.05. It can be inferred from the results that perceptions of customers in
different age groups on the factors of customer loyalty in PHCs are identical.
Table 7.17
Factors of Customer Loyalty (Education Wise Analysis)
N Mean Std. Deviation
Below SSLC 168 13.5417 1.98151 SSLC 184 13.7446 1.94879 Degree 25 13.6400 2.28910 Others 43 13.6047 1.87895
Co-op. Identity
Total 420 13.6429 1.97141 Below SSLC 168 69.0952 6.13446 SSLC 184 69.2989 7.74016 Degree 25 70.0800 4.90982 Others 43 69.4186 6.06448
Service Quality
Total 420 69.2762 3.06599 Below SSLC 168 19.7202 3.06599 SSLC 184 19.7663 3.06483 Degree 25 20.9600 3.07517 Others 43 19.4651 2.47222
Customer Satisfaction
Total 420 19.7881 3.01632 Below SSLC 168 21.9583 2.10603 SSLC 184 21.8533 2.23122 Degree 25 21.5600 2.14243 Others 43 22.0233 2.06430
Switching Costs
Total 420 21.8952 2.15475

346
N Mean Std. Deviation
Below SSLC 168 17.5536 3.45676 SSLC 184 17.8152 3.31392 Degree 25 18.5600 3.41663 Others 43 17.5581 2.50050
Customer Loyalty
Total 420 17.7286 3.30367 Below SSLC 168 141.8690 13.13475 SSLC 184 142.4783 13.18840 Degree 25 144.8000 16.74656 Others 43 142.0698 10.53881
Total Score
Total 420 142.3310 13.12970 Source: Survey data.
Table 7.17 reveals the differences of perceptions of customers on the
service quality, customer satisfaction, co-operative identity, switching cost
and customer loyalty due to differences in the level of education of customers.
The mean scores of the factors indicate differences in the perceptions of
customers having different levels of education.
Table 7.18
Results of Analysis of Variance
Sum of Squares Df Mean
Square F-
value P-
value
Between groups 3.687 3 1.229 0.315 0.815
Within groups 1624.742 416 3.906 Co-op. Identity
Total 1628.429 419
Between groups 22.621 3 7.540 0.204 0.894
Within groups 15387.341 416 36.989 Service Quality
Total 15409.962 419
Between groups 39.981 3 13.227 1.459 0.225
Within groups 3772.460 416 9.068 Customer Satisfaction
Total 3812.140 419

347
Sum of Squares Df Mean
Square F-
value P-
value
Between groups 4.507 3 1.502 0.322 0.809
Within groups 1940.883 416 4.666 Switching Costs
Total 1945.390 419
Between groups 25.057 3 8.352 0.764 0.515
Within groups 4548.000 416 10.933 Customer Loyalty
Total 4573.057 419
Between groups 195.175 3 65.058 0.376 0.771
Within groups 72035.823 416 173.163 Total Score
Total 72230.998 419 Source: Survey data.
Table 7.18 reports the results of the analysis of variance of the
perceptions of customers having different levels of education on service
quality, customer satisfaction, co-operative identity, switching cost and
loyalty. The results of the analysis of variance suggest that there are no
significant differences in the perceptions of customers having different level
of education as the ‘P’ values of all the factors are greater than 0.05
7.3.8 The Relationship between Service Quality, Customer Satisfaction
and Customer Loyalty
Service quality is considered to be an important factor in increasing
customer satisfaction in housing finance companies. Several empirical
findings have agreed that service quality judgments cause satisfaction; that is,
service quality is the antecedent of satisfaction. These findings leads to
suggest that when the PHCs provide quality services to its members/
customers they become satisfied and leads to customers being loyal to the
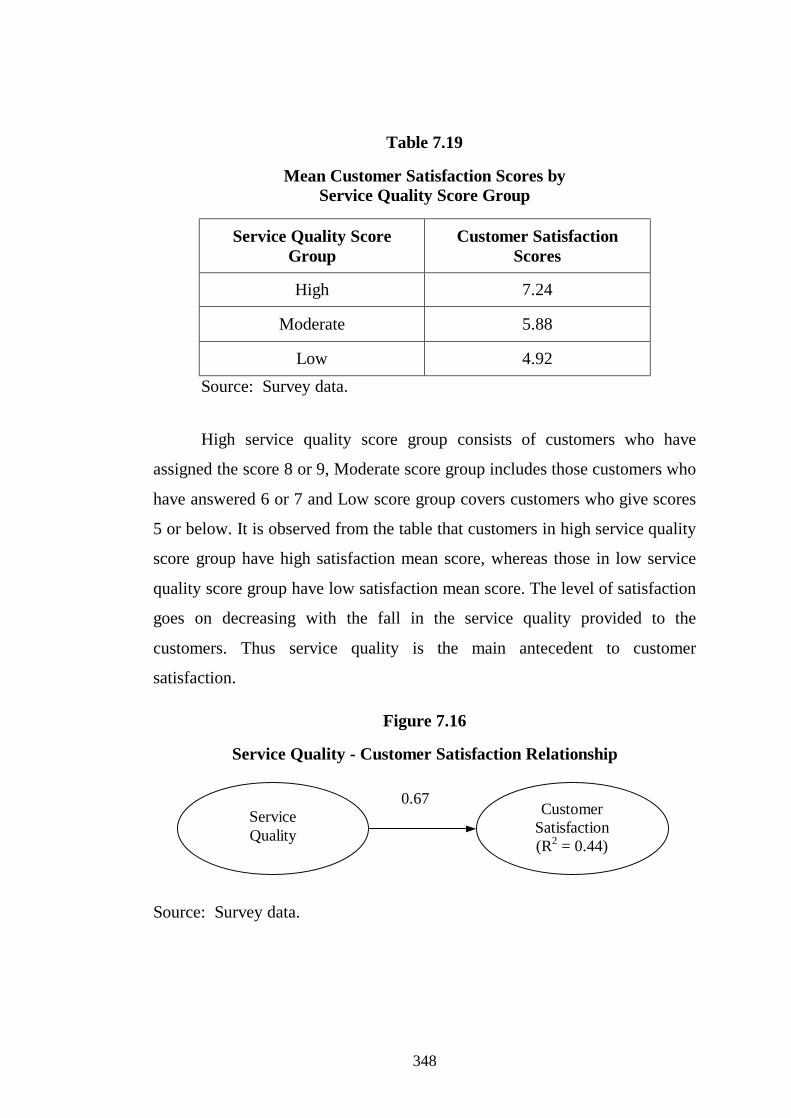
PHCs. Table 7.19 reveals mean customer satisfaction scores for different
service quality score groups.
348
Table 7.19
Mean Customer Satisfaction Scores by Service Quality Score Group
Service Quality Score Group
Customer Satisfaction Scores
High 7.24
Moderate 5.88
Low 4.92 Source: Survey data.
High service quality score group consists of customers who have
assigned the score 8 or 9, Moderate score group includes those customers who
have answered 6 or 7 and Low score group covers customers who give scores
5 or below. It is observed from the table that customers in high service quality
score group have high satisfaction mean score, whereas those in low service
quality score group have low satisfaction mean score. The level of satisfaction
goes on decreasing with the fall in the service quality provided to the
customers. Thus service quality is the main antecedent to customer
satisfaction.
Figure 7.16
Service Quality - Customer Satisfaction Relationship
Source: Survey data.
Customer Satisfaction (R2 = 0.44)
Service Quality
0.67

349
Moreover, Figure 7.16 shows that service quality relates both
significantly and positively to customer satisfaction. More specifically, the
significant relationship between service quality and customer satisfaction is
moderately strong as r=0.67 with p<.01. Service quality explains about 44%
of the variation in customer satisfaction (R2 = 0.44). These results support
that service quality is positively related to customer satisfaction.
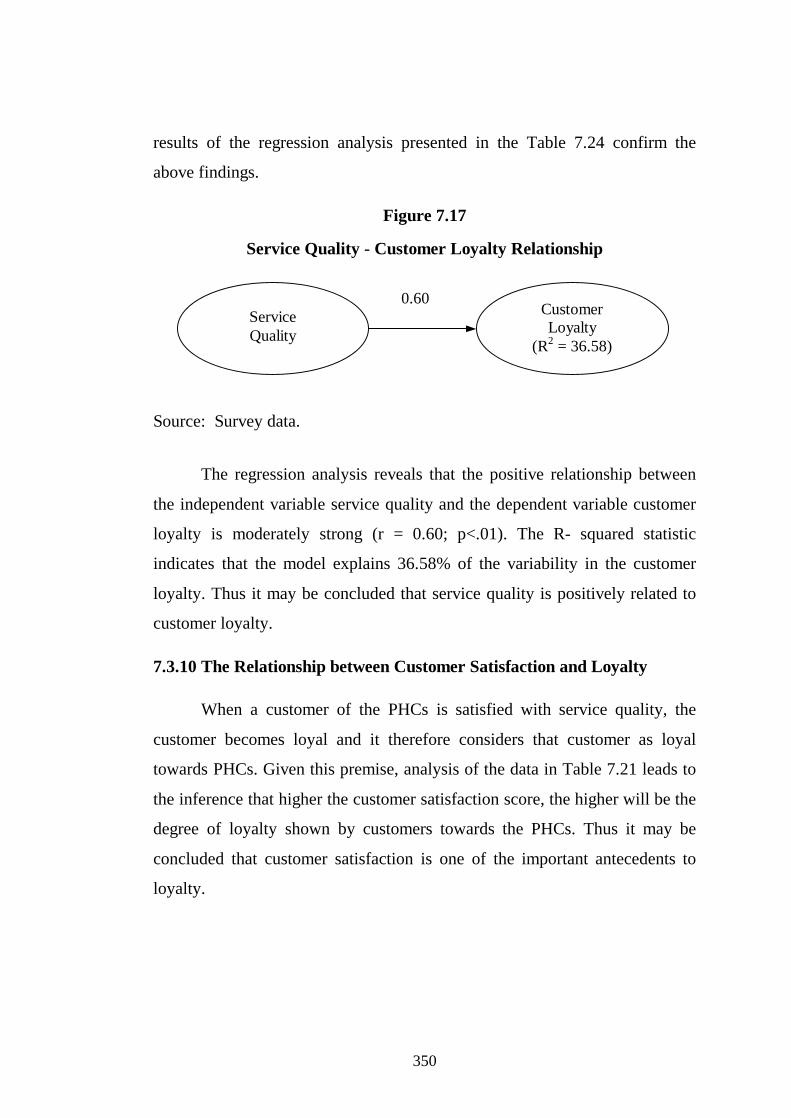
7.3.9 The Relationship between Service Quality and Customer Loyalty
Service quality is an integral component in customer loyalty creation. Higher quality of service leads to increased loyalty, greater tolerance of price increases, and superior image. The level of service quality that the PHCs provide to their customers tends to influence the loyalty of customers towards PHCs. Therefore it is logical to think that there would be a causal link between quality of services provided by PHCs and the level of loyalty shown by the customers. The analysis of the data presented in Table 7.20 sheds light on the causal link between service quality and loyalty in PHCs.
Table 7.20
Mean Customer Loyalty Scores by Service Quality Score Group
Service Quality Score Group Customer Loyalty Scores High 6.44
Moderate 5.86
Low 3.81 Source: Survey data.
It is evident from the above table that customers in high service quality
score group have shown high level of loyalty and those in low service quality
score group have shown low level of loyalty. These results indicate that there
exists positive relationship between service quality and customer loyalty. The
350
results of the regression analysis presented in the Table 7.24 confirm the
above findings.
Figure 7.17
Service Quality - Customer Loyalty Relationship
Source: Survey data.
The regression analysis reveals that the positive relationship between
the independent variable service quality and the dependent variable customer
loyalty is moderately strong (r = 0.60; p<.01). The R- squared statistic
indicates that the model explains 36.58% of the variability in the customer
loyalty. Thus it may be concluded that service quality is positively related to
customer loyalty.
7.3.10 The Relationship between Customer Satisfaction and Loyalty
When a customer of the PHCs is satisfied with service quality, the
customer becomes loyal and it therefore considers that customer as loyal
towards PHCs. Given this premise, analysis of the data in Table 7.21 leads to
the inference that higher the customer satisfaction score, the higher will be the
degree of loyalty shown by customers towards the PHCs. Thus it may be
concluded that customer satisfaction is one of the important antecedents to
loyalty.
Customer Loyalty
(R2 = 36.58)
Service Quality
0.60

351
Table 7.21
Mean Loyalty Scores by Customer Satisfaction Score Group
Customer Satisfaction Score Group Mean Loyalty Scores
High 6.59
Moderate 5.94
Low 4.90 Source: Survey data.
Figure 7.18
Customer Satisfaction - Customer Loyalty Relationship
Source: Survey data.
The results of simple regression analysis indicate that customer
satisfaction has a direct and significant positive effect on customer loyalty.
Specifically, the significant relationship between customer satisfaction and
customer loyalty is moderately strong (r = 0.61; p value < 0.01). As per the
regression analysis customer satisfaction explains about 37% of variation in
customer loyalty (R2 = 0.37). Since the p-value in table is less than 0.01,
there is a statistically significant relationship between customer satisfaction
and customer loyalty.
Customer Loyalty
(R2 = 0.37)
Customer Satisfaction
0.61

352
7.3.11 The Relationship between Co-operative Identity and Customer
Loyalty
Co-operative principles and values, on which the structure of the co-
operative organization is built, clothe co-operative forms of business with a
unique characteristic known as co-operative identity. It is the competitive
advantage that co-operative organizations have over other organizations. Co-
operative identity means that a co-operative exists not to create profits for any
group other than the members and it is member owned and controlled. The
co-operative identity leads to loyalty. Loyalty helps co-operatives to be more
successful. It is in this background the relationship between co-operative
identity and member/customer loyalty is explored.
Table 7.22
Mean Loyalty Scores by Co-operative Identity Score Group
Co-operative Identity Score Group Mean Loyalty Scores
High 6.47
Moderate 5.88
Low 4.90 Source: Survey data.
Table 7.22 reveals that mean loyalty score of customers in the high co-
operative identity score group is more than that of moderate group and mean
loyalty score of moderate group is more than the low co-operative identity
score group. It can be inferred from the mean loyalty scores in the table that
co-operative identity has a profound influence on member/customer loyalty
and therefore it is an important antecedent to loyalty in PHCs.

353
Figure 7.19
Co-operative Identity - Customer Loyalty Relationship
Source: Survey data.
The regression analysis presented Table 7.24 shows that the regression
co-efficient between co-operative identity and customer loyalty as 0.55
(p<0.01). These results establish that there exists a significant positive
relationship between co-operative identity and customer loyalty. The co-
operative identity explains about 30% of the variability in customer loyalty
(R2 = 0.30).
7.3.12 The Relationship between Switching Cost and Customer Loyalty
Switching costs mean costs involved in changing from one service
provider to another. The driving force for the study of switching costs in
PHCs is the assumption that these costs hamper customer switching. Thus the
perception of switching is considered as an important factor influencing
customer loyalty in PHCs. An examination of data presented in Table 7.23
shows that mean loyalty scores of customers who have perceived high
switching costs is higher than those customers who have perceived low
switching costs.
Customer Loyalty
(R2 = 0.30)
Co-operative Identity
0.55

354
Table 7.23
Mean Loyalty Scores by Switching Cost Score Group
Switching Cost Score Group Mean Loyalty Scores
High 6.17
Moderate 5.78
Low 5.00 Source: Survey data.
Figure 7.20
Switching Cost - Customer Loyalty Relationship
Source: Survey data.
While exploring the relationship between switching costs and loyalty
in PHCs, it is found that there exists a statistically significant relationship
between switching costs and customer loyalty. The correlation coefficient
between switching cost and customer loyalty equals 0.27, indicating a
relatively weak relationship between the variables. The R-squared statistic
indicates that the switching cost explains only about 7% of the variation in
customer loyalty (R2 = 0.07).
7.4 Testing of Hypotheses
The hypothesized relationships have been tested using the simple and
multiple regression analysis of SPSS for Windows. The average scores of the
variables which form each construct are used in the data analysis. The R2 is
used to assess the model’s overall predictive fit. The customer loyalty model
Customer Loyalty
(R2 = 0.07)
Switching Cost
0.27

355
in PHCs is presented in Figure 7.20 While in hypothesis H1a the study
examines the relationship between service quality and customer satisfaction,
in hypotheses H1b, H2, H3, and H4 it investigates the influence of service
quality, customer satisfaction, co-operative identity and switching cost on
customer loyalty.
Table.7.24
Customer Loyalty Model: Evaluation and Validity Simple Regression Analysis
Independent Variables
Customer Loyalty - Correlation coefficients
F - Value
P - Value R2
Service Quality 0.605 241.14 0.000 0.3658
Customer Satisfaction 0.611 249.34 0.000 0.3736
Co-operative Identity 0.552 181.54 0.000 0.3028
Switching Cost 0.269 32.60 0.000 0.0723
As shown in Figure 7.16 service quality has a significant positive
influence on customer satisfaction (r=0.67, P<0.01). Hence the hypothesis H1
is supported. Hypotheses H1b, H2, H3 and H4 examine the influence of
service quality, customer satisfaction, co-operative identity and switching cost
on customer loyalty. Service quality (r = 0.60; P<0.01), customer satisfaction
(r = 0.61; P<0.01), co-operative identity (r=0.552; p<0.01), and switching cost
(r = 0.27; P<0.01) have a significant positive effect on customer loyalty.
Therefore the hypotheses H1b, H2, H3 and H4 are supported. Since R-
squared statistic for all the independent variables in simple regression analysis
is small, multiple regression analysis has been considered for examining the
influence of service quality, customer satisfaction, co-operative identity, and
switching cost on customer loyalty.

356
Table.7.25
Customer Loyalty Model: Evaluation and Validity Multiple Regression Analysis
Independent Variables Customer Loyalty -
Correlation coefficients P - Value R2
Service Quality 0.605 0.0000
Customer Satisfaction 0.611 0.0000
Co-operative Identity 0.552 0.0000
Switching Cost 0.269 0.4899
0.4705
As depicted in Table 7.25 service quality (r = 0.53; P<0.01), Customer
Satisfaction (r=0.31; P<0.01) and co-operative identity (r=0.23; P<0.01) have
a moderately strong positive influence on customer loyalty. Although the
regression coefficient of switching cost (r=0.04; P>0.01) is less than service
quality, customer satisfaction and co-operative identity, the removal of the
switching cost from the model does not improve the R-squared statistic.
Rather it decreases R-squared statistic by 10%. Therefore the switching cost
is retained in the model of customer loyalty in PHCs. Moreover, the study
finds that the multiple regression model of customer loyalty in the Figure 7.20
explains a significant percentage of variance in the customer loyalty (R2
=47.05%; P<0.01) than the conceptual model proposed in the Figure 7.1 (see
page 301). According to regression coefficients shown in Figure 7.19, service
quality has exhibited the strongest direct effect on customer loyalty.

357
Figure 7.21
Customer Loyalty Model in PHCs
Source: Survey data.
References:
1. Cronin, J.J.., Brady, M.K., and Hult. G.T.M., (2000), Assessing the
Effects of Quality, Value, and Customer Satisfaction on Consumer
Behavioural Intentions in Service Environments, Journal of Retailing,
76 (2), pp.193-218.
Customer Satisfaction
Switching Costs
Co-operative Identity
Customer Loyalty
(R2=47.05%)
0.31
0.23
0.04
0.53 0.67
Service Quality

358
2. Anderson, Eugene U. and Mittal. Vikas (2000) Strengthening the
Satisfaction Profit Chain, Journal of Services Research, 3 (2), 107-120.
3. Oliver, R.L. (1997) Satisfaction: Behavioural perspective on the
consumer, McGraw-Hill, New York.
4. Cronin, J.J. and Taylor, S.A., (1992), “Measuring Service Quality: A
Reexamination and Extension”, Journal of Marketing, Vol.56, July,
pp.55-68.
5. Parasuraman, A., Zeithaml, V.A., and Berry, L.L., (1994), “Alternative
Scales for Measuring Service Quality: A Comparative Assessment
Based on Psychometric and Diagnostic Criteria, Journal of Retailing,
Vol. 70, pp. 210-230.
6. Rust R.T and Oliver R. L. (1994) Service Quality: New Directions in
Theory and Practice, Sage Publications, Inc., Thousand Oakes, CA, 72-
94.
7. Taylor, S. A., and T. L. Baker (1994) An Assessment of the
Relationship Between Service Quality and Customer Satisfaction in the
Formation of Consumers' Purchase Intentions, Journal of Retailing
70,163-178.
8. Fornell, Michael D., Johnson, Eugene W. Anderson, Jaesung cha and
Barbara Eveeritt Bryant (1996), The American Customer Satisfaction
Index: Nature, Purpose, and Findings, Journal of Marketing, 60
(October), pp.7-18.
9. Zeithaml, V.A., L.L. Berry and A. Parasuraman (1996), “The
Behavioural Consequences of Service Quality”, Journal of Marketing,
Vol. 60, April, pp.31-46.
10. Hallowell, Roger. (1996). “The Relationship of Customer Satisfaction,
Customer Loyalty, and Profitability: An Empirical Study,” The
International Journal of Service Industry Management, 7 (4), pp. 27–
42.

359
11. Spreng, Richard A.,Scott B. MacKenzie, and Richard W. Olshavsky.
(1996). “A Reexamination of the Determinants of Consumer
Satisfaction,” Journal of Marketing, 60 (July), pp. 15–32.
12. Zeithaml, V.A., L.L. Berry and A. Parasuraman (1996), “The
Behavioural Consequences of Service Quality”, Journal of Marketing,
Vol. 60, April, pp.31-46.
13. Anderson, Eugene U. and Mittal. Vikas (2000) Strengthening the
Satisfaction Profit Chain, Journal of Services Research, 3 (2), pp. 107-
120.
14. Zeithaml, V.A., L.L. Berry and A. Parasuraman (1996), “The
Behavioural Consequences of Service Quality”, Journal of Marketing,
Vol. 60, April, pp.31-46.
15. Hoffman, K.Douglas and John E.G. Bateson (1997) Essentials of
Service Marketing, The Dyden Press, Fort Worth.
16. Bolton, Ruth N. (1998) A Dynamic Model of the Customer’s
Relationship with a Continuous Service Provider: The Role of
Satisfaction, Marketing Science, 17 (1), 45-65.
17. Cronin, J.J.., Brady, M.K., and Hult. G.T.M., (2000), Assessing the
Effects of Quality, Value, and Customer Satisfaction on Consumer
Behavioural Intentions in Service Environments, Journal of Retailing,
76 (2), pp.193-218.
18. Fornell Claes (1992), “A national customer satisfaction barometer: the
Swedish experience”, Journal of Marketing, 56, January, pp. 6–21.
19. Reichheld, F.F., (1996) The Loyalty Effect. Harvard Business School
Press, p.328 in Daniel Côté (2005), Loyalty and Co-operative Identity:
Introducing a New Co-operative Paradigm, Revue Internationale de
l’Économie Sociale, RECMA, # 295, 50-69.

360
20. Cronin, J.J. and Taylor, S.A., (1992), “Measuring Service Quality: A
Reexamination and Extension”, Journal of Marketing, Vol.56, July,
pp.55-68.
21. Fornell Claes (1992), “A national customer satisfaction barometer: the
Swedish experience”, Journal of Marketing, 56, January, pp. 6–21.
22. Reichheld, F. F., (1993), Loyalty based management, Harvard Business
Review, 71, pp.64-73.
23. Zeithaml, V.A., L.L. Berry and A. Parasuraman (1996), “The
Behavioural Consequences of Service Quality”, Journal of Marketing,
Vol. 60, April, pp.31-46.
24. Parasuraman, A., Zeithaml, V.A., and Berry, L.L., (1994), “Alternative
Scales for Measuring Service Quality: A Comparative Assessment
Based on Psychometric and Diagnostic Criteria, Journal of Retailing,
Vol. 70, pp. 210-230.
25. Butcher, K.; Sparks, B.; O’Callaghan, F. (2001). “Evaluative and
relational influences on service loyalty”, International Journal of
Service Industry Management, Vol. 12, No. 4, pp. 310-327.
26. Zeithaml, V.A., L.L. Berry and A. Parasuraman (1996), “The
Behavioural Consequences of Service Quality”, Journal of Marketing,
Vol. 60, April, pp.31-46.
27. Parasuraman, A., Zeithaml, V.A., and Berry, L.L., (1994), “Alternative
Scales for Measuring Service Quality: A Comparative Assessment
Based on Psychometric and Diagnostic Criteria, Journal of Retailing,
Vol. 70, pp. 210-230.
28. Zeithaml, V.A., L.L. Berry and A. Parasuraman (1996), “The
Behavioural Consequences of Service Quality”, Journal of Marketing,
Vol. 60, April, pp.31-46.

361
29. Butcher, K.; Sparks, B.; O’Callaghan, F. (2001). “Evaluative and
relational influences on service loyalty”, International Journal of
Service Industry Management, Vol. 12, No. 4, pp. 310-327.
30. International Co-operative Alliance, 1995 The International Co-
operative Alliance Statement on the Co-operative Identity (Vitoria:
CSCE-EKGK, ed. 1996) in Cid, M. (2005) Making the Social Economy
Work within the Global Economy: An Empirical Study of Worker Co-
operatives in Quebec, Emil-Romagna and Mondragon, Unpublished
PhD Thesis, Mondragon University, Spain, 1-14.
31. Morales, A. C. 1996. Ineficiencias del mercado y eficacia de las
cooperativas, Ciriec, Valencia, in Sebastian Bruque, Jose Moyano and
Alfonso Vargas and M. Jesus Hernandez, (2003) “Democratic
Management in a Competitive Economy: A Test of its Effectiveness”,
pp. 1-23, Academy%20meeting%202003.pdf.
32. Locke, E. and Schweiger, D.M. 1979. Participation in decision-making:
One more look, in Cummings, L.L and Staw, B.M.: Research in
organizational behavior. Greenwich: 265-339.
33. Schweiger, D.M. & Leana, C.R. (1986) Participation in decision-
making, in Locke, E.A.: Generalizing from laboratory to field studies:
147-166.
34. Guiltinan, J.P., (1989), “A Classification of Switching Costs with
Implications for Relationship Marketing”, AMA Winter Educator’s
Conference Proceedings: Marketing Theory and Practice, Chicago, pp.
216-220.
35. Zeithaml, V.A. (1981) “How Consumer Evaluation Process Differ
between Goods and Services” in Gremler, D.D. and S.W. Brown,
(1996), “Customer loyalty: Its Nature, Importance and Implications”,
ISQA, New York, 1996_Service_Loyalty-QUIS5.pdf. pp. 171-80.

362
36. Gronhaug. Kjell and Mary C. Gilly (1991) “A Transaction Cost
Approach to Consumer Dissatisfaction and Complaint Actions”,
Journal of Economic Psychology, 12(1), pp. 165-83.
37. Andreasen, A.R. (1985) “Consumer responses to dissatisfaction in loose
monopolies”, Journal of Consumer Research, Vol. 12, pp. 135-141.
38. Storbacka, K.; Strandvik, T.; Grönroos, C. (1994). “Managing
Customer Relationship for Profit: the Dynamics of Relationship
Quality”, International Journal of Service Industry Management, Vol.
5, No.5, pp. 21-38.
39. Sharma, N.; Patterson, P.G. (2000). “Switching Costs, Alternative
Attractiveness and Experience as Moderators of Relationship
Commitment in Professional, Consumer Services”, International
Journal of Service Industry Management, Vol. 11, No.5, pp. 470-490.
40. Teas, R.K., (1993) "Expectations, performance evaluation, and
consumers' perceptions of quality," Journal of Marketing, Vol.57, pp.
18-34.
41. Brady, M.K., Cronin, J.J., and Brand, R.R., (2002), “Performance-only
measurement of service quality: a replication and extension”, Journal of
Business Research, Vol. 55, No. 1, pp. 17-31.
42. Carman.J.H., (1990), “Consumer perceptions of service quality: an
assessment of the SERVQUAL dimensions, Journal of Retailing, 66
(1), pp. 35-55.
43. Oliver, R.L. (1997) Satisfaction: Behavioural perspective on the
consumer, McGraw-Hill, New York.
44. Nguyen, N., Le Blanc, G., (1998), “The mediating role of corporate
image on customers’ retention decisions: on investigation in financial
services”, International Journal of Bank Marketing, 16 (2), pp. 52-65.
45. Oliver, R.L., (1999), “Whence Customer Loyalty?” Journal of
Marketing, 63 (Special Issue), pp. 33-44.