customer franchise a hidden, yet crucial assetpeople.stern.nyu.edu/blev/intangibles/customer...
TRANSCRIPT
Customer Franchise — A Hidden, Yet Crucial Asset
BY
MASSIMILIANO BONACCHI, University of Naples “Parthenope”
KALIN KOLEV
, Yale School of Management
BARUCH LEV, New York University - Stern School of Business
First Draft: October 2009
Current Version: April 2013
Acknowledgements: We thank Jeffrey Callen (the editor), two anonymous reviewers, Richard
Carrizosa, Daniel Cohen, John Hand, Russell Lundholm, Steven Matsunaga, Steven Salterio,
Katherine Schipper, Jacob Thomas, Teri Lombardi Yohn, and participants at the 2010 NYU-Yale
Conference, 2011 EAA Annual Meeting, 2011 AAA Annual Meeting, the 2011 Baruch College-
SWUFE Conference, and the 2012 CAR Conference for valuable comments and suggestions.
Prior versions of the paper were circulated under the title “The Analysis and Valuation of
Subscription-Based Enterprises.”
Corresponding author: [email protected]; (203) 432-7851; 135 Prospect Street, New Haven,
CT, 06520.
Customer Franchise — A Hidden, Yet Crucial Asset
ABSTRACT:
We introduce a measure of customer franchise value for subscription–based companies
— a fast growing and vital sector of the economy. This measure is based on information
voluntarily disclosed by some, but not all, firms. Controlling for self-selection, we examine the
measure’s information content and find that customer value is significantly positively associated
with stock price and this association is incremental to both GAAP and a set of non-GAAP
variables typically considered in valuation tests. Furthermore, we show that the customer value
measure is positively associated with future earnings and analysts’ forecast errors. Importantly, we
find that the documented results are robust to controlling for the individual inputs used to derive
the measure, highlighting the need to consider the interaction between stand-alone value drivers in
assessing a firm’s performance. These findings indicate that the proposed measure of customer
value is an important valuation tool that quantifies and summarizes the main trends and factors
underlying the performance of subscription-based enterprises. This study informs researchers and
investors, as well as accounting policymakers, about a major value–generating asset currently
missing from corporate financial reports.
Keywords: Customer Equity; Intangibles; Forecasting Earning; Subscription-Based Business
Model
JEL Classifications: M41, M44, G12.
1
1. Introduction
The role of non-GAAP information in firm valuation has attracted strong interest from both
academics and practitioners. Extant research explores a breadth of non–GAAP indicators, such as
order backlog (Lev and Thiagarajan 1993), customer satisfaction (Ittner and Larcker 1998, Banker
and Mashruwala 2007), wireless phone metrics (Amir and Lev 1996, Livne, Simpson and Talmor,
2011, Simpson 2010), web usage data (Trueman, Wong and Zhang 2000), brand values (Barth,
Clement, Foster and Kasznik 1998), biotech companies’ product pipeline content (Guo, Lev and
Zhou 2004, Hand 2005), and firms’ patent attributes (Deng, Lev and Narin 1999). These studies
typically examine the association between such non-GAAP indicators and contemporaneous stock
prices and returns, or, in few cases, future performance. While the authors provide institutional
details justifying the link between the individual metrics and firm value, they generally stop short
of fleshing out the crucial mechanism by which the examined non-GAAP variables interact to
jointly affect a firm’s earnings and, ultimately, its stock price.
In contrast, we start our examination of the fast-growing group of subscription-based
enterprises (SBEs) — companies that offer a for-fee-per-period access to products or services —
by identifying the major elements of their business model: new customer acquisition, retention of
existing customers, maximizing revenues, and minimizing operating costs.1 We then use these
business process fundamentals to construct a comprehensive measure which values the firm’s
customer franchise — a major, yet undisclosed asset of these firms. For the sample companies,
we find that, on average, our estimate of customer value is 2.5 times book value of equity and 90
percent of the recognized assets.
1 As we discuss later, the approach we propose in this study extends to most industries. We focus
on SBEs as their business model allows for an easy identification and relatively accurate
measurement of the necessary model inputs and, as SBEs are quickly expanding their role in the
economy, they are likely to attract attention from both investors and regulators.

2
The omission of customer value from the balance sheet raises various accounting
reliability and asset recognition issues which are not the focus of this study. Rather, we are
interested in the information content of the customer equity metric and whether statement users
utilize it efficiently. To this end, we raise two questions within the framework of SBEs: Is
customer value incrementally informative about firm value, controlling for other financial and
non-financial data; and, is customer value useful in predicting future profitability. Importantly, we
also examine whether our aggregate measure provides information incremental to the individual
components of the customer equity model.
Our results provide affirmative answers to each of the questions above. Controlling for
self-selection, we find that our measure of customer value is positively associated with share price,
and the association is incremental to both GAAP and non-GAAP variables commonly used in
equity valuation. Results also indicate that customer equity is an important predictor of future
profitability. Notably, we demonstrate that the relation is incremental to analysts’ earnings
forecasts and, in fact, the metric predicts earnings forecast errors, providing evidence that the link
is not mechanical. Consistent with the conjecture that accounting for the interaction among the
individual components of customer value provides important information, we find that the
documented results remain after augmenting the regression models with the individual variables
used to calculate the value of customer equity.
We believe that our findings are relevant to academics, investors, practitioners, and
regulators. Our evidence is consistent with the conjecture that the value of customer equity
provides important insights into a firm’s economic position and performance, incremental to
GAAP data, and auditors can use the measure to assess customer-related intangible assets and
goodwill impairment. Standard-setters should also find our analysis helpful in identifying and
recommending new disclosure items (Wiesel, Skiera and Villanueva 2008). This issue is
particularly salient as, in practice, an increasing number of companies are voluntarily disclosing
3
certain customer-base-related data in financial statements, press releases, and conference calls.
However, there is no uniformity or consistency in these disclosures, making an efficient analysis
and valuation of SBEs challenging and, in the case of non-disclosers, nearly impossible. Our
study, therefore, informs both regulators and SBEs on disclosure useful to statement users and
provides an algorithm for summarizing these data into a measure of customer value.
The rest of the paper is organized as follows. Section 2 discusses the characteristics of
subscription-based enterprises; Section 3 outlines the algorithm for calculating customer equity
value; Section 4 describes the sample; Section 5 discusses the regression models and summarizes
the empirical findings; and, Section 6 provides concluding remarks.
2. Characteristics of Subscription-Based Enterprises
We apply the “SBE” moniker to companies that structure their operations so that a
customer pays a fee for the right to access products or services for a period of time. While
pioneered by magazine and newspaper publishers, this business model is quickly spreading across
industries including, among others, internet service providers, telecom, and software. An attractive
feature of SBEs is that the acquisition and departure of customers is clearly observable, allowing
companies to track closely the composition and profitability of their customer base.2
Companies employing subscription-based models benefit from acquiring customers at the
lowest possible cost, increasing the monthly average margin per user, and retaining existing
profitable customers. Importantly, these drivers are not independent: As an example, while
increasing price or decreasing quality, hence cost of service, increase margin, both lead to higher
customer turnover. Following this rationale, the economics of subscription-based models are
driven by four key factors: (1) average revenue per user (ARPU), (2) cost per customer
acquisition, (3) cost of service, and (4) churn. Consistent with this notion, the majority of
2 The subsequent analysis could be extended to non-contractual settings, e.g. restaurants, retailers,
or airlines. This, however, requires modeling the probability of repeat purchases (Borle et al. 2008;
Fader et al. 2010; Wübben and Wangenheim 2008), which unnecessarily complicates the analysis.

4
companies we identify as SBEs provide data for at least one of these customer metrics.
Specifically, the most widely, albeit not uniformly, disclosed customer performance metrics in our
sample are:
Number of subscribers: Number of active customers at the end of the period.
Gross customer additions: Number of new customers that joined the company during
the fiscal period.
Net customer additions: Gross number of new customers acquired during the period,
less the number of deactivated customers.
Churn rate: Rate of customer attrition, measured as cancellations per user per period.
Churn rates are generally presented on a monthly basis.
ARPU: Average monthly service revenue per subscriber.
Cost of service: Average monthly cost of providing services and support to existing
customers per subscriber.
Cost per gross addition (CPGA): Average cost incurred to acquire new customers.
This measure is used to evaluate how effective marketing programs are in bringing in
new subscribers. CPGA is also commonly referred to as subscriber acquisition costs
(SAC).
Notably, a large number of the companies we identify as subscription-based businesses
disclose only a subset of these customer-related metrics. While a discussion of the full set of
drivers of the heterogeneous disclosure practices among SBEs is beyond the scope of this paper,
potential reasons for the lack of uniformity include competitive pressures and the voluntary nature
of the disclosure. As a practical matter, however, both the choice of whether to disclose and the
level of detail provided determine the structure of our sample, as we require a minimum level of
disclosure to estimate the value of customer equity (we describe the model in the next section). In

5
Appendix 1 we provide an example of the disclosure we use in applying the customer-equity
valuation model.
3. The valuation of Customer Equity
The fundamentals for valuing customer equity (CE) have been developed in the customer lifetime
value (CLV) literature, which we extend to the accounting field.3 Extant research proposes several
methods for estimating CE, which, while analytically elegant, are generally complex and call for
numerous inputs. This, in turn, has constrained the empirical examination of CE to very small
samples, often individual companies, in very specific settings (e.g., Fader, Hardie and Lee 2005;
Gupta, Lehmann and Stuard 2004; Kumar and Shah 2009; Lewis 2005; Reinartz and Kumar 2000;
Rust, Lemon and Zeithaml 2004; Silveira, De Oliveira, and Luce 2012; Venkatesan and Kumar
2004; Schulze, Skiera and Wiesel 2012).
Building on prior work, we refer to two concepts that can be used when evaluating the
expected profitability of a firm’s customer base (Villanueva and Hanssens 2007):
Current Customer Equity (CEcur): The sum of the future profit margins generated
from the customers that have already been acquired by the end of the period
(Villanueva and Hanssens 2007, p. 5).
Total Customer Equity (CEtot): The sum of the future profit margins generated from
current (CEcur) and future (CEfut) customers of the firm (Hogan, Leheman, Merino,
Srivastava, Thomas and Verhoef 2002; Kumar and Shah 2009).
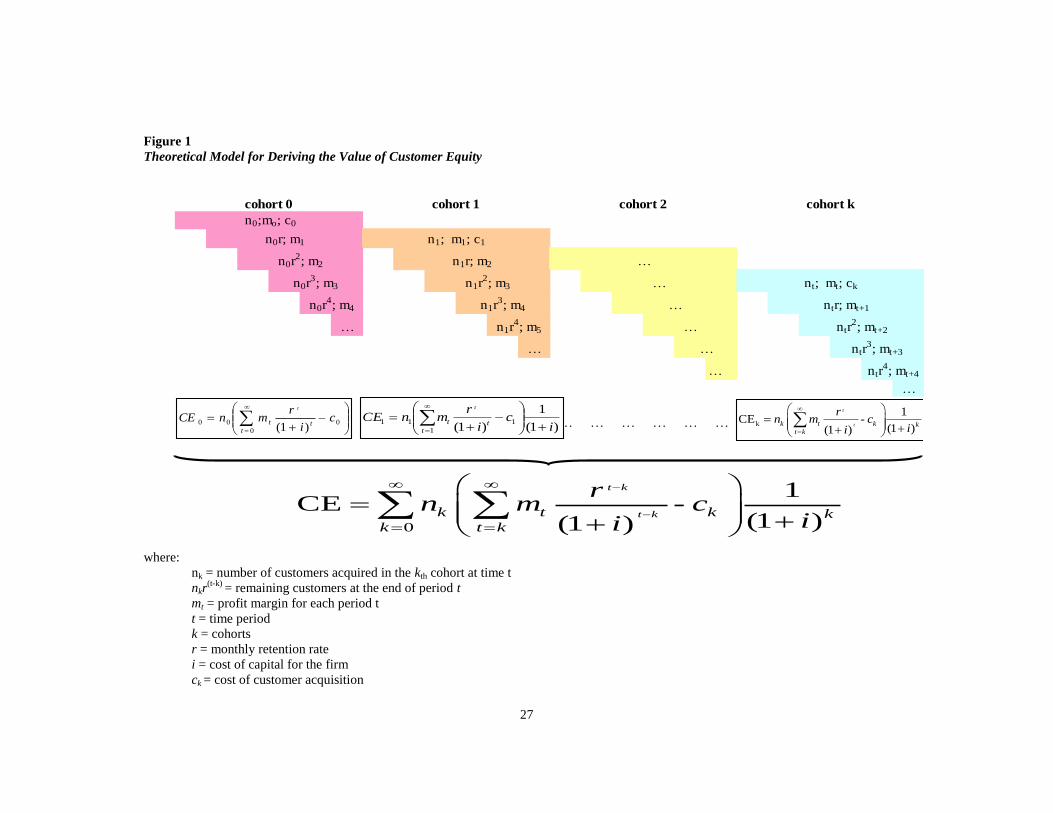
In the marketing literature it is common to estimate the lifetime value of actual and future
customers by tracking the evolution of each “customer cohort,” i.e. group of customers acquired
during a particular period (e.g., Gupta et al. 2004). The general algorithm is as follows: The firm
3 CLV is the disaggregated measure and CE is the aggregated measure of customer profitability
(Gleaves, Burton, Kitshoff, Bates and Whittington 2008; Pfeifer, Haskins and Conroy 2005). In
essence, CLV is the present value of expected future profit margins for each customer and CE is
the sum of the lifetime values of all customers.

6
initially acquires n0 customers at time t0 at an acquisition cost of c0 per customer; then, over time,
customers defect at a fixed defection rate, (1–r), such that the firm is left with n0r customers at the
end of period 1, n0r2 customers at the end of period 2, and so on (Figure 1). The value of the firm’s
customer base is then estimated as the sum of the discounted customer lifetime values of all
cohorts (Berger and Nasr 1998, Gupta and Lehmann 2005, Gupta et al. 2004). The customer
equity value, therefore, is expressed as:
[1]
where t is the unit of time in the analysis; k is the cohort; n is the number of customers; m is the
profit margin; r is the retention rate (1 minus churn); c is the acquisition cost; and i is the weighted
average cost of capital.
=== Insert Figure 1 ===
In our analyses we focus on the value of the current customer base, which derives from a
simplified version of equation [1] (Gupta et al. 2004).4 Specifically, under the assumptions that the
profit margin and customer churn are constant and the acquisition of future customers is a zero net
present value project, customer equity could be expressed as:5
)1()1(1 ri
rmn
i
rmnCE
tt
t
[2]
4 For brevity, we do not discuss the CEtot model, however, the model and its derivation are
available upon request. For the remainder of the paper, we use CE, CEcur, customer equity, and
customer franchise value interchangeably. 5 The zero NPV assumption could be considered problematic for young, growing, companies. As a
robustness test we partition the sample by firm age and find that, consistent with theory, the
association between customer equity and market value is higher for younger firms.
kk
kt
t
k
ki
ci
rmn
kt
kt
)1(
1
)1(CE
0
tot

7
where n is the number of active customers at the end of the period (historic customer base); m is
the profit margin per customer (revenue minus service cost) for period t; r is the retention rate for
period t; i is the cost of capital; and t is the time period. 6
To estimate the value of a firm’s customer base, we require several inputs: the number of
customers, margin per customer, customer retention rate, and cost of capital for the firm. Number
of customers refers to the active customer base at the end of the fiscal quarter. Margin per
customer is measured as the difference between average revenue per customer, ARPU, and cost of
service. Similar to the number of customers, most companies that disclose customer-related
metrics provide sufficient data to infer ARPU. That is, when a company does not disclose ARPU,
we derive it by dividing subscriber revenues by the weighted average number of customers for the
period. Some companies, however, do not disclose cost of service per customer. In these cases we
estimate the metric by applying to ARPU the ratio of “cost of service” to “service revenue” from
the income statement. When companies provide the disclosure by segment (e.g., U.S. and non-
US), we use the weighted average of the reported customer metrics.
Turning to the customer retention rate, its estimation plays a critical role in the model, as
it reflects the likelihood that a customer will leave the company in a future period. Analyses of
parametric and non-parametric models to calculate customer lifetime (i.e., how long a customer is
expected to stay with the firm and create value) are beyond the scope of this study, so we assume
the historical churn rate will persist in the future.7 In practical terms, we derive the probability of a
current customer to remain active during the next period as (1 minus churn).
6 The constant profit and retention rate assumptions, while not too strong (Gupta and Lehman
2005), allow for the generation of a parsimonious model that is easily implementable in practice.
In addition, we do not introduce taxes in the model: While the extension is analytically straight-
forward, the practical implementation presents challenges without contributing to the insights. 7 Examples of projecting retention rate are offered in Fader and Hardie (2007) and Rosset et al.
(2003).

8
The last model input is cost of capital. In theory, cost of capital is a time- and firm-
specific measure. In practice, however, there is little agreement on how to measure cost of capital
(e.g., Botosan, Plumlee and Wen 2011). For this study, we use a constant annual discount rate
(e.g., Frankel and Lee 1998; Gupta et al. 2004) of 12 percent.
8
As described in the preceding paragraphs, in the empirical analysis we focus on CEcur
instead of CEtot. This design choice is driven primarily by the fact that forecasting future
customer acquisitions and their outcomes requires a high degree of subjectivity. Among the
practical challenges, three stand out: (1) Customer growth: A diffusion model is a natural
candidate for estimation of the growth of the customer base (Gupta et al. 2004; Kim, Mahajan and
Srivastava 1995). Such an approach requires the solution of nonlinear differential equations, and
the resulting model is too complex to operationalize for a large sample (e.g., Pfeifer 2011). (2)
Acquisition cost: Within our sample more than one-third of the companies do not report these
data. While, in some cases, total marketing costs could be used to derive a crude proxy for the
metric, the non-random loss of observations is likely to bias the reported results. (3) Discount rate:
Theoretically, the discount rate for future customers’ cash flow should be higher than the discount
rate used for the current customers’ cash flows. The discount rate is supposed to capture the risk
inherent in the customer type: A current customer is more likely to stay with the company through
good times and bad. Furthermore, whether or not a company can acquire new customers is
strongly impacted by macro and micro economic factors.
In summary, by focusing on the current customers of a company, we obtain a
parsimonious and easy-to-implement model of customer equity. Despite the fact that our estimate
likely understates the customer franchise intangible asset, we demonstrate that it is a useful
8 Deriving a firm-quarter measure of customer capital is further complicated by the need of
forward-looking data, which could induce a mechanical association between our estimate of CE
and future profitability. As a robustness test, we repeat the analysis using a time-varying discount
rate, calculated as 10% plus one-year LIBOR. Using this rate instead of the static 12% does not
affect the results qualitatively.
9
practical valuation tool which provides a summary performance metric which managers and
investors can track over time.9
4. Sample selection and descriptive statistics
Sample Selection
We conduct the empirical analysis using a sample of U.S. companies that employ a subscription-
based business model and disclose the necessary inputs for estimating the value of CE (we provide
a list of the sample companies in Appendix 2). To identify the candidate companies, we use the
advanced search function on EDGAR Full-Text, searching for the keywords “churn” and “arpu”
(“churn” and “average revenue per user”). Expecting that companies may discuss the customer-
related metrics outside the 10-Q filings, we also search conference call transcripts obtained from
Thomson StreetEvents.10
We supplement this examination with a review of the analysts’ reports
from Investext® for the company-quarters with less than complete data on the customer metrics
necessary to calculate CE. Interestingly, we find that the conference calls and analysts’ reports do
not reflect customer-related data beyond those available in the companies’ SEC filings. In fact, we
do not find company-quarters with customer-related data in the analysts’ reports or conference
calls that are not already disclosed in the SEC filings.
We obtain the necessary data from company filings and, when possible, machine-
readable sources. Specifically, for the companies identified to disclose customer-related metrics,
we hand-collect the inputs for the customer-equity model from the 10-Qs filed with the SEC. We
obtain the rest of the financial data for the empirical tests from the Compustat Xpressfeed
Quarterly Tapes. We also obtain stock prices from the CRSP Daily Tapes and analysts’ consensus
9 Recent empirical work documents that, in practice, CEcur is sufficiently close approximation of
CEtot (Silveira et al. 2012). 10
In this study we refer to forms 10-Q and 10-K jointly as “10-Q.”

10
earnings and long term growth forecasts from I/B/E/S. We provide variable definitions in
Appendix 3.
Our search and additional data requirements – stock price one business day after the 10-Q
filing date, net income, book value of common equity, and inputs to the disclosure selection model
(discussed in the next section) – result in a sample of 579 firm-quarter observations for 31
companies. As some of the analyses require additional data, the number of observations varies
across tests. Our sample period spans 2002 through 2010. We start the sample in 2002 for two
reasons: Prior to 2002 very few companies disclose the data necessary to calculate CE; and, to
avoid potential bias stemming from the Internet bubble.
Descriptive Statistics
Table 1 presents descriptive statistics for the sample. The average company is relatively large
($6.1 billion in total assets and $0.97 billion in net sales). However, the sample is skewed ($1.4
and $0.25 billion in assets and sales for the median company, respectively). While the average
company-quarter is profitable, 42 percent of the observations reflect loss before extraordinary
items during the period. More so, 20 percent of the observations have negative book value of
equity, characteristics typical of emerging, early-stage, firms.
=== Insert Table 1 ===
The average (median) book to market value of equity ratio for the sample is 0.16 (0.27),
notably below 1, suggesting that the balance sheet omits a substantial portion of the firms’ value
drivers. Interestingly, when book value of equity is converted to comprehensive value, defined as
the sum of the estimated value of customer equity, CE, and the reported book value of equity (Gu
and Lev 2011), the ratio increases to 2.03 (1.31) for the average (median) firm-quarter. Turning to
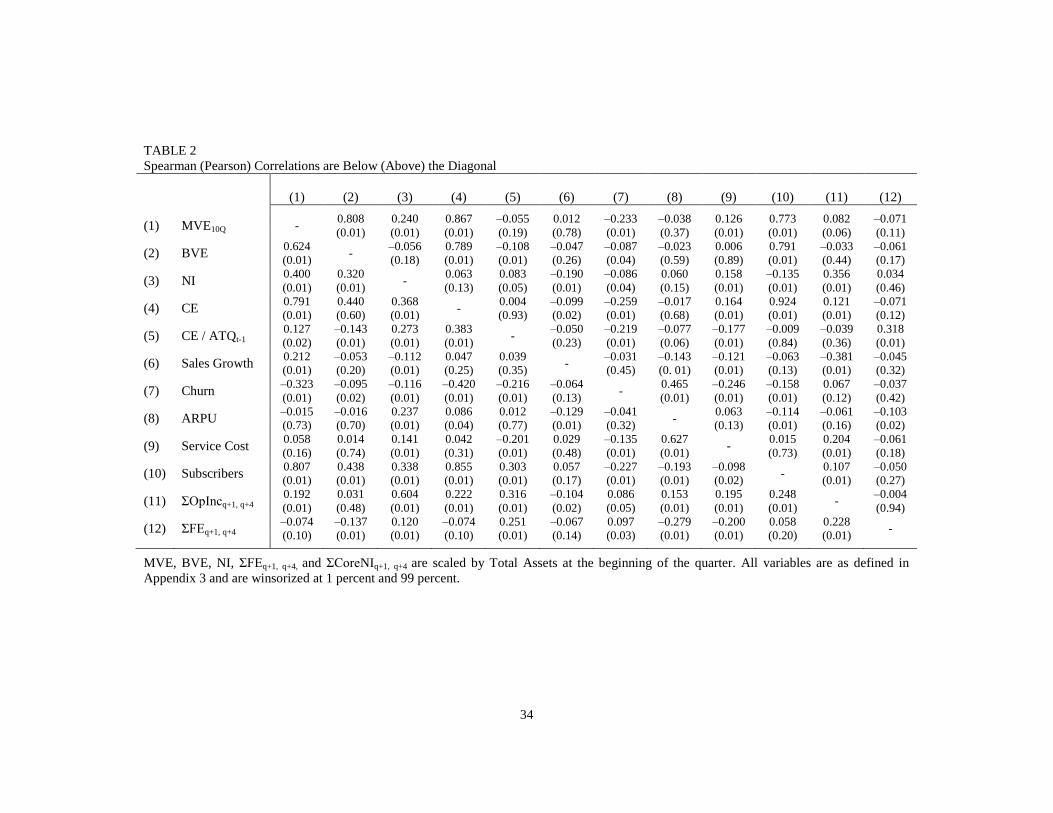
the Spearman correlations (Table 2), it is notable that CE is significantly positively correlated with
current market value of equity. More so, CE is significantly correlated with both operating income
and the analysts’ earnings forecast error for the subsequent four quarters. These univariate results
11
are consistent with the notion that our measure of customer equity is informative and the equity
market incorporates in stock price (at least some of) the information embedded in CE.
=== Insert Table 2 ===
While our estimate of CE is significantly correlated with measures of current value and
future operating performance, the results for the individual model inputs are less straightforward.
Focusing again on the Spearman correlations, out of the four underlying variables, only Churn and
Subscribers are associated with current market value of equity. Turning to future profitability,
while the correlation coefficients on all four metrics are significant, only ARPU and Subscribers
exhibit the expected sign. These observations reinforce the importance of focusing on the
customer franchise value, the intangible derived from the business model, as a whole rather than
the individual performance metrics.
5. Empirical analysis
In the first part of the study we outline a parsimonious model aggregating a set of customer base
metrics into a measure of customer franchise value, CE. To validate the model and shed light on
the place of customer equity in the investors’ information set, we next examine the association of
the derived metric with stock price and future profitability. We start with value-relevance tests, as
they are fairly standard in the accounting literature and mimic the empirical analysis in the
marketing studies we use as a base for the CE valuation model. We then demonstrate that our
measure of customer equity (CE) plays a role in predicting future profitability even after
controlling for current and past profitability and the analysts’ consensus earnings forecast.
Importantly, we verify that the conjectured relationships hold after controlling for the individual
inputs to the customer equity model, confirming the informativeness of CE.
Self-Selection
In this study we rely on voluntary disclosure of customer-related data to implement the proposed
12
customer equity measure and examine its characteristics. The voluntary nature of the disclosure,
however, raises concerns about self-selection bias. To address this issue, we conduct the analysis
using a two-stage selection model (Heckman 1979).11
Specifically, we identify the companies
from the same industry group (six-digit GICS code) as the sample firms, which, over the sample
period, do not disclose any of the necessary CE inputs. Next, we model the propensity to disclose
customer-related metrics, considering measures of incentives and demand for disclosure, and
calculate the Inverse Mills’ ratio (IMR) which we include as additional control in the second-stage
models. The selection model takes the form:
( ) ( )
( ) ∑
[3]
where log(MVE10Q) is the log-transformed market value of equity one day after the 10-Q filing
date, BM is the book-to-market value of equity, SalesGrowth the seasonally adjusted percentage
change in sales revenue, Loss (negBVE) is an indicator variable set to one if net income (book
value of equity) is negative, log(Age) is one plus the number of years for which the company has
data in Compustat, transformed to natural logs, and Follow is an indicator variable set to one if
there is at least one earnings forecast for the firm during the quarter, as reported by I/B/E/S. The
Disclosure and non-Disclosure samples are winsorized individually at 1 percent and 99 percent
and the standard errors are clustered by company and fiscal quarter-year.
Our choice of explanatory variables reflects previous findings that information
asymmetry, proprietary costs, and firm characteristics are important determinants of voluntary
disclosure (e.g., Healy and Palepu 2001). Specifically, we include firm size and the indicator for
analyst following, as extant research documents that large companies face lower cost and higher
11
While propensity score matching has gained popularity as a tool for addressing self-selection
bias, we cannot apply it in this setting as we require estimates of customer equity in the regression
models, which is not available for the control group.

13
demand for disclosure, and the informativeness of disclosure policies increases in analyst
following (Lang and Lundholm 1993, 1996).12
We also consider measures of financial-statement
informativeness (BM, Loss, and negBVE), as companies with less informative statements are
more likely to provide voluntary disclosure (e.g., Tasker 1998). Last, we include sales growth,
firm age, and industry fixed effects to capture remaining life-cycle and industry-level drivers of
disclosure.
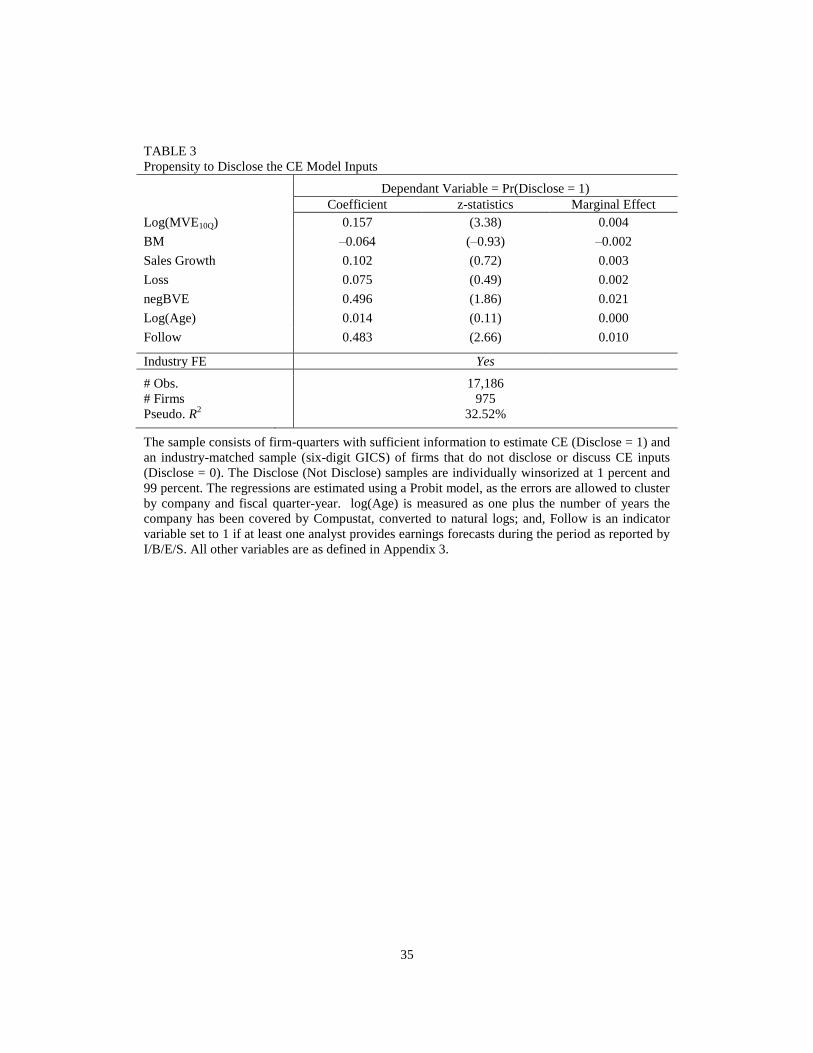
We present the regression results in Table 3. Consistent with prior research, we find that
large companies and companies covered by sell-side analysts—i.e., firms facing higher demand
for information—are more likely to disclose the necessary inputs to estimate the value of customer
equity. While statistically weaker, we also note that firms with negative book value of equity are
more likely to disclose the metrics of interest.
=== Insert Table 3 ===
Customer Equity and Stock Price
We begin our analysis by examining the market assessment of the value-relevance of customer
equity. Specifically, we model market value of equity as a function of net income and book value
of equity (e.g., Ohlson 1995, 2001) and include our estimate of customer franchise value as an
additional parameter. Accounting for the fact that we use voluntarily disclosed data to measure
CE, we also include the Inverse Mills’ ratio from equation [3] as a self-selection control (Heckman
1979). The model takes the form:
[4]
where BVE is book value of equity; NI is net income before extraordinary items; IMR is the
Inverse Mill’s ratio from the first-stage model (equation 3); and, CE is our estimate of the value of
12
We include in the model Follow, an indicator variable reflecting whether or not the firm is
followed by at least one analyst, instead of the log-transformed number of analysts following the
company, since the latter is highly positively correlated with firm size. Results are not sensitive to
this design choice.

14
customer equity.13
The dependant variable, MVE10q, is the firm’s market value of equity, measured
one business day after the 10-Q filing date, accounting for the fact that the sample firms typically
disclose the CE model inputs in the financial statements filed with the SEC. Following Barth et al.
(1998), we estimate the model as an unscaled specification.14
We allow the errors to cluster by
company and fiscal quarter-year (Petersen 2009) and, to mitigate the influence of potential
remaining outliers, we winsorize the regression variables at 1 percent and 99 percent. If our
measure of customer equity captures information deemed useful by equity investors, we expect
to be significantly positive.
The vector of controls includes a set of variables identified by prior research on the
valuation role of net income and book value of equity. One stream of the literature documents that
the association between MVE, BVE, and NI varies predictably with the financial health of the firm
(Barth et al. 1998, Collins et al. 1999). In particular, these studies highlight that the information
content of profit and loss observations is economically different. For this reason, we augment
equation (4), allowing the coefficients on BVE and NI to vary between positive and negative
values of these variables. Specifically, we include negBVE, an indicator variable set to one if the
firm’s Book Value of Equity at the end of the quarter is negative, and Loss, an indicator variable
set to one if Net Income for the quarter is negative, and interact them with BVE and NI,
respectively. Since Barth et al. (1998) further demonstrate that the valuation coefficients on BVE
and NI are driven by industry characteristics, we also include industry fixed effects as controls.
Another stream of research underscores the importance of firm growth in equity valuation (e.g.,
Liu and Ohlson 2000). Thus, we include as additional control Sales Growth, measured as the
seasonally-adjusted percentage change in sales. As an alternative measure of growth we consider
13
We do not include time subscripts in the model as we measure all variables at time t. Since
extant value-relevance studies differ in measuring BVE (t-1 vs. t), we examine whether our results
are sensitive to this choice. We find that the documented relations are robust to using BVEt-1 in
place of BVEt and, in fact, the results are frequently stronger (not tabulated). 14
As additional analysis, we verify that the inferences are not sensitive to this design choice.

15
LTG, the analysts’ median long-term growth forecast as reported by I/B/E/S. While this variable is
not available for all firms, it is an attractive control in our setting as it provides a forward-looking
measure of growth and imposes a high hurdle for our tests since, by construction, it incorporates
the vector of financial and non-financial information considered by sell-side equity analysts.
Finally, in an effort to address the frequently-expressed concern that price-level models such as
equation [4] are particularly vulnerable to correlated omitted variables, we re-estimate the model
substituting the industry fixed effects for firm fixed effects.15
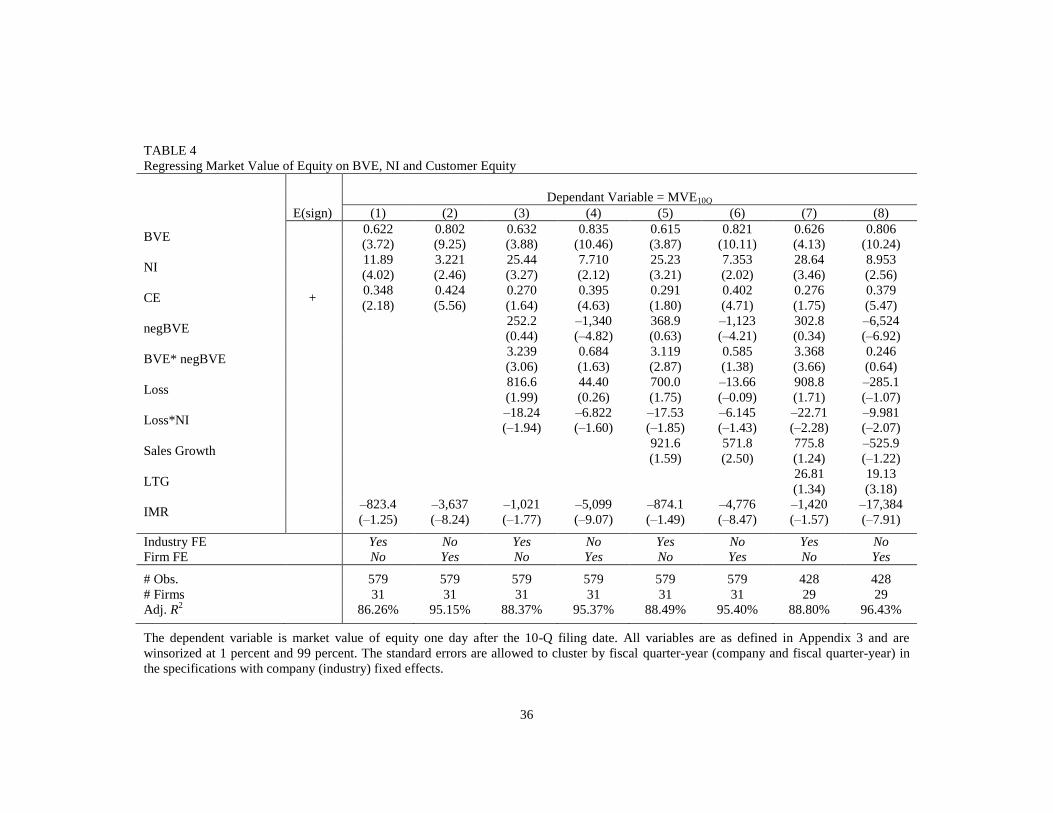
We report the regression results in Table 4. Consistent with prior research, we document
a positive and significant association between MVE10q and both BVE and NI. This positive
association remains after including the vector of controls and substituting the industry fixed effects
for firm fixed effects. Turning to the variable of interest, the estimated coefficients on CE are
consistently positive.16
The t-statistics on CE are lower than these on BVE, however, they imply
that the positive association between MVE and CE is statistically significant under the one-tailed
test implied by the directional prediction on the relationship between the two variables.
Importantly, when firm fixed effects are added to the model, the adjusted R2, and both the
magnitude and statistical significance of the estimated coefficients on CE increase materially. This
result suggests that while the base specification likely suffers from correlated omitted variables,
the results are not driven by this source of endogeneity. Interestingly, the CE coefficient is
significantly lower than 1 in all specifications, consistent with the notion that the market impounds
in stock price some, but not all, of the information from our measure of customer equity.17
15
In the specifications with firm fixed effect, we cluster the standard errors by fiscal quarter-year
only (Petersen 2009). 16
When CE is added to the model, the adjusted R2 increases in each specification (untabulated).
17 This test cannot rule out that equity investors use a more accurate estimate of customer equity.
As we discuss in Section 4, however, a search of analysts’ reports and conference call transcripts
fails to identify discussions of aggregating the individual metrics into a single measure reflecting
the value of customer equity. More so, as additional analysis (not reported), we find that CE is
significantly positively associated with stock returns one, two, and three years after the

16
=== Insert Table 4 ===
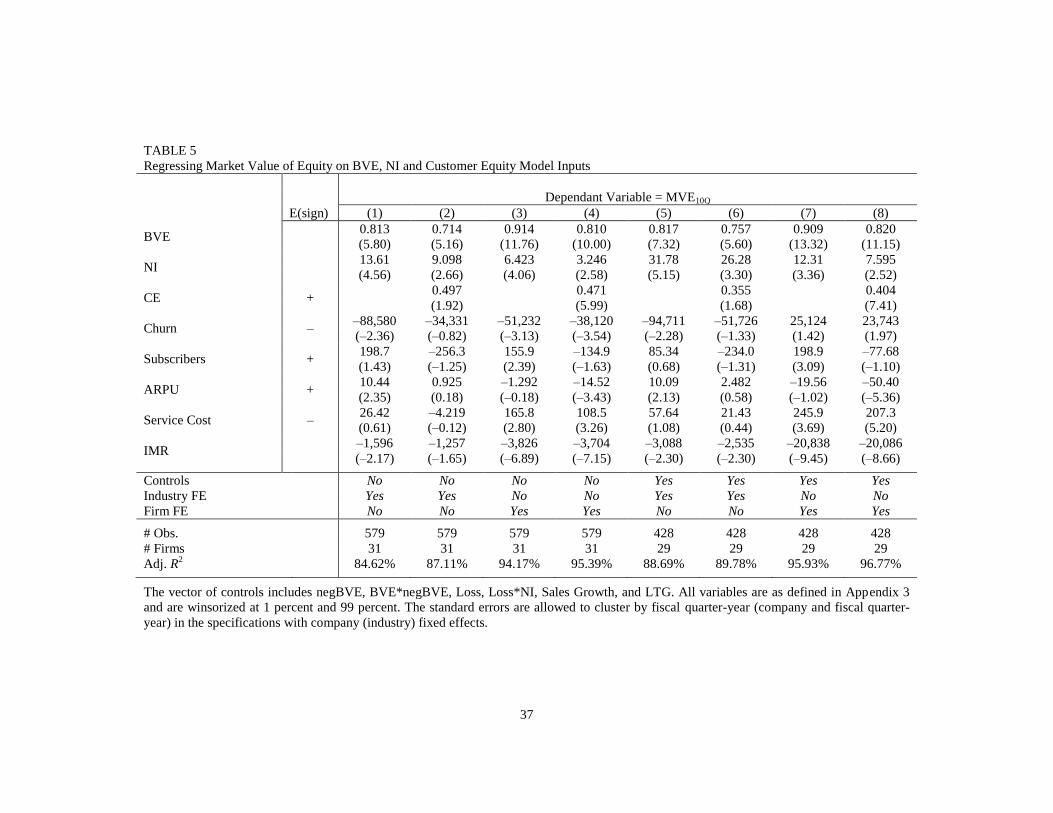
As discussed in the Introduction, a feature of extant research on non-financial
information is the identification and examination of the information content of individual
performance proxies. To verify that the aggregate measure of the value of customer equity, rather
than one (or more) of the model inputs drives the results, we modify equation [4] by including the
CE model inputs−Churn, ARPU, Subscribers, and Service Cost−as regressors. If the individual
inputs as disclosed by the companies, rather than their aggregation into a measure of customer
franchise value, are deemed informative, then we would expect significant positive (negative)
coefficients on ARPU and Subscribers (Churn and Service Cost) and an insignificant coefficient
on CE. Turning to Table 5, we find that while some of the model inputs are associated with MVE
with the expected sign, these associations vary across specifications. The coefficient on CE,
however, remains positive and significant in the presence of the model inputs.18
=== Insert Table 5 ===
These results are consistent with the conjecture that our measure of customer equity
captures information deemed useful by equity investors. Importantly, these findings also
underscore the value of considering the characteristics of the customer base of an SBE instead of
focusing on individual variables: While, unconditionally, a growth in a company’s customer base
is good news, this holds true only if the acquired customers are profitable. More generally, these
results provide evidence on the importance of aggregating individual performance metrics into a
single measure of value, which accounts for the dynamic relation among the individual drivers.
Customer Equity and Future Earnings
The association between market value of equity and customer equity provides evidence that
measurement date. Together with the results from the future profitability analysis, this finding
provides support for our interpretation of the results. 18
As a robustness test, we repeat the analysis including the model inputs one at a time
(untabulated). The results remain qualitatively similar.
17
investors use some of the information embedded in our CE metric. It does not, however, speak to
the mechanism through which the metric provides information about firm value: In fact, value-
relevance tests have been criticized as a mere association exercise (e.g., Holthausen and Watts
2001).
To alleviate such concerns, we next examine whether our measure of customer equity is
associated with future profitability, a key input to investors’ valuation models. This link reflects
our hypothesis that customer equity aggregates information on the expected profitability of a
firm’s customer base.
To test the conjecture that CE conveys information about future profitability beyond
other financial and non-financial data, we regress cumulative operating income for the subsequent
one, two, and three years on CE, controlling for current profitability. To allay concerns that the
relationship between CE and future profitability is mechanical, we also include in the regression
the analysts’ consensus earnings forecast, as extant research suggests that equity analysts’
incorporate in their estimates a rich set of forward-looking data, extending beyond current and past
period GAAP earnings.19
Including the consensus analysts’ forecast as a control variable also
sheds light on whether analysts use all the information reflected in our measure of customer
equity. The model takes the form:
∑ ∑
∑
∑
[5]
where Profit is operating income after depreciation; CE is our estimate of customer equity; AF is the
earliest median consensus analysts’ earnings forecast for quarter Q+H after the earnings
announcement date for the current quarter; and, IMR is the Inverse Mills’ ratio estimated using
equation [3] (Heckman 1979). Since CE derives from the company’s business model and is
19
Indeed, Livne et al. (2011) and Simpson (2010) provide evidence that for wireless companies,
certain customer-related metrics are informative about future profitability.

18
measured pretax, in this analysis we focus on operating income, which does not include the effects of
peripheral, non-recurring transactions, or taxes. We cumulate the dependent variable over the
subsequent one, two, and three years: The sample average monthly Churn of 0.028 implies that the
current customer base will turn over in three years (1 / 0.028 ≈ 36 months), however, inferences based
only on the three-year window could be influenced by survivorship bias. As partial control for size,
we deflate all continuous variables by the value of total assets at the beginning of the quarter. This re-
scaling also allows for an intuitive interpretation of the results: Since CE divided by total assets
captures the relative magnitude of the customer franchise value relative to the asset base recognized
under US GAAP, the estimated coefficient on the variable of interest reflects the portion of future
return on assets attributable to CE not captured by the GAAP and non-GAAP predictors of
profitability.20
Finally, we allow the standard errors to cluster by company and fiscal quarter-year.
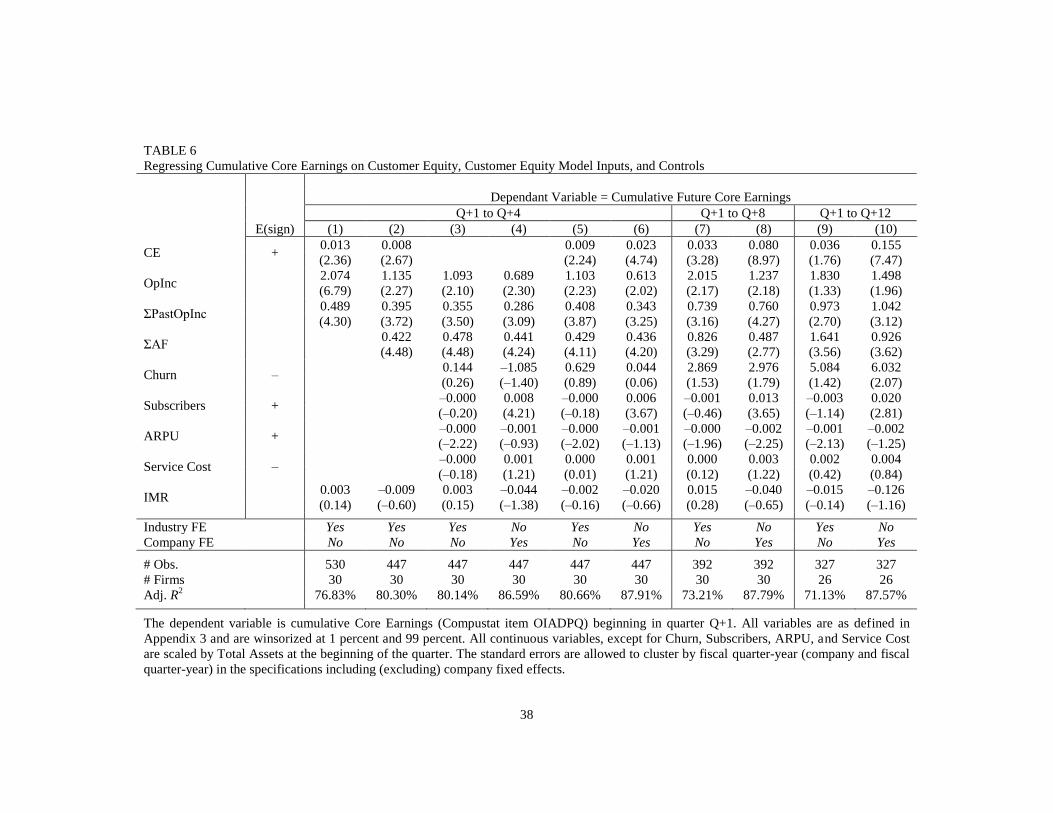
Regression results are presented in Table 6. Consistent with prior research, we document an
economically and statistically significant positive association between current and future profitability.
When the analysts’ consensus forecast is added as an explanatory variable, its coefficient is
significantly positive, consistent with the idea that analyst forecasts reflect information incremental to
current and past profitability.
=== Insert Table 6 ===
Turning to CE, the estimated coefficients are positive and significant across specifications,
and increase with the accumulation period. The effect persists in the presence of the individual inputs
to the customer equity model (Churn, ARPU, Subscribers, and Service Cost) and is robust to
substituting the industry fixed effects for firm fixed effects. Turning to year T+1, while numerically
small, the estimated coefficient on CE of 0.01 (0.02 in the firm fixed effects specification) is
20
As a robustness check, we deflate the model variables by market value of equity one day after
the 10-Q filing date (i.e., we convert the model from future return on assets to forward earnings to
price specification). We find that the results are qualitatively similar and, in fact, the estimated
coefficients on CE are larger (untabulated).

19
comparable in magnitude to the average analysts’ forecast error in the sample (0.01). These results
support our conjecture that customer equity is informative about future profitability. Moreover, the
significant positive coefficient on CE after controlling for the consensus earnings forecast also implies
that although sell-side equity analysts aggregate a wealth of data in their earnings projections, they do
not account fully for the implications of customer equity.21
To shed more light on the link between analysts’ forecasts and CE, we next regress future
earnings forecast errors on our estimate of customer franchise value, controlling for factors shown to
impact forecast accuracy (e.g., Simpson 2010). Specifically, we cumulate quarterly forecast errors,
defined as the difference between actual earnings as reported by I/B/E/S and the earliest median
consensus forecast after the 10-Q filing date for the prior quarter, over one, two, and three years.
Turning to Table 7, the coefficient on CE is positive and significant across the three measurement
windows and the relationship is robust to the inclusion of the individual CE model inputs and firm
fixed effects. The magnitude of the estimated CE coefficient ranges from 0.01 and 0.07 between
specifications and aggregation windows. These results provide additional support for the conjecture
that our measure of customer equity informs on future profitability and the relationship is not
mechanical.
=== Insert Table 7 ===
Although there may be other mechanisms through which customer equity conveys
information about firm value, these findings indicate a clear link between CE and market value of
equity via future profitability, alleviating concerns associated with conventional value-relevance tests.
21
An examination of analysts’ reports reveals that sell-side equity analysts discuss and project
some of the model inputs (e.g., churn and customer base). However, we did not encounter a
systematic discussion of algorithms used to transform customer metrics into a measure of value of
customer equity.
20
Additional analysis: Scaling
To test the association between market value of equity and our measure of customer equity, we
use an unscaled specification. As we discuss in the future profitability analysis section, deflating
by total assets offers both a control for size and an intuitive interpretation of the coefficients of
interest.22
To this end, we scale equation [4] by Total Assets at the beginning of the quarter,
effectively capturing the magnitude of the unrecognized asset – customer franchise value – relative
to the assets recognized under US GAAP. Turning to Table 8 inferences remain qualitatively
unchanged: The association between MVE and CE is economically and statistically significant in all
specifications, even after including the CE model inputs as controls.23
=== Insert Table 8 ===
An alternative deflator often employed in extant value-relevance research is the number
of shares outstanding (e.g., Collins et al. 1999). As a robustness test, we verify that our inferences
are not sensitive to such scaling. In particular, we re-estimate the firm fixed effects specification of
equation [4], converting MVE10q, CE, and the GAAP variables to “per share” basis, and find that
the estimated coefficient on CE remains significantly positive (untabulated).
Additional analysis: Growth
The association between CE and market value of equity in the presence of GAAP metrics is likely
to be a function of the life cycle of the firm. In particular, for steady-state firms net income likely
captures a large portion of the information contained in the the unrecognized customer franchise
intangible asset. This, however, is not likely to be the case for growing and shrinkig firms. While
our regression models include growth metrics and firm fixed effects as controls, up to this point
22
We do not consider book value of equity as a deflator as twenty percent of our sample firms
have negative BVE. 23
Results are qualitatively similar if we scale by lagged total assets only the dependent variable,
CE, and GAAP variables (untabulated). We thank the anonymous reviewer for suggesting the full-
scaling approach as means to mitigating concerns about the interpretation of the regression
coefficients when market value of equity is deflated by total assets.

21
we do not explicitly condition the association between market value of equity and CE on whether
or not the firm is in a steady state.
To explore this relation, we condition the analysis on absolute sales growth.24
Specifically, we estimate equation [4] separately for steady-state (“Low Absolute Growth”) and
growth/decline firms (“High Absolute Growth”), measured relative to the sample median for the
quarter.25
Turning to Table 9, we find that while the association between MVE and CE is positive
in all specifications, consistent with expectations it is statistically signifcant predominnatly in the
“high absolute growth” subsamples. More so, the estimated CE coefficients are notably larger in
these subsamples while the association between MVE and the GAAP performance metrics is
muted.
=== Insert Table 9 ===
6. Conclusion
In this paper, we show that customer equity, a metric summarizing the state of the fundamental
business process of subscription-based enterprises, embeds important information pertaining to
firm value. To this end, we begin by introducing a model translating the main drivers of the
business model of subscription-based enterprises into a unique measure of customer franchise
value. We then apply the estimation algorithm to a sample of companies that voluntarily disclose
customer-related metrics, and show that the value of the customer equity measure is positively and
significantly associated with the market value of the firm, as well as with future earnings and
analysts’ forecast errors. We document that these results persist even after the individual model
inputs disclosed by the sample firms and used by analysts are included as competing explanatory
24
We focus on the absolute value of sales growth as a partitioning variable as the distribution of
sales growth in the sample is heavily skewed. 25
In unreported analyses we verify that the results are qualitatively similar if we partition the
sample relative to all firms in the target industries and, separately, the full sample. We also note
that the results are qualitatively similar if we interact the variables of interest instead of estimating
the models separately for the two subsamples.

22
variables in the regression models.
Our results should be interpreted with caution: The analyses are based on a relatively
small sample of companies that voluntary disclose the necessary customer metrics, and our
measure of customer equity relies on estimates of future margin, retention, and discount rates.
Despite these limitations, we believe that our findings provide important insights into the role of a
major intangible asset missing from the balance sheet—customer equity—in the valuation of
subscription-based enterprises.
Our findings are relevant to a wide audience, including researchers, investors,
accountants, and regulators. Our analysis reveals that while the conventional outputs of the
accounting system—earnings and book values—play an important role in communicating a firm’s
performance and prospects, the meaningful aggregation of non-financial business fundamental
metrics provides a significant improvement, particularly for non-steady-state firms. In particular,
we introduce to the accounting literature a parsimonious, easy-to-implement measure of customer
equity (franchise) for subscription-based enterprises, and highlight the importance of analyzing a
company’s business model as a value-generating mechanism. Auditors can use this measure of
customer value to determine customer-related intangible assets impairment, and standard-setters
could consider our analysis in recommending useful disclosure items for subscription-based
enterprises. Importantly, our customer equity measure can also aid investors and equity analysts in
forecasting earnings, a key input in firm valuation.
23
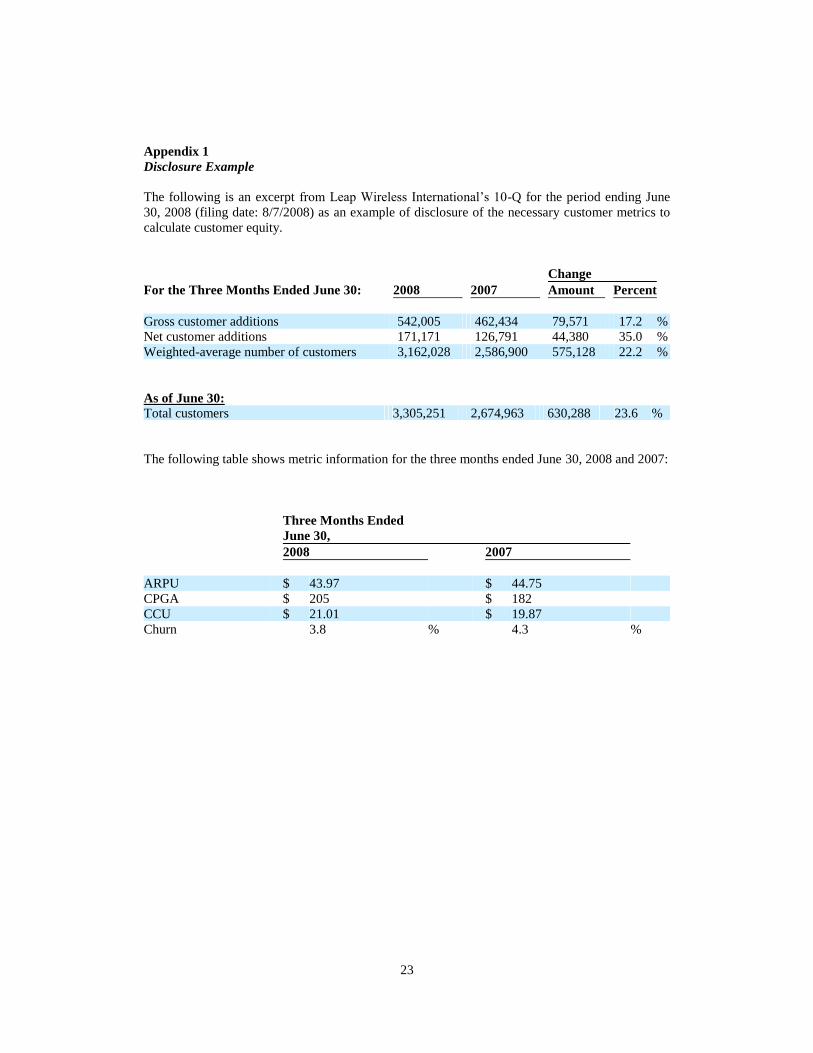
Appendix 1
Disclosure Example
The following is an excerpt from Leap Wireless International’s 10-Q for the period ending June
30, 2008 (filing date: 8/7/2008) as an example of disclosure of the necessary customer metrics to
calculate customer equity.
Change
For the Three Months Ended June 30: 2008 2007 Amount Percent
Gross customer additions 542,005 462,434 79,571 17.2 %
Net customer additions 171,171 126,791 44,380 35.0 %
Weighted-average number of customers 3,162,028 2,586,900 575,128 22.2 %
As of June 30:
Total customers 3,305,251 2,674,963 630,288 23.6 %
The following table shows metric information for the three months ended June 30, 2008 and 2007:
Three Months Ended
June 30,
2008 2007
ARPU $ 43.97 $ 44.75
CPGA $ 205 $ 182
CCU $ 21.01 $ 19.87
Churn 3.8 % 4.3 %
24
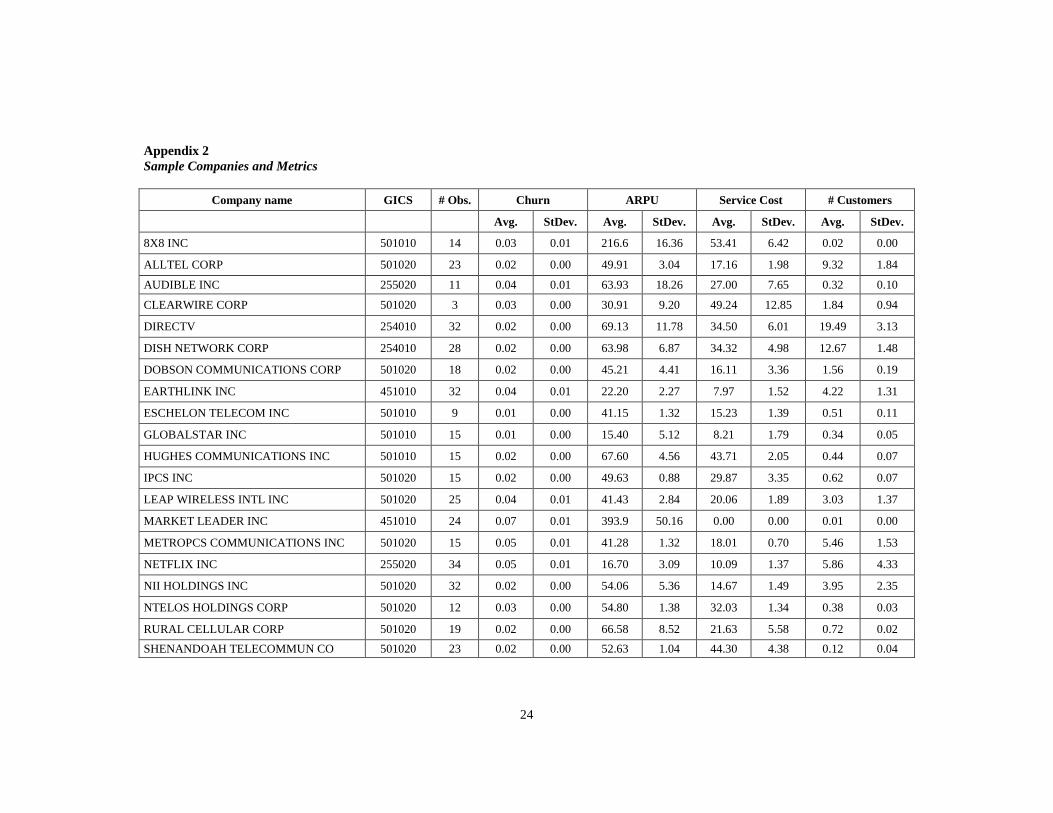
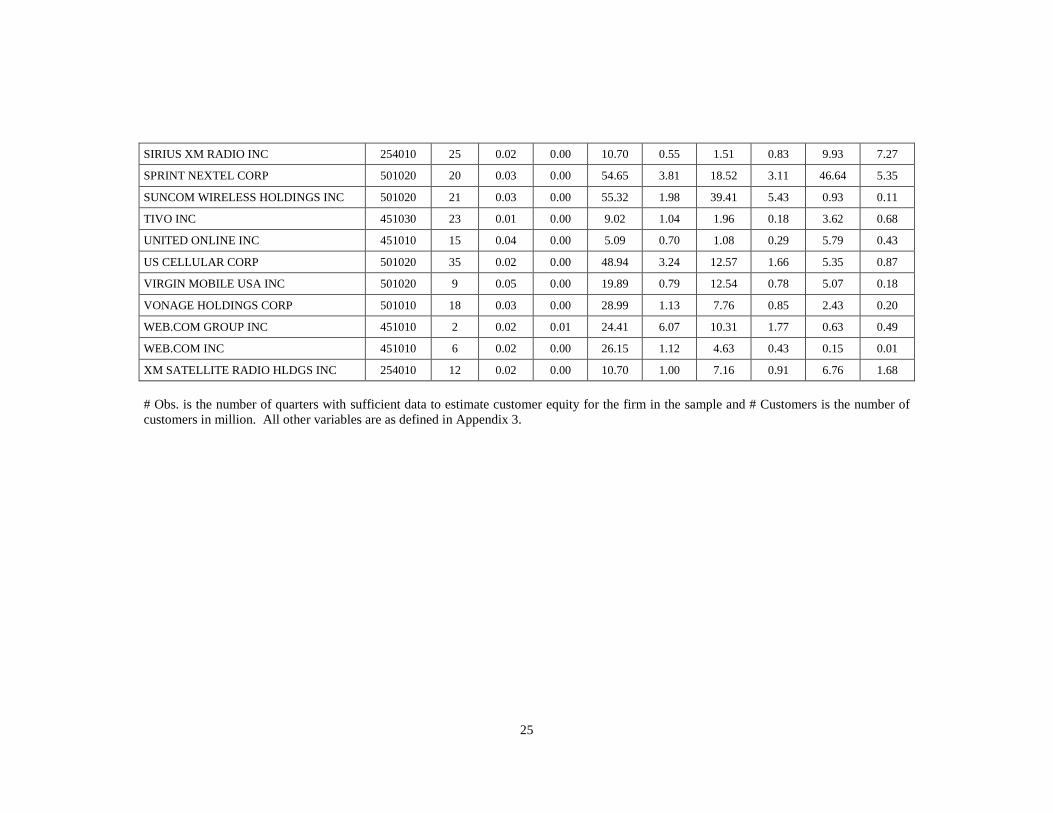
Appendix 2
Sample Companies and Metrics
Company name GICS # Obs. Churn ARPU Service Cost # Customers
Avg. StDev. Avg. StDev. Avg. StDev. Avg. StDev.
8X8 INC 501010 14 0.03 0.01 216.6 16.36 53.41 6.42 0.02 0.00
ALLTEL CORP 501020 23 0.02 0.00 49.91 3.04 17.16 1.98 9.32 1.84
AUDIBLE INC 255020 11 0.04 0.01 63.93 18.26 27.00 7.65 0.32 0.10
CLEARWIRE CORP 501020 3 0.03 0.00 30.91 9.20 49.24 12.85 1.84 0.94
DIRECTV 254010 32 0.02 0.00 69.13 11.78 34.50 6.01 19.49 3.13
DISH NETWORK CORP 254010 28 0.02 0.00 63.98 6.87 34.32 4.98 12.67 1.48
DOBSON COMMUNICATIONS CORP 501020 18 0.02 0.00 45.21 4.41 16.11 3.36 1.56 0.19
EARTHLINK INC 451010 32 0.04 0.01 22.20 2.27 7.97 1.52 4.22 1.31
ESCHELON TELECOM INC 501010 9 0.01 0.00 41.15 1.32 15.23 1.39 0.51 0.11
GLOBALSTAR INC 501010 15 0.01 0.00 15.40 5.12 8.21 1.79 0.34 0.05
HUGHES COMMUNICATIONS INC 501010 15 0.02 0.00 67.60 4.56 43.71 2.05 0.44 0.07
IPCS INC 501020 15 0.02 0.00 49.63 0.88 29.87 3.35 0.62 0.07
LEAP WIRELESS INTL INC 501020 25 0.04 0.01 41.43 2.84 20.06 1.89 3.03 1.37
MARKET LEADER INC 451010 24 0.07 0.01 393.9 50.16 0.00 0.00 0.01 0.00
METROPCS COMMUNICATIONS INC 501020 15 0.05 0.01 41.28 1.32 18.01 0.70 5.46 1.53
NETFLIX INC 255020 34 0.05 0.01 16.70 3.09 10.09 1.37 5.86 4.33
NII HOLDINGS INC 501020 32 0.02 0.00 54.06 5.36 14.67 1.49 3.95 2.35
NTELOS HOLDINGS CORP 501020 12 0.03 0.00 54.80 1.38 32.03 1.34 0.38 0.03
RURAL CELLULAR CORP 501020 19 0.02 0.00 66.58 8.52 21.63 5.58 0.72 0.02
SHENANDOAH TELECOMMUN CO 501020 23 0.02 0.00 52.63 1.04 44.30 4.38 0.12 0.04
25
SIRIUS XM RADIO INC 254010 25 0.02 0.00 10.70 0.55 1.51 0.83 9.93 7.27
SPRINT NEXTEL CORP 501020 20 0.03 0.00 54.65 3.81 18.52 3.11 46.64 5.35
SUNCOM WIRELESS HOLDINGS INC 501020 21 0.03 0.00 55.32 1.98 39.41 5.43 0.93 0.11
TIVO INC 451030 23 0.01 0.00 9.02 1.04 1.96 0.18 3.62 0.68
UNITED ONLINE INC 451010 15 0.04 0.00 5.09 0.70 1.08 0.29 5.79 0.43
US CELLULAR CORP 501020 35 0.02 0.00 48.94 3.24 12.57 1.66 5.35 0.87
VIRGIN MOBILE USA INC 501020 9 0.05 0.00 19.89 0.79 12.54 0.78 5.07 0.18
VONAGE HOLDINGS CORP 501010 18 0.03 0.00 28.99 1.13 7.76 0.85 2.43 0.20
WEB.COM GROUP INC 451010 2 0.02 0.01 24.41 6.07 10.31 1.77 0.63 0.49
WEB.COM INC 451010 6 0.02 0.00 26.15 1.12 4.63 0.43 0.15 0.01
XM SATELLITE RADIO HLDGS INC 254010 12 0.02 0.00 10.70 1.00 7.16 0.91 6.76 1.68
# Obs. is the number of quarters with sufficient data to estimate customer equity for the firm in the sample and # Customers is the number of
customers in million. All other variables are as defined in Appendix 3.

26
Appendix 3
Variable Definitions
Age = Current year minus the first year with non-missing Total Assets data in
Compustat
Analyst Following = Number of analysts providing earnings forecasts for the firm during the
quarter, as reported by I/B/E/S
ARPU = Average monthly revenue per customer for the quarter, as reported by
the company
Assets = Total Assets, Compustat item ATQ
BM = Book to Market Value of Equity; BVE / MVE10Q
BVE = Book Value of Common Equity, Compustat item CEQQ
CE = Equity in current customers, calculated using the proposed model
Churn = Average monthly churn rate for the quarter, as reported by the
company
CV = Comprehensive value; BVE + CE
FE = Analysts’ forecast error measured as the difference between actual
earnings as reported by I/B/E/S and the earliest median consensus
forecast after the 10-Q filing date for the prior quarter, converted to
million $
Follow = An indicator variable set to 1 if the firm has at least one earnings
forecast during the quarter
IMR = Inverse Mills’ Ratio, estimated using the first stage, selection, model
(equation 3)
LTG = I/B/E/S median consensus long-term growth earnings forecast
MVE10Q = Market Value of Equity one business day after the 10-Q filing date
NI = Net Income before Extraordinary Items, Compustat item IBQ
OpInc = Operating income after depreciation (Compustat item OIADPQ)
Sales = Net Sales, Compustat item SALEQ
Sales Growth = Percentage change in Sales over the prior four quarters (Compustat
items (SALEQt + SALEQt-4 / SALEQt-4))
Service Cost = Average monthly service cost per customer for the quarter, as reported
by the company
ΣAFq+1, q+N = Sum of the earliest median consensus earnings forecasts for quarters
Q+1 through Q+4 after the earnings announcement date for the quarter,
converted to million $
ΣOpIncq+1, q+N = Cumulative future Operating Income, measured between quarters Q+1
and Q+N
ΣPastOpInc = OpIncq-1 + OpIncq-2 + OpIncq-3
Subscribers = Total subscribers at the end of the quarter in million, as reported by the
company
27
Figure 1
Theoretical Model for Deriving the Value of Customer Equity
where:
nk = number of customers acquired in the kth cohort at time t
nkr(t-k)
= remaining customers at the end of period t
mt = profit margin for each period t
t = time period
k = cohorts
r = monthly retention rate
i = cost of capital for the firm
ck = cost of customer acquisition
…
…
…
…
… … … … … …
n0r3; m3
n0r4; m4
n1; m1; c1n0r; m1
n0r2; m2 n1r; m2
n1r2; m3
n1r3; m4
cohort kcohort 0 cohort 1 cohort 2
n0;mo; c0
…
ntr3; mt+3
ntr4; mt+4
n1r4; m5
nt; mt; ck
ntr; mt+1
ntr2; mt+2
…
…
…
…
k
1CE -
(1 )(1 )
t
tk t k kt k
rn m c
ii
0
1CE -
(1 )(1 )
t k
t kk t k kk t k
rn m c
ii
0
0
00)1(
ci
rmnCE
tt
t
t
)1(
1
)1(1
1
11i
ci
rmnCE
tt
t
t

28
References
Amir, E., and B. Lev. 1996. Value-relevance of nonfinancial information: The wireless
communications industry. Journal of Accounting and Economics 22 (1-3): 3−30.
Banker, R. D., and R. Mashruwala. 2007. The moderating role of competition in the relationship
between nonfinancial measures and future financial performance. Contemporary
Accounting Research 24 (3): 763−793.
Barth, M. E., W. H. Beaver, and W. R. Landsman. 1998. Relative valuation roles of equity book
value and net income as a function of financial health. Journal of Accounting and
Economics 25 (1): 1−34.
Barth, M. E., M. B. Clement, G. Foster, and R. Kasznik. 1998. Brand values and capital market
valuation. Review of Accounting Studies 3 (1): 41−68.
Berger, P. D., and N. I. Nasr. 1998. Customer lifetime value: Marketing models and applications.
Journal of Interactive Marketing 12 (1): 17−30.
Borle, S, S. S. Singh, and D. C. Jain. 2008. Customer Lifetime Value Measurement. Management
Science 54 (1): 100-112.
Botosan, C. A., M. A. Plumlee, and H. E. Wen. 2011. The Relation between Expected Returns,
Realized Returns, and Firm Risk Characteristics. Contemporary Accounting Research 28
(4): 1085-1122.
Collins, D. W., M. Pincus, and H. Xie. 1999. Equity valuation and negative earnings: The role of
book value of equity. The Accounting Review 74 (1): 29−61.
Deng, Z., B. Lev, and F. Narin. 1999. Science and technology as predictors of stock performance.
Financial Analysts Journal 55 (3): 20−32.
Fader, P., and B. G. S. Hardie. 2007. How to project customer retention. Journal of Interactive
Marketing 21 (1): 76−90.

29
Fader, P., B. G. S. Hardie, and J. Shang. 2010. Customer-Base Analysis in a Discrete-Time
Noncontractual Setting. Marketing Science 29 (6): 1086-1108.
Fader, P., B. G. S. Hardie, and K. L. Lee. 2005. RFM and CLV: Using iso-value curves for
customer base analysis. Journal of Marketing Research 42 (4): 415−430.
Frankel, R., and C. M. C. Lee. 1998. Accounting valuation, market expectation, and cross-
sectional stock returns. Journal of Accounting and Economics 25 (3): 283−319.
Gleaves, R., J. Burton, J. Kitshoff, K. Bates, and M. Whittington. 2008. Accounting is from Mars,
marketing is from Venus: establishing common ground for the concept of customer
profitability. Journal of Marketing Management 24 (7-8): 825−845.
Gu, F., and B. Lev. 2011. Intangible assets: Measurement, drivers, and usefulness. In Managing
Knowledge Assets and Business Value Creation in Organizations: Measures and
Dynamics, edited by Giovanni Schiuma, 110–124. Hershey, PA: IGI Global.
Guo, R., B. Lev, and N. Zhou. 2004. Competitive costs of disclosure by biotech IPOs. Journal of
Accounting Research 42 (2): 319−355.
Gupta, S., and D. R. Lehmann. 2005. Managing Customers as Investment. The Strategic Value of
Customer in the Long Run. Upper Saddle River, NJ: Wharton School Publishing.
Gupta, S., D. R. Lehmann, and J. A. Stuart. 2004. Valuing customers. Journal of Marketing
Research 41 (1): 7−18.
Hand, J. R. M. 2005. The value relevance of financial statements in the venture capital market.
Accounting Review 80 (2): 613−648.
Healy, P. M., and K. G. Palepu. 2001. Information asymmetry, corporate disclosure, and the
capital markets: A review of the empirical disclosure literature. Journal of Accounting
and Economics 31(1-3): 405−440.
Heckman, J. J. 1979. Sample selection bias as a specification error. Econometrica 47(1), 153−161.
30
Hogan, J. E., D. R. Lehmann, M. Merino, R. K. Srivastava, J. S. Thomas, and P. C. Verhoef. 2002.
Linking customer assets to financial performance. Journal of Service Research 5 (1):
26−38.
Holthausen, R. W., and R. L. Watts. 2001. The relevance of the value-relevance literature for
financial accounting standard setting. Journal of Accounting and Economics 31(1-3):
3−75.
Ittner, C. D., and D. F. Larcker. 1998. Are nonfinancial measures leading indicators of financial
performance? An analysis of customer satisfaction. Journal of Accounting Research 36:
1−35.
Kim, N., V. Mahajan, and R. K. Srivastava. 1995. Determining the going market value of a
business in an emerging information technology industry: The case of the cellular
communications industry. Technological Forecasting and Social Change 49 (3):
257−279.
Kumar, V., and D. Shah. 2009. Expanding the role of marketing: from customer equity to market
capitalization. Journal of Marketing 73 (6): 119−136.
Lang, M., and R. Lundholm. 1993. Cross-sectional determinants of analyst ratings of corporate
disclosures. Journal of Accounting Research 31 (2): 246−271.
Lang, M., and R. Lundholm. 1996. Corporate disclosure policy and analyst behavior. The
Accounting Review 71 (4): 467−492.
Lev, B., and S. R. Thiagarajan. 1993. Fundamental information analysis. Journal of Accounting
Research 31 (2): 190−215.
Lewis, M. 2005. Research note: A dynamic programming approach to customer relationship
pricing. Management Science 51 (6): 986−994.
31
Livne, G., Simpson, A., and E. Talmor. 2011. Do customer acquisition cost, retention and usage
matter to firm performance and valuation? Journal of Business Finane & Accounting 38
(3): 334−363.
Liu, J., and J. A. Ohlson. 2000. The Feltham-Ohlson (1995) Model: Empirical implications.
Journal of Accounting, Auditing and Finance 15 (3): 321–331.
Ohlson, J. A. 1995. Earnings, book values, and dividends in equity valuation. Contemporary
Accounting Research 11 (2): 661−687.
Ohlson, J. A. 2001. Earnings, book values, and dividends in equity valuation: An empirical
perspective. Contemporary Accounting Research 18 (1): 107−120.
Petersen, M. 2009. Estimating standard errors in finance panel data sets: Comparing approaches.
Review of Financial Studies 22 (1): 435–480.
Pfeifer, P. E. 2011, On estimating current-customer equity using company summary data, Journal
of Interactive Marketing 25 (1): 1−14.
Pfeifer, P. E., M. E. Haskins, and R. M. Conroy. 2005. Customer lifetime value, customer
profitability, and the treatment of acquisition spending. Journal of Managerial Issues 17
(1): 11−25.
Reinartz, W. J., V. Kumar. 2000. On the profitability of long-life customers in a noncontractual
setting: An empirical investigation and implications for marketing. Journal of Marketing
64 (4): 17−35.
Rosset, S., E. Neumann, U. Eick, U, and N. Vatnik. 2003. Customer lifetime value models for
decision support. Data Mining and Knowledge Discovery 7 (3): 321−339.
Rust, R. T., K. N. Lemon, and V. A. Zeithaml. 2004. Return on marketing: Using customer equity
to focus marketing strategy. Journal of Marketing 68 (1): 109−127.

32
Schulze, C., Skiera, B. and T. Wiesel. 2012. Linking customer and financial metrics to shareholder
value: The leverage effect in customer-based valuation. Journal of Marketing 76 (2):
17−32.
Silveira, C. S., de Oliveira, M. O. R. and Luce, F. B. 2012. Customer equity and market value:
Two methods, same results? Journal of Business Research 65 (12): 1752–1758.
Simpson, A. 2010. Analysts’ use of nonfinancial information disclosure. Contemporary
Accounting Research 27 (1): 249–288.
Tasker, S. C. 1998. Bridging the information gap: Quarterly conference calls as a medium for
voluntary disclosure. Review of Accounting Studies 3 (1): 137−167.
Trueman, B., M. H. F. Wong, and X.-J. Zhang. 2000. The eyeballs have it: Searching for the value
of internet stocks. Journal of Accounting Research 38: 137−162.
Venkatesan, R., and V. Kumar. 2004. A customer lifetime value framework for customer selection
and resource allocation strategy. Journal of Marketing 68 (4): 106−125.
Villanueva, J., and D. Hanssens. 2007. Customer equity: measurement management and research
opportunities. Foundations and Trends in Marketing 1 (1): 1−95.
Wiesel, T., B. Skiera, and J. Villanueva. 2008. Customer equity: An integral part of financial
reporting. Journal of Marketing 72 (2): 1−14.

33
TABLE 1
Descriptive Statistics
# Obs. Mean Q1 Median Q3 StdDev
Assets 579 6,095 457.9 1,427 5,731 14,014
Sales 579 965.3 117.0 251.7 785.2 1,876
NI 579 6.043 –15.30 2.682 35.86 1668
BVE 579 2,211 28.84 226.3 1,703 6,875
MVE10Q 579 4,761 340.7 1,167 4,475 8,738
LTG 428 21.49 11.50 20.00 30.00 15.09
Sales Growth 579 0.224 0.013 0.123 0.270 0.426
Loss 579 0.423 0.000 0.000 1.000 0.494
negBVE 579 0.200 0.000 0.000 0.000 0.401
Age 579 12.96 6.000 10.00 15.00 10.93
Analyst Following 579 9.962 3.000 8.000 16.00 7.970
Churn 579 0.028 0.017 0.023 0.038 0.015
ARPU 579 60.01 21.56 48.01 58.00 77.87
Service Cost 579 19.00 8.629 15.41 30.30 14.42
Subscribers 579 6.261 0.700 3.395 6.736 9.382
CE 579 5,514 381.6 1,171 6,247 10,478
CV 579 7,757 451.5 1,334 7,917 16,703
BM 579 0.156 0.052 0.274 0.600 1.305
CV / MVE10Q 579 2.033 0.725 1.312 2.185 2.487
CE / Assetsq-1 579 1.323 0.398 0.911 1.704 1.544
ΣOpIncq+1, q+4 / Assetsq-1 542 0.056 –0.007 0.075 0.159 0.159
ΣPastOpInc / Assetsq-1 569 0.019 –0.011 0.044 0.090 0.121
ΣAFq+1, q+4 / Assetsq-1 458 0.018 –0.021 0.035 0.097 0.134
ΣFEq+1, q+4 / Assetsq-1 492 0.008 –0.015 0.002 0.019 0.084
All variables are as defined in Appendix 3 and are winsorized at 1 percent and 99 percent.
34
TABLE 2
Spearman (Pearson) Correlations are Below (Above) the Diagonal
(1) (2) (3) (4) (5) (6) (7) (8) (9) (10) (11) (12)
(1) MVE10Q - 0.808 0.240 0.867 –0.055 0.012 –0.233 –0.038 0.126 0.773 0.082 –0.071
(0.01) (0.01) (0.01) (0.19) (0.78) (0.01) (0.37) (0.01) (0.01) (0.06) (0.11)
(2) BVE 0.624
- –0.056 0.789 –0.108 –0.047 –0.087 –0.023 0.006 0.791 –0.033 –0.061
(0.01) (0.18) (0.01) (0.01) (0.26) (0.04) (0.59) (0.89) (0.01) (0.44) (0.17)
(3) NI 0.400 0.320
- 0.063 0.083 –0.190 –0.086 0.060 0.158 –0.135 0.356 0.034
(0.01) (0.01) (0.13) (0.05) (0.01) (0.04) (0.15) (0.01) (0.01) (0.01) (0.46)
(4) CE 0.791 0.440 0.368
- 0.004 –0.099 –0.259 –0.017 0.164 0.924 0.121 –0.071
(0.01) (0.60) (0.01) (0.93) (0.02) (0.01) (0.68) (0.01) (0.01) (0.01) (0.12)
(5)
CE / ATQt-1 0.127 –0.143 0.273 0.383
- –0.050 –0.219 –0.077 –0.177 –0.009 –0.039 0.318
(0.02) (0.01) (0.01) (0.01) (0.23) (0.01) (0.06) (0.01) (0.84) (0.36) (0.01)
(6)
Sales Growth 0.212 –0.053 –0.112 0.047 0.039
- –0.031 –0.143 –0.121 –0.063 –0.381 –0.045
(0.01) (0.20) (0.01) (0.25) (0.35) (0.45) (0. 01) (0.01) (0.13) (0.01) (0.32)
(7) Churn –0.323 –0.095 –0.116 –0.420 –0.216 –0.064
- 0.465 –0.246 –0.158 0.067 –0.037
(0.01) (0.02) (0.01) (0.01) (0.01) (0.13) (0.01) (0.01) (0.01) (0.12) (0.42)
(8) ARPU –0.015 –0.016 0.237 0.086 0.012 –0.129 –0.041
- 0.063 –0.114 –0.061 –0.103
(0.73) (0.70) (0.01) (0.04) (0.77) (0.01) (0.32) (0.13) (0.01) (0.16) (0.02)
(9) Service Cost 0.058 0.014 0.141 0.042 –0.201 0.029 –0.135 0.627
- 0.015 0.204 –0.061
(0.16) (0.74) (0.01) (0.31) (0.01) (0.48) (0.01) (0.01) (0.73) (0.01) (0.18)
(10) Subscribers 0.807 0.438 0.338 0.855 0.303 0.057 –0.227 –0.193 –0.098
- 0.107 –0.050
(0.01) (0.01) (0.01) (0.01) (0.01) (0.17) (0.01) (0.01) (0.02) (0.01) (0.27)
(11) ΣOpIncq+1, q+4 0.192 0.031 0.604 0.222 0.316 –0.104 0.086 0.153 0.195 0.248
- –0.004
(0.01) (0.48) (0.01) (0.01) (0.01) (0.02) (0.05) (0.01) (0.01) (0.01) (0.94)
(12) ΣFEq+1, q+4 –0.074 –0.137 0.120 –0.074 0.251 –0.067 0.097 –0.279 –0.200 0.058 0.228
- (0.10) (0.01) (0.01) (0.10) (0.01) (0.14) (0.03) (0.01) (0.01) (0.20) (0.01)
MVE, BVE, NI, ΣFEq+1, q+4, and ΣCoreNIq+1, q+4 are scaled by Total Assets at the beginning of the quarter. All variables are as defined in
Appendix 3 and are winsorized at 1 percent and 99 percent.
35
TABLE 3 Propensity to Disclose the CE Model Inputs
Dependant Variable = Pr(Disclose = 1)
Coefficient z-statistics Marginal Effect
Log(MVE10Q) 0.157 (3.38) 0.004
BM –0.064 (–0.93) –0.002
Sales Growth 0.102 (0.72) 0.003
Loss 0.075 (0.49) 0.002
negBVE 0.496 (1.86) 0.021
Log(Age) 0.014 (0.11) 0.000
Follow 0.483 (2.66) 0.010
Industry FE Yes
# Obs. 17,186
# Firms 975
Pseudo. R2 32.52%
The sample consists of firm-quarters with sufficient information to estimate CE (Disclose = 1) and
an industry-matched sample (six-digit GICS) of firms that do not disclose or discuss CE inputs
(Disclose = 0). The Disclose (Not Disclose) samples are individually winsorized at 1 percent and
99 percent. The regressions are estimated using a Probit model, as the errors are allowed to cluster
by company and fiscal quarter-year. log(Age) is measured as one plus the number of years the
company has been covered by Compustat, converted to natural logs; and, Follow is an indicator
variable set to 1 if at least one analyst provides earnings forecasts during the period as reported by
I/B/E/S. All other variables are as defined in Appendix 3.
36
TABLE 4
Regressing Market Value of Equity on BVE, NI and Customer Equity
Dependant Variable = MVE10Q
E(sign) (1) (2) (3) (4) (5) (6) (7) (8)
BVE 0.622 0.802 0.632 0.835 0.615 0.821 0.626 0.806
(3.72) (9.25) (3.88) (10.46) (3.87) (10.11) (4.13) (10.24)
NI 11.89 3.221 25.44 7.710 25.23 7.353 28.64 8.953
(4.02) (2.46) (3.27) (2.12) (3.21) (2.02) (3.46) (2.56)
CE + 0.348 0.424 0.270 0.395 0.291 0.402 0.276 0.379
(2.18) (5.56) (1.64) (4.63) (1.80) (4.71) (1.75) (5.47)
negBVE
252.2 –1,340 368.9 –1,123 302.8 –6,524
(0.44) (–4.82) (0.63) (–4.21) (0.34) (–6.92)
BVE* negBVE 3.239 0.684 3.119 0.585 3.368 0.246
(3.06) (1.63) (2.87) (1.38) (3.66) (0.64)
Loss 816.6 44.40 700.0 –13.66 908.8 –285.1
(1.99) (0.26) (1.75) (–0.09) (1.71) (–1.07)
Loss*NI –18.24 –6.822 –17.53 –6.145 –22.71 –9.981
(–1.94) (–1.60) (–1.85) (–1.43) (–2.28) (–2.07)
Sales Growth 921.6 571.8 775.8 –525.9
(1.59) (2.50) (1.24) (–1.22)
LTG 26.81 19.13
(1.34) (3.18)
IMR –823.4 –3,637 –1,021 –5,099 –874.1 –4,776 –1,420 –17,384
(–1.25) (–8.24) (–1.77) (–9.07) (–1.49) (–8.47) (–1.57) (–7.91)
Industry FE Yes No Yes No Yes No Yes No
Firm FE No Yes No Yes No Yes No Yes
# Obs. 579 579 579 579 579 579 428 428
# Firms 31 31 31 31 31 31 29 29
Adj. R2 86.26% 95.15% 88.37% 95.37% 88.49% 95.40% 88.80% 96.43%
The dependent variable is market value of equity one day after the 10-Q filing date. All variables are as defined in Appendix 3 and are
winsorized at 1 percent and 99 percent. The standard errors are allowed to cluster by fiscal quarter-year (company and fiscal quarter-year) in
the specifications with company (industry) fixed effects.
37
TABLE 5
Regressing Market Value of Equity on BVE, NI and Customer Equity Model Inputs
Dependant Variable = MVE10Q
E(sign) (1) (2) (3) (4) (5) (6) (7) (8)
BVE 0.813 0.714 0.914 0.810 0.817 0.757 0.909 0.820
(5.80) (5.16) (11.76) (10.00) (7.32) (5.60) (13.32) (11.15)
NI 13.61 9.098 6.423 3.246 31.78 26.28 12.31 7.595
(4.56) (2.66) (4.06) (2.58) (5.15) (3.30) (3.36) (2.52)
CE + 0.497 0.471 0.355 0.404
(1.92) (5.99) (1.68) (7.41)
Churn – –88,580 –34,331 –51,232 –38,120 –94,711 –51,726 25,124 23,743
(–2.36) (–0.82) (–3.13) (–3.54) (–2.28) (–1.33) (1.42) (1.97)
Subscribers + 198.7 –256.3 155.9 –134.9 85.34 –234.0 198.9 –77.68
(1.43) (–1.25) (2.39) (–1.63) (0.68) (–1.31) (3.09) (–1.10)
ARPU + 10.44 0.925 –1.292 –14.52 10.09 2.482 –19.56 –50.40
(2.35) (0.18) (–0.18) (–3.43) (2.13) (0.58) (–1.02) (–5.36)
Service Cost – 26.42 –4.219 165.8 108.5 57.64 21.43 245.9 207.3
(0.61) (–0.12) (2.80) (3.26) (1.08) (0.44) (3.69) (5.20)
IMR –1,596 –1,257 –3,826 –3,704 –3,088 –2,535 –20,838 –20,086
(–2.17) (–1.65) (–6.89) (–7.15) (–2.30) (–2.30) (–9.45) (–8.66)
Controls No No No No Yes Yes Yes Yes
Industry FE Yes Yes No No Yes Yes No No
Firm FE No No Yes Yes No No Yes Yes
# Obs. 579 579 579 579 428 428 428 428 # Firms 31 31 31 31 29 29 29 29
Adj. R2 84.62% 87.11% 94.17% 95.39% 88.69% 89.78% 95.93% 96.77%
The vector of controls includes negBVE, BVE*negBVE, Loss, Loss*NI, Sales Growth, and LTG. All variables are as defined in Appendix 3
and are winsorized at 1 percent and 99 percent. The standard errors are allowed to cluster by fiscal quarter-year (company and fiscal quarter-
year) in the specifications with company (industry) fixed effects.
38
TABLE 6
Regressing Cumulative Core Earnings on Customer Equity, Customer Equity Model Inputs, and Controls
Dependant Variable = Cumulative Future Core Earnings
Q+1 to Q+4 Q+1 to Q+8 Q+1 to Q+12
E(sign) (1) (2) (3) (4) (5) (6) (7) (8) (9) (10)
CE + 0.013 0.008 0.009 0.023 0.033 0.080 0.036 0.155
(2.36) (2.67) (2.24) (4.74) (3.28) (8.97) (1.76) (7.47)
OpInc 2.074 1.135 1.093 0.689 1.103 0.613 2.015 1.237 1.830 1.498
(6.79) (2.27) (2.10) (2.30) (2.23) (2.02) (2.17) (2.18) (1.33) (1.96)
ΣPastOpInc 0.489 0.395 0.355 0.286 0.408 0.343 0.739 0.760 0.973 1.042
(4.30) (3.72) (3.50) (3.09) (3.87) (3.25) (3.16) (4.27) (2.70) (3.12)
ΣAF 0.422 0.478 0.441 0.429 0.436 0.826 0.487 1.641 0.926
(4.48) (4.48) (4.24) (4.11) (4.20) (3.29) (2.77) (3.56) (3.62)
Churn – 0.144 –1.085 0.629 0.044 2.869 2.976 5.084 6.032
(0.26) (–1.40) (0.89) (0.06) (1.53) (1.79) (1.42) (2.07)
Subscribers + –0.000 0.008 –0.000 0.006 –0.001 0.013 –0.003 0.020
(–0.20) (4.21) (–0.18) (3.67) (–0.46) (3.65) (–1.14) (2.81)
ARPU + –0.000 –0.001 –0.000 –0.001 –0.000 –0.002 –0.001 –0.002
(–2.22) (–0.93) (–2.02) (–1.13) (–1.96) (–2.25) (–2.13) (–1.25)
Service Cost – –0.000 0.001 0.000 0.001 0.000 0.003 0.002 0.004
(–0.18) (1.21) (0.01) (1.21) (0.12) (1.22) (0.42) (0.84)
IMR 0.003 –0.009 0.003 –0.044 –0.002 –0.020 0.015 –0.040 –0.015 –0.126
(0.14) (–0.60) (0.15) (–1.38) (–0.16) (–0.66) (0.28) (–0.65) (–0.14) (–1.16)
Industry FE Yes Yes Yes No Yes No Yes No Yes No
Company FE No No No Yes No Yes No Yes No Yes
# Obs. 530 447 447 447 447 447 392 392 327 327
# Firms 30 30 30 30 30 30 30 30 26 26
Adj. R2 76.83% 80.30% 80.14% 86.59% 80.66% 87.91% 73.21% 87.79% 71.13% 87.57%
The dependent variable is cumulative Core Earnings (Compustat item OIADPQ) beginning in quarter Q+1. All variables are as defined in
Appendix 3 and are winsorized at 1 percent and 99 percent. All continuous variables, except for Churn, Subscribers, ARPU, and Service Cost
are scaled by Total Assets at the beginning of the quarter. The standard errors are allowed to cluster by fiscal quarter-year (company and fiscal
quarter-year) in the specifications including (excluding) company fixed effects.
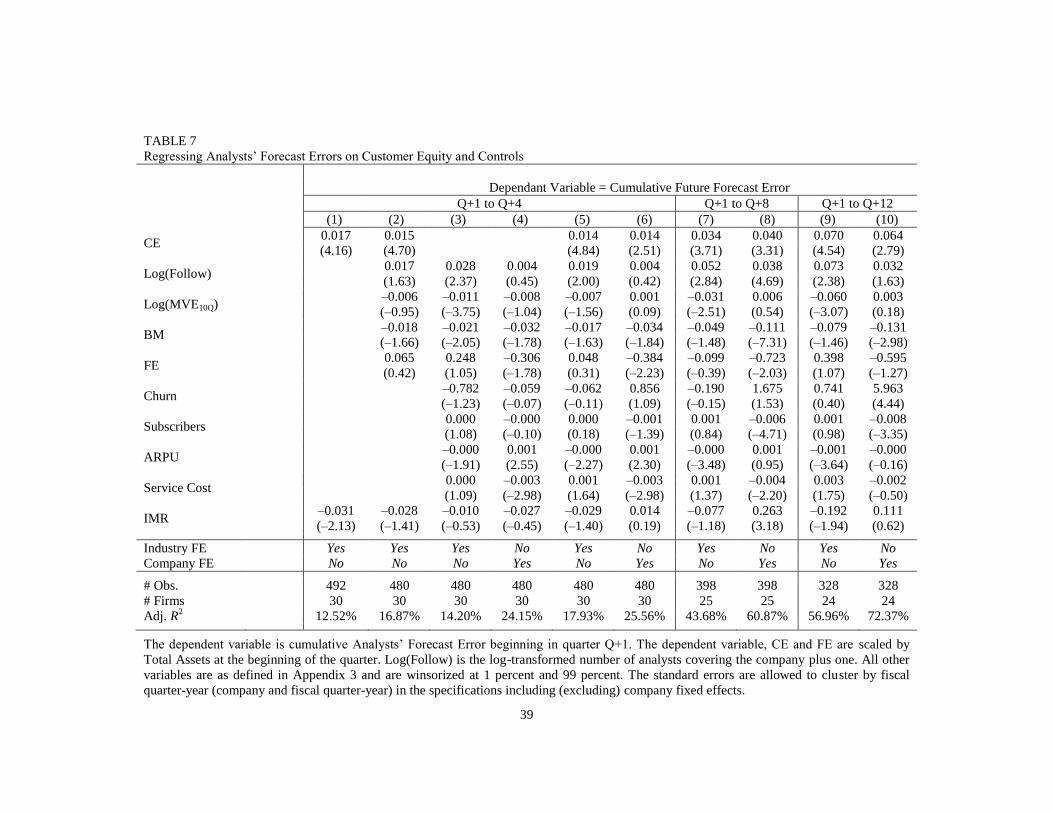
39
TABLE 7
Regressing Analysts’ Forecast Errors on Customer Equity and Controls
Dependant Variable = Cumulative Future Forecast Error
Q+1 to Q+4 Q+1 to Q+8 Q+1 to Q+12
(1) (2) (3) (4) (5) (6) (7) (8) (9) (10)
CE 0.017 0.015 0.014 0.014 0.034 0.040 0.070 0.064
(4.16) (4.70) (4.84) (2.51) (3.71) (3.31) (4.54) (2.79)
Log(Follow) 0.017 0.028 0.004 0.019 0.004 0.052 0.038 0.073 0.032
(1.63) (2.37) (0.45) (2.00) (0.42) (2.84) (4.69) (2.38) (1.63)
Log(MVE10Q) –0.006 –0.011 –0.008 –0.007 0.001 –0.031 0.006 –0.060 0.003
(–0.95) (–3.75) (–1.04) (–1.56) (0.09) (–2.51) (0.54) (–3.07) (0.18)
BM –0.018 –0.021 –0.032 –0.017 –0.034 –0.049 –0.111 –0.079 –0.131
(–1.66) (–2.05) (–1.78) (–1.63) (–1.84) (–1.48) (–7.31) (–1.46) (–2.98)
FE 0.065 0.248 –0.306 0.048 –0.384 –0.099 –0.723 0.398 –0.595
(0.42) (1.05) (–1.78) (0.31) (–2.23) (–0.39) (–2.03) (1.07) (–1.27)
Churn –0.782 –0.059 –0.062 0.856 –0.190 1.675 0.741 5.963
(–1.23) (–0.07) (–0.11) (1.09) (–0.15) (1.53) (0.40) (4.44)
Subscribers 0.000 –0.000 0.000 –0.001 0.001 –0.006 0.001 –0.008
(1.08) (–0.10) (0.18) (–1.39) (0.84) (–4.71) (0.98) (–3.35)
ARPU –0.000 0.001 –0.000 0.001 –0.000 0.001 –0.001 –0.000
(–1.91) (2.55) (–2.27) (2.30) (–3.48) (0.95) (–3.64) (–0.16)
Service Cost 0.000 –0.003 0.001 –0.003 0.001 –0.004 0.003 –0.002
(1.09) (–2.98) (1.64) (–2.98) (1.37) (–2.20) (1.75) (–0.50)
IMR –0.031 –0.028 –0.010 –0.027 –0.029 0.014 –0.077 0.263 –0.192 0.111
(–2.13) (–1.41) (–0.53) (–0.45) (–1.40) (0.19) (–1.18) (3.18) (–1.94) (0.62)
Industry FE Yes Yes Yes No Yes No Yes No Yes No
Company FE No No No Yes No Yes No Yes No Yes
# Obs. 492 480 480 480 480 480 398 398 328 328
# Firms 30 30 30 30 30 30 25 25 24 24
Adj. R2 12.52% 16.87% 14.20% 24.15% 17.93% 25.56% 43.68% 60.87% 56.96% 72.37%
The dependent variable is cumulative Analysts’ Forecast Error beginning in quarter Q+1. The dependent variable, CE and FE are scaled by
Total Assets at the beginning of the quarter. Log(Follow) is the log-transformed number of analysts covering the company plus one. All other
variables are as defined in Appendix 3 and are winsorized at 1 percent and 99 percent. The standard errors are allowed to cluster by fiscal
quarter-year (company and fiscal quarter-year) in the specifications including (excluding) company fixed effects.
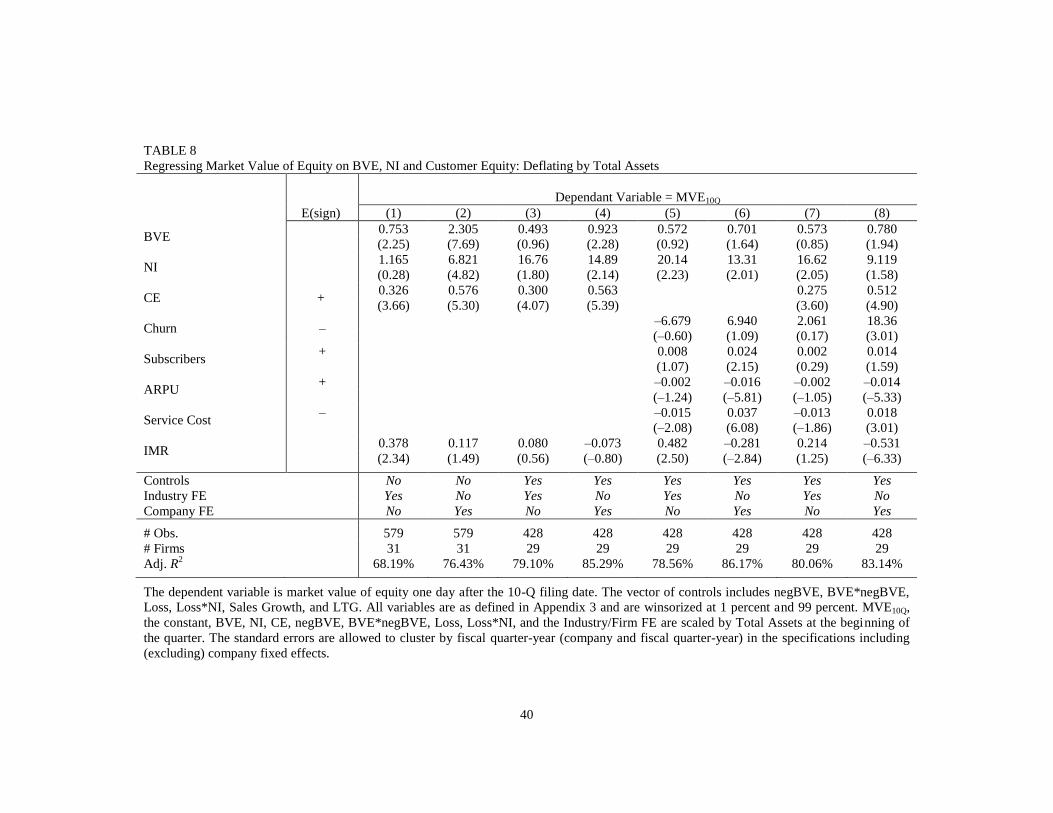
40
TABLE 8
Regressing Market Value of Equity on BVE, NI and Customer Equity: Deflating by Total Assets
Dependant Variable = MVE10Q
E(sign) (1) (2) (3) (4) (5) (6) (7) (8)
BVE 0.753 2.305 0.493 0.923 0.572 0.701 0.573 0.780
(2.25) (7.69) (0.96) (2.28) (0.92) (1.64) (0.85) (1.94)
NI 1.165 6.821 16.76 14.89 20.14 13.31 16.62 9.119
(0.28) (4.82) (1.80) (2.14) (2.23) (2.01) (2.05) (1.58)
CE + 0.326 0.576 0.300 0.563 0.275 0.512
(3.66) (5.30) (4.07) (5.39) (3.60) (4.90)
Churn – –6.679 6.940 2.061 18.36
(–0.60) (1.09) (0.17) (3.01)
Subscribers + 0.008 0.024 0.002 0.014
(1.07) (2.15) (0.29) (1.59)
ARPU + –0.002 –0.016 –0.002 –0.014
(–1.24) (–5.81) (–1.05) (–5.33)
Service Cost – –0.015 0.037 –0.013 0.018
(–2.08) (6.08) (–1.86) (3.01)
IMR 0.378 0.117 0.080 –0.073 0.482 –0.281 0.214 –0.531
(2.34) (1.49) (0.56) (–0.80) (2.50) (–2.84) (1.25) (–6.33)
Controls No No Yes Yes Yes Yes Yes Yes
Industry FE Yes No Yes No Yes No Yes No
Company FE No Yes No Yes No Yes No Yes
# Obs. 579 579 428 428 428 428 428 428
# Firms 31 31 29 29 29 29 29 29
Adj. R2 68.19% 76.43% 79.10% 85.29% 78.56% 86.17% 80.06% 83.14%
The dependent variable is market value of equity one day after the 10-Q filing date. The vector of controls includes negBVE, BVE*negBVE,
Loss, Loss*NI, Sales Growth, and LTG. All variables are as defined in Appendix 3 and are winsorized at 1 percent and 99 percent. MVE10Q,
the constant, BVE, NI, CE, negBVE, BVE*negBVE, Loss, Loss*NI, and the Industry/Firm FE are scaled by Total Assets at the beginning of
the quarter. The standard errors are allowed to cluster by fiscal quarter-year (company and fiscal quarter-year) in the specifications including
(excluding) company fixed effects.
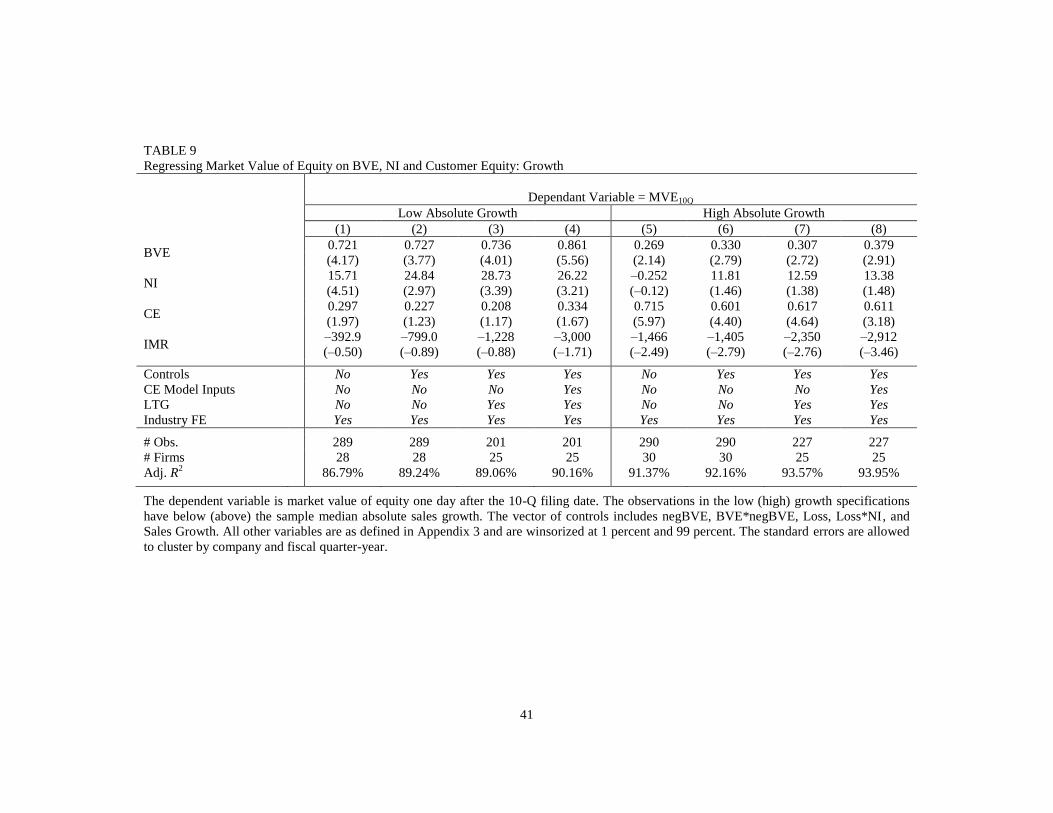
41
TABLE 9
Regressing Market Value of Equity on BVE, NI and Customer Equity: Growth
Dependant Variable = MVE10Q
Low Absolute Growth High Absolute Growth
(1) (2) (3) (4) (5) (6) (7) (8)
BVE 0.721 0.727 0.736 0.861 0.269 0.330 0.307 0.379
(4.17) (3.77) (4.01) (5.56) (2.14) (2.79) (2.72) (2.91)
NI 15.71 24.84 28.73 26.22 –0.252 11.81 12.59 13.38
(4.51) (2.97) (3.39) (3.21) (–0.12) (1.46) (1.38) (1.48)
CE 0.297 0.227 0.208 0.334 0.715 0.601 0.617 0.611
(1.97) (1.23) (1.17) (1.67) (5.97) (4.40) (4.64) (3.18)
IMR –392.9 –799.0 –1,228 –3,000 –1,466 –1,405 –2,350 –2,912
(–0.50) (–0.89) (–0.88) (–1.71) (–2.49) (–2.79) (–2.76) (–3.46)
Controls No Yes Yes Yes No Yes Yes Yes
CE Model Inputs No No No Yes No No No Yes
LTG No No Yes Yes No No Yes Yes
Industry FE Yes Yes Yes Yes Yes Yes Yes Yes
# Obs. 289 289 201 201 290 290 227 227
# Firms 28 28 25 25 30 30 25 25
Adj. R2 86.79% 89.24% 89.06% 90.16% 91.37% 92.16% 93.57% 93.95%
The dependent variable is market value of equity one day after the 10-Q filing date. The observations in the low (high) growth specifications
have below (above) the sample median absolute sales growth. The vector of controls includes negBVE, BVE*negBVE, Loss, Loss*NI, and
Sales Growth. All other variables are as defined in Appendix 3 and are winsorized at 1 percent and 99 percent. The standard errors are allowed
to cluster by company and fiscal quarter-year.