customer experience (cx) - city and county of denver ... · vision customer experience so...
TRANSCRIPT

CUSTOMER EXPERIENCE (CX)Peak Performance Presentation
October 17, 2016
1

Vision
Customer experience so phenomenal that Denver constituents think to themselves
“This can’t possibly be my government.”
2

Vision
3

The Three CX Fundamentals
4
I got it! That was easy!
That was fun!
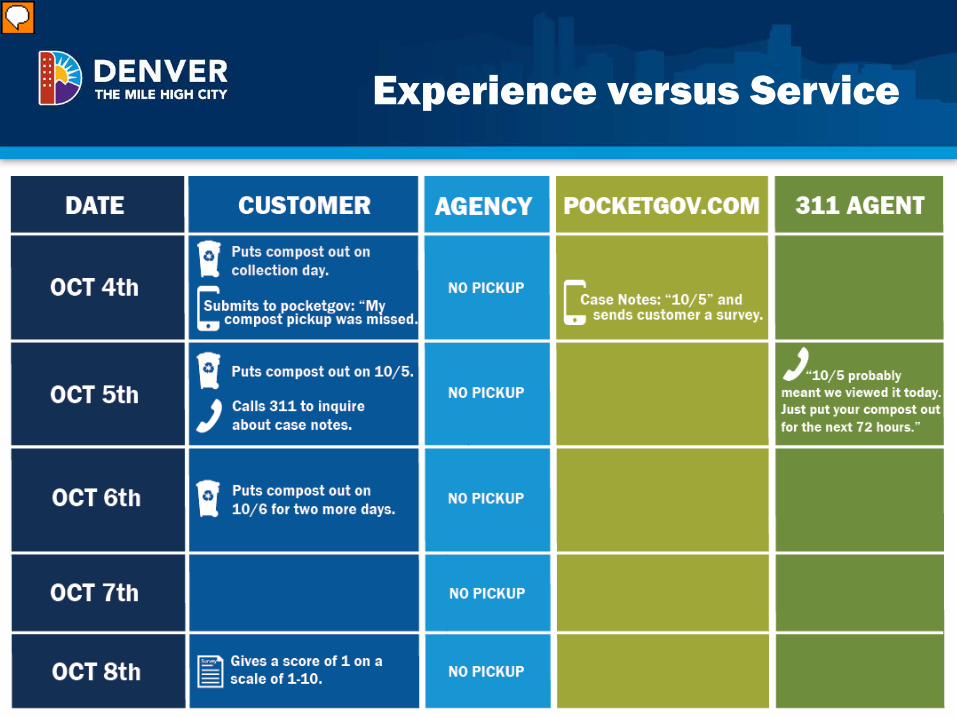
Experience versus Service
5

National Citizen Survey
6
78% 78%
73%76% 76% 78% 85% 86%
83% 82% 82%
87% 87%84%
57% 55%
52%
60%
58%
65%
61%
65% 66%
61%
68%
54%57%
59%
40%
50%
60%
70%
80%
90%
100%
2002 2003 2004 2005 2006 2007 2008 2009 2010 2011 2012 2013 2014 2015
Perc
ent
Overall Quality of Life vs Customer Service
Overall quality of life Customer Service
Peer Cities2015AverageRanges

National Citizen Survey
7
57
5552
60
58
65
61
65 66
62
68
6770
7876 77
79
75
40
45
50
55
60
65
70
75
80
85
2002 2003 2004 2005 2006 2007 2008 2009 2010 2011 2012 2013 2014 2015
Axis
Titl
e
Overall Impression – CCD vs 311
Overall Impression - CCD (Excellent/Good) Overall Impression - 311 (Excellent/Good)

Wait Times Across the City
8
0.00
10.00
20.00
30.00
40.00
50.00
60.00
70.00
80.00
Wai
t Tim
e (m
inut
es)
Date
Clerk & Recorder
DMV
Community Planning &Development - Average Permit
Excise & Licenses - Average

Innovation Approach
1. Improve the digital experience
2. Convert calls to clicks
3. Reduce transactions
1. Make 311 our central nervous system
2. Create an integrated customer experience across 26 lines of business
1. Hire and train tier one customer service representatives
2. Improve the non-digital experience to world class level
9

Digital Experience
10
Pocketgov.comDenver’s Mobile Web ApplicationSome Features Added in 2016
Explore your options to get around with Go Denver.
Use Ballot Trace to watch your ballot get home safely.
Car missing? Check Tow Tracker.
Trying to plan when to catch the A Train? Check DEN Security Wait Times.

Digital Awards
11
• Best of the WebWinner – City Portal Category
• ABA Stevie AwardsGold – Business/Government App Category
• Colorado Technology Association • APEX Nominee - Pocketgov.com for Project of the Year
• American Government Contact • Center Professional Association
2016 Innovations in Technology Award

-
5,000
10,000
15,000
20,000
25,000
2015 Q1 2015 Q2 2015 Q3 2015 Q4 2016 Q1 2016 Q2 2016 Q3
Pocketgov.com User Growth by Quarter
Digital Experience
12

E-mail & Social Marketing
13
E-mail Marketing Campaigns
• Average Open Rate: 29%• Average Click Rate: 3%
Social Marketing Campaigns
• Clicks: 4,996 • Click Through
Rate: 0.32%

Pocketgov.com Timeline
14

DMV Page ViewsStreet Sweeping Page ViewsReport a Problem
Pocketgov.com Page Views
15
-
5,000
10,000
15,000
20,000
25,000
30,000
35,000
40,000
45,000
50,000
2015 Q1 2015 Q2 2015 Q3 2015 Q4 2016 Q1 2016 Q2 2016 Q3
Pocketgov.com Page Views by Quarter
Tow Tracker Pageviews Ask a Question PageviewsProfile Pageviews Waste Service Schedule PageviewsNew Storm Billing Payment Pageviews Parks & Rec MapVirtual Keychain Pageviews Property PageviewsVoter Registration Pageviews Denver Events Pageviews

Native vs Non-native App
16
PROSCustomers expect pocketgov in the appstorePocketgov icon on the home screen will increase, driving up usageIdentification will be improved decreasing the number of logins and reducing abandonsFaster load times are possible in native increasing adoption and usagePush notifications will be possible to drive customer behaviorSensors such as cameras, GPS and microphones will enable richer interactionsThe app will look and feel cleaner meeting our branding objectives
CONSCode and system maintenance and support will be costlierAdditional scrutiny due to the app store approval process will decrease innovationApp releases are less frequent and have a greater lag resulting in fewer releases and code changesContent management becomes more complex as content creators must account for more form factors

Denvergov.org
17
500000
700000
900000
1100000
1300000
Jan-
13Fe
b-13
Mar
-13
Apr-1
3M
ay-1
3Ju
n-13
Jul-1
3Au
g-13
Sep-
13Oc
t-13
Nov
-13
Dec
-13
Jan-
14Fe
b-14
Mar
-14
Apr-1
4M
ay-1
4Ju
n-14
Jul-1
4Au
g-14
Sep-
14Oc
t-14
Nov
-14
Dec
-14
Jan-
15Fe
b-15
Mar
-15
Apr-1
5M
ay-1
5Ju
n-15
Jul-1
5Au
g-15
Sep-
15Oc
t-15
Nov
-15
Dec
-15
Jan-
16Fe
b-16
Mar
-16
Apr-1
6M
ay-1
6Ju
n-16
Jul-1
6Au
g-16
Sep-
16
Number of Sessions
Pre-Adobe Implementation Adobe Live

Understanding the Net Promoter Score
18
The Net Promoter Score is an index ranging from -100 to 100 that measures the willingness of customers to recommend a company's products or services to others. It is used as a proxy for gauging the customer's overall satisfaction with a company's product or service and the customer's loyalty to the brand.

Denvergov.org
19
-9
-7
-5
-3
-1
1
3
5
1-Oct 1-Nov 1-Dec 1-Jan 1-Feb 1-Mar 1-Apr 1-May 1-Jun 1-Jul 1-Aug 1-Sep
Net Promoter Score Average YTD

NPS by Organization
20

21
The 311 Experience -Innovations
Thank you for calling 311.
Here are some great ideas we have!

22
Agency Engagements
PEAK Academy
Salesforce Operation Playbooks
Agency ‘Roadshows’
23
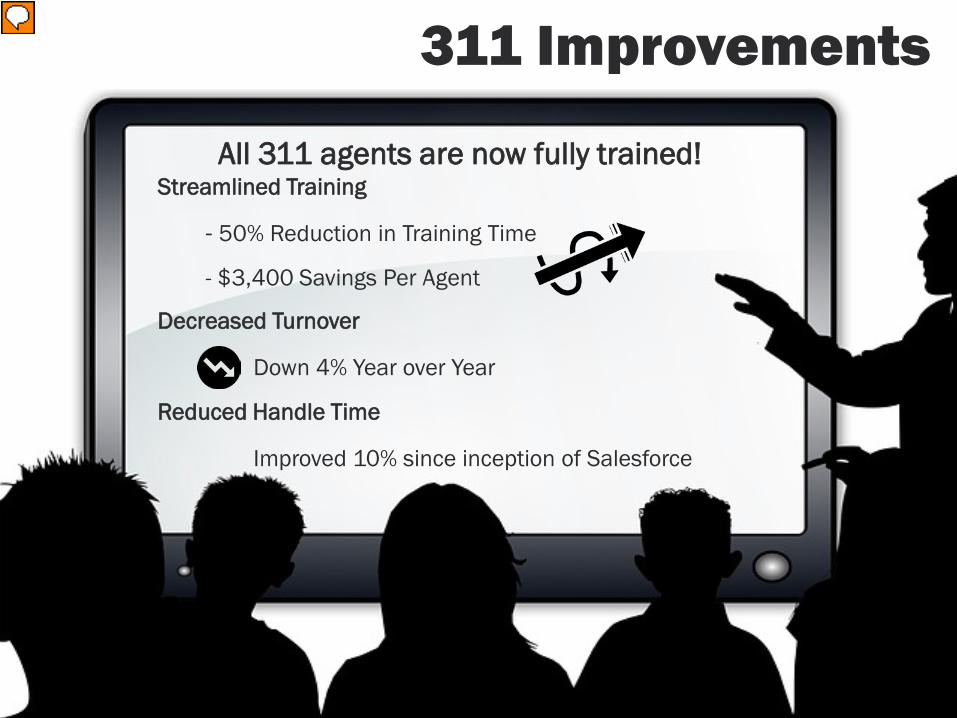
Improvements
All 311 Agents Full Agency Trained
Decreased TurnoverDown 4% Year over Year
Streamlined Training- 50% Reduction in Training Time
- $3,400 Savings Per Agent
The 311 ExperienceStreamlined Training
- 50% Reduction in Training Time
- $3,400 Savings Per Agent
Decreased Turnover
Down 4% Year over Year
Reduced Handle Time
Improved 10% since inception of Salesforce
311 Improvements
All 311 agents are now fully trained!

311 Growth
24

Calls to Clicks
25

Hold Times Matter
26
R² = 0.8337
0%
5%
10%
15%
20%
25%
30%
35%
0:00 1:12 2:24 3:36 4:48 6:00 7:12
CALL
ABA
ND
ONM
ENT
RATE
(PCA
)
HOLD TIME
311 Hold Time versus Call Abandonment Rate (PCA) by Month 1/15-9/16

First Call Resolution (FCR)
27

Case Age
28

Customer Service Pillars
29
Hiring
Training
Coaching
Feedback/Metrics

Jan 2016
March 2016
April 2016
Sept 2016
Oct 2016
Nov 2016
Dec 2016
DAP Coaching Workshop
DMV Training Pilot
DMV Training Live
DMV Training Plan
Recreation Survey and Coaching
Workshop
2016 Key Pilot Activities
30

Customer Satisfaction
The percentage of customers who agree or strongly agree that they were satisfied with their service.
52%
78%
91%
96%
0% 20% 40% 60% 80% 100%
CPD
EXL
Rec
C&R
Average Customer Satisfaction Rating May-October 2016
Agency utilizes all four customer service pillars.

Wait Times vs Customer Satisfaction
32
0%
10%
20%
30%
40%
50%
60%
70%
80%
90%
100%
C&R EXL CPD0.00
5.00
10.00
15.00
20.00
25.00
30.00
35.00
40.00
45.00
50.00
Wait Time Impact on Customer Satisfaction
2016 Wait Time
Customer Satisifaction
Wai
t Tim
e Av
erag
e fo
r 201
6 (m
inut
es)
96%
78%
52%
0.54
6.70
44.22

Next Steps
•First half 2016: continue investment in user experience with current functions
•Second half 2016: I-Fund contingency request•Long-term: regular operational investment
Invest to improve the digital experience
•Demonstrate examples of what good looks like•Leverage disequilibrium to spur interest•Coach and support agencies as they transition
Achieve 311 CNS strategy by continuous
leapfrogging strategy
•Measure customer service by agency (possibly via NPS through 311)
•Raise awareness that this is a mayoral priorityKick start customer
service improvement
33