customer connected community focused
TRANSCRIPT

2012–2013Annual Financial Report
CustomerconnectedCommunityfocused

Contact us Bendigo and Adelaide Bank Limited ABN 11 068 049 178
Registered head officeThe Bendigo Centre 22-44 Bath Lane Bendigo VIC Australia 3550
Telephone: 1300 361 911 Facsimile: 03 5485 7000
Customer Help Centre1300 361 911 (local call) 8.30am to 7.30pm weekdays Australian Eastern Standard Time/Australian Eastern Daylight Time
Shareholder enquiries Share Registry 1800 646 042 Email: [email protected]
Becoming an eShareholderWant to reduce paper and receive this document electronically? You can become an eShareholder simply by registering your mobile number and email address at www.bendigoadelaide.com.au. As an eShareholder, you will have ready access to important dates, current shareholder publications and the Company’s latest announcements.
In an effort to reduce our paper consumption and impact on the environment, this Annual Financial Report is printed on FSC certified paper using environmentally friendly inks.

3
Table of contents
Chairman’s message 4
Managing Director’s message 5
Review of operations and operating results 6
Group performance highlights 15
Analysis of Group performance 17
Overview of loan and deposit portfolios 19
Capital adequacy 20
Divisional performance 20
Directors’ report 22
Remuneration overview for FY2013 25
Remuneration Report 27
Corporate governance 46
Five year history 53
Five year comparison 54
Income statement 55
Statement of comprehensive income 56
Balance sheet 57
Statement of changes in equity 58
Cash flow statement 60
Notes to the financial statements 61
1. Corporate information 61
2. Summary of significant accounting policies 61
3. Segment results 75
4. Profit 78
5. Cash earnings 81
6. Income tax expense 82
7. Capital management 84
8. Earnings per ordinary share 86
9. Dividends 87
10. Return on average ordinary equity 89
11. Net tangible assets per ordinary share 90
12. Cash flow statement reconciliation 90
13. Cash and cash equivalents 91
14. Financial assets held for trading 91
15. Financial assets available for sale - debt securities 92
16. Financial assets available for sale - equity investments 92
17. Financial assets held to maturity 93
18. Loans and other receivables 94
19. Impairment of loans and advances 95
20. Particulars in relation to controlled entities 96
21. Investments accounted for using the equity method 98
22. Property, plant and equipment 101
23. Assets held for sale 103
24. Investment property 103
25. Intangible assets and goodwill 104
26. Impairment testing of goodwill and intangibles with indefinite lives 107
27. Other assets 108
28. Deposits 109
29. Other payables 110
30. Provisions 110
31. Reset preference shares 112
32. Convertible preference shares 112
33. Subordinated debt 112
34. Issued capital 113
35. Retained earnings and reserves 115
36. Employee benefits 117
37. Share based payment plans 118
38. Auditor’s remuneration 123
39. Key management personnel 124
40. Related party disclosures 130
41. Risk management 133
42. Financial instruments 146
43. Derivative financial instruments 156
44. Commitments and contingencies 159
45. Standby arrangements and uncommitted credit facilities 163
46. Fiduciary activities 163
47. Securitisation and transferred assets 163
48. Business combinations 164
49. Events after balance sheet date 164
Directors’ Declaration 165
Independent Auditor's Report 166
Additional information 168

4
Chairman’s message
We are pleased to be able to report another strong performance by Bendigo and Adelaide Bank for 2012–2013.
This result builds on the solid foundations laid over several years as we have dealt with the broader implications of the Global Financial Crisis. It also reflects the strength of the Bank’s unique customer and community value proposition in these subdued market conditions. We appreciate the support that our customers and the communities in which we operate provide to our business.
The Board was pleased to announce an increase in the final dividend to 31 cents per share, a 3.3 percent increase on the first half of the financial year. This increase took the full year dividend to 61 cents per share. It reflects the Bank’s strong capital position, improved earnings performance, and our confidence in the outlook for Bendigo and Adelaide Bank, despite expectations of subdued economic conditions in the coming 12 months.
This strong, consistent performance comes from our low risk, rigorous, common sense management of Bendigo and Adelaide Bank. Today, our conservative funding and balance sheet structure, and our highly engaged staff, place Bendigo and Adelaide Bank in a good position to continue to grow and to benefit from any improvement in market sentiment and demand for credit.
We are now well-placed to move beyond our recent phase of consolidation and transition to a more entrepreneurial period, where we can take greater advantage of the opportunities in the marketplace. We have never been better placed to evolve and develop. As the fifth largest retail bank in Australia, we are an increasingly significant player in the financial services industry. We can be confident about our growing profile and potential.
Following the retirement of Terry O’Dwyer in August 2012, we welcomed Robert Hubbard to our Board. Rob joins the Board with more than 20 years of experience in various accounting, corporate finance, assurance, and audit roles. He is from Queensland, which is an important area of business for us. We look forward to his invaluable insights into running large complex organisations with a national footprint in an international marketplace.
Your Board has a diverse mix of skills, backgrounds, geographies and experience, contributing to the strong, purposeful development of the Bank. Five of the directors have been on the Board for less than five years, each offering fresh perspective and new ideas.
To retain our unique position in the marketplace, we must continually adapt, grow and improve while remaining true to our core values of placing customers and communities first. We must keep responding to and anticipate the demands of our customers and be an unapologetically 21st century organisation. Our investments in Basel II Advanced Accreditation and new digital and online technologies are an integral part of this. We must ensure our business systems and practices are constantly updated to support our people, customers and communities.
On a more personal note, I have been delighted by how the Bank’s scholarship program has grown in the six years since we established it. From just one scholarship in 2007, it has become one of Australia’s largest privately funded scholarship programs. While these scholarships are just one of many examples of how our Bank is investing in communities around the country, I believe there is no better investment for all our communities than giving young people the opportunity to further their education.
I am very proud of some key milestones the Group has celebrated this year, and I am excited about what the coming year will bring. On behalf of the Board, thank you for your continued support, and we look forward to a successful 2014.
Robert Johanson Chairman

5
Managing Director’s message
We have been able to achieve this due to the fantastic support of our shareholders, customers and the communities we operate in, while maintaining a credit rating of at least “A-” from all three ratings agencies.
Our strategy over the next three years is to build on the strong foundations established for the business since the offset of the Global Financial Crisis, and to capitalise on the many opportunities available to us. Our family of brands ensures we will continue to attract, serve and satisfy the varied needs of our customers. Significant investments in Basel II Advanced Accreditation and our new Adelaide premises will deliver enormous benefits to our customers through increases in productivity, efficiency and collaboration.
As a management team we must remain nimble and continue to evolve in response to the ever-changing environment in which we operate. Advances in technology add another layer of uncertainty to the banking environment, through the rapid introduction of new ways and models of doing business and a fluid competitive landscape with aggressive new entrants seeking market share growth in niche areas. We continue to invest in the digital space, and are increasingly engaging with our customers through social media channels. We are currently developing a new online banking system, which will initially be rolled out in mobile format, and we will soon be relaunching www.bendigobank.com.au
Our customer-centric values, ability to innovate and a culture of doing things differently have carved out a position for our Bank that continues to be unique. From the many milestones and achievements of the past year, there are some key highlights we would like to share with you.
> Our Community Bank® model, which celebrated its 15th birthday, has now returned more than $100 million to communities across Australia
> Sandhurst Trustees, part of our Bank’s Wealth division, celebrated 125 years since its formation
> The Community Sector Banking initiative celebrated its first 10 years. From small beginnings, it now serves more than 7,000 customers and has a $650 million balance sheet
> The transition of more than 110,000 Adelaide Bank retail customers onto the core Bendigo Bank retail platform was successfully completed in April. Our Bank is now well-placed to grow our connection with all our South Australian customers
> In November we relaunched the Bank of Cyprus as Delphi Bank. The new-look brand will continue to build on the company’s strong connection to the Hellenic community
> Investments in Community Telco® Australia and HubIT, the company that developed the NoQ app, continue to diversify our services and complement our customer-connected vision
Your management team looks forward to continuing to leverage our unique strengths to take advantage of the significant opportunities that exist for our Bank. This in turn drives our ability to continue to make a positive difference to the communities in which we operate and the individuals and businesses within them.
Mike Hirst Managing Director
The 2012–2013 financial year was typified by soft demand for credit, heightened competition for retail deposits and fragile consumer confidence. It is therefore pleasing that we have been able to produce a result that shows improvement in a range of profitability and efficiency measures – including net profit, cash earnings, net interest margin, dividend and earnings per share, return on equity and cost to income ratio.

6
About the GroupThe Group operates solely in Australia and is a community focussed retail bank that commenced operations in 1858. Today’s business is, to a large degree, the result of the successful merger of the antecedent businesses of Bendigo Bank Limited and Adelaide Bank Limited in 2007.
Our business activitiesThe principal activities of the Group are the provision of banking and other financial services including lending, deposit taking, leasing finance, superannuation and funds management, insurance, treasury and foreign exchange services (including trade finance), financial advisory and trustee services.
Our business modelThe Group provides the above services primarily to retail customers and small to medium sized businesses. The business activities are primarily conducted through four specific customer-facing business divisions – Retail Bank, Third Party Banking, Bendigo Wealth and Rural Bank.
The Group’s customer facing brands are depicted in the diagram below.
Retail Bank The Retail banking business, operating under the ‘Bendigo Bank’ brand, provides a full suite of traditional retail banking, wealth and risk management services to retail customers via our national network of more than 500 branches (company-owned and Community Bank®), call centres, agencies and online banking services.
The major revenue sources are net interest income from traditional banking services (i.e. lending and taking deposits) and fee income for the provision of services. The Group shares revenue with the Community Bank® branch network.
Community Bank® is a franchise with the community owning the rights to operate a Bendigo Bank branch. Essentially, a locally owned public company invests in the rights to operate a bank branch. The Group supplies all banking and back office
services while the community company operates the retail outlet. Revenue is shared, enabling communities to earn revenue from their own banking and channel this revenue back into community enterprise and development.
Delphi Bank (formerly Bank of Cyprus Australia) is the division which provides retail banking services to Greek and Cypriot communities across New South Wales, Victoria and South Australia. Delphi Bank is the largest banker of the Hellenic community in Australia.
Third Party BankingThe Third Party Banking business includes the Adelaide Bank branded business which distributes residential mortgage, commercial and consumer finance through intermediaries, including mortgage managers and brokers.
Third Party Banking also includes the Group’s portfolio funding business which provides wholesale funding to third party financiers in the commercial and consumer finance markets.
The major revenue sources are net interest income and fees derived from the provision of residential, commercial, consumer and business lending.
Bendigo WealthBendigo Wealth is the Group’s wealth management division providing margin lending, superannuation, managed investments, traditional trustee services and financial planning services through subsidiaries including Sandhurst Trustees and Leveraged Equities.
The major revenue sources are fees, commissions and interest from the provision of wealth management, margin lending, wealth deposit, cash management and financial planning products and services.
Rural BankRural Bank is a wholly-owned subsidiary with a separate banking licence. Rural Bank provides specialised banking products and services to primary producers, agribusiness participants and individuals or businesses seeking business loans. Rural Bank products and services are available at regional locations nationally including Bendigo Bank branches, Elders Rural Services branches, selected Ray White Rural agencies and two metropolitan Investment Centres in Adelaide and Perth.
The major revenue source is net interest income and fees predominantly derived from the provision of loans and deposits to agribusiness, rural and regional Australian communities.
Review of operations and operating results
This report provides an overview of the business structure, operations, financial performance and position and future prospects for Bendigo and Adelaide Bank Limited and its operating subsidiaries (the Group).

Annual Financial Report Period ending 30 June 2013
7
Our Vision and StrategyThe Group’s strategy is built on the vision of being Australia’s leading customer-connected Bank. The Group aims to achieve this vision by focusing upon a number of key principles.
It is recognised that our strength comes from focussing on the success of our customers, people, partners and communities. For this reason:
a) We take a long term view of the business which means that we make decisions that will generate value for years to come. We will not be price driven or willing to cut costs at the expense of long term value;
b) We listen. With technology advancements and high levels of competition, listening to what it is our customers and partners want to achieve will help us to tailor products and services to meet their needs;
c) We respect every customer’s choice, needs and objectives. We look to put our customers in control of how they want to define their banking relationship with us and how they want to deal with us; and
d) We partner for sustainable long term outcomes.
We believe our success comes from our focus on the success of others. If we do this we will be relevant, connected and valued, with the benefits flowing to all of our stakeholders including shareholders, customers, our people, partners and the wider community.
With our industry leading customer satisfaction and brand advocacy, we will continue to work to leverage this unique positioning to deliver above system growth in both deposits and housing lending.
Developments during the yearThe consolidation of our office space in Adelaide is well progressed. The construction of the new five-star green-star building in the heart of Adelaide will affirm our commitment to our staff, customers, partners and the South Australian community. We expect to occupy the premises by the end of 2013.
The new building will accommodate more than 1,000 staff currently based in four locations across Adelaide, and including staff from the Bank’s wholly owned subsidiary, Rural Bank. The new office will also feature an innovative flagship branch.
In December 2012, we announced that we had entered into an agreement to acquire the loan book and other assets totalling approximately $290 million from Warrnambool based Southern Finance with the purchase proceeds used to repay Southern Finance noteholders.
In May this year, we also announced the signing of an agreement with Benalla based H.D & C Securities Limited to acquire the loan book of H.D. & C Securities totalling approximately $50 million.
These transactions have further strengthened our connection with these regions and positioned the Group to support these customers with an exceptional product and service offering.
In November 2012, we successfully completed the issue of convertible preference shares (CPS) and raised a total of approximately $270 million of new Tier 1 hybrid capital.
We also successfully completed the redemption of the Reset Preference Shares (RPS) in November 2012.
In February 2013, we announced the issue of $850 million of mortgage backed securities under the Torrens securitisation program and in June 2013 we announced the issue of further mortgage backed securities totalling $500 million under the same program. In addition to the significant funding provided, these transactions also provide capital management benefits to the Group.
In April 2013, we successfully transitioned more than 110,000 Adelaide Bank customers onto the core Bendigo Bank retail platform. This was a significant project for us and we believe it will greatly assist us in building a stronger and more sustainable retail business in South Australia.
Challenges and opportunitiesThe operating environment for the coming year is again expected to be very challenging. However, we believe we are well positioned for continued growth given our distinctive offering and unique market positioning, the significant investment into systems and the distribution network and our long history of trusted service.
We intend to continue to invest in our business to further understand the needs and aspirations of customers through additional development of our customer management platforms and by connecting with customers through social media forums and emerging technologies.
Challenges
Continuation of the low credit growth environmentIt is expected that the sector will continue to experience relatively subdued credit growth and this should in turn drive strong competition as financial institutions compete for the limited demand for credit.
We believe that the low demand for credit will again make growth in interest revenue challenging. In addition, a large percentage of our borrowers are making loan repayments ahead of their minimum contractual obligations. However, we are well placed to generate above system credit growth given the relative immaturity of the retail network, our market positioning and our value proposition.
Continued strong competition for depositsWhilst we moved early to complete the restructuring of our balance sheet, it will be important that we remain competitive in the pricing of term deposits. Higher demand for retail deposit funding, combined with low absolute interest rates, is again expected to continue to squeeze the margins of all banks, including our own.

8
We will again commence the new financial year with a very strong funding profile. The level of deposit funding, in the order of 78 percent of our overall funding mix, places us in an enviable position. In addition, wholesale funding markets have improved and our conservative funding profile should enable us to access these markets where economically sensible to do so. For example, this year we successfully completed two mortgage-backed security issues and two unsecured senior debt issuances.
Advanced Accreditation projectWe have initiated a project to become accredited under the Australian Prudential Regulation Authority’s (APRA) advanced capital measurement model (Basel II). This will be a major project for us over the next few years. Whilst the investment in this project is expected to generate significant long-term benefits for all stakeholders, including improving our ability to meet our customers’ needs, the project will require significant resource allocation and investment in both systems and new skills. We invested in the order of $12.5 million in this project for the 2013 financial year.
Regulatory changeThe Group is subject to significant regulatory oversight. It is regulated by APRA, the Reserve Bank (RBA), the Australian Securities Exchange (ASX), the Australian Securities and Investments Commission (ASIC), the Australian Competition and Consumer Commission and Australian Transaction Reports and Analysis Centre amongst others.
Regulation of the banking and financial services sector is becoming increasingly complex and extensive. Some of the more significant changes that we will need to incorporate into our business structures include completing the implementation of the new minimum liquidity risk management standards and capital requirements under the Basel III reforms.
Other reforms that will impact our business include the new regulations relating to remuneration, the foreign account tax compliance act, tighter anti-money laundering and counter-terrorism financing rules, the future of financial advice reforms, stronger privacy protections, over-the-counter derivatives reforms and stronger governance regulations around superannuation.
OpportunitiesOur core focus will continue to be understanding the needs and objectives of our customers. Customer behaviour and insight drives a lot of what we do and our Customer Led Connections team will coordinate the response to changes in customer behaviour and expectations.
Increasing the level of business activity and engagement with customers will also be a major focus. This opportunity goes directly to our point of difference. There will be continued investment in our community and partner based activities, increasing awareness of the benefits of our banking model and deepening relationships with customers.
Making it easier for customers to do business with us will continue to be a key priority for the business. Structures have been implemented to identify system and process changes to make it simpler and easier for customers to bank with us.
We will continue to invest in our online, mobile and social media strategies through a number of activities. This investment will help the Group grow our connection to our customers utilising social media networks and making improvements to the mobile application as well as the internet banking platform and website.
Another investment that will support the strategy relates to the Bendigo Wealth business. This investment is focussed on enabling us to meet all of our customers’ financial requirements, and we are committed to delivering a meaningful offering of specialist products and services. Our offering will be further expanded with the newly launched SmartStart Super Pension Accounts and MySuper product for employee customers.
Other opportunities include:
Network maturity and growthThe relative immaturity of our distribution network is considered to be a significant platform for growth. The Group now has more than 500 branches across Australia and almost one hundred of these have been operating for less than five years.
The expansion and immaturity of the retail network is evidence of our commitment to our customers and their communities and it is expected that this investment will generate significant growth opportunities for us in years to come.
Funding tenure and diversityThe Group operates with a conservative funding structure and retail deposits continue to make up approximately 78 percent of the total funding.
As demonstrated over recent years, funding markets can go through periods of significant disruption. More recently, the improvements in these markets have been welcomed by all participants.
As a result we have been able to access wholesale funding in both senior unsecured formats as well as secured residential mortgage backed securitisation funding. These transactions have provided the Group with new investors as well as an extension of the Group’s funding profile.
With the success of these transactions and the heightened awareness of the Group’s business model and improved credit rating, more opportunities are likely to arise to further diversify the investor base and potentially lengthen the term debt profile where economically sensible.
Efficiency gainsContinuous Improvement, driven by a developing improvement culture that predominantly uses LEAN techniques, is the centrepiece of our desire to make it easier for customers to do business with us and to deliver further operational efficiencies and cost savings.
It is through this process that we will strive to improve our service delivery, grow our customer business and improve our efficiency by doing more things within the existing cost base.
Banking and telco convergenceWe will continue to progress the banking and telco convergence project. As part of this project the Group is rethinking its online banking service as well as making additional investment into technology that will allow customers to define how and when they deal with the Group.
The digital strategy, of which these initiatives are a part, is principally being driven out of our Customer Led Connections team. This is an exciting area of development and crosses online product and service delivery channels, payments systems, telecommunications and social media.
Leverage customer and staff engagement In addition to the Group’s industry-leading customer satisfaction levels, the organisation has staff engagement levels which are above the Australian high-performance benchmark. There are significant advantages for an organisation that has engaged staff and the organisation will continue to use these strengths to the best advantage.

Annual Financial Report Period ending 30 June 2013
9
Consolidation opportunitiesThe organisation has an established record of successfully acquiring businesses that add shareholder value. The highly competitive environment, the regulatory burden and the pace of technological change is expected to result in more consolidation across the industry. We are well placed to take advantage of opportunities that may arise.
Looking forwardOur focus for the year ahead will be on executing and capitalising on the many opportunities before us. More specifically our businesses will:
> Look to gain a better understanding of the needs, wants and behaviours of customers by tapping into their “Customer Voice” and translating this into increased business from a more engaged and connected customer base.
> Continue to drive above system growth in residential, business and agribusiness lending by building on the current momentum.
> Draw more customers to www.bendigobank.com.au through the delivery of an improved website experience.
> Establish a new and ground breaking online banking experience for our customers.
> Improve the experience for our third party lending customers through the launch of a new and more robust online banking site for Third Party lenders.
> Relaunch our mortgage broker business with a renewed focus and call to action.
> Invest in our margin lending business and position the business for a future turnaround in the share market and investor confidence.
> Start to realise the opportunities and benefits from our ‘convergence strategy’ that involves the amalgamation of banking, telecommunications and payment services.
> Further develop our wealth proposition with a specific emphasis on lifting our presence in the growing superannuation market.
And just as importantly, we will continue to test and challenge everything we do to ensure we are operating as efficiently as possible.
Credit RatingsThe Bank’s credit ratings at the date of this report are:
Short Term Long Term Outlook
Standard & Poor’s A-2 A- Stable
Fitch Ratings F2 A- Stable
Moody’s P-1 A2 Stable
Prudential RegulationAPRA is the prudential regulator of the Australian financial services industry. The Bank is regulated by APRA because of its status as an Authorised Deposit-taking Institution (ADI). Rural Bank is also regulated by APRA because of its ADI status.
APRA’s Prudential Standards aim to ensure that ADI’s remain adequately capitalised to support the risks associated with their activities and to generally protect Australian depositors.
The Bank must currently comply with Basel II which is the common name for a framework issued by the Basel Committee on Banking Supervision (Basel Committee) for the calculation of capital adequacy for banks globally.
The objective of the Basel II framework is to develop capital requirements that are more accurately aligned with the individual risk profile of banks. The Basel II framework is based on three “pillars”:
> Pillar one covers the capital requirements for banks;
> Pillar two covers the supervisory review process; and
> Pillar three relates to market disclosure.
There are two capital measurement approaches under this framework, being the standardised approach and the advanced approach. The Bank is regulated under the standardised approach and has implemented a major project to move to the advanced approach.
Basel IIIThe Basel Committee released in 2010 a series of consultation papers which propose changes to the Basel II framework (Basel III). The aim of the Basel III proposals is to strengthen global capital and liquidity framework and to improve the banking sector’s ability to absorb shocks arising from financial and economic stress.
The consultation papers aim to increase the quality, quantity, consistency and transparency of banks’ capital bases, while strengthening the risk coverage of the capital framework.
On 28 September 2012, APRA released the final Basel III capital reform package for Australia. The major reforms are to be phased in from 1 January 2013 to 1 January 2019. However, recognising that ADIs in Australia are starting from a sound and strongly capitalised position, APRA has accelerated the Basel III timetable in some areas.
The new Basel III minimum capital requirements commenced 1 January 2013 for Australian ADIs. The Group adopted the Basel III measurement and monitoring of regulatory capital from this date as required by APRA.
Bendigo and Adelaide Bank publishes information required under APRA Prudential Standard 330 on its website. This information can be found at:
http://www.bendigoadelaide.com.au/public/shareholders/announcements/aps_330.asp

10
Our capital strategyThe Group seeks to maintain a conservative and prudent capital base that adequately supports the risks being taken through the normal operation of the business. This includes providing for effective and efficient capital buffers to protect depositors and investors, and allowing the business to grow.
The capital management strategy also plans and manages for changes in business conditions, through normal business cycles, regulatory and legislative change and through mergers and acquisitions.
The capital management strategy is designed to ensure that minimum capital standards are met, and that management is afforded the greatest flexibility in pursuing its business objectives.
Our liquidity and funding strategyThe principal source of funding for the Group is, and is expected to continue to be, its retail deposit base. These deposits are traditional term and savings deposits sourced predominantly through the Group’s retail network. Retail deposits provide a stable source of funding and the Group is committed to maintaining a strong retail liability base.
The Group’s funding strategy is to maintain the existing high levels of retail funding on balance sheet. In addition, we have set the following funding objectives:
(a) lengthening the duration of our liabilities;
(b) continuing to diversify our funding opportunities across a range of markets; and
(c) being an active participant in markets where funding opportunities exist and pricing is appropriate.
Securitisation has also formed an important part of the Group’s funding and capital management strategies and we will continue to monitor this market and participate where pricing is appropriate.
Our risk management frameworkThe financial prospects of any company are sensitive to the underlying characteristics of its business and the nature and extent of the commercial risks to which the company is exposed.
There are a number of risks faced by the Group, including those which encompass a broad range of economic and commercial risks. However, the most common risks that the Group actively manages are credit risk, interest rate risk, liquidity risk and operational risk (including fraud, theft and property damage).
Further information on the key financial risks is presented in the Notes to the Financial Statements.
Overview of risk managementThe Board is responsible for overseeing the establishment, implementation, review and monitoring of risk management systems, policies and internal controls to manage material risks.
The directors have adopted policies and procedures to control exposures to, and limit the extent of, these risks. These policies are overseen by Board committees. It is the responsibility of executive management to implement the policies and controls.
The Group has established a system of regular reporting from independent risk (credit, operational, market and liquidity) and audit functions to management and Board committees on the implementation, operation and effectiveness of the risk management systems, policies and internal controls designed to manage risk.
The Group’s approach to managing risk uses three lines of defence. The first line of defence is the business itself. The operational and business management teams have the primary responsibility for identifying and managing risk, implementing controls and monitoring their effectiveness.
The second line of defence is primarily our Group Risk function that provides specialist assistance to the business to monitor and manage risks.
The third line of defence is Group Assurance. Through completion of reviews outlined in the Group Assurance strategic plan, assessments are made to determine whether the Group’s network of risk management, control, and governance processes, as designed and represented by management, is adequate and functioning effectively.
Risk appetiteThe management of risk is an essential element of the Group’s strategy and operations. The Group’s overall risk management strategy is based on a risk appetite approved by the Board. This risk appetite for the key categories of risk are articulated in a Board approved risk appetite statement.
The Group’s risk appetite statement is reviewed, updated and approved annually by the Board. All supporting policies, limits, tolerances and internal controls are updated to reflect the risk appetite statement. All material risks are therefore managed within the defined risk appetite.
The categories of risk where risk appetite and tolerances are set include:
1. Interest rate risk
2. Funding and liquidity risk
3. Credit risk
4. Operational risk
5. Strategic risk
6. Taxation risk
The setting of Group Risk appetite and tolerance limits within each of the categories above is assessed against the approved set of Group strategic objectives.

Annual Financial Report Period ending 30 June 2013
11
Risk limitsRisk limits for market risk, credit risk and capital at risk are set and monitored by the appropriate management committees within the parameters approved by the Board. The management of operational risk is performed using qualitative self assessment.
The risk limits are based upon the level of capital (which may be in the form of net interest income, net profit before or after tax, retained earnings, market value of equity or other key performance indicators) the Board is willing to place at risk.
The risk limits are calculated by aggregating quantifiable measures of market, credit and operational risk. Prior to approval by the Board, limits are formally reviewed on a regular basis by the appropriate management and Board committees, and take into account changes in market conditions, strategy or the Group Risk function.
Risk management functions
Group RiskThe Group’s Executive Risk, heads up the Group Risk function which is an independent function, providing the frameworks, policies and procedures to assist the Group in managing credit and operational risk.
The Credit Risk function is responsible for reviewing portfolio credit quality, policy development and dissemination, credit policy compliance, the assessment of large/maximum credit proposals and manages the performance of the credit management system at the Group level.
The Group’s Operational Risk function is responsible for providing the frameworks, tools and support to assist the business in the management of its operational risk (including regulatory compliance, business continuity, financial crimes and dealings through partners).
Group TreasuryFunctional units are established within the finance and treasury division that are responsible for monitoring and reporting in relation to capital management, financial markets, securitisation, liquidity and balance sheet management.
An independent middle office function, reporting directly to the Chief Financial Officer, is responsible for reporting and monitoring of market risk and oversees, supports and reports on the market risk activities of group treasury and financial markets to the Asset and Liability Management Committee and Board Risk Committee.
Group AssuranceThe Group has an independent Group Assurance function reporting to the Board Audit Committee. The Group Assurance responsibilities include:
1. Providing an assessment on the adequacy and effectiveness of the Group’s processes for controlling its activities and managing its risks; and
2. Reporting significant issues related to the processes for controlling the activities of the Group, including potential improvements to those processes, and confirming resolution.
The Group Assurance function also reports to the Board Credit Committee on items arising from credit risk reviews.
Summary of key risk factors and uncertainties
Dependence on prevailing macro-economic conditionsThe Group’s revenues and earnings are dependent on economic activity and the level of financial services its customers require. In particular, lending is dependent on customer and investor confidence, the state of the economy, the residential lending market and prevailing market interest rates. These factors are, in turn, impacted by both domestic and international economic and political events, natural disasters and the general state of the global economy.
The ongoing global uncertainty continues to impact global economic activity and create high levels of uncertainty and volatility. This continues to adversely impact economic growth, credit growth and consumer and business confidence. A future downturn in the Australian economy could adversely impact the Group’s results of operations, liquidity, capital resources and financial condition.
Geopolitical instability, such as threats of, potential for, or actual conflict, occurring around the world may also adversely affect global financial markets, general economic and business conditions and, in turn, the Group’s business, operations and financial condition.
The Group also has an exposure to the rural sector. The performance of this sector is impacted by national weather patterns and commodity price movements which in-turn may impact group earnings.
Natural disasters such as (but not restricted to) cyclones, floods and earthquakes, and the economic and financial market implications of such disasters on domestic and global conditions can adversely affect the Group’s business, operations and financial condition.
Competition The markets in which the Group operates are highly competitive and could become even more so, particularly in those segments that are considered to provide higher growth prospects or are in greatest demand (for example, customer deposits).
Factors that contribute to competition risk include industry regulation, mergers and acquisitions, changes in customers’ needs and preferences, entry of new participants, development of new distribution and service methods, increased diversification of products by competitors, and regulatory changes in the rules governing the operations of banks and non-bank competitors.
Increasing competition for customers could also potentially lead to a compression in the Group’s net interest margins, or increased advertising and related expenses to attract and retain customers.
Additionally, measures by the Australian Government designed to further promote competitive and sustainable banking system in Australia could have the effect of limiting or reducing the Group’s revenue earned from its banking products or operations.
The effect of competitive market conditions, especially in the Group’s main markets, may lead to erosion in the Group’s market share or margins, and adversely affect the Group’s business, operations, and financial condition.

12
Change to credit ratingsThe Bank’s credit ratings have a significant impact on both its access to, and cost of, capital and wholesale funding.
Credit ratings may be withdrawn, made subject to qualifications, revised, or suspended by the relevant credit rating agency at any time and the methodologies by which they are determined may be revised.
A downgrade or potential downgrade to the Bank’s credit rating may reduce access to capital and wholesale debt markets, potentially leading to an increase in funding costs, as well as affecting the willingness of counterparties to transact with it.
Significant slowdown in the Australian real estate marketResidential, commercial and rural property lending, together with property finance, including real estate development and investment property finance, constitute important businesses to the Group. Overall, the performance of the property market has been variable and in some locations there have been substantially reduced asset values.
A decrease in property valuations in Australia could decrease the amount of new lending the Group is able to write and/or increase the losses that the Group may experience from existing loans, which, in either case, could materially and adversely impact the Group’s financial condition and results of operations.
A significant slowdown in the Australian real estate market could adversely affect the Group’s business, operations and financial conditions.
Risk management
Credit riskCredit risk is the risk of financial loss due to the unwillingness or inability of a counterparty to fully meet their contractual debts and obligations.
Business or economic conditions, whether generally or in a specific industry sector or geographic region, could cause customers to experience an adverse financial situation, thereby exposing the Group to the increased risk that those customers will fail to meet their obligations in accordance with agreed terms.
The Group is exposed to the potential risk of credit-related losses that can occur as a result of a counterparty being unable or unwilling to honour its contractual obligations. As with any financial services organisation, the Group assumes counterparty risk in connection with its lending, trading, derivatives and other businesses where it relies on the ability of a third party to satisfy its financial obligations to the Group on a timely basis.
Credit exposure may also be increased by a number of factors including deterioration in the financial condition of the counterparty, the value of assets the Group holds as collateral and the market value of the counterparty instruments and obligations it holds.
Should material unexpected credit losses occur to the Group’s credit exposures, it could have an adverse effect on the Group’s business, operations and financial conditions.
Credit risk is primarily monitored by the Board Credit Committee and the Management Credit Committee and the framework, policies, analysis and reporting are managed by the Group’s Credit Risk unit.
Market riskMarket risk (which includes interest rate risk and currency risk) is the risk of loss arising from changes and fluctuations in interest rates, foreign currency exchange rates, equity prices and indices, commodity prices, debt securities prices, credit spreads and other market rates and prices.
Changes in investment markets, including changes in interest rates, foreign currency exchange rates and returns from equity, property and other investments, will affect the financial performance of the Group through its operations and investments held in financial services and associated businesses. Losses arising from these risks may have an adverse impact on the Group’s earnings.
Market risk is primarily monitored through the Board Risk Committee and managed through the Asset and Liability Management Committee.
Liquidity and funding riskLiquidity risk is the risk that the Group is unable to meet its payment obligations as they fall due, including repaying depositors or maturing wholesale debt, or that the Group has insufficient capacity to fund increases in assets. Liquidity risk is inherent in all banking operations due to the timing mismatch between cash inflows and cash outflows.
Reduced liquidity could lead to an increase in the cost of the Group’s borrowings and possibly constrain the volume of new lending, which could adversely affect the Group’s profitability. A significant deterioration in investor confidence in the Group could materially impact the Group’s cost of borrowings, and the Group’s ongoing operations and funding.
The Group raises funding from a variety of sources including customer deposits and wholesale funding in Australia and offshore markets to ensure that it continues to meet its funding obligations and to maintain or grow its business generally.
Group Treasury is responsible for implementing liquidity risk management strategies in accordance with approved policies and adherence is monitored by the Asset and Liability Management Committee and the Board Risk Committee. This includes maintaining prudent levels of liquid reserves and a diverse range of funding options to meet daily, short-term and long-term liquidity requirements.
Liquidity scenarios are calculated under stressed and normal operating conditions to assist in anticipating cash flow needs and providing adequate reserves. The Group maintains a portfolio of high quality assets that can be liquidated and readily converted to cash in the event of an unforeseen interruption of cash flow.
The Group also maintains a significant amount of contingent liquidity in the form of internal securitisation whereby the collateral can be presented to the RBA for cash in extraordinary circumstances such as systemic liquidity issues.
The liquidity position is assessed and managed under a stressed name specific scenario as well as under going concern conditions.
The most important of these is to maintain limits on the ratio of net liquid assets to customer liabilities, set to reflect market conditions.
Net liquid assets consist of cash, short term bank deposits and liquid debt securities available for immediate sale, less deposits and other issued securities and borrowings due to mature within the next month.

Annual Financial Report Period ending 30 June 2013
13
Operational riskAs a financial services organisation, the Group is exposed to a variety of risks, including those resulting from process error, fraud, information technology instability and failure, system failure and matters relating to security and physical protection, customer services, staff skills and performance, and product development and maintenance.
Operational risk can directly impact the Group’s reputation and result in financial losses which could adversely affect its financial performance or financial condition.
Operational risk (other than financial reporting risk) is primarily monitored by the Board Risk Committee, supported by a Management Operational Risk Committee.
The business is responsible for managing operational risk with the assistance of the Group Operational Risk unit.
Operational risk is governed by the Group Operational Risk framework. The framework complies with Basel II (operational risk management) and Australian Standard – AS/NZS 4360:2004 (risk management).
Examples of operational risk events by category include:
> Internal and external fraud;
> Products and business practices;
> Business disruption and system failure;
> Employment practices and workplace safety;
> Damage to physical assets; and
> Execution, delivery and process management.
The Board Audit Committee has primary responsibility for the oversight of financial reporting risk.
Information security risk Information security means protecting information and information systems from unauthorised access, use, disclosure, disruption, modification, perusal, inspection, recording or destruction. By its nature, the Group handles a considerable amount of personal and confidential information about its customers and its own internal operations.
The Group employs a team of information security experts who are responsible for the development and implementation of the Group’s information security policies. The Group is conscious that threats to information security are continuously evolving and as such conducts regular internal and external reviews to ensure new threats are identified, evolving risks are mitigated, policies and procedures are updated and good practice is maintained.
However, there is a risk that information may be inadvertently or inappropriately accessed or distributed or illegally accessed or stolen. Any unauthorised use of confidential information could potentially result in breaches of privacy laws, regulatory sanctions, legal action and claims of compensation or erosion to the Group’s competitive market position, which could adversely affect its financial position and reputation.
Information security governance has been aligned to the responsibilities of the Operational Risk Committee. The committee serves a key governance mechanism and is also instrumental in achieving modification of organisational behaviour toward a culture conducive to sound information security and risk management.
An information security policy and standards framework is in place which defines business requirements for security translated into a logical structure that can be consistently applied, monitored and measured. The policy and standards set the requirements for good practice and the risk posture that the business is willing to accept.
Reputation risk Reputation risk may arise as a result of an external event or the Group’s own actions, and adversely affect perceptions about the Group held by the public (including Group customers), shareholders, investors, regulators or rating agencies.
The impact of a risk event on the Group’s reputation may exceed any direct cost of the risk event itself and may adversely impact the Group’s earnings, capital adequacy or value. Accordingly, damage to the Group’s reputation may have wide-ranging impacts, including adverse effects on its profitability, capacity and cost of sourcing funding, and availability of new business opportunities.
Regulatory changes or a failure to comply with regulatory standards, law or policiesThe Group is subject to laws, regulations, policies and codes of practice in countries in which it has operations, trades or raises funds or in respect of which it has some other connection. In particular, the Group’s banking, funds management and superannuation activities are subject to extensive regulation, mainly relating to its liquidity levels, capital, solvency, provisioning and licensing conditions.
Regulations vary from country to country but generally are designed to protect depositors, customers with other banking products and the banking system as a whole.
The Australian Government and its agencies, including APRA, the RBA and other regulatory bodies including ASIC, have supervisory oversight of the Group.
A failure to comply with any standards, laws, regulation or policies in any other of those jurisdictions could result in sanctions by these or other regulatory agencies, the exercise of any discretionary powers that the regulators hold or compensatory action by affected persons, which may in turn cause substantial damage to the Group’s reputation. To the extent that these regulatory requirements limited the Group’s operations or flexibility, they could adversely impact its profitability and prospects.
These regulatory and other governmental agencies (including revenue and tax authorities) frequently review banking and tax laws, regulations, codes of practice and policies. Changes to laws, regulations, codes of practice or policies, including changes in interpretation or implementation of laws, regulations, codes of practices or policies, could affect the Group in substantial and unpredictable ways.
These may include increasing required levels of bank liquidity and capital adequacy, limiting the types of financial services and products the Group can offer and/or increasing the ability of non-banks to offer competing financial services or products, as well as changes to accounting standards, taxation laws and prudential requirements.
Any such changes may adversely affect the Group’s business, operations and financial condition. The changes may lead the Group to, among other things, change its business mix, incur additional costs as a result of increased management attention, raise additional amounts of higher quality capital (such as ordinary shares) and hold significant levels of additional liquid assets and undertake additional long-term wholesale funding to replace short-term wholesale funding to more closely match the Group’s asset maturity profile.
The Group has established a framework of policies and procedures and monitoring and reporting structures to manage compliance risk. The regulatory compliance function, within the Group’s operational risk unit, monitors compliance with approved policies, procedures and requirements. The Board Risk Committee and Management Operational Risk Committee has responsibility for monitoring compliance risk.

14
FraudThe Group is exposed to the risk of fraud, both internal and external. Financial crime is an inherent risk within financial services, given the ability for employees and external parties to obtain advantage for themselves or others.
The inherent risk also exists due to systems of internal controls failing to prevent or detect all instances of fraud, particularly if fraud is committed by persons in collusion or people in positions of trust, who intentionally over-ride control systems in order to misappropriate funds.
There is a risk of intentional actions by Group employees in order to gain an advantage from the Group or related third parties (for example stealing assets and/or information) and a risk of persons external to the Group dishonestly obtaining a benefit, financial or otherwise or causing a loss, by deception or other means.
The Group has established a control framework of policies, procedures, monitoring and reporting and organisational structures to manage fraud risk.
All actual or alleged fraud is investigated under the authority of the Group’s Financial Crimes unit to:
1. Identify and take action against the offender/s of fraud;
2. Minimise the impact of any losses on the Group and where possible recover funds;
3. Identify and rectify deficiencies in processes and controls as well as analyse trends that enable the Group to minimise losses; and
4. Utilise the information obtained to assist in analysis and training.
Disruption of information technology systems or failure to successfully implement new technology systems The Group is highly dependent on information systems and technology and there is a risk that these, or the services the Group uses or is dependent upon, might fail.
Most of the Group’s daily operations are computer-based and information technology systems are essential to the day-to-day provision of banking services. The exposure to systems risks includes the complete or partial failure of information technology systems or data centre infrastructure, the inadequacy of internal and third-party information technology systems due to, among other things, failure to keep pace with industry developments and the capacity of the existing systems to effectively accommodate growth and integrate existing and future acquisitions and alliances.
To manage these risks, the Group has robust disaster recovery and information technology governance structures in place. However, any failure of these systems could result in business interruption, loss of customers, financial compensation, damage to reputation and/or a weakening of the Group’s competitive position, which could adversely impact the Group’s business and have a material adverse effect on the Group’s financial condition and operations.
In addition, the Group must update and implement new information technology systems, in part to assist it to satisfy regulatory demands, ensure information security, enhance computer-based banking services for the Group’s customers and integrate the various segments of its business.
The Group may not implement these projects effectively or execute them efficiently, which could lead to increased project costs, delays in the ability to comply with regulatory requirements, failure of the Group’s information security controls or a decrease in the Group’s ability to service its customers.
The Group has implemented a control framework to manage this risk. The framework includes our enterprise change process, business impact analysis and prioritisation processes, technology infrastructure monitoring, application software maintenance and business system portfolio management structures. The framework is monitored by the Board Technology and Change Committee.
Litigation risks in relation to the Great Southern loan portfolioA specific litigation risk exists in relation to the Group’s Great Southern loan portfolio.
A law firm commenced a number of group legal proceedings involving the Group and other parties on behalf of investors in relation to managed investment schemes managed by Great Southern Managers Australia Ltd (Group Proceedings). The Great Southern Group of companies is now in liquidation.
The Group either acquired or advanced loans to investors in the managed investment schemes.
Not all borrowers are members of the Group Proceedings as the Group Proceedings relate to specific schemes and categories of borrowers.
While no wrongdoing is alleged against the Group, the law firm is seeking to have the loan deeds of those borrowers who are members of the Group Proceedings deemed void or unenforceable and for all money paid under those loans (including principal, interest and fees) to be repaid to borrowers. The Group is vigorously defending the Group Proceedings.
The adequacy of loan provisions in relation to the Great Southern loan portfolio are regularly reviewed having regard to the performance of the portfolio and other relevant factors.

Annual Financial Report Period ending 30 June 2013
15
Group performance highlightsThe Group has announced an after tax statutory profit of $352.3 million for the year ended 30 June 2013. The cash earnings performance is discussed at the Analysis of Group performance section of this report.
The statutory earnings per ordinary share is 84.9 cents (FY2012: 48.6 cents), an increase of 74.7 percent, and the statutory return on average ordinary equity is 8.52 percent (FY2012: 4.84%).
The performance represented a solid result in difficult trading conditions with consumer confidence and demand for credit remaining low and competition for retail deposits remaining very high.
The result included improvements in a range of profitability and efficiency measures including net profit, cash earnings, net interest margin, dividend, earnings per share, return on equity and cost to income ratio.
The Group continues to enjoy the strong support of its customers and of the communities it operates in. This has again been reflected in above-system asset growth across a range of portfolios.
The business operates with a conservative funding and balance sheet structure and highly engaged staff. Together these factors place the Group in an ideal position to benefit from any improvement in market sentiment and demand for credit.
Business performanceNet interest income increased by 8.1 percent to $1,027.5 million (FY2012: $950.1 million). The net interest margin continues to come under pressure from a combination of strong competition for retail deposits and the natural compression caused by low official cash rates.
Despite this the Group managed to increase net interest margin to 2.21 percent for the year, an increase of 10 basis points on the prior year.
Non-interest income before specific items was $297.2 million (FY2012: $275.8 million), an increase of 7.8 percent.
The Group’s expenses before specific items increased by 3.6 percent to $779.0 million (FY2012: $751.7 million) and the cost to income ratio was 57.0 percent compared to 59.1 percent at June 2012.
The improvement in other expenses, compared to the previous financial year, was mainly due to the inclusion of the $95.1 million goodwill write-off for the margin lending business in the 2012 financial year.
The Group continues to invest in its distribution footprint and capability. This, combined with industry leading customer satisfaction and brand advocacy, has allowed the business to grow total lending at an annualised rate of 4.8 percent over the past twelve months. This compares favourably with system growth of just 3.4 percent over the same period.
The Group reported its third consecutive six-monthly improvement in its cost to income ratio. The Group continues to grow revenues faster than costs, with revenue growing at 3.5 percent for the second half of FY2013 compared to 0.4 percent reduction in costs in the first half.
However, the Group expects an increase in costs during the 2014 financial year as the Basel II Advanced Accreditation project continues and we open our new premises for approximately 1,000 staff in Adelaide.
The Group’s bad and doubtful debts expense was $69.9 million (FY2012: $32.4 million), an increase of 115.7 percent.
Credit qualityCredit costs continue to be impacted by seasonal and trade disruptions to the north Queensland cattle sector, and an increase in the number of bankruptcies from investors in the portfolio of Great Southern managed investment schemes.
Despite this, 90-day arrears rates in our residential, business, consumer and Rural Bank portfolios are all better than at the same period last year, and this augers well for the coming financial year.
CapitalThere was a material improvement in capital ratios over the period, with Core Tier 1 increasing 9 basis points to 7.82 percent, Tier 1 capital up 86 basis points to 9.25 percent and total capital up 30 basis points to 10.71 percent.
Under Standard & Poor’s ratings methodology the Group’s risk adjusted capital ratio is 11.5 percent, which is more than 25 percent higher than any of the four major Australian banks.
FundingWhile retail deposits continue to make-up approximately 78 percent of total funding, there has been a material improvement in the cost and availability of wholesale funding options for the Group.
This was evidenced by two successful senior unsecured wholesale funding offers during the year, including the first senior unsecured raising by the Group since the Global Financial Crisis.
The Group also successfully completed two residential mortgage backed securities (RMBS) issues. The RMBS were both priced at the tightest margins since the start of the Global Financial Crisis.
2013 statutory earnings movement for year ($m)
Decrease Increase
June 12 Full year
NII Fee income
Comm income
Other income
Staff costs
Other exps
B & DD Tax June 13 Full year
195.0
77.4 3.6 1.1
61.4
81.8
4.1
37.5
352.3
19.2

16
DividendsThe Board announced an increase in the final dividend to 31 cents per share. This represents an increase of 3.3 percent on the prior half and takes the full-year dividend to 61 cents per share.
OutlookWhile historically low interest rates are providing comfort to existing borrowers, the full effects of recent cash rate reductions are yet to be reflected in a broad return of consumer confidence.
Despite the expectation of relatively subdued credit growth in the coming year, we remain confident that our business model will continue to resonate with customers.
Our industry-leading retail and business customer satisfaction levels and the maintenance of an efficient business model will become even more important in this environment.
The Group will continue to invest in its people and distribution, as it prepares for an eventual improvement in business conditions, and to leverage its unique strengths to take advantage of the significant opportunities that exist for the business.
Financial highlights Full year ending Six months ending
Jun-13 Jun-12 Change Jun-13 Dec-12 Change
$m $m $m % $m $m $m %
Profit before tax 487.6 326.1 161.5 49.5 233.2 254.4 (21.2) (8.3)
Specific items before tax (11.8) 115.7 (127.5) (110.2) 14.0 (25.8) 39.8 154.3
Profit before tax and specific items 475.8 441.8 34.0 7.7 247.2 228.6 18.6 8.1
Statutory profit after tax attributable to the parent 352.3 195.0 157.3 80.7 162.9 189.4 (26.5) (14.0)
Specific items after tax (14.7) 117.0 (131.7) (112.6) 11.9 (26.6) 38.5 144.7
Profit after tax before specific items 337.6 312.0 25.6 8.2 174.8 162.8 12.0 7.4
Adjusted for:
Amortisation of acquired intangibles after tax 16.9 19.5 (2.6) (13.3) 6.5 10.4 (3.9) (37.5)
Distributions paid/accrued on preference shares (3.1) (3.9) 0.8 20.5 (1.5) (1.6) 0.1 6.3
Distributions paid/accrued on step-up preference shares (3.4) (4.6) 1.2 26.1 (1.5) (1.9) 0.4 21.1
Cash basis profit after tax 348.0 323.0 25.0 7.7 178.3 169.7 8.6 5.1
Change
2012-13 2012-13 Total 2011-12 2011-12 Total Full Year 2012to
Full Year 20131st Half 2nd Half 1st Half 2nd Half
$m $m $m $m $m $m $m %
Profit after tax attributable to parent 189.4 162.9 352.3 57.9 137.1 195.0 157.3 80.7
Profit after tax and before specific items 162.8 174.8 337.6 157.4 154.6 312.0 25.6 8.2
Cash earnings 169.7 178.3 348.0 162.6 160.4 323.0 25.0 7.7
Net interest income 507.5 520.0 1,027.5 478.1 472.0 950.1 77.4 8.1
Non-interest income (before specific items) 143.5 153.7 297.2 129.5 146.3 275.8 21.4 7.8
Expenses (before specific items) 390.3 388.7 779.0 367.5 384.2 751.7 27.3 3.6
Retail deposits 41,867.0 42,245.8 42,245.8 38,567.3 40,663.0 40,663.0 1,582.8 3.9
Ordinary equity 4,216.9 4,297.7 4,297.7 4,001.1 4,109.1 4,109.1 188.6 4.6
Funds under management 3,334.5 3,275.2 3,275.2 3,086.8 3,089.9 3,089.9 185.3 6.0
Loans under management 50,505.5 51,689.2 51,689.2 48,057.6 49,989.0 49,989.0 1,700.2 3.4
New loan approvals 6,834.9 7,266.5 14,101.4 6,476.9 6,188.7 12,665.6 1,435.8 11.3
Residential 4,492.9 4,530.2 9,023.1 4,654.0 4,206.7 8,860.7 162.4 1.8
Non-residential 2,342.0 2,736.3 5,078.3 1,822.9 1,982.0 3,804.9 1,273.4 33.5
Change
2012-13 2012-13 Full yeartotal
2011-12 2011-12 Full yeartotal
Full Year 2012to
Full Year 20131st Half 2nd Half 1st Half 2nd Half
Cost to income ratio 57.8% 56.2% 57.0% 58.2% 59.8% 59.1% (2.1) (3.6)
Earnings per ordinary share – cents 45.9 39.0 84.9 14.5 33.5 48.6 36.3 74.7
Cash basis earnings per ordinary share – cents 41.9 43.5 85.4 43.9 40.5 84.2 1.2 1.4
Dividend per share – cents 30.0 31.0 61.0 30.0 30.0 60.0 1.0 1.7

Annual Financial Report Period ending 30 June 2013
17
Full year ending Six months ending
Jun-13 Jun-12 Change % Jun-13 Dec-12 Change %
Dividend per share - cents 61.0 60.0 1.0 1.7 31.0 30.0 1.0 3.3
Dividend amount payable - $m 245.0 232.9 12.1 5.2 125.1 119.9 5.2 4.3
Payout ratio - earnings per ordinary share * 71.8% 123.5% (51.7%) (41.9) 79.5% 65.4% 14.1% 21.6
Payout ratio - cash basis per ordinary share* 71.4% 71.3% 0.1% 0.1 71.3% 71.6% (0.3%) (0.4)
Analysis of Group performanceFinancial performance and business reviewThe 2013 financial year performance represents a solid result given the higher than forecast official cash rate reductions in the year, the subdued credit environment, the intense pricing competition, the significant adjustment to scheme interchange fees and the impact of large projects such as the migration of the Adelaide banking platform to the Bendigo banking platform.
Cost containment and efficiency continued to be a major focus of management and, over the reporting period, operating expenses grew by just 3.6 percent. The Group maintains its long-term 55 percent cost-to-income target.
The Retail Bank performed well for the year. The performance of Third Party Banking and Rural Bank was only slightly below the previous year’s performance. Wealth’s performance was impacted by further run-off in the margin lending portfolio and the dividend forgone after the sale of the Bank’s holding in IOOF.
The Group strengthened its balance sheet over the year through our offer of convertible preference shares and other capital initiatives such as the sale of the IOOF holding and the subordinated securitisation notes, offset by the redemption of the reset preference shares and amortisation of subordinated debt.
The Group’s underlying cash earnings were $348 million which represents an increase of 7.7 percent on the previous year. This equates to a cash earnings per share result of 85.4 cents - an increase of 1.4 percent on the prior year. The components of the cash earnings performance are set out below:
Cash earnings movement FY13 ($m)
The increase in net interest income was primarily driven by:
> an increase in loans under management. Total loans under management increased to $51.7 billion (FY2012: $50.0 billion);
> an increase in the net interest margin. The net interest margin before payments to Community Bank® companies increasing to 2.21 percent (FY2012: 2.11%). This was due to the full year benefit of repricing of the asset portfolios in late 2011/12 combined with further repricing of the asset portfolios in December 2012.
The major component of the increase in other income was the $22.6 million increase in the contribution from the Homesafe Trust. This was due to growth in the Homesafe Trust portfolio and an increase in the housing price index over the past year.
The increase in the Group’s bad and doubtful debt (Credit) expense was mainly due to seasonal and trade disruptions to the north Queensland cattle sector, and an increase in the number of bankruptcies from investors in the portfolio of Great Southern managed investment schemes.
Analysis of net interest margin (%)Net interest income increased over the period. The increase was due to movements in product mix and product pricing.
June 12 Net interest income
Other Income
Staff costs Credit Other expenses
Tax Other specific items & cash adjustments
June 13
323.0
77.4
21.4
Up 7.7%
(19.2)
(37.5)
(8.1) (4.2) (4.8) 348.0
Net Interest Margin
June 12 June 13
Community Bank & Alliance share 0.33%
1.78%
2.11%
0.35%
1.86%
2.21%
Up 10bps

18
Analysis of other incomeThe decrease in liability product and other fee income was largely due to a decrease in transaction fees, interchange fees and credit card income.
The movement in wealth solutions and commission income is mainly due to the increased volume of third party product sales.
Analysis of operating expensesThe increase in salaries and staff related expense was mainly due to ordinary annual salary and wage increases, plus the acquisition of Community Telco® Australia.
The increase in occupancy costs was due to general increases in rental, electricity and insurance premiums.
The increase in information technology costs was predominantly due to an increase in software maintenance.
June 12 June 13
Liability products and other fees
Asset product fees Homesafe revaluation Trustee, management and other services
Insurance commissions Other IncomeWealth solutions and other commissions
108.2
101.0
57.361.3
28.0 28.5
2.5
25.1
5.7 5.3
15.6 16.2
58.5 59.8
June 12 June 13
Salaries and staff related
Occupancy Fees and commissions Property, plant and equipment
Intangibles amortisation Other operatingInformation technology
387.8407.0
65.6 70.655.2
64.6
30.4 28.611.4 10.6
44.0 43.8
157.3 153.8

Annual Financial Report Period ending 30 June 2013
19
Loans
Total lending growth for the year was 4.8 percent compared to system growth of 3.4 percent. Total loan approvals increased by $1.4 billion.
Of this $1.3 billion related to non-residential loan approvals, which represents a 33.5 percent increase on the previous financial year.
The below analysis demonstrates the very high percentage (97.9%) of loans secured by mortgages or listed securities.
Provisions for doubtful debt
Loss provisions and reserves for doubtful debts totalled $276.9 million as at year end. This is an increase of $13.7 million since June 2012. The main reasons for the increase are explained in the Group Performance Highlights section of this report.
DepositsDeposits total $47.44 billion and notes payable total $6.4 billion. The increase in deposits represents a $1.6 billion increase in retail deposits, sourced through the Group’s company-owned and Community Bank® network and a $1.3 billion increase in deposits sourced from wholesale markets.
The mix of deposits at year end is set out in the following table. The Group continues to maintain a high retail funding base in line with its target of 75 percent to 80 percent of total funding.
The Bank’s term deposit retention rate has consistently exceeded 80 percent.
Historical funding mix
Overview of loan and deposit portfolios
Consumer5%
Wealth4%
Delphi Bank3%
Rural Bank8%
Great Southern
1%
Portfolio Funding
1%Business Lending
15%
Retail Residential
33%
3rd Party Mortgages
30%
Total Gross Loans ($m)
Loan portfolio by security
Residential mortgages
69.1%
Commercial mortgages
25.0%
Other 0.5%
Listed securities
& managed funds 3.8%
Unsecured 1.6%
Wholesale Securitisation Retail
8% 8% 9% 10%
Dec-11 Jun-12 Dec-12 Jun-13
15%
77% 80% 80% 78%
13% 11% 12%
General Collective Specific
Dec-10
233.0244.2 248.7
263.2 262.3276.9
Jun-11 Dec-11 Jun-12 Dec-12 Jun-13
81.591.4 96.9
102.9 96.2104.1
108.5 110.9115.0 128.5
134.2 138.343.0 41.9 36.8
31.8 31.9 34.5
53bps

20
The Group maintains a conservative capital management program based on the low risk and highly secured nature of its loan portfolio.
Capital management initiatives during the year have resulted in an 86 basis point improvement in our Tier 1 capital ratios.
Common equity Tier 1 capital ratio recorded a moderate improvement during the year to reach 7.82 percent by year end.
The Group has significant capacity going forward for additional capital efficiency primarily through the issuance of Tier 1 hybrid capital and Tier 2 subordinated debt.
The movement in the Group’s capital ratios is set out in the following chart.
Bendigo and Adelaide Bank publishes information required under APRA Prudential Standard 330 on its website. This information can be found at http://www.bendigoadelaide.com.au/public/shareholders/announcements/aps_330.asp
Capital adequacy
Divisional performanceRetail BankFinancial Performance and Business Review
The Retail Bank’s profit before tax contribution increased from $169.8 million to $231 million. The key driver of this was a $74.4 million increase in net interest income that was mainly attributable to the growth in the residential and business lending portfolios.
Tighter term deposit pricing also contributed to an improvement in the net interest margin and helped lift net interest income. The net interest margin on the retail lending portfolio remained steady with the previous financial year.
The increase in other income was due to:
> telecommunications revenue being recognised for the first time as a result of the Group acquiring a 100 percent ownership in Community Telco Australia Pty Ltd; and
> an increase in commission income mainly relating to insurance premiums, an increase in product fees mainly relating to credit card, net transaction fees and foreign exchange commission.
The increase in credit expense reflects the growth in the retail businesses lending portfolio.
The increase in operating expenses was largely due to staff cost increases.
June 12 DRP Retained earnings IOOF Sale Basel III Adj RWA growth & other
Sub debt amortisation
B-Note sale June 13CPS issue
8.39
2.02
10.410.27
0.58 0.13 (0.28)(1.07)
(0.28) 0.32
0.63 10.71
1.46
9.25
Tier 1 Tier 2
Capital movement
June 12 Net interest income
Other Income Operating expenses
Credit expenses
June 13
169.8
74.4 10.0
Up 36.0%
(11.8)(11.4) 231.0
Retail Bank ($m)

Annual Financial Report Period ending 30 June 2013
21
Third Party Banking Financial performance and business review
The Third Party Banking profit before tax contribution decreased marginally for the year by $2.2 million to $166.9 million.
The increase in net interest income was mainly due to the increase in lending volume. The net interest margin also improved slightly for the year.
The increase in other operating income was mainly due to the improvement in the valuation of the Homesafe Trust portfolio.
The increase in operating expenses was mainly due to an increase in the percentage of unallocated costs charged to the business. The direct operating costs declined compared to the previous year.
The increase in the credit expenses was primarily due to increased loan provisioning for the Great Southern portfolio.
Bendigo Wealth Financial performance and business review
The Wealth profit before tax contribution declined from $45.9 million to $25.9 million. The decline in net interest income was mainly due to the continued decrease in the margin lending portfolio which decreased by $417.6 million for the year.
This was offset (to a degree) by improvements in the net interest income generated from deposit and cash solutions.
The decline in other income was mainly due to the business no longer receiving dividends in relation to the IOOF equity holding sold early in the financial year.
The increase in operating expenses was mainly due to an increase in the percentage of unallocated costs charged to the business. The direct costs declined compared to the previous year.
Rural Bank Financial performance and business review
Rural Bank’s segment contribution was broadly flat year on year. The result was based on strong cost management which was offset by higher credit costs.
Rural Bank achieved net loan growth of 6.0 percent against a slight overall market contraction and compared to the 0.9 percent reduction for the prior year.
The net loan growth includes the acquisition of agricultural lending portfolios. These portfolios contributed $103 million of the total loan growth for the year.
The increase in both credit losses and non performing loans were largely attributable to exposures in the northern regions of Australia.
Further reductions in rural property prices in these areas, combined with challenging export conditions, continue to negatively impact the performance of these markets.
Retail funding remained a core focus with deposit growth increasing by 5.3 percent compared to 4.4 percent for the previous year.
Net interest margin fell by 10 basis points over the year, largely driven by product repricing in response to competitor activity.
Operating expenses benefited from a lower headcount and reduced discretionary expenses across a number of line items.
While the medium term outlook for agriculture remains positive, we expect that in the short term the continued uncertainty around certain export markets, a higher Australian dollar and the potential for further softening in rural property prices is likely to result in relatively subdued market activity and growth.
Further information about the Group’s financial results and financial position are presented in the Annual Financial Report.
June 12 Net interest income
Other Income Operating expenses
Credit expenses
June 13
169.111.3
21.2
Down 1.3%
(13.9)
(20.8) 166.9
Third Party Banking ($m)
June 12 Net interest income
Other Income Operating expenses
Credit expenses
June 13
52.9
(2.7)
0.2
Down 2.1%
5.2 (3.8)
51.8
Rural Bank ($m)
June 12 Margin lending run-off
IOOF & other
Operating expenses
Credit expenses
June 13
45.9(5.6)
(8.3)
Down 43.6%
(4.6)(1.5)
25.9
Wealth ($m)

22
Directors’ reportYour Board of Directors has pleasure in presenting the 149th Financial Report of Bendigo and Adelaide Bank Limited and its controlled entities for the year ended 30 June 2013.
DirectorsThe names and details of the Company's directors are as follows;
Robert Johanson, Chairman, IndependentBA, LLM (Melb), MBA (Harvard), 62 years
Note: Standing for re-election at the 2013 AGM
Term of office: Robert has been a Company director for 25 years. He was appointed Chairman in 2006.
Skills, experience and expertise: Robert has experience in banking and financial services and expertise in corporate strategy, capital management, risk management and mergers and acquisitions. He has more than 30 years experience in providing corporate advice on capital market transactions to a wide range of public and private companies.
Board committees: Governance & HR, Technology and Change.
Group and joint venture directorships: Rural Bank Ltd and Homesafe Solutions Pty Ltd (Chair) and Bank of Cyprus Australia Ltd (from March 2012 to August 2012).
Other director and memberships (current and within last three years): Member, Takeovers Panel; Deputy Chancellor, University of Melbourne; Chairman, Australia India Institute and Chairman of The Conversation; Director, Robert Salzer Foundation Ltd; and Director of Grant Samuel Group Pty Ltd.
Mike Hirst, Managing Director, not independentBCom (Melb), SFin, 55 years
Term of office: Mike was appointed as Managing Director and Chief Executive Officer of the Company in 2009.
Skills, experience and expertise: Mike joined the Group when he was appointed as a director of Sandhurst Trustees Limited (a wealth management subsidiary of the Company) in 2001 and he became an employee of the Company later in 2001. Mike has extensive experience in banking, treasury, funds management and financial markets, including from previous senior executive and management positions with Colonial Ltd, Chase AMP Bank and Westpac.
Board committees: Mike has a standing invitation to attend all committee meetings.
Group and joint venture directorships: Rural Bank Ltd and Bank of Cyprus Australia Ltd (from March 2012 to August 2012).
Other director and memberships (current and within last three years): Director, Treasury Corporation of Victoria; Member; Financial Sector Advisory Council and Business Council of Australia; Councillor, Australian Bankers’ Association; Member, Centre for Workplace Leadership Advisory Board.
Jenny Dawson, IndependentB Bus (Acc), FCA, MAICD, 48 years
Term of office: Jenny joined the Board in 1999.
Skills, experience and expertise: Jenny has experience in financial reporting and audit, IT internal control reviews, internal audit and risk management. Jenny worked with Arthur Andersen for ten years in the audit and IT controls division, and also worked for the Company (her employment ended in 1999).
Board committees: Audit (Chair), Credit.
Group and joint venture directorships: Sandhurst Trustees Ltd (Chair), Community Sector Banking Pty Ltd, Community Sector Enterprises Pty Ltd.
Other director and memberships (current and within last three years): Member, Victorian Regional Policy Advisory Committee; Chair, Regional Development Australia Committee for the Loddon Mallee Region; Member, Independent Audit Committee Goulburn-Murray Water; Former Director, Goulburn-Murray Water (ended 2012); Former Director, Coliban Region Water Corporation (ended 2010).
Jim Hazel, IndependentBEc, SFFin, FAICD, 62 years
Note: Standing for re-election at the 2013 AGM
Term of office: Jim joined the Board in 2010.
Skills, experience and expertise: Jim is a professional public company director who has had an extensive career in banking and finance, including in the regional banking industry. Jim was Chief General Manager of Adelaide Bank (his employment ended in 1999).
Board committees: Risk (Chair), Credit, Governance & HR.
Group and joint venture directorships: Rural Bank Ltd.
Other director and memberships (current and within last three years): Chairman, Ingenia Communities Group Ltd (listed, period June 2012 to present); Director, Centrex Metals Ltd (listed, period of directorship: 2010 to present), Impedimed Ltd (listed, period of directorship: 2007 to present), Motor Accident Commission and Coopers Brewery Ltd.
Jacqueline Hey, IndependentBCom (Melb), Graduate Certificate in Management (Southern Cross University), GAICD, 47 years
Term of office: Jacquie joined the Board in 2011.
Skills, experience and expertise: Jacquie has experience in the areas of telecommunications, marketing and sales, including as CEO/Managing Director of Ericsson in the UK and in Australia. Jacquie worked with Ericsson for more than 20 years in finance, marketing and sales and in leadership roles in Australia, Sweden, the UK and the Middle East.
Board committees: Audit, Risk, Technology and Change (Chair from July 2012)
Group and joint venture directorships: Bank of Cyprus Australia Ltd (from March 2012 to August 2012)
Other director and memberships (current and within last three years): Director, Qantas Airways Limited (ASX listed, period August 2013 to present), Special Broadcasting Service (SBS), Australian Foundation Investment Company Limited, Cricket Australia and Honorary Consul of Sweden

Annual Financial Report Period ending 30 June 2013
23
for Victoria. Former director of Victorian Branch of Australian Industry Group (AIG) (ended 2010), Australian Mobile Telecommunications Association (ended 2010) and Ericsson Group Companies (Australia & New Zealand) (ended 2010).
Robert Hubbard, IndependentBA(Hons) Accy, FCA, MAICD, 54 years
Note: Standing for election at the 2013 AGM
Term of Office: Rob joined the Board in 2013.
Skills, experience and expertise: Rob is an accountant and auditor based in Brisbane. He retired as a partner of PricewaterhouseCoopers Brisbane in March 2013 after 22 years practising in the areas of corporate advice and audit, where he was the auditor of some of Australia’s largest listed companies. Rob also provided accounting and due diligence services for acquisitions, divestments, capital raisings and public takeovers. Rob is now a professional non-executive director in various community and commercially focussed organisations.
Board committees: Audit, Risk
Group and joint venture directorships: nil
Other director and memberships (current and within last three years): Orocobre Ltd (ASX and TSX listed, period of directorship 2012 to present); Chairman of Opera Queensland and Multiple Sclerosis Australia, and a director of UQ Health Care Pty Ltd, MS Research Australia, MS International Federation and Council member of the University of the Sunshine Coast.
David Matthews, IndependentDip BIT, GAICD, 55 years
Note: Standing for re-election at the 2013 AGM
Term of office: David joined the Board in 2010.
Skills, experience and expertise: David has experience in small business and agribusiness. David has involvement in a number of agricultural industry bodies including as a director and vice Chairman of Pulse Australia, and has a strong connection to regional communities. He chaired the first Community Bank®
company in Rupanyup and Minyip when it was first established in 1998.
Board committees: Credit, Audit
Group and joint venture directorships: Member of the Community Bank® Strategic Advisory Board.
Other director and memberships (current and within last three years): Director, Pulse Australia, Rupanyup/Minyip Finance Group Ltd.
Deb Radford, IndependentB.Ec, Graduate Diploma Finance & Investment, 57 years
Term of office: Deb joined the Board in 2006.
Skills, experience and expertise: Deb has over 20 years experience in the banking industry with both international and local banks. Deb also worked in the Victorian State Treasury, and ran her own consulting business between 2001 and 2007 advising the government on commercial transactions.
Board committees: Credit (Chair), Technology and Change, Governance & HR
Group and joint venture directorships: Bank of Cyprus Australia Ltd (from March 2012 to August 2012)
Other director and memberships (current and within last three years): Former Director, Forestry Tasmania (ceased 30 June 2012) and City West Water (ceased 30 September 2011).
Tony Robinson, IndependentB Com (Melb), ASA, MBA (Melb), 55 years
Term of office: Tony joined the Board in 2006.
Skills, experience and expertise: Tony has many years’ experience in financial services, particularly wealth management and insurance. Tony’s previous roles include Managing Director of Centrepoint Alliance Limited, Chief Executive Officer and Executive Director of IOOF Holdings Ltd, Managing Director and Chief Executive Officer of OAMPS Limited, joint Managing Director of Falkiners Stockbroking, Managing Director of WealthPoint, and senior executive positions at Link Telecommunications and Mayne Nickless.
Board committees: Risk, Governance & HR (Chair)
Group and joint venture directorships: n/a
Other director and memberships (current and within last three years): Former director, Centrepoint Alliance Limited (listed, period of directorship: 2009 to 2013)
Share IssuesThe following share classes were issued during the financial year:
Ordinary shares No. of shares
Ordinary shares issued under Employee Share Grant Scheme
-
Ordinary shares issued under the Dividend Reinvestment Plan
8,968,488
Ordinary shares issued in lieu of dividends under the Bonus Share Scheme
806,110
Ordinary shares issued under an Institutional Entitlement
-
Ordinary shares issued under a Retail Entitlement -
Total ordinary shares issued 9,774,598
Share Options and Rights
Unissued Shares: As at the date of this report, there were no unissued ordinary shares under options. There were 591,357 performance shares and no rights to unissued ordinary shares. Refer to notes 37 and 39 of the financial statements for further details of the rights and options outstanding. The Board may decide how to treat the participant’s performance shares to make sure the participant is neither advantaged nor disadvantaged as a result of any share issues or reconstructions.
Shares issued as a result of the exercise of options:During the financial year no performance rights or options vested (2012: nil) and 198,712 (2012: 210,864) performance shares vested and were automatically exercised to acquire ordinary shares in the Company at a nil exercise price.

24
Ordinary Share Dividends Paid or Recommended
Dividends paid:
Final dividend 2012 of 30.0¢ per share, paid September 2012 $117.7 million
Interim dividend 2013 of 30.0¢ per share, paid March 2013 $118.3 million
Dividend recommended:
Final dividend 2013 of 31.0¢ per share, declared by the directors on 19 August 2013, payable 30 September 2013
All dividends were fully franked
$125.1 million
Shareholders electing to receive dividends in the form of shares received the following ordinary shares, paid in full:
September 2012 4,957,637
March 2013 4,010,851
In addition, shareholders electing to receive bonus shares in lieu of dividends received the following ordinary shares, paid in full:
September 2012 402,549
March 2013 403,561
Preference Share Dividends Paid or Recommended
Dividends paid:
91.81 cents per share paid on 17 September 2012 (2011: 115.07 cents) $0.8 million
87.54 cents per share paid on 17 December 2012 (2011: 111.11 cents) $0.8 million
77.63 cents per share paid on 15 March 2013 (2012: 105.50 cents) $0.7 million
83.45 cents per share paid on 17 June 2013 (2012: 104.87 cents) $0.8 million
Dividend announced:
A dividend of 83.45 cents per security for the period 17 June 2013 to 15 September 2013 (inclusive), announced on 18 June 2013, payable 16 September 2013
All dividends were fully franked
$0.8 million
Step-up Preference Share Dividends Paid or Recommended
Dividend paid:
105.00 cents per share paid on 10 July 2012 (2011: 116.00) $1.1 million
94.00 cents per share paid on 10 October 2012 (2011: 118.00) $0.9 million
87.00 cents per share paid on 10 January 2013 (2012: 114.00) $0.9 million
83.00 cents per share paid on 10 April 2013 (2012: 108.00) $0.8 million
Dividend announced:
A dividend of 83.0¢ per security for the period 10 April 2013 to 9 July 2013 (inclusive), announced on 11 April 2013, payable 10 July 2013
All dividends were fully franked
$0.8 million
Reset Preference Share Dividends Paid or Recommended
309.68 cents per share paid on 1 November 2012 (2011: 310.53) $2.8 million
Convertible Preference Share Dividends Paid or Recommended
65.49 cents per share paid on 13 December 2012 (2011: nil) $1.8 million
282.72 cents per share paid on 13 June 2013 (2012: nil) $7.6 million
Annual Financial Report Period ending 30 June 2013
25
Remuneration overview FY2013
This summary provides shareholders a concise overview of the Group’s remuneration outcomes for the 2013 financial year. This overview is unaudited and has not been prepared to comply with accounting standards or statutory requirements. The statutory remuneration disclosures are contained in the Company’s 2013 Remuneration Report.
Non-executive director feesThere was no change to the base non-executive director fee for the year ($165,000 ($412,500 for the Chair)) and there were no additional fee payments for Board committee memberships. The non-executive directors again contributed $5,000 each to fund the Board scholarship for disadvantaged students.
Senior executive base payThe 2013 base pay for senior executives, including the Managing Director, were set by the Board on recommendation of the Governance & HR Committee in August 2012. There were no increases to the fixed remuneration or Short Term Incentive (STI) arrangements with the exception of two senior executives.
Deferred base remunerationDeferred base remuneration is provided in the form of deferred share grants. A deferred share is a fully paid ordinary share issued at nil cost to the senior executive. Deferred shares are beneficially owned by the senior executive from grant date, but are held on trust for a two year deferral period. Vesting of these shares is subject to continued employment with the Company and any adjustment for risk and performance decided by the Board.
Short Term Incentive (STI)In August 2013 the Board, on recommendation of the Governance & HR Committee, decided that the criteria for the establishment of a group STI performance bonus pool had been met for the year and approved the establishment of a group bonus pool for the payment of Short Term Incentive (STI) and bonus payments. One-third of STI awards that exceed a $30,000 threshold are paid as equity in the Company and deferred for two years. The value of the STI cash component received by senior executives for the year are presented in the following table. The value of the deferred equity component for 2013 will be amortised over the two year deferral period (ie 2014 and 2015).
Long Term Incentive (LTI)The Managing Director’s LTI arrangement was set in 2009. Shareholders approved an issue of five equal annual parcels of performance shares to the Managing Director, with the performance periods measured over one to five years (the final performance period ends 30 June 2014). Each annual parcel of performance shares is subject to earnings per share (EPS) and total shareholder return (TSR) tests. The EPS test for the parcel tested on 30 June 2013 was met. The TSR test for the year was partially met and 65 percent of these performance shares vested.
In July 2012 the Board approved new performance share grants for other senior executives. The grants are a single tranche with a four year performance period. The four year performance period consists of a twelve month initial performance period for EPS testing (1 July 2012 to 30 June 2013) and a three year performance period for relative TSR testing (1 July 2013 to 30 June 2016).
Details of the LTI terms including the achievement of performance measures and the number and value of performance shares that vested for the year are presented in the Remuneration Report.

26
The table below sets out the senior executive remuneration arrangements for FY2013 and FY2012.
Senior executive Base pay 1
Deferred base pay 2
Cash bonuses (STI) 3 Deferred STI 4
Performance shares 5 Total
Mike Hirst 2013 $1,242,782 $571,643 $117,333 $50,000 $434,448 $2,416,206
2012 $1,285,106 $596,795 - $50,000 $471,795 $2,403,696
Marnie Baker 2013 $536,708 $50,000 $66,667 $33,332 $22,603 $709,310
2012 $565,967 $169,890 - $33,332 $125,624 $894,813
Dennis Bice 2013 $417,341 $25,000 $50,000 $11,665 $11,302 $515,308
2012 $421,544 $87,684 - $11,665 $67,582 $588,475
John Billington 2013 $423,974 $36,668 $24,000 $16,666 $16,575 $517,883
2012 $427,706 $111,186 - $16,666 $68,798 $624,356
Richard Fennell 2013 $509,201 $50,000 $66,667 $33,332 $22,603 $681,803
2012 $494,184 $167,612 - $33,332 $121,653 $816,781
Russell Jenkins 2013 $517,669 $50,000 $58,667 $26,665 $22,603 $675,604
2012 $487,785 $169,890 - $26,665 $125,624 $809,964
Tim Piper 2013 $415,779 $37,500 $44,000 $20,832 $16,952 $535,063
2012 $432,094 $125,591 - $20,832 $91,038 $669,555
Stella Thredgold 2013 $336,186 $25,000 $30,000 $13,330 $11,302 $415,818
2012 $308,722 $75,805 - $13,330 $46,906 $444,763
Andrew Watts 2013 $392,441 $37,500 $43,333 $16,666 $16,952 $506,892
2012 $426,907 $113,712 - $16,666 $70,361 $627,646
Totals 2013 $4,792,081 $883,311 $500,667 $222,488 $575,340 $6,973,887
2012 $4,850,017 $1,618,165 - $222,488 $1,189,379 $7,880,049
1 Base pay: This is the total amount of cash salary, allowances, non-monetary benefits, company superannuation contributions, notional interest-free loan benefit, annual leave and long service leave paid in the financial year. The amounts also include the movement in annual and long service leave accruals for the year.
2 Deferred base pay: Senior executives’ deferred base pay is made as a grant of “deferred shares”. These are shares held on trust over a deferral period. The amounts of deferred base pay included in the table above represent the accounting fair value of the deferred share grants amortised over the applicable deferral period. A change to a new plan for all senior executives (except the Managing Director) in 2013 has resulted in a significant reduction in the accounting value of their deferred base pay for 2013 because the number of deferred shares granted in 2013 was less than the number of shares of the previous grant (annualised), and the value of the 2013 grant will be amortised over the two year deferral period – FY2013 and FY2014.
3 Cash bonus STI: This is the value of STI payments awarded in cash for the financial year.
4 Deferred STI: In accordance with the Company’s remuneration policy, one-third of total STI awards that exceed $30,000 are subject to deferral into shares in the Company for a two year period. These amounts are the accounting value of the 2011 STI deferred share grants to senior executives amortised over the two year deferral period (being FY2012 and FY2013).
5 Performance Shares: Senior executives’ performance shares are rights to receive shares, subject to minimum EPS and TSR performance conditions. The amounts of performance shares included in the table above represent the accounting fair value of the rights amortised over the applicable performance period. A change to a new plan for all senior executives (except the Managing Director) in 2013 has resulted in a significant reduction in the accounting value of their performance shares for 2013 because the fair value ascribed to the 2013 grant (calculated using option pricing methodology) was lower than the fair value for the previous year and the performance period is longer (four years, instead of three).

Annual Financial Report Period ending 30 June 2013
27
Remuneration Report
This Remuneration Report is for the Company and the consolidated entity (Group) for the year ended 30 June 2013. It forms part of the Directors’ Report. It has been audited. The Remuneration Report explains the approach the Company takes to remuneration for non-executive directors and for senior executives, and details the remuneration provided.
In this report the term “senior executive” is used to refer to all executives who fall within the definition of key management personnel of the Group – ie those persons with authority and responsibility for planning, directing and controlling the activities of the Group, directly or indirectly.
1. Key Management Personnel (KMP)
Name Position Term as KMP
Non-Executive Directors
Robert Johanson Chairman Full Year
Jenny Dawson Director Full Year
Jim Hazel Director Full Year
Jacqueline Hey Director Full Year
Robert Hubbard DirectorFrom: 2 April 2013
David Matthews Director Full Year
Terry O’Dwyer DirectorEnded: 13 August 2012
Deb Radford Director Full Year
Tony Robinson Director Full Year
Managing Director & CEO
Mike HirstManaging Director & Chief Executive Officer
Full Year
Group Executives
Marnie Baker 1 Executive: Banking and Wealth Full Year
Dennis Bice Executive: Retail Banking Full Year
John Billington Executive: Bendigo Wealth Full Year
Richard FennellExecutive: Finance & Treasury (CFO)
Full Year
Russell Jenkins 1 Executive: Customer and Community
Full Year
Tim Piper Executive: Risk Full Year
Stella Thredgold Executive: Corporate Resources Full Year
Andrew Watts Executive: Business Change Full Year
1 On 5th July 2013 the Managing Director announced that Ms Alexandra Tullio had been appointed to the position Executive, Margin Lending reporting directly to the Managing Director. In addition, the following changes to the executive committee were announced on 19 August 2013. Marnie Baker will head up, as a continuing executive member, a new Customer Voice activity that comprises Customer Led Connections, Marketing, Customer Help, Banking Products & Solutions, Access & Payments and the ongoing LINX development. Russell Jenkins ceases as an executive member to take on the role of Co-Chair of the Community Bank® Strategic Advisory Board and to head up a significant Community Bank® project designed to set a shared vision for the Community Bank® model spanning the next 15 years. Robert Musgrove will join the executive and lead the Community Bank®, Community Strengthening, Community Solutions and Partnering and Group Strategy businesses, reporting to the Managing Director.
2. Non-executive director remunerationThe remuneration of non-executive directors is based on the following principles and arrangements. There is no direct link between non-executive directors’ fees and the annual results of the Company. Non-executive directors do not receive bonuses or incentive payments, nor participate in the Company’s employee equity participation plans.
The shareholders approve an aggregate fee pool that includes payments by the Company and its subsidiaries. The current fee pool for non-executive directors of $2,500,000 was approved at the 2011 Annual General Meeting. This fee pool covers the fee payments for the main Board and payments to Company directors on subsidiary Boards and the Community Bank® Strategic Advisory Board. It also covers applicable company superannuation contributions. These amounts are also included in the non-executive director fee disclosures.
The Governance & HR Committee recommends to the Board the remuneration policy and remuneration for non-executive directors. The following considerations are taken into account in setting fees:
(a) The scope of responsibilities of non-executive directors and time commitments. This includes taking into account any changes in the operations of the Company and industry developments which impact director responsibilities, at both the Board and committee level.
(b) Fees paid by peer companies and companies of similar market capitalisation and complexity, including survey data and peer analysis to understand the level of director fees paid in the market by companies of a relatively comparable size and complexity, particularly in the banking and finance sector.
Non-executive directors receive a fixed annual fee, which is reviewed annually. The Chairman receives a higher base fee in recognition of the additional time commitment and responsibilities. No additional fees are paid for serving on Board committees. Additional fees were paid to directors who are also members of the Rural Bank and Sandhurst Trustees Boards or member of the Community Bank® Strategic Advisory Board. The base fee for the reporting period was:
(a) $165,000 for directors (fees were last increased on 1 November 2011 from $143,000 to $165,000)
(b) $412,500 for the chair (two and half times the base fee).
The Board decided to increase the base fee by 2.5 percent in August 2013. The increase is in line with general market movements in director fees.

28
The directors support a Company scholarship fund. This support is generally provided by way of the director forfeiting the amount of the contribution ($5,000 each) so that the director receives a lower base fee and that amount is instead paid into the scholarship fund.
The amounts paid to non-executive directors for the 2012 and 2013 financial years are disclosed in Table 1.
3. Remuneration governanceThe Governance & HR Committee provides assistance to the Board in relation to the Company’s remuneration arrangements. The Board makes all final decisions in relation to those arrangements. The current members of the committee are all independent non-executive directors:
1. Tony Robinson (Chairman)
2. Jim Hazel
3. Robert Johanson
4. Deb Radford
The committee has responsibility for providing input into the Group’s risk framework in relation to remuneration risk, in particular, recommending to the Board the remuneration arrangements for the senior executives (including the Managing Director). Further details of the committee’s responsibilities for remuneration are summarised below and the committee charter is available from the Company’s website.
The committee’s remuneration responsibilities include conducting regular reviews of, and making recommendations to the Board on, the remuneration policy taking into account the Company’s strategy, objectives, risk profile, shareholder interests, regulatory requirements, corporate governance practices and market developments.
The committee is required to determine the persons whose activities, individually or collectively, may affect the financial soundness of the institution, and for whom a significant portion of total remuneration is based on performance (additional management personnel) as required under the remuneration requirements of the Australian Prudential Regulation Authority (APRA).
The committee makes an annual recommendation to the Board on the remuneration of the Managing Director, other senior executives and any non-administrative direct reports to the Managing Director and any additional management personnel. The committee also makes an annual recommendation to the Board on the remuneration of categories of persons covered by the remuneration policy, not addressed above, namely:
(a) Other responsible persons (as defined in APRA’s Prudential Standard APS 520 Fit and Proper).
(b) Risk and financial control personnel.
This includes recommendations on the following:
(a) Changes in the structure of remuneration arrangements.
(b) The basis on which performance based remuneration is provided, including the pool of funds available for distribution as bonuses.
The committee makes recommendations to the Board on the exercise of the Board’s discretion to adjust incentive and performance-based components of remuneration to reflect the outcomes of business activities, the risks relating to those activities and the time necessary for the outcomes of the business activities to be reliably measured. This includes adjusting performance-based components of remuneration downwards, to zero if appropriate, where necessary to protect the financial soundness of the Company or to respond to significant, unexpected or unintended consequences that were not foreseen by the Board.
The committee may consult a professional adviser or expert, at the cost of the Company, if the committee considers it necessary to carry out its duties and responsibilities. No remuneration recommendations were obtained from external consultants in relation to any of the key management personnel during the reporting period.
4. Senior executive remuneration policy and structureThe key features of the Company’s remuneration policy, applicable to remuneration paid in FY2013, are set out below. The Board has sought to maintain a remuneration framework that provides the desired flexibility and reward structure to support the Company’s strategy whilst recognising the need to provide remuneration arrangements aligned with shareholder interests and senior executive roles, responsibilities and market relativities. The following principles apply to the remuneration framework at both an organisational and divisional level:
(a) Remuneration should facilitate the delivery of superior long term results for the business and shareholders and promote sound risk management principles.
(b) Remuneration should support the corporate values and desired culture.
(c) Remuneration should promote behaviour that meets customers’ reasonable expectations and protects their interests.
(d) Remuneration should support the attraction, retention, motivation and alignment of the talent we need to achieve our business goals.
(e) Remuneration should reinforce leadership, accountability, teamwork and innovation.
(f) Remuneration should be aligned to the contribution and performance of the businesses, teams and individuals.

Annual Financial Report Period ending 30 June 2013
29
4.1 Remuneration componentsThe terms of employment for all senior executives contain the following components:
a. Base pay comprising:
» Fixed base remuneration (includes any salary sacrifice arrangements and Company superannuation)
» Deferred base pay (annual grants of deferred shares); and
b. Performance based “at-risk” pay comprising:
» Short Term Incentive - payment that is subject to annual Company performance,
» Long-Term Incentive - involving grants of performance shares subject to long term performance and service conditions.
The details of senior executive remuneration payments for the 2013 and 2012 financial years are disclosed in Table 2 and Table 3.
4.2 Changes in remuneration mixCommencing for FY2013, the Board established a new equity based remuneration component for senior executives.
The remuneration mix for senior executives is made up of fixed base, deferred base, STI and LTI components. Deferred base pay, deferred STI and LTI are equity based to ensure alignment with the interests of shareholders. These changes did not apply to the Managing Director as his remuneration is governed by a separate arrangement which corresponds with the first five years of his fixed term contract (entered into in 2009).
4.3 Fixed base remunerationFixed remuneration in the form of base pay is designed to reflect the value the senior executive provides to the Group including the skills and competencies needed to generate targeted results, their sustained contribution to the team and Group and the value of the role and contribution of the individual in the context of the external market. Senior executive base remuneration is reviewed annually and is set having regard to the need to attract, motivate and retain the appropriate executive management.
In setting the remuneration of senior executives, the Board takes into account general market and peer information, as well as the experience and expertise of the individual relative to their respective role and responsibilities and with a view to maintaining a moderate market positioning for senior executive remuneration. There were no increases to the fixed remuneration arrangements for senior executives for the year with the exception of two senior executives who received increases in recognition of additional responsibilities and workload.
4.4 Deferred base pay (deferred share grants)Annual grants of deferred shares are made to senior executives as part of their base pay that are subject to service and risk adjustment conditions. Deferred base pay was introduced to further align the remuneration of senior executives with the interests of shareholders by exposing an additional percentage of senior executive remuneration to the market value of the Company’s shares.
The deferred shares are fully paid ordinary shares granted at no cost to the recipient. They have no exercise price and are beneficially owned by the senior executive from the grant date but held on trust for two years by the plan trustee, subject to the below vesting conditions. The recipient is entitled to vote and to receive any dividend, bonus issue, return of capital or other distribution made in respect of vested deferred shares.
1. Service condition – continued employment for the two years from the beginning of the financial year in respect of which the grant is made; and
2. Risk adjustment – any adjustment the Board decides to make to take into account the outcomes of business activities and the risks related to the business activities.
Details of deferred share grants made by the Company are disclosed in Tables 4, 5 and 6.
4.5 Short Term IncentiveThe senior executive remuneration packages include an annual incentive component that is awarded in cash and deferred equity in the Company. The incentive is designed to reward the achievement of annual financial and business goals, taking into account risk management and compliance, and senior executive contributions to longer term growth and performance. The senior executive STI components for the 2013 financial year did not increase on the previous year. The STI component is subject to the achievement of quantitative and qualitative performance measures.
The Board determined that the criteria for establishment of a Group performance bonus pool had been met and a bonus pool was established for the 2013 financial year. Further information on the structure of STI arrangements, performance measures and STI payments for the year are disclosed in Section 5 and Table 3.
4.6 STI deferral and forfeitureSTI remuneration is subject to deferral as set out below.
(a) One-third of STI awards that exceed the $30,000 threshold ($50,000 for FY2014) set by the Board are subject to deferral;
(b) Deferral is for two years from the end of the financial year for which the STI is granted;
(c) The amount deferred is converted into shares in the Company;
(d) The participant is entitled to vote and receive dividends on the deferred equity.
Forfeiture of the STI deferred component occurs if an employee resigns or, if an employee acts fraudulently or dishonestly and in other cases decided by the Board (for example, due to an adjustment for risk).

30
4.7 Long-Term Incentive (performance share grants)LTI is discretionary equity-based remuneration designed to drive and reward long-term growth and sustained Company value, aligning the interests of shareholders and senior executives. At the Board’s discretion, the Managing Director and other senior executives may be invited to participate in long-term incentive plans involving grants of performance shares. The grants are subject to long-term performance and service conditions and are designed to link senior executive reward with key performance measures that underpin sustainable longer term growth in shareholder value.
The following long-term incentive arrangement is in place.
Salary sacrifice, deferred share and performance share plan
Established 2008
Status Current - First grant made in December 2009.
ParticipantsSenior executives (including the Managing Director) and other senior management approved by the Board.
Nature of grants
Grants of performance shares subject to performance and service conditions set by the Board. If the performance or service conditions are not satisfied during the performance periods, the performance shares lapse and the senior executives receive no value from the grants.
Further information on the structure of LTI arrangements for the Managing Director and senior executives is presented at Section 6 and Tables 4, 5 and 6.
4.8 Risk adjustment: STI & LTIThe Board has discretion to adjust variable remuneration (Deferred Shares, STI and LTI) to reflect the following:
(a) The outcomes of business activities.
(b) The risks related to the business activities taking account, where relevant, the cost of the associated capital.
(c) The time necessary for the outcomes of those business activities to be reliably measured.
This includes adjusting performance-based components of remuneration downwards, to zero if appropriate.
4.9 Mix of remuneration componentsThe following table sets out the senior executive remuneration mix for FY2013. The ‘at-risk’ components for senior executives vary depending on their role and ability to influence the Company’s performance and financial standing.
Fixed Base 1
Deferred Base Pay 2
STI 3 (Cash paid)
STI 3 (Deferred) LTI 4
Mike Hirst 47% 19% 10% 5% 19%
Marnie Baker 52% 9% 14% 7% 18%
Dennis Bice 62% 8% 10% 5% 15%
John Billington 52% 9% 14% 7% 18%
Richard Fennell 50% 10% 14% 7% 19%
Russell Jenkins 49% 10% 14% 7% 20%
Tim Piper 58% 12% 8% 4% 18%
Stella Thredgold 58% 8% 11% 6% 17%
Andrew Watts 53% 9% 13% 6% 19%
1 Fixed comprises base cash salary, salary sacrifice, superannuation and allowances,
2 For senior executives, grants of deferred shares subject to continued service and risk adjustment conditions. For the Managing Director, the percentage represents the service component of the 2009 performance share grant.
3 These amounts are subject to performance levels being achieved in relation to values, risk and performance.
4 These amounts are subject to target performance levels being achieved and continued service with the Company.
4.10 HedgingA member of key management personnel and their closely related parties may not enter into a transaction designed to remove the at-risk element of the equity before it has vested. This also applies to the at-risk element of equity after it has vested, if it is subject to a holding lock. These restrictions are in the staff trading policy and remuneration policy.
The Company treats compliance with these policies as important. At the end of each financial year, the Company requires a confirmation from each participant in the plan that they have complied with these restrictions. If an employee breaches either of these restrictions the employee forfeits all variable remuneration in the form of equity that is subject to the prohibition at the time of the breach.
4.11 Margin loan facility restrictionThe staff trading policy also prohibits designated officers, including non-executive directors and senior executives, from using the Company’s securities as collateral in any margin loan arrangements.

Annual Financial Report Period ending 30 June 2013
31
5. STI specific arrangements and measures
5.1 Setting annual STI components and measures The maximum potential STI component for senior executives (including the Managing Director) is set by the Board at the start of each financial year. In setting the potential STI component the Board takes into account market data and the senior executive’s role and responsibilities. The objective is to link a reasonable proportion of senior executive remuneration with the Company’s annual performance and the achievement of short and medium term results and business priorities that enhance the future prospects of the Company. The STI is set at a level that does not encourage inappropriate behaviour and short-term risk taking.
5.2 Group bonus pool allocationThe payment of STI awards to senior executives (including the Managing Director) may be adjusted at a number of levels for performance as well as financial and risk outcomes. In the first instance, the payment of STI awards to senior executives is dependent on the Group bonus pool established for the payment of STI awards and bonuses to group employees.
At the start of each year the Board sets the minimum level of Company performance to be achieved before a bonus pool will be established. The Board also sets the parameters used to determine the amount of funds allocated to the Group bonus pool if the minimum level of performance is exceeded. The parameters are structured so that the aggregate amount that can be allocated to the bonus pool is capped.
For the 2013 financial year the minimum level of performance and bonus pool allocation parameters set by the Board were based on the Company’s cash earnings performance. The Board also set the financial and risk measures that were used to adjust, at the discretion of the Board, any bonus pool allocation calculated using the cash earnings formula. The adjustment is to reflect the types and levels of risk involved in achieving the performance and take into account financial measures including the achievement of targeted return on equity performance, capital ratios, liquidity ratios and the Company’s risk weighted asset base. The Board selected these measures to provide a balance between growth, shareholder returns and the management of key risks associated with the Company’s business activities.
The Board decision, based on a recommendation from the Governance & HR Committee, takes into account the Company’s cash earnings performance and the achievement of other financial outcomes and risk targets set by the Board at the start of the year.
For the 2013 financial year the Board established a bonus pool. The bonus pool was 44 percent of the maximum capped amount.
5.3 STI performance assessments and payments The payment of individual STI awards to senior executives and other participants is at the discretion of the Board, taking into account the Company’s capacity under the bonus pool to pay STI awards to both general staff and senior executives. Depending on the bonus pool allocation determined by the Board, the potential maximum STI awards to senior executives may be adjusted downwards proportionately by the Board to reflect the Company’s capacity to pay bonus to general staff and executives.
At an individual level, the payment of STI awards is based on the achievement of Group financial targets and individual executive performance including business unit performance, the individual’s contribution to team performance and their contribution to meeting risk and compliance requirements at a Group, team and individual level. Further details are provided at Sections 5.4 and 5.5.
The performance conditions are measured shortly after Board approval of the Company’s year-end profit result announcement. The achievement of the cash earnings measure for the Managing Director and senior executives is measured on the basis of the Company’s reported cash earnings, adjusted at the Board’s discretion, for key financial and risk outcomes. This method of assessment has been chosen because it represents an objective measure of earnings performance while enabling the Board to exercise its discretion for financial and risk outcomes arising from the Company’s business activities.
The non-executive directors conduct the assessment of the Managing Director’s performance with reference to the quantitative and qualitative measures set by the Board at the start of the year. Taking into account the Group bonus pool available for the payment of STI awards and bonuses to Group employees, the Board will decide the amount of the STI based upon the achievement of the agreed performance measures. This allows for independent and objective assessment of the achievement of performance measures while enabling any necessary risk adjustments to occur at the Board’s discretion.
The Managing Director assesses the performance of other senior executives and recommends the annual STI payments for senior executives for consideration by the Governance & HR Committee and decision by the Board. In making the recommendation, the Managing Director also takes into account the Group bonus pool available for the payment of STI awards and bonuses to Group employees. This method of assessment has been chosen as the Managing Director is best placed to make an informed assessment of senior executive performance and progress towards performance targets, while the Board retains ultimate oversight for the grant of STI awards and any necessary risk adjustments.

32
5.4 Specific measures - Managing DirectorThe Board set the Managing Director’s maximum STI award for FY2013 at $400,000. This was set taking into account the considerations outlined above and the target remuneration mix for the Managing Director.
The Board determines the Managing Director’s STI award for the year by reference to a mix of quantitative and qualitative performance measures. The quantitative element, weighted at 50 percent, focused on the Group’s achievement of targeted cash earnings performance adjusted for financial and risk outcomes including return on equity, cash EPS, capital, liquidity and credit quality performance. This measure was chosen to link the Managing Director’s performance to improved Company performance. The qualitative element, weighted at 50 percent, was chosen to focus on the continued progress of the Group’s strategic priorities. The qualitative measures are:
Measure Description
1. Achievement of Business Goals
Prioritising and allocating resources to the strategic objectives and operational plans and the delivery of benefits identified in operational plans.
2. Risk and Compliance
The level of risk associated with the Group’s performance was within the Group’s risk appetite. An effective risk culture is promoted and maintained and progress plans are in place to achieve Basel II advanced accreditation.
3. Customer satisfaction and advocacy
Maintaining the organisation’s customer satisfaction and advocacy ratings at existing levels.
4. People Capability A pool of potential successors is available for senior executive positions and diversity targets are on track.
5. Scale and Rating Advantage
Implementation of growth initiatives and opportunities that deliver scale advantage and support a ratings upgrade.
6. Representation of the Organisation
Represent the organisation at Federal and State political levels, industry forums, conferences or other public forums.
For the 2013 financial year the Board determined that the Managing Director met all of the above quantitative and qualitative performance measures and, taking into account the bonus pool established by the Board, awarded an STI payment of $176,000.
5.5 Specific measures - other senior executivesThe performance objectives and measures for individual executives include:
(a) Group financial and strategic performance – net profit after tax, cash earnings per share, return on equity, liquidity and capital ratios and arrears performance;
(b) Business unit (team) financial and strategic performance – achievement of division or business unit growth and financial performance targets, implementation of specific business initiatives and projects in line with project targets and timeframes, independent industry focused customer satisfaction and advocacy rankings and customer and community engagement initiatives;
(c) Individual contribution to team performance – achievement of overall division or business unit targets and business and risk objectives, assessment of extent to which a “one-team” culture has been promoted, assessment of continuous improvement in processes and procedures;
(d) Individual performance, including alignment with corporate values and meeting performance objectives – assessment of leadership, management of business unit resourcing and compliance with corporate values and code of conduct; and
(e) Contribution to meeting risk and compliance requirements at the Group, team and individual level.
Risk and compliance requirements also represent a gateway to whether a payment is made and the size of the payment. Notwithstanding financial performance and the individual’s contribution and performance, if the individual, team or Group does not meet or only partially meets risk and compliance requirements, no award or a reduced award may be made. The measures include compliance with risk management and operational policies and procedures.

Annual Financial Report Period ending 30 June 2013
33
6. LTI specific measures and conditions
6.1 Managing DirectorThe Managing Director’s long term incentive arrangements were set in 2009. Shareholders approved an issue of five equal annual parcels of performance shares to the Managing Director at the 2009 AGM, with the performance periods measured over one to five years (the final performance period ends 30 June 2014). Each tranche comprises two components or grants:
(a) Grant A - 50 percent of each annual tranche is subject to an EPS gateway hurdle, requiring an increase in the cash EPS performance of the Company for the performance period. If that hurdle is met, the grant is then subject to a TSR performance hurdle.
(b) Grant B - The other 50 percent of each annual tranche is subject to continuing service with the Company.
The vested shares are subject to a dealing restriction and the Managing Director is not entitled to sell, transfer or otherwise deal with the shares until the later of two years after the end of the tranche’s performance period and the date specified in the offer. In setting the five year performance period (and the additional dealing restriction) the Board took into account the initial five year term of the Managing Director’s contract (July 2009 – July 2014) and the importance of rewarding the Managing Director for taking a longer-term perspective on the Company’s progress and performance.
In setting the remuneration value of the entitlement, the Board included a component that was subject to continued service with the Company. This took into account the moderate market setting of the Managing Director’s remuneration. It was intended to provide the Managing Director with a further ownership stake in the Company aligned with shareholder interests. This component represents a deferred part of the Managing Director’s fixed reward linked to the long term performance of Company and the interests of shareholders.
The performance shares were issued at market price to the value of $5 million (representing an annualised amount over each of the five years of $1 million). The market price was based on the volume weighted average price of the Company’s shares traded on the ASX for the 5 days before 1 July 2009 (being $6.56). The vesting of the performance shares in Grant A is subject to a gateway cash EPS hurdle. The gateway hurdle will be met if there is an increase in the Company’s cash EPS performance during the financial year immediately before vesting for each tranche (ie the final year of the performance period for that tranche).
The second performance condition is based on the Company’s market relative TSR performance over the performance period. To the extent that the performance conditions attaching to performance shares granted under the plan are not satisfied at the end of the relevant tranche’s performance period, the performance shares that do not vest will be carried forward and retested. Performance shares that do not vest will be treated as forming part of the following tranche and will be tested together with other performance shares at the end of the following tranche’s performance period.
The Board believes that retesting in these circumstances is appropriate because it ensures that senior executives are not disadvantaged by short-term average performance over a longer-term period of strong performance. Having regard to the service and performance conditions, the potential minimum value is nil.
The maximum number of shares that may be acquired by the Managing Director is equal to the number of performance shares issued, being 762,190. Performance shares granted to the Managing Director under the plan vest in accordance with the following table provided the cash EPS gateway condition has been met.
Company’s TSR ranking against TSR of peer group
Percentage of performance shares that vest
TSR below 50th percentile Nil
TSR between 50th percentile and 75th percentile
65%
TSR above 75th percentile 100%

34
The Managing Director is entitled to vote and to receive any dividend, bonus issue, return of capital or other distribution made in respect of shares allocated on vesting of the performance shares. Dividends paid on vested performance shares are reinvested into shares in the Company (less an amount distributed to the Managing Director to meet tax obligations on the dividends) and are held in trust on the same terms as the performance shares during the dealing restriction period. Following is a summary of the grants and vesting results to date:
Performance shares (number) Fair value Performance period Outcome to date
Tranche 1 Grant A 10%
Grant B 10%
76,219
76,219
$7.19
$8.56
1 year (1 July 2009 to 30 June 2010)
No of shares vested: 125,761
Grant A – 49, 542
Grant B – 76, 219
Value at time of vesting: $8.18 per share
No of shares carried into next tranche: 26,677 (from Grant A)
Tranche 2 Grant A 10%
Grant B 10%
76,219
76,219
$6.61
$8.19
2 years (1 July 2009 to 30 June 2011)
No of shares vested: 143,102
Grant A – 66,883
Grant B – 76, 219
Value at vesting time: $8.86
No of shares carried into next tranche: 36,013 (from Grant A)
Tranche 3 Grant A 10%
Grant B 10%
76,219
76,219
$6.19
$7.83
3 years (1 July 2009 to 30 June 2012)
No of shares vested: 76,219
Grant A – Nil
Grant B – 76, 219
Value at vesting time: $7.30
No of shares carried into next tranche: 112,232 (from Grant A)
Tranche 4 Grant A 10%
Grant B 10%
76,219
76,219
$5.70
$7.50
4 years (1 July 2009 to 30 June 2013)
No of shares vested: 198,712
Grant A – 122,493
Grant B – 76, 219
Value at vesting time: $10.07
No of shares carried into next tranche: 65,958 (from Grant A)
Tranche 5 Grant A 10%
Grant B 10%
76,219
76,219
$5.02
$7.17
5 years (1 July 2009 to 30 June 2014)
n/a

Annual Financial Report Period ending 30 June 2013
35
6.2 Other senior executivesThe Board has implemented a new LTI for other senior executives. Commencing in the 2013 financial year, other senior executives receive annual LTI grants of performance shares (rather than the previous multi-tranche grants every 3 years). The first annual LTI grant was made in August 2012 as a single tranche with a four year performance period.
The four year performance period will consist of a 12 month initial performance period for EPS testing (1 July 2012 to 30 June 2013) and a three year performance period for relative TSR testing (1 July 2013 to 30 June 2016).
> EPS hurdle: The grant will be reduced by 50 percent at the end of the initial performance period if the cash earnings per share are not equal to or better than the cash earnings per share for the previous year.
> TSR hurdle: During the 3 year TSR performance period, vesting of the performance shares (as adjusted for the EPS performance hurdle) will be conditional on TSR being at least equal to the median performance of a peer group consisting of the ASX100 companies (excluding property trusts and resources). Median performance will result in 65 percent of the performance shares vesting, with 100 percent vesting if the Company’s relative TSR performance is 75 percent or above.
The performance shares are also subject to the senior executive’s continued employment with the Company for the performance period and notification from the Board whether, and to what extent, the performance conditions have been met including to what extent performance shares have vested. There is no dealing restriction on vested shares.
6.3 LTI - GeneralEach performance share represents an entitlement to one ordinary share in the Company. Accordingly, the maximum number of shares that may be acquired is equal to the number of performance shares issued (subject to the vesting conditions being met). Performance shares are granted at no cost to the recipient and have no exercise price.
The performance measures selected for LTI arrangements are the Company’s cash EPS performance and TSR performance. The EPS hurdle is used because it is a fundamental indicator of financial performance, both internally and externally, and links directly to the Company’s long-term objective of growing earnings. The EPS hurdle ensures improvement in the Company’s performance and capital efficiency is achieved before any performance shares can vest.
The TSR hurdle is used because it aligns shareholder return with reward for the Managing Director and senior executives and provides a relative, external market performance measure, having regard to the TSR performance of other companies in a comparator group. For the purpose of the grants under the plan, the comparator group is the ASX 100 Accumulation Index (excluding the Company, property trusts and resources). This group was chosen because it is frequently used by listed companies and there are insufficient companies of comparable size in the banking or financial services sector alone to benchmark against performance of an industry-specific group.
The Company also has a loan-based limited recourse employee share ownership plan (ESOP) that was open to general staff and senior executives (including the Managing Director) and was previously used by the Company as the long-term incentive arrangement. Information on the ESOP, including share grants and loan details are disclosed at Notes 37 and 39 of the Annual Financial Report. This plan is no longer open to the Managing Director and other senior executives.
7. Company performanceThe Company announced on 19 August 2013 a statutory after-tax profit of $352.3 million. The Company’s cash earnings result was $348 million, a 7.7 percent increase on the previous financial year. The cash earnings result equated to 85.4 cents per share and represents a 1.4 percent increase on the previous financial year. Information on the Company’s share price performance is presented below.
The performance represents a solid result in difficult trading conditions. Consumer confidence and demand for credit remain low and the level of competition for retail deposits remains high. The result included improvement in a number of profitability and efficiency measures including net profit, cash earnings, net interest margin, dividend paid, earnings per share, return on equity and cost to income ratio. The Company also produced above-system asset growth across a range of portfolios.
The Company recorded an 8.1 percent increase in net interest income to $1,027.5 million and the interest margin before payments to Community Bank® companies and alliances increased from 2.11 percent to 2.21 percent. Net of these payments, interest margin increased by 8 basis points to 1.86 percent for the 12 months ended 30 June 2013. Cost containment and efficiency has again been a major focus over the year. Expenses before specific items increased by 3.6 percent to $779 million compared to June 2012. The cost to income ratio was 57 percent compared to 59.1 percent at June 2012. Further information on the Company’s operations and performance is presented in the Review of Operations and Operating results.
Financial year ending
Company performance measure June 2013 June 2012 June 2011 June 2010 June 2009
Basic earnings per share (cents) 84.9 48.6 91.5 67.4 25.4
Cash earnings per share (cents) 85.4 84.2 92.3 83.3 62.6
NPAT ($m) 352.3 195.0 342.1 242.6 83.8
Cash earnings ($m) 348.0 323.0 336.2 291.0 181.5
Dividends paid (cents per share) 61.0 60.0 60.0 58.0 43.0
Share price at start of financial year $7.41 $8.86 $8.18 $6.95 $10.93
Share price at end of financial year $10.07 $7.41 $8.86 $8.18 $6.95
Absolute shareholder return 44% (9.6%) 16% 26% (32%)

36
The following graph shows the cash earnings per share over the past year and four previous years, with the average STI payment (as a percentage of the maximum STI) paid to senior executives, which demonstrates the relationship between performance and STI payments.
The following graph compares the Company’s total shareholder return (TSR) against the ASX 100 Accumulation Index for the past five years (explained in section 3.5.3(b)). The ASX 100 is the comparator group against which the Company’s TSR performance is measured for the current long term incentive plan.
TSR BEN vs ASX Accumulation Index
Total return basis index July 2008 = 100 (source: Bloomberg)
The table and graph illustrates the progress in the key performance indicators used by the Board to measure and compare the Company’s year-on-year performance over the past five years.
The Board determined that the criteria to establish a Short- Term Incentive (STI) bonus pool was met for the 2013 financial year. In addition, having regard to the Company’s financial performance, the achievement of business objectives, the satisfaction of compliance and risk measures and individual performance, the Board approved STI awards to senior executives for the year. The value of STI bonuses paid to senior executives for the year is presented in Table 3.
The Company uses cash EPS and market relative TSR performance as the key performance indicators for the LTI. In relation to the Managing Director’s LTI arrangement, the Company’s market relative TSR performance exceeded the median for the 2013 performance period and as the EPS gateway hurdle was also met, 65 percent of the performance shares that are subject to these performance measures vested. The performance shares that did not vest have been carried forward for testing as part of the final tranche tested at 30 June 2014. The performance shares subject to the service condition also vested for FY2013.
The LTI arrangement for other senior executives involved a four year performance period consisting of an initial twelve month performance period for EPS testing and a three year performance period for relative TSR testing. The grant is to be reduced by 50 percent at the end of the initial performance period if the earnings per share performance is not equal to or better than the previous year. The EPS test for the parcel tested on 30 June 2013 was met and accordingly 100 percent the performance shares have been carried forward for testing over the three year TSR performance period. None of the performance shares have vested or lapsed.
Cash EPS (cents) Average STI payment (as a % of maximum STI)
2009
100
90
80
70
60
50
40
30
20
10
02010 2011 2012 2013
BEN ASX 100 AI
Jul-08 Jan-09 Jul-09 Jan-10 Jul-10 Jan-11 Jul-11 Jan-12 Jul-12 Jan-13 Jul-13
160
140
120
100
80
60
40
20
0
Cash
EPS
(Cen
ts)
Perc
enta
ge o
f max
imum
STI
pai
d to
sen
ior e
xecu
tives

Annual Financial Report Period ending 30 June 2013
37
9. Senior executive termination arrangementsThe remuneration and other terms of employment for senior executives are contained in contracts. The material terms of the contracts for the senior executives at the date of this report are set out below.
Issue Description Applies to
What is the duration of the contracts? Fixed term of five years from 2009 (extended in 2013 to 2016), subject to the termination provisions summarised below, and then continuing unless otherwise agreed by the Company or Managing Director.
Managing Director
On-going until notice is given by either party. Senior executives (a)
What notice must be provided by a senior executive to end the contract without cause?
12 months’ notice. No notice period required if material change in duties or responsibilities.
Managing Director
6 months’ notice. No notice period required if material change in duties or responsibilities. All senior executives (a)
What notice must be provided by the Company to end the contract without cause? (b)
12 months’ notice or payment in lieu. All senior executives (a)
What payments must be made by the Company for ending the contract without cause?
Payment of gross salary in lieu of period of notice (including payment of accrued / unused leave entitlements calculated to end of relevant notice period).
Senior executives
What are notice and payment requirements if the Company ends the contract for cause?
Termination for cause does not require a notice period. Payment of pro-rata gross salary and benefits (including payment of accrued / unused leave entitlements) is required to date of termination.
Senior executives
Are there any post-employment restraints? 12 month non-competition and non-solicitation (employees, customers and suppliers) restriction.
Managing Director
12 month non-solicitation (employees, customers and suppliers) restriction. Senior executives
Number of Performance Shares
1st Performance Period (EPS Measure)
2nd Performance Period (TSR Measure) Service Condition Dealing Restriction
Tranche 176,219 30.06.2014 –
30.06.201501.07.2013 –
30.06.201601.07.2013 –
30.06.201601.07.2016 -
01.07.2017
Tranche 276,219 30.06.2015 –
30.06.201601.07.2013 –
30.06.201601.07.2013 –
30.06.201601.07.2016 -
01.07.2017
(a) This does not include Mr Dennis Bice. Mr Bice is employed by the Company (over 35 years) and under his employment contract is currently entitled to 99 weeks notice or payment in lieu.
(b) In certain circumstances, such as a substantial diminution of responsibility, the Company may be deemed to have ended the employment of a senior executive and will be liable to pay a termination benefit as outlined at the row titled “What payments must be made by the Company for ending the contract without cause”.
8. Proposed changes to Managing Director’s remunerationEarlier this year, the Company announced that the Managing Director’s contract had been extended by two years, from 2014 to 2016. The LTI granted to the Managing Director in 2009 completes at the end of the 2014 financial year.
From 1 July 2014 the Board is seeking to align the Managing Director’s arrangements with the deferred base remuneration and LTI arrangement for other senior executives.
The Board will seek shareholder approval at the 2013 Annual General Meeting for proposed equity grants to the Managing Director under the Employee Salary Sacrifice, Deferred Share and Performance Share Plan for the two year contract extension.
The total number of deferred shares and performance shares to be granted for each additional year of the contract is the same number of performance shares that were granted to the Managing Director under each annual tranche for the current LTI.
It is proposed that 152,438 deferred shares will be granted as deferred base pay. The deferred shares will be issued at no cost and a nil exercise price. The deferred shares will be subject to a two year continued service condition and a risk adjustment condition. An additional one year dealing restriction will also apply to vested deferred shares. The deferred shares will be beneficially owned by the Managing Director from the grant date, but will be held on trust by the plan trustee for the three year service and restriction period.
It is proposed that 152,438 performance shares in two tranches will be granted as set out below. Each tranche of the performance share grant will be subject to a three year performance period consisting of a twelve month performance period for cash EPS testing and a three year performance period for market relative TSR testing. The details of the proposed grants including terms and conditions will be included in the 2013 Notice of Annual General Meeting.

38
Table 1: Non-Executive Director Remuneration PaidThe following payments were made to non-executive directors in the 2012 and 2013 financial years.
Short-term benefitsPost-employment
benefits
Fees 1 Non-monetary benefits 2
Superannuation contributions 3 Total
Robert Johanson 5 (Chairman) 2013
2012
$501,644
$443,763
$3,850
-
$20,619
$39,939
$526,113
$483,702
Kevin Abrahamson 4 2013
2012
-
$6,000
-
$38,000
-
$3,960
-
$47,960
Jenny Dawson 5 2013
2012
$250,000
$243,231
-
-
$22,500
$21,891
$272,500
$265,122
Jim Hazel 5 2013
2012
$245,186
$238,417
-
-
$22,067
$21,458
$267,253
$259,875
Jacquie Hey 4 2013
2012
$165,000
$154,085
-
-
$14,850
$13,868
$179,850
$167,953
Robert Hubbard 4 2013
2012
$37,443
-
-
-
$3,370
-
$40,813
-
David Matthews 5 2013
2012
$195,000
$188,231
-
-
$17,550
$16,941
$212,550
$205,172
Terry O’Dwyer 4 2013
2012
$19,039
$158,231
-
-
$1,713
$14,241
$20,752
$172,472
Deb Radford 2013
2012
$165,000
$158,231
-
-
$14,850
$14,241
$179,850
$172,472
Tony Robinson 2013
2012
$142,206
$135,437
$22,794
$22,794
$14,850
$14,241
$179,850
$172,472
Aggregate totals 2013
2012
$1,720,518
$1,725,626
$26,644
$60,794
$132,369
$160,780
$1,879,531
$1,947,200
1 Fee amounts include the $5,000 director contribution to the Board scholarship program for FY2012 and FY2013.
2 Represents fee sacrifice component of base director fee amount paid into superannuation.
3 Company superannuation contributions.
4 Appointments: Mr Hubbard was appointed on 2 April 2013, Ms Hey was appointed on 5 July 2011.
Retirements: Mr Abrahamson retired on 24 October 2011 and Mr O’Dwyer retired on 13 August 2012.
5 Subsidiary fees: Fees were paid by Rural Bank Limited to Mr Johanson of $70,186 for FY2013 ($70,186 for FY2012) and Mr Hazel of $80,186 for FY2013 ($80,186 for FY2012). The fees paid to Ms Dawson for FY2013 and FY2012 include an additional fee of $85,000 as chair of Sandhurst Trustees Ltd. The fees paid to Mr Matthews include $30,000 for FY2012 and FY2013 for his role as Member of the Community Bank® Strategic Advisory Board. In addition, the base fee payments to Mr Johanson include an additional $22,808 paid in lieu of the difference between the company superannuation payable at 9 percent and the current superannuation contribution limit.

Annual Financial Report Period ending 30 June 2013
39
Table 2: Senior Executive Remuneration PaidThe remuneration paid to senior executives for the 2013 and 2012 financial years is set out in the table below.
Short-term Employee Benefits
Super-annuation benefits 5
Other long-term benefits 6
Share-based payments 7
TotalSenior executiveCash
salary 1
Cash bonuses
(STI) 2
Non-Monetary benefits 3 Other 4
Performance shares 8
Deferred shares 9
Mike Hirst 2013
2012
$1,167,494
$1,184,484
$117,333
-
$31,308
$26,491
$7,579
$10,920
$16,470
$40,000
$19,931
$23,211
$1,006,091
$1,068,591
$50,000
$50,000
$2,416,206
$2,403,697
Marnie Baker 2013
2012
$479,496
$477,146
$66,667
-
$26,894
$42,902
$5,719
$8,584
$16,470
$22,383
$8,129
$14,952
$22,603
$295,514
$83,333
$33,332
$709,311
$894,813
Dennis Bice 2013
2012
$385,654
$356,697
$50,000
-
$6,340
$14,664
$2,714
$4,057
$16,470
$33,826
$6,163
$12,300
$11,302
$155,267
$36,663
$11,665
$515,306
$588,476
John Billington 2013
2012
$407,504
$406,196
$24,000
-
-
$5,736
-
-
$16,470
$15,774
-
-
$16,575
$179,984
$53,334
$16,666
$517,883
$624,356
Richard Fennell 2013
2012
$486,679
$461,947
$66,667
-
$6,052
$9,898
-
-
$16,470
$22,339
-
-
$22,603
$289,265
$83,333
$33,332
$681,804
$816,781
Russell Jenkins 2013
2012
$466,115
$420,317
$58,667
-
$21,987
$42,562
$5,726
$8,746
$16,470
$22,584
$7,371
($6,424)
$22,603
$295,514
$76,666
$26,665
$675,605
$809,964
Tim Piper 2013
2012
$363,114
$371,818
$44,000
-
$7,310
$15,431
-
-
$16,470
$33,815
$28,885
$11,030
$16,952
$216,629
$58,332
$20,832
$535,063
$669,555
Stella Thredgold 2013
2012
$296,104
$270,737
$30,000
-
$11,734
$6,896
-
-
$16,470
$23,239
$11,878
$7,850
$11,302
$122,711
$38,329
$13,330
$415,817
$444,763
Andrew Watts 9 2013
2012
$360,297
$359,584
$43,333
-
$29,326
$32,016
$1,257
$1,972
$16,470
$22,888
($14,909)
$10,447
$16,952
$184,073
$54,166
$16,666
$506,892
$627,646
Aggregate totals 2013
2012
$4,412,457
$4,308,926
$500,667
-
$140,951
$196,596
$22,995
$34,279
$148,230
$236,848
$67,448
$73,366
$1,146,983
$2,807,546
$534,156
$222,488
$6,973,887
$7,880,049
1 Cash salary amounts include the net movement in the KMP’s annual leave accrual for the year.
2 These amounts represent STI cash awards to senior executives for the 2013 financial year. The cash component is expected to be paid in September 2013. In the case of FY2012, no STI was awarded given earnings performance did not meet the minimum criteria set by the Board. Refer also to footnote 9 below for discussion on the deferral of STI components.
3 “Non-monetary” relates to sacrifice components of KMP salary such as superannuation contributions and motor vehicle costs.
4 “Other” relates to the notional value of the interest free loan benefit provided under the Group’s employee share plans. A notional benefit is calculated using the average outstanding loan balance and the Company’s average cost of funds. Details on loans provided to the senior executive under the employee share plans are disclosed in the Annual Financial Report at Note 39.
5 Represents superannuation contributions made on behalf of key management personnel. The amounts represent the current superannuation contribution limit. The cash salaries of senior executives include an additional payment in lieu of the difference between the superannuation contribution payable at 9% and the current contribution limit.
6 The amounts disclosed relate to movements in long service leave entitlement accruals.
7 In accordance with the requirements of Australian Accounting Standards, remuneration includes a proportion of the fair value of equity compensation granted or outstanding during the year. The fair value of equity instruments which do not vest during the reporting period is calculated as at the grant date and is progressively allocated over the vesting period. The amount included as remuneration is not related to or indicative of the benefit (if any) that individual senior executives may ultimately realise should the equity instruments vest. The fair value of performance shares as at the date of their grant has been calculated under AASB 2 Share based payments applying a Black-Scholes-Merton valuation method incorporating a Monte Carlo simulation option pricing model to estimate the probability of achieving the Total Shareholder Return hurdle and the number of options and performance shares vesting. The assumptions underpinning these valuations are set out in Table 4 of this report.
8 The amortised value of performance shares as a percentage of total remuneration was: M Hirst 42% (2012: 45%), M Baker 3% (2012: 34%), D Bice 2% (2012: 27%), J Billington 3% (2012: 30%), R Fennell 3% (2012: 37%), R Jenkins 3% (2012: 38%), T Piper 3% (2012: 33%), S Thredgold 3% (2012: 28%), A Watts 3% (2012: 30%).
9 One-third of STI awards that exceed the $30,000 threshold set by the Board are paid as equity in the Company and deferred for two years. The amortised value of the deferred STI components is included in the amounts disclosed under the “deferred share” column. The amounts included in the deferred share column for 2012 and 2013 include the deferred component of 2011 STI awards that were amortised over the deferral period (ie 2012 and 2013). The value of the deferred equity component for 2013 will be amortised over the two year deferral period (ie 2014 and 2015).
In addition, the 2013 base remuneration for senior executives (excluding the Managing Director) included a grant of deferred shares. The amounts included in the table also include the amortised fair value for accounting purposes of the deferred share grants in the 2013 financial year which are subject to vesting and forfeiture conditions.

40
Table 3: Key management personnel STI payments FY2013The following Short Term Incentives (STIs) were awarded to senior executives for FY2013. The Short Term Incentives forfeited are also set out in the table below.
Senior executiveMaximum award
available
STI payment STI payment as % of maximum STI
% of maximum STI payment forfeitedPaid as cash Deferred into shares 1
Mike Hirst $400,000 $117,333 $58,667 44.0% 56.0%
Marnie Baker $225,000 $66,667 $33,333 44.4% 55.6%
Dennis Bice $100,000 $50,000 $25,000 75.0% 25.0%
John Billington $160,000 $24,000 - 15.0% 85.0%
Richard Fennell $225,000 $66,667 $33,333 44.4% 55.6%
Russell Jenkins $200,000 $58,667 $29,333 44.0% 56.0%
Tim Piper $150,000 $44,000 $22,000 44.0% 56.0%
Stella Thredgold $100,000 $30,000 $15,000 45.0% 55.0%
Andrew Watts $150,000 $43,333 $21,667 43.3% 56.7%
1 The number of shares granted as part of the STI deferral is calculated by dividing the deferred STI remuneration value by the volume weighted average closing price of the Company’s shares for the 5 days ending on the grant dates. In the case of deferred base remuneration deferred share grants, the number of shares granted is calculated by dividing the deferred remuneration value by the volume weighted average closing price of the Company’s shares for the 5 days ended 30 June 2012.
Performance shares
Terms & Conditions for each Grant
Instrument Grant date Fair value Exercise priceRisk-free
interest rate Dividend yieldExpected volatility Expected life
Performance period end
Performance Shares 11.12.2009 $7.19 - 4.25% 4.5% 30% 1 year 30.06.2010
Performance Shares 11.12.2009 $8.56 - 4.25% 4.5% 30% 1 year 30.06.2010
Performance Shares 11.12.2009 $6.61 - 4.47% 4.5% 30% 2 years 30.06.2011
Performance Shares 11.12.2009 $8.19 - 4.47% 4.5% 30% 2 years 30.06.2011
Performance Shares 11.12.2009 $6.19 - 4.77% 4.5% 30% 3 years 30.06.2012
Performance Shares 11.12.2009 $7.83 - 4.77% 4.5% 30% 3 years 30.06.2012
Performance Shares 11.12.2009 $5.70 - 5.02% 4.5% 30% 4 years 30.06.2013
Performance Shares 11.12.2009 $7.50 - 5.02% 4.5% 30% 4 years 30.06.2013
Performance Shares 11.12.2009 $5.02 - 5.15% 4.5% 30% 5 years 30.06.2014
Performance Shares 11.12.2009 $7.17 - 5.15% 4.5% 30% 5 years 30.06.2014
Performance Shares 31.08.2012 $3.30 - 2.49% 6.5% 25% 4 years 30.06.2016
1 The allocation of deferred shares relating to STI deferral for FY2013 is expected to be completed in October 2013.
Table 4: All plans – equity valuation inputsThe following tables summarise the valuation inputs for current equity instruments issued by the Company.
Deferred Shares
Terms & Conditions for each Grant
Instrument Grant date Issue price / Fair value 1 Exercise price Share price at grant date Restriction period end
Deferred Shares - STI 22.03.2012 $7.73 - $7.56 30.06.2013
Deferred Base Pay 31.08.2012 $7.30 - $7.58 30.06.2014

Annual Financial Report Period ending 30 June 2013
41
Table 5: All plans – grants of instruments FY2013The following terms apply to current equity instruments issued by the Company.
Senior Executive Instrument
Number of instruments granted (a) (b)
Future years payable
Maximum value of grant (c)
Vesting / exercise date Expiry date
Mike Hirst Performance Shares
Deferred Shares STI
762,190
12,936
2009 - 2014
2013
$5,332,283
$100,000
30.06.2014
30.06.2013
30.06.2014
30.06.2013
Marnie Baker Performance Shares
Deferred Base Pay
Deferred Shares STI
27,397
13,699
8,624
2016
2014
2013
$200,000
$100,000
$66,667
30.06.2016
30.06.2014
30.06.2013
30.06.2016
30.06.2014
30.06.2013
Dennis Bice Performance Shares
Deferred Base Pay
Deferred Shares STI
13,699
6,849
3,018
2016
2014
2013
$100,000
$50,000
$23,333
30.06.2016
30.06.2014
30.06.2013
30.06.2016
30.06.2014
30.06.2013
John Billington Performance Shares
Deferred Base Pay
Deferred Shares STI
20,091
10,046
4,312
2016
2014
2013
$146,667
$73,333
$33,333
30.06.2016
30.06.2014
30.06.2013
30.06.2016
30.06.2014
30.06.2013
Richard Fennell Performance Shares
Deferred Base Pay
Deferred Shares STI
27,397
13,699
8,624
2016
2014
2013
$200,000
$100,000
$66,667
30.06.2016
30.06.2014
30.06.2013
30.06.2016
30.06.2014
30.06.2013
Russell Jenkins Performance Shares
Deferred Base Pay
Deferred Shares STI
27,397
13,699
6,899
2016
2014
2013
$200,000
$100,000
$53,333
30.06.2016
30.06.2014
30.06.2013
30.06.2016
30.06.2014
30.06.2013
Tim Piper Performance Shares
Deferred Base Pay
Deferred Shares STI
20,548
10,274
5,390
2016
2014
2013
$150,000
$75,000
$41,667
30.06.2016
30.06.2014
30.06.2013
30.06.2016
30.06.2014
30.06.2013
Stella Thredgold Performance Shares
Deferred Base Pay
Deferred Shares STI
13,699
6,849
3,449
2016
2014
2013
$100,000
$50,000
$26,667
30.06.2016
30.06.2014
30.06.2013
30.06.2016
30.06.2014
30.06.2013
Andrew Watts Performance Shares
Deferred Base Pay
Deferred Shares STI
20,548
10,274
4,312
2016
2014
2013
$150,000
$75,000
$33,333
30.06.2016
30.06.2014
30.06.2013
30.06.2016
30.06.2014
30.06.2013
(a) The grants made to Senior Executives in FY2013 constituted 100% of the grants available for the year and were made on the terms described at Sections 4 and 6. The value at grant date of deferred base pay grants (excluding STI grants) and performance share grants to senior executives (excluding the Managing Director) are determined by the Managing Director and approved by the Board. The number of deferred shares and performance shares allocated to recipients in the 2013 year were calculated using the volume weighted average closing price of the Company’s shares for the 5 trading days before 30 June 2012 ($7.30).
(b) The performance shares vest subject to performance and continued service over the period 1 July 2009 to 30 June 2014 for the Managing Director and 1 July 2012 to 30 June 2016 for other Senior Executives. The exercise price for the performance shares and deferred shares is nil.
(c) In relation to the Managing Director, the maximum value of the performance shares grants have been estimated based on the fair values presented at Table 4. In relation to other senior executives, the maximum value of the performance share and deferred base pay grants have been estimated based on the volume weighted average closing price of the Company’s shares for the five trading days before the grant date (being $7.30 for the deferred base pay grants and $7.73 for STI deferred shares). The fair value of the performance shares is $3.30. The minimum total value of the grants, if the applicable performance and / or service conditions are not met is nil.

42
Table 6: All plans - number of instruments FY2013The table below sets out the number and value of equity instruments that were granted by the Company including details of instruments that vested, exercised or forfeited/lapsed during FY2013.
Movements in number Movements in value 1
Senior executive Instrument Grant date GrantedExercised /
VestedForfeited/
Lapsed Granted 2
Exercised / Vested 3
Forfeited/ Lapsed 4
Mike Hirst Performance Shares
Deferred Shares - STI
11.12.2009
22.03.2012
-
-
198,712
12,936
-
-
-
-
$1,318,937
$100,000
-
-
Marnie Baker Performance Shares
Deferred Base Pay
Deferred Shares - STI
31.08.2012
31.08.2012
22.03.2012
27,397
13,699
-
-
-
8,624
- - -
$200,000 $100,000
-
- -
$66,667
-
-
-
Dennis Bice Performance Shares
Deferred Base Pay
Deferred Shares - STI
31.08.2012
31.08.2012
22.03.2012
13,699
6,849
-
- -
3,018
- - -
$100,000
$50,000
-
-
-
$23,333
-
- -
John Billington Performance Shares
Deferred Base Pay
Deferred Shares - STI
31.08.2012
31.08.2012
22.03.2012
20,091
10,046
-
- -
4,312
- - -
$146,667
$73,333
-
-
-
$33,333
-
-
-
Richard Fennell Performance Shares
Deferred Base Pay
Deferred Shares - STI
31.08.2012
31.08.2012
22.03.2012
27,397
13,699
-
-
-
8,624
-
-
-
$200,000
$100,000
-
-
-
$66,667
-
-
-
Russell Jenkins Performance Shares
Deferred Base Pay
Deferred Shares - STI
31.08.2012
31.08.2012
22.03.2012
27,397
13,699
-
-
-
6,899
-
-
-
$200,000
$100,000
-
-
-
$53,333
-
-
-
Tim Piper Performance Shares
Deferred Base Pay
Deferred Shares - STI
31.08.2012
31.08.2012
22.03.2012
20,548
10,274
-
-
-
5,390
-
-
-
$150,000
$75,000
-
-
-
$41,667
-
-
-
Stella Thredgold Performance Shares
Deferred Base Pay
Deferred Shares - STI
31.08.2012
31.08.2012
22.03.2012
13,699
6,849
-
-
-
3,449
-
-
-
$100,000
$50,000
-
-
-
$26,667
-
-
-
Andrew Watts Performance Shares
Deferred Base Pay
Deferred Shares - STI
31.08.2012
31.08.2012
22.03.2012
20,548
10,274
-
-
-
4,312
-
-
-
$150,000
$75,000
-
-
-
$33,333
-
-
-
1 For the Managing Director, the percentage of performance shares that vested during the year was 65% (Grants A) and 100% (Grant B). The performance shares that did not vest for Grant A will be carried forward and retested at 30 June 2014. For other senior executives, the percentage of performance shares and deferred shares that vested, or were forfeited, during the year was nil as the performance shares and deferred shares will be tested over future periods. The percentage of deferred shares granted in connection with STI equity deferral for FY 2011 that vested during the year was 100%.
2 The value of the performance shares and deferred shares at the grant date is based on the volume weighted average closing price of the Company’s shares for the five trading days before 1 July 2012 (being $7.30). The fair value of the performance shares is $3.30. The minimum total value of the grants, if the applicable performance and / or service conditions are not met, is nil.
3 The number of vested performance shares for the Managing Director comprises performance shares that were carried forward from tranches one, two and three that were eligible for re-testing at 30 June 2013 (and which vested) together with performance shares from tranche four that were tested at 30 June 2013 and which vested. The value of the vested performance shares is measured using the fair values applicable to the tranche of performance shares that vested. The applicable fair values are presented at Table 4. As each performance share represents an entitlement to one ordinary share in the Company, the number of ordinary shares that will be allocated to the Managing Director for vested performance shares is the same as the number of vested performance shares (ie 198,712 shares). Further information on the number of ordinary shares is presented at Note 39 of the Annual Financial Report.
The value of vested STI deferred shares is based on the Company’s volume weighted closing share price on the date of testing (there is no exercise price), being $7.73. The instruments are scheduled to be allocated in September 2013. The value of the vested performance shares is estimated using the fair value of the performance shares.
4 The value of each instrument on the date it lapses or is forfeited is calculated using the fair value of the instrument. Performance shares and deferred shares lapse where the applicable performance or service condition are not satisfied. As the performance shares and deferred shares only vest on satisfaction of performance and / or service conditions which are to be tested in future financial periods, none of the senior executive forfeited performance shares or deferred shares during the 2013 financial year.

Annual Financial Report Period ending 30 June 2013
43
Meetings of directorsInformation on Board and committee meeting attendance for the year is presented in the Corporate Governance Statement.
Insurance of directors and officersDuring or since the financial year end, the Company has paid premiums to insure certain officers of the company and its related bodies corporate. The officers of the Company covered by the insurance policy include the Company's directors, the secretary and directors or secretaries of controlled entities who are not also directors or secretaries of Bendigo and Adelaide Bank Limited. The insurance does not provide cover for the independent auditor of the Company or of a related body corporate of the Company.
Disclosure of the nature of the liability and the amount of the premium is prohibited by the confidentiality clause of the contract of insurance. The Company has not provided any insurance for an independent auditor of the Company or a related body corporate.
Indemnification of officersThe constitution stipulates that the Company is to indemnify, to the extent permitted by law, each officer of the Company against liabilities (including costs, damages and expenses incurred in defending any proceedings or appearing before any court, tribunal, government authority or other body) incurred by an officer or employee in, or arising out of the conduct of the business of the Company or arising out of the discharge of the officer's or employee's duties.
The Company has entered into deeds providing for indemnity, insurance and access to documents for each director who held office during the year. The Company has also entered into deeds of indemnity with its senior executives and officers of controlled entities. The deeds require the Company to indemnify, to the extent permitted by law, the person against all liabilities (including costs, damages and expenses incurred in defending any proceedings or appearing before any court, tribunal, government authority or other body) incurred in, or arising out of conduct of the business of the Company, an associated entity of the Company or in the discharge of their duties.
Directors' Interests in EquityThe relevant interest of each director (in accordance with section 205G of the Corporations Act 2001) in shares of the company or a related body corporate at the date of this report is as follows:
Environmental regulationThe consolidated entity's operations are not subject to any significant environmental regulations under either Commonwealth or State legislation. However, the Board believes that the consolidated entity has adequate systems in place for the management of its environmental requirements and is not aware of any breach of those environmental requirements as they apply to the consolidated entity.
Company Secretary
William Conlan, LL.B (Melb) Mr Conlan was appointed as company secretary of Bendigo and Adelaide Bank Limited in 2011, having worked with the Company for almost 10 years in strategy, capital management and compliance. Mr Conlan is a practising lawyer and, prior to commencing employment with the Bank, was a lawyer in private practice in Melbourne.
Review of operations and operating resultsInformation on the Company’s operations, financial position, business strategies, material business risks and future prospects is presented in the Operating and Financial Review Disclosures which consist of the Chairman’s and Managing Director’s messages and the Review of Operations and Operating Results section of the Annual Financial Report.
Auditor independence and non-audit servicesThe Company’s Audit Committee has conducted an assessment of the independence of the external auditor for the year ended 30 June 2013. The assessment was conducted on the basis of the Company’s audit independence policy and the requirements of the Corporations Act 2001. The assessment included a review of non-audit services provided by the auditor and an assessment of the independence declaration issued by the external auditor for the year ended 30 June 2013. The Audit Committee's assessment confirmed that the independence requirements have been met. The Audit Committee’s assessment was accepted by the full Board. A copy of the auditor’s independence declaration is provided at the end of this Directors’ Report.
Director Ordinary shares Preference shares Performance Shares Sandhurst Industrial Share Fund (Units) 2
Sandhurst Professional IML Industrial Share
Fund (Units) 3
Bendigo Growth Wholesale Fund
(Units)
Robert Johanson 197,996 1,000 - 146,691 - 118,555
Mike Hirst 660,811 1 - 218,397 - - -
Jenny Dawson 26,751 100 - - 56,301 -
Jim Hazel 15,420 - - - - -
Jacquie Hey 3,338 250 - - - -
Robert Hubbard 4,500
David Matthews 11,407 - - - - -
Deb Radford 1,900 - - - - -
Tony Robinson 10,000 - - - - -
1 Includes 50,000 shares issued under the Bendigo Employee Share Ownership Plan. 2 Relevant interests in managed investment schemes made available by a subsidiary of the Company.

44
Non-audit services Non-audit services are those services paid or payable to the Group’s external auditor, Ernst & Young (Australia), which do not relate to Group statutory audit engagements.
Details of all non-audit services for the year ended 30 June 2013:
(a) Audit related fees (Regulatory) In its capacity as the Group’s external auditor, Ernst & Young are periodically engaged to provide assurance services to the Group in accordance with Australian Auditing Standards. All assignments are subject to engagement letters in accordance with Australian Auditing Standards. They include audit services required for regulatory and prudential purposes and the amounts shown are GST exclusive.
Service CategoryFees
$ Entity
APRA Review 216,300 Bendigo and Adelaide Bank Limited
AFSL audit and APS 310 audit 199,924 Bendigo and Adelaide Bank Limited
Comfort Letter – Euro Medium Term Note Program 29,252 Bendigo and Adelaide Bank Limited
Government Guarantee Review 2,060 Bendigo and Adelaide Bank Limited
Convertible preference share issue advice 118,450 Bendigo and Adelaide Bank Limited
AFSL audit and APS 310 audit 54,332 Rural Bank Limited
Sub total – Audit related fees (Regulatory) 620,318
(b) Audit related fees (Non-regulatory) In its capacity as the Group’s external auditor, Ernst & Young are periodically engaged to provide assurance and related services not required by statute or regulation but are reasonably related to the performance of the audit or review of the Group's financial statements which are traditionally performed by the external auditor. These services include assurance of the Group's credit assessments and reviews of the Group's acquisition accounting and tax consolidation processes. The amounts shown are GST exclusive.
Service CategoryFees
$ Entity
EMTN audit procedures 3,502 Bendigo and Adelaide Bank Limited
Sub total – Audit related fees (Non-regulatory) 3,502
(c) Non audit related fees
ServiceFees
$ Entity
Tax advice 125,705 Bendigo and Adelaide Bank Limited
Professional services 50,470 Bendigo and Adelaide Bank Limited
Sub total – non audit related fees 176,175
Total – non audit services 799,995
The Audit Committee has reviewed the nature and scope of the above non-audit services provided by the external auditor. In doing so, the Audit Committee has assessed that the provision of those services is compatible with the general standard of independence for auditors imposed by the Corporations Act.
This assessment was made on the basis that the non-audit services performed did not represent the performance of management functions or the making of management decisions, nor were the dollar amounts of the non-audit fees considered sufficient to impair the external auditor's independence. As noted previously, this Audit Committee's assessment has been reviewed and accepted by the full Board.

Annual Financial Report Period ending 30 June 2013
45
This Directors Report is signed in accordance with a resolution of the Board of directors
Robert Johanson Chairman
Mike Hirst Managing Director
3 September 2013

46
Corporate governance
IntroductionBendigo and Adelaide Bank is committed to high standards of corporate governance. This commitment applies to the Company’s relationship with its shareholders, customers, employees, suppliers, regulators and the communities in which we operate.
The governance processes and practices adopted by the Company take into account APRA’s standards and guidance and the governance recommendations set by the ASX Corporate Governance Council (ASX Recommendations). A summary of the ASX Recommendations with reference to the Company’s governance practices is available on the Company’s website – www.bendigoadelaide.com.au. The governance documents referred to below can also be accessed from this website.
The following provides an overview of the Company’s corporate governance structure.
Board role and skillsThe Board charter sets out the responsibilities of the Board. A copy of the charter is available on the Company’s website. Except in relation to any matters reserved to the Board under the charter, the day-to-day management of the Company and its operations is delegated to management.
The Company appoints directors with appropriate skills and experience to contribute to the effectiveness of the Board, to provide leadership and contribute to the success of the Company.
This involves taking into account the Company’s strategy (set out above), which includes building a long term sustainable business focusing on the success of our customers, people, partners and communities. This delivers prosperity for stakeholders, which in turn creates prosperity for the Company and its shareholders.
The Board regularly reviews the necessary skills, knowledge and experience represented on the Board to deliver the strategy of the Group and to take into account the benefits to the organisation of having Board representation relating to strategic points of difference.
The Board uses a skills matrix to assist with the review. The criteria from the matrix are as follows;
> Our strength comes from our focus on the success of our customers, people, partners and communities
> We take a 100 year view of the business
> We listen
> We respect everyone’s choice, needs and objectives
> We partner for sustainable long term outcomes
Our Strategy
Our Vision
Industry1. Banking industry
Note, this includes the following:
> Retail banking and distribution
> Capital management, including capital and financial markets and treasury
> Regulation, including prudential regulation
2. Wealth management industry
Subject matter specific3. Governance
4. Accounting and financial reporting
5. Legal
6. Technology and telecommunications
7. Corporate finance/investment banking
8. Risk management
Note: ALMAC is the Asset Liability Management Committee.
Board
Management Committees
Board Committees
Board Committees
Managing Director
Executive CommitteeAudit Technology
& Change Credit Risk Governance & HR
Credit Risk ALMAC Operational Risk

Annual Financial Report Period ending 30 June 2013
47
General9. Business
10. Listed Company Board
11. Retailing Note, this includes sales, branding and marketing
12. Understanding of regional and community issues
A director may obtain independent professional advice at the reasonable cost to the Company with approval of the Chairman of the Board (or, if the chair refuses to give approval, the Board).
DirectorsThe names of the Company's Directors in office during the financial year are as follows. Directors were in office for the financial year unless otherwise stated.
Robert Johanson (Chairman) Mike Hirst (Managing Director) Jenny Dawson Jim Hazel Jacqueline Hey Robert Hubbard (appointed 2 April 2013) David Matthews Terry O’Dwyer (retired on 13 August 2012) Deb Radford Tony Robinson
Particulars of the skills, experience, expertise and responsibilities of the directors at the date of this report are set out in the Directors’ Report in the Annual Financial Report.
IndependenceThe Board believes that the exercise of independent judgment by directors is a crucial feature of corporate governance.
The Board policy sets out the test for the purpose of assessing the independence of non-executive directors as follows: “An independent director is a director who is free from any material business or other association – including those arising out of a substantial shareholding, involvement in past management or as a supplier, customer or advisor - that could interfere with the exercise of their independent judgment”. In deciding materiality, the quantitative materiality thresholds in Accounting Standard AASB 1031 are taken into account, as well as qualitative materiality factors.
The Chairman of the Company, Mr Johanson, is responsible for leading the Board and ensuring that it is operating to the appropriate governance standards. Mr Johanson has been Chairman of the Company since 2006 and a non-executive director since 1988.
Mr Johanson is a director and part-time employee, but no longer a shareholder, of Grant Samuel Group Pty Ltd (and subsidiaries), which is one of a range of firms which may be engaged to provide corporate advisory services to the Company. Grant Samuel was not engaged to provide advisory services to the Company during the reporting period and accordingly no fees were paid to Grant Samuel for the financial year (fees paid FY2012: $280,000). The Board has an established protocol for the engagement of Grant Samuel. Information of the appointment process and involvement of Mr Johanson has been set out in prior year corporate governance reports.
The Board has assessed each non-executive director as independent.
Board composition, renewal and re-electionIt is the Board’s view that, collectively, the Bank’s directors need to have appropriate skills, knowledge and experience to provide leadership and contribute to the effectiveness of the Board and the Bank’s success. The Board reviews its mix of skills, knowledge and experience regularly, using a skills matrix. These reviews include consideration of future succession plans for Board members, as well as any additional areas of expertise that may be required by the Board.
The Board considers gender, geographic and other diversity to be important. It aims to maintain female representation of at least one-third of non-executive directors on the Board, and also aims to have a diversity of geographic representation in its composition.
The Board is committed to a process of orderly renewal, aiming for a blend of tenure and experience. The Board considers that there are significant benefits in retaining non-executive directors who have served on the Bank’s Board through economic cycles. Such experience brings a depth of perspective and a corporate memory that is of particular value to the organisation.
The Board’s commitment to renewal is evidenced by the recent changes in its composition. There are now five directors who have served on the Board for less than five years (including the Managing Director), two directors who have served seven years and two who have served more than 10 years.
The Board discusses succession planning for its members and the chair regularly and robustly. Succession planning is an ongoing process and there are a number of well qualified internal candidates for the role of Chair.
All new directors are provided with an induction program for the Board (and relevant committees) to familiarise directors with the Company’s business and strategy.
A director seeking re-election at the end of their term must provide a statement to the Board setting out a case for their re-election. In making a decision whether to recommend the Chairman and any other non-executive director for re-election, the Board takes into account their contribution, the annual performance assessment, the skills and experience needed on the Board and the skills and experience of the current Board. The decision whether to recommend the Chairman, or any other non-executive director, for re-election is made in that person’s absence.
Board performanceThe following Board performance review process applies.
> Board as a whole – annual review: An internal review is conducted by the Chair of the Board. This involves questionnaires completed by directors and executives, as well as individual discussions with the Chair.
> Individual directors – annual review: This is conducted by the Chair of the Board.
> Chair of Board – annual review: This is conducted by the Board as a whole, led by a director nominated by the Board.
> Committees – bi-annual review: This is bi-annual to enable a greater focus on the Board as a whole and individual director assessment in other years. The review is lead by the Chair of each committee and discussed in a Board meeting.

48
Reviews of the Board as a whole, individual directors and the chair of the Board took place during the year in accordance with the process described above. The next committee performance review is scheduled for the 2013/2014 financial year.
The review of the Board and committees involves consideration of performance against the charters and goals and objectives set at the start of the financial year. The Board review also considers the structure and role of the Board (including in strategy and planning), culture and relationships, meeting processes and organisational performance monitoring.
Last year the Board engaged an external consultant to assist in relation to the Board performance evaluation process and expects to continue with this practice periodically.
Board committeesThe Board is assisted in discharging its responsibilities by the five Board committees described below. These committees have been in place for the full financial year. The membership of the committees has been structured so as to spread responsibility and make best use of the range of skills across the Board.
Membership of the various committees is also designed for sufficient overlap of membership to ensure that implications of matters raised in a committee are not missed in another.
The Board receives the minutes of all committees at the following Board meeting.
A committee can seek information from any group employee or any other source and meet with employees and third parties without the presence of management. A committee may consult with a professional adviser or expert at the cost of the Company, if the committee considers it necessary to carry out its responsibilities.
A summary of the role of each of the Board committees is set out below.
The Audit Committee assists the Board in relation to the external audit function, including prudential audit requirements, the assurance function (internal audit & credit risk review), statutory financial and APRA reporting and the Group’s internal control framework.
The Governance and HR Committee assists the Board in relation to nomination matters (including Board composition and succession planning), Board performance, remuneration (including executive remuneration policy, approval of remuneration consultants and recommendation of remuneration arrangements for the Managing Director and senior executives to the Board), key human resource policies, (including diversity and occupational health and safety) and corporate governance matters generally.
The Risk Committee has oversight of risk, including the establishment, implementation, review and monitoring of risk management systems and policies for balance sheet and off-balance sheet risk (including market and liquidity) and operational risk (including regulatory compliance, financial crimes, anti-money laundering and counter terrorism financing and business continuity).
The Credit Committee has oversight of the establishment, implementation, review and monitoring of credit risk management systems and policies, taking into account the risk appetite of the Group, the overall business strategy and management expertise.
The Technology and Change Committee has oversight and monitoring of the Group’s technology governance and transformational or change projects within the Company. The committee monitors the status of the performance and progress of major change projects and the major activities and priorities for the technology services division.
Board remunerationThe remuneration policy and information about remuneration paid is set out in the remuneration report in the Directors’ Report. There are no schemes for retirement benefits, other than superannuation, for non-executive directors.
Overview of meetings and member attendance
Committees
Director Board Audit Credit Risk Governance & HR Technology & Change
Meetings during reporting period
15 8 12 4 4 7
A B A B A B A B A B A B
Robert Johanson 15 14 4 4 7 7
Jenny Dawson 15 15 8 8 12 11
Jim Hazel 15 15 12 12 4 4 4 4
Jacquie Hey 15 15 8 8 4 4 7 7
Mike Hirst 15 14
Robert Hubbard 1 2 2 1 1 1 1
David Matthews 15 15 8 8 12 12
Terry O’Dwyer 2 2 2 1 1 1 1 1 1
Deb Radford 15 15 12 12 4 4 7 7
Tony Robinson 15 15 4 4 4 4
A = Number eligible to attend
B = Number attended1 Mr R Hubbard was appointed to the Board on 2 April 20132 Mr T O’Dwyer retired from the Board in August 2012

Annual Financial Report Period ending 30 June 2013
49
Code of conduct and reporting of concernsThe Company’s corporate values provide a framework to guide interactions within the Group, with customers, shareholders, suppliers and the community. The values are teamwork, integrity, performance, engagement, leadership and passion. These values have been incorporated in a code of conduct that has been endorsed by the executive committee and adopted by the Board.
The code of conduct is a statement of the Group’s corporate ethics and philosophy and underpins business decisions, actions and behaviour. It aims to make sure that high standards of corporate and individual behaviour are observed in conducting the business, and provides support for those behaviours.
The code provides guidelines for directors and staff, so that there is a common understanding of the values and expected standards of behaviour, including in relation to conflicts of interest, use of information and position and confidentiality. More detailed policies exist that deal specifically with various aspects of the code.
In addition, the reporting of concerns policy provides a reference point for reporting concerns, including on an anonymous basis. This includes a concern, a grievance, and report of a suspected breach of law or group policy (including any breach of the code of conduct). The reporting of concerns policy also sets out the protection provided for employees who raise concerns in good faith.
Fit and properIn addition, all directors and senior managers must meet fit and proper standards under the Company’s fit and proper policy, which addresses the requirements of APRA’s Prudential Standard CPS520 “Fit and Proper”.
Under the policy, all directors and senior managers need to have appropriate skills, experience and knowledge, and act with honesty and integrity. Directors and senior managers are assessed before appointment and then annually. All directors and senior managers have been assessed as fit and proper.
Continuous disclosure and communicationsThe continuous disclosure policy assists the Company in making sure that all price sensitive information is disclosed to Australian Securities Exchange (ASX) under the continuous disclosure requirements of ASX Listing Rules and the Corporations Act.
The Board meeting agenda includes continuous disclosure as a standing item for Board consideration. The Managing Director, chair and executive officers are responsible for identifying matters or transactions arising between Board meetings which require disclosure under the ASX Listing Rules.
All announcements to be lodged with ASX must first be approved by an authorised officer, generally the Managing Director, before release. The Company Secretary is responsible for coordinating communications with ASX and for having systems in place to make sure that information is not released to external parties until confirmation of lodgement is received from ASX.
The communications policy provides clear authorities and protocols for all communications with parties external to the Company, including investors, ASX, regulatory authorities, media and brokers. It has also been designed to complement the continuous disclosure policy, to make sure that information flows are controlled, and to reduce the likelihood of inadvertent disclosures outside the continuous disclosure reporting regime. In addition to all direct communications sent to individual shareholders, the Company will communicate publicly with its shareholders by posting information in the corporate governance section on the Company’s website.
Share tradingThe trading policy imposes restrictions on trading in the Company’s securities by directors, members of the executive committee and other designated employees (who may have access to price sensitive information). A black-out period is imposed for the 10 weeks leading up to each of the half-year and full-year announcements to ASX.
The policy also requires these employees and officers to tell the Company before and after trading and this information is reported to the Board. In addition, all employees and directors are prohibited from trading if in possession of price sensitive information.
The policy prohibits directors, members of the executive committee and other designated employees from using their Company securities as part of a margin loan portfolio.
The policy also prohibits a participant in an executive incentive plan from entering into a transaction designed to remove the “at risk” element of an entitlement under the plan (a) before it vests, and (b) after it vests, until any restriction period imposed by the Board ends or has been lifted.
Overview of diversityThe Company has a diversity policy that is founded on the Company’s code of conduct and corporate values. As stated in the policy:
"Staff: We advocate an inclusive and welcoming workplace. As an employer, we aim to offer an environment where people are treated with respect, feel valued, and can achieve success, both for the individual and the organisation. We also recognise the importance of an appropriate work-life balance.
Customers and communities: Our vision is to be Australia’s leading customer-connected Bank. We engage with customers and communities, by taking time to connect, listen and understand and build sustainable relationships. It makes sense to have a diverse team to be able to better understand and meet the needs of our diverse customer base and the communities in which we operate.
The Bank: Our ability to deliver our “unique style of banking” is dependent on having the best people. We will only find these people by drawing from the broadest pool of candidates available. Attracting and retaining a diverse team of talented people positions our organisation for success and creates both immediate business value and a sustainable organisation. It also contributes to our good reputation. So diversity makes good business sense and helps create value for shareholders."

50
The Governance & HR Committee has responsibility for keeping the policy under review. This includes the effectiveness of the policy. The Board is responsible for assessing performance against measurable objectives on an annual basis.
In April 2013, the role and membership of the people development and diversity council was reviewed and the council was renamed the Diversity Council with a renewed focus on delivering the diversity and inclusiveness strategy. The council is chaired by the Executive, Corporate Resources and it represents a diverse group with cross organisation coverage at a senior management level. Its role is to promote diversity and inclusiveness in the workplace, and also to provide input from across the organisation to assist it to formulate policy, strategy and objectives. Its specific responsibilities are:
> To champion the diversity vision for the Company
> To communicate the business case, success stories and to inspire action in the business
> To role-model the leadership of diversity and inclusiveness
> To support the development and oversight of the organisation and divisional targets
> To identify relevant case studies and stories and establish relevance to the organisation
> To establish and support communities of practice
> To support executive updates, highlighting issues, progress and achievements as required.
Diversity and Inclusiveness strategyA Diversity and Inclusiveness strategy was established in 2012 as a basis for a 3 year work program to develop greater diversity and inclusiveness. The diversity and inclusiveness vision is “Team success through the unique contribution of each individual” with the following goals to be delivered by 2015:
> A more diverse workforce at all levels
> One third of senior management (including senior managers and executives) to be women
> Flexible work and career will be how we work
> Leaders and employees will manage diversity as a business opportunity.
A work program was developed during the first half of 2013 to deliver the strategy by:
> Engaging and developing inclusive leaders
> Developing supportive practices and policies
> Embedding flexible work practices as the way we do things
> Facilitating communities of practice which support diversity and inclusiveness
> Connecting individuals and sharing success stories.
The application of the diversity and inclusiveness strategy and work program for 2013, which focused on foundation programs, policies and initiatives, is described below.
Gender profileInformation about the Company’s gender profile is set out in the following table.
All employees Award employees
Salaried employees (not senior
management or executive)
Senior management and executive positions
Non-Executive Directors
Senior management
Executive committee
Total 5195 2607 2510 69 10 8
Number of women 3251 2144 1087 18 3 3
Women as percentage of total 2013 63% 82% 43% 26% 30% 38%
Women as percentage of total 2012 63% 82% 43% 25% 22% 38%

Annual Financial Report Period ending 30 June 2013
51
Progress against diversity objectives set for 2013The diversity objectives set for this year and progress against those objectives is outlined below.
1. Increase the representation of females in senior management (including senior managers and executives) from 25 percent to at least one third by 30 June 2015 - ongoing.
Representation is currently at 26 percent. This area will be a primary focus of the 2014 work program with a women in leadership community of practice now in place and development of refreshed flexible work options designed to support career progression. An initial women in leadership forum was conducted which identified priority development areas.
2. Maintain female representation of at least one third of the non-executive directors – ongoing.
This representation has been maintained, with three female directors on the Board (out of a total of eight non-executive directors).
3. Female management representation on subsidiary and joint venture Boards – target 25 percent by 30 June 2013.
Female management representation on subsidiary and joint venture Boards increased from 20 percent to 31 percent during the year.
4. Senior management and the top 200 hiring managers to attend a diversity awareness and unconscious bias workshop with diversity messages to be built into the management and leader development program by 30 June 2013.
280 leaders attended inclusive leader workshops addressing diversity awareness and unconscious bias. The program was attended by Board and executive committee members plus a wide range of senior leaders with people management responsibility. Key diversity messages following this program have been built into the management and leader development program.
5. Flexible work arrangements to be reviewed by 30 June 2013.
A review of flexible work options and arrangements was undertaken by an external consultant. The recommendations are being reviewed to form the basis of refreshed and supportive flexible work arrangements for all employees.
6. Additional operational milestones and targets to support each of the elements of the diversity and inclusiveness strategy to be set by 30 November 2012 and reviewed by 30 June 2013.
10 priorities were identified to support the diversity and inclusiveness strategy. These were:
1. Leading inclusiveness and unconscious bias
2. Vision, three year journey and communication strategy
3. Diversity profile and metrics
4. Subsidiary ventures representation
5. Inclusive leadership messages in recruitment
6. Compliance review and update
7. Flexible work options refresh and relaunch
8. Develop communities of practice
9. Leadership and entrenching in other People and Performance frameworks
10. Development of partnerships
Priorities 1 to 4 were the focus of the 2013 work program. In addition to the milestones outlined above the following initiatives were delivered:
> Delivery of a communication program to employees on diversity and inclusiveness with practical leadership tools on leading in an inclusive workplace and internet resources.
> An organisation profile survey was launched in June 2013. This will provide valuable data to further develop measures, targets and standards for diversity and inclusiveness for the future.
2014 Diversity and Inclusiveness objectivesThe objectives for 2014 are designed to further develop the priority initiatives identified in 2013. They are:
1. Increase the representation of females in senior management (including senior managers and executives) from 26 percent to at least one third by 30 June 2015 - ongoing.
2. Maintain female representation of at least one third of the non-executive directors - ongoing
3. Develop initiatives in the following areas:
> embedding of diversity and inclusiveness messages in recruitment practices and guidelines
> updating of compliance training
> refresh and relaunch of flexible work options
> development of communities of practice with a focus on women in leadership and return to work.
Group AssuranceGroup Assurance is an internal audit and credit risk review function, independent of the business and of the external auditor. It assesses the adequacy and effectiveness of the Company’s processes for controlling its activities and managing its risks.
The Head of Group Assurance has a direct reporting line to the Board Audit Committee and an administrative reporting line to the Executive, Corporate Resources, as well as direct access to the Managing Director, the Chair of the Board Audit Committee and the Chair of the Board.
The Board committee procedural rules provide for the Audit Committee to meet at least annually with the head of Group Assurance without management present.
Group Assurance also has direct access to any member of staff and access to any information relevant to its work. Reports on the outcome of assurance programs are provided to the Board Audit Committee, with those relating to credit risk also provided to the Board Credit Committee. Reports on specific reviews are also provided to other Board committees as appropriate.
The strategic plan for the Group Assurance function is approved and monitored by the Board Audit Committee which also assesses and confirms the independence and effectiveness of the function.

52
Financial reportingThe directors of the Company are responsible for the preparation and fair presentation of the financial statements. The Board’s responsibility includes establishing and maintaining internal controls relevant to the preparation and fair presentation of financial statements that are free from material misstatement, selecting and applying appropriate accounting policies and making accounting estimates that are reasonable in the circumstances.
The Audit Committee assists the Board by providing oversight of the Group’s financial reporting responsibilities including external audit independence and performance. The Audit Committee responsibilities include the following:
> Assessing whether the financial statements are consistent with committee members’ information and knowledge and, in their opinion, adequate for shareholder needs.
> Overseeing compliance with the statutory financial reporting obligations of the Group.
> Considering and applying any significant changes in accounting policies, principles and practices.
The Managing Director and Chief Financial Officer provide a written statement to the Board in accordance with section 295A of the Corporations Act that the Annual Financial Report is founded on a sound system of risk management and internal control and that the system is operating effectively in all material respects in relation to financial reporting risks. The statement is made on the basis that it provides a reasonable, but not absolute, level of assurance and does not imply a guarantee against adverse events or circumstances that may arise in future periods.
External auditor - independence policyThe Board Audit Committee is responsible for maintaining a policy about auditor independence, rotation and the provision of non-audit services, and monitoring compliance with that policy. The policy on audit independence sets out the factors that may compromise auditor independence.
It requires advance approval by the Audit Committee for engaging the auditor for any non-audit services, to enable the Audit Committee to consider whether there may be an impact on auditor independence.
The policy requires the Audit Committee to receive the annual and half-year independence declarations from the auditor. The external auditor also meets separately with the Audit Committee without the presence of management.
Non-audit servicesThe Audit Committee gives an annual and half-year statement to the Board as to whether the Audit Committee is satisfied that the independence of the external audit function has been maintained having regard to the provision of non-audit services, and why it is so satisfied.
As part of this process the Audit Committee receives a report, confirmed by Group Assurance, setting out the nature and scope of all non-audit services provided during the period, including fees and confirmation from relevant senior management that they are not aware of any matters that might impact the auditor’s independence.
The Directors’ Report includes a statement about whether the directors are satisfied that the provision of non-audit services is compatible with the independence of the auditor and the reasons for being so satisfied.
Rotation of audit personnelThe policy provides that a person who plays a significant role in the audit must rotate if they have acted in that role for five successive years or, if they were to act, they would have played a significant role for more than five out of seven successive financial years, with a two-year cooling-off period.
Risk management frameworkInformation on the Company’s risk management governance, framework and material business risks is presented in the Directors’ Report and Note 41 Risk Management of the Financial Statements.
Remuneration arrangementsInformation on the governance arrangements and policies applicable to the Company’s remuneration is presented in the 2013 Remuneration Report which forms part of the Directors Report.
Annual General MeetingMembers may give written questions to the Company for the auditor about the content of the auditor’s report to be considered at the Annual General Meeting, or the conduct of the audit of the Annual Financial Report to be considered at the Annual General Meeting, no later than the fifth business day before the day on which the Annual General Meeting is held.
The external audit engagement partner from Ernst & Young is required to make sure that a suitably qualified representative attends the Annual General Meeting. The chair of the meeting provides an opportunity for the members as a whole at the meeting to ask the auditor’s representative questions relevant to the conduct of the audit, the preparation and conduct of the auditor’s report, the accounting policies adopted by the Company in relation to the preparation of the financial statements and the independence of the auditor in relation to the conduct of the audit.
The Chair also allows a reasonable opportunity for the representative of the auditor to answer written questions submitted before the meeting.

Annual Financial Report Period ending 30 June 2013
53
Five year historyThe Bendigo and Adelaide Bank Group
Financial Performance for the year ended 30 June
2013 2012 1 2011 2010 2 2009 3
$m $m $m $m $m
Interest income 3,073.7 3,440.8 3,385.8 2,712.2 3,154.7
Interest expense 2,046.2 2,490.7 2,450.6 1,857.6 2,519.7
Net interest income 1,027.5 950.1 935.2 854.6 635.0
Other income 321.8 262.8 300.8 280.4 238.7
Bad & doubtful debts expense (net of bad debts recovered) 69.9 32.4 44.2 44.7 80.3
Other expenses 791.8 854.4 767.3 739.6 674.1
Profit before income tax expense 487.6 326.1 424.5 350.7 119.3
Income tax expense (135.3) (131.1) (77.9) (90.8) (35.5)
Net (profit)/loss attributable to non controlling interest - - (4.5) (17.3) -
Profit after income tax expense 352.3 195.0 342.1 242.6 83.8
Adjustments (4.3) 128.0 (5.9) 48.4 97.7
Cash basis earnings 348.0 323.0 336.2 291.0 181.5
Financial Position at 30 June
Total assets 60,282.2 57,237.8 55,004.5 52,222.5 47,114.2
Net loans and other receivables 50,511.5 48,670.0 46,409.8 43,603.2 38,740.9
Cash and cash equivalents 677.7 561.0 670.6 1,040.2 1,148.0
Financial assets and derivatives 6,374.0 5,372.5 5,296.8 4,848.6 4,360.3
Other assets 2,719.0 2,634.3 2,627.3 2,730.5 2,780.6
Equity 4,434.0 4,217.7 3,960.1 3,880.4 3,118.7
Deposits and Notes payable 53,839.6 50,983.7 48,975.0 46,217.4 41,854.3
Reset preference shares - 89.5 89.5 89.5 89.5
Convertible preference shares 268.9 - - - -
Subordinated debt 354.3 436.9 575.7 532.9 598.7
Other liabilities 1,385.4 1,510.0 1,404.2 1,502.3 1,453.0
Share Information
Net tangible assets per ordinary share $6.62 $6.16 $5.76 $5.27 $4.31
Earnings per ordinary share - cents 84.9 48.6 91.5 67.4 25.4
Cash basis earnings per ordinary share - cents 85.4 84.2 92.3 83.3 62.6
Dividends per ordinary share:
Interim - cents 30.0 30.0 30.0 28.0 28.0
Final - cents 31.0 30.0 30.0 30.0 15.0
Total - cents 61.0 60.0 60.0 58.0 43.0
Ratios
Profit after tax before specific items return on average assets 0.57% 0.56% 0.61% 0.56% 0.36%
Return on average assets 0.60% 0.35% 0.64% 0.49% 0.18%
Cash basis return on average ordinary equity 8.58% 8.36% 9.07% 8.18% 5.79%
Return on average ordinary equity 8.52% 4.84% 8.99% 6.61% 2.35%
1 Figures for 2012 include the fully consolidated trading of Delphi Bank (formerly Bank of Cyprus Australia) from 1 March 2012.2 Figures for 2010 include the fully consolidated trading of Rural Bank from 1 October 2009, Tasmanian Banking Services from 1 August 2009.3 Figures for 2009 include the fully consolidated trading of Macquarie margin lending portfolio from January 2009.
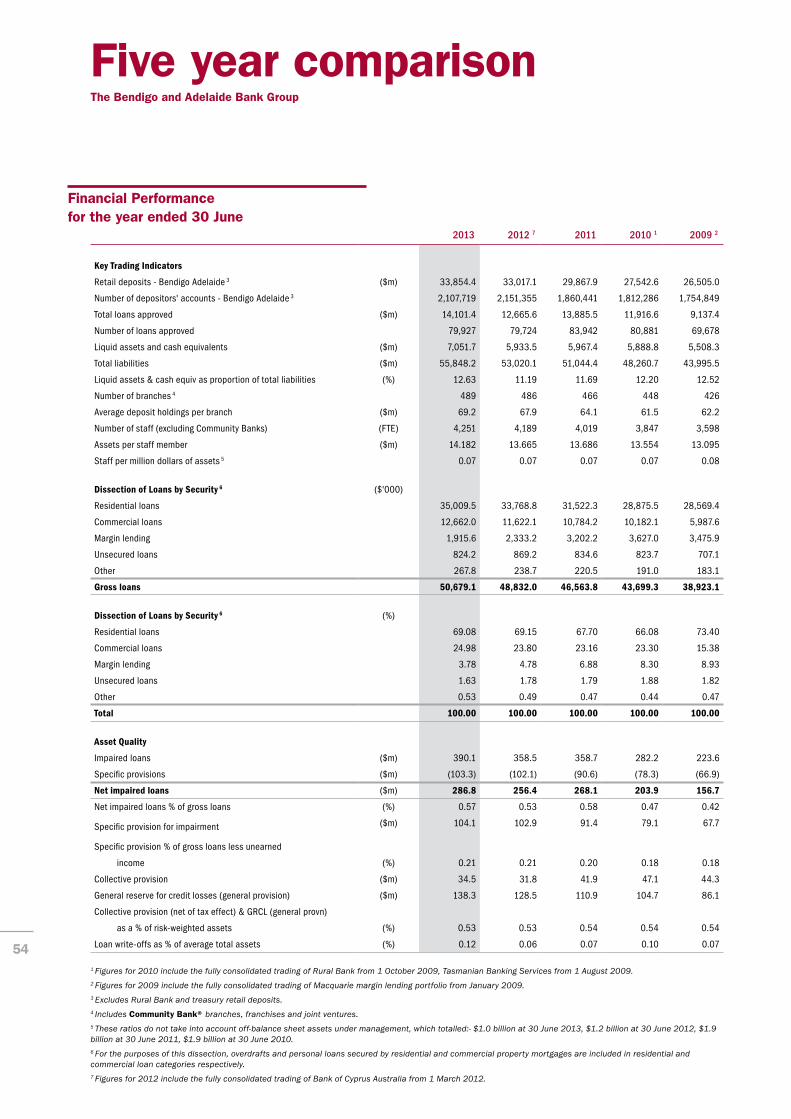
54
Five year comparisonThe Bendigo and Adelaide Bank Group
Financial Performance for the year ended 30 June
2013 2012 7 2011 2010 1 2009 2
Key Trading Indicators
Retail deposits - Bendigo Adelaide 3 ($m) 33,854.4 33,017.1 29,867.9 27,542.6 26,505.0
Number of depositors' accounts - Bendigo Adelaide 3 2,107,719 2,151,355 1,860,441 1,812,286 1,754,849
Total loans approved ($m) 14,101.4 12,665.6 13,885.5 11,916.6 9,137.4
Number of loans approved 79,927 79,724 83,942 80,881 69,678
Liquid assets and cash equivalents ($m) 7,051.7 5,933.5 5,967.4 5,888.8 5,508.3
Total liabilities ($m) 55,848.2 53,020.1 51,044.4 48,260.7 43,995.5
Liquid assets & cash equiv as proportion of total liabilities (%) 12.63 11.19 11.69 12.20 12.52
Number of branches 4 489 486 466 448 426
Average deposit holdings per branch ($m) 69.2 67.9 64.1 61.5 62.2
Number of staff (excluding Community Banks) (FTE) 4,251 4,189 4,019 3,847 3,598
Assets per staff member ($m) 14.182 13.665 13.686 13.554 13.095
Staff per million dollars of assets 5 0.07 0.07 0.07 0.07 0.08
Dissection of Loans by Security 6 ($'000)
Residential loans 35,009.5 33,768.8 31,522.3 28,875.5 28,569.4
Commercial loans 12,662.0 11,622.1 10,784.2 10,182.1 5,987.6
Margin lending 1,915.6 2,333.2 3,202.2 3,627.0 3,475.9
Unsecured loans 824.2 869.2 834.6 823.7 707.1
Other 267.8 238.7 220.5 191.0 183.1
Gross loans 50,679.1 48,832.0 46,563.8 43,699.3 38,923.1
Dissection of Loans by Security 6 (%)
Residential loans 69.08 69.15 67.70 66.08 73.40
Commercial loans 24.98 23.80 23.16 23.30 15.38
Margin lending 3.78 4.78 6.88 8.30 8.93
Unsecured loans 1.63 1.78 1.79 1.88 1.82
Other 0.53 0.49 0.47 0.44 0.47
Total 100.00 100.00 100.00 100.00 100.00
Asset Quality
Impaired loans ($m) 390.1 358.5 358.7 282.2 223.6
Specific provisions ($m) (103.3) (102.1) (90.6) (78.3) (66.9)
Net impaired loans ($m) 286.8 256.4 268.1 203.9 156.7
Net impaired loans % of gross loans (%) 0.57 0.53 0.58 0.47 0.42
Specific provision for impairment ($m) 104.1 102.9 91.4 79.1 67.7
Specific provision % of gross loans less unearned
income (%) 0.21 0.21 0.20 0.18 0.18
Collective provision ($m) 34.5 31.8 41.9 47.1 44.3
General reserve for credit losses (general provision) ($m) 138.3 128.5 110.9 104.7 86.1
Collective provision (net of tax effect) & GRCL (general provn)
as a % of risk-weighted assets (%) 0.53 0.53 0.54 0.54 0.54
Loan write-offs as % of average total assets (%) 0.12 0.06 0.07 0.10 0.07
1 Figures for 2010 include the fully consolidated trading of Rural Bank from 1 October 2009, Tasmanian Banking Services from 1 August 2009.2 Figures for 2009 include the fully consolidated trading of Macquarie margin lending portfolio from January 2009.3 Excludes Rural Bank and treasury retail deposits.4 Includes Community Bank® branches, franchises and joint ventures.5 These ratios do not take into account off-balance sheet assets under management, which totalled:- $1.0 billion at 30 June 2013, $1.2 billion at 30 June 2012, $1.9 billion at 30 June 2011, $1.9 billion at 30 June 2010.6 For the purposes of this dissection, overdrafts and personal loans secured by residential and commercial property mortgages are included in residential and commercial loan categories respectively.7 Figures for 2012 include the fully consolidated trading of Bank of Cyprus Australia from 1 March 2012.
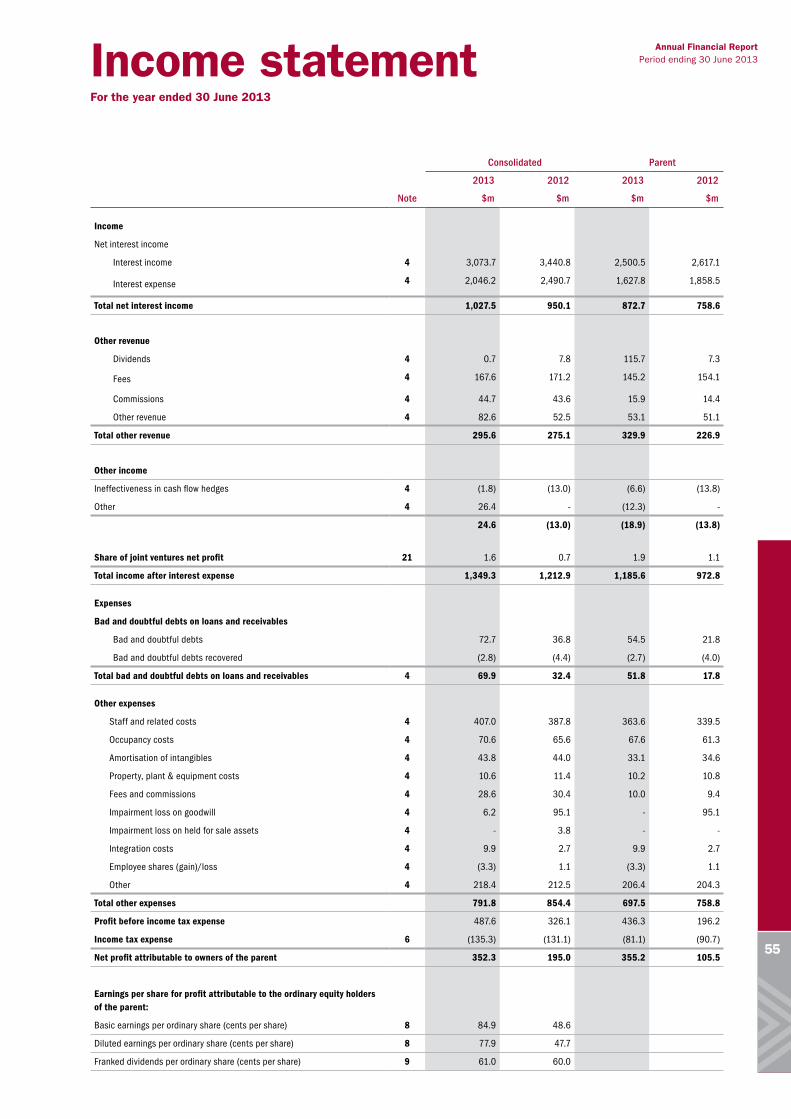
Annual Financial Report Period ending 30 June 2013
55
Consolidated Parent
2013 2012 2013 2012
Note $m $m $m $m
Income
Net interest income
Interest income 4 3,073.7 3,440.8 2,500.5 2,617.1
Interest expense 4 2,046.2 2,490.7 1,627.8 1,858.5
Total net interest income 1,027.5 950.1 872.7 758.6
Other revenue
Dividends 4 0.7 7.8 115.7 7.3
Fees 4 167.6 171.2 145.2 154.1
Commissions 4 44.7 43.6 15.9 14.4
Other revenue 4 82.6 52.5 53.1 51.1
Total other revenue 295.6 275.1 329.9 226.9
Other income
Ineffectiveness in cash flow hedges 4 (1.8) (13.0) (6.6) (13.8)
Other 4 26.4 - (12.3) -
24.6 (13.0) (18.9) (13.8)
Share of joint ventures net profit 21 1.6 0.7 1.9 1.1
Total income after interest expense 1,349.3 1,212.9 1,185.6 972.8
Expenses
Bad and doubtful debts on loans and receivables
Bad and doubtful debts 72.7 36.8 54.5 21.8
Bad and doubtful debts recovered (2.8) (4.4) (2.7) (4.0)
Total bad and doubtful debts on loans and receivables 4 69.9 32.4 51.8 17.8
Other expenses
Staff and related costs 4 407.0 387.8 363.6 339.5
Occupancy costs 4 70.6 65.6 67.6 61.3
Amortisation of intangibles 4 43.8 44.0 33.1 34.6
Property, plant & equipment costs 4 10.6 11.4 10.2 10.8
Fees and commissions 4 28.6 30.4 10.0 9.4
Impairment loss on goodwill 4 6.2 95.1 - 95.1
Impairment loss on held for sale assets 4 - 3.8 - -
Integration costs 4 9.9 2.7 9.9 2.7
Employee shares (gain)/loss 4 (3.3) 1.1 (3.3) 1.1
Other 4 218.4 212.5 206.4 204.3
Total other expenses 791.8 854.4 697.5 758.8
Profit before income tax expense 487.6 326.1 436.3 196.2
Income tax expense 6 (135.3) (131.1) (81.1) (90.7)
Net profit attributable to owners of the parent 352.3 195.0 355.2 105.5
Earnings per share for profit attributable to the ordinary equity holders of the parent:
Basic earnings per ordinary share (cents per share) 8 84.9 48.6
Diluted earnings per ordinary share (cents per share) 8 77.9 47.7
Franked dividends per ordinary share (cents per share) 9 61.0 60.0
Income statementFor the year ended 30 June 2013
Five year comparisonThe Bendigo and Adelaide Bank Group

56
Consolidated Parent
2013 2012 2013 2012
Note $m $m $m $m
Profit for the year 352.3 195.0 355.2 105.5
Items which may be reclassified subsequently to the profit & loss:
Net gain/(loss) on available for sale - equity investments 35 1.1 (9.6) - (0.1)
Transfer to income on sale of available for sale assets 35 (37.1) - - -
Net gain on cash flow hedges taken to equity 35 75.8 47.0 60.2 34.2
Net loss on reclassification from cash flow hedge reserve to income 35 (1.8) (13.0) (6.6) (13.9)
Net unrealised gain/(loss) on debt securities in available for sale portfolio
35 2.9 (1.8) 2.9 (1.8)
Tax effect on items taken directly to or transferred from equity 35 (13.1) (7.3) (17.3) (6.1)
27.8 15.3 39.2 12.3
Items which will not be reclassified subsequently to the profit & loss:
Actuarial gain/(loss) on superannuation defined benefits plan 35 2.3 (1.8) 2.3 (1.8)
Tax effect on items taken directly to or transferred from equity 35 (0.7) 0.4 (0.7) 0.4
Net income recognised directly in equity 1.6 (1.4) 1.6 (1.4)
Total comprehensive income for the period 381.7 208.9 396.0 116.4
Total comprehensive income for the period attributable to:
Members of the Parent 381.7 208.9 396.0 116.4
Statement of comprehensive incomeFor the year ended 30 June 2013

Annual Financial Report Period ending 30 June 2013
57
Statement of comprehensive incomeFor the year ended 30 June 2013
Balance sheetAs at 30 June 2013
Consolidated Parent
2013 2012 2013 2012
Note $m $m $m $m
Assets
Cash and cash equivalents 13 383.8 288.8 258.1 175.8
Due from other financial institutions 13 293.9 272.2 292.2 266.3
Amounts receivable from controlled entities - - 544.7 1,090.8
Financial assets held for trading 14 5,465.2 4,366.1 5,465.8 4,367.0
Financial assets available for sale - debt securities 15 535.5 444.8 1,362.9 1,594.6
Financial assets held to maturity 17 323.3 388.4 1.8 1.8
Other assets 27 615.4 509.7 1,229.9 837.4
Financial assets available for sale - equity investments 16 18.1 124.7 4.5 4.1
Derivatives 43 31.9 48.5 182.6 547.3
Loans and other receivables - investment 18 554.1 453.0 554.1 453.0
Net loans and other receivables 18 49,957.4 48,217.0 44,691.3 41,366.6
Investments accounted for using the equity method 21 15.6 12.9 13.8 10.7
Shares in controlled entities - - 526.5 604.1
Property, plant & equipment 22 63.4 69.0 59.5 60.6
Deferred tax assets 6 132.1 170.2 96.6 108.5
Investment property 24 348.9 298.9 5.9 -
Assets held for sale 23 25.4 25.4 - -
Intangible assets and goodwill 25 1,518.2 1,548.2 1,390.0 1,408.4
Total Assets 60,282.2 57,237.8 56,680.2 52,897.0
Liabilities
Due to other financial institutions 13 379.5 327.2 371.4 315.1
Deposits 28 47,439.0 44,572.7 44,121.7 40,179.4
Notes payable 28 6,400.6 6,411.0 350.3 -
Derivatives 43 98.4 179.0 85.7 111.2
Other payables 29 688.7 731.8 887.9 1,168.0
Loans payable to securitisation trusts - - 5,829.9 6,294.1
Income tax payable 6 47.1 86.8 47.1 86.8
Provisions 30 93.5 80.7 90.3 75.8
Deferred tax liabilities 6 78.2 104.5 88.0 209.2
Reset preference shares 31 - 89.5 - 89.5
Convertible preference shares 32 268.9 - 268.9 -
Subordinated debt 33 354.3 436.9 302.2 361.1
Total Liabilities 55,848.2 53,020.1 52,443.4 48,890.2
Net Assets 4,434.0 4,217.7 4,236.8 4,006.8
Equity
Equity attributable to equity holders of the parent
Issued capital - ordinary 34 3,758.0 3,681.8 3,758.0 3,681.8
Perpetual non-cumulative redeemable convertible preference shares 34 88.5 88.5 88.5 88.5
Step up preference shares 34 100.0 100.0 100.0 100.0
Employee Share Ownership Plan (ESOP) shares 34 (18.7) (21.3) (18.7) (21.3)
Reserves 35 108.1 72.2 122.9 70.7
Retained earnings 35 398.1 296.5 186.1 87.1
Total Equity 4,434.0 4,217.7 4,236.8 4,006.8

58
Statement of changes in equityFor the year ended 30 June 2013
Consolidated
Attributable to owners of Bendigo and Adelaide Bank Limited
Issued ordinary capital Shares 1
Retained earnings Reserves 2 Total equity
$m $m $m $m $m
At 1 July 2012
Opening balance b/fwd 3,681.8 167.2 296.5 72.2 4,217.7
Comprehensive income:
Profit for the year - - 352.3 - 352.3
Other comprehensive income - - 1.6 27.8 29.4
Total comprehensive income for the period - - 353.9 27.8 381.7
Transactions with owners in their capacity as owners:
Shares issued 76.2 - - - 76.2
Reduction in employee share ownership plan (ESOP) shares - 2.6 - - 2.6
Movement in general reserve for credit losses (GRCL) - - (9.8) 9.8 -
Share based payment - - - (1.7) (1.7)
Equity dividends - - (242.5) - (242.5)
At 30 June 2013 3,758.0 169.8 398.1 108.1 4,434.0
1 refer to note 34 Issued Capital for further details2 refer to note 35 Retained earnings and reserves for further details
For the year ended 30 June 2012 Attributable to owners of Bendigo and Adelaide Bank Limited
Issued
ordinary capital
Shares 1 Retained earnings
Reserves 2 Total equity
$m $m $m $m $m
At 1 July 2011
Opening balance b/fwd 3,408.9 163.9 349.5 37.8 3,960.1
Comprehensive income:
Profit for the year - - 195.0 - 195.0
Other comprehensive income - - (1.4) 15.3 13.9
Total comprehensive income for the period - - 193.6 15.3 208.9
Transactions with owners in their capacity as owners:
Shares issued 274.8 - - - 274.8
Share issue expenses (1.9) - - - (1.9)
Reduction in Employee Share Ownership Plan (ESOP) shares - 3.3 - - 3.3
Movement in general reserve for credit losses (GRCL) - - (17.6) 17.6 -
Share based payment - - - 1.5 1.5
Equity dividends - - (229.0) - (229.0)
At 30 June 2012 3,681.8 167.2 296.5 72.2 4,217.7
1 refer to note 34 Issued Capital for further details2 refer to note 35 Retained earnings and reserves for further details

Annual Financial Report Period ending 30 June 2013
59
Statement of changes in equityFor the year ended 30 June 2013
Statement of changes in equity (continued)
Parent
Attributable to owners of Bendigo and Adelaide Bank Limited
Issued ordinary capital Shares 1
Retained earnings Reserves 2 Total equity
$m $m $m $m $m
At 1 July 2012
Opening balance b/fwd 3,681.8 167.2 87.1 70.7 4,006.8
Acquired in business combination - - (0.6) - (0.6)
Comprehensive income:
Profit for the year - - 355.2 - 355.2
Other comprehensive income - - 1.6 39.2 40.8
Total comprehensive income for the period - - 356.8 39.2 396.0
Transactions with owners in their capacity as owners:
Shares issued 76.2 - - - 76.2
Reduction in employee share ownership plan (ESOP) shares - 2.6 - - 2.6
Movement in general reserve for credit losses (GRCL) - - (14.7) 14.7 -
Share based payment - - - (1.7) (1.7)
Equity dividends - - (242.5) - (242.5)
At 30 June 2013 3,758.0 169.8 186.1 122.9 4,236.8
1 refer to note 34 Issued Capital for further details2 refer to note 35 Retained earnings and reserves for further details
For the year ended 30 June 2012
Attributable to owners of Bendigo and Adelaide Bank Limited
Issued ordinary capital Shares 1
Retained earnings Reserves 2 Total equity
$m $m $m $m $m
At 1 July 2011
Opening balance b/fwd 3,408.9 163.9 224.6 43.6 3,841.0
Comprehensive income:
Profit for the year - - 105.5 - 105.5
Other comprehensive income - - (1.4) 12.3 10.9
Total comprehensive income for the period - - 104.1 12.3 116.4
Transactions with owners in their capacity as owners:
Shares issued 274.8 - - - 274.8
Share issue expenses (1.9) - - - (1.9)
Reduction in Employee Share Ownership Plan (ESOP) shares - 3.3 - - 3.3
Movement in general reserve for credit losses (GRCL) - - (12.6) 12.6 -
Share based payment - - - 2.2 2.2
Equity dividends - - (229.0) - (229.0)
At 30 June 2012 3,681.8 167.2 87.1 70.7 4,006.8
1 refer to note 34 Issued Capital for further details2 refer to note 35 Retained earnings and reserves for further details

60
Cash flow statementFor the year ended 30 June 2013
Consolidated Parent
2013 2012 2013 2012
Note $m $m $m $m
Cash flows from operating activities
Interest and other items of a similar nature received 3,134.5 3,442.3 2,324.6 2,584.1
Interest and other costs of finance paid (2,132.8) (2,545.0) (1,678.9) (1,868.9)
Receipts from customers (excluding effective interest) 263.9 265.6 228.6 256.3
Payments to suppliers and employees (665.7) (850.5) (544.2) (677.7)
Dividends received 0.8 8.1 115.7 7.3
Income taxes paid (177.2) (120.6) (124.4) (87.0)
Net cash flows from operating activities 12 423.5 199.9 321.4 214.1
Cash flows from investing activities
Cash paid for purchases of property, plant and equipment (7.1) (12.2) (6.5) (11.7)
Cash proceeds from sale of property, plant and equipment 0.8 1.2 0.7 1.1
Cash paid for purchases of investment property (31.8) (44.4) - -
Cash proceeds from sale of investment property 20.1 11.0 6.6 -
Cash paid for purchases of intangible software (2.5) (15.4) - (8.6)
Cash paid for purchases of equity investments - (12.0) - (2.6)
Cash proceeds from sale of equity investments 109.8 - - -
Capital injection into subsidiaries - - (36.0) -
Cash paid for investment in associate - - (1.5) -
Net (increase) in balance of loans and other receivables outstanding (1,841.5) (929.6) (2,879.7) (1,596.6)
Net (increase)/decrease in balance of investment securities (1,124.7) 208.1 (867.1) 773.7
Proceeds from return of capital - 0.4 - -
Net cash received on acquisition of a business combination (258.8) (213.1) (258.8) (131.4)
Net cash flows used in investing activities (3,135.7) (1,006.0) (4,042.3) (976.1)
Cash flows from financing activities
Proceeds from issue of shares 177.7 195.5 177.7 195.5
Net increase in balance of retail deposits 1,582.8 2,638.3 2,712.9 2,614.9
Net increase in balance of wholesale deposits 1,283.5 78.9 1,229.4 38.5
Repayment of subordinated debt (82.6) (138.7) (58.9) (123.8)
Dividends paid (166.1) (149.7) (166.1) (149.7)
Net decrease in balance of notes payable (10.4) (2,040.8) (113.9) (2,020.8)
Repayment of ESOP shares 2.6 3.3 2.6 3.3
Payment of share issue costs (10.9) (1.9) (10.9) (1.9)
Net cash flows from financing activities 2,776.6 584.9 3,772.8 556.0
Net increase/(decrease) in cash and cash equivalents 64.4 (221.2) 51.9 (206.0)
Cash and cash equivalents at the beginning of period 233.8 455.0 127.0 333.0
Cash and cash equivalents at the end of period 13 298.2 233.8 178.9 127.0

Annual Financial Report Period ending 30 June 2013
61
Cash flow statementFor the year ended 30 June 2013
Notes to the financial statements
1. Corporate informationThe financial report of Bendigo and Adelaide Bank Limited (the Company) for the year ended 30 June 2013 was authorised for issue in accordance with a resolution of the directors on 3 September 2013.
Bendigo and Adelaide Bank Limited is a company limited by shares incorporated in Australia whose shares are publicly traded on the Australian Securities Exchange.
The domicile of the Company is Australia.
The registered office of the Company is:
The Bendigo Centre 22 – 44 Bath Lane Bendigo, Victoria Australia 3550
2. Summary of significant accounting policies
2.1 Basis of preparationBendigo and Adelaide Bank Limited is a “prescribed corporation” in terms of the Corporations Act 2001. Financial reports prepared in compliance with the Banking Act are deemed to comply with the accounts provisions of the Corporations Act 2001.
The financial report is a general purpose financial report which has been prepared in accordance with the Banking Act, Australian Accounting Standards, Corporations Act 2001 and the requirements of law so far as they are applicable to Australian banking corporations, including the application of ASIC Class Order 10/654 allowing the disclosure of parent entity financial statements due to Australian Financial Services Licensing obligations.
The financial report has been prepared in accordance with the historical cost convention, amortised cost for loans and receivables and financial liabilities, except for investment properties, land and buildings, derivative financial instruments and available-for-sale financial assets which are measured at their fair value.
The amounts contained in the financial statements have been rounded off under the option available to the Company under ASIC Class Order 98/0100. The Company is an entity to which the Class Order applies. The Class Order allows for rounding to the nearest one hundred thousand dollars ($’00,000).
2.2 Compliance with IFRSThe financial report complies with Australian Accounting Standards and International Financial Reporting Standards (IFRS).
Recently issued or amended standards not yet effectiveAustralian Accounting Standards that have recently been issued or amended but are not yet effective have not been adopted for the annual reporting period ended 30 June 2013:
Reference Title Summary
Application date of Standard 1
Impact on Group financial report
Application date for Group 1
AASB 2012-9 Amendments to Australian Accounting Standards – Presentation of Other Comprehensive Income [AASB 1,5,7,101,112,120,121,132,133,134,1039, 1049]
This Standard requires entities to group items presented in other comprehensive income on the basis of whether they might be reclassified subsequently to profit or loss and those that will not.
1 July 2013 The Group has already presented Other Comprehensive Income in the required format. Refer to the Statement of Comprehensive Income.
1 July 2013
AASB 119 Employee Benefits The main change introduced by this standard is to revise the accounting for defined benefit plans. The amendment removes the options for accounting for the liability, and requires that the liabilities arising from such plans is recognised in full with actuarial gains and losses being recognised in other comprehensive income. It also revised the method of calculating the return on plan assets.
The revised standard changes the definition of short-term employee benefits. The distinction between short-term and other long-term employee benefits is now based on whether the benefits are expected to be settled wholly within 12 months after the reporting date.
Consequential amendments were also made to other standards via AASB 2012-10.
1 January 2013 The Group has not yet determined the extent of the impacts of the amendments, however it is not expected to result in a material impact to the Group.
1 July 2013

62
Reference Title Summary
Application date of Standard 1
Impact on Group financial report
Application date for Group 1
Annual Improve-ments 2009-2012 Cycle 3
Annual Improvements to IFRSs 2009-2012 Cycle
This standard sets out amendments to International Financial Reporting Standards (IFRSs) and the related bases for conclusions and guidance made during the International Accounting Standards Board’s Annual Improvements process. These amendments have not yet been adopted by the AASB.
The following items are addressed by this standard:
IFRS 1 First-time Adoption of International Financial Reporting Standards
> Repeated application of IFRS 1
> Borrowing costs
IAS 1 Presentation of Financial Statements
> Clarification of the requirements for comparative information
IAS 16 Property, Plant and Equipment
> Classification of servicing equipment
IAS 32 Financial Instruments: Presentation
> Tax effect of distribution to holders of equity instruments
IAS 34 Interim Financial Reporting
> Interim financial reporting and segment information for total assets and liabilities
1 January 2013 The Group has not yet determined the extent of the impacts of the amendments, if any.
1 July 2013
AASB 2011-4 Amendments to Australian Accounting Standards to Remove Individual Key Management Personnel Disclosure Requirements [AASB 124]
This Amendment deletes from AASB 124 individual key management personnel disclosure requirements for disclosing entities that are not companies. It also removes the individual KMP disclosure requirements for all disclosing entities in relation to equity holdings, loans and other related party transactions.
1 July 2013 The Group has not yet determined the extent of the impacts of the amendments, however it is not expected to result in a material impact to the Group.
1 July 2013
AASB 1053 Application of Tiers of Australian Accounting Standards
This Standard establishes a differential financial reporting framework consisting of two Tiers of reporting requirements for preparing general purpose financial statements:
(a) Tier 1: Australian Accounting Standards
(b) Tier 2: Australian Accounting Standards – Reduced Disclosure Requirements
Tier 2 comprises the recognition, measurement and presentation requirements of Tier 1 and substantially reduced disclosures corresponding to those requirements.
The following entities apply Tier 1 requirements in preparing general purpose financial statements:
(a) For-profit entities in the private sector that have public accountability (as defined in this Standard); and
(b) The Australian Government and State, Territory and Local Governments.
The following entities apply either Tier 2 or Tier 1 requirements in preparing general purpose financial statements:
(a) For-profit private sector entities that do not have public accountability;
(b) All not-for-profit private sector entities; and
(c) Public sector entities other than the Australian Government and State, Territory and Local Governments.
Consequential amendments to other standards to implement the regime were introduced by AASB 2010-2, 2011-2, 2011-6, 2011-11, 2012-1, 2012-7 and 2012-11.
1 July 2013 There are no changes to the current reporting requirements.
1 July 2013
2. Summary of significant accounting policies (continued)
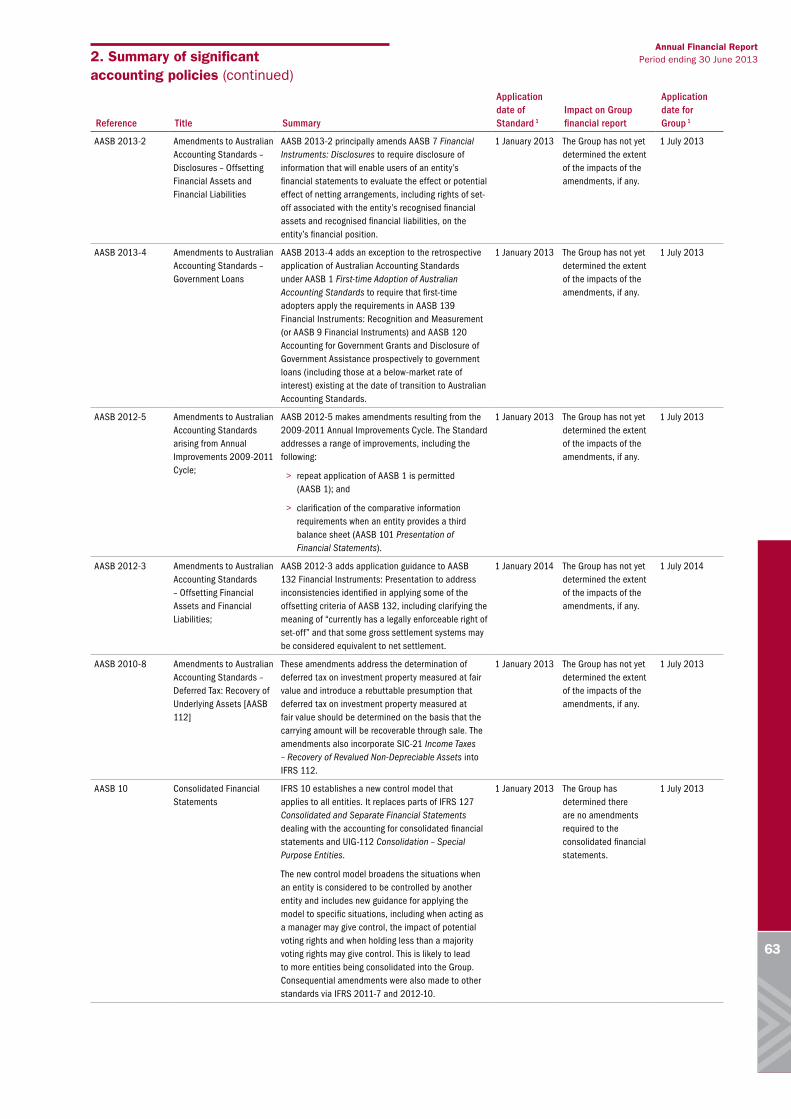
Annual Financial Report Period ending 30 June 2013
63
Reference Title Summary
Application date of Standard 1
Impact on Group financial report
Application date for Group 1
AASB 2013-2 Amendments to Australian Accounting Standards – Disclosures – Offsetting Financial Assets and Financial Liabilities
AASB 2013-2 principally amends AASB 7 Financial Instruments: Disclosures to require disclosure of information that will enable users of an entity’s financial statements to evaluate the effect or potential effect of netting arrangements, including rights of set-off associated with the entity’s recognised financial assets and recognised financial liabilities, on the entity’s financial position.
1 January 2013 The Group has not yet determined the extent of the impacts of the amendments, if any.
1 July 2013
AASB 2013-4 Amendments to Australian Accounting Standards – Government Loans
AASB 2013-4 adds an exception to the retrospective application of Australian Accounting Standards under AASB 1 First-time Adoption of Australian Accounting Standards to require that first-time adopters apply the requirements in AASB 139 Financial Instruments: Recognition and Measurement (or AASB 9 Financial Instruments) and AASB 120 Accounting for Government Grants and Disclosure of Government Assistance prospectively to government loans (including those at a below-market rate of interest) existing at the date of transition to Australian Accounting Standards.
1 January 2013 The Group has not yet determined the extent of the impacts of the amendments, if any.
1 July 2013
AASB 2012-5 Amendments to Australian Accounting Standards arising from Annual Improvements 2009-2011 Cycle;
AASB 2012-5 makes amendments resulting from the 2009-2011 Annual Improvements Cycle. The Standard addresses a range of improvements, including the following:
> repeat application of AASB 1 is permitted (AASB 1); and
> clarification of the comparative information requirements when an entity provides a third balance sheet (AASB 101 Presentation of Financial Statements).
1 January 2013 The Group has not yet determined the extent of the impacts of the amendments, if any.
1 July 2013
AASB 2012-3 Amendments to Australian Accounting Standards – Offsetting Financial Assets and Financial Liabilities;
AASB 2012-3 adds application guidance to AASB 132 Financial Instruments: Presentation to address inconsistencies identified in applying some of the offsetting criteria of AASB 132, including clarifying the meaning of “currently has a legally enforceable right of set-off” and that some gross settlement systems may be considered equivalent to net settlement.
1 January 2014 The Group has not yet determined the extent of the impacts of the amendments, if any.
1 July 2014
AASB 2010-8 Amendments to Australian Accounting Standards – Deferred Tax: Recovery of Underlying Assets [AASB 112]
These amendments address the determination of deferred tax on investment property measured at fair value and introduce a rebuttable presumption that deferred tax on investment property measured at fair value should be determined on the basis that the carrying amount will be recoverable through sale. The amendments also incorporate SIC-21 Income Taxes – Recovery of Revalued Non-Depreciable Assets into IFRS 112.
1 January 2013 The Group has not yet determined the extent of the impacts of the amendments, if any.
1 July 2013
AASB 10 Consolidated Financial Statements
IFRS 10 establishes a new control model that applies to all entities. It replaces parts of IFRS 127 Consolidated and Separate Financial Statements dealing with the accounting for consolidated financial statements and UIG-112 Consolidation – Special Purpose Entities.
The new control model broadens the situations when an entity is considered to be controlled by another entity and includes new guidance for applying the model to specific situations, including when acting as a manager may give control, the impact of potential voting rights and when holding less than a majority voting rights may give control. This is likely to lead to more entities being consolidated into the Group. Consequential amendments were also made to other standards via IFRS 2011-7 and 2012-10.
1 January 2013 The Group has determined there are no amendments required to the consolidated financial statements.
1 July 2013
2. Summary of significant accounting policies (continued)

64
Reference Title Summary
Application date of Standard 1
Impact on Group financial report
Application date for Group 1
AASB 11 Joint Arrangements IFRS 11 replaces IFRS 131 Interests in Joint Ventures and UIG-113 Jointly- controlled Entities – Non-monetary Contributions by Ventures. IFRS 11 uses the principle of control in IFRS 10 to define joint control, and therefore the determination of whether joint control exists may change. In addition IFRS 11 removes the option to account for jointly controlled entities using proportionate consolidation. Instead, accounting for a joint arrangement is dependent on the nature of the rights and obligations arising from the arrangement. Joint operations that give the venturers a right to the underlying assets and obligations themselves is accounted for by recognising the share of those assets and obligations. Joint ventures that give the venturers a right to the net assets is accounted for using the equity method
Consequential amendments were also made to other standards via IFRS 2011-7, 2010-10 and 128.
1 January 2013 The Group has not yet determined the extent of the impacts of the amendments, if any.
1 July 2013
AASB 12 Disclosure of Interests in Other Entities
IFRS 12 includes all disclosures relating to an entity’s interests in subsidiaries, joint arrangements, associates and structured entities. New disclosures have been introduced about the judgments made by management to determine whether control exists, and to require summarised information about joint arrangements, associates and structured entities and subsidiaries with non-controlling interests.
1 January 2013 The Group has not yet determined the extent of the impacts of the amendments, if any.
1 July 2013
AASB 13 Fair Value Measurement IFRS 13 establishes a single source of guidance under IFRS for determining the fair value of assets and liabilities. IFRS 13 does not change when an entity is required to use fair value, but rather, provides guidance on how to determine fair value under IFRS when fair value is required or permitted by IFRS. Application of this definition may result in different fair values being determined for the relevant assets.
IFRS 13 also expands the disclosure requirements for all assets or liabilities carried at fair value. This includes information about the assumptions made and the qualitative impact of those assumptions on the fair value determined.
Consequential amendments were also made to other standards via IFRS 2011-8.
1 January 2013 The Group has not yet determined the extent of the impacts of the amendments, if any.
1 July 2013
2. Summary of significant accounting policies (continued)

Annual Financial Report Period ending 30 June 2013
65
Reference Title Summary
Application date of Standard 1
Impact on Group financial report
Application date for Group 1
AASB 9 Financial Instruments AASB 9 includes requirements for the classification and measurement of financial assets resulting from the first part of Phase 1 of the IASB’s project to replace IAS 39 Financial Instruments: Recognition and Measurement (AASB 139 Financial Instruments: Recognition and Measurement). It was further amended by AASB 2010-7 to reflect amendments to the accounting for financial liabilities.
These requirements improve and simplify the approach for classification and measurement of financial assets compared with the requirements of AASB 139. The main changes are described below.
(a) Financial assets that are debit instruments are classified based on (1) the objective of the entity’s business model for managing the financial assets; (2) the characteristics of the contractual cash flows. This replaces the numerous categories of financial assets in AASB 139, each of which had its own classification criteria.
(b) AASB 9 allows an irrevocable election on initial recognition to present gains and losses on investments in equity instruments that are not held for trading in other comprehensive income. Dividends in respect of these investments that are a return on investment can be recognised in profit or loss and there is no impairment or recycling on disposal of the instrument.
(c) Financial assets can be designated and measured at fair value through profit or loss at initial recognition if doing so eliminates or significantly reduces a measurement or recognition inconsistency that would arise from measuring assets or liabilities, or recognising the gains and losses on them, on different bases.
(d) Where the fair value option is used for financial liabilities the change in fair value is to be accounted for as follows:
The change attributable to changes in credit risk are presented in other comprehensive income (OCI).
The remaining change is presented in profit or loss.
If this approach creates or enlarges an accounting mismatch in the profit or loss, the effect of the changes in credit risk are also presented in profit or loss.
Consequential amendments were also made to other standards as a result of AASB 9, introduced by AASB 2009-11 and superseded by AASB 2010-7 and 2010-10.
1 January 2013 2
The Group has not yet determined the extent of the impacts of the amendments, if any.
1 January 2013
AASB 2012-2 Amendments to Australian Accounting Standards – Disclosures – Offsetting Financial Assets and Financial Liabilities
AASB 2012-2 principally amends AASB 7 Financial Instruments: Disclosures to require disclosure of the effect or potential effect of netting arrangements. This includes rights of set-off associated with the entity’s recognised financial assets and liabilities on the entity’s financial position, when the offsetting criteria of AASB 132 are not all met.
1 January 2013 The Group has not yet determined the extent of the impacts of the amendments, if any.
1 July 2013
Interpretation 21 Levies The Interpretation confirms that a liability to pay a levy is only recognised when the activity that triggers the payment occurs. Applying the going concern assumption does not create a constructive obligation.
1 January 2014 The Group has not yet determined the extent of the impacts of the amendments, if any.
1 July 2014
1 Designates the beginning of the applicable annual reporting period unless otherwise stated.
2 AASB ED 215 Mandatory effective date of IFRS 9 proposes to defer the mandatory effective date of AASB 9 to annual periods beginning on or after 1 January 2013, with early application permitted.
3 These IFRS amendments have not yet been adopted by the AASB. In order to claim compliance with IFRS, these amendments should be noted in the financial statements.
2. Summary of significant accounting policies (continued)

66
2.3 Basis of consolidationThe consolidated financial statements comprise the financial statements of Bendigo and Adelaide Bank Limited and all of its controlled entities (the Group). Interests in joint ventures are equity accounted and are not part of the consolidated Group.
A controlled entity is any entity (including special purpose entities) over which Bendigo and Adelaide Bank Limited has the power to govern directly or indirectly decision-making in relation to financial and operating policies, so as to obtain benefits from their activities. The existence and effect of potential voting rights that are currently exercisable or convertible are considered when assessing whether the Group controls another entity.
Controlled entities prepare financial reports for consolidation in conformity with Group accounting policies. Adjustments are made to bring into line any dissimilar accounting policies that may exist. The financial statements of controlled entities are prepared for the same reporting period as the parent company.
All inter-company balances and transactions between entities in the Group have been eliminated on consolidation. Where a controlled entity has been sold or acquired during the year its operating results have been included to the date control ceased or from the date control was obtained.
Investments in subsidiaries held by Bendigo and Adelaide Bank Limited are accounted for at cost in separate financial statements of the parent entity.
The acquisition of subsidiaries is accounted for using the purchase method of accounting. The purchase method of accounting involves allocating the cost of the business combination to the fair value of the assets acquired and the liabilities and contingent liabilities assumed at the date of acquisition.
Minority interest not held by the Group are allocated their share of net profit after tax in the income statement and are presented within equity in the consolidated balance sheet, separately from parent shareholders’ equity.
2.4 Business combinationsThe purchase method of accounting is used to account for all business combinations regardless of whether equity instruments or other assets are acquired. Cost is measured as the fair value of the assets given, shares issued or liabilities incurred or assumed at the date of exchange. Where equity instruments are issued in a business combination, the fair value of the instruments is their published price at the date of exchange unless, in rare circumstances, it can be demonstrated that the published price at the date of exchange is an unreliable indicator of fair value and that other evidence and valuation methods provide a more reliable measure of fair value. Transaction costs arising on the issue of equity instruments are recognised directly in equity.
Except for non-current assets or disposal groups classified as held for sale (which are measured at fair value less costs to sell), all identifiable assets acquired and liabilities and contingent liabilities assumed in a business combination are measured initially at their fair values at the acquisition date, irrespective of the extent of any minority interest. The excess of the cost of the business combination over the net fair value of the Group’s share of the identifiable net assets acquired is recognised as goodwill. If the cost of acquisition is less than the Group’s share of the net fair value of the identifiable net assets of the subsidiary, the difference is recognised as a gain in the income statement, but only after a reassessment of the identifiable net assets and measurement of the net assets acquired.
Where settlement of any part of the consideration is deferred, the amounts payable in the future are discounted to their present value as at the date of exchange. The discount rate used is the entity’s incremental borrowing rate, being the rate at which a similar borrowing could be obtained from an independent financier under comparable terms and conditions.
2.5 Changes in accounting policiesThe accounting policies are consistent with those applied in the previous financial year and corresponding interim period except as follows:
The Group has adopted the following new and amended Australian Accounting Standards and AASB Interpretations as at 1 July 2012
> AASB 1054 Australian Additional Disclosures
> AASB 2010-6 Amendments to Australian Accounting Standards – Disclosures on Transfers of Financial Assets [AASB 1 and AASB 7]
> AASB 1048 Interpretation of Standards
> AASB 2010-8 Amendments to Australian Accounting Standards – Deferred Tax: Recovery of Underlying Assets [AASB 112]
> AASB 2011-9 Amendments to Australian Accounting Standards – Presentation of Other Comprehensive Income [AASB 1,5,7,101,112,120,121,132,133,134,1039,1049]
When the adoption of the Standard or Interpretation is deemed to have an impact on the financial statements or performance of the Group, its impact is described below:
AASB 1054 Australian Additional Disclosures (amendment)This standard is a consequence of phase 1 of the joint Trans-Tasman Convergence project of the AASB and FRSB. This standard relocates all Australian specific disclosures from other standards to one place and revises disclosures in the following areas: compliance with Australian Accounting Standards, the statutory basis or reporting framework for financial statements, whether the financial statements are general purpose or special purpose, audit fees and imputation credits.
AASB 2010-6 Amendments to Australian Accounting StandardsThis standard makes amendments to increase the disclosure requirements for transactions involving transfers of financial assets. Disclosures require enhancements to the existing disclosure in IFRS 7 where an asset is transferred but is not derecognised and introduce new disclosure for assets that are derecognised but the entity continues to have a continuing exposure to the asset after the sale.
AASB 1048 Amendments to Australian Accounting StandardsThis standard identifies the Australian interpretations and classifies them into two groups: those that correspond to an IASB interpretation and those that do not. Entities are required to apply each relevant Australian interpretation in preparing financial statements that are within the scope of the standard. The revised version of AASB 1048 updates the lists of interpretations for new and amended interpretations issued since the June 2010 version of AASB 1048.
2. Summary of significant accounting policies (continued)
Annual Financial Report Period ending 30 June 2013
67
AASB 2010-8 Amendments to Australian Accounting StandardsThese amendments address the determination of deferred tax on investment property measured at fair value and introduce a rebuttable presumption that deferred tax on investment property measured at fair value should be determined on the basis that the carrying amount will be recoverable through sale. The amendments also incorporate SIC-21 Income Taxes – Recovery of Revalued non-Depreciable Assets into IFRS 112.
AASB 2011-9 Amendments to Australian Accounting StandardsThe main change resulting from the amendments is a requirement for entities to group items presented in other comprehensive income (OCI) on the basis of whether they are potentially reclassifiable to profit or loss subsequently (reclassification adjustments). These amendments do not remove the option to present profit or loss and other comprehensive income in two statements.
The amendments do not change the option to present items of OCI either before tax or net of tax. However, if the items are presented before tax then the tax related to each of the two groups of OCI items (those that might be reclassified to profit or loss and those that will not be reclassified) must be shown separately.
2.6 Significant accounting judgments, estimates and assumptions
(i) Significant accounting judgmentsIn the process of applying the Group’s accounting policies, management has made the following judgments, apart from those involving estimations, which have the most significant effect on the amounts recognised in the financial statements:
Cash earningsCash earnings are considered by management as a key indicator representing the performance of the core business activities of the Group. The basis for determining cash earnings is the statutory profit after tax, adjusted for specific items after tax, acquired intangibles amortisation after tax and preference share/step up preference share appropriations. Cash earnings have been used in a number of key indicator calculations such as Note 8 – earnings per ordinary share and Note 10 – return on average ordinary equity.
Specific itemsSpecific items are those items that are deemed to be outside of our core activities and such items are not considered to be representative of the Group’s ongoing financial performance.
Recovery of deferred tax assetsDeferred tax assets are recognised for deductible temporary differences as management considers that it is probable that future taxable profits will be available to utilise those temporary differences.
SecuritisationsSecuritised positions are held through a number of Special Purpose Entities (SPEs). As the Bank is exposed to the majority of the residual risk associated with these SPEs, their underlying assets, liabilities, revenues and expenses are reported in the Bank’s consolidated balance sheet and income statement. At each reporting period, the Bank reassesses the requirement to consolidate these SPEs in accordance with AASB 127 and judgment is exercised.
(ii) Significant accounting estimates and assumptionsThe carrying amounts of certain assets and liabilities are often determined based on estimates and assumptions of future events. The key estimates and assumptions that have a significant risk of causing a material adjustment to the carrying amounts of certain assets and liabilities within the next annual reporting period are:
Impairment of goodwill and intangibles with indefinite useful livesThe Group determines whether goodwill and intangibles with indefinite useful lives are impaired at least on an annual basis. This requires an estimation of the recoverable amount of the cash-generating units to which the goodwill and intangibles with indefinite useful lives are allocated. The assumptions used in this estimation of recoverable amount and the carrying amount of goodwill and intangibles with indefinite useful lives are discussed in Note 26.
Impairment of financial assets and property, plant & equipmentThe Group has to make a judgment as to whether an impairment trigger is evident at each balance date. If a trigger is evident the asset must be tested for impairment, which requires the estimation of future cash flows and the use of an appropriate discount rate.
Impairment of non-financial assets other than goodwillThe Group assess impairment of all assets at each reporting date by evaluating conditions specific to the Group and to the particular asset that may lead to impairment. If an impairment trigger exists, the recoverable amount of the asset is determined. This involves value in use calculations, which incorporate a number of key estimates and assumptions.
Employee benefits (leave provisions)The carrying amount of leave liabilities is calculated based on assumptions and estimates of when employees will take leave and the prevailing wage rates at the time the leave will be taken. Long service leave liability also requires a prediction of the number of employees that will achieve entitlement to long service leave.
Superannuation defined benefit planVarious actuarial assumptions are required when determining the Group’s superannuation obligations. The bank’s policy on superannuation defined benefit plan is disclosed in Note 2.24 and Note 44.
Loan provisioningThe Group determines whether loans are impaired on an ongoing basis. This requires an estimation of the value of future cash flows. The bank’s policy for calculation of loan loss allowance is disclosed in Note 2.13.
Investment propertyThe fair value of investment properties are based on estimated future cashflows using market indices of property values and long term discount rates. The Bank’s policy for calculation of the fair value is disclosed in Note 2.17.
2. Summary of significant accounting policies (continued)

68
2.7 ComparativesWhere necessary, comparatives have been reclassified and repositioned for consistency with current year disclosures.
2.8 Trustee and funds management activitiesControlled entities of the Bank act as the Trustee and/or Manager for a number of funds. The assets and liabilities of these funds are not included in the consolidated financial statements. The parent entity does not have direct or indirect control of the funds as defined by Accounting Standard AASB 127 Consolidated and Separate Financial Statements. Commissions and fees generated by the funds management activities are brought to account when earned.
2.9 Foreign currency transactions and balances Both the functional and presentation currency of Bendigo and Adelaide Bank Limited and each of its subsidiaries is Australian dollars (AUD). Transactions in foreign currencies are initially recorded in the functional currency at the exchange rates ruling on the date of the transaction.
All amounts are expressed in Australian currency and all references to "$" are to Australian dollars unless otherwise stated. Amounts receivable and payable in foreign currencies at balance date are converted at the rates of exchange ruling at that date. Exchange differences relating to amounts payable and receivable in foreign currencies are brought to account as exchange gains or losses in the income statement in the financial year in which the exchange rates change.
2.10 Cash and cash equivalentsCash on hand and in banks and short-term deposits are stated at nominal value.
For the purposes of the cash flow statement, cash includes cash on hand and in banks, short-term money market investments readily convertible into cash within two working days, net of outstanding overdrafts.
Bank overdrafts are carried at amortised cost. Interest is charged as an expense as it accrues.
2.11 Classification of financial instrumentsFinancial instruments in the scope of AASB 139 Financial Instruments: Recognition and Measurement are classified into one of five categories, which determine the accounting treatment of the financial instrument.
The classification depends on the purpose for which the instruments were acquired. Designation is re-evaluated at each financial year end, but there are restrictions on reclassifying to other categories.
The classifications are:
> Loans & receivables - measured at amortised cost
> Held to maturity - measured at amortised cost
> Held for trading - measured at fair value with changes in fair value charged to the income statement
> Available for sale - measured at fair value with changes in fair value taken to equity
> Non-trading liabilities - measured at amortised cost
All derivative contracts are recorded at fair value in the balance sheet.
2.12 Financial assets and financial liabilities All investments are initially recognised at cost, being the fair value of the consideration given and including acquisition charges associated with the investment. After initial recognition, investments, which are classified as held for trading and available-for-sale, are measured at fair value. Gains or losses on investments held for trading are recognised in the income statement.
All regular way purchases and sales of financial assets are recognised on the settlement date i.e. the date the Group settles the purchase of the asset. Regular way purchases or sales are purchases or sales of financial assets under contracts that require delivery of the assets within the period established generally by regulation or convention in the market place.
Gains or losses on available-for-sale investments are recognised as a separate component in equity until the investment is sold, collected or otherwise disposed of, or until the investment is determined to be impaired, at which time the cumulative gain or loss previously reported in equity is included in the income statement.
Treasury financial assets – held to maturity Non-derivative financial assets with fixed or determinable payments and fixed maturity are classified as held-to-maturity where the Group has the positive intention and ability to hold to maturity. Investments intended to be held for an undefined period are not included in this classification.
Investments that are intended to be held to maturity are subsequently measured at amortised cost using the effective interest method.
Amortised cost is calculated by taking into account any discount or premium on acquisition, over the period to maturity.
For investments carried at amortised cost, gains and losses are recognised in income when the investments are derecognised or impaired, as well as through the amortisation process.
Treasury financial liabilities – deposits and subordinated debtAll treasury funding instruments are initially recognised at cost, being the fair value of the consideration given and including charges associated with the issue of the instrument. They are subsequently measured at amortised cost using the effective interest method.
Amortised cost is calculated by taking into account any discount or premium on acquisition, over the period to maturity.
For liabilities carried at amortised cost, gains and losses are recognised in the income statement when the instruments are derecognised. Treasury funding instruments that are hedged are treated in accordance with the accounting policy for hedges.
Funding instruments that are issued in currencies other than AUD are accounted for at amortised cost. These transactions are restated to AUD equivalents each month with adjustments taken directly to income.
Financial assets – available for sale share investmentsInvestment securities available for sale consist of securities that are not actively traded by the Group.
Fair value of quoted investments in active markets are based on current bid prices. If the relevant market is not considered active (or the securities are unlisted), the Group establishes fair value by using valuation techniques, including recent arm's length transactions, discounted cash flow analysis, option pricing models and other valuation techniques commonly used by market participants.
2. Summary of significant accounting policies (continued)

Annual Financial Report Period ending 30 June 2013
69
Purchases and sales of financial assets and liabilities that require delivery of assets/securities within the time frame, and generally established by regulation or convention in the market place are recognised on the settlement date i.e. the date that the Group receives or pays the principal sum.
2.13 Loans and receivablesLoans and receivables are carried at amortised cost, using the effective interest method. The effective interest rate calculation includes the contractual terms of loans together with all fees, transaction costs and other premiums or discounts.
Loans with renegotiated terms are accounted for in the same manner, taking account of any change to the terms of the loan.
All loans are subject to continuous management review to assess whether there is any objective evidence that any loan or group of loans is impaired.
Impairment loss is measured as the difference between the loan's carrying amount and the value of estimated future cash flows (excluding future credit losses that have not been incurred) discounted at the loan's original effective interest rate. Impairment losses are recognised in the income statement.
Deferred costs include costs associated with the acquisition, origination or securitisation of loan portfolios. These costs are amortised through the income statement over the life of the loans in these portfolios.
Specific provisionA specific provision is recognised for all impaired loans when there is reasonable doubt over the collectability of principal and interest in accordance with the loan agreement. All bad debts are written off against the specific provision in the period in which they are classified as not recoverable.
The provision is determined by specific identification or by estimation of expected losses in relation to loan portfolios where specific identification is impractical, based on historical impairment experience for these portfolios. These portfolios include unsecured credit cards, overdrawn accounts and personal loans, unsecured mortgage loans (property realisation shortfalls) where provisions are calculated based on historical loss experience.
Collective provisionIndividual loans not subject to specific provisioning are grouped together according to their risk characteristics and are then assessed for impairment. Based on historical loss data and current available information for assets with similar risk characteristics, the appropriate collective provision is raised. Adjustments to the collective provision are recognised in the income statement.
General reserve for credit lossesAustralian Prudential Regulation Authority (APRA) requires that banks maintain a general reserve for credit losses to cover risks inherent in loan portfolios. In certain circumstances the collective provision can be included in this assessment.
Movements in the general reserve for credit losses are recognised as an appropriation of retained earnings.
2.14 Investments accounted for using the equity method The Group's investment in joint ventures is accounted for under the equity method of accounting in the consolidated financial statements. These are entities in which the Group has significant influence and is not a subsidiary. The financial statements of joint ventures are used by the Group to apply the equity method. The accounting policies of the joint ventures and the Group are consistent.
The investments in the joint ventures are carried at cost plus post-acquisition changes in the holding entity’s share of the results of operations of the joint ventures, less any impairment in value. The income statement of the holding entity reflects the share of the results of operations of the joint ventures.
Dividends receivable from joint ventures are recognised in the holding entity’s income statement when received.
When the Group’s share of losses in a joint venture equals or exceeds its interest in the joint venture, including any unsecured long-term receivables and loans, the Group does not recognise further losses, unless it has incurred obligations or made payments on behalf of the joint venture.
2.15 Property, plant & equipment
Cost and valuationPlant and equipment is measured at cost less accumulated depreciation and any impairment in value. Land is measured at fair value. Buildings are measured at fair value less accumulated depreciation.
Depreciation is calculated on a straight-line basis over the estimated useful life of the asset as follows:
Asset category 2013 Years 2012 Years
Freehold buildings 40 40
Leasehold improvements 3 - 10 3 - 10
Plant & equipment 2 - 10 2 - 10
Impairment Management has identified cash generating units and applicable impairment indicators in accordance with AASB 136 Impairment of Assets.
The carrying values of plant and equipment are reviewed for impairment when events or changes in circumstances indicate the carrying value may not be recoverable. If any such indication exists and where the carrying values exceed the estimated recoverable amount, the assets are written down to their recoverable amount.
The recoverable amount of plant and equipment is the greater of fair value less costs to sell and value in use. In assessing value in use, the estimated future cash flows are discounted to their present value using a pre-tax discount rate that reflects current market assessments of the time value of money and the risks specific to the asset.
For an asset that does not generate largely independent cash inflows, the recoverable amount is determined for the cash-generating unit to which the asset belongs.
Impairment losses are recognised in the income statement, unless they relate to revalued assets. Impairment losses of revalued assets are recognised in the revaluation reserve.
2. Summary of significant accounting policies (continued)

70
RevaluationsFollowing initial recognition at cost, land and buildings are carried at a revalued amount which is the fair value at the date of the revaluation less any subsequent accumulated depreciation on buildings and accumulated impairment losses.
Fair value is determined by reference to market-based evidence, which is the amount which the assets could be exchanged between a knowledgeable willing buyer and a knowledgeable willing seller in an arm's length transaction as at the valuation date.
Any revaluation surplus is credited to the asset revaluation reserve included in the statement of comprehensive income and the equity section of the balance sheet unless it reverses a revaluation decrease of the same asset previously recognised in the income statement.
Any revaluation deficit is recognised in the income statement unless it directly offsets a previous surplus of the same asset recognised in the asset revaluation reserve.
An annual transfer from the asset revaluation reserve is made to retained earnings for the depreciation relating to the revaluation surplus. In addition, any accumulated depreciation as at the revaluation date is eliminated against the gross carrying amount of the asset and the net amount is restated to the revalued amount of the asset.
Upon disposal, any revaluation reserve relating to the particular asset being disposed is transferred to retained earnings.
The fair value of property, plant and equipment is assessed at each reporting date. Also, external valuations are performed every three years (or more often if circumstances require) ensuring that the carrying amount does not differ materially from the asset's fair value at the balance sheet date.
DerecognitionAn item of property, plant and equipment is derecognised upon disposal or when no future economic benefits are expected to arise from the continued use of the asset.
Any gain or loss arising on derecognition of the asset (calculated as the difference between the net disposal proceeds and the carrying amount of the item) is included in the income statement in the year the item is derecognised.
2.16 Assets held for saleAssets are classified as held for sale, when their carrying amounts are expected to be recovered principally through sale within twelve months.
They are measured at the lower of carrying amount or fair value less costs to sell, unless the nature of the assets requires they be measured in line with another accounting standard.
Assets classified as held for sale are neither amortised nor depreciated.
2.17 Investment propertiesInvestment properties are measured initially at cost, including transaction costs. The carrying amount includes the cost of replacing part of an investment property at the time the cost is incurred if the recognition criteria are met, and excludes the costs of day-to-day servicing of an investment property.
Subsequent to initial recognition, fair value is determined by discounting the expected future cash flows of the portfolio, taking account of the restrictions on the ability to realise the investment property due to contractual obligations. Assumptions used in the modelling of future cash flows are sourced from market indexes of property values and long term growth/discount rates appropriate to residential property. Gains or losses arising from changes in the fair values of investment properties are recognised in profit and loss in the year in which they arise.
2.18 GoodwillGoodwill on acquisition is initially measured at cost being the excess of the cost of the business combination over the acquirer's interest in the net fair value of the identifiable assets, liabilities and contingent liabilities at date of acquisition.
Following initial recognition, goodwill is measured at cost less any accumulated impairment loss. Goodwill is not amortised. Goodwill is reviewed for impairment annually, or more frequently, if events or changes in circumstances indicate that the carrying value may be impaired.
Management has identified cash generating units and applicable impairment indicators in accordance with AASB 136 Impairment of Assets.
Goodwill with respect to business combinations is allocated to identify cash generating units expected to benefit from the synergies of the combination.
Impairment is determined by assessing the recoverable amount of the cash generating unit to which the goodwill relates.
Where the recoverable amount of the cash generating unit is less than the carrying amount, which includes the allocated goodwill, an impairment loss is recognised in the income statement, with the goodwill being impaired first. Impairment losses of goodwill are not subsequently reversed.
Where goodwill forms part of a cash generating unit and part of the operation within that unit is disposed of, the goodwill associated with the operation disposed of is included in the carrying amount of the operation when determining the gain or loss on disposal of the operation.
Goodwill disposed of in this circumstance is measured on the basis of the relative values of the operation disposed of and the portion of the cash generating unit retained.
2.19 Intangible assets
Acquired both separately and from a business combinationIntangible assets acquired separately are capitalised at cost and from a business combination are capitalised at fair value as at the date of acquisition.
Following initial recognition, the cost model is applied to the class of intangible assets.
2. Summary of significant accounting policies (continued)

Annual Financial Report Period ending 30 June 2013
71
The useful lives of these intangible assets are assessed to be either finite or indefinite.
Where amortisation is charged on assets with finite lives, this expense is taken to the income statement. Intangible assets, excluding development costs, created within the business are not capitalised and expenditure is charged against profits in the year in which the expenditure is incurred.
Intangible assets are tested for impairment where an indicator of impairment exists, and in the case of indefinite useful life intangibles, annually, either individually or at the cash generating unit level. Useful lives are also examined on an annual basis and adjustments, where applicable, are made on a prospective basis.
The only intangible asset with an indefinite useful life currently carried by the Group is the trustee licence relating to Sandhurst Trustees Limited.
Computer softwareComputer software, other than software that is an integral part of the computer hardware, is capitalised as intangible software and amortised on a straight-line basis over the useful life of the asset.
Research and development costsResearch costs are expensed as incurred.
Development expenditure incurred on an individual project is carried forward when it is probable the future economic benefits attributable to the asset will flow to the Group.
Following the initial recognition of the development expenditure, the cost model is applied requiring the asset to be carried at cost less any accumulated amortisation and accumulated impairment losses.
Any expenditure carried forward is amortised over the period of expected future sales from the related project or expected useful life.
The carrying value of development costs is reviewed for impairment annually when the asset is not yet in use, or more frequently when an indicator of impairment arises during the reporting period indicating that the carrying value may not be recoverable.
A summary of the policies applied to the Group's intangible assets (excluding goodwill) is as follows:
2. Summary of significant accounting policies (continued)
Trustee LicenceComputer software/ Development costs
Intangible assets acquired in business combination
Useful lives Indefinite Finite Finite
Method used Not amortised or revalued Usually not in excess of 5 years – straight line (major software systems – 7 years)
Amortised to reflect period and pattern of economic benefits
Internally generated/acquired Acquired Internally generated or acquired Acquired
Impairment test/recoverable amount testing
Annually and where an indicator of impairment exists
Annually and where an indicator of impairment exists
Annually and where an indicator of impairment exists
Gains or losses arising from derecognition of an intangible asset are measured as the difference between the net disposal proceeds and the carrying amount of the asset and are recognised in the income statement where the asset is derecognised.
2.20 Trade and other payablesLiabilities for trade creditors and other amounts are carried at amortised cost, which is the fair value of the consideration to be paid in the future for goods and services received, whether or not billed to the consolidated entity. Payables to related parties are carried at the amortised cost.
Interest, when charged by the lender, is recognised on an effective interest rate basis.
Deferred cash settlements are recognised at the present value of the outstanding consideration payable on the acquisition of an asset discounted at prevailing commercial borrowing rates.
Interest, when charged on payables to related parties, is recognised as an expense on an accrual basis using the effective interest method.
2.21 DepositsAll deposits and borrowings are initially recognised at cost, being the fair value of the consideration received net of issue costs associated with the borrowing. After initial recognition, interest-bearing borrowings are subsequently measured at amortised cost using the effective interest method. Amortised cost is calculated by taking into account any issue costs, and any discount or premium on settlement.
Gains and losses are recognised in the income statement when the liabilities are derecognised and as well as through the amortisation process.

72
2.22 ProvisionsProvisions are recognised when the Group has a legal, equitable or constructive obligation to make a future sacrifice of economic benefits to other entities as a result of past transactions or other past events, and it is probable that a future sacrifice of economic benefits will be required and a reliable estimate can be made of the amount of the obligation.
If the effect of the time value of money is material, provisions are determined by discounting the expected cash flows at a pre-tax rate that reflects current market assessments of the time value of money and, where appropriate, the risks specific to the liability.
Where discounting is used, the increase in the provision due to the passage of time is recognised as a finance cost.
A provision for dividend is not recognised as a liability unless the dividend is declared, determined or publicly recommended on or before the reporting date.
2.23 Employee benefits
Wages and Salaries, Annual leave and Sick leaveLiabilities for wages and salaries have been recognised and measured as the amount which the Group has a present obligation to pay, at balance date, in respect of employees' service up to that date. Liabilities have been calculated at nominal amounts based on wage and salary rates current at balance date and include related on-costs. Wages and salaries liabilities are recognised in payables.
Annual leave liabilities are accrued on the basis of full pro rata entitlement at their nominal amounts, being the amounts estimated to apply when the leave is paid. Sick leave bonus liability has been calculated at balance date in accordance with the relevant Group policy, which provides entitlement dependent on an individual employees’ years of service and unused sick leave.
Long Service LeaveLong service leave has been assessed at full pro rata entitlement in respect of all employees with more than one year’s service. The amount provided meets the requirement of Accounting Standard AASB 119 Employee Benefits, which requires the assessment of the likely number of employees that will ultimately be entitled to long service leave, the estimated salary rates that will apply when the leave is paid, discounted to take account of the time value of money.
Annual leave, sick leave and long service leave liabilities are recognised in provisions.
Superannuation
Accumulation fundContributions are made to an employee accumulation superannuation fund and are charged to expenses when incurred.
Defined benefit planContributions made to the defined benefit plan by entities within the consolidated entity are added to the superannuation asset in the balance sheet. Any actuarial gains or losses are applied to the retained earnings with other fund movements being recognised in the statement of comprehensive income.
2.24 Share based paymentsThe Group provides benefits to its employees (including key management personnel) in the form of share-based payments, whereby employees render services in exchange for shares, rights or options over shares.
There are a number of plans in place to provide these benefits:
1. the Employee Share Plan (ESP), which provides benefits only to the general staff. Executives (including the Managing Director) may not participate in it.Under the terms of the ESP, shares are issued at the prevailing market value at the time of the issues. The shares must be paid for by the staff member. The ESP provides staff members with an interest-free loan for the sole purpose of acquiring Bendigo and Adelaide Bank shares. Dividends paid on shares issued under the plan are applied primarily to repay the loans. Staff cannot deal in the shares until the loan has been repaid.
The unpaid portion of the issued shares, reflected in the outstanding balance of interest-free loans advanced to employees, is accounted for as ESP shares. The outstanding loan value of the ESP shares is deducted from equity in the balance sheet.
The cost of issues under the plan is measured by reference to the fair value of the equity instruments at the date at which they are granted. Shares granted under the ESP, vest immediately and are expensed to the Income Statement with the employee benefits reserve increasing by a corresponding amount.
The last issue under this plan was made in January 2008.
2. the Employee Share Grant SchemeThis Plan was introduced in 2008 and is open to employees (excluding directors and senior executives) of Bendigo and Adelaide Bank and its subsidiaries. Employees may be granted shares annually up to a maximum number determined by the directors having regard to the Bank’s performance. When an eligible employee accepts an invitation to participate in the Scheme, the trustee of the Scheme will acquire shares on behalf of the employee and hold the shares on trust for the employee. Three years after the trustee acquires the shares, they will be transferred to the employee.
The cost of issues under the Scheme is measured by reference to the fair value of the equity instruments at the date at which they are granted. Shares granted under the Scheme vest immediately and are expensed to the Income Statement with the employee benefits reserve increasing by a corresponding amount.
3. Employee Salary Sacrifice, Deferred Share and Performance Share PlanThis Plan was introduced in September 2008 as the Employee Salary Sacrifice and Deferred Share Plan, as a vehicle for employees to purchase shares in the Bank via salary sacrifice. It was amended in August 2009 to allow for the grant of performance shares. Performance shares may be granted to any person employed by or on behalf of a group company who the Board decides are eligible to receive grants. The employee will not have beneficial title to the underlying shares until the relevant performance conditions have been met. The shares will be held by a trustee until that time.
2. Summary of significant accounting policies (continued)

Annual Financial Report Period ending 30 June 2013
73
The cost of equity-settled transactions under this Plan is measured by reference to the fair value of the equity instruments at the date at which they are granted. The fair value is determined with the assistance of an external valuer using a binomial model.
The cost of equity-settled transactions is recognised, together with a corresponding increase to employee benefits reserve, over the period in which the performance conditions are fulfilled (the vesting period), ending on the date on which the relevant executive becomes fully entitled to the award.
The dilutive effect, if any, of outstanding options is reflected as additional share dilution in the computation of diluted earnings per share.
4. The Executive Incentive Plan (EIP), which provides for grants of performance options and rights to key executives, including the Managing Director (discontinued).Under the EIP, eligible executives are granted options and performance rights subject to performance conditions set by the Board. If the performance conditions are satisfied during the relevant performance period, the options and performance rights will vest.
The cost of these equity-settled transactions under the EIP is measured by reference to the fair value of the equity instruments at the date at which they are granted. The fair value is determined with the assistance of an external valuer using a binomial model.
The cost of equity-settled transactions is recognised, together with a corresponding increase to employee benefits reserve, over the period in which the performance conditions are fulfilled (the vesting period), ending on the date on which the relevant executive becomes fully entitled to the award.
The dilutive effect, if any, of outstanding options is reflected as additional share dilution in the computation of diluted earnings per share.
2.25 LeasesThe determination of whether an arrangement is/or contains a lease is based on the substance of the arrangement and requires an assessment of whether the fulfilment of the arrangement is dependent on the use of a specific asset or assets and the arrangement conveys a right to use the asset.
Lease payments for operating leases, where substantially all the risks and benefits remain with the lessor, are charged as expenses over the period of the lease on a straight-line basis unless another systematic basis is more representative of the time pattern of the benefit.
The Group has no leases deemed to be finance leases where substantially all the risks and benefits incidental to the ownership of the asset, but not the legal ownership, are transferred to entities within the Group.
2.26 Financial guaranteesBank guarantees have been issued by the bank on behalf of customers whereby the bank is required to make specified payments to reimburse the holders for a loss they may incur because the customer fails to make a payment.
The fair value of financial guarantee contracts has been assessed using a probability weighted discounted cash flow approach.
In order to estimate the fair value under this approach the following assumptions have been made:
> Probability of default (PD): This represents the
likelihood of the guaranteed party defaulting in a 1
year period and is assessed on historical default
rates.
> Loss given default (LGD): This represents the
proportion of the exposure that is not
expected to be recovered in the event of a default by
the guaranteed party and is based
on historical experience.
> Exposure to default (EAD): This represents the
maximum loss that Bendigo and Adelaide Bank is
exposed to if the guaranteed party were to default.
The model assumes that the guaranteed loan/facility/
contract is at maximum possible exposure at the time
of default.
The value of the financial guarantee over each future year of the guarantees’ life is then equal to PD x LGD x EAD, which is discounted over the contractual term of the guarantee, to reporting date to determine the fair value. The discount rate adopted is the five year Commonwealth government bond yield at 30 June. The contractual term of the guarantee matches the underlying obligations to which it relates.
As guarantees issued by the bank are fully secured and the bank has therefore never incurred a loss in relation to financial guarantees, the LGD (proportion of the exposure that is not expected to be recovered) is zero.
Therefore, the fair value of financial guarantees has not been included in the balance sheet. The nominal value of financial guarantees is disclosed in the “Contingent liabilities” note of this financial report.
2.27 RevenueRevenue is recognised to the extent that it is probable that the economic benefits will flow to the entity and the revenue can be reliably measured. The following specific recognition criteria must also be met before revenue is recognised.
Interest, fees and commissions Control of a right to receive consideration for the provision of, or investment in, assets has been attained.
Interest, fee and commission revenue is brought to account on an accruals basis. Interest is accrued using the effective interest rate method, which is the rate that exactly discounts estimated future cash receipts through the expected life of the financial instrument.
2. Summary of significant accounting policies (continued)

74
Loan origination and loan application feesLoan origination and application fees are recognised as components of the calculation of the effective interest rate method in relation to originated loans. They therefore affect the interest recognised in relation to this portfolio of loans.
The average life and interest recognition pattern of loans in the relevant loan portfolios is reviewed annually to ensure the amortisation methodology for loan origination fees is appropriate.
Unearned income Unearned income on the Group's personal lending and leasing is brought to account over the life of the contracts on an actuarial basis.
Loan portfolio premiumThe loan portfolio premium is included as part of net loans and receivables in the balance sheet. The amortisation of the loan portfolio premium is charged to the income statement on an effective yield basis and is included in net interest income.
Day 1 ProfitWhere the transaction price in a non-active market is different to the fair value from other observable market transactions in the same instrument or based on a valuation technique whose variables include only data from observable markets, the Bank immediately recognises the difference between the transaction price and fair value (a 'Day 1' profit) in the income statement in 'Other income'.
DividendsDividends are recognised when control of a right to receive consideration for the investment in assets is established.
2.28 Borrowing costsBorrowing costs are recognised as an expense when incurred unless they are incurred in relation to qualifying assets.
Borrowing costs for qualifying assets are capitalised as part of the cost of that asset.
2.29 Income taxThe income tax for the period is the tax payable on the current period's taxable income based on the national income tax rate, adjusted for changes in deferred tax assets and liabilities and unused tax losses.
The Group has adopted the balance sheet liability method of tax effect accounting, which focuses on the tax effects of transactions and other events that affect amounts recognised in either the balance sheet or a tax-based balance sheet.
Deferred tax assets and liabilities are recognised for temporary differences, except where the deferred tax asset/liability arises from the initial recognition of an asset or liability in a transaction that is not a business combination and, at the time of the transaction, affects neither the accounting profit nor taxable profit or loss.
Current and deferred tax balances attributable to amounts recognised directly in equity are also recognised directly in equity.
Deferred income tax assets are recognised for all deductible temporary differences, carry-forward of unused tax assets and unused tax losses, to the extent that it is probable that taxable profit will be available against which the deductible temporary differences, and the carry-forward of unused tax assets and unused tax losses can be utilised.
he carrying amount of deferred income tax assets is reviewed at each balance sheet date and reduced to the extent that it is no longer probable that sufficient taxable profit will be available to allow all or part of the deferred income tax asset to be utilised. Unrecognised deferred tax balances are reviewed annually to determine whether they should be recognised.
Deferred income tax assets and liabilities are measured at the tax rates that are expected to apply to the year when the asset is realised or the liability is settled, based on tax rates (and tax laws) that have been enacted or substantively enacted at the balance sheet date.
2.30 Goods and Services Tax (GST) Revenues, expenses and assets are recognised net of the amount of GST except:
> where the GST incurred on a purchase of goods and services is not recoverable from the taxation authority, in which case the GST is recognised as part of the cost of acquisition of the asset or as part of the expense item as applicable; and
> receivables and payables are stated with the amount of GST included.
The net amount of GST recoverable from or payable to the taxation authority is included as part of receivables or payables in the balance sheet. Cash flows are included in the cash flow statement on a gross basis, the GST component of cash flows arising from investing and financing activities, which are recoverable from or payable to the taxation authority are classified as operating cash flows.
2.31 Derecognition of financial instrumentsThe derecognition of a financial instrument takes place when the Group no longer controls the contractual rights that comprise the financial instrument, which is normally the case when the instrument is sold, or all the cash flows attributable to the instrument are passed through to an independent third party.
2.32 Derivative financial instrumentsThe Group uses derivative financial instruments such as foreign currency contracts and interest rate swaps to hedge its risks associated with interest rate and foreign currency fluctuations. Such derivative financial instruments are stated at fair value.
The fair value of forward exchange contracts is calculated by reference to current forward exchange rates with similar maturity profiles. The fair value of interest rate swap contracts is determined by discounting the expected future cash flows associated with the swaps. Discount rates are determined by reference to swap curves available through independent market data providers.
For the purpose of hedge accounting, hedges are classified as either fair value hedges when they hedge the exposure to changes in the fair value of a recognised asset or liability, or cash flow hedges where they hedge exposure to variability in cash flows that is either attributable to a particular risk associated with a recognised asset or liability or a forecasted transaction.
In relation to fair value hedges which meet the conditions for hedge accounting, any gain or loss from remeasuring the hedging instrument at fair value is recognised immediately in the income statement.
Any gain or loss attributable to the hedged risk on remeasurement of the hedged item is adjusted against the carrying amount of the hedged item and recognised in the income statement. Where the adjustment is to the carrying
2. Summary of significant accounting policies (continued)

Annual Financial Report Period ending 30 June 2013
75
amount of a hedged interest-bearing financial instrument, the adjustment is amortised to the income statement such that it is fully amortised by maturity.
In relation to cash flow hedges, to hedge firm commitments which meet the conditions for hedge accounting, the portion of the gain or loss on the hedging instrument that is determined to be an effective hedge is recognised directly in equity and the ineffective portion is recognised in the income statement.
The Group tests each of the designated cash flow hedges for effectiveness on a monthly basis both retrospectively and prospectively using regression analysis. A minimum of 30 data points is used for regression analysis and if the testing falls within the 80:125 range the hedge is considered highly effective and continues to be designated as a cash flow hedge.
When the hedged firm commitment results in the recognition of an asset or liability, then, at the time the asset or liability is recognised, the associated gains or losses that had previously been recognised in equity are included in the initial measurement of the acquisition cost or other carrying amount of the asset or liability. For all other cash flow hedges, the gains or losses that are recognised in equity are transferred to the income statement in the same year in which the hedged firm commitment affects the net profit and loss, for example when the future sale actually occurs.
For derivatives that do not qualify for hedge accounting, any gains or losses arising from changes in fair value are taken directly to net profit or loss for the year.
Hedge accounting is discontinued when the hedging instrument expires or is sold, terminated or exercised, or no longer qualifies for hedge accounting.
At that point in time, any cumulative gain or loss on the hedging instrument recognised in equity is kept in equity until the forecasted transaction occurs.
If a hedged transaction is no longer expected to occur, the net cumulative gain or loss recognised in equity is transferred to net profit or loss for the year.
2.33 Issued ordinary capitalIssued and paid up ordinary capital is recognised at the fair value of the consideration received by the company. Any transaction costs (net of any tax benefit) arising on the issue of ordinary shares are recognised directly in equity as a reduction of the share proceeds received.
2.34 Hybrid capital instruments
Perpetual non-cumulative redeemable convertible preference sharesPreference capital is recognised at the fair value of the consideration received by the company. Any transaction costs (net of any tax benefit) arising on the issue of preference shares are recognised directly in equity as a reduction of the share proceeds received. Dividends on the shares are recognised as a distribution of equity.
Convertible preference sharesThese instruments are classified as debt within the balance sheet and distributions to the holders are treated as interest expense in the income statement.
Step up preference sharesThese instruments are classified as equity and the dividends are recognised as a distribution of equity.
2.35 Earnings per ordinary share (EPS)Basic EPS is calculated as net profit attributable to members, adjusted to exclude cost of servicing equity (other than dividends) and preference share dividends, divided by the weighted average number of ordinary shares, adjusted for any bonus element.
Diluted EPS is calculated as net profit attributable to members, adjusted for:
> costs of servicing equity (other than dividends), preference share dividends; the after tax effect of dividends and interest associated with dilutive potential ordinary shares that have been recognised as expenses; and
> other non-discretionary changes in revenues or expenses during the period that would result from the dilution of potential ordinary shares;
divided by the weighted average number of ordinary shares and dilutive potential ordinary shares, adjusted for any bonus element.
Cash basis EPS is calculated as net profit attributable to members, adjusted for:
> after tax intangibles amortisation (except intangible software amortisation);
> after tax specific income and expense items; and
> costs of servicing equity (other than dividends) and preference share dividends;
divided by the weighted average number of ordinary shares, adjusted for any bonus element.
3. Segment results
Segment informationThe Group has identified its operating segments based on the internal reports that are reviewed and used by the executive management team in assessing performance and determining the allocation of resources.
The operating segments are identified according to the nature of products and services provided and the key delivery channels, with each segment representing a strategic business unit that offers a different delivery method and/or different products and services. Discrete financial information about each of these operating businesses is reported to the executive management team on a monthly basis.
Segment assets and liabilities reflect the value of loans and deposits directly managed by the operating segment. All other assets of the Group are managed centrally.
Types of products and services
Retail bankingNet interest income predominantly derived from the provision of first mortgage finance and deposit facilities; and fee income from the provision of banking services delivered through the company-owned branch network and the Group's share of net interest and fee income from the Community Bank® branch network. Delphi Bank (formally Bank of Cyprus Australia) and Community Telco® Australia are included within the retail banking operating segment.
2. Summary of significant accounting policies (continued)
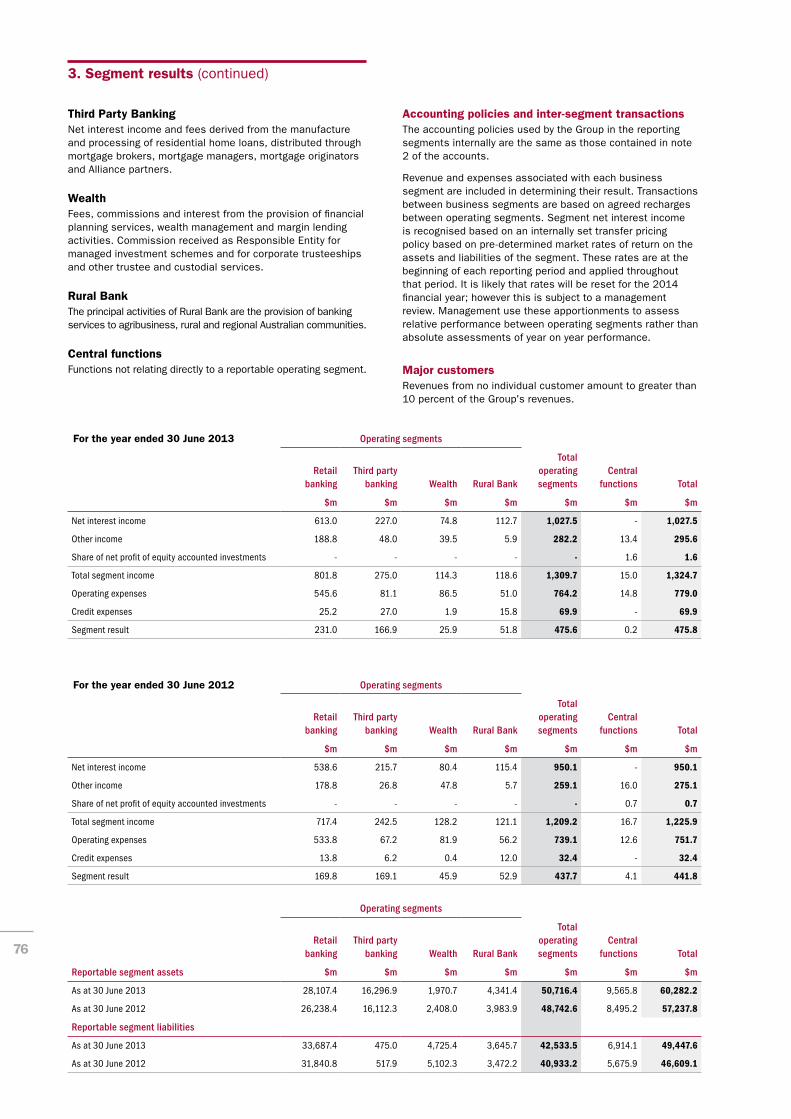
76
Third Party BankingNet interest income and fees derived from the manufacture and processing of residential home loans, distributed through mortgage brokers, mortgage managers, mortgage originators and Alliance partners.
WealthFees, commissions and interest from the provision of financial planning services, wealth management and margin lending activities. Commission received as Responsible Entity for managed investment schemes and for corporate trusteeships and other trustee and custodial services.
Rural BankThe principal activities of Rural Bank are the provision of banking services to agribusiness, rural and regional Australian communities.
Central functionsFunctions not relating directly to a reportable operating segment.
Accounting policies and inter-segment transactionsThe accounting policies used by the Group in the reporting segments internally are the same as those contained in note 2 of the accounts.
Revenue and expenses associated with each business segment are included in determining their result. Transactions between business segments are based on agreed recharges between operating segments. Segment net interest income is recognised based on an internally set transfer pricing policy based on pre-determined market rates of return on the assets and liabilities of the segment. These rates are at the beginning of each reporting period and applied throughout that period. It is likely that rates will be reset for the 2014 financial year; however this is subject to a management review. Management use these apportionments to assess relative performance between operating segments rather than absolute assessments of year on year performance.
Major customersRevenues from no individual customer amount to greater than 10 percent of the Group's revenues.
For the year ended 30 June 2013 Operating segments
Retail banking
Third party banking Wealth Rural Bank
Total operating segments
Central functions Total
$m $m $m $m $m $m $m
Net interest income 613.0 227.0 74.8 112.7 1,027.5 - 1,027.5
Other income 188.8 48.0 39.5 5.9 282.2 13.4 295.6
Share of net profit of equity accounted investments - - - - - 1.6 1.6
Total segment income 801.8 275.0 114.3 118.6 1,309.7 15.0 1,324.7
Operating expenses 545.6 81.1 86.5 51.0 764.2 14.8 779.0
Credit expenses 25.2 27.0 1.9 15.8 69.9 - 69.9
Segment result 231.0 166.9 25.9 51.8 475.6 0.2 475.8
For the year ended 30 June 2012 Operating segments
Retail banking
Third party banking Wealth Rural Bank
Total operating segments
Central functions Total
$m $m $m $m $m $m $m
Net interest income 538.6 215.7 80.4 115.4 950.1 - 950.1
Other income 178.8 26.8 47.8 5.7 259.1 16.0 275.1
Share of net profit of equity accounted investments - - - - - 0.7 0.7
Total segment income 717.4 242.5 128.2 121.1 1,209.2 16.7 1,225.9
Operating expenses 533.8 67.2 81.9 56.2 739.1 12.6 751.7
Credit expenses 13.8 6.2 0.4 12.0 32.4 - 32.4
Segment result 169.8 169.1 45.9 52.9 437.7 4.1 441.8
Operating segments
Retail banking
Third party banking Wealth Rural Bank
Total operating segments
Central functions Total
Reportable segment assets $m $m $m $m $m $m $m
As at 30 June 2013 28,107.4 16,296.9 1,970.7 4,341.4 50,716.4 9,565.8 60,282.2
As at 30 June 2012 26,238.4 16,112.3 2,408.0 3,983.9 48,742.6 8,495.2 57,237.8
Reportable segment liabilities
As at 30 June 2013 33,687.4 475.0 4,725.4 3,645.7 42,533.5 6,914.1 49,447.6
As at 30 June 2012 31,840.8 517.9 5,102.3 3,472.2 40,933.2 5,675.9 46,609.1
3. Segment results (continued)
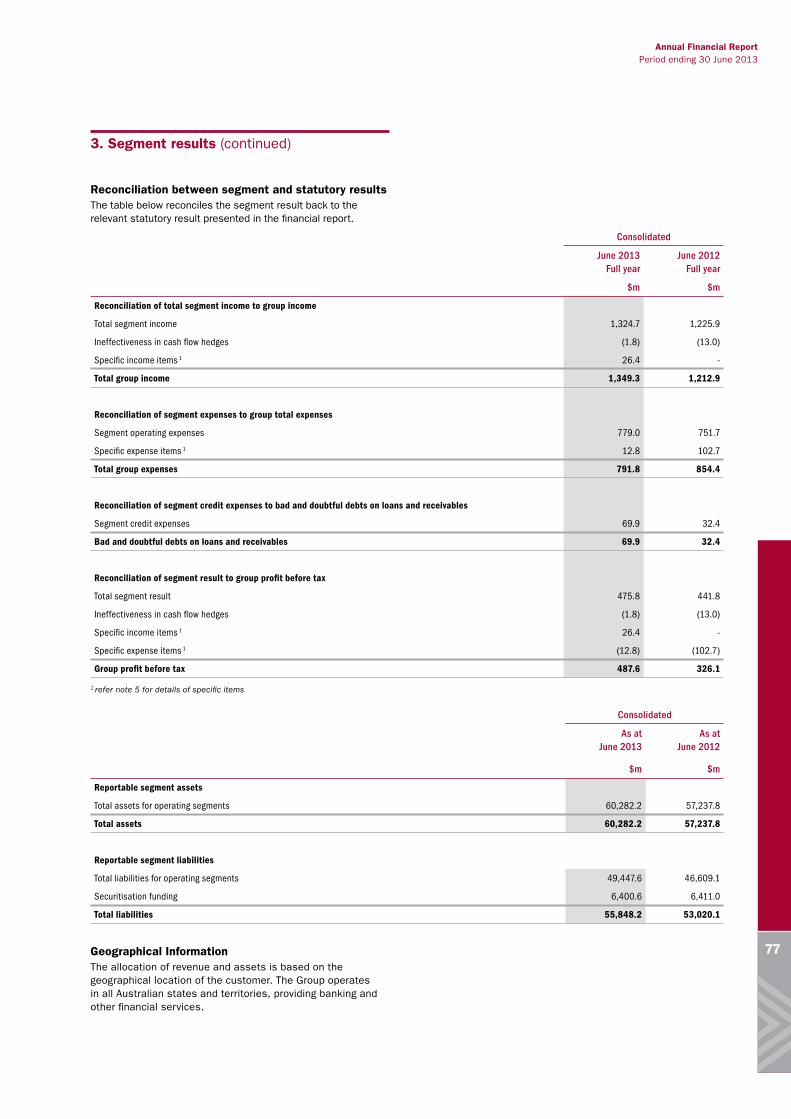
Annual Financial Report Period ending 30 June 2013
77
Reconciliation between segment and statutory resultsThe table below reconciles the segment result back to the relevant statutory result presented in the financial report.
Consolidated
June 2013 Full year
June 2012 Full year
$m $m
Reconciliation of total segment income to group income
Total segment income 1,324.7 1,225.9
Ineffectiveness in cash flow hedges (1.8) (13.0)
Specific income items 1 26.4 -
Total group income 1,349.3 1,212.9
Reconciliation of segment expenses to group total expenses
Segment operating expenses 779.0 751.7
Specific expense items 1 12.8 102.7
Total group expenses 791.8 854.4
Reconciliation of segment credit expenses to bad and doubtful debts on loans and receivables
Segment credit expenses 69.9 32.4
Bad and doubtful debts on loans and receivables 69.9 32.4
Reconciliation of segment result to group profit before tax
Total segment result 475.8 441.8
Ineffectiveness in cash flow hedges (1.8) (13.0)
Specific income items 1 26.4 -
Specific expense items 1 (12.8) (102.7)
Group profit before tax 487.6 326.1
1 refer note 5 for details of specific items
Consolidated
As at June 2013
As at June 2012
$m $m
Reportable segment assets
Total assets for operating segments 60,282.2 57,237.8
Total assets 60,282.2 57,237.8
Reportable segment liabilities
Total liabilities for operating segments 49,447.6 46,609.1
Securitisation funding 6,400.6 6,411.0
Total liabilities 55,848.2 53,020.1
Geographical InformationThe allocation of revenue and assets is based on the geographical location of the customer. The Group operates in all Australian states and territories, providing banking and other financial services.
3. Segment results (continued)

78
4. ProfitProfit before income tax expense has been determined as follows:
Consolidated Parent
2013 2012 2013 2012
$m $m $m $m
(a) Income:
Interest income
Controlled entities
Cash and cash equivalents - - - 0.3
Loans and other receivables - - 50.2 84.9
Other persons/entities
Cash and cash equivalents 3.2 4.2 2.7 3.1
Financial assets (treasury) held for trading 147.2 211.3 147.2 211.3
Financial assets (treasury) available for sale 18.5 26.1 14.4 21.2
Financial assets (treasury) held to maturity 37.4 29.5 - -
Loans and other receivables 2,867.4 3,169.7 2,286.0 2,296.3
Total interest income 3,073.7 3,440.8 2,500.5 2,617.1
Interest expense
Controlled entities
Wholesale - domestic - - 1.8 0.9
Other persons/entities
Deposits
Retail 1,578.7 1,828.5 1,415.0 1,617.2
Wholesale - domestic 170.8 190.3 162.6 183.2
Wholesale - offshore 10.0 4.4 10.0 4.3
Other borrowings
Notes payable 247.3 421.5 4.5 14.0
Reset preference shares 1.8 5.5 1.8 5.5
Convertible preference shares 10.1 - 10.1 -
Subordinated debt 27.5 40.5 22.0 33.4
Total interest expense 2,046.2 2,490.7 1,627.8 1,858.5
Total net interest income 1,027.5 950.1 872.7 758.6
Other revenue
Dividends
Controlled entities - - 115.4 6.8
Joint ventures 0.2 0.4 0.1 0.4
Other - 7.1 0.2 0.1
Distribution from unit trusts 0.5 0.3 - -
0.7 7.8 115.7 7.3
Fees
Assets 61.3 57.3 48.1 46.7
Liabilities & electronic delivery 83.0 84.0 80.6 83.2
Securitisation income 1.6 7.4 - 7.4
Trustee, management & other services 5.3 5.7 0.4 0.4
Other 16.4 16.8 16.1 16.4
167.6 171.2 145.2 154.1

Annual Financial Report Period ending 30 June 2013
79
4. Profit (continued)
Consolidated Parent
2013 2012 2013 2012
$m $m $m $m
Commissions
Wealth solutions 29.7 29.1 0.3 -
Insurance 16.2 15.6 14.5 13.4
Other (1.2) (1.1) 1.1 1.0
44.7 43.6 15.9 14.4
Other
Income from property 1.9 2.1 1.7 4.9
Foreign exchange income 17.0 15.9 16.8 15.4
Factoring products income 13.6 12.2 13.6 12.2
Trading profit - held for trading securities 2.9 2.4 2.9 2.6
Profit/(loss) on disposal of property, plant & equipment 0.2 0.4 0.2 0.3
Homesafe revaluation income 25.1 2.5 - -
Other 21.9 17.0 17.9 15.7
82.6 52.5 53.1 51.1
Other income
Ineffectiveness in cash flow hedges (1.8) (13.0) (6.6) (13.8)
Profit on disposal of IOOF shares 38.7 - - -
(Loss) on disposal of RMBS notes (12.3) - (12.3) -
24.6 (13.0) (18.9) (13.8)
Share of associates' and joint ventures net profits/(losses) 1.6 0.7 1.9 1.1
(b) Expenses
Bad and doubtful debts
Specific provision 64.8 44.9 47.1 29.3
Collective provision 2.7 (10.2) 2.9 (8.7)
Bad debts written off 5.2 2.1 4.5 1.2
Bad debts recovered (2.8) (4.4) (2.7) (4.0)
69.9 32.4 51.8 17.8
Staff and related costs
Salaries, wages and incentives 341.4 320.9 303.6 282.6
Superannuation contributions 29.5 28.0 26.2 24.5
Provision for annual leave 2.5 0.1 2.9 (1.0)
Provision for long service leave 4.7 8.3 5.4 6.9
Other provisions 0.5 0.6 0.5 0.6
Payroll tax 18.2 18.2 16.0 16.0
Fringe benefits tax 2.9 2.3 2.6 1.8
Executive equity transactions expense 0.2 2.2 0.1 1.9
Other 7.1 7.2 6.3 6.2
407.0 387.8 363.6 339.5

80
Consolidated Parent
2013 2012 2013 2012
$m $m $m $m
Occupancy costs
Operating lease rentals 40.4 37.6 40.0 36.8
Depreciation of buildings - 0.3 - -
Amortisation of leasehold improvements 7.3 6.5 7.1 6.2
Property rates and outgoings 4.3 3.9 4.2 3.8
Land tax 0.4 0.4 0.4 0.4
Repairs and maintenance 6.6 6.7 4.6 4.6
Utilities 4.3 3.6 4.2 3.5
Cleaning 4.3 3.8 4.2 3.7
Other 3.0 2.8 2.9 2.3
70.6 65.6 67.6 61.3
Amortisation of intangibles
Amortisation of intangible assets 24.1 27.8 15.3 19.4
Amortisation of intangible software 19.7 16.2 17.8 15.2
43.8 44.0 33.1 34.6
Impairment losses on goodwill 6.2 95.1 - 95.1
Property, plant & equipment costs
Depreciation of property, plant & equipment 10.6 11.4 10.2 10.8
Fees and commissions 28.6 30.4 10.0 9.4
Employee shares shortfall/(gain) (3.3) 1.1 (3.3) 1.1
Impairment loss on held for sale asset - 3.8 - -
Integration costs 9.9 2.7 9.9 2.7
Other
Administration expenses
Communications, postage and stationery 33.0 34.2 37.3 32.3
Computer systems and software costs 64.6 55.2 53.6 49.2
Advertising & promotion 32.0 30.6 29.1 27.4
Other product & services delivery costs 35.4 35.8 35.3 35.4
Impairment loss - assets available for sale, equity investments - - - 9.5
Consultancy expense 9.1 7.4 8.4 6.4
Legal expense 3.2 7.3 2.8 6.9
Travel expense 6.7 6.6 5.7 5.7
General administration expenses 33.3 32.9 30.8 28.4
Listing and rating agency costs 0.8 2.0 0.6 1.6
Other 0.3 0.5 2.8 1.5
Total other 218.4 212.5 206.4 204.3
4. Profit (continued)
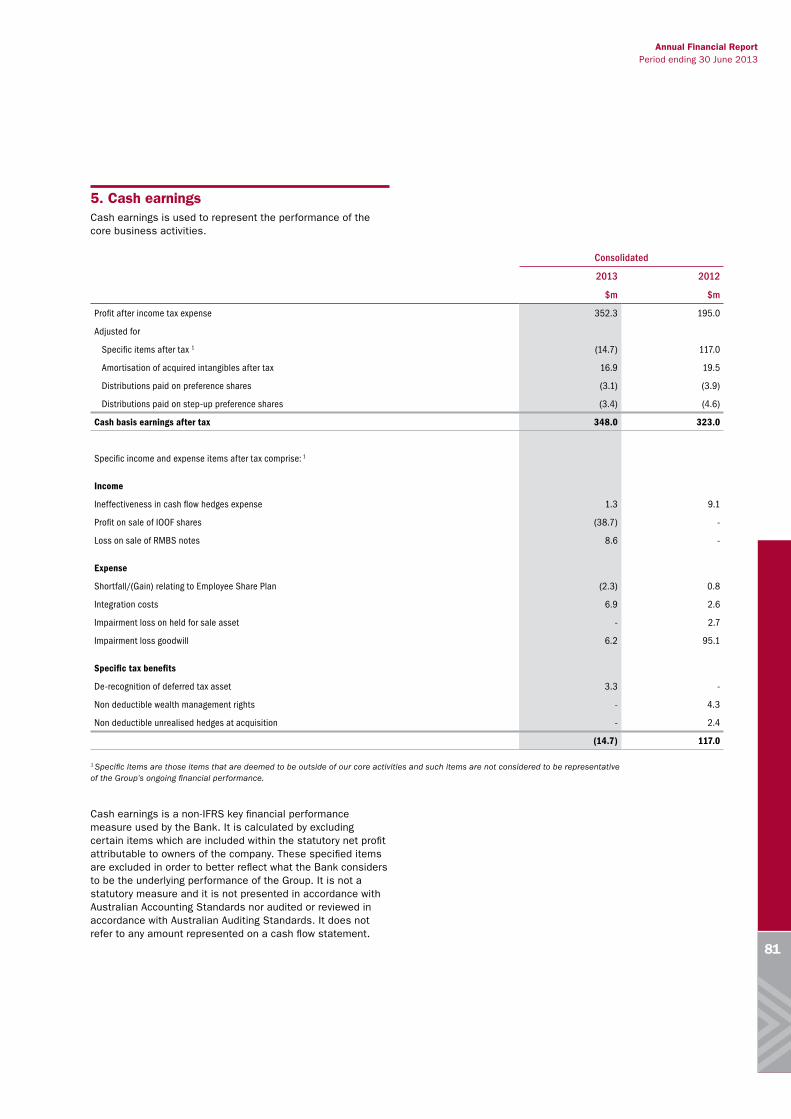
Annual Financial Report Period ending 30 June 2013
81
5. Cash earningsCash earnings is used to represent the performance of the core business activities.
Consolidated
2013 2012
$m $m
Profit after income tax expense 352.3 195.0
Adjusted for
Specific items after tax 1 (14.7) 117.0
Amortisation of acquired intangibles after tax 16.9 19.5
Distributions paid on preference shares (3.1) (3.9)
Distributions paid on step-up preference shares (3.4) (4.6)
Cash basis earnings after tax 348.0 323.0
Specific income and expense items after tax comprise: 1
Income
Ineffectiveness in cash flow hedges expense 1.3 9.1
Profit on sale of IOOF shares (38.7) -
Loss on sale of RMBS notes 8.6 -
Expense
Shortfall/(Gain) relating to Employee Share Plan (2.3) 0.8
Integration costs 6.9 2.6
Impairment loss on held for sale asset - 2.7
Impairment loss goodwill 6.2 95.1
Specific tax benefits
De-recognition of deferred tax asset 3.3 -
Non deductible wealth management rights - 4.3
Non deductible unrealised hedges at acquisition - 2.4
(14.7) 117.0
1 Specific items are those items that are deemed to be outside of our core activities and such items are not considered to be representative of the Group’s ongoing financial performance.
Cash earnings is a non-IFRS key financial performance measure used by the Bank. It is calculated by excluding certain items which are included within the statutory net profit attributable to owners of the company. These specified items are excluded in order to better reflect what the Bank considers to be the underlying performance of the Group. It is not a statutory measure and it is not presented in accordance with Australian Accounting Standards nor audited or reviewed in accordance with Australian Auditing Standards. It does not refer to any amount represented on a cash flow statement.

82
6. Income tax expenseMajor components of income tax expense are:
Consolidated Parent
2013 2012 2013 2012
$m $m $m $m
Income statement
Current income tax
Current income tax charge 143.7 138.6 208.3 (76.0)
Retrospective change in tax legislation - 3.2 - 1.7
Imputation credits (0.2) (3.4) (0.1) (0.2)
Adjustments in respect of current income tax of previous years (7.8) 2.3 (4.9) 2.2
Deferred income tax
De-recognition of temporary differences 3.8 - 0.4 -
Retrospective change in tax legislation - 3.5 - 2.6
Adjustments in respect of deferred income tax of previous years (0.4) (1.6) (1.4) (2.0)
Relating to origination and reversal of temporary differences (3.8) (11.5) (121.2) 162.4
Income tax expense reported in the income statement 135.3 131.1 81.1 90.7
Statement of changes in equity
Deferred income tax related to items charged or credited directly in equity
Net gain on cash flow hedge 22.2 11.1 16.1 7.0
Net gain/(loss) on available-for-sale investments (9.0) (3.8) 1.3 (0.9)
Net loss on revaluation of land and buildings (0.1) - (0.1) -
Other 0.7 (0.4) 0.7 (0.4)
Income tax expense reported in equity 13.8 6.9 18.0 5.7
A reconciliation between tax expense and the product of accounting profit
before income tax multiplied by the Group's applicable income tax rate is as follows:
Income tax expense attributable to:
Accounting profit before income tax 487.6 326.1 436.3 196.2
The income tax expense comprises amounts set aside as:
Provision attributable to current year at statutory rate, being
Prima facie tax on accounting profit before tax 146.3 97.8 130.9 58.9
Under/(over) provision in prior years (8.2) 0.7 (6.3) 0.2
Tax credits and adjustments (0.2) (3.4) (0.1) (0.2)
Expenditure not allowable for income tax purposes 6.4 2.9 4.5 5.7
Impairment Wealth Management goodwill - 28.5 - 28.5
Other assessable income 0.9 - 0.6 -
Other non assessable income (1.0) - (36.5) (3.6)
Tax effect of tax credits and adjustments 0.1 1.0 - 0.1
Retrospective change in tax legislation - 6.7 - 4.3
De-recognition of temporary differences 3.8 - 0.4 -
Utilisation of previously unrecognised tax losses (13.4) - (13.4) -
Other 0.6 (3.1) 1.0 (3.2)
Income tax expense reported in the consolidated income statement 135.3 131.1 81.1 90.7

Annual Financial Report Period ending 30 June 2013
83
6. Income tax expense (continued)
Deferred income tax Deferred income tax at 30 June relates to the following: Balance sheet
Consolidated Parent
2013 2012 2013 2012
$m $m $m $m
Gross Deferred tax liabilities
Available-for-sale financial assets 0.9 12.1 0.5 (0.7)
Deferred expenses 3.7 1.1 3.7 1.1
Derivatives 9.4 17.5 54.6 164.1
Intangible assets on acquisition 25.4 36.2 15.1 23.5
Investment property 21.6 14.0 - -
Lease receivable 2.8 8.3 2.7 8.2
Other 14.4 15.3 11.4 13.0
78.2 104.5 88.0 209.2
Gross Deferred tax assets
Derivatives 24.2 54.2 20.5 31.0
Employee entitlements 24.9 20.1 24.0 18.6
Intangible liabilities on acquisition 5.8 8.1 0.2 0.3
Losses available for offset against future taxable income - 0.5 - 0.4
Prepaid income 0.5 11.8 0.5 0.9
Provisions 48.1 48.3 31.6 34.7
Other 28.6 27.2 19.8 22.6
132.1 170.2 96.6 108.5
Tax payable/(receivable) attributable to members of the tax consolidated group 47.1 86.8 47.1 86.8
47.1 86.8 47.1 86.8
At 30 June 2013, there is no unrecognised deferred income tax liability (2012: Nil) for taxes that would be payable on the unremitted earnings of certain of the Group’s subsidiaries or joint ventures, as the Group has no liability for additional taxation should such amounts be remitted.
At 30 June 2013, unused tax losses (capital in nature) of $74.3 million (2012: $111.8 million) exist in the consolidated group. Deferred tax assets have not been recognised in respect of these losses as it is not probable that future taxable capital gains will be available against which the consolidated group can utilise the benefit of the losses.
Tax consolidationBendigo and Adelaide Bank Limited and its 100 percent owned subsidiaries form the tax consolidated group. Members of the Group entered into a tax sharing agreement to allocate income tax liabilities to the wholly-owned subsidiaries should the head entity default on its tax payment obligations. At the balance date, the possibility of default is remote. The head entity of the tax consolidated group is Bendigo and Adelaide Bank Limited.
Tax effect accounting by members of the tax consolidated group Members of the tax consolidated group have entered into a tax funding agreement. The tax funding agreement provides for the allocation of current taxes to members of the tax
consolidated group on a Group allocation method based on a notional standalone calculation, while deferred taxes are calculated by members of the tax consolidated group in accordance with AASB112 Income Taxes.
The allocation of taxes under the tax funding agreement is recognised as an increase/decrease in the subsidiaries inter-company accounts with the tax consolidated group head company, Bendigo and Adelaide Bank Limited. The tax funding agreement is in accordance with AASB Interpretation 1052 Tax Consolidation Accounting (UIG 1052). Where the tax funding agreement is not in accordance with UIG 1052, the difference between the current tax amount that is allocated under the tax funding agreement and the amount that is allocated under an acceptable method is recognised as a contribution/distribution in the subsidiaries' equity accounts.
Taxation of Financial Arrangements (TOFA)The new taxing regime for financial instruments (TOFA) began to apply to the Tax Consolidated group on 1 July 2010. The regime aims to align the tax and accounting treatment of financial arrangements.
The Tax Consolidated group made a transitional election to bring pre-existing arrangements into TOFA. The deferred tax in relation to the transitional adjustment that this created is being amortised equally over the 2011 to 2014 years.
84
7. Capital management
a. Capital managementBendigo and Adelaide Bank Limited key capital management objectives are to:
> Maintain a sufficient level of capital above the regulatory minimum to provide a buffer against loss arising from unanticipated events, and allow the Group to continue as a going concern;
> Optimise the level and use of capital resources to enhance shareholder value through maximising financial performance;
> Ensure that capital management is closely aligned with the Group’s business and strategic objectives; and
> Achieve progressive improvement to short and long term credit ratings.
The Group manages capital adequacy according to the framework provided by the APRA Prudential Standards. Capital adequacy is measured at two levels:
> Level 1 includes Bendigo and Adelaide Bank Limited and certain controlled entities that meet the APRA definition of extended licensed entities; and
> Level 2 consists of the consolidated group, excluding non-controlled subsidiaries and subsidiaries involved in insurance, funds management, non-financial operations and securitisation special purpose vehicles.
APRA determines minimum prudential capital ratios (eligible capital as a percentage of total risk-weighted assets) that must be held by all authorised deposit-taking institutions. Accordingly, Bendigo and Adelaide Bank Limited is required to maintain a minimum prudential capital ratio (eligible capital as a percentage of total risk-weighted assets) at both Level 1 and Level 2 as determined by APRA. As part of the Group’s capital management process, the Board considers the Group’s strategy, financial performance objectives, credit ratings and other factors relating to the efficient management of capital in setting target ratios of capital above the regulatory required levels. These processes are formalised within the Group’s internal capital adequacy assessment process (or ICAAP).
The Basel III measurement and monitoring of capital has been effective from 1 January 2013. The requirement defines what is acceptable as capital. Regulatory capital is divided into common equity tier 1, tier 1 and tier 2 capital.
Common equity tier 1 capital primarily consists of shareholders equity less goodwill and other prescribed adjustments. Tier 1 capital is comprised of common equity tier 1 plus other highly rated capital instruments acceptable to APRA. Tier 2 capital is comprised primarily of lower rated hybrid and debt instruments acceptable to APRA.
Total capital is the aggregate of tier 1 and tier 2 capital.
The Group has adopted the Prudential Capital Adequacy Standardised Approach to credit risk, operational risk and market risk, which requires the Group to determine capital requirements based on standards set by APRA. The Group has satisfied the minimum capital requirements at Levels 1 and 2 throughout the 2012/13 financial year.

Annual Financial Report Period ending 30 June 2013
85
b. Capital adequacy
Consolidated
As at June 2013 * As at June 2012
$m $m
Risk weighted capital ratios
Tier 1 9.25% 8.39%
Tier 2 1.46% 2.02%
Total capital ratio 10.71% 10.41%
Regulatory capital
Common Equity Tier 1
Contributed capital 3,758.0 3,681.8
Retained profits & reserves 320.7 101.3
Accumulated other comprehensive income (and other reserves) (17.7) -
Innovative Tier 1 capital - 277.9
Less,
Intangible assets, cash flow hedges and capitalised expenses 1,637.3 1,583.9
Net deferred tax assets 6.6 -
Equity exposures 27.8 -
50/50 deductions - 8.5
Other adjustments as per APRA advice 2.4 92.4
Total common equity tier 1 capital 2,386.9
Additional Tier 1 capital instruments 438.5
Total Additional Tier 1 Capital 438.5 -
Total Tier 1 Capital 2,825.4 2,376.2
Tier 2
Tier 2 capital instruments 290.8 434.6
General reserve for credit losses/collective provision (net of tax effect) 154.1 144.4
Asset revaluation reserves - 1.9
444.9 580.9
Less,
50/50 deductions - 8.5
Total Tier 2 capital 444.9 572.4
Total regulatory capital 3,270.3 2,948.6
Total risk weighted assets 30,530.2 28,310.1
Common Tier 1 Equity 7.82%
* Current year disclosures have been presented to reflect the requirements of Basel III effective from 1 January 2013.
Prior year comparatives have not been restated.
7. Capital management (continued)

86
8. Earnings per ordinary share
Consolidated
2013 Cents per share
2012 Cents per share
Basic earnings per ordinary share 84.9 48.6
Diluted earnings per ordinary share 77.9 47.7
Cash basis earnings per ordinary share 85.4 84.2
$m $m
Reconciliation of earnings used in the calculation of basic earnings per ordinary share
Profit after tax 352.3 195.0
Dividends paid on preference shares (3.1) (3.9)
Dividends paid/accrued on step up preference shares (3.4) (4.6)
345.8 186.5
Reconciliation of earnings used in the calculation of diluted earnings per ordinary share
Earnings used in calculating basic earnings per ordinary share 345.8 186.5
Dividends on dilutive preference shares 13.6 12.4
359.4 198.9
Reconciliation of earnings used in the calculation of cash basis earnings per ordinary share
Earnings used in calculating basic earnings per ordinary share 345.8 186.5
After tax intangibles amortisation (excluding software amortisation) 16.9 19.5
After tax specific income and expense items (Note 5) (14.7) 117.0
348.0 323.0
No. of shares No. of shares
Weighted average number of ordinary shares used in basic and cash basis earnings per ordinary share 407,408,624 383,463,802
Effect of dilution - executive performance rights 889,445 1,149,679
Effect of dilution - preference shares 53,006,660 32,352,260
Weighted average number of ordinary shares used in diluted earnings per ordinary share 461,304,729 416,965,741
Information on the classification of securities - Executive performance rights
Executive performance rights are treated as dilutive from the date of issue and remain dilutive so long as the performance conditions are satisfied. In the event of a performance condition not being satisfied, the number of dilutive rights would be reduced to the number that would have been issued if the end of the period was the end of the contingency period.
Potentially dilutive instruments
The following instruments are potentially dilutive as at the reporting date: Dilutive
2013 2012
Preference shares Yes Yes
Step up preference shares Yes Yes
Reset preference shares * Yes Yes
Convertible preference shares * Yes -
Executive share options No No
Executive performance rights Yes Yes
* Reset preference shares were redeemed in November 2012 and convertible preference shares were issued in November 2012.

Annual Financial Report Period ending 30 June 2013
87
9. Dividends
Consolidated Parent
2013 2012 2013 2012
$m $m $m $m
Dividends paid or proposed
Ordinary shares
Dividends paid during the year
Current year
Interim dividend (30.0 cents per share) (2012 - 30.0 cents per share) 118.3 113.2 118.3 113.2
Previous year
Final dividend (30.0 cents per share) (2012 - 30.0 cents per share) 117.7 107.4 117.7 107.4
236.0 220.6 236.0 220.6
Dividends proposed since the reporting date, but not recognised as a liability
Final dividend (31.0 cents per share) (2012: 30.0 cents per share) 125.1 118.1 125.1 118.1
Franked dividends per ordinary shares (cents per share) 61.0 60.0 61.0 60.0
All dividends paid were fully franked. Proposed dividends will be fully franked out of existing franking credits or out of franking credits arising from payment of income tax provided for in the financial statements for the year ended 30 June 2013.
Preference shares
Dividends paid during the year
91.81 cents per share paid on 17 September 2012 (2011: 115.07 cents) 0.8 1.0 0.8 1.0
87.54 cents per share paid on 17 December 2012 (2011: 111.11 cents) 0.8 1.0 0.8 1.0
77.63 cents per share paid on 15 March 2013 (2012: 105.50 cents) 0.7 1.0 0.7 1.0
83.45 cents per share paid on 17 June 2013 (2012: 104.87 cents) 0.8 0.9 0.8 0.9
3.1 3.9 3.1 3.9
Step up preference shares
Dividends paid during the year
105.00 cents per share paid on 10 July 2012 (2011: 116.00 cents) 1.1 1.2 1.1 1.2
94.00 cents per share paid on 10 October 2012 (2011: 118.00 cents) 0.9 1.2 0.9 1.2
87.00 cents per share paid on 10 January 2013 (2012: 114.00 cents) 0.9 1.1 0.9 1.1
83.00 cents per share paid on 10 April 2013 (2012: 108.00 cents) 0.8 1.1 0.8 1.1
3.7 4.6 3.7 4.6
Reset preference shares (recorded as debt instruments)
Dividends paid during the year:
309.68 cents per share paid on 1 November 2012 (2011: 310.53) 2.8 2.8 2.8 2.8
(May 2012: 307.16) Reset preference shares were fully repaid in November 2012 - 2.7 - 2.7
2.8 5.5 2.8 5.5
Convertible preference shares (recorded as debt instruments)
Dividends paid during the year:
65.49 cents per share paid on 13 December 2012 (2012: nil) 1.8 - 1.8 -
282.72 cents per share paid on 13 June 2013 (2012: nil) 7.6 - 7.6 -
9.4 - 9.4 -
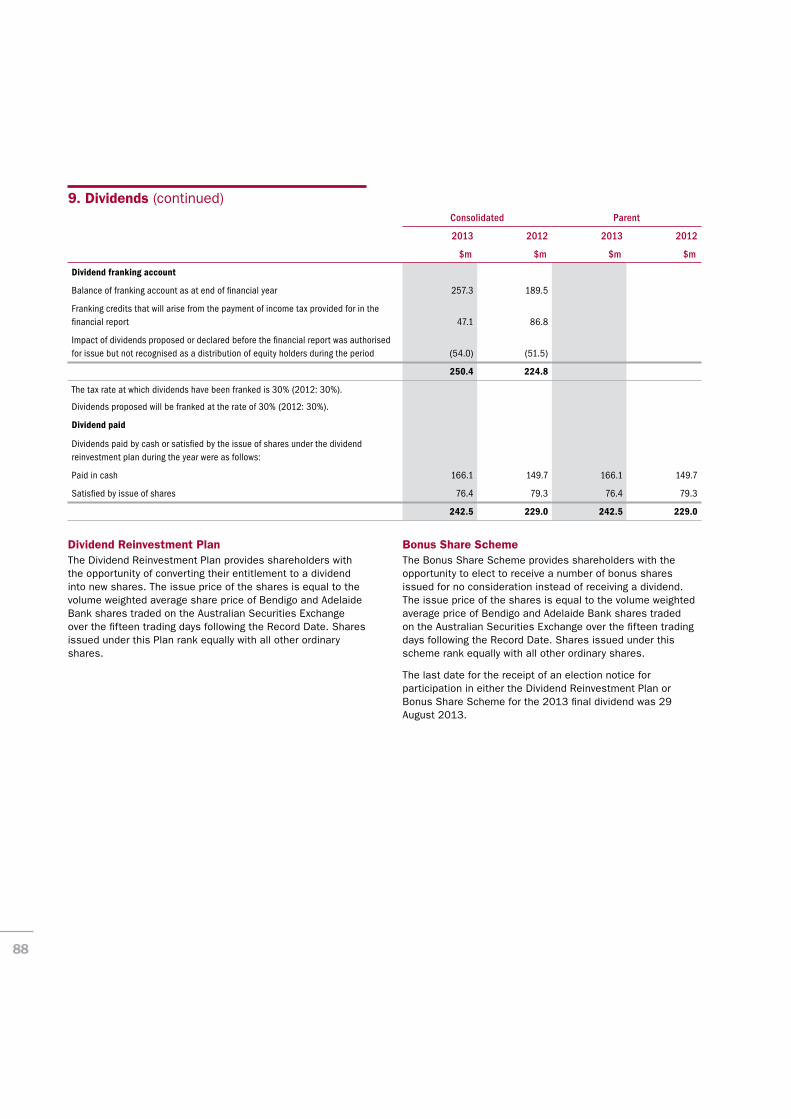
88
Consolidated Parent
2013 2012 2013 2012
$m $m $m $m
Dividend franking account
Balance of franking account as at end of financial year 257.3 189.5
Franking credits that will arise from the payment of income tax provided for in the financial report 47.1 86.8
Impact of dividends proposed or declared before the financial report was authorised for issue but not recognised as a distribution of equity holders during the period (54.0) (51.5)
250.4 224.8
The tax rate at which dividends have been franked is 30% (2012: 30%).
Dividends proposed will be franked at the rate of 30% (2012: 30%).
Dividend paid
Dividends paid by cash or satisfied by the issue of shares under the dividend reinvestment plan during the year were as follows:
Paid in cash 166.1 149.7 166.1 149.7
Satisfied by issue of shares 76.4 79.3 76.4 79.3
242.5 229.0 242.5 229.0
Dividend Reinvestment Plan The Dividend Reinvestment Plan provides shareholders with the opportunity of converting their entitlement to a dividend into new shares. The issue price of the shares is equal to the volume weighted average share price of Bendigo and Adelaide Bank shares traded on the Australian Securities Exchange over the fifteen trading days following the Record Date. Shares issued under this Plan rank equally with all other ordinary shares.
Bonus Share SchemeThe Bonus Share Scheme provides shareholders with the opportunity to elect to receive a number of bonus shares issued for no consideration instead of receiving a dividend. The issue price of the shares is equal to the volume weighted average price of Bendigo and Adelaide Bank shares traded on the Australian Securities Exchange over the fifteen trading days following the Record Date. Shares issued under this scheme rank equally with all other ordinary shares.
The last date for the receipt of an election notice for participation in either the Dividend Reinvestment Plan or Bonus Share Scheme for the 2013 final dividend was 29 August 2013.
9. Dividends (continued)

Annual Financial Report Period ending 30 June 2013
89
10. Return on average ordinary equity
Consolidated
2013 %
2012 %
Return on average ordinary equity 8.52 4.84
Pre-specific items return on average ordinary equity 8.16 7.88
Cash basis return on average ordinary equity 8.58 8.36
$m $m
Reconciliation of earnings used in the calculation of return on average ordinary equity
Net profit for the year 352.3 195.0
Dividends paid on preference shares (3.1) (3.9)
Dividends paid/accrued on step up preference shares (3.4) (4.6)
Earnings used in calculation of return on average ordinary equity 345.8 186.5
After tax specific income and expense items (14.7) 117.0
Earnings used in calculation of pre-specific items return on average ordinary equity 331.1 303.5
After tax intangibles amortisation (excluding amortisation of intangible software) 16.9 19.5
Earnings used in calculation of cash basis return on average ordinary equity 348.0 323.0
Reconciliation of ordinary equity used in the calculation of return on average ordinary equity
Total equity 4,434.0 4,217.7
Preference share net capital (188.5) (188.5)
Asset revaluation reserve - available for sale investments (2.8) (26.9)
Unrealised gains/losses on cash flow hedge reserve 34.6 86.4
Acquisitions reserve 20.4 20.4
Ordinary equity 4,297.7 4,109.1
Average ordinary equity 4,057.6 3,852.3
The above calculation uses a twelve month rolling basis of calculation.

90
11. Net tangible assets per ordinary shareConsolidated
2013 2012
$ $
Net tangible assets per ordinary share 6.62 6.16
Reconciliation of net tangible assets used in calculation of net tangible assets per ordinary share $m $m
Net assets 4,434.0 4,217.7
Intangible assets and goodwill (1,518.2) (1,548.2)
Preference shares - face value (90.0) (90.0)
Step up preference shares - face value (100.0) (100.0)
Net tangible assets 2,725.8 2,479.5
Number of ordinary shares on issue at reporting date 412,007,864 402,233,266
12. Cash flow statement reconciliation
Consolidated Parent
2013 2012 2013 2012
$m $m $m $m
Profit after tax 352.3 195.0 355.2 105.5
Non-cash items
Doubtful debts expense 72.7 36.8 54.5 21.8
Amortisation 43.8 139.1 33.1 129.7
Depreciation 17.9 18.2 17.3 17.0
Revaluation (increments)/decrements (24.8) 0.9 (0.2) 0.6
Equity settled transactions 0.2 1.7 0.1 1.7
Share of joint ventures' net profits (1.6) (0.7) (1.9) (1.1)
Profit/(loss) on sale of investment securities (26.4) - 12.3 -
Ineffectiveness in cash flow hedges (1.8) 13.0 (6.6) 13.8
Changes in assets and liabilities
Increase/(decrease) in tax provision (39.7) 18.2 (39.7) 18.2
Increase/(decrease) in deferred tax assets & liabilities (64.4) (7.8) 97.5 163.8
(Increase)/decrease in derivatives (97.2) 7.9 (390.2) (546.3)
(Increase)/decrease in accrued interest (58.7) (39.3) (41.3) (21.1)
Increase/(decrease) in accrued employees entitlements 16.2 (4.4) 17.9 (7.5)
Increase/(decrease) in other accruals, receivables and provisions 235.0 (178.7) 213.4 318.0
Net cash flows from operating activities 423.5 199.9 321.4 214.1
Cash flows presented on a net basis
Cash flows arising from the following activities are presented on a net basis in the cash flow statement:
Loans and other receivables, investment securities, retail deposits and wholesale deposits.

Annual Financial Report Period ending 30 June 2013
91
13. Cash and cash equivalents
Consolidated Parent
2013 2012 2013 2012
$m $m $m $m
Notes, coin and cash at bank 249.2 244.2 143.4 131.2
Investments at call 134.6 44.6 114.7 44.6
383.8 288.8 258.1 175.8
Reconciliation of cash and cash equivalents
For the purposes of the cash flow statement, cash and cash equivalents includes:
Cash and cash equivalents 383.8 288.8 258.1 175.8
Due from other financial institutions 293.9 272.2 292.2 266.3
Due to other financial institutions (379.5) (327.2) (371.4) (315.1)
298.2 233.8 178.9 127.0
14. Financial assets held for trading
Consolidated Parent
2013 2012 2013 2012
$m $m $m $m
Discount securities 2,351.5 2,656.7 2,352.1 2,657.6
Floating rate notes 1,122.1 706.6 1,122.1 706.6
Government securities 1,991.6 1,002.8 1,991.6 1,002.8
5,465.2 4,366.1 5,465.8 4,367.0
Maturity analysis
Not longer than 3 months 2,028.0 1,387.6 2,028.0 1,387.6
Longer than 3 and not longer than 12 months 2,400.1 2,334.6 2,400.1 2,334.6
Longer than 1 and not longer than 5 years 1,037.1 643.9 1,037.1 643.9
Over 5 years - - 0.6 0.9
5,465.2 4,366.1 5,465.8 4,367.0

92
15. Financial assets available for sale – debt securities
Consolidated Parent
2013 2012 2013 2012
$m $m $m $m
Negotiable securities
Negotiable certificates of deposit 109.5 92.7 - -
Mortgage backed securities 426.0 352.1 426.0 352.1
Notes to securitisations - - 936.9 1,242.5
535.5 444.8 1,362.9 1,594.6
Maturity analysis
Not longer than 3 months 95.5 105.3 629.6 813.1
Longer than 3 and not longer than 12 months 47.2 41.6 32.4 65.4
Longer than 1 and not longer than 5 years 392.8 297.9 392.8 297.9
Over 5 years - - 308.1 418.2
535.5 444.8 1,362.9 1,594.6
Recognised gains / (losses) before tax:
Gain/(loss) recognised directly in equity 2.9 (1.8) 2.9 (1.8)
16. Financial assets available for sale – equity investments
Consolidated Parent
2013 2012 2013 2012
$m $m $m $m
Share investments at fair value
Listed share investments 1.4 109.5 1.4 1.4
Unlisted share investments 16.7 15.2 3.1 2.7
18.1 124.7 4.5 4.1
Fair value of share investments is determined as follows:
Listed shares - quoted market price at balance date.
Unlisted shares - estimated using valuation techniques based on assumptions that are not supported by observable market prices or rates.
Management believes the estimated fair values resulting from the valuation techniques and recorded in the balance sheet and the related
changes in fair values recorded in equity are reasonable and the most appropriate at the balance sheet date.
Recognised gains / (losses) before tax:
Gain/(loss) recognised directly in equity 1.1 (9.6) - (0.1)
Amount removed from equity and recognised in (profit)/loss (37.1) - - -

Annual Financial Report Period ending 30 June 2013
93
17. Financial assets held to maturity
Consolidated Parent
2013 2012 2013 2012
$m $m $m $m
Negotiable securities
Bank accepted bills of exchange - 9.9 - -
Negotiable certificates of deposit 289.8 328.5 - -
Other 30.6 47.1 0.5 0.5
320.4 385.5 0.5 0.5
Non negotiable securities
Deposits - other 1.6 1.6 - -
Other 1.3 1.3 1.3 1.3
2.9 2.9 1.3 1.3
Total financial assets held to maturity 323.3 388.4 1.8 1.8
Maturity analysis
Not longer than 3 months 295.3 331.5 - -
Longer than 3 and not longer than 12 months 10.0 38.4 - -
Longer than 1 and not longer than 5 years 14.6 15.0 - -
Over 5 years 3.4 3.5 1.8 1.8
323.3 388.4 1.8 1.8

94
18. Loans and other receivablesConsolidated Parent
2013 2012 2013 2012
$m $m $m $m
Loans and other receivables - investments 554.1 453.0 554.1 453.0
Overdrafts 4,345.8 4,342.5 4,305.7 4,257.5
Credit cards 282.4 241.2 282.4 241.2
Term loans 42,931.7 40,828.7 39,556.7 36,335.7
Margin lending 1,915.6 2,333.2 - -
Lease receivables 472.5 472.1 437.3 459.4
Factoring receivables 98.6 78.7 98.6 78.7
Other 78.4 82.6 78.4 82.6
Gross loans and other receivables 50,125.0 48,379.0 44,759.1 41,455.1
Specific provision for impairment (Note 19) (104.1) (102.9) (51.3) (60.0)
Collective provision for impairment (Note 19) (34.5) (31.8) (30.8) (27.7)
Unearned income (109.0) (105.1) (56.2) (64.3)
(247.6) (239.8) (138.3) (152.0)
Deferred Costs paid 80.0 77.8 70.5 63.5
Net loans and other receivables 49,957.4 48,217.0 44,691.3 41,366.6
Impaired loans
Loans - without provisions 135.8 98.7 18.6 32.1
- with provisions 191.7 224.0 89.0 94.6
Restructured Loans 62.6 35.8 18.0 35.7
less specific impairment provisions (103.3) (102.1) (50.5) (59.2)
Net impaired loans 286.8 256.4 75.1 103.2
Net impaired loans % of loans and other receivables 0.57% 0.53% 0.17% 0.25%
Portfolios facilities - past due 90 days, not well secured 4.2 3.7 4.2 3.7
less impairment provisions (0.8) (0.8) (0.8) (0.8)
Net portfolio facilities 3.4 2.9 3.4 2.9
Loans past due 90 days
Accruing loans past due 90 days, with adequate security balance 750.7 811.8 650.5 665.8
Net fair value of properties acquired through the enforcement of security 139.9 108.2 120.7 99.0
Interest income recognised
Interest income recognised in respect of impaired loans 1.6 5.6 1.6 2.5
Interest income forgone in respect of impaired loans 5.7 26.1 5.1 6.3
Interest income recognised is the interest income actually received subsequent to these balances becoming impaired or restructured.
Interest income forgone is the gross interest income that would have been recorded during the financial year had the interest on such loans been included in income.
Maturity analysis 1
At call / overdrafts 7,601.0 7,971.4 5,237.3 5,085.1
Not longer than 3 months 1,369.6 1,311.8 954.0 791.6
Longer than 3 and not longer than 12 months 1,834.4 1,727.4 1,332.8 1,062.2
Longer than 1 and not longer than 5 years 7,222.4 6,660.3 5,294.6 4,489.3
Longer than 5 years 32,651.7 31,161.1 32,494.5 30,479.9
50,679.1 48,832.0 45,313.2 41,908.1
1 Balances exclude specific and general provisions for doubtful debts and unearned revenue, and are categorised by the contracted maturity date of each loan facility.

Annual Financial Report Period ending 30 June 2013
95
19. Impairment of loans and advances
Consolidated Parent
2013 2012 2013 2012
$m $m $m $m
Specific provision for impairment
Opening balance 102.9 91.4 60.0 47.3
Provision acquired in business combination 3.4 0.3 1.8 -
Transfer of business - - 1.2 8.4
Charged to income statement 64.8 44.9 47.1 29.3
Impaired debts written-off applied to specific impairment provision (67.0) (33.7) (58.8) (25.0)
Closing balance 104.1 102.9 51.3 60.0
Collective provision for impairment
Opening balance 31.8 41.9 27.7 36.1
Provision acquired in business combination - 0.1 - -
Transfer of business - - 0.2 0.3
Charged to income statement 2.7 (10.2) 2.9 (8.7)
Closing balance 34.5 31.8 30.8 27.7
General reserve for credit losses
Opening balance 128.5 110.9 105.0 92.4
Provision acquired in business combination - 4.8 - -
Transfer of business - - 4.9 -
Charged to equity 9.8 12.8 9.8 12.6
Closing balance 138.3 128.5 119.7 105.0
Bad and doubtful debts expense
Specific provisions for impairment 64.8 44.9 47.1 29.3
Collective provision 2.7 (10.2) 2.9 (8.7)
Bad debts written off 5.2 2.1 4.5 1.2
Bad debts recovered (2.8) (4.4) (2.7) (4.0)
69.9 32.4 51.8 17.8
Ratios
Specific provision as % of gross loans less unearned income 0.21% 0.21%
Collective provision (adjusted for tax) & general reserve for credit losses as a % of risk-weighted assets
0.53% 0.53%

96
20. Particulars in relation to controlled entities
Chief entity Principal Activities
Bendigo and Adelaide Bank Limited Banking
Directly Controlled Operating Entities 1, 2
AB Management Pty Ltd Securitisation Manager
ABL Custodian Services Pty Ltd Security Trustee
ABL NIM Pty Ltd Trust Manager
ABL Nominees Pty Ltd Trustee company
Adelaide Managed Funds Ltd Responsible Entity for listed trusts
ACN 092 167 904 (BOCA) Pty Ltd Banking
Hindmarsh Adelaide Property Trust Property Owner
Hindmarsh Financial Services Ltd Investment company
Leveraged Equities Ltd Margin Lending
Adelaide Equity Finance Pty Ltd Margin Lending
Leveraged Equities 2009 Trust Securitisation
Pirie Street Custodian Ltd Provider of share nominee services for margin lending
BBS Nominees Pty Ltd Administration company
Bendigo Finance Pty Ltd Leasing finance
Bendigo Financial Planning Ltd Financial advisory services
Community Developments Australia Pty Ltd Community initiatives
Community Telco Australia Pty Ltd Telecommunications services
Community Energy Australia Pty Ltd Community initiatives
Community Solutions Australia Pty Ltd Community initiatives
Homesafe Trust Homesafe product financier
National Mortgage Market Corporation Pty Ltd Mortgage origination & management
Rural Bank Limited Banking
TDCC Holdings Pty Ltd Property/land development
TDCC Developments No. 1 Pty Ltd Property/land development
TDCC Developments No. 2 Pty Ltd Property/land development
TDCC Developments No. 3 Pty Ltd Property/land development
TDCC Developments No. 4 Pty Ltd Property/land development
TDCC Developments No. 5 Pty Ltd Property/land development
TDCC Developments No. 6 Pty Ltd Property/land development
TDCC Developments No. 7 Pty Ltd Property/land development
TDCC Developments No. 8 Pty Ltd Property/land development
TDCC Developments No. 9 Pty Ltd Property/land development
TDCC Developments No. 10 Pty Ltd Property/land development
TDCC Developments No. 11 Pty Ltd Property/land development
TDCC Developments No. 12 Pty Ltd Property/land development
TDCC Developments No. 13 Pty Ltd Property/land development
TDCC Developments No. 14 Pty Ltd Property/land development
Sandhurst Trustees Ltd Trustee company
Sandhurst Nominees (Victoria) Pty Ltd Nominee services
Pirie Street Nominees Pty Ltd Financial services

Annual Financial Report Period ending 30 June 2013
97
20. Particulars in relation to controlled entities (continued)
Chief entity Principal Activities
Securitisation
ABL Portfolio Funding Trust 2007-1 Securitisation
Lighthouse Warehouse Trust No 1 Securitisation
Lighthouse Warehouse Trust No 2 Securitisation
Lighthouse Warehouse Trust No 14 Securitisation
Torrens Series 2005-1 Trust Securitisation
Torrens Series 2005-3 (E) Trust Securitisation
Torrens Series 2006-1(E) Trust Securitisation
Torrens Series 2007-1 Trust Securitisation
Torrens Series 2008-1 Trust Securitisation
Torrens Series 2008-3 Trust Securitisation
Torrens Series 2008-4 Trust Securitisation
Torrens Series 2009-1 Trust Securitisation
Torrens Series 2009-3 Trust Securitisation
Torrens Series 2010-1 Trust Securitisation
Torrens Series 2010-2 Trust Securitisation
Torrens Series 2010-3 Trust Securitisation
Torrens Series 2011-1(E) Trust Securitisation
Torrens Series 2011-2 Trust Securitisation
Torrens Series 2012-1 Trust Securitisation
Torrens Series 2013-1 Trust Securitisation
Torrens Series 2013-2 Trust Securitisation
1 Non-operating controlled entities are excluded from the above list.
2 All entities are 100% owned and incorporated in Australia.

98
21. Investments accounted for using the equity method
Ownership interest held by consolidated entity Balance date
2013 2012
% %
Name
Community Sector Enterprises Pty Ltd 50.0 50.0 30 June
Homesafe Solutions Pty Ltd 50.0 50.0 30 June
Silver Body Corporate Financial Services Pty Ltd 50.0 50.0 30 June
Community Telco Australia Pty Ltd 1 100.0 50.0 30 June
Strategic Payments Services Pty Ltd 47.5 47.5 31 December
Linear Financial Holdings Pty Ltd 40.0 40.0 30 June
Homebush Financial Services Ltd 49.0 49.0 30 June
Vic West Community Enterprise Pty Ltd 50.0 - 30 June
Aegis Correctional Partnership Pty Ltd 49.5 - 30 June
Aegis Securitisation Nominees Pty Ltd 49.5 - 30 June
Aegis Correctional Partnership Trust 49.5 - 30 June
Aegis Securitisation Trust 49.5 - 30 June
1 Community Telco Australia (wholly owned subsidiary, effective December 2012)
(i) Principal activities of associated companiesCommunity Sector Enterprises Pty Ltd - financial services Homesafe Solutions Pty Ltd - trust manager Silver Body Corporate Financial Services Pty Ltd - financial services Community Telco Australia Pty Ltd - telecommunication services Strategic Payments Services Pty Ltd - payment processing services Linear Financial Holdings Pty Ltd - asset management services Homebush Financial Services Ltd - financial services Vic West Community Enterprise Pty Ltd - telecommunications services (acquired December 2012)
Aegis Correctional Partnership Pty Ltd - trustee services (acquired November 2012) Aegis Securitisation Nominees Pty Ltd - trustee services (acquired November 2012) Aegis Correctional Partnership Trust - project management and financial services (acquired November 2012) Aegis Securitisation Trust - financial services (acquired November 2012)
All joint ventures' and associates are incorporated in Australia, and have a balance date of 30 June except Strategic Payments Services Pty Ltd which has a balance date of 31 December.

Annual Financial Report Period ending 30 June 2013
99
21. Investments accounted for using the equity method (continued)
(ii) Share of joint ventures' and associates revenue and profits
Consolidated Parent
2013 2012 2013 2012
$m $m $m $m
Share of joint ventures' and associates:
Revenue 16.1 16.4 13.1 14.7
Expense 14.5 15.7 11.2 13.6
Profit before income tax 1.6 0.7 1.9 1.1
Income tax expense 0.1 0.3 0.1 0.2
Profit after income tax 1.5 0.4 1.8 0.9
2013 2012 2013 2012
$m $m $m $m
Share of joint ventures' and associates operating profits after income tax:
Community Sector Enterprises Pty Ltd 0.2 0.2 0.2 0.2
Homesafe Solutions Pty Ltd 0.2 0.4 0.2 0.4
Silver Body Corporate Financial Services Pty Ltd 0.1 0.2 - -
Vicwest Community Enterprise Ltd (0.1) - (0.1) -
Strategic Payments Services Pty Ltd 1.5 0.3 1.5 0.3
Linear Financial Holdings Pty Ltd (0.4) (0.7) - -
Homebush Financial Services Ltd - - - -
Aegis Correctional Partnership Pty Ltd - - - -
Aegis Securitisation Nominees Pty Ltd - - - -
Aegis Correctional Partnership Trust - - - -
Aegis Securitisation Trust - - - -
1.5 0.4 1.8 0.9
The consolidated entity's share in the retained profits and reserves of joint ventures' and associates are not available for payment of dividends to shareholders of Bendigo and Adelaide Bank Limited until such time as those profits and reserves are distributed by the joint ventures' and associates.

100
21. Investments accounted for using the equity method (continued)
(iii) Carrying amount of investments in joint ventures' and associates
2013 2012 2013 2012
$m $m $m $m
Balance at the beginning of financial year 12.9 12.5 10.7 9.5
Carrying amount of investment in joint ventures' and associates 1.4 0.4 1.4 0.4
Acquired during the year
Dividends received from joint ventures' and associates (0.2) (0.4) (0.1) (0.4)
Share of joint ventures' and associates net profits for the financial year 1.5 0.4 1.8 0.9
Carrying amount of investments in joint ventures' and associates at the end of the financial year
15.6 12.9 13.8 10.4
Represented by:
Investments at equity accounted amount:
Homebush Financial Services Ltd 0.8 0.8 0.8 0.8
Community Sector Enterprises Pty Ltd 0.9 0.8 0.9 0.8
Silver Body Corporate Financial Services Pty Ltd 0.4 0.4 - -
Vicwest Community Enterprise Ltd 1.5 - 1.5 -
Strategic Payment Services Pty Ltd 10.2 8.8 10.2 8.8
Homesafe Solutions Pty Ltd 0.4 0.3 0.4 0.3
Linear Financial Holdings Pty Ltd 1.4 1.8 - -
Aegis Correctional Partnership Pty Ltd - - - -
Aegis Securitisation Nominees Pty Ltd - - - -
Aegis Correctional Partnership Trust - - - -
Aegis Securitisation Trust - - - -
15.6 12.9 13.8 10.7
There are no impairment losses relating to investments in joint ventures' and associates.
Unrecognised losses relating to joint ventures' and associates - 1.2 - 1.2
(iv) The consolidated entity's share of the assets and liabilities of joint ventures' and associates in aggregate
Assets 16.1 13.4 13.7 11.2
Liabilities 8.7 9.8 5.9 7.4
Net Assets 7.4 3.6 7.8 3.8
Subsequent events affecting joint ventures' and associates profits/losses for the ensuing year (if any) are disclosed in the Events after balance sheet date Note 49.
The consolidated entity's share of joint ventures' and associates commitments and contingent liabilities (if any) are disclosed in the Commitments and Contingencies Note 44.

Annual Financial Report Period ending 30 June 2013
101
22. Property, plant and equipment
Consolidated Parent
2013 2012 2013 2012
$m $m $m $m
(a) Carrying Value
Property
Freehold land - at fair value 1.0 1.0 0.3 0.3
1.0 1.0 0.3 0.3
Freehold buildings - at fair value 1.1 1.1 0.2 0.2
Accumulated depreciation (0.1) (0.1) - -
1.0 1.0 0.2 0.2
Leasehold improvements - at cost 84.2 80.7 82.8 72.7
Accumulated depreciation (45.8) (40.9) (45.3) (36.7)
38.4 39.8 37.5 36.0
40.4 41.8 38.0 36.5
Other
Plant, furniture, fittings, office equipment & vehicles - at cost 168.3 179.3 164.8 172.1
Accumulated depreciation (145.3) (152.1) (143.3) (148.0)
23.0 27.2 21.5 24.1
63.4 69.0 59.5 60.6
(b) Reconciliations
Freehold land
Carrying amount at beginning of financial year 1.0 16.6 0.3 0.3
Transfer to assets held for sale - (15.6) - -
1.0 1.0 0.3 0.3
Freehold buildings
Carrying amount at beginning of financial year 1.0 14.9 0.2 0.2
Depreciation expense - (0.3) - -
Transfer to assets held for sale - (13.6) - -
1.0 1.0 0.2 0.2
Leasehold improvements - at cost
Carrying amount at beginning of financial year 39.8 39.6 36.0 38.4
Additions 6.0 3.8 6.0 3.8
Additions through acquisition of entities - 2.9 - -
Disposals (0.1) - (0.1) -
Depreciation expense (7.3) (6.5) (7.1) (6.2)
Transfer assets from subsidiary to parent - - 2.7 -
38.4 39.8 37.5 36.0

102
Consolidated Parent
2013 2012 2013 2012
$m $m $m $m
Plant, furniture, fittings, office equipment & vehicles
Carrying amount at beginning of financial year 27.2 28.8 24.1 27.8
Additions 7.1 8.4 6.5 7.9
Additions through acquisition of entities 0.1 2.2 - -
Disposals (0.8) (0.8) (0.7) (0.8)
Depreciation expense (10.6) (11.4) (10.2) (10.8)
Transfer assets from subsidiary to parent - - 1.8 -
23.0 27.2 21.5 24.1
If land and buildings were measured using the cost model the carrying amounts would be as follows:
Land 0.4 0.4 0.1 0.1
Buildings 0.6 0.6 0.1 0.1
Accumulated depreciation and impairment (0.4) (0.3) (0.1) (0.1)
Net carrying amount 0.6 0.7 0.1 0.1
22. Property, plant and equipment (continued)

Annual Financial Report Period ending 30 June 2013
103
23. Assets held for sale
Consolidated Parent
2013 2012 2013 2012
$m $m $m $m
Land and buildings 25.4 25.4 - -
25.4 25.4 - -
24. Investment property
Consolidated Parent
2013 2012 2013 2012
$m $m $m $m
Carrying amount at beginning of financial year 298.9 263.0 - -
Additions 21.0 36.3 - -
Additions through acquisition of entities 12.5 - 12.5 -
Disposals (6.6) - (6.6) -
Net gain/(loss) from fair value adjustments 23.1 (0.4) - -
348.9 298.9 5.9 -
Investment properties are carried at fair value, which has been determined in accordance with directors’ valuations and have not been independently valued.
The major component of the asset represents residential properties acquired under the Homesafe Equity Release product, and is subject to restricted trading rights over the life of the agreements with individual customers. The realisability of the properties and the remittance of income and proceeds of disposal can be impacted by the real estate market conditions, specifically Melbourne and Sydney. The fair value represents the amounts at which the assets could be sold in an arm’s length transaction at the date of valuation including allowance for the restrictions applicable to these assets, and is determined by reference to adjusted property market index rates.
Additions acquired through acquisitions are investment properties acquired through Southern Finance acquisition. Properties are carried at fair value. Properties are independently valued or contracts are in place for sale.

104
25. Intangible assets and goodwill
Consolidated Parent
2013 2012 2013 2012
$m $m $m $m
(a) Carrying Value
Intangible assets
Customer list - at cost 12.1 9.1 2.9 -
Accumulated amortisation (6.0) (4.2) (0.6) -
6.1 4.9 2.3 -
Computer software - at cost 143.4 135.3 122.6 119.9
Accumulated amortisation and impairment (92.5) (67.9) (74.5) (54.6)
50.9 67.4 48.1 65.3
Trustee licence - at cost 8.4 8.4 - -
Computer Software (Adelaide) - at fair value - 1.3 - 1.3
Accumulated amortisation - (1.3) - (1.3)
- - - -
Trade Name - at fair value 28.4 28.4 25.5 25.5
Accumulated amortisation (23.6) (20.7) (22.2) (19.7)
4.8 7.7 3.3 5.8
Customer Relationship - at fair value 72.0 72.0 29.3 29.3
Accumulated amortisation (39.3) (30.7) (20.0) (16.4)
32.7 41.3 9.3 12.9
Management rights - at fair value 15.3 15.3 15.3 15.3
Accumulated amortisation (5.7) (4.7) (5.7) (4.7)
9.6 10.6 9.6 10.6
Core Deposits - at fair value 116.3 116.3 98.7 98.7
Accumulated amortisation (79.0) (68.5) (70.2) (62.0)
37.3 47.8 28.5 36.7
Goodwill 1,368.4 1,360.1 1,288.9 1,277.1
Total intangible assets and goodwill 1,518.2 1,548.2 1,390.0 1,408.4
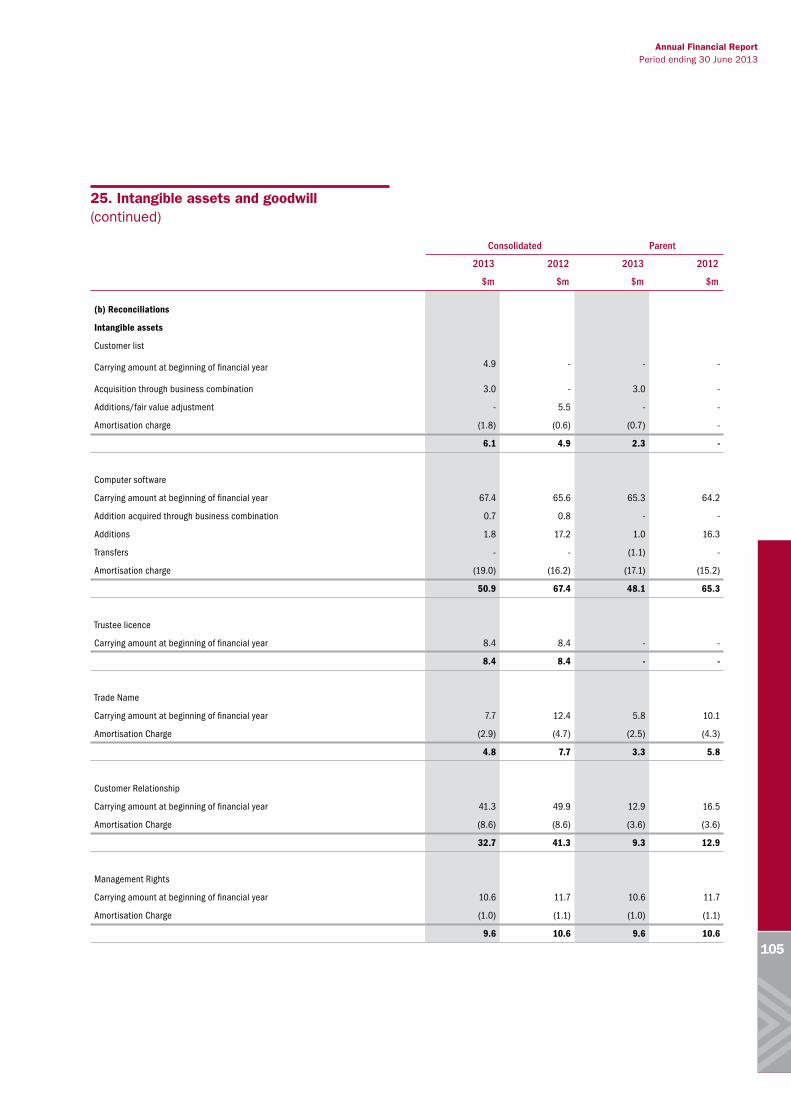
Annual Financial Report Period ending 30 June 2013
105
Consolidated Parent
2013 2012 2013 2012
$m $m $m $m
(b) Reconciliations
Intangible assets
Customer list
Carrying amount at beginning of financial year 4.9 - - -
Acquisition through business combination 3.0 - 3.0 -
Additions/fair value adjustment - 5.5 - -
Amortisation charge (1.8) (0.6) (0.7) -
6.1 4.9 2.3 -
Computer software
Carrying amount at beginning of financial year 67.4 65.6 65.3 64.2
Addition acquired through business combination 0.7 0.8 - -
Additions 1.8 17.2 1.0 16.3
Transfers - - (1.1) -
Amortisation charge (19.0) (16.2) (17.1) (15.2)
50.9 67.4 48.1 65.3
Trustee licence
Carrying amount at beginning of financial year 8.4 8.4 - -
8.4 8.4 - -
Trade Name
Carrying amount at beginning of financial year 7.7 12.4 5.8 10.1
Amortisation Charge (2.9) (4.7) (2.5) (4.3)
4.8 7.7 3.3 5.8
Customer Relationship
Carrying amount at beginning of financial year 41.3 49.9 12.9 16.5
Amortisation Charge (8.6) (8.6) (3.6) (3.6)
32.7 41.3 9.3 12.9
Management Rights
Carrying amount at beginning of financial year 10.6 11.7 10.6 11.7
Amortisation Charge (1.0) (1.1) (1.0) (1.1)
9.6 10.6 9.6 10.6
25. Intangible assets and goodwill (continued)

106
Consolidated Parent
2013 2012 2013 2012
$m $m $m $m
Core Deposits
Carrying amount at beginning of financial year 47.8 60.6 36.7 47.1
Amortisation Charge (10.5) (12.8) (8.2) (10.4)
37.3 47.8 28.5 36.7
Goodwill
Carrying amount at beginning of financial year 1,360.1 1,446.1 1,277.1 1,369.5
Addition acquired through business combination/(purchase price adjustment) 14.5 9.1 2.7 -
Transfer from subsidiary - - 9.1 2.7
Impairment of goodwill (6.2) (95.1) - (95.1)
1,368.4 1,360.1 1,288.9 1,277.1
Total intangible assets and goodwill 1,518.2 1,548.2 1,390.0 1,408.4
Intangible assets
Finite useful lifeThe customer lists are acquired through a business combination and have been capitalised at fair value. The customer lists have been assessed as having a finite life and are amortised using a method that reflects the pattern of the economic benefits of the asset over a period of five years.
Computer software includes internally developed software and software that is not an integral part of the related hardware. Intangible software is capitalised at cost and is amortised over the assessed useful life of the asset on a straight line basis. This is generally a period of between 2.5 years and seven years (major software items).
The carrying value of internally developed software is tested annually for impairment, using estimates of future cash flows over the assets remaining useful life.
Other intangible assets acquired through the business combinations with Adelaide Bank Limited and Rural Bank Limited, include trade name, customer relationship, management rights and core deposits. These assets have been capitalised at fair value and are amortised to reflect the period and pattern of economic benefit. Impairment testing is completed annually on these assets, and if impairment indicators are met, the assets are written down to recoverable amounts.
Indefinite useful lifeThe trustee licence represents an intangible asset purchased through the effect of a business combination (Sandhurst Trustees Limited). The useful life of this asset has been estimated as indefinite and the cost method is utilised for measurement.
The asset is assessed as having an indefinite life as the authorisation for Sandhurst Trustees Limited to trade as a trustee company has no end period. Revocation of the authority is unlikely and would occur only in the event of non-compliance with conditions under which authorisation is granted. Sandhurst Trustees Limited has specific compliance procedures in place to ensure these conditions are met.
GoodwillThe goodwill items represent intangible assets purchased through the effect of business combinations.
For intangible assets that have definite life, impairment testing is only required at each reporting date where there is an indication of an impairment. For intangible assets that have indefinite life, impairment testing is required at least annually.
25. Intangible assets and goodwill (continued)

Annual Financial Report Period ending 30 June 2013
107
26. Impairment testing of goodwill and intangibles with indefinite livesGoodwill acquired through business combinations is initially measured at its cost, being the excess of the cost of the business combination over Bendigo and Adelaide Bank Limited interest in the net fair value of all subsidiaries’ identifiable assets, liabilities and contingent liabilities. Goodwill is not amortised, but is tested for impairment annually or more frequently if impairment indicators exist.
For the year ended 30 June 2013 an impairment loss of $6.2 million was recorded as at 30 June 2013 against the goodwill generated through the Community Telco® Australia acquisition.
Allocation of goodwill and intangible assetsGoodwill and intangible assets do not generate cash flows independently of other assets or groups of assets, and often contributes to the cash flows of multiple cash-generating units. Therefore the accounting standard allows companies to aggregate cash-generating units (CGU) and test goodwill for impairment at relatively higher levels than is the case of other assets.
Amortisation and Impairment Charge – Intangible Assets with Finite LivesAll the intangible assets other than goodwill and trustee licence have been assessed as having finite lives in the ranges as follows:
Category Useful Life
Core deposit
Trade name
Customer relationship
Management rights
Software
Customer lists
2 - 10 years
5 - 15 years
7 - 12 years
15 years
3 - 7 years
5 years
Impairment Review Methodologies – Goodwill and Intangible Assets with Indefinite LivesImpairment testing for goodwill and intangible assets is performed by comparing the carrying amount of the CGU grouping to which the goodwill and intangible assets have been allocated with its recoverable amount. The recoverable amount is measured as the higher of value in use and fair value less costs to sell.
(i) Fair Value MethodIn the goodwill impairment review model, fair value less costs to sell is calculated by multiplying the CGU’s projected after tax cash flows for 2013/2014 (adjusted for specific items) by 12.
In order to determine the appropriate multiple, consideration is given to recent similar transactions that may have occurred. A review is performed over earnings multiples across similar sectors over the last five years as well as current market conditions. Management consider that an earnings multiple of 12 is appropriate for each for each of the Groups identified CGU’s.
(ii) Value in Use MethodValue in use recoverable amount calculation is based on five years’ forecasted after tax cash flows for the CGU, discounted back to the present value using an appropriate discount rate, plus a terminal value.
The discount rate applied to the cash flows projection is 10.07 percent (2012: 9.37%). Management believe this discount rate is appropriate based on current market risk free rate, company specific beta and market risk premium.
Terminal value for value in use method is calculated by discounting the fifth year’s earning by the discount factor (i.e. 10.07 percent minus long term growth rate i.e. 3 percent). Long term growth rates of 3 percent have been used.
The five years’ forecasted after tax cash flows of each CGU is based on management’s expectation of group strategy and future trends in the industry.
The below table represents the growth assumptions adopted for CGU's using the value in use methodology for the 2013/14 year and is based on the budget approved by the Board:
CGU2014/
152015/
162016/
172017/
18
Long term
growth rate
Wealth 4.0% 4.0% 6.0% 6.0% 3.0%
Rural Bank 6.0% 6.0% 6.0% 6.0% 3.0%
The 2013/14 forecasted after tax cash flows are based on the financial forecast approved by the Board.
For impairment review purposes, no impairment loss is required to be made if the CGU’s recoverable amount is above the CGU’s net asset carrying amount under either of the fair value and value in use tests. Based on the fair value or value in use tests results, no further impairment loss is required to be made for any of the CGU’s as at 30 June 2013.
For the purpose of impairment testing, goodwill and intangible assets acquired in a business combination shall, from the acquisition date, be allocated to each of the acquirer’s cash-generating units, or groups of cash-generating units, that are expected to benefit from the synergies of the combination, irrespective of whether other assets or liabilities of the acquiree are assigned to those units or groups of units.
For goodwill allocation, the cash generating units identified represent the core business operations of the Group as follows:
Retail The provision of retail banking products and services delivered through the company-owned branch network and the Group’s share of net interest and fee income from the Community Bank® branch network and includes Delphi Bank.
Third Party The provision of loans, distributed through mortgage brokers, mortgage managers, mortgage originators and alliance partners.

108
26. Impairment testing of goodwill and intangibles with indefinite lives (continued)
Wealth The provision of financial planning services, margin lending activities and wealth deposits. Commissions are received as the responsible entity for managed investment schemes and for corporate trusteeships and other trustee and custodial services.
Rural BankThe provision of banking services to agribusiness, rural and regional Australian communities.
The carrying amount of goodwill and intangibles allocated to each cash-generating unit is as follows:
CGUGoodwill test applied
Carrying amount of goodwill
Carrying amount of intangibles
Sensitivity before impairment becomes evident for the test applied
$m $m Fair value Value in use
Earnings multiple Annual profit growth Discount rate
Retail Fair value 677.5 61.0 Lower by 1 Lower by 10.6% 13.2%
Third Party Fair value 464.4 23.0 Lower by 1 Lower by 10.4% 13.1%
Wealth Value in use 209.7 36.2 Not applicable 1 Lower by 2.2% 10.6%
Rural Bank Value in use 16.8 29.6 Not applicable 1 Lower by 6.4% 11.8%
Total 1,368.4 149.8
1 The value in use test has been applied to the Wealth and Rural Bank CGU.
27. Other assets
Consolidated Parent
2013 2012 2013 2012
$m $m $m $m
Accrued income 22.3 20.7 15.6 18.5
Prepayments 24.0 22.4 18.7 17.4
Sundry debtors 376.7 263.3 1,049.5 645.1
Accrued interest 186.3 203.3 146.1 156.4
Other 6.1 - - -
615.4 509.7 1,229.9 837.4
Other assets are generally non-interest bearing and are short-term by nature. Sundry debtors are normally settled within 30 days. Accrued interest is interest accrued on loans and receivables and is generally charged to the loan or receivable on the first day of the next month.
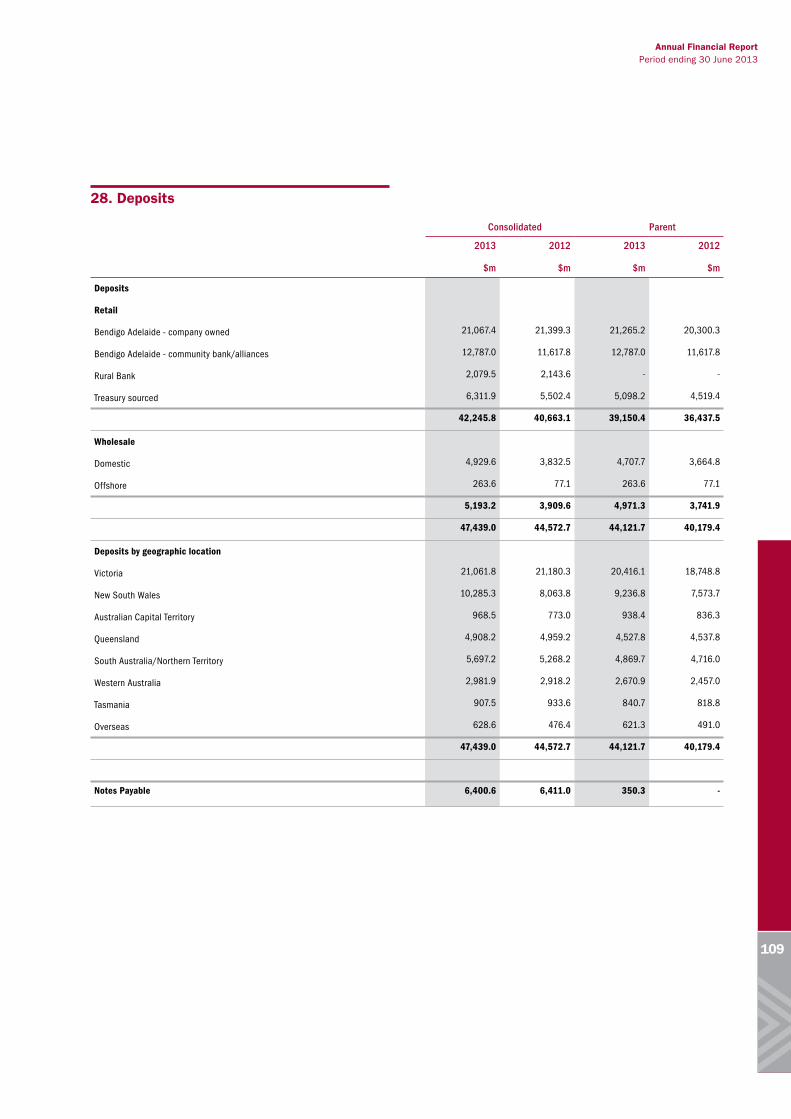
Annual Financial Report Period ending 30 June 2013
109
28. Deposits
Consolidated Parent
2013 2012 2013 2012
$m $m $m $m
Deposits
Retail
Bendigo Adelaide - company owned 21,067.4 21,399.3 21,265.2 20,300.3
Bendigo Adelaide - community bank/alliances 12,787.0 11,617.8 12,787.0 11,617.8
Rural Bank 2,079.5 2,143.6 - -
Treasury sourced 6,311.9 5,502.4 5,098.2 4,519.4
42,245.8 40,663.1 39,150.4 36,437.5
Wholesale
Domestic 4,929.6 3,832.5 4,707.7 3,664.8
Offshore 263.6 77.1 263.6 77.1
5,193.2 3,909.6 4,971.3 3,741.9
47,439.0 44,572.7 44,121.7 40,179.4
Deposits by geographic location
Victoria 21,061.8 21,180.3 20,416.1 18,748.8
New South Wales 10,285.3 8,063.8 9,236.8 7,573.7
Australian Capital Territory 968.5 773.0 938.4 836.3
Queensland 4,908.2 4,959.2 4,527.8 4,537.8
South Australia/Northern Territory 5,697.2 5,268.2 4,869.7 4,716.0
Western Australia 2,981.9 2,918.2 2,670.9 2,457.0
Tasmania 907.5 933.6 840.7 818.8
Overseas 628.6 476.4 621.3 491.0
47,439.0 44,572.7 44,121.7 40,179.4
Notes Payable 6,400.6 6,411.0 350.3 -

110
29. Other payables
Consolidated Parent
2013 2012 2013 2012
$m $m $m $m
Sundry creditors 54.5 36.2 187.3 157.9
Accrued expenses and outstanding claims 291.7 266.7 410.2 668.1
Accrued interest 311.5 387.2 290.4 342.0
Prepaid interest 31.0 41.7 - -
688.7 731.8 887.9 1,168.0
Payables are non-interest bearing and are generally settled within 30 days.
Accrued interest is credited to customer accounts in accordance with the terms of the investment products held by the customer, but generally within a twelve month period.
30. Provisions
Consolidated Parent
2013 2012 2013 2012
$m $m $m $m
(a) Balances
Employee benefits (Note 36) 83.1 66.9 79.9 62.0
Employee shares shortfall 1 0.7 4.2 0.7 4.2
Rewards program 2 4.8 4.2 4.8 4.2
Property Rent 3 1.1 1.5 1.1 1.5
Dividends 4 0.9 1.0 0.9 1.0
Uninsured Losses 5 2.9 2.9 2.9 2.9
93.5 80.7 90.3 75.8
1 The provision for employee shares shortfall is in relation to possible losses associated with employee loans under the Employee share plan. This provision will only be utilised if:
(a) employees instruct the administrator of the plan to sell their shares in settlement of the employee loan relating to those shares: and,
(b) at the time of the sale the market price of Bendigo and Adelaide Bank Limited shares is below the outstanding value of those shares in the loan account.
2 The provision for rewards program is to recognise the liability to customers in relation to points earned by them under the Bendigo and Adelaide Bank Rewards Program and is measured on the basis of full value of points outstanding at balance date. As reward points "expire" after three years, the balance will be utilised, or forfeited within a three year period.
3 The provision for property rent is to recognise the difference between actual property rent paid and the property rent expense recognised in the income statement. The value recognised in the income statement is in accordance with Accounting Standard AASB 117 "Leases" whereby the lease expense is to be recognised on a straight-line basis over the period of the lease. The provision is expected to be utilised over the period of the respective leases, typically a period between three and ten years. However, it is expected that a balance will continue as old leases expire and are replaced by new leases.
4 The provision for dividends represents the residual carried forward balance in relation to ordinary shareholders that participate in the dividend reinvestment plan. It is expected that the current balance will be utilised within a 12 month period. However, an ongoing balance will continue unless all outstanding balances are paid to shareholders upon ceasing participation in the dividend reinvestment plan. The provision also includes accrued dividends relating to preference shares.
5 The provision for uninsured losses represents the expected loss in relation to fraud not covered under insurance contracts.
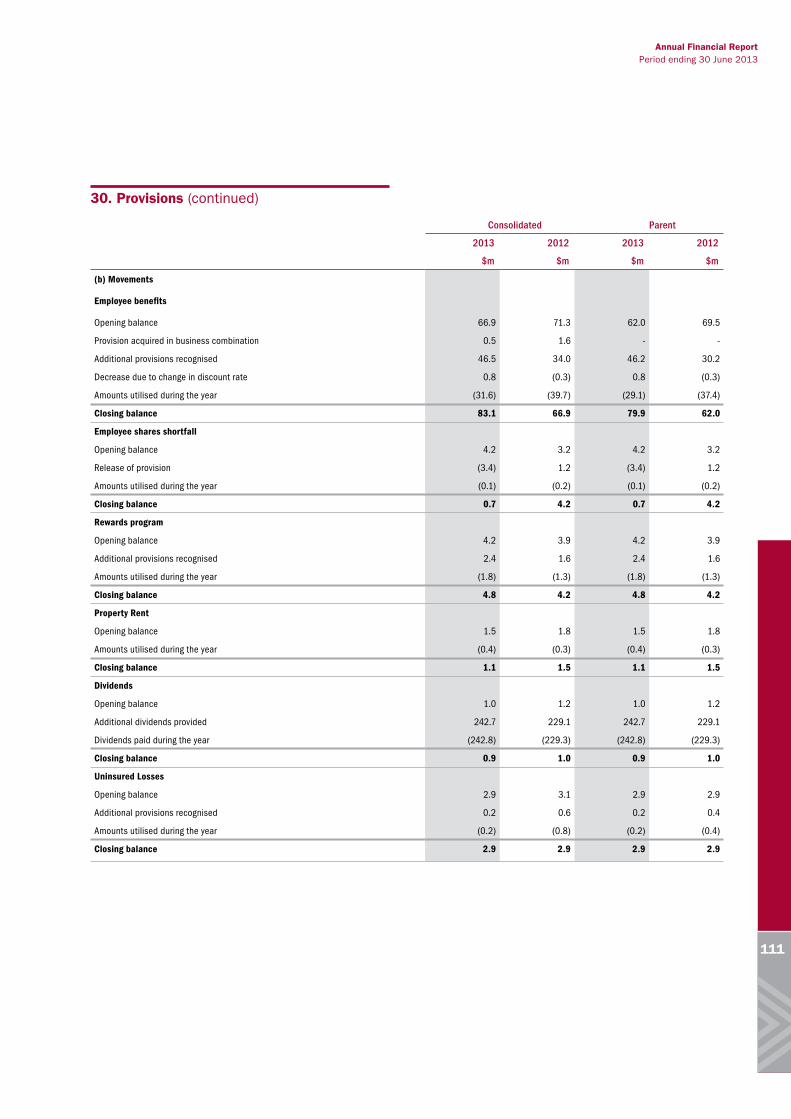
Annual Financial Report Period ending 30 June 2013
111
Consolidated Parent
2013 2012 2013 2012
$m $m $m $m
(b) Movements
Employee benefits
Opening balance 66.9 71.3 62.0 69.5
Provision acquired in business combination 0.5 1.6 - -
Additional provisions recognised 46.5 34.0 46.2 30.2
Decrease due to change in discount rate 0.8 (0.3) 0.8 (0.3)
Amounts utilised during the year (31.6) (39.7) (29.1) (37.4)
Closing balance 83.1 66.9 79.9 62.0
Employee shares shortfall
Opening balance 4.2 3.2 4.2 3.2
Release of provision (3.4) 1.2 (3.4) 1.2
Amounts utilised during the year (0.1) (0.2) (0.1) (0.2)
Closing balance 0.7 4.2 0.7 4.2
Rewards program
Opening balance 4.2 3.9 4.2 3.9
Additional provisions recognised 2.4 1.6 2.4 1.6
Amounts utilised during the year (1.8) (1.3) (1.8) (1.3)
Closing balance 4.8 4.2 4.8 4.2
Property Rent
Opening balance 1.5 1.8 1.5 1.8
Amounts utilised during the year (0.4) (0.3) (0.4) (0.3)
Closing balance 1.1 1.5 1.1 1.5
Dividends
Opening balance 1.0 1.2 1.0 1.2
Additional dividends provided 242.7 229.1 242.7 229.1
Dividends paid during the year (242.8) (229.3) (242.8) (229.3)
Closing balance 0.9 1.0 0.9 1.0
Uninsured Losses
Opening balance 2.9 3.1 2.9 2.9
Additional provisions recognised 0.2 0.6 0.2 0.4
Amounts utilised during the year (0.2) (0.8) (0.2) (0.4)
Closing balance 2.9 2.9 2.9 2.9
30. Provisions (continued)

112
31. Reset Preference Shares
Consolidated Parent
2013 2012 2013 2012
$m $m $m $m
Reset preference shares - Nil fully paid $100 preference shares - 89.5 - 89.5
- 89.5 - 89.5
Reset preference shares are perpetual, but can be exchanged at the request of the holder or the Company. Dividends are non-cumulative and are payable six-monthly in arrears at the discretion of the directors, based on a dividend rate of the five year mid swap reference rate plus the initial margin multiplied by one less the corporate tax rate.
In November 2012 the Bank redeemed all reset preference shares.
32. Convertible preference shares
Consolidated Parent
2013 2012 2013 2012
$m $m $m $m
Convertible preference shares - 2,688,703 fully paid $100 preference shares 268.9 - 268.9 -
268.9 - 268.9 -
In November 2012, the bank issued 2.7 million convertible preference shares. The preference shares may be redeemed at the discretion of Bendigo and Adelaide Bank for a price per preference share on 13 December 2017. Any preference shares not already converted will be converted on 13 December 2019 into ordinary shares.
The preference shares carry a dividend which will be determined semi-annually, payable half yearly in arrears on 13 June and 13 December. If the Bank is unable to pay a dividend because of insufficient profits, the dividend is non-cumulative. The convertible shares rank ahead of the ordinary shares in the event of liquidation, they are perpetual and do not have a fixed maturity date.
The dividend rate will be the floating Bank Bill Rate plus the initial fixed margin, adjusted for franking credits.
33. Subordinated debt
Consolidated Parent
2013 2012 2013 2012
$m $m $m $m
Subordinated capital notes 354.3 436.9 302.2 361.1
Maturity analysis
Not longer than 3 months - 38.5 - 38.5
Longer than 3 and not longer than 12 months - 43.8 - 20.2
Longer than 1 and not longer than 5 years 72.5 72.7 30.4 30.5
Over 5 years 281.8 281.9 271.8 271.9
354.3 436.9 302.2 361.1

Annual Financial Report Period ending 30 June 2013
113
34. Issued capital
Consolidated Parent
2013 2012 2013 2012
$m $m $m $m
Issued and paid up capital
Ordinary shares fully paid - 412,007,864 (2012: 402,233,266 ) 3,758.0 3,681.8 3,758.0 3,681.8
Preference shares of $100 face value fully paid - 900,000 (2012: 900,000 fully paid)
88.5 88.5 88.5 88.5
Step-up preference shares of $100 face value fully paid - 1,000,000 (2012: 1,000,000)
100.0 100.0 100.0 100.0
Employee share ownership plan shares (18.7) (21.3) (18.7) (21.3)
3,927.8 3,849.0 3,927.8 3,849.0
Consolidated Parent
2013 2012 2013 2012
$m $m $m $m
Movements in ordinary shares on issue
Opening balance 1 July - 402,233,266 (2012: 367,104,585 ) 3,681.8 3,408.9 3,681.8 3,408.9
Shares issued under:
Bonus share scheme - 402,549 @ $7.39; 403,561 @ $9.92
(2012: 338,041 @ $8.06; 529,211 @ $7.36) - - - -
Dividend reinvestment plan - 4,957,637 @ $7.39; 4,010,851 @ $9.92
(2012: 5,005,825 @ $8.06; 5,303,252 @ $7.36) 76.4 79.3 76.4 79.3
Institutional placement and entitlement offer - Nil (2012: 17,751,480 @ $8.45) - 150.0 - 150.0
Retail entitlement offer - Nil (2012: 6,200,872 @ $7.33) - 45.5 - 45.5
Share issue costs (0.2) (1.9) (0.2) (1.9)
Closing balance 30 June - 412,007,864 (2012: 402,233,266) 3,758.0 3,681.8 3,758.0 3,681.8
Movements in preference shares on issue
Opening balance 1 July - 900,000 fully paid (2012: 900,000 fully paid) 88.5 88.5 88.5 88.5
Closing balance 30 June - 900,000 fully paid to $100 (2012: 900,000 fully paid)
88.5 88.5 88.5 88.5
Effective 1 July 1998, the corporations legislation in place abolished the concepts of authorised capital and par value shares. Accordingly, the parent does not have authorised capital nor par value in respect of its issued shares. Fully paid ordinary shares carry one vote per share and carry the right to dividends.
Preference share (BPS) dividends are non-cumulative and are payable quarterly in arrears, at the discretion of the directors, based on a dividend rate equal to the sum of the 90 day bank bill rate plus the initial margin multiplied by one minus the company tax rate. It is expected that dividends paid will be fully franked. The BPS are perpetual, but may be redeemed by Bendigo and Adelaide Bank subject to prior approval of APRA.
Step up Preference share (SPS) dividends are non-cumulative and are payable quarterly in arrears, at the discretion of the directors, based on a dividend rate equal to the sum of the 90 day bank bill rate plus the initial margin multiplied by one minus the company tax rate. It is expected that dividends paid will be fully franked. The SPS are perpetual, but may be redeemed by Bendigo and Adelaide Bank subject to prior approval of APRA.
Employee share ownership plan shares is the value of loans outstanding in relation to shares issued to employees under this plan and effectively represents the unpaid portion of the issued shares.

114
34. Issued capital (continued)
Consolidated Parent
2013 2012 2013 2012
$m $m $m $m
Movements in step up preference shares on issue
Opening balance 1 July - 1,000,000 (2012: 1,000,000) 100.0 100.0 100.0 100.0
Closing balance 30 June - 1,000,000 fully paid to $100 (2012: 1,000,000) 100.0 100.0 100.0 100.0
Movements in Employee share ownership plan shares
Opening balance 1 July (21.3) (24.6) (21.3) (24.6)
Reduction in Employee share ownership plan shares 2.6 3.3 2.6 3.3
Closing balance 30 June (18.7) (21.3) (18.7) (21.3)
Total other issued and paid up capital 169.8 167.2 169.8 167.2
Total issued and paid up capital 3,927.8 3,849.0 3,927.8 3,849.0

Annual Financial Report Period ending 30 June 2013
115
35. Retained earnings and reserves
Consolidated Parent
2013 2012 2013 2012
Retained earnings $m $m $m $m
Movements
Opening balance 1 July 296.5 349.5 87.1 224.6
Profit for the year 352.3 195.0 355.2 105.5
Movements in general reserve for credit losses (9.8) (17.6) (14.7) (12.6)
Dividends (242.5) (229.0) (242.5) (229.0)
Defined benefits actuarial adjustment 2.3 (1.8) 2.3 (1.8)
Tax effect of defined benefits actuarial adjustment (0.7) 0.4 (0.7) 0.4
Transfer of business - Delphi Bank - - (0.6) -
Balance 30 June 398.1 296.5 186.1 87.1
Other reserves
(a) Balances
Employee benefits reserve 18.5 20.2 18.5 20.2
Asset revaluation reserve - property 3.5 3.4 0.2 0.1
Asset revaluation reserve - available for sale equity investments 1.7 28.7 0.5 1.8
Asset revaluation reserve - available for sale debt securities 1.1 (1.8) 1.2 (1.7)
Cash flow hedge reserve (34.6) (86.4) (17.2) (54.7)
General reserve for credit losses 138.3 128.5 119.7 105.0
Acquisitions Reserve (20.4) (20.4) - -
108.1 72.2 122.9 70.7
(b) Nature, purpose and movements
Employee benefits reserve
(a) Nature and purpose
The employee benefits reserve is used to record the assessed cost of shares issued to non-executive employees under the Employee Share Plan and the assessed cost of options granted to executive employees under the Executive Incentive Plan.
(b) Movements
Opening balance 20.2 18.7 20.2 18.0
Net increase/(decrease) in reserve (1.7) 1.5 (1.7) 2.2
18.5 20.2 18.5 20.2
Asset revaluation reserve - property
(a) Nature and purpose
The asset revaluation reserve is used to record increments and decrements in the value of non-current assets.
(b) Movements
Opening balance 3.4 3.4 0.1 0.1
Tax adjustment relating to prior years 0.1 - 0.1 -
3.5 3.4 0.2 0.1

116
35. Retained earnings and reserves (continued)
Consolidated Parent
2013 2012 2013 2012
$m $m $m $m
Asset revaluation reserve - available for sale equity investments
(a) Nature and purpose
The asset revaluation reserve is used to record increments and decrements in the value of non-current assets. The reserve can only be used to pay dividends in limited circumstances.
(b) Movements
Opening balance 28.7 34.5 1.8 1.0
Transfer asset revaluation reserve to retained earnings (sold assets) (37.1) - - -
Tax effect of asset revaluation reserve to profit (sold assets) 10.6 - - -
Net revaluation increments/(decrements) 1.1 (9.6) - (0.1)
Tax effect of net revaluation increments (0.3) 3.0 - 0.1
Tax adjustments relating to prior years (1.3) 0.8 (1.3) 0.8
1.7 28.7 0.5 1.8
Asset revaluation reserve - available for sale debt securities
(a) Nature and purpose
The net unrealised gains reserve is used to record unrealised gains and losses on investments in the available for sale portfolio.
(b) Movements
Opening balance (1.8) - (1.7) 0.1
Net unrealised gains/(losses) 2.9 (1.8) 2.9 (1.8)
1.1 (1.8) 1.2 (1.7)
Cash flow hedge reserve
(a) Nature and purpose
The cash flow hedge reserve records the portion of the gain or loss on a hedging instrument in a cash flow hedge that is determined to be an effective hedge.
(b) Movements
Opening balance (86.4) (109.3) (54.7) (68.0)
Changes due to mark to market 75.8 47.0 60.2 34.2
Tax effect of changes due to mark to market (22.7) (15.0) (18.1) (11.2)
Changes due to transfer to the income statement (1.8) (13.0) (6.6) (13.9)
Tax effect of changes due to transfer to the income statement 0.5 3.9 2.0 4.2
(34.6) (86.4) (17.2) (54.7)

Annual Financial Report Period ending 30 June 2013
117
35. Retained earnings and reserves (continued)
Consolidated Parent
2013 2012 2013 2012
$m $m $m $m
General reserve for credit losses
(a) Nature and purpose
The general reserve for credit losses records the value of a reserve maintained to recognised credit losses inherent in the Group's lending portfolio, but not yet identified. The bank is required to maintain general provisions (includes general reserve for credit losses and collective provision) by APRA at a minimum level of 0.50 percent (net of tax) of risk-weighted assets.
(b) Movements
Opening balance 128.5 110.9 105.0 92.4
Establishment of GRCL on acquisition - 4.8 - -
Establishment of GRCL on transfer of business - - 4.9 -
Increase/(decrease) in general reserve for credit losses 9.8 12.8 9.8 12.6
138.3 128.5 119.7 105.0
Acquisitions Reserve
(a) Nature and purpose
The acquisition reserve is used to record the difference between the carrying value of non-controlling interest and the consideration paid to acquire the remaining interest of the non-controlling interest.
The reserve is attributable to the equity of the parent.
(b) Movements
Opening balance (20.4) (20.4) - -
(20.4) (20.4) - -
Total reserves 108.1 72.2 122.9 70.7
36. Employee benefits
Employee benefits liability
Provision for annual leave 23.5 21.0 21.7 18.9
Provision for other employee payments 9.1 0.6 9.1 -
Provision for long service leave 44.8 40.1 43.4 37.9
Provision for sick leave bonus 5.7 5.2 5.7 5.2
Aggregate employee benefits liability 83.1 66.9 79.9 62.0
It is anticipated that annual leave provided at balance date will be paid in the ensuing 12 month period.
Other employee payments include short-term incentives are expected to be paid in September 2013.
Long service leave is taken with agreement between employee and employer, or on termination of employment.
Sick leave bonus is paid to entitled employees on termination of employment.

118
37. Share based payment plans
Salary Sacrifice, Deferred Share and Performance Share Plan (Current)The Company has established an Employee Salary Sacrifice, Deferred Share and Performance Share Plan (the Plan) that is used as the vehicle for senior executive (including the Managing Director) long term incentive arrangements. The Plan provides for grants of performance shares to the Managing Director, other senior executives and senior management (the Participants) and includes rules to allow the Board to set performance conditions and to determine when those performance conditions have been met and the Performance Shares vest.
In addition, the plan is used to provide grants of deferred shares to Participants as deferred base remuneration that is subject to a service based condition and risk adjustment. The Plan is also used to provide grants of deferred shares in connection with the Short Term Incentive (STI) equity deferral component of senior executive and senior management remuneration arrangements.
Performance sharesUnder the Plan, the Participants have been granted performance shares subject to performance conditions set by the Board. If the performance conditions are satisfied during the relevant performance period, the performance shares will vest. The performance conditions and performance periods for grants under the Plan are set out in the 2013 Remuneration Report. Each performance share represents an entitlement to one fully-paid ordinary share in the company. Accordingly, the maximum number of shares that may be acquired by the Participants is equal to the number of performance shares granted.
Performance shares are granted at no cost to Participants. The Plan rules provide that the Board may determine that a price is payable upon exercise of an exercisable performance share. The Board has determined that no exercise price will apply to exercisable performance shares.
The number of performance shares granted to Participants is based on the fair value of each performance share. The assessed fair value of current performance shares granted under the Plan are set out in the 2013 remuneration report at Table 4.
The Participants are entitled to vote and to receive any dividend, bonus issue, return of capital or other distribution made in respect of shares they are allocated on vesting and exercise of their performance shares. The grants to the Managing Director are subject to a dealing restriction. The Managing Director is not entitled to sell, transfer or otherwise deal with any shares allocated to them until two years after the end of the performance period. There is no dealing restriction on the current grant of performance shares to other senior executives.
The current grants under the Plan to Participants were made in December 2009 (Managing Director’s grant), and in December 2010, September 2011 and August 2012. The grants were made in accordance with the terms disclosed in the remuneration report and were valued and expensed in accordance with applicable accounting requirements. The expense recognised in the income statement. The following table illustrates the number (No.) and weighted average exercise prices (WAEP) of and movements in performance shares issued during the year.
The outstanding balance as at 30 June 2013 is represented by 591,357 performance shares over ordinary shares with an exercise price of nil, each exercisable upon meeting the above conditions, and until 2016. The weighted average fair value of performance shares granted during the year was $3.30 (2012: $7.50).
The fair value of the performance shares granted under the Plan takes into account the terms and conditions upon which the performance shares were granted. The fair value is estimated as at the date of grant using the Black-Scholes-Merton Option Pricing Model incorporating a Monte Carlo simulation option pricing model to estimate the probability of achieving the TSR hurdle and the number of shares vesting. The first table on page 119 lists the inputs to the model used for the 2012 and 2013 financial years.
2013 No.
2013 WAEP
2012 No.
2012 WAEP
Outstanding at the beginning of the year 587,330 $0.00 877,560 $0.00
Granted during the year 202,739 $0.00 110,201 $0.00
Forfeited during the year - - - -
Vested / Exercised during the year (198,712) $0.00 (210,864) $0.00
Expired during the year - $0.00 (189,567) $0.00
Outstanding at the end of the year 591,357 $0.00 587,330 $0.00

Annual Financial Report Period ending 30 June 2013
119
37. Share based payment plans (continued)
2013 Grant 2012 Grant
Dividend yield (%) 6.5% 6.0%
Expected volatility (%) 25% 27.5%
Risk-free interest rate (%) 2.49% 3.79% to 4.27%
Expected life of performance shares (years)
4 3
Exercise price ($) Nil Nil
Fair value share price at grant date ($) $7.58 $8.82
The expected life of the performance shares is based on historical data and is not necessarily indicative of exercise patterns that may occur. The expected volatility reflects the assumption that the historical volatility is indicative of future trends, which may also not necessarily be the actual outcome. No other features of shares granted were incorporated into the measurement of fair value.
Deferred sharesUnder the Plan, the Participants have been granted deferred shares as deferred base remuneration and in relation to the STI equity deferral components of remuneration. Deferred shares are fully-paid ordinary shares in the Company. Accordingly, the maximum number of shares that may be acquired by the Participants is equal to the number of deferred shares granted.
Deferred shares issued in relation to deferred base remuneration are subject to a service condition and risk adjustment as decided by the Board. The deferred shares issued in relation to the STI equity deferral are subject to a dealing restriction and continued service condition set by the Board. Deferred shares are issued at no cost to the recipient and have no exercise price. If the service condition is satisfied the deferred shares will vest subject to any financial and risk adjustment decided by the Board. The service condition for grants under the Plan is set out in the 2013 Remuneration Report.
The number of deferred shares granted to Participants is calculated using a volume weighted average closing price of the company’s shares. The assessed fair value of each performance share granted under the Plan is set out in the tables presented in the 2013 Remuneration Report.
The Participants are entitled to vote and to receive any dividend, bonus issue, return of capital or other distribution made in respect of shares they are allocated on vesting of their deferred shares.
The first grant was made under the Plan in March 2012 that related to STI equity deferral for the 2011 financial year and a subsequent grant was made in September 2012 as deferred base remuneration. The grants were made in accordance with the terms disclosed in the remuneration report and were valued and expensed in accordance with applicable accounting requirements. The expense recognised in the income statement in relation to share-based payments is disclosed in the Income Statement. The following table illustrates the number (No.) and weighted average exercise prices (WAEP) of and movements in deferred shares issued during the year.
2013 No.
2013 WAEP
2012 No.
2012 WAEP
Outstanding at the beginning of the year 74,466 $0.00 - $0.00
Granted during the year 94,521 $0.00 74,466 $0.00
Forfeited during the year (2,781) - - -
Vested / Exercised during the year (71,685) $0.00 - $0.00
Expired during the year - $0.00 - $0.00
Outstanding at the end of the year 94,521 $0.00 74,466 $0.00
The outstanding balance as at 30 June 2013 is represented by 94,521 deferred shares with an exercise price of nil, each exercisable upon the Participant meeting the above conditions, and until 30 June 2014. The weighted average fair value of deferred shares granted during the year was $7.30 (2012: $7.73). The fair value of the deferred shares granted under the Plan takes into account the terms and conditions upon which the deferred shares were granted. The fair value is estimated as at the date of grant using the volume weighted average closing price of the company’s shares traded on the ASX for the five trading days prior to the grant date.

120
37. Share based payment plans (continued)
Employee Share Plan (Current)The Bank established a loan-based limited recourse Employee Share Plan (Plan) in 2006. The Plan is substantially the same as the legacy plan (employee share ownership plan) that was in place from 1995 to 2006. However, the new Plan is only available to general staff. Executives (including the Managing Director) may not participate in it.
Under the terms of the Plan, shares are issued at the prevailing market value. The shares must be paid for by the staff member. The Plan provides staff members with an interest-free loan for the sole purpose of acquiring Plan shares. Net cash dividends after personal income tax obligations are applied to reduce the loan balance and staff cannot deal in the shares until the loan has been repaid. The primary benefit under the terms of the Plan is the financial benefit of the limited recourse interest-free loan.
The first issue to general staff under this plan was completed in September 2006. A grant to Community Bank® employees was made in December 2007. There have been no further issues under this Plan. Share issues under the Plan are valued and expensed in accordance with applicable accounting requirements. The expense recognised in the income statement in relation to share-based payments is disclosed on the following page. The following table illustrates the number (No.) and weighted average exercise prices (WAEP) of and movements in Plan shares (including the employee share ownership plan) during the year.
2013 No.
2013 WAEP
2012 No.
2012 WAEP
Outstanding at the beginning of the year 3,683,212 $5.78 4,187,187 $5.87
Granted during the year - - - -
Forfeited during the year - - - -
Exercised during the year (370,175) $6.90 (503,975) $6.53
Expired during the year - - - -
Outstanding at the end of the year 3,313,037 $5.65 3,683,212 $5.78
Exercisable at the end of the year 3,313,037 $5.65 3,683,212 $5.78
The outstanding balance as at 30 June 2013 is represented by 3,313,037 ordinary shares with a market value at 30 June 2013 of $10.07 each (value: $33,362,283), exercisable upon repayment of the employee loans.
The acquisition price of shares granted during the year was nil as no new shares have been issued since December 2007. The acquisition price for shares issued under the Plan is calculated using the volume weighted average share price of the company’s shares traded on the ASX in the 7 days trading ending one calendar week before the invitation date.
The fair value of the shares granted under the Plan is estimated as at the date of each grant using the Black-Scholes-Merton Option Pricing Model taking into account the terms and conditions upon which the shares were granted. The fair value is determined by independent valuation. The expected life of the share options is based on historical data and is not necessarily indicative of exercise patterns that may occur. The expected volatility reflects the assumption that the historical volatility is indicative of future trends, which may also not necessarily be the actual outcome. No other features of shares granted were incorporated into the measurement of fair value. The exercise price of the shares issued will reduce over time as dividends are applied to repay the staff loans.

Annual Financial Report Period ending 30 June 2013
121
37. Share based payment plans (continued)
Consolidated
2013 2012
$m $m
Recognised share-based payment expenses
Expense arising from equity settled share-based payment transactions 0.2 2.2
Total expense arising from share-based payment transactions 0.2 2.2
Employee share and loan values and EPS impact 1
Employee Share and Loan Values
Value of unlisted employee shares on issue at 30 June 2013 -
3,313,037 shares @ $10.07 (2012 - 3,683,212 shares @ $7.41) 33.4 27.3
Value of outstanding employee loans at beginning of year relating to employee shares 21.3 24.6
Value of repayments of loans during year (2.6) (3.3)
Value of outstanding employee loans at end of year relating to employee shares 18.7 21.3
Number of employees with outstanding loan balances 2,075 2,217
Indicative cost of funding employee loans
Average balance of loans outstanding 19.8 22.6
Average cost of funds 3.99% 5.06%
After tax indicative cost of funding employee loans 0.6 0.8
Earnings per ordinary share - actual cents 84.9 48.6
Earnings per ordinary share - adjusted for interest foregone cents 85.0 48.8
1 The EPS analysis relates to shares issued under the Company’s current and legacy employee share plans.
The cost of employee interest-free loans is calculated by applying the Company’s average cost of funds for the financial year to the average outstanding balance of employee loans for the financial year. This cost is then tax-effected at the Company tax rate of 30 percent (2012: 30%).
Earnings per ordinary share - adjusted is calculated by adding the after tax indicative cost of funding employee loans to profit available for distribution to ordinary shareholders. This adjusted earnings figure is divided by the weighted average number of ordinary shares.

122
37. Share based payment plans (continued)
Share Grant Scheme (Current)The Company has established a tax-exempt Employee Share Grant Scheme (ESGS) as the main equity participation platform for general employees. The ESGS is open to all full-time and permanent part-time staff in the Group (excluding directors and senior executives) who can elect to acquire fully paid ordinary shares. It is was intended that grants under the ESGS would be made annually subject to Board discretion and having regard to company performance.
Employees will generally be entitled to participate in rights attached to the shares including to receive dividends and to vote at general meetings. The shares are restricted for three years unless the employee leaves the Company. The first grant to general employees was made in January 2009 with 764,504 fully paid ordinary shares being issued at $10.78. A second grant to general employees was made in March 2010 with 340,039 fully paid ordinary shares being issued at $10.03 and a third grant to general employees was made in February 2011 with 327,233 fully paid ordinary shares being issued at $9.78. There were no grants under the ESGS during the 2012 and 2013 financial years.
The issue price is the volume weighted average price of the Company’s shares traded over the five days prior to the issue. The share issues were valued and expensed in accordance with applicable accounting requirements. The expense recognised in the income statement in relation to share-based payments is disclosed on the previous page. As at 30 June 2013 there were 278,310 fully paid ordinary shares held by the Plan Trustee.
Bendigo and Adelaide Bank Employee Share Ownership Plan (Discontinued)
The Company discontinued in 2006 the existing loan-based Employee Share Ownership Plan (the Plan) that was open to all employees in the Group, including the Managing Director and senior executives. The Plan will continue as a legacy plan until such time as the loans provided to fund share purchases under the Plan have been repaid. There have been no issues of shares under this Plan since November 2004.
Shares were issued under the Plan at market value. The terms of the Plan are consistent with the Share Ownership Plan described earlier. The Plan provides staff members with an interest-free loan for the sole purpose of acquiring Plan shares. Staff cannot deal in the shares until the loan has been repaid. The primary benefit under the terms of the Plan is the financial benefit of the limited recourse interest-free loan.
The loan will be repayable progressively out of after tax dividends (if any) paid on the shares and the sale of unexercised renounceable rights (if any). A participant is not otherwise obliged to repay all or part of the outstanding loan while he or she is an employee of the Bendigo and Adelaide Bank Group. The loan must be fully repaid when a participant ends employment and before the participant can sell, transfer, mortgage or otherwise deal with the shares.
If a participant’s employment ends and the participant have not repaid the loan within the time period specified by the Board, the Company may sell, transfer or realise the participant’s shares and apply those funds to cover the costs of the sale and to repay the loan. If there is a shortfall in repaying the loan once the participant’s shares are sold, the Company will not have any further recourse against the participant.
The notional value of the limited recourse interest-free loan provided to the Managing Director and relevant senior executives under this legacy Plan is disclosed in the remuneration tables that accompany this report. Information on shares issued and loans provided under this Plan have been aggregated into the above table titled “Recognised share-based payment expenses”.

Annual Financial Report Period ending 30 June 2013
123
38. Auditor's remuneration
Consolidated Parent
2013 2012 2013 2012
$m $m $m $m
Total fees paid or due and payable to Ernst & Young (Australia) 1
Audit and review of financial statements 2 1,817,403 2,027,396 1,297,440 1,198,039
Audit-related fees
Regulatory 3 620,318 274,315 565,985 211,665
Non-regulatory 4 3,502 42,745 3,502 3,399
Total audit-related fees 623,820 317,060 569,487 215,064
All other fees 5
Taxation services 125,705 182,334 93,205 162,084
Other advice 50,470 44,805 - 44,805
Total other fees 176,175 227,139 93,205 206,889
Total remuneration of Ernst & Young Australia 2,617,398 2,571,595 1,960,132 1,619,992
1 Fees exclude goods and services tax
2 Audit and review of financial statements includes payments for the audit of the financial statements of the Group and parent, including controlled entities that are required to prepare financial statements.
3 Audit-related fees (Regulatory) consist of fees for services required by statute or regulation that are reasonably related to the performance of the audit of the Group's financial statements and are traditionally performed by the external auditor. These services include assurance of the Group’s compliance with APRA and Australian Financial Services Licensing reporting and compliance requirements.
4 Audit-related (Non-regulatory) consist of fees for assurance and related services not required by statute or regulation but are reasonably related to the performance of the audit or review of the Group's financial statements which are traditionally performed by the external auditor. These services include assurance of the Group's credit assessments and reviews of the Group's acquisition accounting and tax consolidation processes.
5 All other fees, including taxation services and other advice are incurred under the audit committee's pre-approval policies and procedures, having regard to the auditor’s independence requirements of applicable laws, rules and regulations, and assessment that each of the non-audit services provided would not impair the independence of Ernst & Young.

124
39. Key management personnelDetails of key management personnel for the Group and the Company for the 2013 financial year are presented in the 2013 Remuneration Report.
Compensation for key management personnel for the 2013 and 2012 financial years:
Short-term benefitsPost employment
benefitsOther long term
benefitsTermination
benefitsShare-based
payments Total
2013 $6,824,232 $280,599 $67,448 - $1,681,139 $8,853,418
2012 $6,326,221 $397,628 $73,366 - $3,030,036 $9,827,251
Details of remuneration disclosures in relation to the Company’s key management personnel are presented in the Remuneration Report which forms part of the Directors’ Report. The remuneration disclosures in the Remuneration Report have been audited.
Equity holdings of key Management PersonnelAll equity transactions with key management personnel have been entered into under terms and conditions no more favourable than those the entity would have adopted if dealing at arm’s length other than shares issued under the Employee Share Ownership Plan. Issues of shares under the Employee Share Plan are made under conditions disclosed in Note 37.
Shares held by non-executive directors:The details of shareholdings in the Company held (directly or nominally) by each director or their related parties (their close family members or any entity they, or their close family members, control, jointly control or significantly influence) are set out below.
1 July 2012 Net Change 30 June 2013
Name Ordinary shares Pref Shares Ordinary shares Pref Shares Ordinary shares Pref Shares
Non-Executive Directors
R Johanson 337,407 1,000 (9,566) 500 327,841 1,500
J Dawson 33,444 100 2,408 - 35,852 100
J Hazel 12,462 - 2,958 - 15,420 -
J Hey 3,114 - 1,374 350 4,488 350
R Hubbard 1 - - 4,500 - 4,500 -
D Matthews 7,295 - 4,112 - 11,407 -
T O’Dwyer 1 74,530 - (74,530) - - -
D Radford 1,900 - - - 1,900 -
A Robinson 6,921 - 3,079 - 10,000 -
1 Mr Hubbard was appointed on 2 April 2013 and Mr O’Dwyer retired on 13 August 2012.

Annual Financial Report Period ending 30 June 2013
125
1 July 2011 Net Change 30 June 2012
Name Ordinary shares Pref Shares Ordinary shares Pref Shares Ordinary shares Pref Shares
Non-Executive Directors
R Johanson 333,604 1,000 3,803 - 337,407 1,000
J Dawson 28,199 100 5,245 - 33,444 100
J Hazel 10,659 - 1,803 - 12,462 -
J Hey - - 3,114 - 3,114 -
D Matthews 6,925 - 370 - 7,295 -
T O’Dwyer 1 73,575 - 955 - 74,530 -
D Radford 1,900 - - - 1,900 -
A Robinson 5,966 - 955 - 6,921 -
Shares held by the Managing Director and senior executivesPerformance shares and deferred shares are granted as equity compensation under the Employee Salary Sacrifice, Deferred Share and Performance Share Plan (Plan) to certain key management personnel as the long term incentive and deferred base remuneration components.
Performance sharesThe movements in performance shares granted by the Company for FY2013 and FY2012 are set out below.
30 June 2013Balance at
1-Jul-12Granted as
Remuneration
Number Exercised /
Vested Number LapsedBalance at 30-Jun-13 Exercisable Not Exercisable
Current Executives
M Hirst 417,109 - (198,712) - 218,397 - 218,397
M Baker - 27,397 - - 27,397 - 27,397
D Bice - 13,699 - - 13,699 - 13,699
J Billington - 20,091 - - 20,091 - 20,091
R Fennell - 27,397 - - 27,397 - 27,397
R Jenkins - 27,397 - - 27,397 - 27,397
T Piper - 20,548 - - 20,548 - 20,548
S Thredgold - 13,699 - - 13,699 - 13,699
A Watts - 20,548 - - 20,548 - 20,548
39. Key management personnel (continued)

126
30 June 2012Balance at
1-Jul-11Granted as
Remuneration
Number Exercised /
Vested Number LapsedBalance at 30-Jun-12 Exercisable Not Exercisable
Current Executives
M Hirst 493,328 - (76,219) - 417,109 - 417,109
M Baker 51,793 - (21,245) (30,548) - - -
D Bice 27,318 - (11,108) (16,210) - - -
J Billington 31,032 - (13,205) (17,827) - - -
R Fennell 50,610 - (20,841) (29,769) - - -
R Jenkins 51,793 - (21,245) (30,548) - - -
T Piper 37,898 - (15,610) (22,288) - - -
S Thredgold 21,157 - (9,003) (12,154) - - -
A Watts 31,737 - (13,505) (18,232) - - -
The movements in shareholdings in the Company for senior executives (including their related parties) are below:
FY2013 Type 1 1 JulyGranted as
remuneration Received on
vesting 2 Net change other 30 June
M Hirst Deferred shares 12,936 - - (12,936) -
Ordinary shares 428,761 - 198,712 33,338 660,811
Preference shares - - - - -
M Baker Deferred shares 8,624 13,699 (8,624) 13,699
Ordinary shares 171,615 - - 15,777 187,392
Preference shares 500 - - - 500
D Bice Deferred shares 3,018 6,849 (3,018) 6,849
Ordinary shares 80,089 - - (10,056) 70,033
Preference shares - - - - -
J Billington Deferred shares 4,312 10,046 (4,312) 10,046
Ordinary shares 36,250 - - 6,243 42,493
Preference shares - - - - -
R Fennell Deferred shares 8,624 13,699 (8,624) 13,699
Ordinary shares 84,836 - - 12,638 97,474
Preference shares - - - - -
R Jenkins Deferred shares 6,899 13,699 (6,899) 13,699
Ordinary shares 159,770 - - (10,890) 148,880
Preference shares - - - - -
T Piper Deferred shares 5,390 10,274 (5,390) 10,274
Ordinary shares 63,371 - - (1,610) 61,761
Preference shares - - - - -
S Thredgold Deferred shares 3,449 6,849 (3,449) 6,849
Ordinary shares 28,780 - - 4,765 33,545
Preference shares - - - - -
A Watts Deferred shares 4,312 10,274 (4,312) 10,274
Ordinary shares 60,030 - - 6,286 66,316
Preference shares - - - - -
39. Key management personnel (continued)

Annual Financial Report Period ending 30 June 2013
127
FY2012 Type 1 1 JulyGranted as
remuneration Received on
vesting 2 Net change other 30 June
M Hirst Deferred shares - 12,936 - - 12,936
Ordinary shares 334,919 - 76,219 17,623 428,761
Preference shares - - - - -
M Baker Deferred shares - 8,624 - - 8,624
Ordinary shares 143,825 - 21,245 6,545 171,615
Preference shares 500 - - - 500
D Bice Deferred shares - 3,018 - - 3,018
Ordinary shares 66,795 - 11,108 2,186 80,089
Preference shares - - - - -
J Billington Deferred shares - 4,312 - - 4,312
Ordinary shares 21,788 - 13,205 1,257 36,250
Preference shares - - - - -
R Fennell Deferred shares - 8,624 - - 8,624
Ordinary shares 61,910 - 20,841 2,085 84,836
Preference shares - - - - -
R Jenkins Deferred shares - 6,899 - - 6,899
Ordinary shares 155,012 - 21,245 (16,487) 159,770
Preference shares - - - - -
T Piper Deferred shares - 5,390 - - 5,390
Ordinary shares 46,562 - 15,610 1,199 63,371
Preference shares - - - - -
S Thredgold Deferred shares - 3,449 - - 3,449
Ordinary shares 18,921 - 9,003 856 28,780
Preference shares - - - - -
A Watts Deferred shares - 4,312 - - 4,312
Ordinary shares 45,239 - 13,505 1,286 60,030
Preference shares - - - - -
1 Ordinary share amounts include ordinary shares issued under the employee share ownership plan.
2 Shares allocated in relation to vested performance shares.
39. Key management personnel (continued)

128
Loans to directors and named executives (including their related parties)Details of individuals (including their related parties) with loans above $100,000 in the reporting period are as follows:
Balance at beginning of
period
Interest charged
Interest not charged
Write-off Balance at end of period
Number at 30 June 2013
$’000 $’000 $’000 $’000 $’000
Non-Executive Directors
2013 1,923 121 - - 2,132 5
2012 3,188 200 - - 1,923 5
Executives 1
2013 4,779 254 24 - 5,103 8
2012 4,451 282 35 - 4,779 8
Total Directors and Executives
2013 6,702 375 24 - 7,235 13
2012 7,639 482 35 - 6,702 13
39. Key management personnel (continued)
1 Balances include interest-free loans provided to the Managing Director and senior executives in connection with share issues under employee share plans as described at Note 37. Details of individuals (including their related parties) with loans in the reporting period are as follows:
Balance at beginning of
period
Interest charged
Interest not charged
Write-off Balance at end of period
Highest owing in period
$’000 $’000 $’000 $’000 $’000 $’000
Non-Executive Directors
R Johanson 504 38 - - 576 712
J Dawson 405 24 - - 383 405
D Radford 54 1 1 - - 291 317
T Robinson 500 30 - - 500 503
D Matthews 460 28 - - 382 466
1 The facilities were fully repaid shortly after the start of the financial year. In addition the facilities were not redrawn until late in the financial year.

Annual Financial Report Period ending 30 June 2013
129
Balance at beginning of
period
Interest charged Interest not charged
Write-off Balance at end of period
Highest owing in period
$’000 $’000 $’000 $’000 $’000 $’000
Executives
M Hirst
Staff share loan 206 - 8 - 183 206
Loans 137 9 - - 120 167
M Baker
Staff share loan 159 - 6 - 136 159
Loans 43 4 - - 87 103
D Bice
Staff share loan 74 - 3 - 65 74
Loans 477 34 - - 511 516
J Billington
Loans 374 32 - - 711 784
R Fennell
Loans 464 28 - - 464 492
R Jenkins
Staff share loan 159 - 6 - 136 159
Loans 2,066 117 - - 1,678 2,066
S Thredgold
Loans 560 29 - - 968 976
A Watts
Staff share loan 35 - 1 - 29 35
Loans 25 1 - - 15 47
Terms and conditions of director and senior executive loans The loans to directors and senior executives are made in the ordinary course of the company’s business and on an arms-length basis. The loans are processed and approved in accordance with the Bank’s standing lending processes and prevailing terms and conditions.
Terms and conditions of the loans under Employee Share Ownership Plan Loans have been provided to senior executives under the terms of the Bank’s legacy Employee Share Ownership Plan (Plan). Details of the Plan’s terms and conditions are provided at Note 37 to the financial statements.
Other transactions of directors and director related entitiesMr R Johanson is a director and part-time employee, but no longer a sherholder, of the Grant Samuel Group, which is one of a range of firms which may be engaged to provide professional advisory services to Bendigo and Adelaide Bank Ltd. The services are based on normal commercial terms and conditions. A protocol, approved by the Board, has been established for the engagement of Grant Samuel by the Bank which includes arrangements for dealing with conflicts of interest. The services are provided in accordance with scheduled fee rates which were discussed and approved by the Board in the absence of Mr Johanson. Grant Samuel was not engaged to provide advisory services to the Company during the reporting period and accordingly there were no fees paid to Grant Samuel for the year (fees paid FY2012: $273,322).
39. Key management personnel (continued)
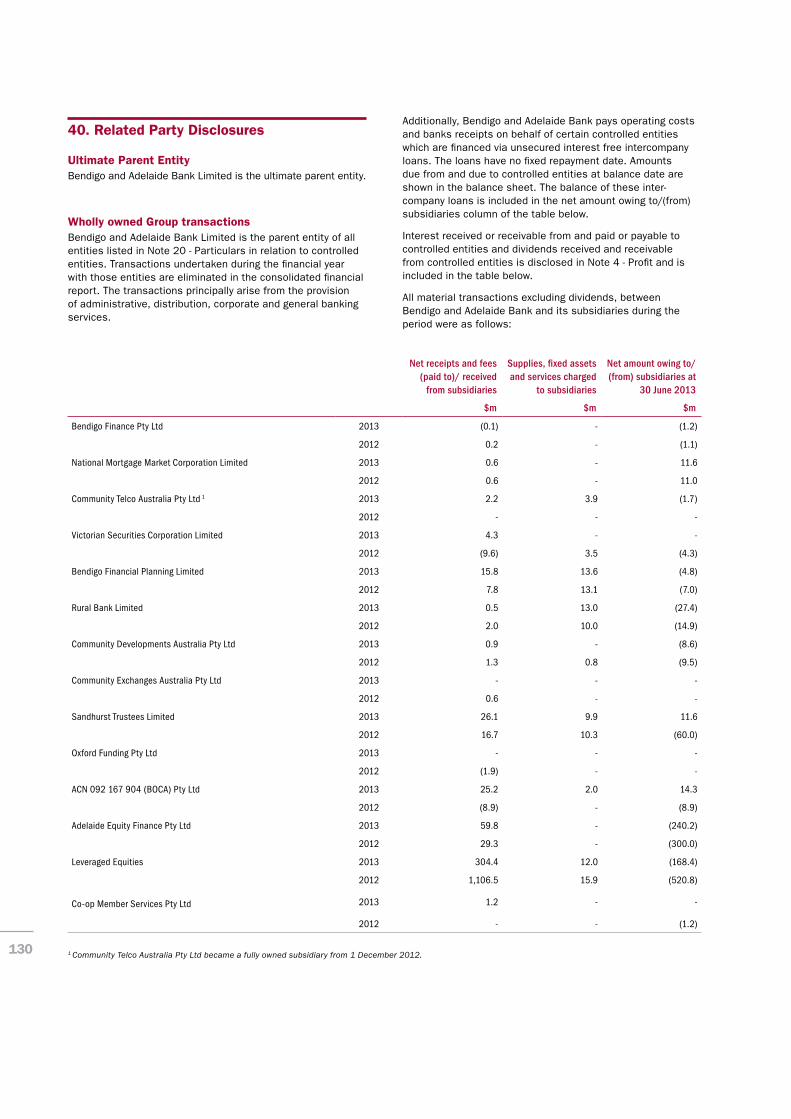
130
40. Related Party Disclosures
Ultimate Parent Entity Bendigo and Adelaide Bank Limited is the ultimate parent entity.
Wholly owned Group transactions Bendigo and Adelaide Bank Limited is the parent entity of all entities listed in Note 20 - Particulars in relation to controlled entities. Transactions undertaken during the financial year with those entities are eliminated in the consolidated financial report. The transactions principally arise from the provision of administrative, distribution, corporate and general banking services.
Additionally, Bendigo and Adelaide Bank pays operating costs and banks receipts on behalf of certain controlled entities which are financed via unsecured interest free intercompany loans. The loans have no fixed repayment date. Amounts due from and due to controlled entities at balance date are shown in the balance sheet. The balance of these inter-company loans is included in the net amount owing to/(from) subsidiaries column of the table below.
Interest received or receivable from and paid or payable to controlled entities and dividends received and receivable from controlled entities is disclosed in Note 4 - Profit and is included in the table below.
All material transactions excluding dividends, between Bendigo and Adelaide Bank and its subsidiaries during the period were as follows:
Net receipts and fees (paid to)/ received
from subsidiaries
Supplies, fixed assets and services charged
to subsidiaries
Net amount owing to/(from) subsidiaries at
30 June 2013
$m $m $m
Bendigo Finance Pty Ltd 2013 (0.1) - (1.2)
2012 0.2 - (1.1)
National Mortgage Market Corporation Limited 2013 0.6 - 11.6
2012 0.6 - 11.0
Community Telco Australia Pty Ltd 1 2013 2.2 3.9 (1.7)
2012 - - -
Victorian Securities Corporation Limited 2013 4.3 - -
2012 (9.6) 3.5 (4.3)
Bendigo Financial Planning Limited 2013 15.8 13.6 (4.8)
2012 7.8 13.1 (7.0)
Rural Bank Limited 2013 0.5 13.0 (27.4)
2012 2.0 10.0 (14.9)
Community Developments Australia Pty Ltd 2013 0.9 - (8.6)
2012 1.3 0.8 (9.5)
Community Exchanges Australia Pty Ltd 2013 - - -
2012 0.6 - -
Sandhurst Trustees Limited 2013 26.1 9.9 11.6
2012 16.7 10.3 (60.0)
Oxford Funding Pty Ltd 2013 - - -
2012 (1.9) - -
ACN 092 167 904 (BOCA) Pty Ltd 2013 25.2 2.0 14.3
2012 (8.9) - (8.9)
Adelaide Equity Finance Pty Ltd 2013 59.8 - (240.2)
2012 29.3 - (300.0)
Leveraged Equities 2013 304.4 12.0 (168.4)
2012 1,106.5 15.9 (520.8)
Co-op Member Services Pty Ltd 2013 1.2 - -
2012 - - (1.2)
1 Community Telco Australia Pty Ltd became a fully owned subsidiary from 1 December 2012.

Annual Financial Report Period ending 30 June 2013
131
Net receipts and fees (paid to)/ received
from subsidiaries
Supplies, fixed assets and services charged
to subsidiaries
Net amount owing to/(from) subsidiaries at
30 June 2013
$m $m $m
Hindmarsh Financial Service Pty Ltd 2013 - - (1.4)
2012 - - (1.4)
AB Management Pty Ltd 2013 1.8 - 16.2
2012 2.5 - 14.4
Adelaide Managed Funds Limited 2013 0.1 0.2 1.1
2012 1.8 0.3 1.2
Hindmarsh Adelaide Property Trust 2013 - - (4.9)
2012 0.1 0.1 (4.9)
Homesafe Trust 2013 - - (330.9)
2012 - - (287.4)
Pirie St Nominees Pty Ltd 2013 11.3 - 1.1
2012 (10.3) - (10.2)
Subsidiary FacilityLimit
$m
Drawn/issued at 30 June 2013
$m
Sandhurst Trustees Limited Standby 12.0 -
Guarantee 0.5 -
Community Telco Australia Pty Ltd Overdraft 2.5 0.6
Dividends paid by subsidiaries are disclosed in the table below.
Bendigo and Adelaide Bank provides funding and guarantee facilities to several subsidiary companies as detailed in the following table. The balance outstanding on these facilities are included in the net amount owing to/(from) subsidiaries in the above table.
All funding and guarantee facilities are provided to subsidiary companies on normal commercial terms and conditions.
Several subsidiary companies have bank accounts and investment funds held with Bendigo and Adelaide Bank Limited under normal terms and conditions. These balances are included in the amount owing to/(from) subsidiaries in the above table.
Guarantees disclosed in the above table with a zero limit are less than $0.1 million.
All funding and guarantee facilities are provided to subsidiary companies on normal commercial terms and conditions.
Several subsidiary companies have bank accounts and investment funds held with Bendigo and Adelaide Bank
Limited under normal terms and conditions. These balances are included in the amount owing to/(from) subsidiaries in the above table.
The following dividends received by Bendigo and Adelaide Bank Limited from subsidiary companies are included in the above table:
$m
Sandhurst Trustees Limited 2013 55.4
2012 -
Victorian Securities Corporation Limited 2013 -
2012 4.7
Oxford Funding 2013 -
2012 2.1
Leveraged Equities 2013 60.0
2012 -
During the year there were no other material transactions between subsidiary companies.
40. Related Party Disclosures (continued)

132
40. Related Party Disclosures (continued)
Other related party transactions
Securitised and sold loansThe Bank securitised loans totalling $3,053.0 million (2012: $1,556.9 million) during the financial year. The consolidated Group does invest in some of its own securitisation programs where the Bank holds A & B notes equivalent to $6,520.4 million as at 30 June 2013 (2012: $5,719.4 million). The Bank does invest in other securitisation programs unrelated to the Bank as part of normal investment activities.
Joint venture entities and associatesBendigo and Adelaide Bank Limited has investments in joint venture entities and associates are disclosed in Note 21 - Investments accounted for using the equity method. The Group has transactions with the joint venture entities and associates, principally relating to commissions received and paid, services and supplies procured from joint ventures and associates and fees charged in relation to the provision of banking, administrative and corporate services. These revenue and expense items are included in the relevant values disclosed in Note 4 - Profit. The transactions are conducted on terms and conditions no more favourable than those which it is reasonable to expect would have been adopted if dealing with the joint venture entities and associates at arm's length in the same circumstances.
During the financial year, transactions took place between the Bendigo and Adelaide Bank Group and joint venture entities and associates as follows:
Commissions and fees paid to
joint ventures
Supplies and services
provided to joint ventures
Amount owing to/(from) joint
ventures at 30 June 2013
$m $m $m
Homesafe Solutions Pty Ltd 2013 4.3 - -
2012 4.9 - -
Community Sector Enterprises Pty Ltd 2013 8.6 3.8 0.2
2012 7.3 1.5 0.1
Silver Body Corporate Financial Services Pty Ltd 2013 0.8 0.5 -
2012 1.0 0.6 -
Strategic Payments Services Pty Ltd 2013 12.2 - -
2012 11.6 - -
Community Telco Australia Pty Ltd (1) 2013 - - -
2012 0.2 - (0.7)
Linear Financial Holdings Pty Ltd 2013 - - (4.7)
2012 - - (4.4)
Homebush Financial Services Ltd 2013 0.6 0.1 0.1
2012 0.3 - 0.1
Vicwest Community Enterprises Ltd 2013 0.1 3.0 (2.9)
2012 - - -
(1) Community Telco Australia Pty Ltd became a fully owned subsidiary from 1 December 2012.
Dividends received and receivable from joint ventures’ and associates are disclosed in Note 4 – Profit.
Bendigo and Adelaide Bank Limited provides loans, guarantees and/or overdraft facilities to joint ventures’ and associates in connection with cash flow management, and the payment of administration costs on behalf of the joint ventures’ and associates. The loans have agreed repayment terms which vary according to the nature of the facility. These loans are included in the net amount owing to/(from) joint ventures’ and associates in the above table.

Annual Financial Report Period ending 30 June 2013
133
41. Risk Management
Risk OversightThe management of risk is an essential element of the Group’s strategy, profitability management and is central to the way the Group operates.
The Board, being ultimately responsible for risk management associated with the Group’s activities, has established a Group Risk Management Framework (GRMF) which provides an integrated governance and accountability framework, policies and controls to identify, assess, monitor and manage risk.
In addition to strategic and reputation risk the material business risks relating to the Group can be categorised as: credit, market (including interest rate and currency), liquidity, and operational risk (includes compliance, contagion, environment/sustainability risks).
The GRMF establishes a framework for risk governance which involves managing the Bank’s risks within the limits and tolerances detailed in the Group’s risk appetite statement and is underpinned by a system of delegations, passing from the Board through Board committees, the Managing Director (MD), management committees to the various risk, support and business units of the Group.
An essential element of the GRMF is the risk culture of the Group. Management of risk is the responsibility of the business units of the Group. Embedded in the Group’s culture are the values of all staff doing the right thing, taking responsibility for managing risks inherent in their role and engaging with the Group’s stakeholders including the broader community to deliver a sustainable business proposition for all. The Group’s risk management culture is also demonstrated by many aspects of management of the Group, including:
> Risk is managed both top down and bottom up.
> Risk management is embedded in strategy, planning, policy (including remuneration) and procedures.
> An ability to identify opportunities, strive for quality and efficiency and minimise losses.
> Maintaining risk competencies especially for key roles.
> Regular discussion on risk at the business unit level.
> Acting promptly to manage risks and events whether internal or external.
> The existence of a close working relationship/partnership between the business and risk functions and acceptance of a “healthy tension” between the functions.
Board responsibilitiesIn accordance with the Board charter, the Board principally through the Audit, Credit, Risk, Change framework and Technology Governance and Governance & HR committees oversees the establishment, implementation, review and monitoring of risk management systems and policies, taking into account the risk appetite of the Group, the overall business strategy, management expertise and the external environment. This includes approving risk limits and risk policies.
Board Committee responsibilitiesThe Board has approved policies that support the implementation of a risk oversight and management framework for the Group. These policies are overseen by the Board committees with each committee operating under a Board approved charter that is reviewed annually.
Each committee has established Terms of Reference that describes the relevant responsibilities in respect to oversight and monitoring of Board-approved risk management policies.
The committees evaluate developments in respect to the Group’s structure and operations, as well as economic, industry and market developments that may impact the Group’s management of risk.
Executive responsibilitiesOn a day to day basis each executive, manager and staff member are responsible for carrying out their roles in a way that manages risk in line with policies and procedures.
Whilst the Board has responsibility for approving the Group’s appetite for risk, the MD and other executive committee members are responsible for developing strategies and business plans commensurate with that risk appetite.
The executive committee has responsibility for ensuring that the Board approved strategies and decisions are appropriately implemented as well as managing and monitoring the day to day activities of the Group including the management of risk and consideration of emerging risks and opportunities.
The executive has a number of committees that assists the executive consider risk management matters including the Asset Liability Management Committee, Management Credit Committee and the Operational Risk Committee.
Independent review
Group Assurance (Internal audit)The Group Assurance function operates under a charter and annual audit plan approved by the Board Audit Committee. The Board, on recommendation of the Board Audit Committee, approves the appointment of the Head of Group Assurance. The committee receives reports at each meeting in respect to the outcomes and status of the internal bank assurance plan. The independent group assurance function audits all functions across the Group including the effectiveness of the Group’s risk management and internal compliance and control systems, in line with the Bank assurance plan and has direct access to the Board through the Board Audit Committee.
Group Risk Group Risk is an independent function within the Group and provides the frameworks, policies and procedures to assist the Group in managing credit and operational risk in line with the risk appetite set by the Board.
The Group Credit Risk function is responsible for reviewing portfolio credit quality, policy development and promulgation, credit policy compliance, the assessment of large credit exposures and manages the performance of the credit management system at the Group level.
The Group Operational Risk function is responsible for providing the frameworks, tools and support to assist the business in the management of its operational risk (including regulatory compliance, business continuity, financial crimes and dealings through its partners).

134
41. Risk Management (continued)
The Group insurance function develops an insurance strategy and program for “insurable risk” which is approved by the Board risk committee.
The Group Risk function has direct access to the Board through the Board Credit and Risk committees.
Middle officeA middle office function has been established within Finance and Treasury that is responsible for monitoring market risk and treasury policy compliance (including adherence to tolerance limits). Middle office reports to the Chief Financial Officer and has direct access to the Asset Liability Management Committee and in turn the Board Risk Committee.
MD and CFO AssuranceAs part of the statutory reporting arrangements for the Group, the Managing Director (MD) and Chief Financial Officer (CFO), provide a written declaration to the Board that:
> The Group’s financial statements present a true and fair view, in all material respects, of the Group’s financial position and performance, are in accordance with the Corporations Act and comply with the Corporations Regulations 2001 and accounting standards.
> The financial records of the Group for the financial year have been properly maintained in accordance with Section 286 of the Corporations Act 2001.
> The above statements regarding the integrity of the financial reports are founded on a sound system of risk management and internal control and that the systems, including those relating to business continuity, are operating effectively in all material respects in relation to financial reporting risks.
> Any other matters that are prescribed by the Corporations Act regulations as they relate to the financial statements and notes to the financial statements are met.
To provide this assurance a formal due diligence and verification process, including attestations from management, is conducted. This assurance is provided each six months in conjunction with the half year and full year financial reporting obligations. The statements are made on the basis that they provide a reasonable but not absolute level of assurance and do not imply a guarantee against adverse circumstances that may arise in future periods.
In addition a description of the systems and policies employed to manage the key risks to which the Bank and Group is exposed is provided to APRA. The MD confirms annually the integrity of these descriptions to APRA with the endorsement of the Board.
Risk Principles
OverviewThe Group’s Risk Management Principles and Systems Description document summarises the risk management control framework of the Group. These principles are approved by the Board and may be amended with endorsement of the Board. Specific details and responsibilities for managing each category of risk are contained in the relevant policy statements, frameworks and procedural manuals.
The risk principles are summarised below.
Risk management strategyA structured framework has been established to ensure that the risk management objectives are linked to the Group’s business strategy and operations. The risk management strategy is underpinned by an integrated framework of responsibilities and functions driven from Board level down to operational levels, covering all aspects of risk, most notably market, credit, liquidity, operational (includes compliance, contagion and environmental), strategic, reputation and emerging risks.
The framework recognises the governance structure and risk management framework referred to above.
Risk limitsRisk limits for market risk, credit risk and capital at risk are set and monitored by the appropriate management committees within the risk appetite approved by the Board.
The management of operational risk is performed using qualitative self assessment and the Group has defined general parameters to manage the Group-wide operational risk profile to comply with the approved risk appetite and tolerances.
Limits (which may be in the form of net interest income, net profit before or after tax, retained earnings, market value of equity or other key performance indicators) are based upon the level of capital the Board is willing to place at risk. Limits are calculated by aggregating quantifiable measures of market, credit and operational risk.
Prior to approval by the Board, limits are formally reviewed on a regular basis by the appropriate management and Board committees, who consider changes in market conditions, strategy or risk appetite. The limits are set and reviewed regularly by the Asset Liability Management Committee, Operational Risk Committee, Management Credit Committee and Executive Committee. They align with the financial forecast and planning cycle take into account historic and projected risk-adjusted performance and are independently monitored.

Annual Financial Report Period ending 30 June 2013
135
41. Risk Management (continued)
Risk management measurement reporting and controlEffective measurement, reporting and control of risk is vital to manage the Group’s business activities in accordance with overall strategic and risk management objectives. The risk management, reporting and control framework requires the quantification of market, credit and liquidity risk, the capability to aggregate and monitor exposures, a comprehensive set of limits to ensure that exposures remain within the approved risk appetite, and a mechanism for evaluating performance on a risk-adjusted basis. The management of operational risk is based on a documented policy and framework. The Board has defined general parameters to manage the Group-wide operational risk profile to comply with the approved risk appetite and tolerances which considers both downside risk and opportunities.
Internal controlsThe risk management framework requires robust internal controls across all aspects of the business as well as strong support functions covering legal, regulatory, governance, reputation, finance, information technology, human resources and strategy. Consequently the effectiveness and efficiency of controls is evaluated in all new and amended products, processes and systems or where external and internal factors impact the operating environment (e.g. changes in organisation structure, growth, new regulation).
Risk management systemsAccurate, reliable and timely information is vital to support decisions regarding risk management at all levels. The requirements span a diverse range of risk functionality including market and credit risk analysis systems, financial forecasting, strategic planning, asset and liability management, performance measurement, operational risk and regulatory reporting, as well as trading and trade processing systems and those systems supporting our staff.
Data reconciliation is established to provide for the integrity of the information used and appropriate security controls around all systems. Back-up and recovery procedures are defined and business continuity plans approved and communicated to promote resilience and minimise the impact of an incident.
The Group maintains and implements specific policies and procedures to measure, monitor, manage and report on the material and emerging risks to which the Group is exposed. Each policy contains requirements to be met for review and approval.
Material Risks
OverviewThe GRMF of the Group is structured upon:
> Core Risk Principles – overriding principles governing all activities and risk monitoring procedures; and
> Specific Risk Policies – appropriate policies, framework documents, procedures and processes implemented to manage specific risks to which the Group is exposed.
The Board, and industry regulators, have identified the material risks to which the Group is exposed as being credit, market (including interest rate and currency), liquidity and operational risk. Specific risk management structures have been established by the Group to manage these and other risks (e.g. reputation, emerging, strategic, contagion and sustainability).
The material risks are described below.
Credit riskCredit risk is the potential that the Group will suffer a financial loss due to the unwillingness or inability of counterparties to fully meet their contractual debts and obligations.
The Board Credit Committee is responsible for monitoring adherence to credit policies, practices and procedures within the Group. The Board has established levels of delegated lending authority under which various levels of management (including the management credit committee), partners and the Board credit committee can approve transactions.
Group Credit Risk has responsibility for:
> Managing, maintaining and enhancing the currency and relevance of the Group’s credit policies;
> Providing support and analysis of credit portfolio information for credit management purposes;
> Reporting to the management credit committee and the Board credit committee and
> Jointly approving larger transactions that are not required to be submitted to the management credit committee for approval.

136
41. Risk Management (continued)The table below shows the maximum exposure to credit risk for the components of the balance sheet, including derivatives. The maximum exposure is shown gross, before the effect of mitigation through the use of master netting and collateral agreements.
Consolidated Parent
Gross maximum exposure 2013
$ m2012
$ m2013
$ m2012
$ m
Cash and cash equivalents 383.8 288.8 258.1 175.8
Due from other financial institutions 293.9 272.2 292.2 266.3
Financial assets held for trading 5,465.2 4,366.1 5,465.8 4,367.0
Financial assets available for sale - debt securities 535.5 444.8 1,362.9 1,594.6
Financial assets held to maturity 323.3 388.4 1.8 1.8
Other assets 615.4 509.7 1,229.9 837.4
Financial assets available for sale - equity investments 18.1 124.7 4.5 4.1
Derivatives 31.9 48.5 182.6 547.3
Shares in controlled entities - - 526.5 604.1
Amounts receivable from controlled entities - - 544.7 1,090.8
Loans and other receivables - investment 554.1 453.0 554.1 453.0
Gross loans and other receivables 50,125.0 48,379.0 44,759.1 41,455.1
58,346.2 55,275.2 55,182.2 51,397.3
Contingent liabilities 232.9 235.9 227.8 223.4
Commitments 5,474.3 4,611.8 5,212.6 4,319.1
5,707.2 4,847.7 5,440.4 4,542.5
Total credit risk exposure 64,053.4 60,122.9 60,622.6 55,939.8
Where financial instruments are recorded at fair value the amounts shown above represent the current credit risk exposure but not the maximum risk exposure that could arise in the future as a result of changes in values.
The effect of collateral and other risk mitigation techniques is shown in the Ageing table within this note.
Concentrations of the maximum exposure to credit riskConcentration of risk is managed by client/counterparty, by geographical region and by industry sector. The maximum credit exposure to any client or counterparty as at 30 June 2013 was $856.4 million (2012: $652.6 million) before taking account of collateral or other credit enhancements and $856.4 million (2012: $652.6 million) net of such protection.
GeographicThe Group’s financial assets, before taking into account any collateral held or other credit enhancements can be analysed by the following geographic regions:
Consolidated Parent
Gross maximum exposure2013
$ m2012
$ m2013
$ m2012
$ m
Victoria 22,619.7 22,347.6 23,937.7 23,380.6
New South Wales 13,183.5 12,835.2 11,775.7 10,894.0
Australian Capital Territory 840.0 823.2 807.5 784.1
Queensland 9,836.3 9,697.2 8,537.5 8,278.6
South Australia/Northern Territory 7,907.9 6,870.4 7,476.8 6,390.9
Western Australia 7,552.7 6,055.9 6,139.9 4,838.9
Tasmania 1,504.9 1,124.0 1,356.8 1,019.8
Overseas/other 608.4 369.4 590.7 352.9
Total credit risk exposure 64,053.4 60,122.9 60,622.6 55,939.8

Annual Financial Report Period ending 30 June 2013
137
41. Risk Management (continued)
Industry sectorAn industry sector analysis of the Group’s financial assets, before taking into account collateral held or other credit enhancements, is as follows:
Consolidated Parent
Gross maximum exposure
Gross maximum exposure
Gross maximum exposure
Gross maximum exposure
Industry Concentration2013
$ m2012
$ m2013
$ m2012
$ m
Accommodation and food services 699.2 644.6 698.9 642.9
Administrative and support services 307.8 310.1 307.8 310.1
Agriculture, forestry and fishing 5,174.5 4,913.8 1,495.1 1,467.2
Arts and recreation services 206.2 199.8 206.2 191.7
Construction 2,564.1 2,307.2 2,522.6 2,213.1
Education and training 413.9 411.4 413.9 411.4
Electricity, gas, water and waste services 209.1 208.9 209.1 208.9
Financial and insurance services 1,520.2 1,430.6 1,519.0 1,428.2
Financial services 7,387.8 6,288.8 9,628.5 9,413.8
Health care and social assistance 1,180.7 1,083.3 1,180.7 1,082.4
Information media and telecommunications 184.5 185.1 192.8 191.3
Manufacturing 924.1 927.5 922.6 897.4
Margin Lending 1,915.6 2,333.2 - -
Mining 236.6 240.9 236.6 240.9
Other 308.5 176.7 299.8 126.6
Other Services 712.6 673.1 712.4 673.1
Professional, scientific and technical services 874.1 833.5 873.6 833.0
Public administration and safety 670.3 584.2 669.7 583.6
Rental, hiring and real estate services 4,160.3 4,071.8 4,138.6 3,525.9
Residential/consumer 31,759.4 29,630.3 31,754.2 28,921.2
Retail trade 1,414.7 1,461.9 1,414.3 1,399.1
Transport, postal and warehousing 775.6 729.7 775.2 724.8
Wholesale trade 453.6 476.5 451.0 453.2
64,053.4 60,122.9 60,622.6 55,939.8
The amount and type of collateral required depends on an assessment of the credit risk of the counterparty. Guidelines are implemented regarding the acceptability of types of collateral and valuation parameters.
The main types of collateral obtained are as follows:
> For home loans - charges over borrowers’ residential, other properties or cash. Further, lenders mortgage insurance (LMI) is taken out for most loans with a loan to valuation ratio (LVR) higher than 80 percent.
> For commercial loans - charges over specified assets such as commercial and residential property, inventory and trade receivables or cash, and guarantees.
> For margin lending - charges over listed securities and managed funds.
> For personal loans - approximately 50 percent are secured by a charge over a specified asset, whilst credit cards are predominantly unsecured.
Management monitors the market value of collateral, requests additional collateral in accordance with the underlying agreement, and monitors the market value of collateral obtained during the review of the adequacy of the allowance for impairment losses.
It is the Group’s policy to dispose of repossessed properties in an orderly fashion. The proceeds are used to reduce or repay the outstanding claim.

138
41. Risk Management (continued)
Credit quality
The credit quality of financial assets is managed by the Group using internal credit ratings. The table below shows the credit quality by class of asset for financial asset balance sheet lines, based on the Group’s credit rating system.
Consolidated
Neither past due or impaired
High GradeStandard
GradeSub-standard
Grade UnratedConsumer
Loans*Past Due or
Impaired Total
2013 $ m $ m $ m $ m $ m $ m $ m
Cash and cash equivalents 383.8 - - - - - 383.8
Due from other financial institutions 293.9 - - - - - 293.9
Financial assets held for trading 5,465.2 - - - - - 5,465.2
Financial assets available for sale - debt securities
535.5 - - - - - 535.5
Financial assets held to maturity 323.3 - - - - - 323.3
Other assets - - - 615.4 - - 615.4
Financial assets available for sale - equity investments
- - - 18.1 - - 18.1
Derivatives 31.9 - - - - - 31.9
Loans and other receivables - investment
- 302.4 221.7 17.2 - 12.8 554.1
Loans and other receivables 3,473.6 8,377.3 1,134.7 606.7 33,681.6 2,851.1 50,125.0
10,507.2 8,679.7 1,356.4 1,257.4 33,681.6 2,863.9 58,346.2
2012
Cash and cash equivalents 288.8 - - - - - 288.8
Due from other financial institutions 272.2 - - - - - 272.2
Financial assets held for trading 4,366.1 - - - - - 4,366.1
Financial assets available for sale - debt securities
444.8 - - - - - 444.8
Financial assets held to maturity 388.4 - - - - - 388.4
Other assets - - - 509.7 - - 509.7
Financial assets available for sale - equity investments
- - - 124.7 - - 124.7
Derivatives 48.5 - - - - - 48.5
Loans and other receivables - investment
- 233.2 58.4 17.9 - 143.5 453.0
Loans and other receivables 3,742.4 7,638.2 964.9 654.1 32,374.8 3,004.6 48,379.0
9,551.2 7,871.4 1,023.3 1,306.4 32,374.8 3,148.1 55,275.2
* Consumer loans are predominantly mortgage secured residential loans not rated on an individual basis.

Annual Financial Report Period ending 30 June 2013
139
Parent
Neither past due or impaired
High GradeStandard
GradeSub-standard
GradeUnrated Consumer
Loans*Past Due or
ImpairedTotal
2013 $ m $ m $ m $ m $ m $ m $ m
Cash and cash equivalents 258.1 - - - - - 258.1
Due from other financial institutions 292.2 - - - - - 292.2
Financial assets held for trading 5,465.8 - - - - - 5,465.8
Financial assets available for sale - debt securities
1,362.9 - - - - - 1,362.9
Financial assets held to maturity 1.8 - - - - - 1.8
Other assets - - - 1,229.9 - - 1,229.9
Financial assets available for sale - equity investments
- - - 4.5 - - 4.5
Derivatives 182.6 - - - - - 182.6
Loans and other receivables - investment
- 302.4 221.7 17.2 - 12.8 554.1
Loans and other receivables 83.0 6,768.7 807.4 964.9 33,684.4 2,450.7 44,759.1
Amounts receivable from controlled entities
- - - 544.7 - - 544.7
Shares in controlled entities - - - 526.5 - - 526.5
7,646.4 7,071.1 1,029.1 3,287.7 33,684.4 2,463.5 55,182.2
2012
Cash and cash equivalents 175.8 - - - - - 175.8
Due from other financial institutions 266.3 - - - - - 266.3
Financial assets held for trading 4,367.0 - - - - - 4,367.0
Financial assets available for sale - debt securities
1,594.6 - - - - - 1,594.6
Financial assets held to maturity 1.8 - - - - - 1.8
Other assets - - - 837.4 - - 837.4
Financial assets available for sale - equity investments
- - - 4.1 - - 4.1
Derivatives 547.3 - - - - - 547.3
Loans and other receivables - investment
- 233.2 58.4 17.9 - 143.5 453.0
Loans and other receivables 81.8 5,583.0 614.7 955.4 31,819.8 2,400.4 41,455.1
Amounts receivable from controlled entities
- - - 1,090.8 - - 1,090.8
Shares in controlled entities - - - 604.1 - - 604.1
7,034.6 5,816.2 673.1 3,509.7 31,819.8 2,543.9 51,397.3
* Consumer loans are predominantly mortgage secured residential loans not rated on an individual basis.
41. Risk Management (continued)
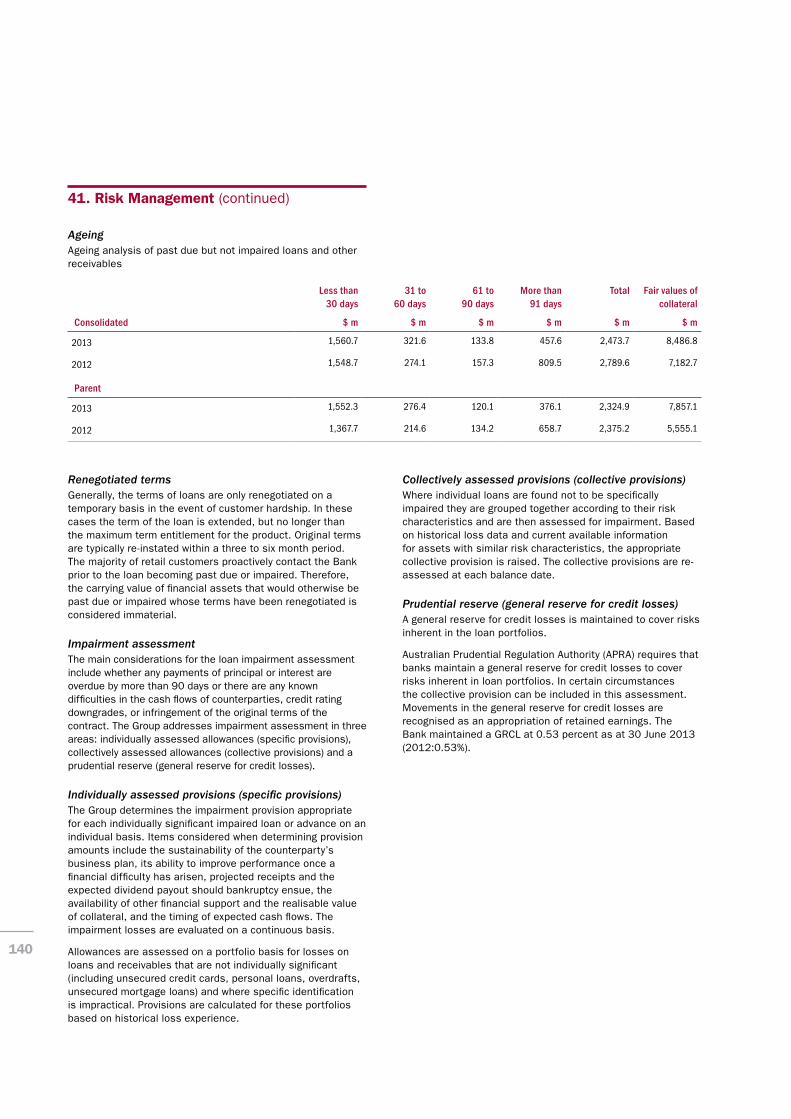
140
AgeingAgeing analysis of past due but not impaired loans and other receivables
Less than 30 days
31 to 60 days
61 to 90 days
More than 91 days
Total Fair values of collateral
Consolidated $ m $ m $ m $ m $ m $ m
2013 1,560.7 321.6 133.8 457.6 2,473.7 8,486.8
2012 1,548.7 274.1 157.3 809.5 2,789.6 7,182.7
Parent
2013 1,552.3 276.4 120.1 376.1 2,324.9 7,857.1
2012 1,367.7 214.6 134.2 658.7 2,375.2 5,555.1
Renegotiated termsGenerally, the terms of loans are only renegotiated on a temporary basis in the event of customer hardship. In these cases the term of the loan is extended, but no longer than the maximum term entitlement for the product. Original terms are typically re-instated within a three to six month period. The majority of retail customers proactively contact the Bank prior to the loan becoming past due or impaired. Therefore, the carrying value of financial assets that would otherwise be past due or impaired whose terms have been renegotiated is considered immaterial.
Impairment assessmentThe main considerations for the loan impairment assessment include whether any payments of principal or interest are overdue by more than 90 days or there are any known difficulties in the cash flows of counterparties, credit rating downgrades, or infringement of the original terms of the contract. The Group addresses impairment assessment in three areas: individually assessed allowances (specific provisions), collectively assessed allowances (collective provisions) and a prudential reserve (general reserve for credit losses).
Individually assessed provisions (specific provisions)The Group determines the impairment provision appropriate for each individually significant impaired loan or advance on an individual basis. Items considered when determining provision amounts include the sustainability of the counterparty’s business plan, its ability to improve performance once a financial difficulty has arisen, projected receipts and the expected dividend payout should bankruptcy ensue, the availability of other financial support and the realisable value of collateral, and the timing of expected cash flows. The impairment losses are evaluated on a continuous basis.
Allowances are assessed on a portfolio basis for losses on loans and receivables that are not individually significant (including unsecured credit cards, personal loans, overdrafts, unsecured mortgage loans) and where specific identification is impractical. Provisions are calculated for these portfolios based on historical loss experience.
Collectively assessed provisions (collective provisions)Where individual loans are found not to be specifically impaired they are grouped together according to their risk characteristics and are then assessed for impairment. Based on historical loss data and current available information for assets with similar risk characteristics, the appropriate collective provision is raised. The collective provisions are re-assessed at each balance date.
Prudential reserve (general reserve for credit losses)A general reserve for credit losses is maintained to cover risks inherent in the loan portfolios.
Australian Prudential Regulation Authority (APRA) requires that banks maintain a general reserve for credit losses to cover risks inherent in loan portfolios. In certain circumstances the collective provision can be included in this assessment. Movements in the general reserve for credit losses are recognised as an appropriation of retained earnings. The Bank maintained a GRCL at 0.53 percent as at 30 June 2013 (2012:0.53%).
41. Risk Management (continued)

Annual Financial Report Period ending 30 June 2013
141
Liquidity riskLiquidity risk is the risk that the Group will be unable to meet its payment obligations when they fall due under normal and stressed circumstances.
Group Treasury is responsible for implementing liquidity risk management strategies in accordance with approved policies and adherence is monitored by the Asset Liability Management Committee and Board Risk Committee. This includes maintaining prudent levels of liquid reserves and a diverse range of funding options to meet daily, short-term and long-term liquidity requirements.
Liquidity scenarios are calculated under stressed and normal operating conditions to assist in anticipating cash flow needs and providing adequate reserves.
The Group maintains a portfolio of highly marketable and diverse assets that can be easily liquidated in the event of an unforeseen interruption of cash flow. The Group also has committed lines of credit that it can access to meet liquidity needs. The liquidity position is assessed and managed under a variety of scenarios, giving due consideration to stress factors relating to both the market in general and specifically to the Group. The most important of these is to maintain limits on the ratio of net liquid assets to customer liabilities, set to reflect market conditions. Net liquid assets consist of cash, short term
bank deposits and liquid debt securities available for immediate sale, less deposits for banks and other issued securities and borrowings due to mature within the next month.
The liquidity ratio during the financial year was as follows:
2013 2012
% %
30 June 11.91 11.09
Average during the financial year 11.63 12.09
Highest 13.20 13.67
Lowest 10.90 11.04
Analysis of financial liabilities by remaining contractual maturitiesThe table below summarises the maturity profile of the Group’s financial liabilities at 30 June 2013 based on contractual undiscounted cash flows. Cash flows which are subject to notice are treated as if notice were to be given immediately. However, the Group expects that many customers will not request repayment on the earliest date the Group could be required to pay and the table does not reflect the expected cash flows indicated by the Group’s deposit retention history.
Consolidated
At call Not longer than 3 months
3 to 12 months 1 to 5 years Longer than 5 years
Total
2013 $ m $ m $ m $ m $ m $ m
Due to other financial institutions 379.5 - - - - 379.5
Deposits 12,516.6 21,044.2 12,246.8 2,058.4 1.2 47,867.2
Notes payable - 549.6 10.8 1,454.1 4,392.2 6,406.7
Derivatives - 184.7 144.7 373.0 47.2 749.6
Other payables 504.9 - - - - 504.9
Income tax payable 47.1 - - - - 47.1
Convertible preference shares - - 14.7 320.4 - 335.1
Subordinated debt - at amortised cost - 6.0 17.7 117.4 375.2 516.3
13,448.1 21,784.5 12,434.7 4,323.3 4,815.8 56,806.4
2012
Due to other financial institutions 327.2 - - - - 327.2
Deposits 11,699.3 22,539.6 9,788.3 1,083.5 2.0 45,112.7
Notes payable - 581.4 490.5 1,063.2 4,276.3 6,411.4
Derivatives - 171.9 200.4 523.6 59.7 955.6
Other payables 530.0 - - - - 530.0
Income tax payable 86.8 - - - - 86.8
Reset preference shares - - 92.2 - - 92.2
Subordinated debt - at amortised cost - 46.5 41.9 140.2 433.9 662.5
12,643.3 23,339.4 10,613.3 2,810.5 4,771.9 54,178.4
41. Risk Management (continued)

142
Parent
At call Not longer than 3 months
3 to 12 months 1 to 5 years Longer than 5 years
Total
2013 $ m $ m $ m $ m $ m $ m
Due to other financial institutions 371.4 - - - - 371.4
Deposits 12,336.7 19,787.4 10,273.7 2,007.6 0.5 44,405.9
Notes payable - 350.3 - - - 350.3
Derivatives - 98.7 135.9 198.8 47.2 480.6
Other payables 775.7 - - - - 775.7
Loans payable to securitisation trusts - - - - 5,829.9 5,829.9
Income tax payable 47.1 - - - - 47.1
Convertible preference shares - - 14.7 320.4 - 335.1
Subordinated debt - at amortised cost - 5.0 14.8 102.0 316.9 438.7
13,530.9 20,241.4 10,439.1 2,628.8 6,194.5 53,034.7
2012
Due to other financial institutions 315.1 - - - - 315.1
Deposits 11,140.8 20,675.1 7,768.8 974.7 - 40,559.4
Derivatives - 141.4 130.3 166.2 59.5 497.4
Other payables 1,111.0 - - - - 1,111.0
Loans payable to securitisation trusts - - - - 6,294.3 6,294.3
Income tax payable 86.8 - - - - 86.8
Reset preference shares - - 92.2 - - 92.2
Subordinated debt - at amortised cost - 45.0 37.5 117.0 346.2 545.7
12,653.7 20,861.5 8,028.8 1,257.9 6,700.0 49,501.9
41. Risk Management (continued)

Annual Financial Report Period ending 30 June 2013
143
The table below shows the contractual expiry by maturity of the Group’s contingent liabilities and commitments. This table includes commitments which are not exposed to credit risk.
Consolidated
At call Not longer than 12 months
1 to 5 years Longer than 5 years
Total
2013 $ m $ m $ m $ m $ m
Contingent liabilities 232.9 - - - 232.9
Commitments 5,474.3 62.9 149.6 185.6 5,872.4
Total 5,707.2 62.9 149.6 185.6 6,105.3
2012
Contingent liabilities 235.9 - - - 235.9
Commitments 4,611.8 66.2 137.4 199.5 5,014.9
Total 4,847.7 66.2 137.4 199.5 5,250.8
Parent
At call Not longer than 12 months
1 to 5 years Longer than 5 years
Total
2013 $ m $ m $ m $ m $ m
Contingent liabilities 227.8 - - - 227.8
Commitments 5,212.6 62.8 149.6 185.6 5,610.6
Total 5,440.4 62.8 149.6 185.6 5,838.4
2012
Contingent liabilities 223.4 - - - 223.4
Commitments 4,319.1 64.0 131.8 196.4 4,711.3
Total 4,542.5 64.0 131.8 196.4 4,934.7
Market risk (including interest rate and currency risk)Market risk is the risk that the fair value of future cash flows of financial instruments will fluctuate due to changes in market variables such as interest rates, foreign exchange rates, and equity prices.
Interest rate riskInterest rate risk arises from the possibility that changes in interest rates will affect future cash flows or the fair values of financial instruments. The Board has established limits on the interest rate risk volatility of net interest income and market value of equity exposures. Positions are monitored regularly and approved hedging strategies are executed to ensure sensitivities and exposures are maintained within the established limits.
The following table demonstrates the sensitivity to a reasonably possible change in interest rates, with all other variables held constant, on the Group’s income statement and equity.
The sensitivity of the income statement is the effect of assumed changes in interest rates on the net interest for one year, based on the floating rate financial assets and financial liabilities held at 30 June 2013, including the effect of hedging instruments. The sensitivity of equity is calculated by revaluing fixed rate available for sale financial assets (including the effect of any associated hedges), and swaps designated as cash flow hedges, at 30 June 2013 for the effects of the assumed changes in interest rates. The sensitivity of equity is analysed by maturity of the asset or swap. With sensitivity based on the assumption that there are parallel shifts in the yield curve.
Monitoring of adherence to policies, limits and procedures is controlled through the ALMAC and the Board risk committee.
41. Risk Management (continued)

144
Consolidated
+100 basis points 2013
-100 basis points 2013
+100 basis points 2012
-100 basis points 2012
2013 $ m $ m $ m $ m
Net interest income 9.4 (16.4) 33.7 (36.1)
Ineffectiveness in cash flow hedge 0.5 (0.5) 4.4 (4.4)
Income tax effect at 30% (3.0) 5.1 (11.4) 12.2
Effect on profit 6.9 (11.8) 26.7 (28.3)
Effect on profit (per above) 6.9 (11.8) 26.7 (28.3)
Cash flow hedge reserve 135.9 (135.9) 195.1 (195.1)
Income tax effect on reserves at 30% (40.8) 40.8 (58.5) 58.5
Effect on equity 102.0 (106.9) 163.3 (164.9)
Parent
+100 basis points 2013
-100 basis points 2013
+100 basis points 2012
-100 basis points 2012
2013 $ m $ m $ m $ m
Net interest income 2.2 (10.8) 24.3 (29.3)
Ineffectiveness in cash flow hedge 0.5 (0.5) 4.4 (4.4)
Income tax effect at 30% (0.8) 3.4 (8.6) 10.1
Effect on profit 1.9 (7.9) 20.1 (23.6)
Effect on profit (per above) 1.9 (7.9) 20.1 (23.6)
Cash flow hedge reserve 129.5 (129.5) 185.6 (185.6)
Income tax effect on reserves at 30% (38.9) 38.9 (55.7) 55.7
Effect on equity 92.5 (98.5) 150.0 (153.5)
The movements in profit are due to higher/lower interest costs from variable rate debt and cash balances. The movement in equity is also affected by the increase/decrease in the fair value of derivative instruments designated as cash flow hedges, where these derivatives are deemed effective. Controlled entity hedges are no longer held following the transfer of all of the assets and liabilities of Adelaide Bank Limited to the parent entity. This analysis reflects a scenario where no management actions are taken to counter movements in rates.
Foreign currency riskThe Group does not have any significant exposure to foreign currency risk, as all borrowings through the company’s Euro medium term note program (EMTN) and Euro commercial paper program (ECP) are fully hedged. At balance date the principal of foreign currency denominated borrowings under these programs was AUD $266.0 million (2012: AUD $77.3m) with all borrowings fully hedged by cross currency swaps, and foreign exchange swaps. Retail and business banking FX transactions are managed by the Group’s Financial Markets unit, with resulting risk constrained by Board approved spot and forward limits. Adherence to limits is independently monitored by the Treasury Operations unit.
It is the current policy of the Group that it does not trade in derivatives or foreign currencies (i.e. the risk is managed rather than actively sought).
Equity price riskThe Group’s exposure to equity securities at 30 June 2013 is $18.1 million (2012: $124.7 million) with $1.4 million (2012: $109.5 million) of these listed on a recognised stock exchange. The fair value of listed investments is affected by movements in market prices, whilst unlisted investment fair values are determined using other valuation methods.
Equity securities price risk arises from investments in equity securities and is the risk that the fair values of equities decrease as the result of changes in the levels of equity indices and the value of individual stocks. The majority of the value of equity investments held are of a high quality and are publicly traded on either the ASX or BSX.
The Groups’ equity investments represent approximately 0.03 percent of total Group assets and are predominantly long term strategic holdings, therefore short term volatility in fair values is not considered significant and a sensitivity analysis has not been completed.
41. Risk Management (continued)

Annual Financial Report Period ending 30 June 2013
145
Operational riskOperational risk is defined as the risk of impact on objectives resulting from inadequate or failed internal processes, people and systems or from external events, including legal and reputation risk but excluding strategic risk, that are not already covered by other regulatory capital charges (i.e. credit and market risks).
The Board Risk Committee is responsible for the oversight of the operational risk management policies and effectiveness of implementation across the Group.
The Executive Committee and each individual executive member has day to day responsibility and accountability for the management of operational risk in their business/support line including, but not limited to ensuring operational risk management strategies are in place and operating effectively.
Management and staff in each business are responsible for identifying operational risks and determining, implementing, monitoring and reporting on policies and practices to manage operational risks to which their business is exposed.
In managing operational risks, the Group is cognisant of its correlation with strategic, reputation and contagion risk.
The Group considers both the internal and external environment as well emerging risks when monitoring and assessing operational risk.
Inherent in the Group’s industry the following factors can also impact the Group’s operations and outcomes:
> Globalisation & global impacts e.g. market liquidity, investor sentiment
> Economic e.g. changes in economic growth, interest rates
> Changes in government policy and regulation
> Demographic trends
> Technological dependency, advancements and speed to market
> Financial convergence and competitive landscape
Group Operational Risk has a role to assist and support the executive committee and business units to develop, implement, monitor and report on the effectiveness of implementation of the Group’s operational risk management framework. It reports to the Board Risk Committee on the status of the implementation of the framework and implications of significant risks and risk events at the Group level.
Sustainability and climate changeSustainability and climate change risk is defined as the risk to the business and our stakeholders of meeting objectives due to changes in climate and environment.
In recognition of the importance of managing this risk (both downside and opportunity) the Group’s risk and business functions consider the broader environment, social responsibility and resilience in its decision making.
41. Risk Management (continued)
146
42. Financial Instruments
Fair value Disclosed below is the estimated fair value of the Group's financial instruments presented in accordance with the requirements of Accounting Standard AASB 7 "Financial Instruments - Disclosure”.
A financial instrument is defined by AASB 132 as any contract that gives rise to both a financial asset of one entity and a financial liability or equity instrument of another entity. A financial liability is a contractual obligation either to deliver cash or another financial asset to another entity, or, to exchange financial instruments with another entity under conditions that are potentially unfavourable.
MethodologiesThe methodologies and assumptions used depend on the terms and risk characteristics of the various instruments and include the following:
Cash and cash equivalents, due to and from other financial institutionsThe carrying values of certain on-balance sheet financial instruments approximate fair values. These include cash and short-term cash equivalents, due to and from other financial institutions and accrued interest receivable or payable. These instruments are short-term in nature and the related amounts approximate fair value and are receivable or payable on demand.
Derivatives (assets and liabilities)The fair value of exchange-rate and interest-rate contracts, used for hedging purposes, is the estimated amount the Group would receive or pay to terminate the contracts at reporting date. The fair value of these instruments is disclosed under “Derivatives”.
Financial assets – held for trading (Securities)These financial assets include floating rate notes and discounted short term securities. The carrying value of these assets is based on a mark to market value. Therefore the carrying value represents fair value.
Financial assets - available for sale Available for sale financial assets (securities) are predominantly short-term bank accepted bills of exchange and negotiable certificates of deposit and are carried at fair value.
Financial assets - held to maturity (Securities)The fair value of financial assets held to maturity, including bills of exchange, negotiable certificates of deposit, government securities and bank and other deposits, which are predominantly short-term, is measured at amortised book value. Carrying value of these assets approximates fair value.
Financial assets - available for sale (share investments and shares in controlled entities) The fair value of share investments is based on market value for listed share investments and carrying values for unlisted share investments. As the listed share investments are carried at market value, carrying value represents fair value.
Loans and other receivables The carrying value of loans and other receivables is net of specific and collective provisions for doubtful debts.
For variable rate loans, excluding impaired loans, the carrying amount is a reasonable estimate of fair value. The net fair value for fixed loans is calculated by utilising discounted cash flow models (i.e. the net present value of the portfolio future principal and interest cash flows), based on the maturity of the loans. The discount rates applied represent the rate the market is willing to offer for these loans at arms-length.
The net fair value of impaired loans is calculated by discounting expected cash flows using these rates.
Investments accounted for using the equity methodThese investments are carried at the proportional share of equity invested in the joint ventures and associates, including accumulated profit or losses of the joint ventures and associates. The fair value has been determined using a multiple of the latest annual profit after tax. Where the joint venture and associate is not yet profitable the fair value has been assumed to be equal to the carrying value.
Other assets This category includes items such as sundry debtors, which are short-term by nature and the carrying amount is therefore a reasonable estimate of fair value, except for other assets in the Company which includes investments in joint ventures. Refer to Investments accounted for using the equity method methodology above.
Deposits and notes payable
The carrying value of call, variable rate and fixed rate deposits repricing within six months approximates the fair value at balance date. The fair value of other term deposits is calculated using discounted cash flow models, based on the deposit type and its related maturity. The discount rates applied represent the rate the market is willing to offer these loans at arms-length.
Other financial liabilities This category includes items such as sundry creditors which are short-term by nature and the carrying amount is therefore a reasonable estimate of fair value
Convertible preference sharesThe closing share price of the convertible preference shares on 30 June is used to calculate the fair value of these financial liabilities.
Subordinated debt and other debt The fair value of subordinated debt is calculated based on quoted market prices, where applicable. For those debt issues where quoted market prices were not available, a discounted cash flow model using a yield curve appropriate to the remaining maturity of the instrument is used.

Annual Financial Report Period ending 30 June 2013
147
42. Financial Instruments (continued)
SummaryThe following table provides comparison of carrying and net fair values for each item discussed above, where applicable:
Consolidated
Carrying value Net fair value
Financial Assets2013
$ m2012
$ m2013
$ m2012
$ m
Cash and cash equivalents 383.8 288.8 383.8 288.8
Due from other financial institutions 293.9 272.2 293.9 272.2
Derivatives 31.9 48.5 31.9 48.5
Financial assets held for trading 5,465.2 4,366.1 5,465.2 4,366.1
Financial assets available for sale - debt securities 535.5 444.8 535.5 444.8
Financial assets available for sale - equity investments
18.1 124.7 18.1 124.7
Financial assets held to maturity 323.3 388.4 323.3 387.6
Loans and other receivables - investment 554.1 453.0 568.0 451.8
Net loans and other receivables 49,957.4 48,217.0 50,150.4 48,984.2
Investments accounted for using the equity method 15.6 12.9 15.6 12.9
Other assets 615.4 509.7 615.4 509.7
Financial Liabilities
Due to other financial institutions 379.5 327.2 379.5 327.2
Deposits 47,439.0 44,572.7 47,578.7 44,057.9
Notes Payable 6,400.6 6,411.0 6,465.2 6,359.0
Derivatives 98.4 179.0 98.4 179.0
Other payables 688.7 731.8 688.7 731.8
Reset preference shares - 89.5 - 90.8
Convertible preference shares 268.9 - 284.8 -
Subordinated debt 354.3 436.9 355.6 430.7

148
42. Financial Instruments (continued)
Parent
Carrying value Net fair value
Financial Assets2013
$ m2012
$ m2013
$ m2012
$ m
Cash and cash equivalents 258.1 175.8 258.1 175.8
Due from other financial institutions 292.2 266.3 292.2 266.3
Derivatives 182.6 547.3 182.6 547.3
Financial assets held for trading 5,465.8 4,367.0 5,465.8 4,367.0
Financial assets available for sale - debt securities 1,362.9 1,594.6 1,362.9 1,594.6
Financial assets available for sale - equity investments
4.5 4.1 4.5 4.1
Shares in controlled entities 526.5 604.1 526.5 604.1
Financial assets held to maturity 1.8 1.8 1.8 1.8
Loans and other receivables - investment 554.1 453.0 568.0 451.8
Net loans and other receivables 44,691.3 41,366.6 44,841.5 42,027.9
Amounts receivable from controlled entities 544.7 1,090.8 544.7 1,090.8
Investments accounted for using the equity method 13.8 10.7 13.8 10.7
Other assets 1,229.9 837.4 1,229.9 834.9
Financial Liabilities
Due to other financial institutions 371.4 315.1 371.4 315.1
Deposits 44,121.7 40,179.4 44,226.9 39,686.9
Notes Payable 350.3 - 350.3 -
Derivatives 85.7 111.2 85.7 111.2
Other payables 887.9 1,168.0 887.9 1,168.0
Loans payable to securitisation trusts 5,829.9 6,294.1 5,829.9 6,294.1
Reset preference shares - 89.5 - 90.8
Convertible preference shares 268.9 - 284.8 -
Subordinated debt 302.2 361.1 296.9 354.9

Annual Financial Report Period ending 30 June 2013
149
42. Financial Instruments (continued)
Interest rate riskThe Group's exposure to interest rate risks of financial assets and liabilities at the balance date are disclosed in the following table.
Sensitivity to interest rates arises from mismatches in the period to repricing of assets and liabilities. These mismatches are managed as part of the overall asset and liability management process
Consolidated
Fixed interest rate repricing
Floating interest
Less than 3 months
Between 3 months & 6
months
Between 6 months &
12 months
Between 1 year & 5
years
After 5 years
Non interest
earning/bearing
Total carrying
value per Balance
sheet
Weighted average
effective interest
rate
As at 30 June 2013 $ m $ m $ m $ m $ m $ m $ m $ m %
Assets
Cash and cash equivalents 162.3 - - - - - 221.5 383.8 1.16
Due from other financial institutions
- - - - - - 293.9 293.9 -
Financial assets held for trading - 3,146.9 2,294.2 24.1 - - - 5,465.2 2.94
Financial assets available for sale
- 520.5 14.9 0.1 - - - 535.5 3.66
Financial assets held to maturity - 318.3 5.0 - - - - 323.3 3.18
Loans and other receivables 35,097.6 6,184.9 1,064.6 2,406.4 5,659.4 95.4 3.2 50,511.5 6.13
Derivatives - - - - - - 31.9 31.9 -
Total financial assets 35,259.9 10,170.6 3,378.7 2,430.6 5,659.4 95.4 550.5 57,545.1
Liabilities
Due to other financial institutions
- - - - - - 379.5 379.5 -
Deposits 12,566.5 22,702.0 8,111.4 2,923.0 1,135.6 0.5 - 47,439.0 3.45
Notes payable 49.0 6,221.6 130.0 - - - - 6,400.6 4.01
Derivatives - - - - - - 98.4 98.4 -
Convertible preference shares - - 268.9 - - - - 268.9 7.80
Subordinated debt - 342.3 - - 12.0 - - 354.3 6.67
Total financial liabilities 12,615.5 29,265.9 8,510.3 2,923.0 1,147.6 0.5 477.9 54,940.7

150
42. Financial Instruments (continued)
Interest rate risk (continued)
Consolidated
Fixed interest rate repricing
Floating interest
Less than 3 months
Between 3 months & 6
months
Between 6 months &
12 months
Between 1 year & 5
years
After 5 years
Non interest
earning/bearing
Total carrying
value per Balance
sheet
Weighted average
effective interest
rate
As at 30 June 2012 $ m $ m $ m $ m $ m $ m $ m $ m %
Assets
Cash and cash equivalents 122.7 - - - - - 166.1 288.8 1.38
Due from other financial institutions
- - - - - - 272.2 272.2 -
Financial assets held for trading - 2,072.0 2,244.4 49.7 - - - 4,366.1 4.07
Financial assets available for sale
- 444.7 - - 0.1 - - 444.8 4.50
Financial assets held to maturity - 350.0 38.2 0.2 - - - 388.4 3.83
Loans and other receivables 34,482.0 5,297.0 1,125.9 2,682.9 4,927.9 184.8 (30.5) 48,670.0 6.94
Derivatives - - - - - - 48.5 48.5 -
Total financial assets 34,604.7 8,163.7 3,408.5 2,732.8 4,928.0 184.8 456.3 54,478.8
Liabilities
Due to other financial institutions
- - - - - - 327.2 327.2 -
Deposits 11,506.7 22,854.0 6,917.9 2,137.1 1,156.3 0.7 - 44,572.7 4.38
Notes payable 74.1 6,056.9 150.0 - 130.0 - - 6,411.0 4.86
Derivatives - - - - - - 179.0 179.0 -
Reset preference shares - - 89.5 - - - - 89.5 6.16
Subordinated debt - 424.9 - - 12.0 - - 436.9 7.10
Total financial liabilities 11,580.8 29,335.8 7,157.4 2,137.1 1,298.3 0.7 506.2 52,016.3
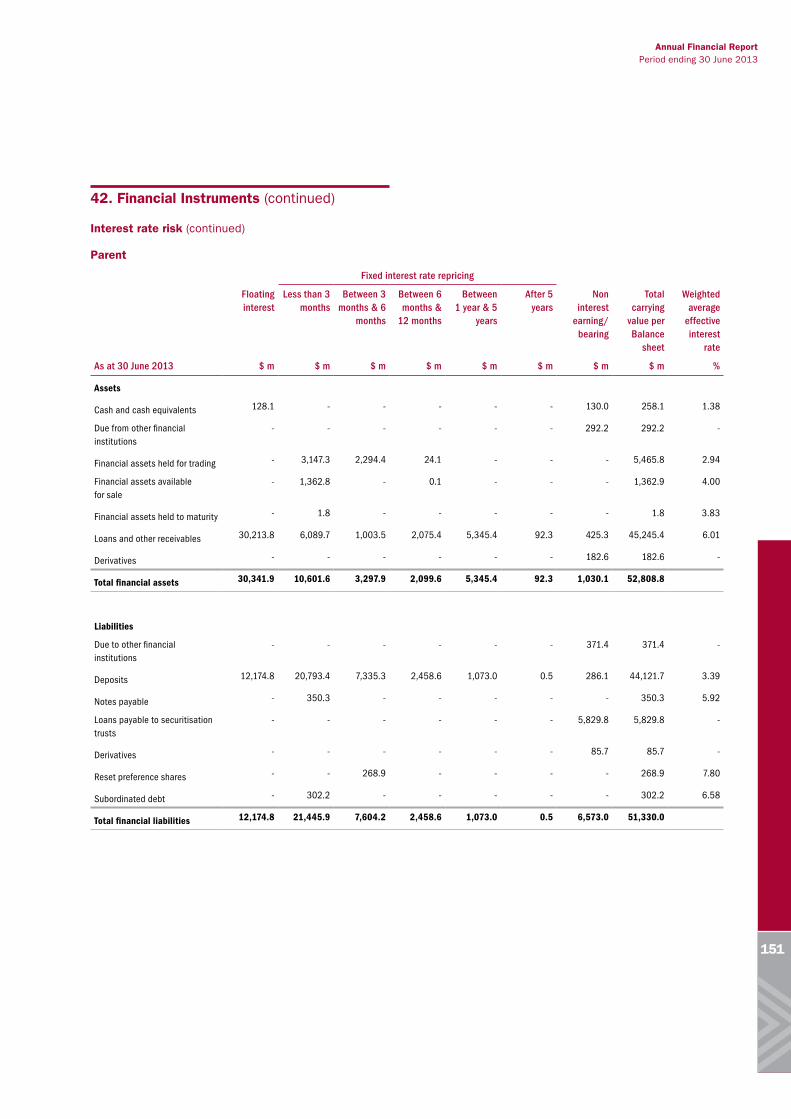
Annual Financial Report Period ending 30 June 2013
151
42. Financial Instruments (continued)
Interest rate risk (continued)
Parent
Fixed interest rate repricing
Floating interest
Less than 3 months
Between 3 months & 6
months
Between 6 months &
12 months
Between 1 year & 5
years
After 5 years
Non interest
earning/bearing
Total carrying
value per Balance
sheet
Weighted average
effective interest
rate
As at 30 June 2013 $ m $ m $ m $ m $ m $ m $ m $ m %
Assets
Cash and cash equivalents 128.1 - - - - - 130.0 258.1 1.38
Due from other financial institutions
- - - - - - 292.2 292.2 -
Financial assets held for trading - 3,147.3 2,294.4 24.1 - - - 5,465.8 2.94
Financial assets available for sale
- 1,362.8 - 0.1 - - - 1,362.9 4.00
Financial assets held to maturity - 1.8 - - - - - 1.8 3.83
Loans and other receivables 30,213.8 6,089.7 1,003.5 2,075.4 5,345.4 92.3 425.3 45,245.4 6.01
Derivatives - - - - - - 182.6 182.6 -
Total financial assets 30,341.9 10,601.6 3,297.9 2,099.6 5,345.4 92.3 1,030.1 52,808.8
Liabilities
Due to other financial institutions
- - - - - - 371.4 371.4 -
Deposits 12,174.8 20,793.4 7,335.3 2,458.6 1,073.0 0.5 286.1 44,121.7 3.39
Notes payable - 350.3 - - - - - 350.3 5.92
Loans payable to securitisation trusts
- - - - - - 5,829.8 5,829.8 -
Derivatives - - - - - - 85.7 85.7 -
Reset preference shares - - 268.9 - - - - 268.9 7.80
Subordinated debt - 302.2 - - - - - 302.2 6.58
Total financial liabilities 12,174.8 21,445.9 7,604.2 2,458.6 1,073.0 0.5 6,573.0 51,330.0

152
42. Financial Instruments (continued)
Interest rate risk (continued)
Parent
Fixed interest rate repricing
Floating interest
Less than 3 months
Between 3 months & 6
months
Between 6 months &
12 months
Between 1 year & 5
years
After 5 years
Non interest
earning/bearing
Total carrying
value per Balance
sheet
Weighted average
effective interest
rate
As at 30 June 2012 $ m $ m $ m $ m $ m $ m $ m $ m %
Assets
Cash and cash equivalents 63.5 - - - - - 112.3 175.8 1.24
Due from other financial institutions
- - - - - - 266.3 266.3 -
Financial assets held to maturity - 1.8 - - - - - 1.8 4.43
Financial assets held for trading - 2,072.5 2,244.8 49.7 - - - 4,367.0 4.07
Financial assets available for sale
- 1,594.5 - - 0.1 - - 1,594.6 4.67
Loans and other receivables 28,632.9 5,083.6 1,017.4 2,003.8 4,572.7 179.2 330.0 41,819.6 6.79
Derivatives - - - - - - 547.3 547.4 -
Total financial assets 28,696.4 8,752.4 3,262.2 2,053.5 4,572.8 179.2 1,255.9 48,772.4
Liabilities
Due to other financial institutions
- - - - - - 315.1 315.1 -
Deposits 10,910.1 20,646.1 5,835.4 1,708.2 1,029.6 - 50.0 40,179.4 4.29
Notes payable - - - - - - - - -
Loans payable to securitisation trusts
- - - - - - 6,294.1 6,294.1 -
Derivatives - - - - - - 111.2 111.2 -
Reset preference shares - - 89.5 - - - - 89.5 6.16
Subordinated debt - 361.1 - - - - - 361.1 6.98
Total financial liabilities 10,910.1 21,007.1 5,925.0 1,708.2 1,029.6 - 6,770.4 47,350.4
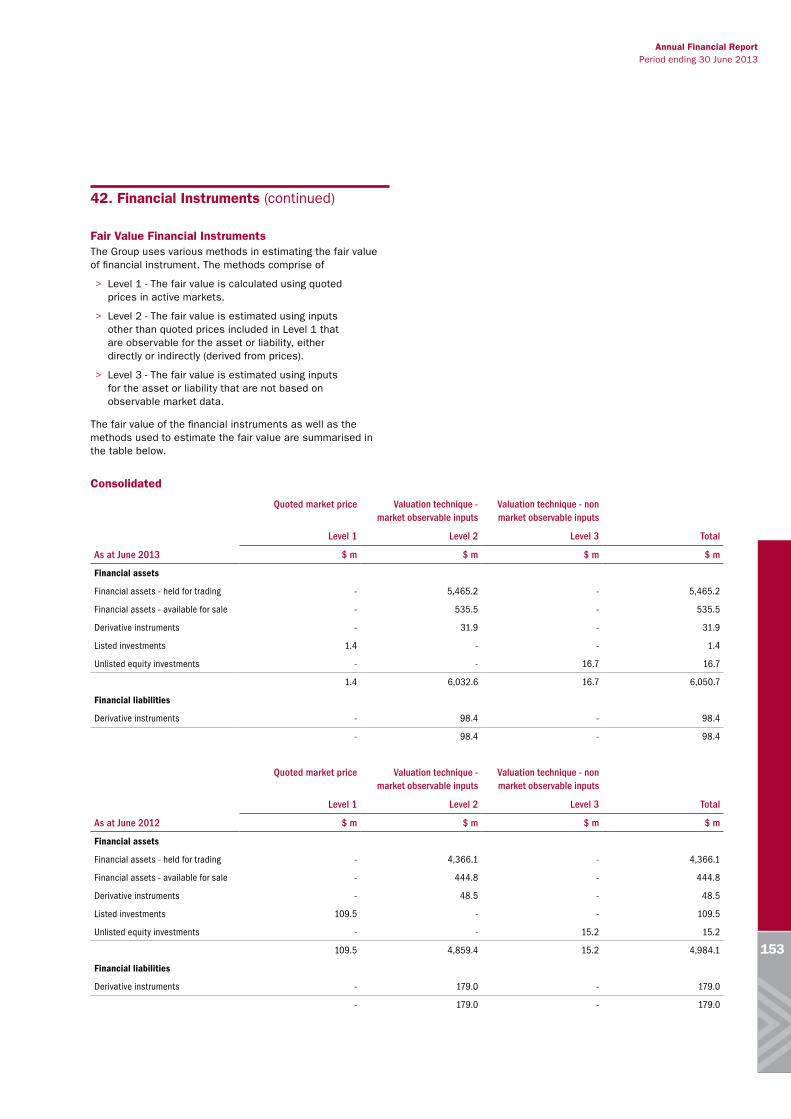
Annual Financial Report Period ending 30 June 2013
153
42. Financial Instruments (continued)
Fair Value Financial InstrumentsThe Group uses various methods in estimating the fair value of financial instrument. The methods comprise of
> Level 1 - The fair value is calculated using quoted prices in active markets.
> Level 2 - The fair value is estimated using inputs other than quoted prices included in Level 1 that are observable for the asset or liability, either directly or indirectly (derived from prices).
> Level 3 - The fair value is estimated using inputs for the asset or liability that are not based on observable market data.
The fair value of the financial instruments as well as the methods used to estimate the fair value are summarised in the table below.
Consolidated
Quoted market price Valuation technique - market observable inputs
Valuation technique - non market observable inputs
Level 1 Level 2 Level 3 Total
As at June 2013 $ m $ m $ m $ m
Financial assets
Financial assets - held for trading - 5,465.2 - 5,465.2
Financial assets - available for sale - 535.5 - 535.5
Derivative instruments - 31.9 - 31.9
Listed investments 1.4 - - 1.4
Unlisted equity investments - - 16.7 16.7
1.4 6,032.6 16.7 6,050.7
Financial liabilities
Derivative instruments - 98.4 - 98.4
- 98.4 - 98.4
Quoted market price Valuation technique - market observable inputs
Valuation technique - non market observable inputs
Level 1 Level 2 Level 3 Total
As at June 2012 $ m $ m $ m $ m
Financial assets
Financial assets - held for trading - 4,366.1 - 4,366.1
Financial assets - available for sale - 444.8 - 444.8
Derivative instruments - 48.5 - 48.5
Listed investments 109.5 - - 109.5
Unlisted equity investments - - 15.2 15.2
109.5 4,859.4 15.2 4,984.1
Financial liabilities
Derivative instruments - 179.0 - 179.0
- 179.0 - 179.0

154
42. Financial Instruments (continued)
Parent
Quoted market price Valuation technique - market observable inputs
Valuation technique - non market observable inputs
Level 1 Level 2 Level 3 Total
As at June 2013 $ m $ m $ m $ m
Financial assets
Financial assets - held for trading - 5,465.8 - 5,465.8
Financial assets - available for sale - 426.0 - 426.0
Derivative instruments - 182.6 - 182.6
Listed equity investments 1.4 - - 1.4
Unlisted equity investments - - 3.1 3.1
1.4 6,074.4 3.1 6,078.9
Financial liabilities
Derivative instruments - 85.7 - 85.7
- 85.7 - 85.7
Quoted market price Valuation technique - market observable inputs
Valuation technique - non market observable inputs
Level 1 Level 2 Level 3 Total
As at June 2012 $ m $ m $ m $ m
Financial assets
Financial assets - held for trading - 4,367.0 - 4,367.0
Financial assets - available for sale - 352.1 - 352.1
Derivative instruments - 547.3 - 547.3
Listed equity investments 1.4 - - 1.4
Unlisted equity investments - - 2.7 2.7
1.4 5,266.4 2.7 5,270.5
Financial liabilities
Derivative instruments - 111.2 - 111.2
- 111.2 - 111.2
The Fair Value of Held for Trading and Available for Sale financial assets process is as follows.
Each month market security investment valuations are determined by the Middle Office department of the Group’s Finance and Treasury Division. This involves an analysis of market rate sheets provided by institutions independent of Bendigo and Adelaide Bank. From these independent rate sheets, market average valuations are calculated within the Group’s Treasury Management System, thereby updating the value of investments. Depending on the valuation movement, the company will report a profit or loss for the period.
Listed Investments relates to equity held that are on listed exchanges. Unlisted Equity Investments relates to equity holdings in entities that are traded in an illiquid market or are thinly traded.

Annual Financial Report Period ending 30 June 2013
155
42. Financial Instruments (continued)
Reconciliation of level 3 fair value movements
Consolidated
As at 30 June 2012
Gains/losses in equity
Purchases Sales As at 30 June 2013
As at June 2013 $ m $ m $ m $ m $ m
Fair value assets
Unlisted equity investments 15.2 1.1 0.5 (0.1) 16.7
Total fair value assets 15.2 1.1 0.5 (0.1) 16.7
As at 30 June 2011
Gains/losses in equity
Purchases Sales As at 30 June 2012
As at June 2012 $ m $ m $ m $ m $ m
Fair value assets
Unlisted equity investments 3.7 0.2 11.3 - 15.2
Total fair value assets 3.7 0.2 11.3 - 15.2
Parent
As at 30 June 2012 Gains/losses in equity
Purchases Sales As at 30 June 2013
As at June 2013 $ m $ m $ m $ m $ m
Fair value assets
Unlisted equity investments 2.7 - 0.5 (0.1) 3.1
Total fair value assets 2.7 - 0.5 (0.1) 3.1
As at 30 June 2011
Gains/losses in equity
Purchases Sales As at 30 June 2012
As at June 2012 $ m $ m $ m $ m $ m
Fair value assets
Unlisted equity investments 2.2 (0.2) 0.7 - 2.7
Total fair value assets 2.2 (0.2) 0.7 - 2.7
There were no transfers between level 1 and level 2 during the year.

156
43. Derivative Financial InstrumentsThe Group uses derivatives primarily to hedge banking operations and for asset and liability management. Some derivatives transactions may qualify as either cash flow or fair value hedges. The accounting treatment of these hedges is outlined in Note 2.32 Derivative Financial Instruments.
The Group is exposed to volatility in interest cash flows inherent in its loan portfolio and that of the securitisation vehicles. Interest rate swaps are used to hedge the risk that this volatility creates.
During the 2013 financial year the consolidated entity recognised a loss of $1.8 million (2012: a loss of $12.6 million) due to hedge ineffectiveness.
Consolidated 2013 Consolidated 2012
Notional Amount
Asset Revaluation
Liability Revaluation
Net Fair Value
Notional Amount
Asset Revaluation
Liability Revaluation
Net Fair Value
Value of derivatives as at 30 June $ m $ m $ m $ m $ m $ m $ m $ m
Included in derivatives category
Derivatives held for trading
Futures 500.0 0.4 - 0.4 - - - -
Forward Rate Agreements - - - - 1,200.0 - (1.6) (1.6)
Interest Rate Swaps 1,300.0 16.0 (15.9) 0.1 2,708.8 21.2 (24.9) (3.7)
Foreign Exchange
Contracts 95.3 0.6 (0.6) - 73.1 0.5 (0.7) (0.2)
Derivatives 1,895.3 17.0 (16.5) 0.5 3,981.9 21.7 (27.2) (5.5)
Derivatives held as fair value hedges
Interest Rate Swaps 57.1 - (3.6) (3.6) 59.2 - (4.4) (4.4)
Embedded Derivatives 0.4 - - - 1.0 0.2 (0.2) -
Derivatives 57.5 - (3.6) (3.6) 60.2 0.2 (4.6) (4.4)
Derivatives held as cash flow hedges
Cross Currency
Swaps 241.7 1.1 (22.8) (21.7) 386.9 11.3 (58.4) (47.1)
Interest Rate Swaps 14,393.8 13.8 (55.5) (41.7) 19,128.9 15.3 (88.8) (73.5)
Derivatives 14,635.5 14.9 (78.3) (63.4) 19,515.8 26.6 (147.2) (120.6)
Total derivatives 16,588.3 31.9 (98.4) (66.5) 23,557.9 48.5 (179.0) (130.5)

Annual Financial Report Period ending 30 June 2013
157
Parent 2013 Parent 2012
Notional Amount
Asset Revaluation
Liability Revaluation
Net Fair Value
Notional Amount
Asset Revaluation
Liability Revaluation
Net Fair Value
Value of derivatives as at 30 June $ m $ m $ m $ m $ m $ m $ m $ m
Included in derivatives category
Derivatives held for trading
Futures 500.0 0.4 - 0.4 - - - -
Forward Rate Agreements - - - - 1,200.0 - (1.6) (1.6)
Interest Rate Swaps 10,124.6 170.0 (31.5) 138.5 14,508.8 537.1 (24.9) 512.2
Foreign Exchange
Contracts 95.3 0.6 (0.6) - 73.1 0.5 (0.7) (0.2)
Derivatives 10,719.9 171.0 (32.1) 138.9 15,781.9 537.6 (27.2) 510.4
Derivatives held as fair value hedges
Interest Rate Swaps 57.1 - (3.6) (3.6) 59.2 - (4.4) (4.4)
Derivatives 57.1 - (3.6) (3.6) 59.2 - (4.4) (4.4)
Derivatives held as cash flow hedges
Interest Rate Swaps 13,996.0 11.6 (50.0) (38.4) 18,520.6 9.7 (79.6) (69.9)
Derivatives 13,996.0 11.6 (50.0) (38.4) 18,520.6 9.7 (79.6) (69.9)
Total derivatives 24,773.0 182.6 (85.7) 96.9 34,361.7 547.3 (111.2) 436.1
43. Derivative Financial Instruments (continued)

158
As at 30 June hedged cash flows are expected to occur and affect the income statement as follows:
Consolidated
2013Within 1 year
$ m1 to 3 years
$ m3 to 8 years
$ mOver 8 years
$ m
Cash inflows (Assets) 323.0 326.2 41.8 28.6
Cash outflows (Liabilities) (329.4) (340.7) (50.8) (28.7)
Net cash inflow (6.4) (14.5) (9.0) (0.1)
Income statement (18.5) (29.8) (6.1) (0.1)
2012
Cash inflows (Assets) 351.2 247.7 187.8 36.1
Cash outflows (Liabilities) (372.4) (337.8) (209.1) (36.4)
Net cash inflow (21.2) (90.1) (21.3) (0.3)
Income statement (51.1) (47.8) (9.0) (0.1)
Parent
2013Within 1 year
$ m1 to 3 years
$ m3 to 8 years
$ mOver 8 years
$ m
Cash inflows (Assets) 231.6 124.5 41.4 28.6
Cash outflows (Liabilities) (234.7) (167.6) (49.7) (28.7)
Net cash inflow (3.1) (43.1) (8.3) (0.1)
Income statement (15.4) (19.1) (4.4) (0.1)
2012
Cash inflows (Assets) 254.4 56.3 39.7 36.1
Cash outflows (Liabilities) (271.7) (130.8) (58.5) (36.4)
Net cash inflow (17.3) (74.5) (18.8) (0.3)
Income statement (38.4) (29.5) (6.5) (0.1)
Net gain on cash flow hedges reclassified to the income statement:
Consolidated Parent
2013 $ m
2012 $ m
2013 $ m
2012 $ m
Interest income 4.8 5.6 - 2.9
Interest expense (7.3) (18.0) (7.3) (16.1)
Other operating expenses 0.7 (0.6) 0.7 (0.6)
(1.8) (13.0) (6.6) (13.8)
Taxation 0.5 3.9 2.0 4.1
Net gain on cash flow hedges reclassified to the income statement
(1.3) (9.1) (4.6) (9.7)
During 2013 the Group recognised a $0.1 million gain on fair value hedges (2012: $0.8 million gain), due to hedge ineffectiveness. For hedges that are marked to market and not in a hedge relationship, a gain of $0.5 million (2012: loss of $1.2 million) has been recognised.
43. Derivative Financial Instruments (continued)

Annual Financial Report Period ending 30 June 2013
159
44. Commitments and Contingencies
(a) Commitments The following are outstanding expenditure and credit related commitments as at 30 June 2013. Except where specified, all commitments are payable within one year.
Operating lease commitments - Group as lessee The Group has entered into commercial property leases and commercial leases on certain motor vehicles and items of office equipment.
These leases have an average life of between three and seven years. Some property leases include optional renewal periods included in the contracts. There are no restrictions placed upon the lessee by entering into these leases. The head office development has a lease term of 17 years remaining.
Consolidated Parent
2013 $ m
2012 $ m
2013 $ m
2012 $ m
Future minimum rentals payable under non-cancellable operating leases as at 30 June
Not later than 1 year 58.3 62.1 58.2 60.0
Later than 1 year but not later than 5 years
149.6 137.4 149.6 131.8
Later than 5 years 185.6 199.5 185.6 196.4
393.5 399.0 393.4 388.2
Operating lease commitments - group as lessorThe Group has entered into commercial property leases on the Group's surplus office space. These non-cancellable leases have remaining terms of between two and five years. All leases have a clause to enable upward revision of the rental charge on a regular basis according to prevailing market conditions.
Future minimum rentals payable under non-cancellable operating leases as at 30 June
Not later than 1 year 1.2 1.6 1.2 1.6
Later than 1 year but not later than 5 years
1.3 2.3 1.3 2.3
2.5 3.9 2.5 3.9
Consolidated Parent
2013 2012 2013 2012
Other expenditure commitments $ m $ m $ m $ m
Sponsorship commitments not paid as at balance date, payable not later than one year
4.6 4.1 4.6 4.0
Credit related commitments
Gross loans approved, but not advanced to borrowers
1,219.1 869.3 1,201.2 817.2
Credit limits granted to clients for overdrafts and credit cards
Total amount of facilities provided
10,871.2 10,700.8 9,887.4 9,613.5
Amount undrawn at balance date
4,255.2 3,742.5 4,011.4 3,501.9
Normal commercial restrictions apply as to use and withdrawal of the facilities.
(b) Superannuation CommitmentsThe Bendigo and Adelaide Bank Group has a legally enforceable obligation to contribute to a superannuation plan for employees either on an accumulation basis (including the Superannuation Guarantee Charge) or on a defined benefits basis (Adelaide Bank staff superannuation plan) which provides benefits on retirement, disability or death based on years of service and final average salary. Employees contribute to the plan at a fixed percentage of remuneration.
The Group’s contribution to the defined benefit plan is determined by the Trustee after consideration of actuarial advice. At balance date, the Directors believe that funds available were adequate to satisfy all vested benefits under the Plan.
Accounting PolicyActuarial gains and losses are recognised in retained earnings.
Plan InformationDefined benefit members receive lump sum benefits on retirement, death, disablement and withdrawal. The defined benefit section of the Plan is closed to new members. All new members are entitled to become members of the accumulation categories of the fund.
Fair Value of Plan AssetsThe fair value of Plan assets includes Bendigo and Adelaide Bank shares to the value of $1.4 million as at 30 June 2013.

160
Actual ReturnConsolidated 2013
$ mConsolidated 2012
$ m
Actual return on Plan assets 1.8 (0.1)
Principal Actuarial Assumptions
Discount rate 3.2% pa 2.6% pa
Expected salary increase rate 3.0% pa 3.5% pa
Expected rate of return on Plan assets - ^ pa 7.0% pa
^ Not required due to change in standard
Reconciliation of the Present Value of the Defined Benefit Obligation $ m $ m
Present value of defined benefit obligations at beginning of period 8.0 7.0
Add Current service cost 0.3 0.3
Add Interest cost 0.2 0.3
Add contributions by plan participants 0.1 0.1
Add Actuarial gains/(losses) (1.1) 0.9
Less Benefits paid 0.3 0.6
Less Taxes, premiums and expenses paid 0.1 -
Add Transfers in - -
Less Contributions to accumulation section - -
Present value of defined benefit obligations at end of the year 7.1 8.0
Reconciliation of the Fair Value of Plan Assets
Fair value of Plan assets at beginning of period 8.9 9.4
Add Expected return on plan assets 0.6 0.7
Add Actuarial gains/(losses) 1.2 (0.8)
Add Employer contributions 0.2 0.1
Add Contributions by plan participants 0.1 0.1
Less Benefits paid 0.3 0.6
Less Taxes, premiums and expenses paid 0.1 -
Add Transfers in - -
Less Contributions to accumulation section - -
Fair value of Plan assets at end of the year 10.6 8.9
44. Commitments and Contingencies (continued)

Annual Financial Report Period ending 30 June 2013
161
Reconciliation of the Assets and Liabilities Recognised in the Balance SheetConsolidated 2013
$ mConsolidated 2012
$ m
Defined Benefit Obligation ^ 7.1 8.0
Less Fair value of Plan assets 10.6 8.9
(Surplus) (3.5) (0.9)
Net superannuation (asset) / liability (3.5) (0.9)
^ includes contributions tax provision
Movements in Liability / (Asset) Recognised in the Balance Sheet
Net superannuation (asset) at beginning of period (0.9) (2.4)
Add Amount recognised in other comprehensive income (2.3) 1.8
Add Expense/(income) recognised in the P&L (0.1) (0.1)
Less Employer contributions 0.2 0.2
Net superannuation (asset) at 30 June (3.5) (0.9)
Expense Recognised in Income Statement
Service cost 0.3 0.3
Interest cost 0.2 0.3
Expected return on assets (0.6) (0.7)
Superannuation expense (0.1) (0.1)
Amount recognised directly in Other Comprehensive Income
Actuarial (gain) / loss (2.3) 1.8
Cumulative amount recognised directly in Other Comprehensive Income
Actuarial (gain) / loss 4.3 6.6
Plan AssetsThe percentage invested in each asset class at the balance sheet date:
Consolidated 2013 $ m
Consolidated 2012 $ m
Australian Equity 34% 37%
International Equity 29% 24%
Fixed Income 16% 15%
Property 10% 14%
Alternatives 5% 4%
Cash 6% 6%
44. Commitments and Contingencies (continued)

162
44. Commitments and Contingencies (continued)
Contribution RecommendationsThe financial position of the defined benefits is reviewed regularly by the Bank, at least annually, to ensure that the contribution amount remains appropriate.
Funding MethodThe method used to determine the employer contribution recommendations is the Attained Age Normal method. The method adopted affects the timing of the cost to the Bank.
Under the Attained Age Normal method, a “normal cost” is calculated which is the estimated employer contribution rate required to provide benefits in respect of future service after the review date. The “normal” cost is then adjusted to take into account any surplus (or deficiency) of assets over the value of liabilities in respect of service prior to the review date. Any surplus or deficiency can be used to reduce or increase the “normal” employer contribution rate over a suitable period of time.
Economic AssumptionsThe long-term economic assumptions adopted are:
Expected salary increase rate 3.0% pa
Nature of AssetBendigo and Adelaide Bank has recognised an asset in the Balance Sheet (under other assets) in respect of its defined benefit superannuation arrangements. If a surplus exists in the Plan, Bendigo and Adelaide Bank may be able to take advantage of it in the form of a reduction in the required contribution rate, depending on the advice of the Plan’s actuary.
The Bendigo and Adelaide Bank Staff Superannuation Plan, a sub-plan of the Spectrum Super, does not impose a legal liability on Bendigo and Adelaide Bank to cover any deficit that exists in the Plan. If the Plan were wound up, there would be no legal obligation on the Bank to make good any shortfall. The rules of the Plan state that if the Plan winds up, the remaining assets are to be distributed amongst the Members as determined by the Trustee of the Plan.
The Bank may at any time terminate its contributions by giving one month’s notice in writing to the Trustee.
Historical Information
2013 $ m
2012 $ m
Present value of defined benefit obligation 7.1 8.0
Fair value of Plan assets 10.6 8.9
(Surplus) / deficit in Plan (3.5) (0.9)
Experience adjustments (gain)/loss - Plan assets (1.2) 0.8
Experience adjustments (gain)/loss - Plan liabilities (0.3) (0.2)
Expected Contributions
Financial year ending
2014 $ m
Expected employer contributions 0.2
(c) Legal claimFrom time to time, Bendigo and Adelaide Bank may be subject to material litigation, regulatory actions, legal or arbitration proceedings and other contingent liabilities which, if they crystallise, may adversely affect the financial position or financial performance of the Bank.
A specific litigation risk exists in relation to the Bank’s Great Southern loan portfolio. A law firm commenced a number of group legal proceedings involving the Bank and other parties on behalf of investors in relation to managed investment schemes managed by Great Southern Managers Australia Ltd (Group Proceedings). The Great Southern Group of companies is now in liquidation.
The Bank either acquired or advanced loans to investors in the managed investment schemes. Not all borrowers are members of the Group Proceedings as the Group Proceedings relate to specific schemes and categories of borrowers.
While no wrongdoing is alleged against the Bank and the Bank is vigorously defending the Group Proceedings, the law firm is seeking to have the loan deeds of those borrowers who are members of the Group Proceedings deemed void or unenforceable and for all money paid under those loans (including principal, any interest and fees) to be repaid to borrowers. The litigation will continue to be assessed and managed on an ongoing basis.
Bendigo and Adelaide Bank has raised provisions and in some cases made write-offs in relation to the Great Southern loan portfolio, having regard to the performance of the portfolio and other relevant factors. However the provisions and write-offs are small in the context of the potential loss should the
proceedings succeed.
(d) Contingent liabilities and contingent assets
Consolidated Parent
2013 $ m
2012 $ m
2013 $ m
2012 $ m
Contingent liabilities
Guarantees
The economic entity has issued guarantees on behalf of clients
217.0 221.2 212.0 208.8
Other
Documentary letters of credit & performance related obligations
15.9 14.7 15.8 14.6
As the probability and value of guarantees, letters of credit and performance related obligations that may be called on is unpredictable, it is not practical to state the timing of any potential payment.
Contingent assets As at 30 June 2013, the economic entity does not have any contingent assets.

Annual Financial Report Period ending 30 June 2013
163
45. Standby Arrangements and Uncommitted Credit Facilities
Consolidated Parent
2013 $ m
2012 $ m
2013 $ m
2012 $ m
Amount available:
Offshore borrowing facility 8,755.0 7,814.0 8,755.0 7,814.0
Domestic note program 5,750.0 5,750.0 5,000.0 5,000.0
Amount utilised:
Offshore borrowing facility 266.0 77.3 266.0 77.3
Domestic note program 1,731.0 566.9 1,678.0 490.5
Amount not utilised:
Offshore borrowing facility 8,489.0 7,736.7 8,489.0 7,736.7
Domestic note program 4,019.0 5,183.1 3,322.0 4,509.5
The Parent has a $US 5,000 million Euro Commercial Paper program of which $US 243 million (2012: $US 79.1 million) was drawn down as at 30 June 2013, and a $US 3,000 million Euro Medium Term Note program of which there were no draw downs (2012: EURO nil). As at 30 June 2013 the Parent has a $5,000 million Domestic Note program of which $ 1,678 million (2012: $490.5 million) was issued and the consolidated group has an additional $750.0 million Domestic Note program through its subsidiary Rural Bank Limited, of which $53 million (2012: $76.4 million) was issued.
46. Fiduciary ActivitiesThe Group conducts investment management and other fiduciary activities as trustee, custodian or manager for a number of funds and trusts, including superannuation, unit trusts and mortgage pools. The amounts of the funds concerned, which are not included in the Group's statement of financial position is as follows:
Consolidated
2013 $ m
2012 $ m
Funds under trusteeship 3,491.1 2,733.0
Assets under management 1,665.3 1,789.2
Funds under management 1,609.9 1,300.7
As an obligation arises under each type of duty the amount of funds has been included where that duty arises. This may lead to the same funds being shown more than once where the Group acts in more than one capacity in relation to those funds e.g. manager and trustee. Where controlled entities, as trustees, custodian or manager incur liabilities in the normal course of their duties, a right of indemnity exists against the assets of the applicable trusts. As these assets are sufficient to cover liabilities, and it is therefore not probable that the Group companies will be required to settle them, the liabilities are not included in the financial statements. Bendigo and Adelaide Bank does not guarantee the performance or obligations of its subsidiaries.
47. Securitisation and Transferred Assets
Transfer of financial assetsIn the normal course of business the Group enters into transactions by which it transfers financial assets to counterparties or directly to Special Purpose Entities (SPEs). These transfers do not give rise to de-recognition of those financial assets for the Group.
Repurchase agreementsSecurities sold under agreement to repurchase are retained on the balance sheet when substantially all the risks and rewards of ownership remain with the Group, and the counterparty liability is included separately on the balance sheet when cash consideration is received.
Securitisation programsThe Group through its loan securitisation program, securities mortgage loans to the Torrens Trust and Lighthouse Trusts (the trusts) which in turn issue rated securities to the investors.
The Bank holds income and capital units in the trust at nominal values, which entitles the bank to receive excess income, if any, generated by securitised assets, while the capital units receive upon termination of the trusts any residual capital value. Investors in the trusts have no recourse against the Group if cash flows from the securitised loans are inadequate to service the obligations of the trusts.
Repurchase Agreements Securitisation
Consolidated2013
$ m2012
$ m2013
$ m2012
$ m
Carrying amount of transferred assets 1
350.3 - 5,806.4 6,271.7
Carrying amount of associated liabilities 2
350.3 - 6,015.0 6,338.4
Fair value of transferred assets
5,829.0 6,310.1
Fair value of associated liabilities
6,079.6 6,286.4
Net Position (250.6) 23.7
Repurchase Agreements Securitisation
Parent2013
$ m2012
$ m2013
$ m2012
$ m
Carrying amount of transferred assets
350.3 - 11,379.7 11,528.5
Carrying amount of associated liabilities 3
350.3 - 11,862.1 11,858.3
Fair value of transferred assets
11,418.6 11,599.1
Fair value of associated liabilities
11,926.7 11,806.3
Net Position (508.1) (207.2)
1 Represents the carrying value of the loans transferred to the trust.
2 Securitisation liabilities of the Group include RMBS notes issued by the SPE's and held by external parties.
3 Securitisation liabilities of the Bank include borrowings from SPE's including the SPE's that issue internally held notes for repurchase with central banks, recognised on transfer of residential mortgages by the Bank.

164
48. Business CombinationsBelow are the material business combinations for the year ended 30 June 2013.
Southern FinanceOn 21 December 2012 Bendigo and Adelaide Bank Group acquired the loan, leases and other assets of Southern Finance Ltd. The Group also acquired the business activities and personnel of Southern Financial Planning. The Group did not acquire any of Southern Finance’s legal entities. The consideration for the acquisition of assets was the Group’s assumption of Southern Finance’s outstanding deposits and payment of employee entitlements to Southern Finance employees. Bendigo and Adelaide Bank will repay monies to Southern depositors as their deposits fall due. Upon maturity amounts outstanding to Southern depositors may also be converted into Bendigo and Adelaide Bank deposits.
Southern Finance Ltd is a finance company based in Warrnambool with offices in Victoria and South Australia. Its business operations include the provision of loan and lease finance, the raising of deposits and the provision of financial planning services.
The following table shows the effect on the Group's assets:
Pre-acquisition carrying amount
Recognised values on acquisition
Assets $ m $ m
Cash and cash equivalents 31.2 31.2
Loans 219.5 216.3
Leases 23.4 23.3
Investment properties 13.2 12.5
Motor vehicles and office equipment
0.4 0.4
Intangibles - client list 1.3 1.3
Total Assets 289.0 285.0
Net identifiable assets attributable to Bendigo and Adelaide Bank Limited
289.0 285.0
Cost of acquisition 287.3
Fair value of net assets acquired 285.0
Final goodwill on acquisition 2.3
Had the acquisition occurred at the beginning of the reporting period, the consolidated financial statement of comprehensive income would have included additional revenue of $4 million and net profit before tax of $0.5 million.
Community Telco Australia Pty LtdOn 1 December 2012 Bendigo and Adelaide Bank Group acquired an additional 50 percent of shares in Community Telco Australia Pty Ltd, increasing the Group’s holding to 100 percent. The acquisition of the additional share holding resulted in the Group gaining effective control, and the requirement to consolidate the joint venture. Total number of shares held in Community Telco Australia Pty Ltd is 14,500,560 for the cash consideration of $500,000 and debt forgiveness of $8.4 million.
The principal activities of Community Telco Australia Pty Ltd are to provide a wide range of telecommunication services.
The following table shows the effect on the Group's assets and liabilities:
Pre-acquisition carrying amount
Recognised values on acquisition
Assets $ m $ m
Receivables 5.8 5.8
Intangible assets 0.7 0.7
Fixed assets 0.4 0.4
Deferred tax asset - 0.2
Total Assets 6.9 7.1
Liabilities
Bank account overdraft 3.2 3.2
Other liabilities 6.7 6.7
Deferred tax liability - 0.3
Total Liabilities 9.9 10.2
Net identifiable assets attributable to Bendigo and Adelaide Bank Limited
(3.0) (3.1)
Cost of acquisition 8.9
Fair value of net assets acquired (3.1)
Final goodwill on acquisition 12.0
The consolidated statement of comprehensive income includes revenue of $3.8 million and profit before tax of $0.1 million for the seven months to June 2013. Had the acquisition occurred at the beginning of the reporting period, the consolidated financial statement of comprehensive income would have included revenue of $6.5 million and net profit before tax of $0.1 million.
Goodwill Goodwill arose in the business combination as the consideration paid for the combination effectively included amounts in relation to the skills and talent of the acquired business workforce, the benefit of expected head office and operational synergies, revenue growth and future market development. These benefits are not recognised separately from goodwill as the future economic benefits arising from them cannot be measured reliably or they are not capable of being separated from the Group and sold, transferred, licensed, rented or exchanged either individually or together with any related contracts.
49. Events After Balance Sheet DateNo other matters or circumstances have arisen since the end of the financial year which significantly affected or may significantly affect the operations of the economic entity, the results of those operations, or the state of affairs of the economic entity in subsequent financial years.

Annual Financial Report Period ending 30 June 2013
165
Directors’ DeclarationIn accordance with a resolution of the directors of Bendigo and Adelaide Bank Limited, we state that: In the opinion of the directors:
(a) the financial statements and notes of the Company and the Bendigo and Adelaide Bank Group are in accordance with the Corporations Act 2001, including:
(i) giving a true and fair view of the Company's and the Bendigo and Adelaide Bank Group’s financial position as at 30 June 2013 and of its performance for the year ended on that date; and
(ii) complying with Australian Accounting Standards (including the Australian Accounting Interpretations) and Corporations Regulations 2001; and
(b) the financial statements and notes also comply with International Financial Reporting Standards as disclosed in note 2.2
(c) there are reasonable grounds to believe that the Company will be able to pay its debts as and when they become due and payable
(d) this declaration has been made after receiving the declarations required to be made to the directors in accordance with section 295A of the Corporations Act 2001 for the financial year ending 30 June 2013.
On behalf of the Board
Robert Johanson Mike Hirst Chairman Managing Director 3 September 2013

166

Annual Financial Report Period ending 30 June 2013
167

168
Additional information
1. Material DifferencesThere are no material differences between the information supplied in this report and the information in the preliminary final report supplied by Bendigo and Adelaide Bank Limited to the Australian Securities Exchange on 19 August 2013.
2. Audit Committee As at the date of the Directors' Report the Group had an Audit Committee of the Board of Directors.
3. Corporate governance practices The corporate governance practices adopted by Bendigo and Adelaide Bank Limited are as detailed in the Corporate Governance section of this report.
4. Substantial shareholdersAs at 15 August 2013 there were no substantial shareholders in Bendigo and Adelaide Bank Limited as detailed in substantial holdings notices given to the company.
5. Distribution of shareholdersRange of Securities as at 15 August 2013 in the following categories:
CategoryFully Paid
Ordinary SharesFully Paid
Employee SharesBPS
Preference SharesConvertible
Preference SharesStep Up
Preference Shares
1 - 1,000 37,065 3,224 3,071 5,063 2,950
1,001 - 5,000 35,918 690 66 279 86
5,001 - 10,000 7,057 58 2 25 9
10,001 - 100,000 3,722 12 6 13 6
100,001 and over 109 2 - 1 -
Number of Holders 83,871 3,986 3,145 5,381 3,051
Securities on Issue 407,228,173 4,779,691 900,000 2,688,703 1,000,000
6. Marketable parcelBased on the closing price of $10.84 on 15 August 2013 the number of holders with less than a marketable parcel of the Company’s main class of securities (Ordinary Shares), as at 15 August 2013 was 6,562.
7. Unquoted securitiesThe number of unquoted equity securities that are on issue and the number of holders of those securities are shown in the above table under the heading of Fully Paid Employee shares.
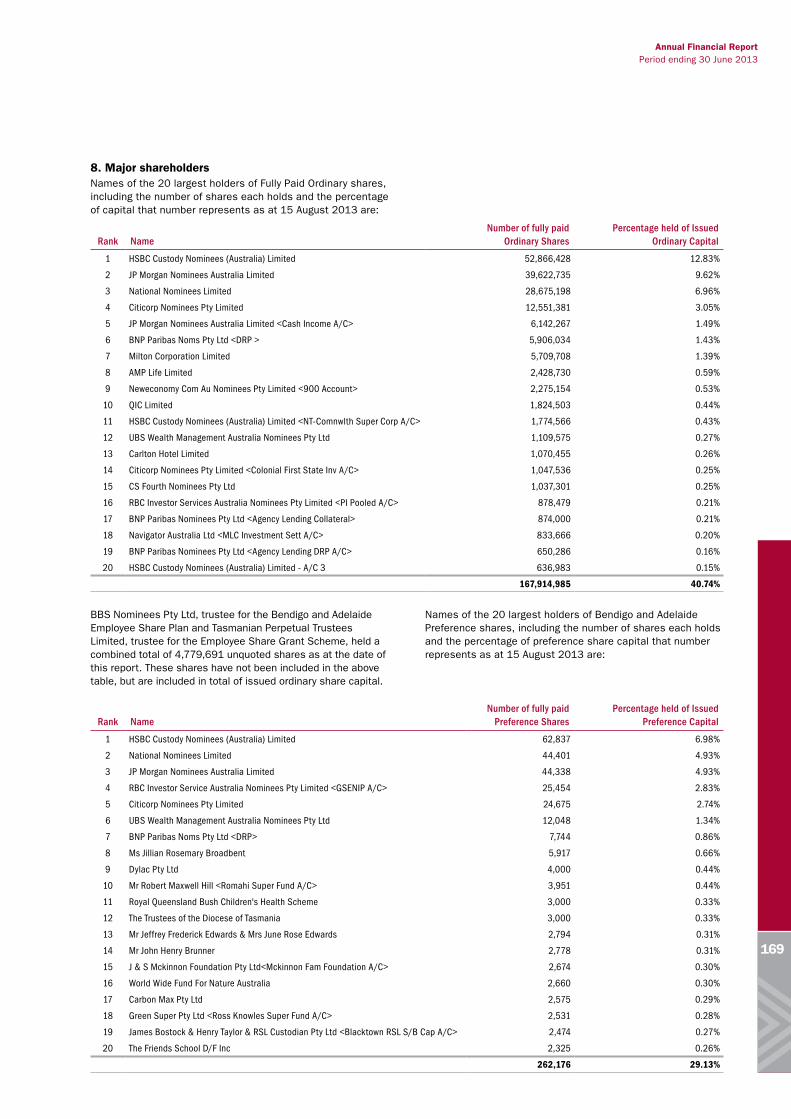
Annual Financial Report Period ending 30 June 2013
169
8. Major shareholdersNames of the 20 largest holders of Fully Paid Ordinary shares, including the number of shares each holds and the percentage of capital that number represents as at 15 August 2013 are:
Rank NameNumber of fully paid
Ordinary SharesPercentage held of Issued
Ordinary Capital
1 HSBC Custody Nominees (Australia) Limited 52,866,428 12.83%
2 JP Morgan Nominees Australia Limited 39,622,735 9.62%
3 National Nominees Limited 28,675,198 6.96%
4 Citicorp Nominees Pty Limited 12,551,381 3.05%
5 JP Morgan Nominees Australia Limited <Cash Income A/C> 6,142,267 1.49%
6 BNP Paribas Noms Pty Ltd <DRP > 5,906,034 1.43%
7 Milton Corporation Limited 5,709,708 1.39%
8 AMP Life Limited 2,428,730 0.59%
9 Neweconomy Com Au Nominees Pty Limited <900 Account> 2,275,154 0.53%
10 QIC Limited 1,824,503 0.44%
11 HSBC Custody Nominees (Australia) Limited <NT-Comnwlth Super Corp A/C> 1,774,566 0.43%
12 UBS Wealth Management Australia Nominees Pty Ltd 1,109,575 0.27%
13 Carlton Hotel Limited 1,070,455 0.26%
14 Citicorp Nominees Pty Limited <Colonial First State Inv A/C> 1,047,536 0.25%
15 CS Fourth Nominees Pty Ltd 1,037,301 0.25%
16 RBC Investor Services Australia Nominees Pty Limited <PI Pooled A/C> 878,479 0.21%
17 BNP Paribas Nominees Pty Ltd <Agency Lending Collateral> 874,000 0.21%
18 Navigator Australia Ltd <MLC Investment Sett A/C> 833,666 0.20%
19 BNP Paribas Nominees Pty Ltd <Agency Lending DRP A/C> 650,286 0.16%
20 HSBC Custody Nominees (Australia) Limited - A/C 3 636,983 0.15%
167,914,985 40.74%
BBS Nominees Pty Ltd, trustee for the Bendigo and Adelaide Employee Share Plan and Tasmanian Perpetual Trustees Limited, trustee for the Employee Share Grant Scheme, held a combined total of 4,779,691 unquoted shares as at the date of this report. These shares have not been included in the above table, but are included in total of issued ordinary share capital.
Names of the 20 largest holders of Bendigo and Adelaide Preference shares, including the number of shares each holds and the percentage of preference share capital that number represents as at 15 August 2013 are:
Rank NameNumber of fully paid
Preference SharesPercentage held of Issued
Preference Capital
1 HSBC Custody Nominees (Australia) Limited 62,837 6.98%
2 National Nominees Limited 44,401 4.93%
3 JP Morgan Nominees Australia Limited 44,338 4.93%
4 RBC Investor Service Australia Nominees Pty Limited <GSENIP A/C> 25,454 2.83%
5 Citicorp Nominees Pty Limited 24,675 2.74%
6 UBS Wealth Management Australia Nominees Pty Ltd 12,048 1.34%
7 BNP Paribas Noms Pty Ltd <DRP> 7,744 0.86%
8 Ms Jillian Rosemary Broadbent 5,917 0.66%
9 Dylac Pty Ltd 4,000 0.44%
10 Mr Robert Maxwell Hill <Romahi Super Fund A/C> 3,951 0.44%
11 Royal Queensland Bush Children's Health Scheme 3,000 0.33%
12 The Trustees of the Diocese of Tasmania 3,000 0.33%
13 Mr Jeffrey Frederick Edwards & Mrs June Rose Edwards 2,794 0.31%
14 Mr John Henry Brunner 2,778 0.31%
15 J & S Mckinnon Foundation Pty Ltd<Mckinnon Fam Foundation A/C> 2,674 0.30%
16 World Wide Fund For Nature Australia 2,660 0.30%
17 Carbon Max Pty Ltd 2,575 0.29%
18 Green Super Pty Ltd <Ross Knowles Super Fund A/C> 2,531 0.28%
19 James Bostock & Henry Taylor & RSL Custodian Pty Ltd <Blacktown RSL S/B Cap A/C> 2,474 0.27%
20 The Friends School D/F Inc 2,325 0.26%
262,176 29.13%

170
Names of the 20 largest holders of Bendigo and Adelaide Convertible Preference shares, including the number of shares each holds and the percentage of convertible preference share capital that number represents as at 15 August 2013 are:
Rank NameNumber of fully paid
Convertible Preference SharesPercentage held of Issued
Convertible Preference Shares
1 BNP Paribas Noms Pty Ltd <DRP> 103,117 3.84%
2 Citicorp Nominees Pty Limited 56,359 2.10%
3 Northern Metropolitan Cemeteries T/A Macquarie Park Cemetery 40,000 1.49%
4 HSBC Custody Nominees (Australia) Limited 39,093 1.45%
5 Questor Financial Services Limited <TPS RF A/C> 33,110 1.23%
6 Pershing Australia Nominees Pty Ltd <Implemented Portfolios A/C> 24,456 0.91%
7 National Nominees Limited 22,053 0.82%
8 JP Morgan Nominees Australia Limited 20,568 0.76%
9 Netwealth Investments Limited <Wrap Services A/C> 15,660 0.58%
10 Woronora General Cemetery & Crematorium 15,000 0.56%
11 Vesade Pty Ltd 15,000 0.56%
12 Sandhurst Trustees Ltd <DMP Asset Management A/C> 14,984 0.45%
13 Sandhurst Trustees Ltd <LMA A/C> 12,008 0.38%
14 G E Mallan Investments Pty Ltd <Mallan Super Fund A/C> 10,300 0.37%
15 Baptist Financial Services Australia Limited 10,000 0.37%
16 Hampton Pty Ltd 10,000 0.37%
17 John E Gill Trading Pty Ltd 10,000 0.37%
18 Marento Pty Ltd 10,000 0.37%
19 Noilly Pty Ltd <Walmsley Family Fund A/C> 10,000 0.37%
20 Randlewood Pty Ltd <Murray Family A/C> 10,000 0.37%
481,708 17.91%
Names of the 20 largest holders of Bendigo and Adelaide Step Up Preference shares, including the number of shares each holds and the percentage of step up preference share capital that number represents as at 15 August 2013 are:
Rank NameNumber of fully paid
Step Up Preference SharesPercentage held of Issued
Step Up Preference Shares
1 National Nominees Limited 62,440 6.24%
2 JP Morgan Nominees Australia Limited 22,334 2.23%
3 UBS Wealth Management Australia Nominees Pty Ltd 17,907 1.79%
4 Navigator Australia Ltd <MLC Investment Sett A/C> 16,752 1.68%
5 Nulis Nominees (Australia) Limited <Navigator Mast Plan Sett A/C> 13,814 1.38%
6 Post Perfect Pty Ltd 10,800 1.08%
7 Returned Services League of Australia (Queensland Branch) 10,000 1.00%
8 UBS Nominees Pty Ltd 7,043 0.70%
9 Aust Executor Trustees Ltd <DDH Preferred Income Fund> 6,559 0.66%
10 Invia Custodian Pty Limited <Faithfull Group Invest A/C> 6,340 0.63%
11 Sandhurst Trustees Ltd <LMA A/C> 6,133 0.61%
12 HSBC Custody Nominees (Australia) Limited 6,068 0.61%
13 Carbon Max Pty Ltd 5,458 0.55%
14 Questor Financial Services Limited <TPS RF A/C> 5,196 0.52%
15 Escor Investments Pty Ltd <FF A/C> 5,085 0.51%
16 BNP Paribas Noms Pty Ltd <DRP> 5,000 0.50%
17 Ballabradach Pty Ltd 4,474 0.45%
18 Tank Lord Pty Ltd 4,401 0.44%
19 Rogand Pty Ltd <Rogand Unit A/C> 4,220 0.42%
20 Baker Custodian Corporation 3,893 0.39%
223,917 22.39%
9. Voting rightsThe holders of ordinary shares are entitled to vote at meetings of shareholders in the first instance by a show of hands of the shareholders present and entitled to vote. If a poll is called, each shareholder has one vote for each fully paid share held.
Holders of partly paid shares have a vote which carries the same proportionate value as the proportion that the amount
paid up on the total issue price bears to the total issue price of the share.
In the case of an equality of votes the Chairman has, on both a show of hands and at a poll, a casting vote in addition to the vote to which the Chairman may be entitled as a shareholder, proxy, attorney or duly appointed representative of a shareholder.


Bendigo and Adelaide Bank Limited ABN 11 068 049 178