customer attitudes toward service of bts skytrain during
TRANSCRIPT

CUSTOMER ATTITUDES TOWARD SERVICE OF
BTS SKYTRAIN DURING WEEKDAYS
BY
MISS KANIT VANNASIRI
AN INDEPENDENT STUDY SUBMITTED IN PARTIAL
FULFILLMENT OF
THE REQUIREMENTS FOR THE DEGREE OF
MASTER OF SCIENCE PROGRAM IN MARKETING
(INTERNATIONAL PROGRAM)
FACULTY OF COMMERCE AND ACCOUNTANCY
THAMMASAT UNIVERSITY
ACADEMIC YEAR 2017
COPYRIGHT OF THAMMASAT UNIVERSITY
Ref. code: 25605902040780BMJ

CUSTOMER ATTITUDES TOWARD SERVICE OF
BTS SKYTRAIN DURING WEEKDAYS
BY
MISS KANIT VANNASIRI
AN INDEPENDENT STUDY SUBMITTED IN PARTIAL
FULFILLMENT OF THE REQUIREMENTS FOR THE DEGREE
OF MASTER OF SCIENCE PROGRAM IN MARKETING
(INTERNATIONAL PROGRAM)
FACULTY OF COMMERCE AND ACCOUNTANCY
THAMMASAT UNIVERSITY
ACADEMIC YEAR 2017
COPYRIGHT OF THAMMASAT UNIVERSITY
Ref. code: 25605902040780BMJ


(1)
Independent Study Title CUSTOMER ATTITUDES TOWARD
SERVICE OF BTS SKYTRAIN DURING
WEEKDAYS
Author Miss Kanit Vannasiri
Degree Master of Science Program in Marketing
(International Program)
Major Field/Faculty/University Faculty of Commerce and Accountancy
Thammasat University
Independent Study Advisor Prof. Malcolm C. Smith, Ph.D.
Academic Years 2017
ABSTRACT
BTS SkyTrain is the largest mass transit operator in Bangkok, Thailand with
66% ridership market share during the working week at around 600,000 people per
day. The company tries to improve its customer satisfaction towards services by doing
a customer satisfaction survey annually. However, the latest satisfaction rating was
just 3.84 out of 5.
There are three main research objectives. First, the research will identify the
target consumers and their profiles for BTS SkyTrain. Second, the research will
evaluate customer attitudes toward services that BTS offers during the trip. Lastly, the
research will discover customer attitudes toward the usage of the Rabbit Smart Pass
card system.
The exploratory research includes secondary research, which was obtained
from published sources, while eight in-depth interviews provided insights of
consumer behaviors and perceptions toward BTS SkyTrain. The key findings from the
exploratory research were validated through the descriptive research of 216 online
questionnaires. The Statistical Package for the Social Sciences (SPSS) program was
also used to analyze the data from the survey.
All respondents were divided into three segments based on their lifestyle,
which are Active Passengers, Socially Oriented Passengers, and Variety Seeking
Passengers. Moreover, the study revealed some issues that were necessary for the
Ref. code: 25605902040780BMJ

(2)
passengers. For example, there were no plastic bags provided to pack umbrellas when
it rained, there was no the LED information board to notice what time the train will
come, etc. Recommendations are provided that the company can implement that takes
these into consideration.
This research is designed to obtain a better understanding of customer
attitudes towards services of the BTS SkyTrain during weekdays. The findings from
this study will provide the benefits not only for the BTS SkyTrain to gain a higher
annual rating and more customers, but also to increase the customer happiness.
Keywords: BTS SkyTrain, Services, Passenger, Attitude, Satisfaction, Weekdays
Ref. code: 25605902040780BMJ

(3)
ACKNOWLEDGEMENTS
I would like to express my sincere appreciation to Prof. Malcolm C. Smith, my
supportive advisor. His kind valuable recommendations throughout the entire
independent study course were highly appreciated. He once said that he wanted me to
be proud of the report and he also wanted to be proud of this report as well. Without
his support, comments, advice and knowledge, this research will never be completed.
Moreover, I would like to express special thanks to all respondents for their
valuable time to complete both the in-depth interviews and the questionnaires. I also
deeply appreciate my family members, my father, my mother, and my brother, for
their supporting me on everything during my graduate school. Without them, I could
never have accomplished this Master’s Degree.
Last but not least, I would like to thank all my MIM30 classmates, especially
Pon and Oil, for their countless encouragement and support.
Miss Kanit Vannasiri
Ref. code: 25605902040780BMJ

(4)
TABLE OF CONTENTS
Page
ABSTRACT (1)
ACKNOWLEDGEMENTS (3)
LIST OF TABLES (7)
LIST OF FIGURES (8)
CHAPTER 1 INTRODUCTION
1.1 Introduction to the Study 1
1.2 Objectives 1
CHAPTER 2 REVIEW OF LITERATURE 4
2.1 Business Overview 4
2.2 Five-Year Strategy of BTS SkyTrain 4
2.3 Problem about Facilities and Operation 4
2.4 Framework about Services 5
2.5 Customer Research about BTS SkyTrain 6
2.6 Conclusion of Literature Review 6
CHAPTER 3 RESEARCH METHODOLOGY 8
3.1 Research Design 8
3.2 Exploratory Research 8
3.2.1 Secondary Data 8
3.2.2 In-depth Interview 8
Ref. code: 25605902040780BMJ

(5)
3.3 Descriptive Research 9
3.3.1 Target respondents 9
3.3.2 Survey recruiting plan 9
3.3.2.1 Pantip 10
3.3.2.2 Facebook 10
3.3.2.3 Twitter 10
3.3.2.4 Other Social Media Platforms 10
3.4 Identification of Key Research Variables 10
3.5 Data Analysis Plan 11
3.6 Limitations of the Study 11
CHAPTER 4 RESULTS AND DISCUSSION 12
4.1 Key Results from Secondary Research 12
4.2 Key Results from In-depth Interviews 12
4.2.1 Customer attitudes toward the procedure before passing
through the BTS SkyTrain automatic station gates 13
4.2.2 Customer attitudes toward the services received while
on BTS SkyTrain platforms 13
4.2.3 Customer attitudes toward the services received while
onboard BTS SkyTrains 14
4.2.4 Customer attitudes toward the services received while
exiting BTS SkyTrain stations 14
4.2.5 Customer attitudes toward the method of payment for
BTS SkyTrain tickets 14
4.2.6 Customer attitudes toward the privileges received from
using the BTS SkyTrain Rabbit SmartPass card 15
4.3 Key Results from Questionnaire Survey 15
4.3.1 General Profile of Respondents 15
4.3.1.1 Gender 15
4.3.1.2 Age 15
Ref. code: 25605902040780BMJ

(6)
4.3.1.3 Occupation 15
4.3.1.4 Education 15
4.3.1.5 Current Status 15
4.3.1.6 Monthly Income 15
4.3.2 BTS SkyTrain customers segmented by their Lifestyle 15
4.3.3 Characteristics of each segment 16
4.3.3.1 Segment 1: Active Passengers 16
4.3.3.2 Segment 2: Socially Oriented Passengers 16
4.3.3.3 Segment 3: Variety Seeking Passengers 16
4.3.4 Customer attitudes toward services that BTS offers during the trip16
4.3.4.1 Customer attitudes toward the process before
getting into the automatic gate of the station 16
4.3.4.2 Customer attitudes toward the services that they
receive while on the platform 18
4.3.4.3 Customer attitudes toward the services that they
receive while onboard the BTS 20
4.3.4.4 Customer attitudes toward the services that they
receive while exiting the station 21
4.3.5 Customer attitudes toward the usage of the Rabbit SmartPass
card system 22
4.3.5.1 Customer attitudes toward the method of payment 22
4.3.5.2 Customer attitudes toward the privileges that they
receive from using the Rabbit SmartPass card 24
CHAPTER 5 CONCLUSIONS AND RECOMMENDATIONS 27
5.1 Research Summary 27
5.2 Recommendations 29
REFERENCES 32
APPENDICES
Ref. code: 25605902040780BMJ

(7)
APPENDIX A In-depth Interviews Questions 35
APPENDIX B Online Questionnaire 36
APPENDIX C Summary of Respondents Profile 43
APPENDIX D Factor Analysis 44
APPENDIX E Cluster Analysis 45
APPENDIX F Analysis of Variance 47
BIOGRAPHY 54
Ref. code: 25605902040780BMJ

(8)
LIST OF TABLES
Tables Page
3.1 Sampling Plan 9
4.1 General Profile of Respondents 12
4.2 Summary of different between segments for customer attitudes
toward the process before getting into the automatic gate of the station 18
4.3 Summary of results for customer attitudes toward the services that
they receive while on the platform 20
4.4 Summary of results for customer attitudes toward the services that
they receive while onboard the BTS 21
4.5 Summary of results for customer attitudes toward the services that
they receive while exiting the station 23
4.6 Summary of results for customer attitudes toward the method of payment 24
4.7 Summary of results for customer attitudes toward the privileges that they
receive from using the Rabbit SmartPass card 26
Ref. code: 25605902040780BMJ

(9)
LIST OF FIGURES
Figures Page
3.1 Relationship of Independent variables and Dependent Variables 10
4.1 The barrier between the train and the platform 13
5.1 Example of the LED information board from Singapore 30
5.2 Example of the umbrella bag dispenser 31
Ref. code: 25605902040780BMJ

1
CHAPTER 1
INTRODUCTION
1.1 Introduction to the Study
Traffic jams in Bangkok cause Bangkokians waste 45% of gas that they
normally use per day or around 2,500 million liters per year. Moreover, they also have
to spend more than 1-3 hours struggling in a car to go to their school or workplace
every day. Compared to other transportations, the BTS SkyTrain helps Bangkokians
save time and money on gas. Therefore, the BTS SkyTrain has a vital role in their
daily life (Engineeringtoday, 2010). Most of the BTS passengers travel the BTS
SkyTrain 4-5 days per week during peak hours, both in the morning and in the
evening (BTS Group, 2017). According to Naewna News (2017), BTS customer
satisfaction has achieved a rating of 3.84 out of five. The highest rating of satisfaction
is in safety and security area (4.10) and the lowest rating of satisfaction is in ticketing
and marketing area (3.62).
Yet, as will be discussed below in the literature review, many attributes about
the BTS SkyTrain services and facilities are still not known. Therefore, this research
aims to answer the following question: “Which factors could be improved to increase
the satisfaction of customers who ride the BTS SkyTrain during weekdays?” This
research is a contemporary topic in applied marketing about the customer attitude
towards service of BTS SkyTrain, focusing on the subject area of society in Thailand.
This report is organized in the following manner. The next section will cover the
objectives of the research. This will be followed by a literature review, a discussion of
Ref. code: 25605902040780BMJ
2
the methods used, the key variables, sampling, data analysis, results, discussion, and
recommendations.
1.2 Objectives
This study consists of three main objectives as follows;
1.2.1 To identify the target consumers and their profiles for the BTS
SkyTrain
1.2.1.1 Lifestyle
1.2.1.2 Demographic: Age, Gender, Occupation, Income, etc.
1.2.1.1 Ridership Behavior : Frequency of riding BTS per week, Period
of time they ride BTS most often, Objective of riding BTS, Average spending on BTS
per day, Method of adding money to the Rabbit SmartPass card.
1.2.2 To evaluate customer attitudes toward services that BTS offers
during the trip
1.2.2.1 To determine customer attitudes toward the process before
getting to the automatic gate of the station e.g. staff helpfulness, ticket purchase, clear
information of signage, the number of automatic gate, available facilities for disabled
people, etc.
1.2.2.2 To determine customer attitudes toward the services that they
receive while on the platform, e.g. waiting time, clear information of signage, the
number of benches, etc.
1.2.2.3 To determine customer attitudes toward the services that they
receive while onboard the BTS e.g. quality of train system, sound quality of
loudspeaker, proper temperature, the number of handles, etc.
Ref. code: 25605902040780BMJ

3
1.2.2.4 To determine customer attitudes toward the services that they
receive while exiting the station e.g. the number of automatic gate, the number of
shops, etc.
1.2.3 To discover the customer attitude towards the usage of the Rabbit
SmartPass card system
1.2.3.1 To evaluate customer attitudes toward the method of payment.
1.2.3.2 To evaluate customer attitudes toward the privileges that they
receive from using the Rabbit SmartPass card e.g. turning points to money in the card,
discounts at many kinds of retail shops and restaurants, etc.
Ref. code: 25605902040780BMJ

4
CHAPTER 2
REVIEW OF LITERATURE
2.1 Business Overview
BTS SkyTrain was officially opened in 1999. Built and operated by the
Bangkok Mass Transit System Public Company Limited (BTSC), it was the first
electric mass transit railway system to commence operations in Thailand. BTS
SkyTrain system is a standard mass transit system commonly used in cosmopolitan
cities. Each train serves up to 1,000 passengers per journey compared to the 800
vehicles on the roads transporting the same number of commuters. (BTS Group,
2017) There are over 600,000 people who ride the BTS SkyTrain per day during
weekdays (Arphaaphirom, 2013). BTS SkyTrain is the largest mass transit operator in
Bangkok, Thailand with 66% ridership market share. (BTS Factsheet, 2017).
2.2 Five-Year Strategy of BTS SkyTrain
There are three key investment features for their five-year strategy, which are
mass transit, media, and property. The investment feature relating to the research
topic directly is the mass transit. The Company desires to increase ridership growth by
3-5% over five years (BTS Factsheet, 2017). However, this goal might prove difficult
to achieve as the latest customer satisfaction survey gave disappointing results.
2.3 Problem about Facilities and Operation
Even though the ticketing and marketing area received the lowest score, the
system error of the BTS SkyTrain also seems to be a huge problem. According to the
issue from Pantip, the most popular web board in Thailand, some users gathered
statistics from the official Twitter of the BTS SkyTrain and revealed that there were
system errors 52 times per year or 4 times per month (Pantip, 2017 A). Many
passengers have demanded more development of the system in order to avoid more
failure because the BTS SkyTrain is the main transportation in Bangkok and its
failure could affect many people (Posttoday, 2017). Also, they demanded that the
BTS SkyTrain be more frequent or add more buggies in order to hold as many
Ref. code: 25605902040780BMJ

5
passengers as possible during peak hours (Pantip, 2017 B). Furthermore, after the
photo of a disabled lady with her wheelchair using the escalators by holding the
handrail by herself was revealed, there was a social criticism. They wanted BTS
SkyTrain to provide elevators for every station for disabled people (Lheam-Thong,
2017).
2.4 Framework about Services
In a highly competitive economy, many businesses become more similar and it
becomes more difficult to maintain their uniqueness. Businesses cannot create their
own uniqueness because they do not use their full imagination. There are many ways
to differentiate themselves in terms of value and benefits for their consumers. The
businesses might redesign their products or services offered by following their
consumer needs. They could provide more facilities, offer faster services, provide
better training to their employees, or offer a product warranty. Even though there are
no offers that have good impact forever, it keeps the businesses alert and makes their
consumers see that they never stop developing. (Samerjai, 2002)
Consumers are individual and organizations who purchase products or services
in order to consume by themselves or to assemble to other products, not for resale.
Responding to consumer needs and creating customer satisfaction is fundamental of
any marketing strategy. However, the way to create a good strategy is to get the
consumer insights. Therefore, businesses need a marketer to study consumer behavior
and all gaps between consumer needs and services offered. (Jitcheang, 2010)
One of the gaps model of service quality will be used for the second objective
which is to evaluate the customer attitude towards services that the BTS SkyTrain
offers during the trip. The explanation is as follows;
Provider gap 1 (Knowledge Gap): Not knowing what customers expect
This is the gap between the consumer expectations of service and the company
perception of consumer expectations. Because the business has not conducted
marketing research, there is a lack of communicating and maintaining relationships
with the customers, and a lack of prioritizing the business management.
A solution to avoid this gap is to do marketing research and to prioritize the
business management. In this research, the BTS SkyTrain’s customers will be asked
Ref. code: 25605902040780BMJ

6
about the new attributes that are not in the existing research in order to make BTS
Group understand more about consumer needs. (Shahaida, 2012)
2.5 Customer Research about BTS SkyTrain
Jitcheang (2010) studied the purchase intention of Bangkokians who ride the
BTS SkyTrain. Some questions in this study were about the staff friendliness, proper
temperature, clear information on signage, etc. However, this research was collected
eight years ago. Therefore, I desire to know whether there are any differences from
then to now. The previous research found that most of the BTS SkyTrain passengers
are female, 15-24 years of age, students, and have a salary base less than 10,000 baht.
The period of time that they ride the BTS most often is 09:00-12:00 A.M. They focus
on the convenience, speed, and safety.
Apart from the purchase intention, there is a survey that studied passengers
who use the Rabbit SmartPass card. The research found that most of the BTS
passengers who use the Rabbit SmartPass card are female, 21-30 years of age,
employees of a private company, and have salary range around 10,001-20,000 baht.
They mostly use the adult Sky SmartPass (Stored Value SmartPass). They often use
the BTS SmartPass on weekdays to get to work due to its convenience and rapidity
(Udommahalarp, 2010)
2.6 Conclusion of Literature Review
BTS SkyTrain is the largest mass transit operator in Bangkok, Thailand with
66% ridership market share during the working week at around 600,000 people per
day. The Company desires to increase ridership growth by 3-5% over five years. This
goal might prove difficult to achieve as the latest customer satisfaction survey
revealed disappointing results. Many problems with BTS SkyTrain services are
highlighted daily on Pantip and Twitter social media sites such as system errors and
lack of facilities for disabled people. The company should analyze this Knowledge
Gap to recognize a better understanding of the needs of their customers. Previous
research concerning BTS customers found that most passengers who used the BTS
SmartPass were female and convenience, speed, and safety were all important factors.
Ref. code: 25605902040780BMJ

7
However, the data were collected many years ago. This study, therefore, determined
the current passenger assessment of the BTS transport system.
Ref. code: 25605902040780BMJ

8
CHAPTER 3
RESEARCH METHODOLOGY
3.1 Research Design
This research was conducted using two methods, which were exploratory
research and descriptive research. The exploratory research included secondary
research and in-depth interviews. The data and insights from the exploratory research
were used in the development of the questionnaires, which were distributed through
online channels.
3.2 Exploratory Research
3.2.1 Secondary Data
At the initial stage of this study, the secondary data was obtained from
credible sources in order to collect general information about the BTS SkyTrain
business in Bangkok. The data includes reliable statistics, existing consumers’
opinions, and other useful information from published sources that are related to this
study. The secondary sources came from the Internet, abstracts, textbooks, and
previous research. All information was collected to analyze and to be used as a
guideline to set up questions for in-depth interviews for the next stage of the study.
3.2.2 In-depth Interviews (see Appendix A: In-depth interviews questions)
The in-depth interviews were conducted to obtain consumers insights on
attitudes toward services that the BTS SkyTrain offers during the ride, the usage of
the Rabbit Smart Pass card system, and the segmentation of the BTS SkyTrain
consumers. The in-depth interviews provided insightful information on an
individual’s perspective, while not being influenced by other people. This method was
conducted with eight participants.
For the recruitment, a personal contact was used to recruit eight participants
from various consumer profiles. The in-depth interviews were conducted both by
face-to-face communication at Starbucks (Siam Square) and by telephone calls. The
target respondents are Thai passengers who are living, studying, or working in an
Ref. code: 25605902040780BMJ

9
urban area of Bangkok, especially in the CBD district and residential area. The length
of the in-depth interview did not exceed 30 minutes per participant.
3.3 Descriptive Research
This study used a questionnaire survey, which was analyzed using various
analysis techniques. The structured questionnaire was designed to seek the attitude of
the respondents on their level of agreement/ disagreement on a 1-5 Likert scale. Apart
from collecting the demographic and the socio-economic characteristics data, the
questionnaire was also designed to gain information concerning the respondents’
expectation and perceived quality on the performance of the facilities.
The descriptive research aimed to provide a clear picture of consumers’
attitude towards the BTS SkyTrain services. The descriptive research was used to
quantify the findings from the exploratory research. The research aimed to have at
least 200 completed questionnaires. The length of the questionnaire did not exceed 15
minutes per respondent. (see Table 3.1)
Type of Research Methodology Pre-Test Pilot Sample Size
Qualitative In-depth Interview - 8 respondents
Quantitative Survey Questionnaire 5 respondents 215 respondents
Table 3.1: Sampling Plan
3.3.1 Target respondents
The target respondents are Thai male and female passengers who are between
15-40 years of age, and are living, studying, or working in an urban area of Bangkok,
especially in the CBD district and residential area. According to the BTS Group
(2016), two third of all Thai BTS SkyTrain customers are people who are between 15-
40 years of age.
3.3.2 Survey recruiting plan (see Appendix B: Online questionnaire)
The online questionnaire was distributed to respondents using a non-
probability convenience sampling plan over the target population from various online
community as follows:
Ref. code: 25605902040780BMJ

10
3.3.2.1 Pantip: There are many different rooms on Pantip.com.
Therefore, the questionnaire was posted in the rooms that are related to the BTS
SkyTrain consumer, such as the ‘Community Hall’ room, the ‘Siam Square’ room,
and the ‘Silom’ room.
3.3.2.2 Facebook: The questionnaire was posted in the official pages,
unofficial pages, and groups that are related to the BTS SkyTrain consumer as
follows;
(1) Official pages: BTS SkyTrain, NuduanBTS
(2) Unofficial pages: Rodfaifah BTS MRT
(3) Group: Thailand Electrified Train Club
3.3.2.3 Twitter: The questionnaire will be posted with the hashtag
#BTS #BTSSkyTrain #บทเอส #รถไฟฟา
3.3.2.4 Other social network platforms: such as, LINE Application
3.4 Identification of Key Research Variables (see Figure 3.1)
Relationship of Independent variables and dependent variables are described below.
Independent Variables Dependent Variables
Figure 3.1: Relationship of Independent variables and Dependent Variables
Ref. code: 25605902040780BMJ

11
3.5 Data Analysis
Before analysis, all questionnaires were coded and entered electronically. The
Statistical Package for the Social Sciences (SPSS) and Microsoft Excel Program were
used to analyze data from the questionnaire and focused on frequency analysis, mean
comparisons, factor analysis, cluster analysis, and other appropriate statistical
analysis.
3.6 Limitations of the Study
The research findings cannot be generalized to the entire population due to the
following reasons:
- Samples in this research were selected by using convenience sampling method.
- Time and budget were main constraints.
Ref. code: 25605902040780BMJ

12
CHAPTER 4
RESULTS AND DISCUSSION
4.1 Key Results from Secondary Research
BTS SkyTrain desires to increase ridership growth by 3-5% over five years.
This goal might prove difficult to achieve as the latest customer satisfaction survey
gave disappointing results. Many problems with BTS SkyTrain services are
highlighted daily on Pantip and Twitter social media sites such as system errors and
lack of facilities for disabled people. Previous research concerning BTS customers
found that most passengers who used the BTS SmartPass were female and
convenience, speed, and safety were all important factors. However, the data were
collected many years ago. This study, therefore, determined the current passenger
assessment of the BTS transport system.
4.2 Key Results from In-depth Interviews
The in-depth interviews were conducted by face-to-face communication and
by telephone with eight respondents (see Table 4.1). Target respondents were Thai
passengers living, studying, or working in Bangkok, especially in the central business
district (CBD) and residential areas. General profiles of respondents were as follows:
Number Gender Age Occupation Frequency of riding BTS per week
1 Female 57 Employee 5 times/ week
2 Female 28 Employee 12-15 times/ week
3 Female 27 Employee 10 times/ week
4 Male 23 Own Business 3-5 times/ week
5 Male 59 Own Business 1 time/ week
6 Female 25 Freelance 5-8 times/ week
7 Male 30 Own Business 10-12 times/ week
8 Female 28 Freelance 3-5 times/ week
Table 4.1: General Profile of Respondents
Ref. code: 25605902040780BMJ

13
4.2.1 Customer attitudes toward the procedure before passing through
the BTS SkyTrain automatic station gates (Objective 2a)
Three respondents stated that staff at the counter were inactive and needed to
improve their service mindsets. Most respondents loved the food and beverage shops
at the stations because they were very convenient for grab and go. However, two
respondents mentioned that the limited area caused congestion when people stopped
to shop along the walkway during the rush hour. It would be better if the BTS
established lines demarcating walking traffic throughout. Moreover, interestingly, one
respondent who rode the BTS SkyTrain every day noted that when it rained, the BTS
had no plastic bags for passengers to pack umbrellas, and station floors and trains
quickly became wet and dirty.
4.2.2 Customer attitudes toward the services received while on BTS
SkyTrain platforms (Objective 2b)
Most respondents agreed that station guards who checked bags near the
automatic doors were ineffective. They checked bags carelessly and did not care if
they were ignored by passengers. The respondents suggested that a walk-through
metal detector would be better. One respondent thought that more benches should be
provided on platforms because there were long waits for trains outside of the rush
hour. Most respondents appreciated the barrier between the train and the platform (see
Figure 4.1) and thought that these safety barriers should be installed at every station.
One of the most interesting findings was that all respondents considered the LED
information boards as very useful and necessary. They wanted to know how many
minutes remained before the next train, why they had to wait so long, and the nature
of any problems with the BTS service. This information assisted their route planning
and should be considered by BTS SkyTrain management.
Figure 4.1: The barrier between the train and platform
Ref. code: 25605902040780BMJ

14
4.2.3 Customer attitudes toward the services received while onboard BTS
SkyTrains (Objective 2c)
Most respondents raised problems with the air conditioning. They mentioned
that BTS SkyTrain air conditioners were often broken and they could not breathe
properly, especially when the train was full. When it rained, the temperature inside the
train was too cold. The driver should adjust the air conditioner depending on the
prevailing weather conditions. Moreover, water often dripped from the air conditioner
positioned on the ceiling. Respondents requested an LED information board inside
each carriage. Presently, the station name is shown in small print on the monitor but
not everyone on the train can see this. Respondents also stated that the numbers of
holding handles were not sufficient during the rush hour and more handles should be
positioned close to the doors. Lastly, four respondents said that sometimes the driver
operated the train very badly. A 23-year-old male respondent stated, “She (the driver)
drove badly and my head hit the glass!”
4.2.4 Customer attitudes toward the services received while exiting BTS
SkyTrain stations (Objective 2d)
Most respondents considered that the number of automatic doors was
insufficient, and BTS SkyTrain management should adjust passenger directions to the
automatic doors depending on the time of day. For example, there should be more
exits than entrances at stations nearby popular workplaces during the rush hour.
Moreover, two respondents mentioned that the automatic doors closed too fast; they
were hit by the doors and this was painful.
4.2.5 Customer attitudes toward the method of payment for BTS
SkyTrain tickets (Objective 3a)
Most respondents used the BTS SkyTrain Rabbit SmartPass card and topped
up by cash and credit card via staff at the station counters. Only one respondent
topped up the card via McDonald’s or at a food court. Lastly, a 28-year-old female
respondent mentioned that she wanted to top up her card online via mobile phone but
this facility was unavailable.
Ref. code: 25605902040780BMJ

15
4.2.6 Customer attitudes toward the privileges received from using the
BTS SkyTrain Rabbit SmartPass card (Objective 3b)
Most respondents said that they loved changing Rabbit points for cash or
discounts from many shops and restaurants. Only one respondent had not registered
for a Rabbit SmartPass card because she did not fully understand the benefits.
4.3 Key Results from the Questionnaire Survey
4.3.1 General Profile of Respondents
The online questionnaire was distributed to 384 respondents via
SurveyMonkey.com. From a total number of respondents, 216 respondents met the
criteria for this study. (see Appendix C: General profile of respondents)
4.3.1.1 Gender: From 216 respondents, 88.6% were female.
4.3.1.2 Age: The top two age groups of the respondents were 23-30
years old (48.6%) and 31-40 years old (42.7%).
4.3.1.3 Occupation: The majority of the respondents (57.7%) were
office workers.
4.3.1.4 Education: The majority of the respondents (60.9%) graduated
with a bachelor’s degree.
4.3.1.5 Current Status: The majority of the respondents (90.5%) were
single.
4.3.1.6 Monthly Income: 42.7% of the respondents had their income
within 15,000 - 30,000 baht range, while about 24.5% had theirs within 30,001 –
45,000 baht range per month.
All target respondents were BTS SkyTrain customers who had ridden the BTS
SkyTrain during weekdays in the past 6 months and were in the age range of 15-40
years old.
4.3.2 BTS SkyTrain customers segmented by their Lifestyle
Factor and cluster analyses were conducted to determine respondent segments
based on their lifestyle. First, factor analysis was applied to reduce 13 variables down
to 4 factors (See Appendix D: Factor analysis) as trend, social, activeness, and
Ref. code: 25605902040780BMJ

16
inactiveness. Second, cluster analysis (See Appendix E-1: Cluster analysis) was used
to develop segmentation. Third, after applying cluster analysis, results were classified
into 3 groups of passengers as Active, Socially Oriented, and Variety Seeking.
Frequency analysis and chi-square were used to present the demographics of each
segment and test statistically significant differences among them at the 95%
confidence level. Results determined no significant differences among the 3 segments.
(See Appendix E-2: Demographic of each segment).
4.3.3 Characteristics of each segment
The 216 respondents were divided into three segments as follows:
4.3.3.1 Segment 1: Active Passengers (24.54%, n=53)
For active passengers, 83.0% were female. They were mostly 23-30
years old (52.8%) and 31-40 years old (45.3%). The majority (52.8%) were office
workers and 47.2% had an income of 15,000-30,000 baht.
For their ridership behavior, most of them (34.0%) spent 46-60 baht
per day on the BTS SkyTrain and 36.0% rode the BTS 1-4 times per week. They often
rode the BTS in the evening (34.0%) and always went home by the BTS (35.8%).
Lastly, the majority of them (58%) added money by cash.
These passengers followed an active lifestyle and enjoyed traveling to
many places in their free time to explore and discover new experiences. They loved
visiting museums and archeological sites in other provinces and participated in
outdoor and adventurous activities. They did not like to stay at home during weekends
and did not care that much about trendy activities and socialization.
4.3.3.2 Segment 2: Socially Oriented Passengers (49.07%, n=106)
Socially oriented passengers were the largest segment and 87.7% were
female. They were mostly 23-30 years old (47.2%). The majority (59.4%) were office
workers and 38.7% had an income of 15,000-30,000 baht. This segment had the
highest personal income (14.2%).
For their ridership behavior, most of them (29.2%) spent 46-60 Baht
per day on the BTS SkyTrain and 45.0% rode the BTS less than once a week. They
often rode the BTS in the evening (31.0%) and always went home by the BTS
Ref. code: 25605902040780BMJ

17
(35.8%). Lastly, the majority of them (57%) added money by cash and the next below
was that they did not use the BTS SmartPass card because they rarely rode the BTS. These passengers loved social activities. They were addicted to social
media and spend hours every day on Facebook, Instagram, and Twitter. They
maintained e-connection with their friends and hung out with them during their free
time. They loved having fun and joyful moments in a crowd such as attending
concerts, performances and events. They had a moderate interest in trendy things and
were happy to live their lives at a slow pace. They expressed low interest in outdoor
and adventurous activities.
4.3.3.3 Segment 3: Variety Seeking Passengers (26.39%, n=57)
For variety seeking passengers, 96.5% were female. They were mostly
23-30 years old (47.4%). The majority (59.6%) were office workers and 42.6% had an
income of 15,000-30,000 baht. For their ridership behavior, this was the segment that spent the most
on the BTS SkyTrain. 24.6% of them spent over 90 baht per day and another 24.6%
of them spent at 46-60 baht per day. The majority of them (35.0%) rode the BTS 1-4
times per week and often rode the BTS in the evening (29.0%) to go home (47.4%).
Lastly, the majority of them (59%) added money by cash while 26.0% added money
by a credit card. Passengers in this segment had varied interests including trends,
socializing, activeness, or inactiveness. They loved social media, fashion, and
technology. They were adaptable and could either stay at home to watch a TV series
and live the slow life or hang out with friends and attend concerts or outdoor
activities. They also loved trying out new things and discovering fresh experiences.
4.3.4 : Customer attitudes toward services that BTS offers during the trip
(Objective 2)
4.3.4.1 Customer attitudes toward the process before getting into
the automatic gate of the station (Objective 2a)
The respondents were asked about their opinion towards the process
before getting to the automatic gate of the station based on five-point scales of
Ref. code: 25605902040780BMJ

18
agreement. These questions helped to identify issues BTS consumers have before they
get to the automatic gate. Therefore, the issues were not identified merely by the top
three mean scores; it depended on the meaning of each statement. Some issues that
were identified had the highest mean score, while some issues had the lowest mean.
From the results, the three main issues that the passengers were
concerned about BTS Skytrain services were: The BTS should provide a plastic bag
for an umbrella when it rains (MTotal Mean = 4.26); The facilities for disabled people are
available (MTotal Mean = 2.77); and The number of the automatic gates are enough
(MTotal Mean = 2.90). For the last two issues, they imply that the facilities for disabled
people are not available as it is supposed to be and the number of the automatic gates
are not enough. Means scores (five points scales) for each segment and all passenger
are displayed in Table 4.2.
Statements
Active
Passengers
(n = 53)
Socially
Oriented
Passengers
(n = 106)
Variety
Seeking
Passengers
(n = 57)
Overall
(n = 216)
Mean SD Mean SD Mean SD Mean SD
A staff at the
counter is friendly. 3.08 0.65 3.25 1.07 3.51 1.31 3.26 1.07
A staff at the
counter is active. 3.38 0.79 3.51 1.08 3.82 1.20 3.55 1.06
A staff at the
counter is always
available. 3.45 0.82 3.89 1.09 4.19 0.91 3.83 1.04
The information
signage is easy to
understand. 3.51 0.72 3.65 1.04 3.86 1.13 3.66 1.00
The number of the
automatic gates are
enough. 2.64 1.02 2.87 1.24 3.18 1.39 2.90 1.23
The BTS should
provide a plastic
bag for an umbrella
when it rains.
3.94 1.05 4.35 0.82 4.39 0.96 4.26 0.93
The facilities for
disabled people are
available. 2.47 0.95 2.89 1.37 2.88 1.52 2.77 1.33
Table 4.2: Summary of different between segments for customer attitudes toward
the process before getting into the automatic gate of the station
Ref. code: 25605902040780BMJ

19
After testing for significant differences among the three means via an
Analysis of Variance (ANOVA) (See Appendix F-1: ANOVA table of three
segments, Appendix F-2: Post Hoc test table), there were two variables that had
significant differences among the three means as follows:
- “A staff at the counter is always available” was significantly
different among the three segments (F(2,213) = 7.83, p < .05). The mean score of
Variety Seeking Passengers (MVariety Seeking Passengers = 4.19) was significantly higher
than the mean score of Active Passengers (MActive Passengers = 3.45). However, there was
no significant difference between the mean score of Variety Seeking Passengers and
the mean score of Social Oriented Passengers (MSocially Oriented Passengers = 3.89).
- “The BTS should provide a plastic bag for an umbrella when it
rains” was significantly different among the three segments (F(2,213) = 4.12, p <
.05). The mean score of Variety Seeking Passengers (MVariety Seeking Passengers = 4.39)
was significantly higher than the mean score of Active Passengers (MActive Passengers =
3.94). However, there was no significant difference between the mean score of
Variety Seeking Passengers and the mean score of Social Oriented Passengers
(MSocially Oriented Passengers = 4.35).
4.3.4.2 Customer attitudes toward the services that they receive
while on the platform (Objective 2b)
The respondents were asked about their opinion towards the services
that they receive while on the platform based on five-point scales of agreement.
From the results, the three main issues that the passengers were
concerned about BTS Skytrain services were: I think there should be the LED
information board to notify what time the train will come (MTotal Mean = 4.72); I think
the barrier between the platform and the train is important (MTotal Mean = 4.67); and A
guard who is in charge of checking a bag is effective (MTotal Mean = 2.20). The last
issue got the lowest score. Therefore, it could implied that a guard who is in charge of
checking a bag is not effective. Means scores (five points scales) are distributed
according to each segment in Table 4.3.
Ref. code: 25605902040780BMJ

20
Statements
Active
Passengers
(n = 53)
Socially
Oriented
Passengers
(n = 106)
Variety
seeking
Passengers
(n = 57)
Overall
(n = 216)
Mean SD Mean SD Mean SD Mean SD
A guard who is in
charge of checking
a bag is effective. 1.96 0.88 2.37 1.31 2.14 1.48 2.20 1.27
I do not have to
wait for so long for
the train. 3.23 1.07 3.06 1.19 3.93 1.03 3.32 1.18
The number of
benches are enough. 2.15 0.89 2.11 1.09 2.54 1.54 2.23 1.18
I think the barrier
between the
platform and the
train is important.
4.57 0.75 4.64 0.78 4.84 0.45 4.67 0.71
I think there should
be the LED
information board
to notice what time
the train will come.
4.53 0.72 4.73 0.58 4.88 0.38 4.72 0.58
Table 4.3: Summary of results for customer attitudes toward the services that
they receive while on the platform.
After testing for significant differences among three means via an
ANOVA (See Appendix F-3: ANOVA table of three segments, Appendix F-4: Post
Hoc test table), there were two variables that had significant differences among the
three means as follows:
- “I do not have to wait for so long for the train” was
significantly different among the three segments (F(2,213) = 11.58, p < .05). The
mean score of Variety Seeking Passengers (MVariety Seeking Passengers = 3.39) was
significantly higher than the mean score of Active Passengers (MActive Passengers = 3.23)
and the mean score of Social Oriented Passengers (MSocially Oriented Passengers = 3.06).
- “There should be the LED information board to notice what
time the train will come” was significantly different among the three segments
(F(2,213) = 5.08, p < .05). The mean score of Variety Seeking Passengers (MVariety
Seeking Passengers = 4.88) was significantly higher than the mean score of Active
Passengers (MActive Passengers = 4.53). However, there was no significant difference
Ref. code: 25605902040780BMJ

21
between the mean score of Variety Seeking Passengers and the mean score of Social
Oriented Passengers (MSocially Oriented Passengers = 4.73).
4.3.4.3 Customer attitudes toward the services that they receive
while onboard the BTS (Objective 1c)
The respondents were asked about their opinion towards the services
that they receive while onboard the BTS based on five-point scales of agreement.
From the results, the three main issues that the passengers were
concerned about BTS Skytrain services were: I can see the station name clearly
(MTotal Mean = 2.80); The number of handles are enough (MTotal Mean = 2.85); and A
driver can drive the train smoothly (MTotal Mean = 3.22). The first two issues imply that
they cannot see the station name clearly and the number of handles are not enough.
Means scores (five points scales) are distributed according to each segment in Table
4.4.
Statements
Active
Passengers
(n = 53)
Socially
Oriented
Passengers
(n = 106)
Variety
seeking
Passengers
(n = 57)
Overall
(n = 216)
Mean SD Mean SD Mean SD Mean SD
I do not face with
system error often. 2.94 1.12 3.33 1.31 3.46 1.46 3.26 1.32
A driver can drive
the train smoothly. 3.11 0.87 3.15 1.24 3.53 1.30 3.22 1.19
The quality of
loudspeaker is
clear. 3.21 0.93 3.53 1.16 3.82 1.24 3.52 1.14
The number of
handles are enough. 2.87 0.92 2.78 1.19 2.95 1.37 2.85 1.18
The air conditioner
works well. 3.42 0.75 3.79 .96 4.00 1.13 3.75 0.99
There is some water
that drops from the
air conditioner. 3.15 1.39 2.71 1.47 2.88 1.76 2.87 1.55
The temperature is
proper. 3.28 0.74 3.34 1.10 3.75 1.14 3.44 1.04
I can see the station
name clearly. 2.75 0.90 2.69 1.25 3.07 1.57 2.80 1.27
Table 4.4: Summary of results for customer attitudes toward the services that
they receive while onboard the BTS.
Ref. code: 25605902040780BMJ

22
After testing for significant differences among three means via an
ANOVA (See Appendix F-5: ANOVA table of three segments, Appendix F-6: Post
Hoc test table), there were three variables that had significant differences among the
three means as follows:
- “The quality of loudspeaker is clear” was significantly different
among the three segments (F(2,213) = 4.07, p < .05). The mean score of Variety
Seeking Passengers (MVariety Seeking Passengers = 3.82) was significantly higher than the
mean score of Active Passengers (MActive Passengers = 3.21). However, there was no
significant difference between the mean score of Variety Seeking Passengers and the
mean score of Social Oriented Passengers (MSocially Oriented Passengers = 3.53).
- “The air conditioner works well” was significantly different
among the three segments (F(2,213) = 5.21, p < .05). The mean score of Variety
Seeking Passengers (MVariety Seeking Passengers = 4.00) was significantly higher than the
mean score of Active Passengers (MActive Passengers = 3.42). However, there was no
significant difference between the mean score of Variety Seeking Passengers and the
mean score of Social Oriented Passengers (MSocially Oriented Passengers = 3.79).
- “The temperature is proper” was significantly different among
the three segments (F(2,213) = 3.72, p < .05). The mean score of Variety Seeking
Passengers (MVariety Seeking Passengers = 3.75) was significantly higher than the mean score
of Active Passengers (MActive Passengers = 3.28). However, there was no significant
difference between the mean score of Variety Seeking Passengers and the mean score
of Social Oriented Passengers (MSocially Oriented Passengers = 3.34).
4.3.4.4 Customer attitudes toward the services that they receive
while exiting the station (Objective 1d)
The respondents were asked about their opinion towards the services
that they receive while exiting the station based on five-point scales of agreement.
From the results, the main issue that the passengers were concerned
about BTS Skytrain services was that there are not enough automatic gates. (MTotal
Mean = 2.91). This issue got the lowest score. Therefore, it implies that the number of
automatic gates are not enough. Means scores (five points scales) are distributed
according to each segment in Table 4.5.
Ref. code: 25605902040780BMJ

23
Statements
Active
Passengers
(n = 53)
Socially
Oriented
Passengers
(n = 106)
Variety
seeking
Passengers
(n = 57)
Overall
(n = 216)
Mean SD Mean SD Mean SD Mean SD
The number of
automatic gates are
enough. 2.74 .86 2.88 1.21 3.14 1.41 2.91 1.19
I get a queue
jumping from
others. 3.11 1.17 3.10 1.41 3.58 1.44 3.25 1.37
I used to get hit by
the automatic door. 3.15 1.32 3.14 1.62 3.47 1.66 3.23 1.56
Table 4.5: Summary of results for customer attitudes toward the services that
they receive while exiting the station
After testing for significant differences among three means via an
ANOVA, there were no significant differences among the three means as follows:
- “The number of automatic gates are enough” was not
significantly different among the three segments (F(2,213) = 1.67, p > .05).
- “I get a queue jumping from other” was not significantly
different among the three segments (F(2,213) = 2.51, p > .05).
- “I used to get hit by the automatic door” was not significantly
different among the three segments (F(2,213) = 0.93, p > .05).
4.3.5 : Customer attitudes toward the usage of the Rabbit SmartPass card
system (Objective 3)
4.3.5.1 Customer attitudes toward the method of payment
(Objective 3a)
The respondents were asked about their opinion towards the method of
payment based on five-point scales of agreement.
From the results, the three main issues that the passengers were
concerned about BTS Skytrain services were: I hope I could add money via mobile
application (MTotal Mean = 4.46); I agree when the BTS cancelled adding money with a
credit card (MTotal Mean = 2.36); and A payment method is convenient for me (MTotal
Mean = 3.15). For the second issue, it implies that the customers disagree when the
Ref. code: 25605902040780BMJ

24
BTS cancelled adding money by using a credit card. Means scores (five points scales)
are distributed according to each segment in Table 4.6.
Statements
Active
Passengers
(n = 53)
Socially
Oriented
Passengers
(n = 106)
Variety
seeking
Passengers
(n = 57)
Overall
(n = 216)
Mean SD Mean SD Mean SD Mean SD
A payment method
is convenient for
me. 3.08 1.03 2.90 1.41 3.74 1.34 3.15 1.35
I think the payment
method is safety. 3.47 .67 3.66 1.04 4.11 .94 3.71 0.98
I hope I could add
money via mobile
application. 4.23 .78 4.46 .76 4.63 .77 4.46 0.77
I agree when the
BTS cancelled
adding money with
a credit card.
2.26 1.02 2.53 1.52 2.16 1.46 2.36 1.40
Table 4.6: Summary of results for customer attitudes toward
the method of payment
After testing for significant differences among three means via an
ANOVA (See Appendix F-7: ANOVA table of three segments, Appendix F-8: Post
Hoc test table), there were three variables that had significant differences among the
three means as follows:
- “A payment method is convenient for me” was significantly
different among the three segments (F(2,213) = 7.81, p < .05). The mean score of
Variety Seeking Passengers (MVariety Seeking Passengers = 3.74) was significantly higher
than the mean score of Active Passengers (MActive Passengers = 3.08) and the mean score
of Social Oriented Passengers (MSocially Oriented Passengers = 2.90).
- “I think the payment method is safety” was significantly
different among the three segments (F(2,213) = 6.90, p < .05). The mean score of
Variety Seeking Passengers (MVariety Seeking Passengers = 4.11) was significantly higher
than the mean score of Active Passengers (MActive Passengers = 3.47) and the mean score
of Social Oriented Passengers (MSocially Oriented Passengers = 3.66).
Ref. code: 25605902040780BMJ

25
- “I hope I could add money via mobile application” was
significantly different among the three segments (F(2,213) = 3.86, p < .05). The mean
score of Variety Seeking Passengers (MVariety Seeking Passengers = 4.63) was significantly
higher than the mean score of Active Passengers (MActive Passengers = 4.23). However,
there was no significant difference between the mean score of Variety Seeking
Passengers and the mean score of Social Oriented Passengers (MSocially Oriented Passengers
= 4.46).
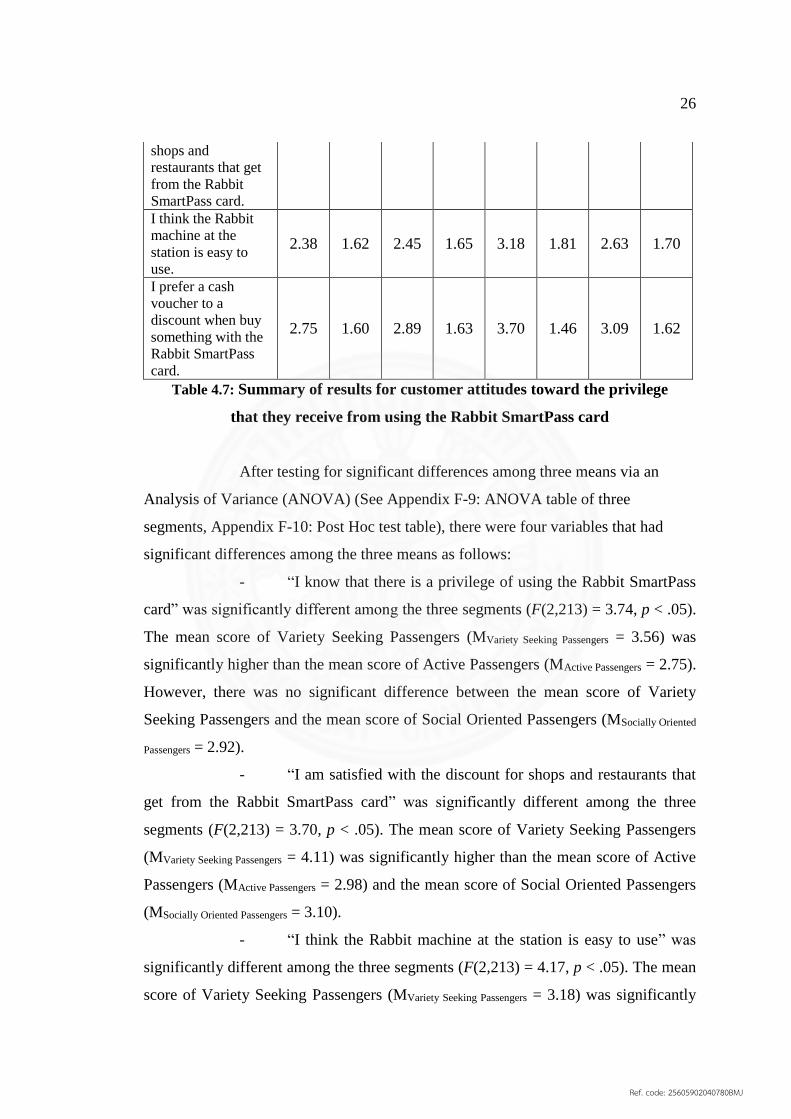
4.3.5.2 Customer attitudes toward the privileges that they receive
from using the Rabbit SmartPass card (Objective 3b)
The respondents were asked about their opinion towards the privileges
that they receive from using the Rabbit SmartPass card based on five-point scales of
agreement.
From the results, the three main issues that the passengers were
concerned about BTS Skytrain services were: I think the Rabbit machine at the station
is easy to use (MTotal Mean = 2.63); I know that there is a privilege of using the Rabbit
SmartPass card (MTotal Mean = 3.05); and I prefer a cash voucher to a discount when
buying something with the Rabbit SmartPass card (MTotal Mean = 3.09). For the first
one, it implies that the Rabbit machine at the station is difficult to use. Means scores
(five points scales) are distributed according to each segment in Table 4.7.
Statements
Active
Passengers
(n = 53)
Socially
Oriented
Passengers
(n = 106)
Variety
seeking
Passengers
(n = 57)
Overall
(n = 216)
Mean SD Mean SD Mean SD Mean SD
I know that there is
a privilege of using
the Rabbit
SmartPass card.
2.75 1.67 2.92 1.64 3.56 1.77 3.05 1.71
I like when I can
turn Rabbit points
into money in the
Rabbit SmartPass
card.
3.55 1.29 3.51 1.58 4.04 1.39 3.65 1.46
I am satisfied with
the discount for 2.98 1.20 3.10 1.54 3.70 1.44 3.23 1.44
Ref. code: 25605902040780BMJ
26
shops and
restaurants that get
from the Rabbit
SmartPass card.
I think the Rabbit
machine at the
station is easy to
use.
2.38 1.62 2.45 1.65 3.18 1.81 2.63 1.70
I prefer a cash
voucher to a
discount when buy
something with the
Rabbit SmartPass
card.
2.75 1.60 2.89 1.63 3.70 1.46 3.09 1.62
Table 4.7: Summary of results for customer attitudes toward the privilege
that they receive from using the Rabbit SmartPass card
After testing for significant differences among three means via an
Analysis of Variance (ANOVA) (See Appendix F-9: ANOVA table of three
segments, Appendix F-10: Post Hoc test table), there were four variables that had
significant differences among the three means as follows:
- “I know that there is a privilege of using the Rabbit SmartPass
card” was significantly different among the three segments (F(2,213) = 3.74, p < .05).
The mean score of Variety Seeking Passengers (MVariety Seeking Passengers = 3.56) was
significantly higher than the mean score of Active Passengers (MActive Passengers = 2.75).
However, there was no significant difference between the mean score of Variety
Seeking Passengers and the mean score of Social Oriented Passengers (MSocially Oriented
Passengers = 2.92).
- “I am satisfied with the discount for shops and restaurants that
get from the Rabbit SmartPass card” was significantly different among the three
segments (F(2,213) = 3.70, p < .05). The mean score of Variety Seeking Passengers
(MVariety Seeking Passengers = 4.11) was significantly higher than the mean score of Active
Passengers (MActive Passengers = 2.98) and the mean score of Social Oriented Passengers
(MSocially Oriented Passengers = 3.10).
- “I think the Rabbit machine at the station is easy to use” was
significantly different among the three segments (F(2,213) = 4.17, p < .05). The mean
score of Variety Seeking Passengers (MVariety Seeking Passengers = 3.18) was significantly
Ref. code: 25605902040780BMJ

27
higher than the mean score of Active Passengers (MActive Passengers = 2.38) and the mean
score of Social Oriented Passengers (MSocially Oriented Passengers = 2.45).
- “I prefer a cash voucher to a discount when buy something with
the Rabbit SmartPass card” was significantly different among the three segments
(F(2,213) = 6.32, p < .05). The mean score of Variety Seeking Passengers (MVariety
Seeking Passengers = 3.70) was significantly higher than the mean score of Active
Passengers (MActive Passengers = 2.75) and the mean score of Social Oriented Passengers
(MSocially Oriented Passengers = 2.89).
Ref. code: 25605902040780BMJ

28
CHAPTER 5
CONCLUSIONS AND RECOMMENDATIONS
5.1 Research Summary
To summarize, the total respondents of 216 are divided into three segments
based on their lifestyle. Their characteristics are listed below;
5.1.1 Active Passengers
They were mostly 23-30 years old and the rest of them were 31-40
years old. The majority of them were office workers and had an income of 15,000-
30,000 baht per month. They spent 46-60 Bhat per day on the BTS SkyTrain and
mostly rode the BTS in the evening to go home.
These passengers followed an active lifestyle and enjoyed traveling to
discover new experiences. They did not like to stay at home and did not care that
much about trendy and socialization.
5.1.2 Socially Oriented Passengers
Socially oriented passengers were the largest segment. They were
mostly 23-30 years old. The majority were office workers and this segment had the
highest personal income. Even though this segment was the majority of the
respondents, they mostly rode the BTS less than once a week.
These passengers loved social activities. They were addicted to social
media and spent hours every day on Facebook, Instagram, and Twitter. They loved
hanging out with friends and having fun in a crowd. They expressed low interest in
outdoor and adventurous activities.
5.1.3 Variety Seeking Passengers
Variety Seeking Passengers were mostly 23-30 years old. The majority
were office workers and had an income of 15,000-30,000 baht per month. This
segment spend the most on the BTS SkyTrain, which was over 90 baht per day. The
majority of them rode the BTS 1-4 times per week and often rode the BTS in the
evening to go home.
Ref. code: 25605902040780BMJ

29
Passengers in this segment had varied interests including trends,
socializing, activeness, or inactiveness. They loved social media, fashion, and
technology. They also loved trying out new things and discovering fresh experiences.
The study revealed that there were some issues that were important for
the BTS passengers. Therefore, the company should improve these in order to
increase their customers’ satisfaction. The main issues for each process of using the
BTS SkyTrain are as follows:
1. While getting to the automatic gate of the station: There are no
plastic bags to pack umbrellas provided when it rained, the number of the automatics
gates are not enough especially during the rush hour, and the facilities for disabled
people are not available as they were supposed to be.
2. While on the platform: There was no the LED information
board to inform passengers what time the train will come, some stations have no the
barrier between the platform and the train, and the guard who was in charge of
checking a bag was ineffective.
3. While onboard the BTS: They cannot see the station name
clearly, there are not enough handles, and the driver could not drive the train
smoothly.
4. While exiting the station: There at not enough automatic gates.
The main issues for the usage of the Rabbit SmartPass card system are
as follows:
1. The method of payment: They cannot add money to the Rabbit
SmartPass card via mobile application, they disagree when the company cancelled
adding money by using a credit card, and the payment method is inconvenient.
2. The privilege of using the Rabbit SmartPass card: The Rabbit
machine at the station is difficult to use. They do not know that there was any
privilege of using the Rabbit SmartPass card, and they prefer a cash voucher to a
discount when buy something with the Rabbit SmartPass card.
Ref. code: 25605902040780BMJ

30
5.2 Recommendations
Based on the results, the following recommendations are advised from the top
three pain points that the company should consider in order to solve the customer’s
pain and to increase their satisfaction:
Recommendations from the top three issues of the process of using the BTS
skytrain are as follows:
1. The LED information board (MTotal Mean = 4.72): The company should
provide the LED information board (see Figure 5.1) to notify the passengers about the
exact time that the train will arrive both at the station and on the platform. They
considered it as very useful and necessary because this information assists their route
planning.
Figure 5.1: Example of the LED information board from Singapore
2. The barrier between the train and the platform (MTotal Mean = 4.67): The
safety barrier between the train and the platform should be installed at every station.
The passengers said that “Safety” should be put as the first priority because of “Better
be sure than sorry”.
3. Plastic bags to pack umbrellas (MTotal Mean = 4.26): In order to avoid
wet and dirty station floors and trains, the company should provide plastic bags for
passenger to pack umbrellas (see Figure 5.2). They consider this as very necessary.
Ref. code: 25605902040780BMJ

31
Figure 5.2: Example of the umbrella bag dispenser
Recommendations from the top two issues of the usage of the Rabbit
SmartPass card system are as follows:
1. Topping up card online via mobile phone (MTotal Mean = 4.46): The
company should provide the facility that the passengers could top up their card online,
such as a mobile application, website, etc., to make the passengers save time instead
of lining up at the station.
2. Allow passengers top up the BTS SmartPass with a credit card. (MTotal
Mean = 2.36): Recently, the company cancelled topping up card with a credit card.
Many passengers considered this inconvenience and found that it was opposed to the
promotion of paying by the Rabbit SmartPass card.
Moreover, the respondents were divided into three segments. The BTS
SkyTrain should treat them all as equally important. After testing for significant
differences among three means via an ANOVA, they were not significantly different.
The recommendations for each of the segments are as follows:
1. Active Passengers
They followed an active lifestyle and loved traveling. To target this group, the
company should create a campaign that encourage them to travel by the BTS, such as
generating information about attractive places, great foods near the line, hidden gems
in the city, etc., in order to attract them to ride the BTS more. The BTS should set the
Ref. code: 25605902040780BMJ

32
promotion for this campaign such as, buy 1 one day trip ticket get the other one at half
price, etc.
2. Socially Oriented Passengers
They are addicted to social media and love hanging out with friends. To
target this group, the company should create activities through social media. For
example, they could have a “The BTS Lucky Draw Campaign”. When the customer
tops up the Rabbit SmartPass card, they have to post a photo of the receipt with the
hashtag #BTSLuckyRabbit on Facebook, Twitter, or Instragram, and then the
company will draw lots to get a lucky person.
3. Variety Seeking Passengers
They have varied interests. They also love trying out new things and
discovering fresh experiences. To target this group, the company should focus on
creativity For instance, they could create an exciting and surprising event at the Siam
station. To do this, the company might organize a fashion show event with celebrities
or build a pop-up dance floor with a pop star, etc., in order to make a normal day of
office workers more colorful.
Ref. code: 25605902040780BMJ
33
REFERENCES
Arphaaphirom A. (2013). ชวตหลากรส. Bangkok: Bangkokbiz Media, 175.
BTS Group. (2016). An annual report 2016. Retrieved January 6, 2018, from
http://bts.listedcompany.com/misc/form561/20160630-bts-form561-201516-
th.pdf
BTS Group. (2017, May 25). PR & Communication News. Retrieved November 26,
2017, from http://www.bts.co.th/corporate/th/03-news-
pr.aspx?page=5&show=214
BTS Factsheet. (2017). Factsheet. Retrieved December 30, 2017, from
http://bts.listedcompany.com/misc/factsheet/20170816-bts-factsheet-
201617.pdf
Engineeringtoday. (2010, November 28). ประโยชนของรถไฟฟา BTS & MRT. Retrieved
November 27, 2017, from http://palmmy100201008.exteen.com/20101128/15-
bts-mrt
Jitcheang P. (2010). การศกษาการตดสนใจใชบรการรถไฟฟามหานครของประชาชนในเขตกรงเทพมหานคร,
Silpakorn University, 33. Retrieved November 26, 2017, from
http://www.info.ms.su.ac.th/sums02/PDF01/2553/GB/10.pdf
Lheam-Thong. (2017, May 12). วจารณแซด! ภาพทลกทเลคนพการ นงเขนรถขนบนไดเลอนรถไฟฟา.
Retrieved November 26, 2017, from https://news.mthai.com/social-
news/563640.html
Naewna News. (2017, May 25). คนพอใจบรการ BTS 3.84 คะแนน. Retrieved November 26,
2017, from http://www.naewna.com/local/271893
Ref. code: 25605902040780BMJ

34
Pantip. (2017 A, November 17). BTS ขดของระหวางเดอน พ.ย. 59 - พ.ย. 60 ใน 1 ป พงไปกครง มา
ลองดกน. Retrieved November 27, 2017, from https://pantip.com/topic/37097857
Pantip. (2017 B, June 10). จรงๆ แลว ท าไมรถไฟฟา BTS ไมเพมตอกสก 1-2 ตคะ? . Retrieved
November 27, 2017, from https://pantip.com/topic/36552651
Posttoday. (2017, November 22). เผยขอมล 1 ป BTS ขดของ 52 ครง เฉลย 4 ครงตอเดอน. Retrieved
November 27, 2017, from https://www.posttoday.com/social/hot/526620
Samerjai C. (2002). พฤตกรรมผบรโภค. Bangkok: Expernet Publishing. Retrieved
December 12, 2017, from https://books.google.co.th/books?id=fXbkSAA
ACAAJ&dq=ฉตยาพร+เสมอใจ+พฤตกรรมผบรโภค&hl=en&sa=X&ved=0ahUKEwiukt
Kq8b7YAhUD448KHSMhBf4Q6AEIJzAA
Shahaida P. (2012). Gaps Model. Retrieved December 12, 2017, from
https://www.slideshare.net/LILANAGARKOTI/gaps-model
Udommahalarp, N. (March 2010). ปจจยทมผลตอพฤตกรรมของผบรโภคในการใชบตร BTS SmartPass
ของรถไฟฟา BTS ของผบรโภคในเขตกรงเทพมหานคร,115. Retrieved November 27, 2017,
from http://thesis.swu.ac.th/swuthesis/Mark/Nattaporn_U.pdf
Ref. code: 25605902040780BMJ

35
APPENDIXES
Ref. code: 25605902040780BMJ

35
APPENDIX A
IN-DEPTH INTERVIEWS QUESTIONS
1. How often do you ride BTS SkyTrain during weekdays?
2. What do you like and dislike about BTS SkyTrain services and facility before
getting into the automatic gate of the station?
3. What do you like and dislike about BTS SkyTrain services while waiting for
the train?
4. What do you like and dislike about BTS SkyTrain services while onboard the
BTS?
5. What do you like and dislike about BTS SkyTrain services while exiting the
station?
6. How do you add money to your Rabbit SmartPass?
7. Do you like the privilege that you receive from Rabbit SmartPass?
8. Lifestyle questions: Hobbies, Interest, etc.
9. Demographic questions: age, gender, occupation, education, etc.
Ref. code: 25605902040780BMJ
36
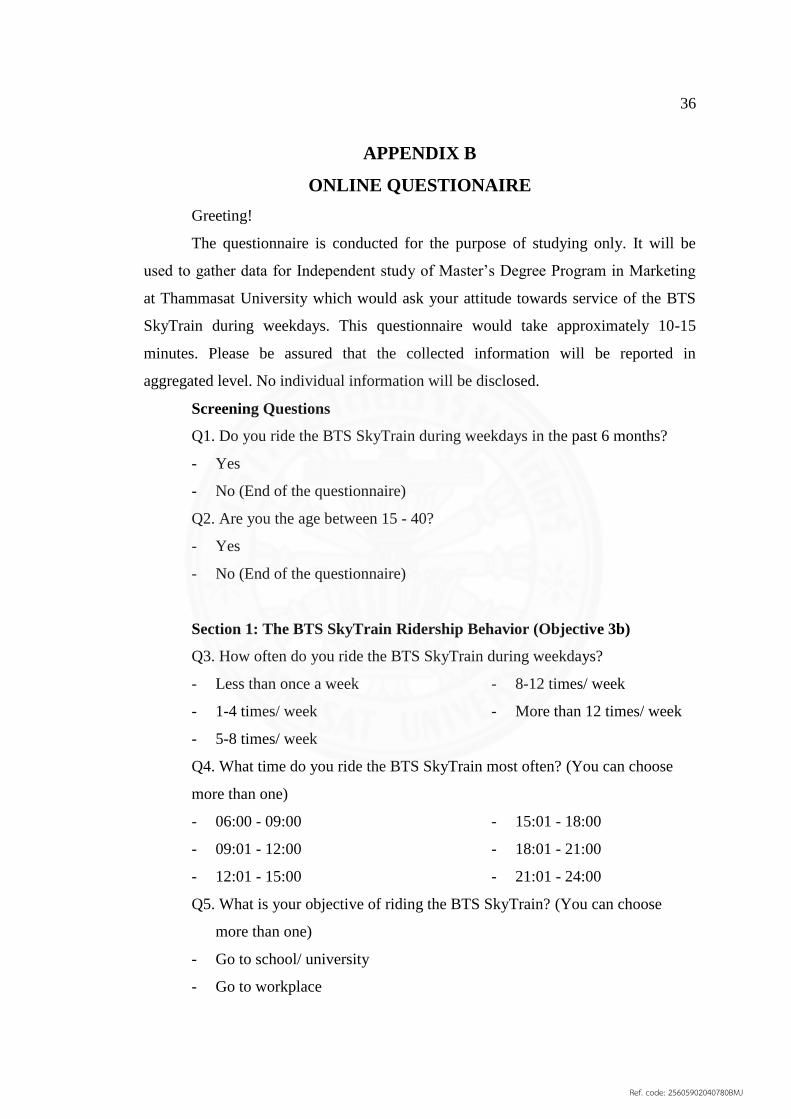
APPENDIX B
ONLINE QUESTIONAIRE
Greeting!
The questionnaire is conducted for the purpose of studying only. It will be
used to gather data for Independent study of Master’s Degree Program in Marketing
at Thammasat University which would ask your attitude towards service of the BTS
SkyTrain during weekdays. This questionnaire would take approximately 10-15
minutes. Please be assured that the collected information will be reported in
aggregated level. No individual information will be disclosed.
Screening Questions
Q1. Do you ride the BTS SkyTrain during weekdays in the past 6 months?
- Yes
- No (End of the questionnaire)
Q2. Are you the age between 15 - 40?
- Yes
- No (End of the questionnaire)
Section 1: The BTS SkyTrain Ridership Behavior (Objective 3b)
Q3. How often do you ride the BTS SkyTrain during weekdays?
- Less than once a week
- 1-4 times/ week
- 5-8 times/ week
- 8-12 times/ week
- More than 12 times/ week
Q4. What time do you ride the BTS SkyTrain most often? (You can choose
more than one)
- 06:00 - 09:00
- 09:01 - 12:00
- 12:01 - 15:00
- 15:01 - 18:00
- 18:01 - 21:00
- 21:01 - 24:00
Q5. What is your objective of riding the BTS SkyTrain? (You can choose
more than one)
- Go to school/ university
- Go to workplace
Ref. code: 25605902040780BMJ

37
- Go to café or co-working space
- Go to meeting
- Go to shopping
- Go to travel
- Go to exercise
- Go to hang out
- Go home
Q6. What is your average spending on the BTS SkyTrain per day?
- Not sure
- Below 15 Baht
- 16-30 Baht
- 31-45 Baht
- 46-60 Baht
- 61-75 Baht
- 76-90 Baht
- Over 90 Baht
Q7. What is your Method of adding money to the BTS SmartPass Card? (You
can choose more than one)
- Not using BTS SmartPass
- Cash
- Credit card
- AIS mPAY Rabbit
- Be1st Smart Rabbit
- Other
Section 2: The customer attitude towards services that BTS offers during
the trip (Objective 2)
Section 2-1: Customer attitudes toward the process before getting to the
automatic gate of the station (Objective 2a)
Q8. Think about your experiences in the BTS station before you get to the
automatic gate. How much do you agree with the following statements?
Ref. code: 25605902040780BMJ

38
Statements
1
Strongly
disagree
2
Disagree
3
Neutral
4
Agree
5
Strongly
agree
1. A staff at the counter is friendly.
2. A staff at the counter is active.
3. A staff at the counter is always available.
4. The information signage is easy to understand.
5. The number of the automatic gates are enough.
6. The BTS should provide a plastic bag for an
umbrella when it rains.
7. I like the shops at the station.
8. The facilities for disabled people are available.
Section 2-2: Customer attitudes toward the services that they receive while on
the platform (Objective 2b)
Q9. Think about your experiences while on the platform of the BTS station.
How much do you agree with the following statements?
Statements
1
Strongly
disagree
2
Disagree
3
Neutral
4
Agree
5
Strongly
agree
1. A guard who is in charge of checking a bag is
effective.
2. I do not have to wait for so long for the train.
3. The number of benches are enough.
4. I think the barrier between train and platform
is important.
5. I think there should be the LED information
board to notice what time the train will come.
Section 2-3: Customer attitudes toward the services that they receive while
onboard the BTS (Objective 2c)
Q10. Think about your experiences while onboard the BTS. How much do you
agree with the following statements?
Ref. code: 25605902040780BMJ

39
Statements
1
Strongly
disagree
2
Disagree
3
Neutral
4
Agree
5
Strongly
agree
1. I do not face with system error often.
2. A driver can drive the train smoothly.
3. The quality of loudspeaker is clear.
4. The number of handles are enough.
5. The air conditioner works well.
6. There is some water that drops from the air
conditioner.
7. The temperature is proper.
8. I can see the station name clearly.
Section 2-4: Customer attitudes toward the services that they receive while
exiting the station (Objective 2d)
Q11. Think about your experiences while exiting the station. How much do you
agree with the following statements?
Statements
1
Strongly
disagree
2
Disagree
3
Neutral
4
Agree
5
Strongly
agree
1. The number of automatic gates are enough.
2. I get a queue jumping from others.
3. I used to get hit by the automatic door.
Section 3: Customer attitudes toward the usage of the Rabbit SmartPass
card system (Objective 3)
Section 3-1: Customer attitudes toward the method of payment (Objective 3a)
Q12. How much do you agree with the following statements?
Ref. code: 25605902040780BMJ

40
Statements
1
Strongly
disagree
2
Disagree
3
Neutral
4
Agree
5
Strongly
agree
1. A payment method is convenient for me.
2. I think the payment method is safety.
3. I hope I could add money via mobile
application.
4. I agree when the BTS cancel adding money
with a credit card.
Section 3-2: Customer attitudes toward the privilege that they receive from
using the Rabbit SmartPass card (Objective 3b)
Q13. How much do you agree with the following statements?
Statements
1
Strongly
disagree
2
Disagree
3
Neutral
4
Agree
5
Strongly
agree
1. I know that there is a privilege of using the
Rabbit SmartPass card.
2. I like when I can turn Rabbit points into
money in the Rabbit SmartPass card.
3. I am satisfied with the discount for shops and
restaurants that get from the Rabbit SmartPass
card.
4. I think the Rabbit machine at the station is
easy to use.
5. I prefer a cash voucher to a discount when buy
something with the Rabbit SmartPass card.
Section 4: The target consumers and their profiles for the BTS SkyTrain
(Objective 1)
Section 4-1: Lifestyle (Objective 1b)
Ref. code: 25605902040780BMJ

41
Q14. How much do you agree with the following statements?
Statements
1
Strongly
disagree
2
Disagree
3
Neutral
4
Agree
5
Strongly
agree
1. I love to drive a car by myself even though
there is a traffic jam.
2. I love fashion
3. I love staying at home when I have free time.
4. I love hanging out with friends.
5. I love outdoor activities.
6. I love going to the recommended restaurant
even though it is far away to the BTS.
7. I love trying new things.
8. I love going to the concert.
9. I am a social media lover.
10. I always keep up to date with technology.
11. I love to slow down and enjoy life.
12. I love traveling to other provinces.
13. I love going to the museums and
archaeological site.
Section 4-2: Demographic (Objective 1a)
Q15. What is your gender?
- Male
- Female
- Other
Q16. What is your age?
- 15-22
- 23-30
- 31-40
Ref. code: 25605902040780BMJ

42
Q17. What is your occupation?
- Student
- Employee
- Government Sector
- Own Business
- Freelance
- Others
Q18. What is your education?
- Below Bachelor Degree
- Bachelor Degree
- Master Degree
- Doctoral Degree
Q19. What is your current status?
- Single
- Married (with kids)
- Married (without kids)
- Separated
- Divorced
- Other
Q19. What is your income?
- Below 15,000 THB
- 15,001 – 30,000 THB
- 30,001 – 45,000 THB
- 45,001 – 60,000 THB
- Above 60,000 THB
- End of Survey -
Ref. code: 25605902040780BMJ

43
APPENDIX C
SUMMARY OF RESPONDENTS PROFILE (n = 216)
Demographics Frequency Percentage
Gender Male 25 11.4
Female 195 88.6
Age 15-22 years old 19 8.6
23-30 years old 107 48.6
31-50 years old 94 42.7
Occupation Student 30 13.6
Office Worker 127 57.7
Government Officer 18 8.2
Business Owner 16 7.3
Freelance 8 3.6
Other 21 9.5
Education
Below Bachelor Degree
Bachelor Degree
Master Degree
Doctoral Degree
19
134
64
3
8.6
60.9
29.1
1.4
Monthly
Income Less than 15,000 THB 32 14.5
15,000 - 30,000 THB 94 42.7
30,001 - 45,000 THB 54 24.5
45,001 - 60,000 THB 15 6.8
More than 60,001 THB 25 11.4
Ref. code: 25605902040780BMJ

44
APPENDIX D
FACTOR ANALYSIS
Rotated Component Matrix
Component
1 2 3 4
I love going to the recommended restaurant
even though it is far away to the BTS. .667
I love to drive a car by myself even though
there is a traffic jam. .551
I love fashion. .551 .452
I always keep up to date with technology. .525 .359
I love trying new things. .499
I am a social media lover. .768
I love going to the concert. .766
I love outdoor activities. .735
I love traveling to other provinces. .312 .642
I love going to the museums and
archaeological sites. .634 .314
I love living the slow life. .724
I love staying at home when I have free time. .645
I love hanging out with friends. .307 -.350
Ref. code: 25605902040780BMJ

45
APPENDIX E
CLUSTER ANALYSIS
APPENDIX E-1: Cluster Analysis Result
Final Cluster Center
Number of Cases in each Cluster
Frequency Percentage
Cluster Active Passengers 53 24.1%
Socially Oriented Passengers 106 48.2%
Variety Seeking Passengers 57 25.9%
Valid 216 98.2%
Missing 4 1.8%
Ref. code: 25605902040780BMJ

46
APPENDIX E-2: Demographic Profile of Three Clusters
Demographic
Active
Passengers
(n = 53)
Socially
Oriented
Passengers
(n = 106)
Variety
Seeking
Passengers
(n = 57)
n % n % n %
Gender Male 9 17% 13 12% 2 4%
Female 44 83% 93 88% 55 96%
53 100% 106 100% 57 100%
Age 15-22 years old 1 2% 11 10% 6 10%
23-30 years old 28 53% 50 47% 27 47%
31-50 years old 24 45% 45 43% 24 43%
53 100% 106 100% 57 100%
Occupation Student 5 10% 14 13% 10 18%
Office Worker 28 53% 63 59% 34 60%
Government Officer 6 11% 6 6% 6 10%
Business Owner 5 9% 9 8% 2 4%
Freelance 2 4% 5 5% 0 0%
Other 7 13% 9 9% 5 8%
53 100% 106 100% 57 100%
Education Below Bachelor Degree
Bachelor Degree
Master Degree
Doctoral Degree
1
35
17
0
2%
66%
32%
0%
11
59
34
2
10%
56%
32%
2%
6
37
13
1
10%
65%
23%
2%
53 100% 106 100% 57 100% Monthly
Income Less than 15,000 THB 4 8% 20 19% 7 12%
15,000 - 30,000 THB 25 47% 41 39% 26 45%
30,001 - 45,000 THB 13 25% 25 24% 15 26%
45,001 - 60,000 THB 5 9% 5 4% 5 9%
More than 60,001 THB 6 11% 15 14% 4 7%
53 100% 106 100% 57 100%
Ref. code: 25605902040780BMJ

47
APPENDIX F
ANALYSIS OF VARIANCE
APPENDIX F-1: ANOVA table of three cluster
Sum of
Squares df
Mean
Square F Sig.
A staff at the
counter is
always
available.
Between Groups 15.183 2 7.591 7.825 .001
Within Groups 206.651 213 .970
Total 221.833 215
The BTS
should provide
a plastic bag
for an
umbrella when
it rains.
Between Groups 7.058 2 3.529 4.213 .016
Within Groups 178.424 213 .838
Total 185.481 215
APPENDIX F-2: Post Hoc test table of three cluster
Dependent Variable I J
Mean
Difference
(I-J) Std. E Sig.
A staff at the counter
is always available.
Active
Passengers
Social Oriented
Passengers -.43396* .16571 .026
Variety Seeking
Passengers -.74015* .18795 .000
Social Oriented
Passengers
Active
Passengers .43396* .16571 .026
Variety Seeking
Passengers -.30619 .16178 .143
Variety
Seeking
Passengers
Active
Passengers .74015* .18795 .000
Social Oriented
Passengers .30619 .16178 .143
Ref. code: 25605902040780BMJ

48
Active
Passengers
Social Oriented
Passengers -.40566* .15397 .024
The BTS should
provide a plastic bag
for an umbrella
when it rains.
Variety Seeking
Passengers -.44257* .17465 .032
Social Oriented
Passengers
Active
Passengers .40566* .15397 .024
Variety Seeking
Passengers -.03691 .15033 .967
Variety
Seeking
Passengers
Active
Passengers .44257* .17465 .032
Social Oriented
Passengers .03691 .15033 .967
APPENDIX F-3: ANOVA table of three cluster
Sum of
Squares df
Mean
Square F Sig.
I do not have
to wait for so
long for the
train.
Between Groups 28.999 2 14.500 11.582 .000
Within Groups 266.663 213 1.252
Total 295.662 215
I think there
should be the
LED
information
board to notice
what time the
train will
come.
Between Groups 3.359 2 1.680 5.081 .007
Within Groups 70.414 213 .331
Total
73.773 215
APPENDIX F-4: Post Hoc test table of three cluster
Dependent Variable I J
Mean
Difference
(I-J) Std. E Sig.
A staff at the counter
is always available.
Active
Passengers
Social Oriented
Passengers .16981 .18823 .640
Variety Seeking
Passengers -.70341* .21351 .003
Social Oriented
Passengers
Active
Passengers -.16981 .18823 .640
Variety Seeking
Passengers -.87322* .18378 .000
Ref. code: 25605902040780BMJ

49
Variety
Seeking
Passengers
Active
Passengers .70341* .21351 .003
Social Oriented
Passengers .87322* .18378 .000
Active
Passengers
Social Oriented
Passengers -.40566* .15397 .024
The BTS should
provide a plastic bag
for an umbrella
when it rains.
Variety Seeking
Passengers -.44257* .17465 .032
Social Oriented
Passengers
Active
Passengers .40566* .15397 .024
Variety Seeking
Passengers -.03691 .15033 .967
Variety
Seeking
Passengers
Active
Passengers .44257* .17465 .032
Social Oriented
Passengers .03691 .15033 .967
APPENDIX F-5: ANOVA table of three cluster
Sum of
Squares df
Mean
Square F Sig.
The quality of
loudspeaker is
clear.
Between Groups 10.456 2 5.228 4.07 .018
Within Groups 273.378 213 1.283
Total 283.833 215
The air
conditioner
works well.
Between Groups 9.693 2 4.847 5.21 .006
Within Groups 198.302 213 .931
Total 207.995 215
The
temperature is
proper.
Between Groups 8.003 2 4.001 3.72 .026
Within Groups 229.090 213 1.076
Total 237.093 215
APPENDIX F-6: Post Hoc test table of three cluster
Dependent Variable I J
Mean
Difference
(I-J) Std. E Sig.
Active
Passengers
Social Oriented
Passengers -.32075 .17036 .175
Ref. code: 25605902040780BMJ

50
The quality of
loudspeaker is clear.
Variety Seeking
Passengers -.61701* .20795 .011
Social Oriented
Passengers
Active
Passengers .32075 .17036 .175
Variety Seeking
Passengers -.29626 .19954 .365
Variety
Seeking
Passengers
Active
Passengers .61701* .20795 .011
Social Oriented
Passengers .29626 .19954 .365
Active
Passengers
Social Oriented
Passengers -.37736 .16232 .055
The air conditioner
works well
Variety Seeking
Passengers -.58491* .18412 .005
Social Oriented
Passengers
Active
Passengers .37736 .16232 .055
Variety Seeking
Passengers -.20755 .15848 .391
Variety
Seeking
Passengers
Active
Passengers .58491* .18412 .005
Social Oriented
Passengers .20755 .15848 .391
Active
Passengers
Social Oriented
Passengers -.05660 .14803 .974
The temperature is
proper.
Variety Seeking
Passengers -.47137* .18211 .033
Social Oriented
Passengers
Active
Passengers .05660 .14803 .974
Variety Seeking
Passengers -.41476 .18497 .079
Variety
Seeking
Passengers
Active
Passengers .47137* .18211 .033
Social Oriented
Passengers .41476 .18497 .079
APPENDIX F-7: ANOVA table of three cluster
Sum of
Squares df
Mean
Square F Sig.
A payment
method is
convenient for
me.
Between Groups 26.719 2 13.360 7.805 .001
Within Groups 364.609 213 1.712
Total 391.329 215
Ref. code: 25605902040780BMJ

51
I think the
payment
method is
safety.
Between Groups 12.076 2 6.038 6.902 .001
Within Groups 186.350 213 .875
Total 198.426 215
I hope I could
add money via
mobile
application.
Between Groups 4.545 2 2.272 3.875 .022
Within Groups 124.895 213 .586
Total 129.440 215
APPENDIX F-8: Post Hoc test table of three cluster
Dependent Variable I J
Mean
Difference
(I-J) Std. E Sig.
A payment method
is convenient for
me.
Active
Passengers
Social Oriented
Passengers .17925 .19719 .744
Variety Seeking
Passengers -.66137* .22775 .013
Social Oriented
Passengers
Active
Passengers -.17925 .19719 .744
Variety Seeking
Passengers -.84062* .22435 .001
Variety
Seeking
Passengers
Active
Passengers .66137* .22775 .013
Social Oriented
Passengers .84062* .22435 .001
Active
Passengers
Social Oriented
Passengers -.18868 .13654 .426
I think the payment
method is safety.
Variety Seeking
Passengers -.63357* .15455 .000
Social Oriented
Passengers
Active
Passengers .18868 .13654 .426
Variety Seeking
Passengers -.44489* .16028 .019
Variety
Seeking
Passengers
Active
Passengers .63357* .15455 .000
Social Oriented
Passengers .44489* .16028 .019
Active
Passengers
Social Oriented
Passengers -.23585 .12882 .162
I hope I could add
money via mobile
application.
Variety Seeking
Passengers -.40516* .14612 .017
Social Oriented
Passengers
Active
Passengers .23585 .12882 .162
Ref. code: 25605902040780BMJ

52
Variety Seeking
Passengers -.16931 .12577 .371
Variety
Seeking
Passengers
Active
Passengers .40516* .14612 .017
Social Oriented
Passengers .16931 .12577 .371
APPENDIX F-9: ANOVA table of three cluster
Sum of
Squares df
Mean
Square F Sig.
I know that there
is a privilege of
using the Rabbit
SmartPass card.
Between Groups 21.197 2 10.599 3.742 .025
Within Groups 603.243 213 2.832
Total 624.440 215
I am satisfied
with the discount
for shops and
restaurants that
get from the
Rabbit SmartPass
card.
Between Groups 17.656 2 8.828 4.286 .015
Within Groups 438.769 213 2.060
Total
456.426 215
I think the Rabbit
machine at the
station is easy to
use.
Between Groups 23.662 2 11.831 4.166 .017
Within Groups 604.963 213 2.840
Total 628.625 215
I prefer a cash
voucher to a
discount when
buy something
with the Rabbit
SmartPass card.
Between Groups 31.576 2 15.788 6.317 .002
Within Groups 532.383 213 2.499
Total 563.958 215
APPENDIX F-10: Post Hoc test table of three cluster
Dependent Variable I J
Mean
Difference
(I-J) Std. E Sig.
I know that there is a
privilege of using
the Rabbit
SmartPass card.
Active
Passengers
Social Oriented
Passengers -.16981 .28312 .820
Variety Seeking
Passengers -.80669* .32113 .034
Social Oriented
Passengers
Active
Passengers .16981 .28312 .820
Ref. code: 25605902040780BMJ

53
Variety Seeking
Passengers -.63688 .27641 .057
Variety
Seeking
Passengers
Active
Passengers .80669* .32113 .034
Social Oriented
Passengers .63688 .27641 .057
Active
Passengers
Social Oriented
Passengers -.12264 .24145 .868
I am satisfied with
the discount for
shops and
restaurants that get
from the Rabbit
SmartPass card.
Variety Seeking
Passengers -.72062* .27387 .025
Social Oriented
Passengers
Active
Passengers .12264 .24145 .868
Variety Seeking
Passengers -.59798* .23574 .032
Variety
Seeking
Passengers
Active
Passengers .72062* .27387 .025
Social Oriented
Passengers .59798* .23574 .032
Active
Passengers
Social Oriented
Passengers -.12264 .22243 .927
I think the Rabbit
machine at the
station is easy to use.
Variety Seeking
Passengers -.72062* .25204 .015
Social Oriented
Passengers
Active
Passengers .12264 .22243 .927
Variety Seeking
Passengers -.59798* .24205 .044
Variety
Seeking
Passengers
Active
Passengers .72062* .25204 .015
Social Oriented
Passengers .59798* .24205 .044
Active
Passengers
Social Oriented
Passengers -.07547 .28352 .962
I prefer a cash
voucher to a
discount when buy
something with the
Rabbit SmartPass
card.
Variety Seeking
Passengers -.79808* .32158 .037
Social Oriented
Passengers
Active
Passengers .07547 .28352 .962
Variety Seeking
Passengers -.72261* .27681 .026
Variety
Seeking
Passengers
Active
Passengers .79808* .32158 .037
Social Oriented
Passengers .72261* .27681 .026
Ref. code: 25605902040780BMJ

54
BIOGRAPHY
Name Miss Kanit Vannasiri
Date of Birth December 15, 1989
Educational Attainment
2016-2018: Master of Science in Marketing
(MIM), Thammasat University
2012: Bachelor Degree of Urban Planning,
Faculty of Architecture, Chulalongkorn
University
Work Position Urban Architect
Group Three Design Co., Ltd.
Work Experiences 2012 – Present: Urban Architect
Group Three Design Co., Ltd.
Ref. code: 25605902040780BMJ