curriculum alignment among the intended, enacted and
TRANSCRIPT

_______________________________________________________________
72Journal of the Canadian Association for Curriculum Studies (JCACS) Volume 15, Number 1, 2017
_________________________________________________________________
Curriculum Alignment Among the Intended, Enacted and
Assessed Curricula for Grade 9 Mathematics
Paolina Seitz St Mary’s University
Abstract: This study examined curriculum alignment among the intended, the enacted, and the assessed curricula in Grade 9 mathematics in two domains: content/operations and cognitive processes. The Program of Studies was used to determine the content/ operations and the Delphi method was used to identify the cognitive levels for the intended curriculum. Classroom observations were used to capture the enacted curriculum. End of unit tests were used to determine the assessed curriculum. Results indicated that curriculum alignment among the intended, enacted and assessed curricula for the mathematics content/operations was high (97% alignment). In contrast, curriculum alignment among the intended, enacted, and assessed curricula for the cognitive processes was low (7.3% alignment). This study makes a contribution towards understanding the quality of the relationship among the intended, enacted, and assessed curricula in mathematics education. The methodological framework provides a model for subsequent research on curriculum alignment among the three components of the education system.
Keywords: curriculum alignment; content/operations; cognitive processes
Seitz
JCACS 73
he first time I heard the word “alignment” was in reference to the wheels on my father’s automobile. When its wheels are aligned, an automobile moves unobstructedly in the intended direction. Likewise, when learner expectations (standards), instruction, and
assessment are aligned, there is the potential to aid the learning and achievement of students (Porter & Smithson, 2002; Anderson, 2002; Martone & Sireci, 2009). Of course, curriculum alignment is much more complex than that of automobile wheels.
The word "curriculum" has many meanings in educational research. Curriculum can refer to all courses offered at a school. Kerr (1999) describes curriculum as all the learning of students that is guided by the school. Marsh and Willis (2003) suggest that curriculum includes the totality of learning experiences provided to students in order to attain general knowledge and skills. Curriculum may refer to a specific course of studies offered in a school. For example, an elementary school might discuss how its curriculum for mathematics at the primary level (Grades 1 to 3) is designed help students learn the basic operations of addition, subtraction, multiplication, and division of whole numbers up to 10,000. Another view breaks curriculum into three sequentially ordered parts. What societies envisage as important to learn constitutes the “official” or "intended" curriculum. What is delivered in the classroom constitutes the "implemented" or “enacted” curriculum. What students learn constitutes the "achieved" or “assessed” curriculum (Porter, 2002).
The word alignment was defined by Webb (2002) as the degree “to which learner expectations and assessments are in agreement and serve in conjunction with one another to guide the system towards students learning of what they are expected to know and do” (p. 1). Later, Roach, Niebling, and Kurz (2008) defined alignment “as the extent to which curricular expectations and assessments are in agreement and work together to provide guidance to educators’ efforts to facilitate students’ progress toward desired academic outcomes” (p. 1). Both definitions include “curricular expectations” which refer to the learner outcomes or standards. It is the intended curriculum (the standards) that determines both the enacted and the assessed curricula.
While some researchers have examined the alignment between the intended and assessed curricula (Moss, 1999; Webb, 2002; McGehee & Griffith, 2001) or between enacted and assessed curricula (Blank, Porter, & Smithson, 2001; Keokane, 2008), other researchers have argued that the enacted curriculum provides an explanation for the presence or lack of presence of alignment between learner expectations and assessment (Anderson, 2002; Elmore & Rothman, 1999; Elliott, Braden, & White, 2001; `Pellegrino, 2006; Smith & O’Day, 1991; Webb, 1997). For example, while assessment results may be low because of student background factors, they may also be low due to a lack of alignment among the learner expectations, what was taught, and what was assessed. Therefore, it is important that there be a strong and valid alignment among the expectations of the content to be learned, the cognitive skills to be acquired, the instruction designed to provide students with the opportunity to acquire desired knowledge and skills, and the assessment instruments used to determine if the students have acquired the desired knowledge and skills (Ananda, 2003; Resnick, Rothman, Lattery, & Vranek, 2003). Further, given a standards-based education system, used to hold school districts and schools accountable (Fuhrman, 2001), it is
T

Curriculum Alignment
JCACS 74
important that the intended, enacted, and assessed curricula align to achieve the intended goals (see also Anderson (2002) and Squires (2012). Tindal, Cipoletti, and Almond (2005) indicated that results of an alignment study might be used to identify areas where learning expectations may need to be clarified so that progression of knowledge across grades is more evident. Results of an alignment study may also be used in deciding whether restructuring of an assessment is necessary or not. If restructuring is necessary, alignment results would help to identify what changes need to be made in the intended, enacted, and assessed curricula.
While the position papers and guidelines presented support the alignment of the intended, enacted, and assessed curricula, there are very few empirical studies that measure curriculum alignment among the intended, the enacted, and the assessed curricula (Squires, 2008). Kurz, Elliott, Wehby, and Smithson (2010) examined the alignment among the content of the intended, enacted, and assessed curricula for eighth-grade mathematics. Results indicated that alignment for the intended and enacted curriculum was low. However, they found significant correlations between student achievement when the enacted and assessed curricula were aligned for the three formative assessments and the state assessment.
The purpose of the present study was to examine the degree of alignment among the intended, enacted, and assessed curricula for the Patterns and Relations strand included in Grade 9 Mathematics in the province of Alberta. The alignment was examined for both the content/operations to be learned and the cognitive skills to be acquired by the students.
Method
A mixed-method design (Creswell & Clark. 2011) was used to answer the following two questions:
• Given that the cognitive process levels are not provided in the Program of Studies for Grade 9 mathematics, what are the levels of cognitive processing as defined in the Taxonomy for Learning, Teaching, and Assessing: A revision of Bloom’s Taxonomy of Educational Objectives (Anderson, Krathwohl, Airasian, Cruikshank, Mayer, Pintrich, Raths, & Wittrock, 2001) corresponding to each of the learning expectations for the Patterns and Relations strand for Grade 9 Mathematics?
• What is the degree of alignment among the intended curriculum, the enacted curriculum, and the assessed curriculum for both the mathematics content and cognitive processes included in the Patterns and Relations strand?
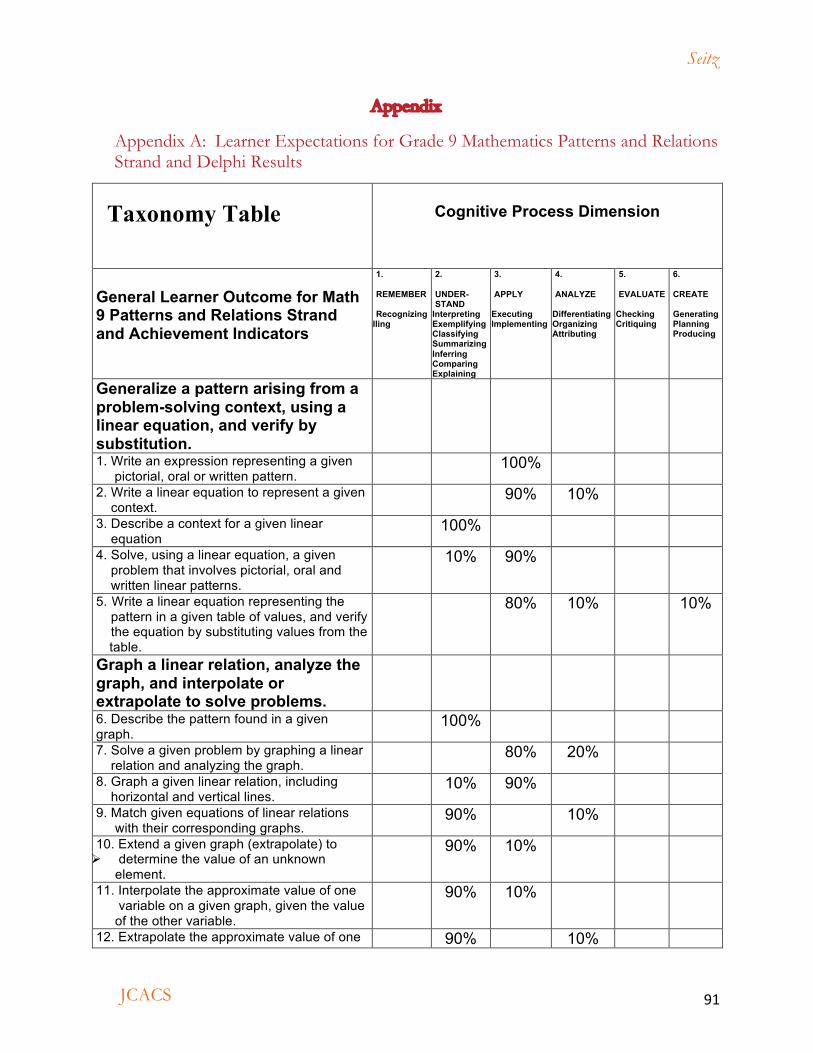
A 2 x 2 taxonomy table, was created that included the 45 learner expectations from the Patterns and Relations strand in the rows and the six cognitive process dimensions from the revised Taxonomy of Educational Objectives (Anderson, et al., 2001) in the columns (See Appendix A). This table, which reflects the intended curriculum, was then used to organize the information collected from the classroom observations, teacher surveys, teacher interviews, and the end of unit assessments used by the teachers for the end of unit assessment for the Patterns and Relations strand. The completed table was then used to determine the degree of alignment between the

Seitz
JCACS 75
intended curriculum, the enacted curriculum, and the assessed curriculum for both content/operations and cognitive processes.
Creation of the Intended Curriculum
The Delphi method (Dalkey & Helmer, 1963) was used to determine the cognitive process called for by each of the 45 learning expectations for the Pattern and Relations strand. A panel of 10 experienced Grade 9 mathematics teachers who were independently geographically distributed placed the learner expectations in the cells of a 2 x 2 taxonomy table. The panel members returned their tables to the researcher, who determined the proportion of panel members who placed a learning expectation in the same cell in the Taxonomy Table. The summary and each judge’s initial taxonomy table was sent to each judge separately. Second and third rounds were conducted following the same procedures, and 88% overall agreement was reached. Appendix A contains a listing of the 45 learner expectations and the Round 3 results. The final placement of each learning expectation within a cognitive level was determined either unanimously or by the majority of the panel members.
Collecting Information about the Enacted and Assessed Curricula
The sample of teachers to determine the enacted and assessed curricula was a convenience sample. Six teachers from a geographically large school district in southern Alberta were invited to be part of the study. Five teachers agreed. A number of instruments were used to collect the data, as shown in the table below.
Table 1: Data Collection Instruments
Intended Curriculum Enacted Curriculum Assessed Curriculum
Taxonomy Table Teacher Survey Teacher Survey
Classroom Observations Teacher End of the Unit test
Teacher Interviews Assessments administered during the instructional period
Teacher Unit Plans
Assessments administered during the instructional period
The teacher survey, which was based on the Survey of Enacted Curriculum (SEC) model (Porter & Smithson, 2001), consisted of three parts. In Part I, teachers indicated for each learner expectation, whether or not they provided an opportunity for the students to learn the content in the learning

Curriculum Alignment
JCACS 76
expectations, and at what cognitive level the students were engaged (Remembering, Understanding, Applying, Analyzing, Evaluating, or Creating), and the emphasis (1– Some Emphasis, 2 - Moderate Emphasis, 3 – Strong Emphasis) they gave to the teaching the learner expectation. For example, for the learner expectation, demonstrate the differences between the exponent and the base by building models of a given power, such as 23 and 32, the teachers were asked to indicate if they taught it and, if so, the level of cognitive complexity the students were engaged in and the emphasis the teacher gave to it. Part II asked about teachers’ practices for planning, teaching, and assessing. Part III asked about teacher characteristics to allow a description of the sample of teachers. The teacher survey was administered at the end of their teaching of the Patterns and Relations strand.
Three retired mathematics teachers, and the researcher conducted the classroom observations. A checklist was used to record the data during the classroom observations. The researcher conducted a training session outlining the observation process and explained the checklist the observers were to use every time they observed a class. The checklist allowed the observers to record the content of the learner expectations and the cognitive levels that were engaged. Space was provided for each learner outcome for the observers to enter additional comments. Each class was observed each day for the duration of the Patterns and Relations strand. The first observation was a warm-up observation during which the teacher and the students had a chance to get used to a visitor in the classroom. The remaining visits involved making observations. A brief discussion of what was observed for each visit was shared with the teacher to ensure that the teacher agreed with what was recorded by the observer for that particular class.
The number of weeks the teachers taught the strand differed with one teacher needing seven weeks, one needing eight weeks, one needing 12 weeks and two teachers needing 10 weeks. Mathematics 9 was taught for five 40- minute periods per week in two of the schools and seven 44-minute periods per week in the other schools. Altogether, a total of 238 classroom observations were made.
Unit plans and the assessment instruments the teachers used during the time they taught the Patterns and Relations unit and the assessment instrument they administered at the end of the unit were collected. Following completion of the observations, each instructional activity and each item on the end of unit assessment instrument were independently placed in the appropriate cell of the same 2x2 Taxonomy Table (Appendix A) by one of the observers and the researcher.
After completion of the placement of the instructional activities and items in the Taxonomy Table (see Data Analysis), the observed teachers were separately interviewed to discuss the observation data for their classes, what was written in their unit plans, and the items in their end-of-unit assessment instruments. A semi-structured teacher interview was used. The length of the interviews varied from 30 to 60 minutes. The researcher conducted all interviews, which were audio recorded, and with notes taken during the interviews. The responses to the interview questions were transcribed with each line numbered to facilitate retrieving and making quotes and references. The researcher and one of the classroom observers independently coded the transcriptions with the assistance of the written notation of the conversation taken during the interview and guided by the
Seitz
JCACS 77
two dimensions in the Taxonomy Table. Through discussion, consensus between the two coders was reached for codes that differed.
Data Analysis
The quantitative data from the surveys and qualitative data collected during the classroom observations, the interviews, and the unit tests were merged to obtain a complete view of the enacted and the assessed curricula for the Patterns and Relations strand. First, the teacher survey data was matched with the unit plans and lesson plans. Second, data and information from the lesson plans were matched with classroom observations, and the interviews. The results of the final quantitative and qualitative databases were compared using a side-by-side summary table (Creswell & Clark, 2011). The merged data for the enacted curriculum was entered independently into the Taxonomy Table by the researcher and by one of the classroom observers. There was 96% agreement with the learner expectations and 85.5% agreement with the cognitive levels. The two files were reviewed until 100% agreement was reached.
At this point, three sub-tables were created, one for the intended curriculum, one for the enacted curriculum, and one for the assessed curriculum. (The intended curriculum, the enacted curriculum, and the assessed curriculum tables are included in the results section). The base for the index that reflected the overall alignment among the intended, enacted, and assessed curriculum was the total number of items administered in the end of unit assessments. Two indices were computed, one of mathematics content and operations and the second for the cognitive processes.
1. The mathematics content and operations index was the ratio of the total number of teachers who taught the learner expectation given they assessed the learner expectation to the total number of learner expectations. If the mathematics content and operations index was close to or equaled 1.00, then there was full curriculum alignment among the intended, enacted, and assessed curricula across the five teachers.
2. The cognitive process index was the ratio of the total number of teachers who taught the intended cognitive process for a learner expectation given they assessed the learner expectation at the intended cognitive level to the total number of items. If the cognitive process index was close to or equaled 1.00, then there was full curriculum alignment among the intended, enacted, and assessed curricula across the five teachers.
Results
Enacted Curriculum
Content/Operations
With one exception, the classroom observations indicated that the five teachers taught all but a few of the 45 Patterns and Relations learner expectations. Teacher A taught all but learning expectation 44. Teacher B taught all the learner expectations but 33, 40, and 44. Teacher C taught all
Curriculum Alignment
JCACS 78
learner expectations but 23, 29, 30, 32, 33, 37, 38, 40, and 44. However, when questioned as to why these learner outcomes were not taught, the teacher expressed that he/she believed that they were taught in another segment of the course. Teacher D taught all the learner expectations but 15 and 44. Teacher E taught all the learner outcomes. Taken together, the results suggest that the enacted curriculum defined in terms of mathematics content (elements and operations) set out in the learner expectations was essentially aligned with the intended curriculum defined in terms of the mathematics content as identified in the learning expectations. With one exception, the teachers indicated during their interviews that they provided their students with an opportunity to learn the mathematics contents and operations identified in the 45 learner expectations for the Patterns and Relations strand. Teacher D indicated that she/he did not provide an opportunity to learn learner expectation 32. While these results confirm what the observers found, the enacted curriculum defined in terms of mathematics content/operations set out in the learner expectations was essentially aligned with the intended curriculum defined in terms of the mathematics content identified in the learning expectations.
Cognitive Process
In contrast, there was variability among the cognitive process levels at which the teachers taught the learner expectations as observed by the classroom observers for most learner expectations. There were only three learner expectations – 12, 13, and 20 – that all five teachers taught at the same cognitive level to their students and only nine learner expectations that four of the five teachers taught at the same cognitive level. No more than three teachers taught the same cognitive levels for the remaining 33 learner expectations.
Clearly, there is unwanted variation in the cognitive processes observed being taught to students. Likewise, there was significant variability among the cognitive levels at which each learner expectation was taught as reported by the teachers. For example, for the first learner expectation, Teacher A taught it at the cognitive level Understand, Teachers B taught it at the cognitive level Create. There was no learning expectation that five teachers reported having taught at the same cognitive level. There were only seven expectations – 2, 7, 8, 13, 20, 28, and 31 – that four of the five teachers taught at the same cognitive level. For the remaining 37 learning expectations, no more than three teachers indicated they taught at the same cognitive level.
During the interviews, teachers were asked what they did to help students see and understand higher order cognitive processes for the learning outcomes that called for higher order thinking. Their answers varied. Teacher A used past Provincial Achievement Test questions to challenge the students. Teacher B expressed her/his belief that they had covered all the learning outcomes but noticed that they tended to stay more at the lower three cognitive levels. Teachers B felt that teaching higher order thinking skills and problem solving presented the greatest challenge. She/he commented that teachers need to make a conscious effort to teach these higher order thinking skills because students tended to want the answer given to them and it was sometimes easier to cater to the students rather than have them develop their own solutions. The teacher went on to say that it
Seitz
JCACS 79
was “a reminder that work needs to be done at the higher levels”. Teacher C taught the students the basic concepts then the students went over the material on their own and they decided how it was relevant to them. Teacher D had the students explain their thought processes, or had them solve problems on the board and then led a discussion on why the answer was correct or incorrect. Teacher E stated, “my favorite way is to have students create their own patterns and give these patterns to their peers to solve on the board, and then discuss them as a whole class.”
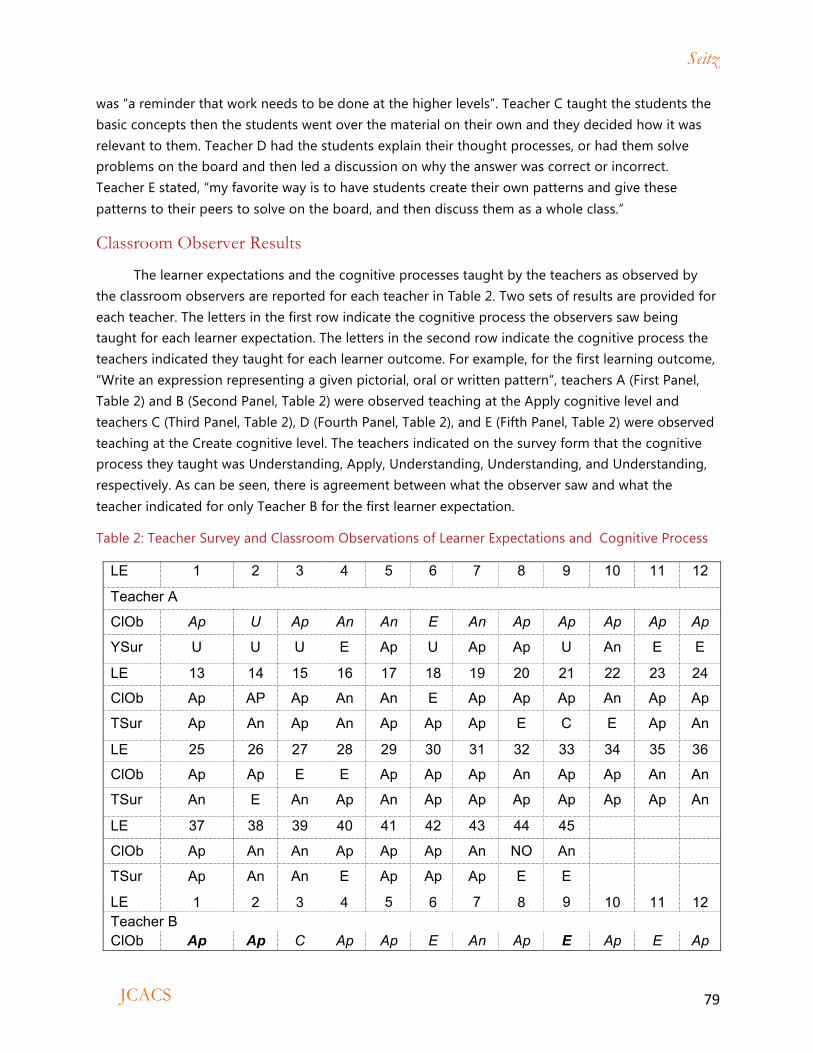
Classroom Observer Results
The learner expectations and the cognitive processes taught by the teachers as observed by the classroom observers are reported for each teacher in Table 2. Two sets of results are provided for each teacher. The letters in the first row indicate the cognitive process the observers saw being taught for each learner expectation. The letters in the second row indicate the cognitive process the teachers indicated they taught for each learner outcome. For example, for the first learning outcome, “Write an expression representing a given pictorial, oral or written pattern”, teachers A (First Panel, Table 2) and B (Second Panel, Table 2) were observed teaching at the Apply cognitive level and teachers C (Third Panel, Table 2), D (Fourth Panel, Table 2), and E (Fifth Panel, Table 2) were observed teaching at the Create cognitive level. The teachers indicated on the survey form that the cognitive process they taught was Understanding, Apply, Understanding, Understanding, and Understanding, respectively. As can be seen, there is agreement between what the observer saw and what the teacher indicated for only Teacher B for the first learner expectation.
Table 2: Teacher Survey and Classroom Observations of Learner Expectations and Cognitive Process
LE 1 2 3 4 5 6 7 8 9 10 11 12
Teacher A
ClOb Ap U Ap An An E An Ap Ap Ap Ap Ap
YSur U U U E Ap U Ap Ap U An E E
LE 13 14 15 16 17 18 19 20 21 22 23 24
ClOb Ap AP Ap An An E Ap Ap Ap An Ap Ap
TSur Ap An Ap An Ap Ap Ap E C E Ap An
LE 25 26 27 28 29 30 31 32 33 34 35 36
ClOb Ap Ap E E Ap Ap Ap An Ap Ap An An
TSur An E An Ap An Ap Ap Ap Ap Ap Ap An
LE 37 38 39 40 41 42 43 44 45 ClOb Ap An An Ap Ap Ap An NO An
TSur Ap An An E Ap Ap Ap E E
LE 1 2 3 4 5 6 7 8 9 10 11 12 Teacher B ClOb Ap Ap C Ap Ap E An Ap E Ap E Ap

Curriculum Alignment
JCACS 80
TSur Ap Ap An An An An Ap An E An An An LE 13 14 15 16 17 18 19 20 21 22 23 24 ClOb Ap Ap Ap Ap Ap Ap Ap Ap Ap Ap Ap Ap TSur An An E An An An An Ap An An An An LE 25 26 27 28 29 30 31 32 33 34 35 36 ClOb Ap Ap Ap Ap Ap Ap Ap Ap NO Ap Ap Ap TSur An E Ap An Ap An An Ap An Ap Ap An LE 37 38 39 40 41 42 43 44 45 ClOb Ap Ap Ap NO Ap Ap U NO An TSur An An An An Ap An An E E LE 1 2 3 4 5 6 7 8 9 10 11 12 Teacher C ClOb Ap U Ap An An E An Ap Ap Ap Ap Ap TSur U U U E Ap U Ap Ap U An E E LE 13 14 15 16 17 18 19 20 21 22 23 24 ClOb Ap Ap Ap An An E Ap Ap Ap An Ap Ap TSur Ap An Ap An Ap Ap Ap E C E Ap An
Notes: LE – Learner Expectations Cognitive Process: R – Remember, U – Understand, Ap – Apply, An – Analyze, E – Evaluate, and C – Create ClOb - Classroom Observations TSur - Teacher Survey NO - not observed
Assessed Curriculum
The assessed curriculum was defined by the end-of-unit test or sequentially ordered tests administered during the unit. Although the teachers indicated that the district team created an end of the unit summative test, only one teacher used the district test. Teachers A, C, and D used an end of the unit test that they created together. Teacher B did not use an end of the unit test, per se. Rather, Teacher B used a series of progressive tests, each test covering a segment of the learner expectations. Teacher E used the district test.
The researcher and one of the classroom observers independently determined the classification of the learner expectations that were assessed and the cognitive processing levels called for by each item included in each of the three tests. There was 96% agreement with the learner expectations and 85.5% agreement with the cognitive levels. Following discussion, 100% agreement was reached for both the classification of the learner expectations and the cognitive levels.
The test created by Teachers A, C, and D consisted of 22 multiple-choice items and four numeric response items assessing 18 of the 45 learner outcomes. As shown in Table 3, the learner expectations that were assessed were: 4, 5, 6, 7, 9, 13, 15, 19, 20, 23, 25, 29, 31, 34, 35, 37, 41, and 42. Two learner expectations were assessed at the cognitive level Remember, 11 learner expectations were assessed at the cognitive level Understand, eight learner expectations were assessed at the cognitive level Apply, three learner expectations were assessed at the cognitive level Analyze, and

Seitz
JCACS 81
one learner expectation was assessed at the cognitive level Evaluate. There were three learner expectations that were assessed more than once. Four questions assessed learner expectation 4; two questions were at the cognitive level Understand one question was at cognitive level Apply and one question was at the cognitive level Analyze. Two questions assessed learner expectations 25; both questions were at the cognitive level Understand. Two questions assessed learner expectations 31; both questions were at the cognitive level Remember. In addition, there was one question that appeared twice in two different parts of the test.
Table 3: Unit Test Items, Learner Expectations, and Cognitive Processes: Teachers A, C, and D
Item 1 NR 2 3 4 5 6 7 8 9 NR 10 LE 31 4 5 41 6 23 4 4 7 42 4 20 CP(AC) R An U Ap Ap Ap U U An U Ap U
Item 11 12 13 14 15 NR 16 17 18 19 20 21 LE 23 37 4 19 13 42 25 35 25 34 29 9 CP(AC) Ap U An U Ap E U U U Ap Ap An
Item NR 22 LE 15 31 CP(AC)
U R
Notes: LE – Learner Expectations CP(AC) – Cognitive Process: R – Remember, U – Understand, Ap – Apply, An – Analyze, E – Evaluate, and C – Create: (Assessed Curriculum)
The series of progressive summative tests used by Teacher B contained 68 questions that
assessed 19 of the 45 learner expectations. As reported in Table 4, the 19 learner expectations that were assessed included: 1, 5, 6, 8, 12,13, 15, 19, 23, 25, 28, 31, 34, 35, 37, 39, 41, 42, and 44. Thirty-five items assessed at the cognitive level Understand, 32 items assessed at the cognitive level Apply, and one item assessed at the cognitive level Analyze. There were 14 learner expectations that were assessed more than once. Two questions assessed learner expectation 1; both questions were at the cognitive level Apply. Two questions assessed learner expectation 5; one question was at the cognitive level Understand, and one question was at the cognitive level Apply. Five questions assessed learner expectation 6; all five questions were at the cognitive level Understand. Two questions assessed learner expectation 12; one question assessed at the cognitive level Understand, and one question assessed at the cognitive level Apply. Eleven questions assessed learner expectation 13, eight questions were at the cognitive level Understand, and three questions were at the cognitive level Apply. Eight questions assessed learner expectation 15; all eight questions were at the cognitive level Apply. Four questions assessed learner expectation 19; all four questions were at the cognitive level Understand. Ten questions assessed learner expectation 23, four questions were at the cognitive level Understand, and six questions were at the cognitive level Apply. Two questions assessed learner expectation 25; both questions were at the cognitive level Understand. Two questions assessed learner expectation 28; both questions were at the cognitive level Apply. Five questions assessed learner expectation 31, four questions were at the cognitive level Understand,

Curriculum Alignment
JCACS 82
and one question was at the cognitive level Apply. Two questions assessed learner expectation 39; both questions were at the cognitive level Apply. Two questions assessed learner expectation 41, one question was at the cognitive level “Understand”, and one question was at the cognitive level Apply. Two questions assessed learner expectation 42; both questions were at the cognitive level Understand.
Table 4: Unit Test Items, Learner Expectations and Cognitive Processes: Teacher B
Item A1 A2 A3 A4 A5 A6 A7 A8 B1 B2 B3 C1 LE 13 13 13 13 13 13 13 13 13 13 13 5 CP(AC) U U U U U U U U Ap Ap Ap Ap
Item C2 C3a C3b C3c C3d C4a C4b C4c C5 D1 D2 D3 LE 5 6 6 12 6 6 6 12 8 15 15 15 CP(AC) U U U Ap U U U U Ap Ap Ap Ap
Item D4 D5 D6 D7 D8 E1a E1b E2a E2b E3a E3b E4a LE 15 15 15 15 15 19 19 19 19 25 25 23 CP(AC) Ap Ap Ap Ap Ap U U U U U U U
Item E4b F1a F1b F2a F2b F2c G1a G1b G1c H1 H2 I1 LE 23 23 23 23 23 23 23 23 23 28 28 31 CP(AC U U U Ap Ap Ap Ap Ap Ap Ap Ap U
Item I2 I3 I4 I5 I6 I7 I8 I9 I10 I11 J1 J2 LE 41 31 42 34 31 44 31 1 1 42 31 31 CP(AC) U U Ap Ap Ap Ap U Ap Ap U U Ap
Item J3a J3b J3c J3d J4 J5a J5b J6 LE 42 41 34 35 37 39 39 41 CP(AC) U U U U An Ap Ap Ap
Notes: LE – Learner Expectations CP(AC) – Cognitive Process: R – Remember, U – Understand, Ap. – Apply, An – Analyze, E – Evaluate, and C – Create
The district created test used by Teacher E contained 20 questions with nine questions having multiple parts for a total of 45 items. As illustrated in Table 5 the district’s test assessed 20 of the 45 learner expectations – 2, 5, 6, 7, 8, 11, 12, 13, 14, 17, 18, 19, 28, 30, 31, 32, 34, 35, 42, and 45 and the parts of questions with parts are separated. Of the full set of assessed learner expectations, one learner expectation was assessed at the cognitive level Remember, eight learner expectations were assessed at the cognitive level Understand, 32 learner expectations were assessed at the cognitive level Apply, one learner expectation was assessed at the cognitive level Analyze, two learner expectations were assessed at the cognitive level Evaluate, and one learner expectations was assessed at the cognitive level Create.

Seitz
JCACS 83
Table 5: Unit Test Items, Learner Expectations and Cognitive Processes: Teacher E
Item 1 2 4 4a 4b 4c 5 6 7a 7b 7c 7d
LE 2 2 5 2 2 2 5 6 6 11 6 12
CP Ap Ap E Ap Ap Ap Ap U Ap Ap Ap Ap
Item 7e 8a 8b 8c 8d 8e 8f 9a 9b 9c 9d 9e
LE 32 5 8 18 7 12 12 13 13 13 13 13
CP C Ap Ap An Ap Ap Ap U U U U U
Item 10 11 12a 12b 13 14a 14b 15a 15b 16 17 18a
LE 14 30 17 18 19 28 28 28 28 29 31 34
CP Ap U Ap Ap Ap Ap Ap Ap Ap E R Ap
Item 18b 18c 18d 18e 19a 19b 19c 19d 20 LE 35 34 35 34 42 42 42 42 45
CP Ap Ap Ap Ap Ap Ap Ap Ap U Notes:- LE – Learner Expectations CP(AC) – Cognitive Process: R – Remember, U – Understand, Ap. – Apply, An – Analyze, E – Evaluate, and C – Create
There were five questions that assessed learner expectation 2; all five questions were at the cognitive level Apply. Three questions assessed learner expectation 5; two questions were at the cognitive level Apply and the other question was at the cognitive level Evaluate. Three questions assessed learner expectation 12; all three questions were at the cognitive level Apply. Five questions assessed learner expectation 13; all five questions were at the cognitive level Understand. Four questions assessed learner expectations 28; all four questions were at the cognitive level Apply. Three questions assessed learner expectation 34; all three questions were at the cognitive level Apply. Two questions assessed learner expectation 35; both questions were at the cognitive level Apply. Four questions assessed learner expectation 42; all four questions were at the cognitive level Apply.
Alignment among the Intended, Enacted, and Assessed Curricula
The results for the alignment among the intended, enacted, and assessed curricula is discussed in two parts. The alignment for the content/operations is provided first and the alignment in the cognitive processes is provided in next. As mentioned earlier, the alignment among the intended, enacted, and assessed curricula was based on the learning expectations that were assessed. Indeed, not all learner expectations were assessed by each teacher. Further, 12 learner expectations did not have an assessment item. Consequently, it was not possible to assess the fit between the three curricula for these 12 learner expectations.
Curriculum Alignment
JCACS 84
Content/Operations
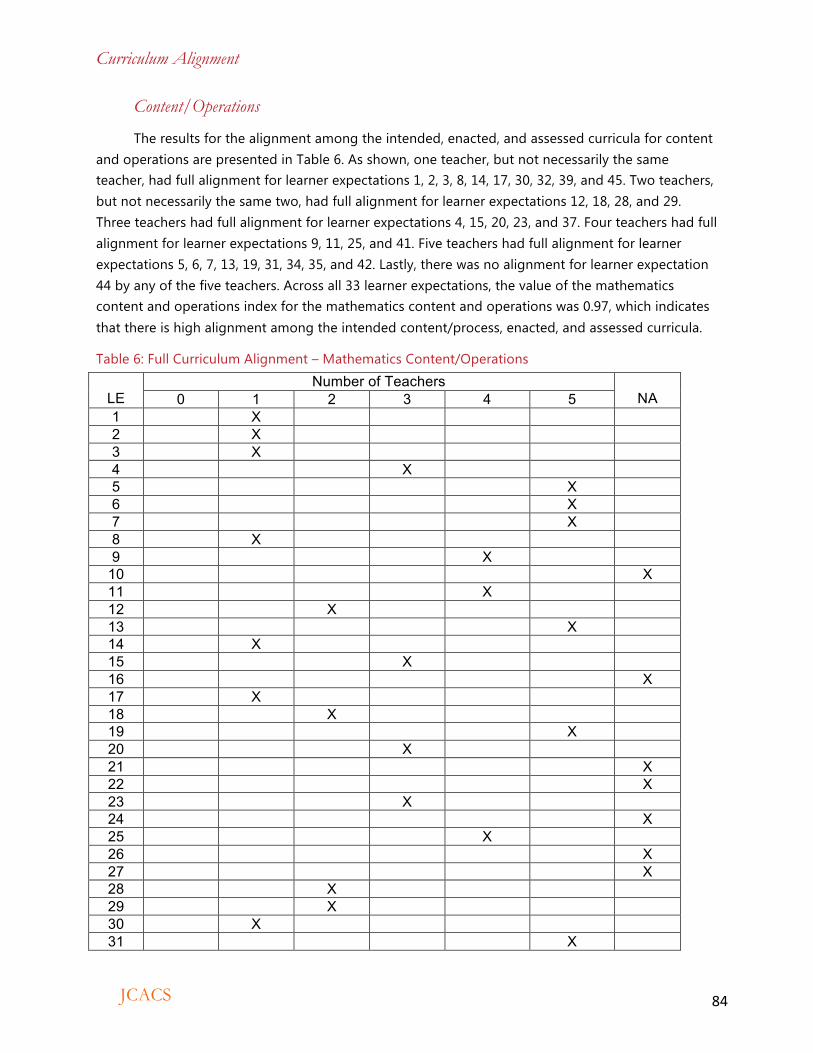
The results for the alignment among the intended, enacted, and assessed curricula for content and operations are presented in Table 6. As shown, one teacher, but not necessarily the same teacher, had full alignment for learner expectations 1, 2, 3, 8, 14, 17, 30, 32, 39, and 45. Two teachers, but not necessarily the same two, had full alignment for learner expectations 12, 18, 28, and 29. Three teachers had full alignment for learner expectations 4, 15, 20, 23, and 37. Four teachers had full alignment for learner expectations 9, 11, 25, and 41. Five teachers had full alignment for learner expectations 5, 6, 7, 13, 19, 31, 34, 35, and 42. Lastly, there was no alignment for learner expectation 44 by any of the five teachers. Across all 33 learner expectations, the value of the mathematics content and operations index for the mathematics content and operations was 0.97, which indicates that there is high alignment among the intended content/process, enacted, and assessed curricula.
Table 6: Full Curriculum Alignment – Mathematics Content/Operations
LE
Number of Teachers NA 0 1 2 3 4 5
1 X 2 X 3 X 4 X 5 X 6 X 7 X 8 X 9 X
10 X 11 X 12 X 13 X 14 X 15 X 16 X 17 X 18 X 19 X 20 X 21 X 22 X 23 X 24 X 25 X 26 X 27 X 28 X 29 X 30 X 31 X

Seitz
JCACS 85
32 X 33 X 34 X 35 X 36 X 37 X 38 X 39 X 40 X 41 X 42 X 43 X 44 X 45 X Notes: LE – Learner Expectations RS - Rating Scale: 0 - No match among the intended, the enacted and the assessed curricula, 1 - One teacher Full Curriculum match, 2 - Two teachers full Curriculum match, 3 - Three teachers full curriculum match, 4 - Four teachers full curriculum match, 5 - Five teachers full curriculum match, NA - Learner Expectations were not assessed
Cognitive Processes
The results for the alignment among the intended, enacted, and assessed curricula for cognitive process are presented in Table 7. As shown, one teacher, but not necessarily the same teacher, had full alignment for learner expectations 1, 5, 15, 18, 25, 34, and 35; two teachers had full alignment of learner expectation 23; and all five teachers had full alignment for learner expectation 13. There was no alignment found for the remaining 25 learner expectations. The value of the cognitive process index was 0.073, which indicates that there was low alignment among the intended cognitive process, enacted, and assessed curricula across the five teachers.
Table 7: Full Curriculum Alignment – Cognitive Processes
LE
Number of Teachers NA 0 1 2 3 4 5
1 X 2 X 3 X 4 X 5 X 6 X 7 X 8 X 9 X
10 X 11 X 12 X 13 X 14 X

Curriculum Alignment
JCACS 86
15 X 16 X 17 X 18 X 19 X 20 X 21 X 22 X 23 X 24 X 25 X 26 X 27 X 28 X 29 X 30 X 31 X 32 X 33 X 34 X 35 X 36 X 37 X 38 X 39 X 40 X 41 X 42 X 43 X 44 X 45 X Notes: LE – Learner Expectations RS - Rating Scale: 0 - No match among the intended, the enacted and the assessed curricula, 1 - One teacher Full Curriculum match, 2 - Two teachers full Curriculum match, 3 - Three teachers full curriculum match, 4 - Four teachers full curriculum match, 5 - Five teachers full curriculum match, NA - Learner Expectations were not assessed
Discussion of Results
The findings indicate high curriculum alignment among the intended, enacted, and assessed curricula for the content/operations included in the learning expectations and low curriculum alignment among the intended, enacted, and assessed curricula for the cognitive processes included in the learning expectations for the Grade 9 Patterns and Relations Mathematics Strand. The high alignment for content/operations is not surprising given teachers are required to teach all the learner expectations in the Program of Studies.

Seitz
JCACS 87
In contrast to the content/operations, the Program of Studies does not identify the cognitive process necessary to obtain the level of learning intended for the content and operation listed in each of the learner expectations. Further, teachers tended to concentrate their instruction at the lower cognitive levels. Fuhrman (2001) found similar results, stating that assessment items assess lower cognitive processes such as remember and understand and not higher cognitive levels such as evaluate and create. This is not to say that the lower cognitive levels are not important. Indeed, although Mathematics concepts may be learned at different cognitive levels, the lower level cognitive skills are the foundation for the higher order cognitive skills (Kaira, 2010). For example, remembering is an essential skill for problem solving since it taps into long-term memory. The higher-order cognitive processing levels promote transfer of knowledge as opposed to formulaic methods where learners become proficient at substituting numbers into a formula. What is needed is a balance in the teaching of the cognitive processes where both lower and higher levels cognitive skills are taught and assessed appropriately. It is therefore recommended that the Taxonomy for Learning, Teaching, and Assessing: A revision of Bloom’s Taxonomy of Educational Objectives (Anderson, et al., 2001) be used to identify the cognitive level for each learning expectation and that the cognitive level for each learner expectation be added to the expectation. This could be accomplished using a simple code such as the one in the study: R- Remember, U - Understand, Ap - Apply, A - Analyze, E - Evaluate, and C- Create. For example, two learning expectations from the Patterns and Relations Strand with the identification of the cognitive complexity that teachers would be required to teach to would appear as follows:
• Model the solution of a given linear equation using concrete or pictorial representations, and record the process (Ap.).
• Generalize and apply a rule for adding or subtracting a positive or negative number to determine the solution of a given inequality (C).
Alignment of learner expectations, instruction, and assessment is an essential principle of systemic and standards-based educational reform. As such, curriculum alignment could be used as a tool for the professional development of teachers. This would provide teachers the opportunity to analyze their own teaching and assessment practices based on the coherent understanding of the learner expectations. Engaging in professional development in curriculum alignment would assist teachers to clearly know what it is that they are responsible for teaching (content and cognitive processes), make decisions about the use of appropriate teaching strategies for helping students learn the content and acquire the cognitive skills that are specified in the learning expectations; develop relevant assessment items that represent both the content and cognitive processes stated in the learner expectations; and use the students’ assessment data to identify strengths and weaknesses and adjust instruction accordingly. This practice has the potential to clarify the teaching for teachers and the learning for students.
Conclusion
The results of the study indicate high curriculum alignment for the mathematics content/operations of the learning expectations (0.97) and very low curriculum alignment for the

Curriculum Alignment
JCACS 88
cognitive complexity of the learning expectations (0.073). The principle of curriculum alignment is that successful student learning and achievement can be more reliably attained when there is an alignment of (1) learner expectations, (2) instruction in the classroom, and (3) reliable assessment information. To be most successful, the learner expectations need to clearly identify the level of cognitive processing needed to operate on the mathematics elements for the learner expectations.
Curriculum alignment can provide a framework for examining the extent to which the learner expectations, instruction, and assessments are aligned. The findings of this study contribute toward improving the learning of students with its call to explicitly identify cognitive processes at all levels to be learned, and to determine if the enacted curriculum and the assessed curriculum, both revised to take account of the cognitive processes, are properly aligned.
References
Ananda, S. (2003). Achieving alignment. Leadership, 33(1), 18–22.
Anderson, L. W. (2002). Curricular alignment: A re-examination. Theory Into Practice, 41(4), 255–260.
Anderson, L. W., Krathwohl, D. R., Airasian, P. W., Cruikshank, K. A., Mayer, R. E., Pintrich, P. R., Raths, J., & Wittrock, M. C. (2001). A taxonomy for learning, teaching, and assessing: A revision of Bloom’s Taxonomy of Educational Objectives. Boston, MA: Allyn & Bacon.
Blank, R. K., Porter, A. C., & Smithson, J. L. (2001). New tools for analyzing teaching, curriculum and standards in mathematics and science. Washington, DC: Council of Chief State School Officers.
Contino, J. (2012). A case study of the alignment between curriculum and assessment in the New York State earth science standards-based system. Journal of Science Education Technology, 22, 62–72.
Creswell, J. W., & Plano Clark, V. L. (2011). Designing and conducting mixed methods research (2nd ed.). Thousand Oaks, CA: Sage.
Dalkey, N., & Helmer, O. (1963). An experimental application of the Delphi method to the use of experts. Management Science 9(3), 458-467.
Elmore, R. F., & Rothman, R. (Eds.) (1999). Testing, teaching and learning: A guide for states and school districts. A report of the National Research Council's Committee on Title I Testing and Assessment. Washington, DC: National Academy Press.
Elliott, S. N., Braden, J., P., & White, J. (2001). Assessing one and all: Educational accountability for students with disabilities. Arlington, VA: Council of Exceptional Children.
Fuhrman, S. (Ed.). (2001). From the Capitol to the classroom: Standards-based reform in the States, One-hundredth yearbook of the National Society for the Study of Education. Chicago, IL.:
Seitz
JCACS 89
University of Chicago Press.
Kaira, L. (2010). Using item mapping to evaluate alignment between curriculum and assessment. (Dissertation and Thesis 9-1). Amherst, Massachusetts’ School of Education, University of Massachusetts.
Keohane, D. (2008). Curriculum Alignment in a Grade 9 Social Studies Exam. Unpublished study, Holy Spirit Catholic School Division No. 4, Lethbridge, Alberta.
Kerr, D. (1999). Citizenship education: An international comparison. International Review of Curriculum and Assessment Frameworks Paper (4). London, UK: Qualifications and Curriculum Authority.
Kurz, A., Elliott, S., Wehby, J., & Smithson, J. (2010). Alignment of the intended, planned, and enacted curriculum in general and special education and its relation to students’ achievement. Journal of Special Education, 44(3), 131- 145.
La Marca, P. M., Redfield, D., Winter, P. C., & Despriet, L. (2000). State standards and state assessment systems: A guide to alignment. Series on Standards and Assessments. Washington, DC: Council of Chief State School Officers.
Marsh, C., & Willis, P. (2003). Curriculum: Alternative approaches, ongoing issues (3rd ed.). Upper Saddle River, NJ: Merrill/Prentice Hall.
Martone, A., & Sereci, S. (2009). Evaluating alignment between curriculum, instruction and assessment. Review of Educational Research, 79(4), 1332- 1361.
McGehee, J. J., & Griffith, L. K. (2001). Large-scale assessments combined with curriculum alignment: Agents of Change. Theory into Practice, 40(2), 137-144.
McNamara, C. (1999). General guidelines for conducting interviews. Retrieved from: http://www.mapnp.org/library/evaluatn/intrview.htm
Moss, M. F. (1999). All students can learn: Effects of curriculum alignment on the mathematics achievement of third-grades students. Paper presented at the Annual Meeting of the American Educational Research Association, Montreal, Quebec.
Pellegrino, J. (2006). Rethinking and redesigning curriculum, instruction and assessment. Paper Commissioned by the National Center on Education and the Economy for the New Commission on the Skills of the American Workforce. National Center on Education and the Economy.
Porter, A. C. (2002). Measuring the content of instruction: Uses in research and practice. Educational Researcher, 31(7), 3-14.
Porter, A. C., & Smithson, J. L. (2000). Alignment of state testing programs NAEP and reports of teacher practice in mathematics and science in grades 4 and 8. Paper presented at the
Curriculum Alignment
JCACS 90
annual meeting of the American Educational Research Association, New Orleans, L.A.
Porter, A. C., & Smithson, J. L. (2001). Are content standards being implemented in the classroom? A methodology and some tentative answers. In S. H. Fuhrman (Ed.), From the capitol to the classroom: Standards-based reform in the states—One hundredth yearbook of the National Society for the Study of Education, Part II (pp. 60-80). Chicago, IL: University of Chicago Press.
Porter, A. C., & Smithson, J. L. (2002). Alignment of assessments, standards and instruction using curriculum indicator data. Paper presented at the Annual Meeting of American Educational Research Association, New Orleans, LA.
Resnick, L. B., Rothman R., Slattery, J. B., & Vranek, J. L. (2003). Benchmarking and alignment of standards and testing. Educational Assessment, 9(1 & 2), 1–27.
Roach, A. T., Niebling, B. C., & Kurz, A. (2008). Evaluating the alignment among curriculum, instruction, and assessments: Implications and applications for research and practice. Psychology in the Schools, 45, 158-176.
Smith, M. S., & O'Day, J. (1991). Putting the pieces together: Systemic school reform. New Brunswick, NJ: Consortium for Policy Research in Education.
Squires, D. (2008). Curriculum alignment: Research-based strategies for increasing student achievement. Thousand Oaks, CA: Corwin Press.
Squires, D. (2012). Curriculum alignment research suggests that alignment can improve student achievement. The Clearing House: A Journal of Educational Strategies, Issues and Ideas, 85(4), 129-135.
Tindal, G., Cipoletti, B., & Almond, P. (2005). Alternate assessments: Evidence based on test content and alignment with standards. Eugene, OR: University of Oregon Behavioral Research and Teaching.
Webb, N. L. (1997). Determining alignment of expectations and assessments in mathematics and science education. NISE Brief, 1(2).
Webb, N. L. (2002). Alignment study in language arts, mathematics, science, and social studies of state standards and assessments for four states. Washington, DC: Council of Chief State of School Officers.
Seitz
JCACS 91
Appendix
Appendix A: Learner Expectations for Grade 9 Mathematics Patterns and Relations Strand and Delphi Results
Cognitive Process Dimension
General Learner Outcome for Math 9 Patterns and Relations Strand and Achievement Indicators
1.
REMEMBER
Recognizing Recalling
2.
UNDER-STAND
Interpreting Exemplifying Classifying Summarizing Inferring Comparing Explaining
3.
APPLY
Executing Implementing
4.
ANALYZE
Differentiating Organizing Attributing
5.
EVALUATE
Checking Critiquing
6.
CREATE
Generating Planning Producing
Generalize a pattern arising from a problem-solving context, using a linear equation, and verify by substitution.
Ø 1. Write an expression representing a given Ø pictorial, oral or written pattern.
100%
Ø 2. Write a linear equation to represent a given Ø context.
90% 10%
Ø 3. Describe a context for a given linear Ø equation
100%
Ø 4. Solve, using a linear equation, a given Ø problem that involves pictorial, oral and Ø written linear patterns.
10% 90%
5. Write a linear equation representing the pattern in a given table of values, and verify the equation by substituting values from the table.
80% 10% 10%
Graph a linear relation, analyze the graph, and interpolate or extrapolate to solve problems.
Ø 6. Describe the pattern found in a given graph.
100%
Ø 7. Solve a given problem by graphing a linear Ø relation and analyzing the graph.
80% 20%
Ø 8. Graph a given linear relation, including Ø horizontal and vertical lines.
10% 90%
9. Match given equations of linear relations with their corresponding graphs.
90% 10%
Ø 10. Extend a given graph (extrapolate) to Ø determine the value of an unknown
element.
90% 10%
Ø 11. Interpolate the approximate value of one Ø variable on a given graph, given the value
of the other variable.
90% 10%
12. Extrapolate the approximate value of one 90% 10%
Taxonomy Table

Curriculum Alignment
JCACS 92
variable from a given graph, given the value of the other variable.
Model and solve problems, using linear equations of the form: ax = b; x - b, a ≠ 0; ax + b = c; x + b - c, a ≠ 0; ax = b + cx; a(x + b) = c; ax + b = cx + d; a(bx + c) = d(ex + f); a - b, x ≠ 0 (where a , b, c, d, e and f are rational numbers).
13. Model the solution of a given linear equation, using concrete or pictorial representations, and record the process.
10% 90%
14. Verify by substitution whether a given rational number is a solution to a given linear equation.
80% 20%
15. Solve a given linear equation symbolically. 10% 90% 16. Identify and correct an error in a give
incorrect solution of a linear equation. 60% 10% 10% 20%
17. Represent a given problem, using a linear equation.
10% 90%
18. Solve a given problem, using a linear equation, and record the process.
100%
Explain and illustrate strategies to solve single variable linear inequalities with rational coefficients within a problem-solving context.
19. Translate a given problem into a single variable using the symbols ≥ , >, < or ≤.
100%
20. Determine if a given rational number is a possible solution of a given linear inequality.
10% 90%
21. Generalize and apply a rule for adding or subtracting a positive or negative number to determine the solution of a given inequality.
10% 90%
22. Generalize and apply a rule for multiplying or dividing by a positive or negative number to determine the solution of a given inequality.
10% 90%
23. Solve a given linear inequality algebraically, and explain the process orally or in written form.
100%
24. Compare and explain the process for solving a given linear equation to the process for solving a given linear inequality.
80% 20%
25. Graph the solution of a given linear inequality on a number line.
10% 90%
26. Compare and explain the solution of a given linear equation to the solution of a given linear inequality.
90% 10%

Seitz
JCACS 93
27. Verify the solution of a given linear inequality, using substitution for multiple elements in the solution.
10% 90%
28. Solve a given problem involving a single variable linear inequality, and graph the solution.
90% 10%
Demonstrate an understanding of polynomials (limited to polynomials of degree less than or equal to 2).
29. Create a concrete model or a pictorial representation for a given polynomial expression.
40% 60%
30. Write the expression for a given model of a polynomial.
10% 90%
31. Identify the variables, degree, number of terms and coefficients, including the constant term, of a given simplified polynomial expression.
70% 30%
32. Describe a situation for a given first degree polynomial expression.
90% 10%
33. Match equivalent polynomial expressions given in simplified form; e.g., 4x - 3x2 + 2 is equivalent to -3x2 + 4x + 2.
100%
Model, record and explain the operations of addition and subtraction of polynomial expressions, concretely, pictorially and symbolically (limited to polynomials of degree less than or equal to 2).
34. Model addition of two given polynomial expressions concretely or pictorially, and record the process symbolically.
80% 20%
35. Model subtraction of two given polynomial expressions concretely or pictorially, and record the process symbolically.
80% 20%
36. Identify like terms in a given polynomial expression.
90% 10%
37. Apply a personal strategy for addition or subtraction of two given polynomial expressions, and record the process symbolically.
100%
38. Refine personal strategies to increase their efficiency.
100%
39. Identify equivalent polynomial expressions from a given set of polynomial expressions, including pictorial and symbolic representation.
10% 90%
40. Identify the error(s) in a given simplification
70% 30%

Curriculum Alignment
JCACS 94
of a given polynomial expression. Model, record and explain the operations of multiplication and division of polynomial expressions (limited to polynomials of degree less than or equal to 2) by monomials, concretely, pictorially and symbolically.
41. Model division of a given polynomial expression by a given monomial concretely or pictorially, and record the process symbolically.
80% 20%
42. Apply a personal strategy for multiplication and division of a given polynomial expression by a given monomial.
10% 90%
43. Refine personal strategies to increase their efficiency.
100%
44. Provide examples of equivalent polynomial expressions.
90% 10%
45. Identify the error(s) in a given simplification of a given polynomial expression.
70% 30%