current japanese casting businesses - global casting … · 2014-10-06 · structure of castings...
TRANSCRIPT

Current Japanese Casting Businesses
September 27 2014
Japan Foundry Society, Inc. Chairman Hiroyoshi Kimura

1.Japanese Economy is going to get out from
the deflation.
2008 2009 2010 2011 2012 2013 2014 2015
Nominal Growth Rate -4.6 -3.2 1.3 -1.4 -0.2 1.9 3.3 2.8
Real Growth Rate -3.7 -2 3.4 0.3 0.7 2.3 1.2 1.4
-5
-4
-3
-2
-1
0
1
2
3
4
%
Trend of GDP
(1) Japanese Economy Growth Rate
(2) From Strong ¥ to Weak ¥ The Strongest ¥(a) July 2014(b) b/a
$/¥ Sep. 2011 76.8 102.8 34%
Euro/¥ July 2012 97.0 139.2 44%
出所:内閣府
Data: Cabinet Office

2. Mid & Long Term Trend of Japanese Economy
3.3
1.0 1.0
1.2
0.5
- 0.3 - 0.6 - 0.7
4.5
1.5
0.7
- 1
0
1
2
3
4
1980S 1990S 2000S 2010S 2020S
Impact of the variation of employees’ number
Predictability par employee Real GDP
Real GDP growth
(Average Changing Rate par year:%)
(Fiscal Year)
出所:新素形材産業ビジョン

38.6 46.6
50.6
26.6 35.2
41.8
18.9
29.3
21.5
29.2
24.2
0
10
20
30
40
50
60
02 03 04 05 06 07 08 09 10 11 12 13 14 15
(%)
(2015年は見込み)
電気・電子
自動車
一般機械
化学
鉄鋼
(備考)国際協力銀行「海外事業展開調査」
3. Each industry development to overseas
(1) Trend of Japanese industries ratio to overseas.
出所:新素形材産業ビジョン
Electrical & Electronic
Automobile
Machinery
Chemical
Steel

0 500 1,000 1,500 2,000 2,500 3,000
1999年
2012年
日本
990
日本
994
アジア
155
アジア
850
北米
280
北米
425
欧州
93
欧州
148
中南米
25
中南米
103
63.1% 海外生産 36.9%
38.6% 海外生産 61.4%
アフリカ大洋州中近東
アフリカ大洋州
2577万台
1568万台
(2) Comparison of automobile production between domestic & overseas
2012
1999
25.77 M cars
15.68 M cars
Japan
Japan
Asia North
America Europe
M.S
America
Africa
etc
Africa
etc
M.S
America
Asia North
America Europe
Overseas
Overseas
Source: JFS

(3) Rising Electricity Rate
A Company: Supplier Tokyo Electric Power Company
Average Electricity Rate
8.78¥/kwh (Jan – Mar 2011)92% Rise16.52¥/kwh (Apr – Jun 2014)
B Company: Supplier CHUBU Electric Power Co.,Inc.
Average Electricity Rate
8.44¥/kwh (Jan – Mar 2011)53% Rise12.88¥/kwh (Apr – Jun 2014)
1. Nuclear power plants that were 30% of total electric generating capacity have stopped caused by 3.11.2011 Great East Japan Earthquake.
2. Electric rate is rising coupled with the fuel cost of thermal power plants that are the alternative to nuclear power plants have been rising.
Source: JFS

(%)
4. The Trend of Production & Sales volume
(by materials)
(10 Million$)
1990 1995 2000 2001 2002 2003 2004 2005 2006 2007 2008 2009 2010 2011 2012 2013
Investment Casting 47 45 47 49 45 40 44 46 47 54 60 43 51 52 51 52
High Pressure Diecast Casting 520 485 465 434 465 506 551 600 675 732 697 444 577 558 581 569
Aluminum Casting 312 300 289 265 269 256 260 279 307 320 309 207 263 258 274 280
Copper Alloy Casting 112 98 70 69 67 75 83 82 115 133 129 84 96 108 96 91
Steel Casting 223 174 138 141 126 122 122 143 160 175 187 133 137 131 124 125
Iron Casting 1,267 1,080 905 817 764 821 849 913 973 1,001 1,048 677 851 858 849 820
Non-Ferrous Rate 38.0 40.5 43.1 43.3 46.2 46.0 46.8 46.6 48.2 49.1 46.7 46.3 47.4 47.0 48.2 48.5
0
10
20
30
40
50
60
0
500
1,000
1,500
2,000
2,500
3,000
Non-Ferrous Rate

0
500
1,000
1,500
2,000
2,500
3,000
0
1,000
2,000
3,000
4,000
5,000
6,000
7,000
8,000
9,000
1975 77 79 81 83 85 87 89 91 93 95 97 99 01 03 05 07 09 11 13
生産量
(破線)
千t
生産量
(実践)
千t
銑鉄鋳物(含む鋳鉄管)
鋳物 総量
ダイカスト→
非鉄鋳物(除ダイカスト)→
鋳鋼品→
破線は右軸→
出所:素形材年鑑
2013
5,540
3,820
990
Max.
Total Production 8,200 K ton (1990)
Iron casting 6,190 K ton (1990)
High pressure die
cast 1,160 K ton (2007)
2009
4,380
3,020
760
5. Trend of casting production by products
2013/Max.
68%
62%
85%
Total production
Iron casting
High pressure die cast
Steel casting
Non-ferrous casting
Kton
Dot line Solid line
Kton
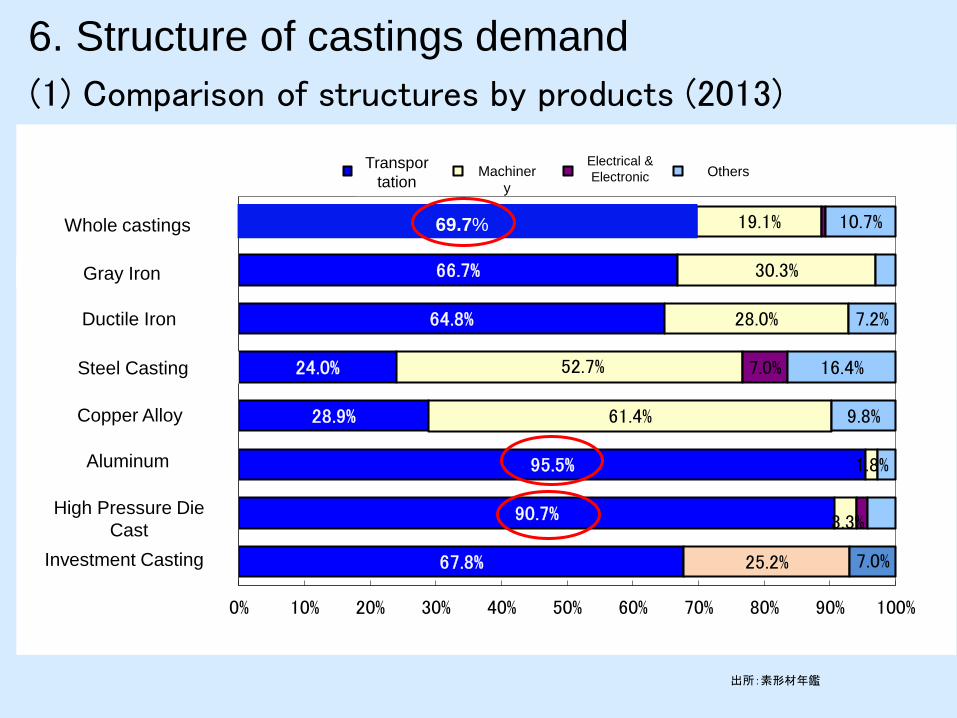
67.8%
90.7%
95.5%
28.9%
24.0%
64.8%
66.7%
69.7%
25.2%
3.3%
1.8%
61.4%
52.7%
28.0%
30.3%
19.1%
7.0%
7.0%
9.8%
16.4%
7.2%
10.7%
0% 10% 20% 30% 40% 50% 60% 70% 80% 90% 100%
精密鋳造品
ダイカスト
アルミニウム鋳物
銅合金鋳物
鋳鋼品
球状黒鉛鋳鉄*
ねずみ鋳鉄*
鋳造品全体
輸送機械 一般機械 電気機械 その他
6. Structure of castings demand
(1) Comparison of structures by products (2013)
出所:素形材年鑑
69.7% Whole castings
Gray Iron
Ductile Iron
Steel Casting
Copper Alloy
Aluminum
High Pressure Die
Cast
Investment Casting
Transpor
tation Machiner
y
Electrical &
Electronic Others

59.0%
7.3%
15.8%
3.8%9.8%
4.6%
52.9%
6.9%
17.3%
3.4%
13.4%
6.1%
自動車
その他輸送機械
産業機械
金属工作・加工機械
その他一般機械
その他 内円:重量
外円:金額
Passenger cars
Trucks
Moto-cycle
Industrial transport machines,
Rail way, Ships, Airplanes
Including
Electric
machines
Inner circle:Weight
Outer circle: Value
(2) Customers distributions of Japanese foundries (2011)
出所:素形材年鑑
Others
Machinery
Machining machines
Industrial
machines Automobile
Other transport machines

1990 1995 2000 2002 2004 2006 2007 2008 2009 2010 2011
High pressure Die cast 1,006 894 836 746 685 715 724 763 693 657 690
Non-ferrous castings 1,241 1,028 832 699 661 637 626 650 571 570 576
Steel castings 95 95 92 80 82 77 84 87 81 78 64
Iron castings 1,899 1,432 1,164 970 902 873 882 887 838 808 829
0
500
1,000
1,500
2,000
2,500
3,000
3,500
4,000
4,500
5,000
7. Trend of foundries number by materials.
出所:素形材年鑑
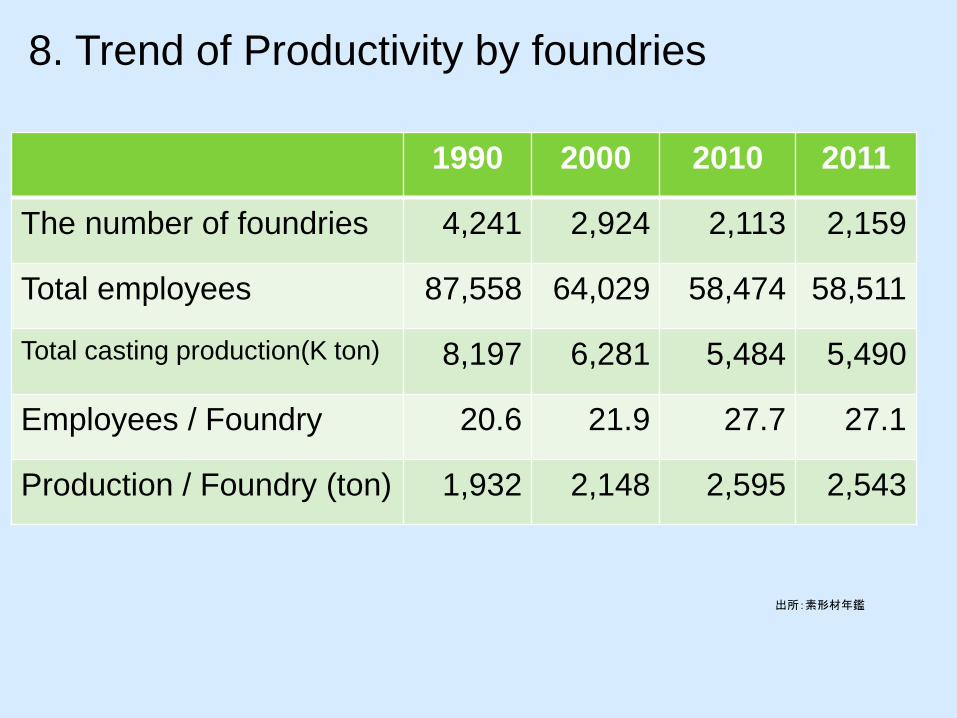
8. Trend of Productivity by foundries
1990 2000 2010 2011
The number of foundries 4,241 2,924 2,113 2,159
Total employees 87,558 64,029 58,474 58,511
Total casting production(K ton) 8,197 6,281 5,484 5,490
Employees / Foundry 20.6 21.9 27.7 27.1
Production / Foundry (ton) 1,932 2,148 2,595 2,543
出所:素形材年鑑

Foundry(2011) Shipping(2011)
Less than 49 621 84% 17.5 M$ 26%
More than 50 116 16% 48.8 M$ 74%
出所:素形材年鑑 (但し、従業員規模別生産量は日本鋳造協会)
2.6%
32.6%
5.4%
23.6%
7.6%
15.9%
10.8%
12.2%
19.5%
10.4%
14.0%
3.4%
40.1%
1.9%
0% 20% 40% 60% 80% 100%
出荷額
工場数
9人以下 10人~ 20人~ 30人~ 50人~ 100人~ 200人~
50人未満 84%
16%
9. Shipping amount classified by foundry sizes ( Iron Castings).
Foundry
Shipping
amount
< 49
< 10 > 10 > 20 > 30 > 50 > 100 > 200
26%

10. Casting production in top 10 countries (2012)
0
5
10
15
20
25
30
35
40
45
Non-Ferrous
Steel
Ductile Iron
Grey Iron
出所:モダンキャスティング
Mton

36.5
32.0
43.6
57.9
43.2
45.9
41.4
66.9
33.5
47.3
45.6
37.5
21.3
27.6
24.0
20.9
31.5
25.8
10.5
34.9
25.6
25.0
5.7
3.7
6.6
8.8
17.0
4.2
4.0
12.4
11.2
12.7
11.2
18.0
36.6
20.0
7.9
8.7
15.4
26.2
9.5
13.7
10.5
13.9
0% 10% 20% 30% 40% 50% 60% 70% 80% 90% 100%
フランス
イタリア
韓国
ブラジル
ロシア
ドイツ
日本
インド
アメリカ
中国
世界
ねずみ鋳鉄 球状黒鉛鋳鉄鋳鋼
可鍛鋳鉄 銅合金鋳物アルミ合金鋳物
その他
出所:Modern Castig (December 2013)から作成
11. Casting ratio in top ten countries by materials with weight (2012)
Worldwide
China
U.S.A
India
Japan
Germany
Russia
Brazil
Korea
Italy
France
Gray Iron Ductile Iron Malleable Iron
Steel
Copper
Aluminum
Others

1. Active management based on creating attractive products
with excellent technologies and skills.
2. Business development with reinforcement of management
bases and sound management.
3. Enhancement of competitiveness based on positive
collaborations with casting industry, outside casting industry,
and regional industry.
4. Collaboration with overseas companies.
5. Long term development and scarcity of human resource.
6. Reinforcement of environment and energy
countermeasures.
12. The Vision of Casting Industry
1. The vision must be devoted to the development of Japanese Casting
Industry.
2. JFS focuses on six principles in Casting Industry.
Source: JFS
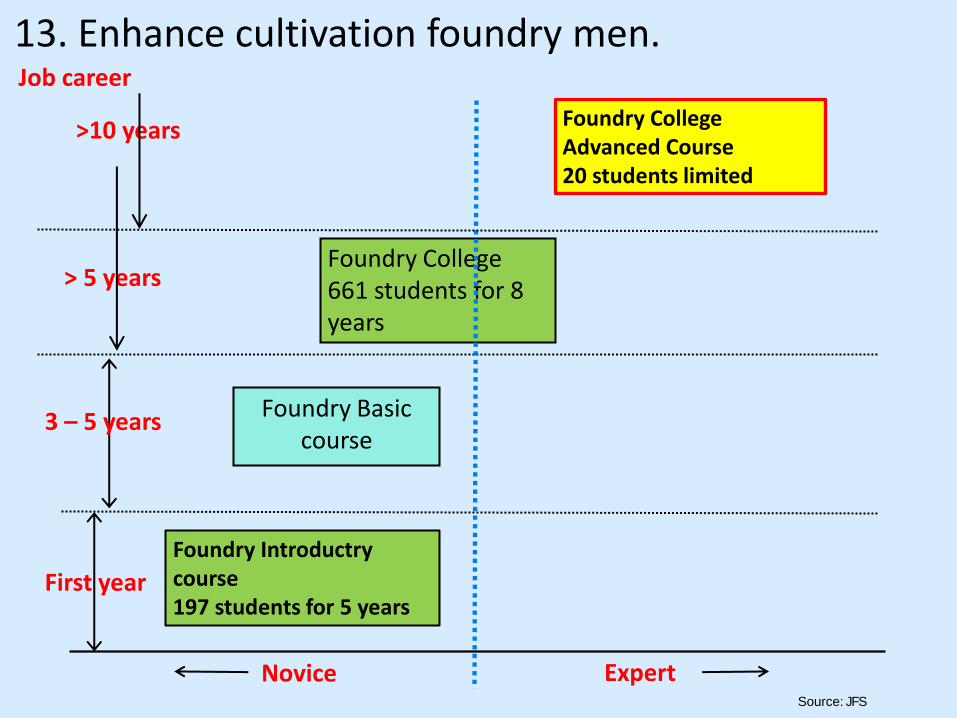
Foundry Introductry course 197 students for 5 years
Foundry College 661 students for 8 years
Foundry Basic course
Foundry College Advanced Course 20 students limited
First year
3 – 5 years
Job career
Novice Expert
13. Enhance cultivation foundry men.
> 5 years
>10 years
Source: JFS
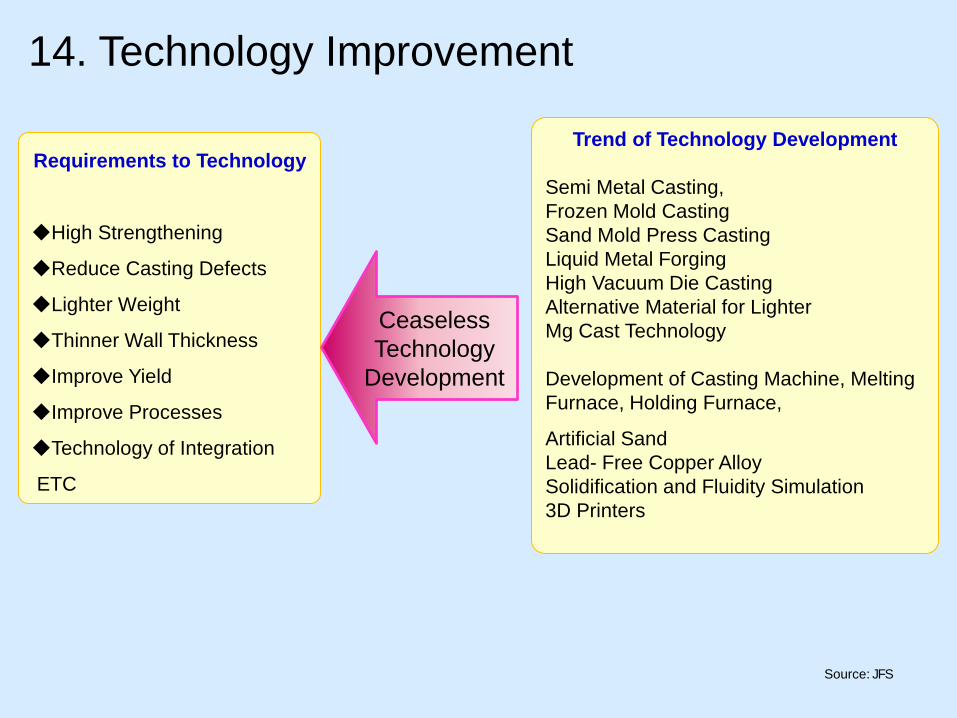
Requirements to Technology
◆High Strengthening
◆Reduce Casting Defects
◆Lighter Weight
◆Thinner Wall Thickness
◆Improve Yield
◆Improve Processes
◆Technology of Integration
ETC
Trend of Technology Development
Semi Metal Casting,
Frozen Mold Casting
Sand Mold Press Casting
Liquid Metal Forging
High Vacuum Die Casting
Alternative Material for Lighter
Mg Cast Technology
Development of Casting Machine, Melting
Furnace, Holding Furnace,
Artificial Sand
Lead- Free Copper Alloy
Solidification and Fluidity Simulation
3D Printers
Ceaseless
Technology
Development
14. Technology Improvement
Source: JFS

Thank you
for your kind attention.
ARIGATO!
Hiroyoshi Kimura JFS, Inc.
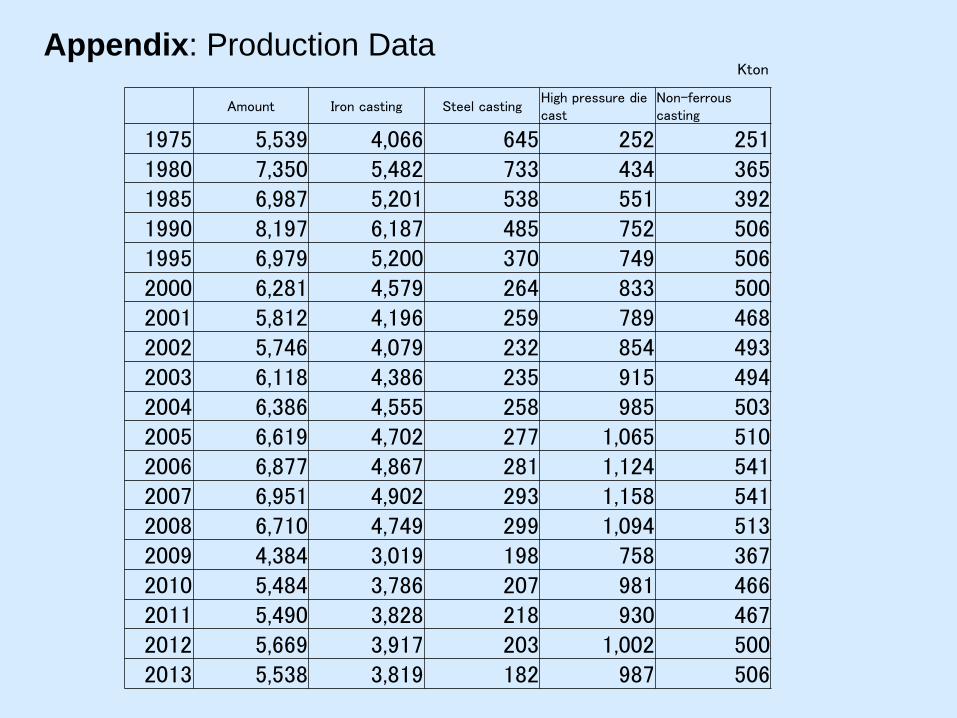
Appendix: Production Data
Amount Iron casting Steel casting High pressure die cast
Non-ferrous casting
1975 5,539 4,066 645 252 251 1980 7,350 5,482 733 434 365 1985 6,987 5,201 538 551 392 1990 8,197 6,187 485 752 506 1995 6,979 5,200 370 749 506 2000 6,281 4,579 264 833 500 2001 5,812 4,196 259 789 468 2002 5,746 4,079 232 854 493 2003 6,118 4,386 235 915 494 2004 6,386 4,555 258 985 503 2005 6,619 4,702 277 1,065 510 2006 6,877 4,867 281 1,124 541 2007 6,951 4,902 293 1,158 541 2008 6,710 4,749 299 1,094 513 2009 4,384 3,019 198 758 367 2010 5,484 3,786 207 981 466 2011 5,490 3,828 218 930 467 2012 5,669 3,917 203 1,002 500 2013 5,538 3,819 182 987 506
Kton