current and future markets and challenges for onshore … · challenges for onshore and offshore...
TRANSCRIPT

Current and Future Markets and Challenges for Onshore and Offshore Wind in TX U.S. Department of Energy H2@Scale Workshop May 23-24, 2017, University of Houston
Carsten H. Westergaard, Professor of Practice Mechanical Engineering & National Wind institute, Texas Tech University, Lubbock
Middelgrunden, Denmark
Agenda
• Texas Tech activities in wind, renewables, grids and energy storage
• Offshore wind in Denmark
• Technology and capacity fact, be careful with the assumptions – especially about the future assumptions
• Territories leading the way
• Offshore challenges
• Storage functionality
• Conclusion

Electric wind energy Denmark anno 1896
Poul La Cour systematically researched how wind power could support his social vision, bringing the power of electricity to the rural areas Education: meteorologist Published a magazine, established a wind energy society and wind education For La Cour, the windmill was a power plant. His inventions included: Aerodynamic investigations in a wind tunnel Storage in Hydrogen (no grid !) Kratosate: a mechanical adjustment of
variable load inputs to improve smooth running of a DC motor
Pictures and sources www.poullacour.dk

About Texas Tech Wind energy
Education at Tech • 2005 First Wind Energy Graduate Class was offered • 2007 Wind Science and Engineering PhD • 2009 Funding by Texas Workforce Commission • 2010 Graduate Certificate Program – 2 Tracks • 2011 Bachelor of Science in Wind Energy • 2017 BSWE Metrics
• 180 majors • 50 minors in Wind Energy (6 courses)

GLEAMM Global Laboratory for Energy Asset Management and Manufacturing
GLEAMM is a $13M award from the State of Texas to test, certify, and develop new electric grid technologies and next generation power electronics Increase Research, Accelerate Innovation, Grow Field Testing at Group NIRE • Smart-grid and Smart-home • Microgrid and Distributed Energy Resources (DER) • Cybersecurity and Big Data • Solar • Battery storage • Wind • Phasor measurement units (PMU) • Weather and energy forecasting • Silicon carbide design and manufacturing
http://gleamm.org/

Huge real world Microgrid and Energy Test Facility
DOE/SNL SWIFT Facility
Commercial prototype test
1MW Battery
Erskine Sub-station (3.5 going to 10 MW)
Reese Sub-station (1.0 MW)
Hurlwood Sub-station (3.5MW)
Xcel, Southwest Power Pool
Yuma Substation (15MW)
To Carlisle Sub-station, Xcel, Southwest Power Pool
Additional Wind Turbines
Solar Array
The Reese Technology Center is a former Air Force Base that has become the well understood electric grid and place for any research, testing, certifying of energy resources.
Battery Test Facility
Wolfforth Sub-station (5-15MW)
Diesel Generator
Xcel, Southwest Power Pool
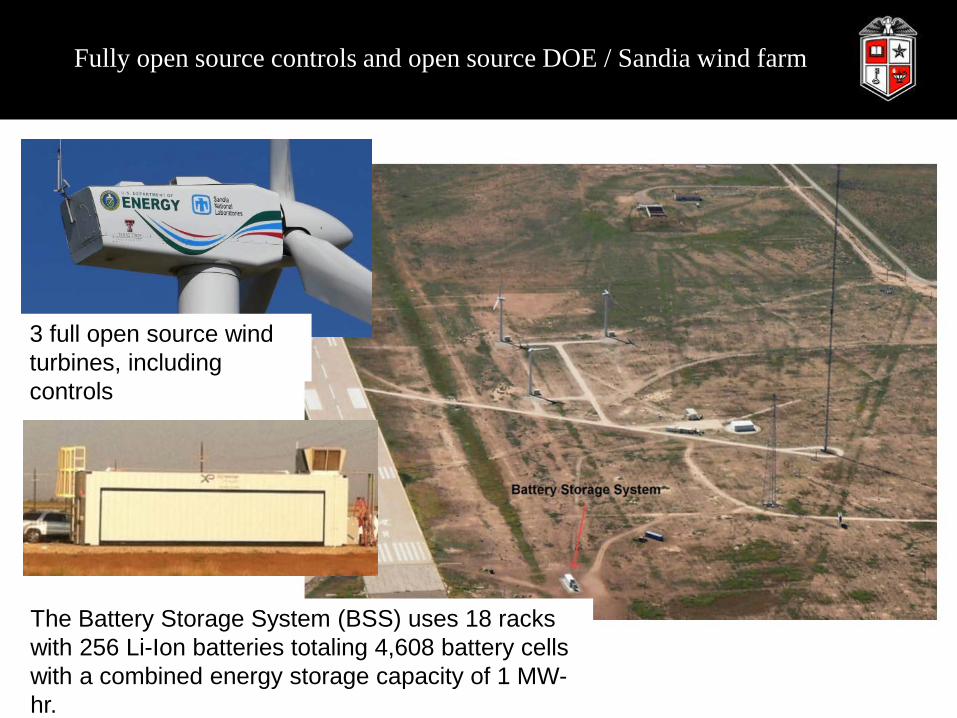
Fully open source controls and open source DOE / Sandia wind farm
The Battery Storage System (BSS) uses 18 racks with 256 Li-Ion batteries totaling 4,608 battery cells with a combined energy storage capacity of 1 MW-hr.
3 full open source wind turbines, including controls

Middelgrunden, Denmark

Lillegrunden
Lillegrunden wind farm – 48 turbines, 377 feet tall. Seen 75 feet above sea level from 12 miles away, 24 miles away, this would be under the horizon
Bridge to Sweden 5 miles
Tunnel to Copenhagen ~ 2.5 miles

First offshore wind turbine, ~1940: concrete and 2-blades Two technologies that keep bouncing back ?
Company F.L Smidth, Gedser 1956
Company F.L Smidth ~1940, Neksø
Tvind school 1978
www.windsofchange.dk ele.aut.ac.i www.hvidovrevindmollelaug.dk
Nibe, 1982 Näsudden, Sweden, 1982
Elsam (Dong) Tjæreborg, 1989
SEAS (Dong) Avedøre, 1993
Dong Energy, 3 x Siemens 2.3MW, Avedøre, 2010
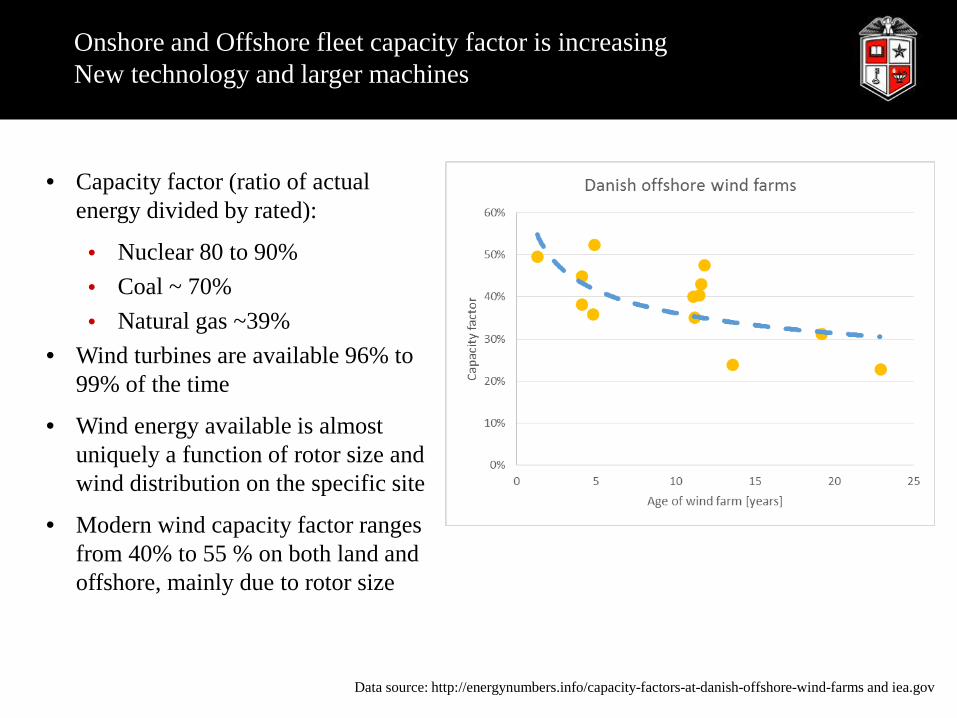
Onshore and Offshore fleet capacity factor is increasing New technology and larger machines
• Capacity factor (ratio of actual energy divided by rated):
• Nuclear 80 to 90% • Coal ~ 70% • Natural gas ~39%
• Wind turbines are available 96% to 99% of the time
• Wind energy available is almost uniquely a function of rotor size and wind distribution on the specific site
• Modern wind capacity factor ranges from 40% to 55 % on both land and offshore, mainly due to rotor size
Data source: http://energynumbers.info/capacity-factors-at-danish-offshore-wind-farms and iea.gov
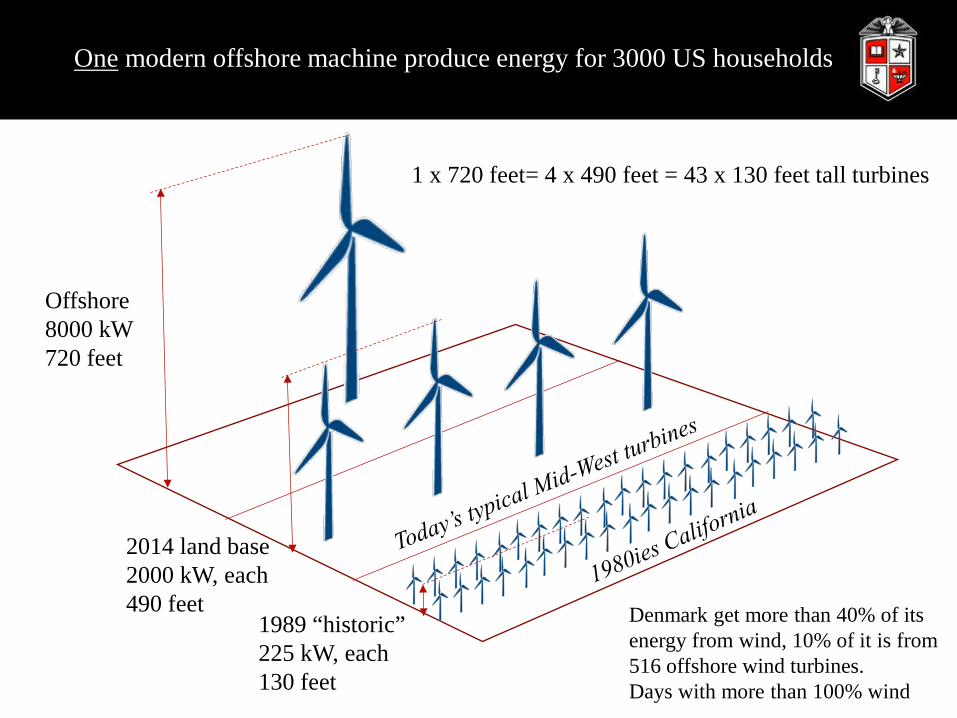
One modern offshore machine produce energy for 3000 US households
Offshore 8000 kW 720 feet
2014 land base 2000 kW, each 490 feet
1989 “historic” 225 kW, each 130 feet
1 x 720 feet= 4 x 490 feet = 43 x 130 feet tall turbines
Denmark get more than 40% of its energy from wind, 10% of it is from 516 offshore wind turbines. Days with more than 100% wind

Status from the Danish Energy Agency
Denmark all wind turbines: 5196 turbines 4823 MW Produced 9466 GWh in
2013 30% of the domestic
energy consumption Offshore wind: 1271 GW Offshore wind accounts
for approx. 10% of the domestic energy consumption Vindeby:
11 450kW stall wind turbines, 2 km from the coastline Concrete foundation
North Sea Horns Rev I (160MW)
Anholt (400MW)
http://ens.dk

Load and generation development in Denmark
Source: www.energinet.dk

Onshore and Offshore fleet capacity factor is increasing New technology and larger machines (approximate numbers)
Data source: energynumbers.info/capacity-factors-at-danish-offshore-wind-farms and iea.gov GWEC, ERCOT, BP Energy statistics
Where Capacity factor
Penetration Maximum Number of turbines
World 24.3% 4% 341,320 US 32.9% 5.6% 52,343
(offshore: 6) China 19.3% 104,934
(offshore: ~300) EU 26.3% 10.4% ~128,000
(offshore: 3,589) Texas 34.5% 15.1% 50% 10,700
(offshore: 0) DK (offshore)
33.6% (41.4 to 49.4)
42.7% >140% 5196 (offshore: 512)
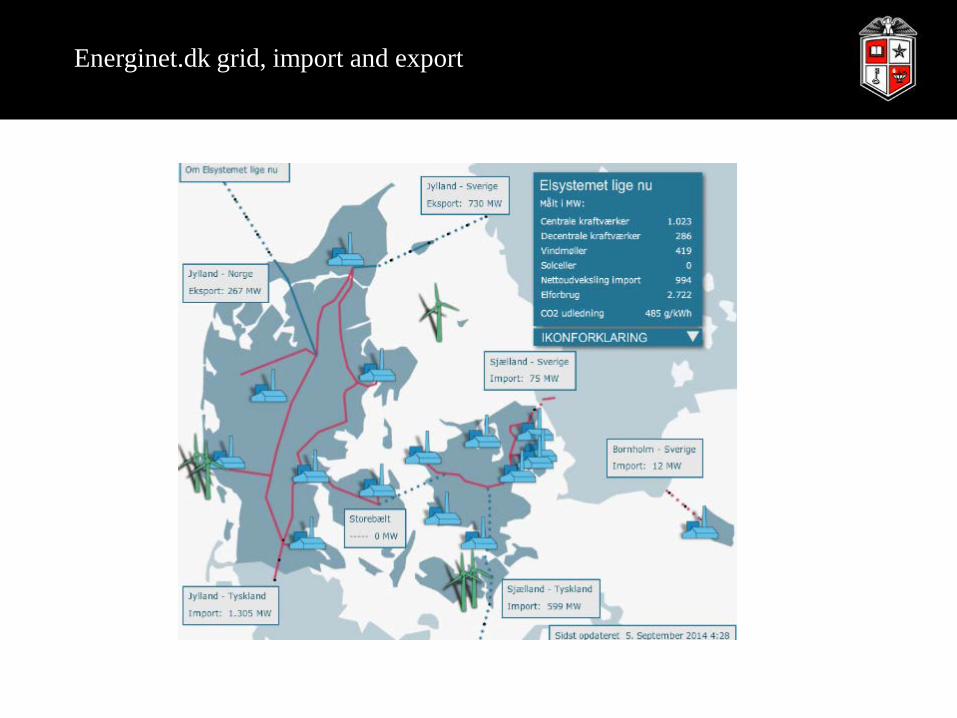
Energinet.dk grid, import and export
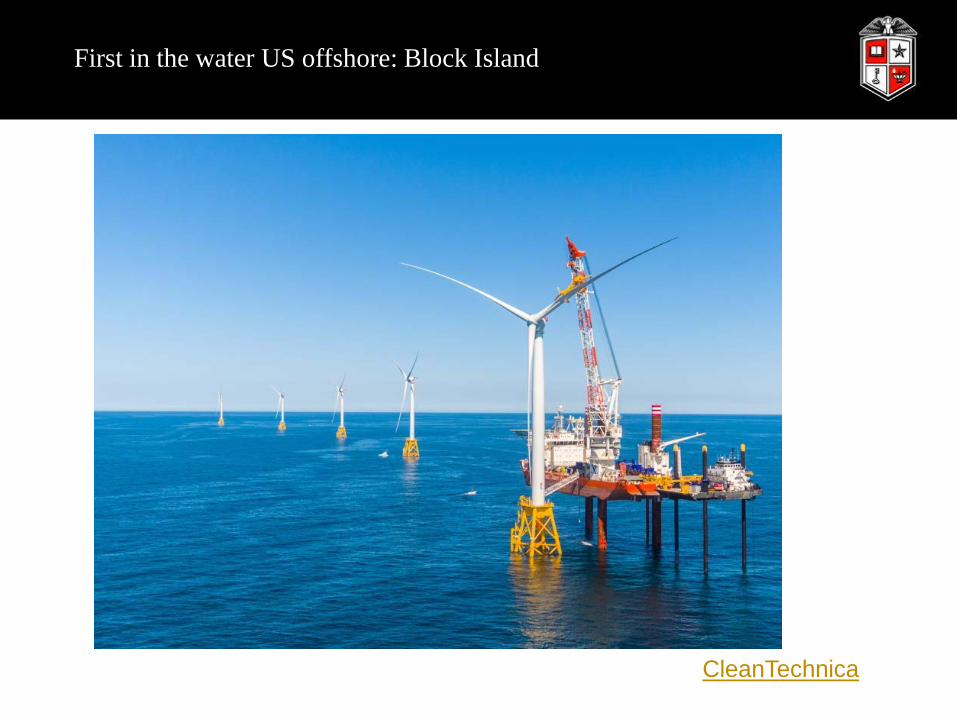
First in the water US offshore: Block Island
CleanTechnica

Regional wind PPA’s Reducing offshore cost of energy is crucial
Sources: 2013 Wind Technologies market report, Wiser & Bolinger, LBNL / DOE *1, Fishermen PPA / NJ public utility board *2, DOE 2010 target for US offshore wind
Offshore: $199*1 DOE target: $100*2 by 2020, Average retail price US ~ $100 EU ~ $250

Offshore cost of energy, still some challenges
Source: http://windpower.org Danish wind power association

Wind energy is competitive – Texas is a world class leader
Gov. Bush signs Texas RPS goal of 2,000 MW
Texas updates RPS goal of 5,800 MW
Texas exceeds 12,000 MW No. 5 world wide 8.3% penetration
2013 Wind Technologies market report, Wiser & Bolinger, LBNL / DOE
Texas exceeds 18,000 MW No. 5 world wide 15.1% penetration
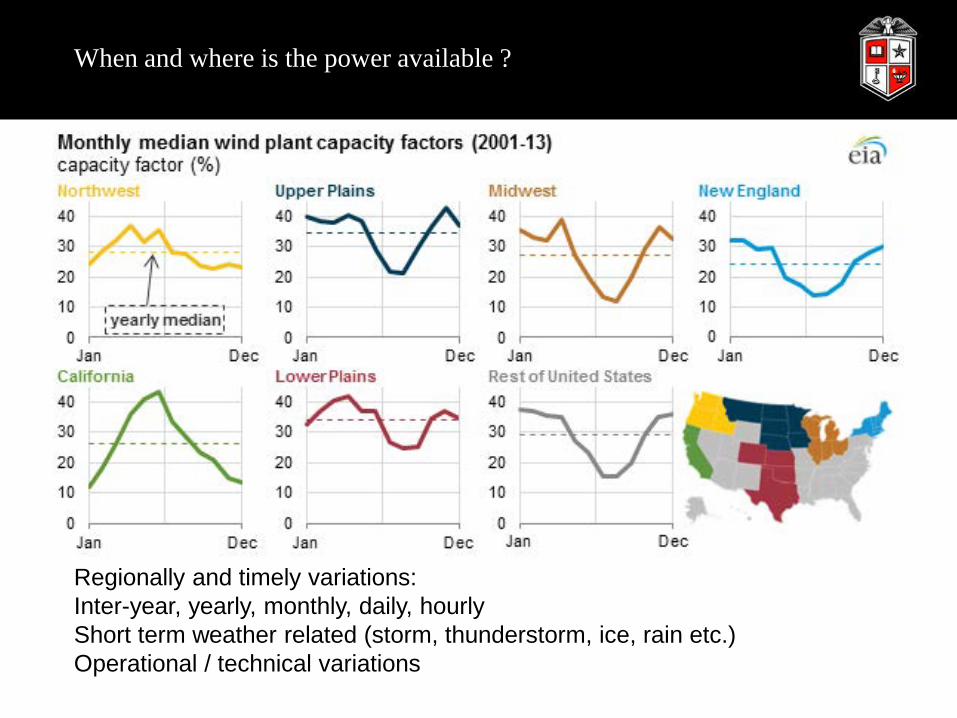
When and where is the power available ?
Regionally and timely variations: Inter-year, yearly, monthly, daily, hourly Short term weather related (storm, thunderstorm, ice, rain etc.) Operational / technical variations

The challenge
• Function • Spatial shift of energy (transmission and delivery) • Balancing between sources (wind, solar, fossil, nuclear) • Time shift of energy (storage) • Load and peak values management • Ancillary services support
• Cost • Meeting demand / market price • Storage media lifetime consumptions cost (and efficiency) • Turbine lifetime consumption cost • System cost and ownership structure
• Control • Forecasting of potential generation • Plant control technology • Source control and transmission control • Meet market / demand – delivery and price • Ownership structures and market pricing

Conclusions
• Denmark has exceed 100% wind many time @around 30%
• Strong interconnect • Strong market • One grid operator
• Texas has reached up to 50% wind several times @around 15%
• Strong market • One grid operator
• Offshore wind energy will continue to grow, but fundamentally price and available space play an important role in the US
• On the wind technology side, be careful predicting the future using past data
