currency trader (200708)
DESCRIPTION
TRANSCRIPT
August 2007
Volume 4, No. 8
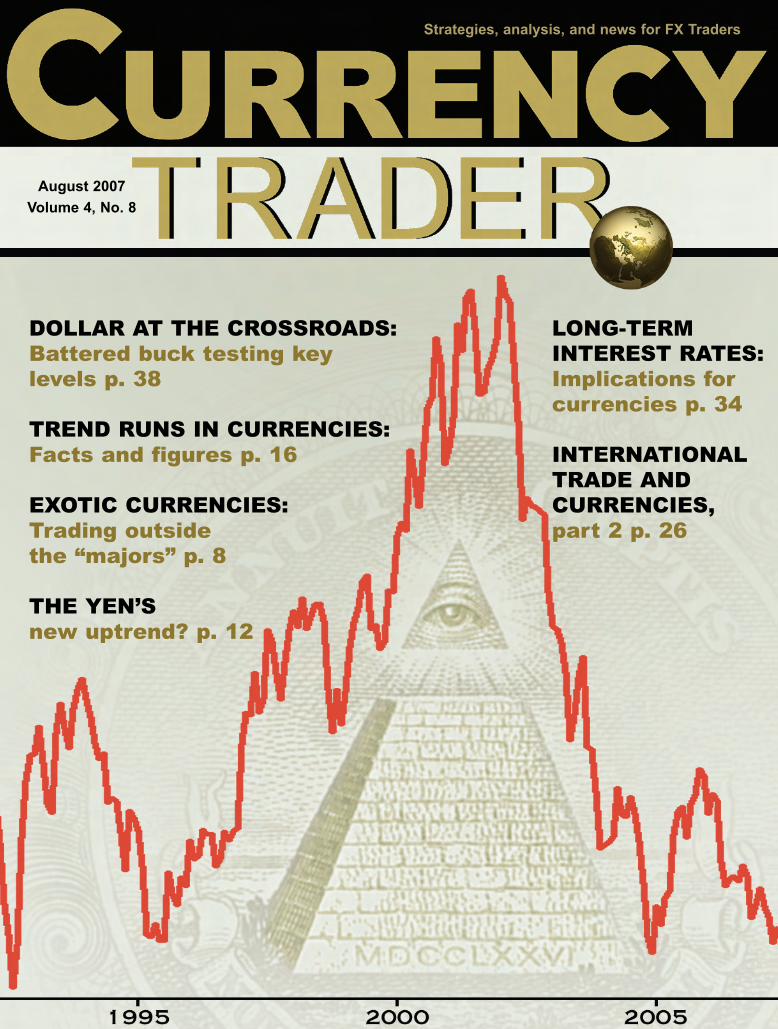
Strategies, analysis, and news for FX Traders
DOLLAR AT THE CROSSROADS:Battered buck testing key levels p. 38
TREND RUNS IN CURRENCIES:Facts and figures p. 16
EXOTIC CURRENCIES:Trading outside the “majors” p. 8
THE YEN’S new uptrend? p. 12
LONG-TERM INTEREST RATES:Implications for currencies p. 34
INTERNATIONALTRADE AND CURRENCIES,part 2 p. 26

Contributors . . . . . . . . . . . . . . . . . . . . .6
Global MarketsBeyond the majors: The exotic waters of emerging-market currencies . . . . . .8Some forex brokers are offering access tomore currency pairs, but you need to knowthe risks associated with these markets beforeyou consider trading them.By Currency Trader Staff
On the MoneyThe rising yen — here we go again . . . . . . . . . . . . . . . .12The yen has been on the rise vs. the dollar. Find out if it’s a reversal or just a correction.By Barbara Rockefeller
Trading StrategiesShort-term trends in the EUR/USD pair . . . . . . . . . . . . .16This study shows how often different runs of consecutive higher or lower highs, lows, and closes occur in the euro/dollar pair. By Currency Trader Staff
Advanced StrategiesMinor currencies and federal reserve trade weights . . . . . .26A continuation of last month’s analysis of the relationship between trade and currencies undermines one of the basic premises of the floating exchange-rate system. By Howard L. Simons
Trading BasicsLong-term interest rates and the U.S. dollar . . . . . . . . . . . . . . .34What the recent rise in T-bond and T-noteyield implies for the FX market. By David Mantell
Spot CheckU.S. dollar index . . . . . . . . . . . . . . . .38The greenback has recently established all-time lows against many currencies. Find out what analysis of the dollar index says about the probabilities of the buck’s next move.By Currency Trader Staff
CONTENTS
2 August 2007 • CURRENCY TRADER
continued on p. 4


4 August 2007 • CURRENCY TRADER
CONTENTS
Have a question about something you’ve seen in Currency Trader?
Submit your editorial queries or comments to
Looking for an advertiser?Consult the list below and click on the company name for a direct link to the ad in this month’s
issue of Currency Trader.
Advertising index
Industry NewsNew NFA proposal could cause significant shakeup among forex brokerages . . . . . . . . . . . . . . . .42The National Futures Association wants new capital requirements that could force several forex brokerages out of business.
USFE to list forex futures . . . . . . . . .42The United States Futures Exchange will roll out currency futures that mimic the pricing of spot forex positions.
Currency Futures . . . . . . . . . . . . . . .44Currency fund manager performance.
Global News Briefs . . . . . . . . . . . . .45
International Market Summary . . . . . . . . . . . . . . . . . . . . . . .46
Currency, interest rate, and equity performance from around the globe.
Global Economic Calendar . . . . . . . . .48Key dates for currency traders.
New Products and Services . . . . . . . . .49
The Face of Trading . . . . . . . . . . . . . . .49Rolling with the punches.
Key Concepts . . . . . . . . . . . . . . . . . . . .50
Events . . . . . . . . . . . . . . . . . . . . . . . . . .51Conferences, seminars, and other events.
Forex Trade Journal . . . . . . . . . . . .52Too late to sell the dollar? A position in the dollar index futures tells the tale.
CMS Forex
Currency Trader Bookstore
Deutsche Bank
eSignal
Forex.com
Forex Expo
Forexrtadingseminar.com
FXCM
FXStreet.com
InterbankFX
Market Technicians Assoc.
MetaStock
NewsTrader Pro
TradeGuider
About the authorEdward Ponsi is the President of FXEducator LLC and is the former Chief Trading Instructor for Forex Capital Markets (FXCM). An experienced trader and mentor, Ed gives personal, one-on-one trading instruction to students around the world, and has advised hedge funds, Interbank traders, and individuals of all levels of skill and experience.
Why is it the fastest growing segment for individual investors and many former equity and futures traders?
MetaStock, the leading creator of technical analysis software, is excited about the FOREX market — and for good reason. It’s one of the best ways for YOU to get started in investing. To help you along, we want to give you a FREE copy of “Successful FOREX Trading.” Written by the former Chief Trading Instructor for FOREX Capital Markets. This book explains technical analysis as it relates to currency trading. This valuable information is FREE, no strings attached. To get your copy, visit our web site, or give us a call at (800) 432-4917 and mention the promotion code CT67
Click Here for your FREE Book
This is neither a solicitation to buy or sell any type of financial instruments, nor intended as investment recommendations. All investment trading involves multiple substantial risks of mon-etary loss. Don’t trade with money you can’t afford to lose. Trading is not suitable for everyone. Past performance, whether indicated by actual or hypothetical results or testimonials are no guarantee of future performance or success. NO REPRESENTATION IS BEING MADE THAT ANY ACCOUNT WILL OR IS LIKELY TO ACHIEVE PROFITS OR LOSSES SIMILAR TO THOSE SHOWN. IN FACT, THERE ARE FREQUENTLY SHARP DIFFERENCES BETWEEN HYPOTHETICAL PERFORMANCE RESULTS OR TESTIMONIALS AND THE ACTUAL RESULTS SUBSEQUENTLY ACHIEVED BY ANY PARTICULAR TRADING PROGRAM. Furthermore, all internal and external computer and software systems are not fail-safe. Have contingency plans in place for such occasions. Equis International assumes no responsibility for errors, inaccuracies, or omissions in these materials, nor shall it be liable for any special, indirect, incidental, or consequential damages, including without limitation losses, lost revenue, or lost profits, that may result from the reliance upon the information materials presented.
FOREXBy far the largest cash value traded market in the world. The trade happening in the forex markets across the globe currently exceeds US$1.9 trillion/day (on average).
FREE Book

�Howard Simons is president of
Rosewood Trading Inc. and a strategist for
Bianco Research. He writes and speaks fre-
quently on a wide range of economic and
financial market issues.
� Barbara Rockefeller (http://www.rts-forex.com) is an
international economist with a focus on foreign exchange. She
has worked as a forecaster, trader, and consultant at Citibank
and other financial institutions, and currently publishes two
daily reports on foreign exchange. Rockefeller is the author of
Technical Analysis for Dummies (For Dummies, 2004), 24/7
Trading Around the Clock, Around the World (John Wiley &
Sons, 2000), The Global Trader (John Wiley & Sons, 2001), and
How to Invest Internationally, published in Japan in 1999. A
book tentatively titled How to Trade FX is in the works.
� David Mantell is a currency trader at Chicago Global
Investors, where he trades currency futures in the euro, yen,
British pound, Swiss franc, and Canadian dollar. He began his
career in the financial markets 15 years ago as a financial
advisor. Mantell is a former equity research analyst, having
covered the media & telecommunications (wireline and wire-
less) industries. As part of his MBA, Mantell attended the
ESSEC Business School in Paris. He can be contacted at
� Thom Hartle (http://www.thomhartle.com) is director
of marketing for CQG and a contributing edi-
tor to Active Trader magazine. In a career span-
ning more than 20 years, Hartle has been a
commodity account executive for Merrill
Lynch, vice president of financial futures for
Drexel Burnham Lambert, trader for the
Federal Home Loan Bank of Seattle, and edi-
tor for nine years of Technical Analysis of Stocks & Commodities
magazine. Hartle also writes a daily market blog called hartle
& flow (http://www.hartleandflow.com).
6 August 2007 • CURRENCY TRADER
Editor-in-chief: Mark [email protected]
Managing editor: Molly [email protected]
Senior editor: Jeff Ponczak [email protected]
Contributing writers:Barbara Rockefeller,
Howard Simons, Marc Chandler
Editorial assistant andWebmaster: Kesha Green
Art director: Laura [email protected]
President: Phil [email protected]
Publisher,Ad sales East Coast and Midwest:
Ad sales West Coast and Southwest only:
Allison [email protected]
Classified ad sales: Mark [email protected]
Volume 4, Issue 8. Currency Trader is published monthly by TechInfo, Inc., 150 S. Wacker Drive, Suite 880, Chicago, IL 60606. Copyright © 2007TechInfo, Inc. All rights reserved. Information in this publication may not bestored or reproduced in any form without written permission from the publisher.
The information in Currency Trader magazine is intended for educational pur-poses only. It is not meant to recommend, promote or in any way imply theeffectiveness of any trading system, strategy or approach. Traders are advisedto do their own research and testing to determine the validity of a trading idea.Trading and investing carry a high level of risk. Past performance does notguarantee future results.
For all subscriber services:www.currencytradermag.com
A publication of Active Trader®
CONTRIBUTORSCONTRIBUTORS


While the vast majority of forex tradingoccurs in the so-called “majors” — thecurrencies of G-10 countries — someretail forex brokerages are beginning to
expand their offerings to include emerging-market or“exotic” currencies.
Such currencies include the Mexican peso, South Africanrand, Singapore dollar, Thailand baht, Brazilian real, andHong Kong dollar.
There are many reasons forex trading revolves around ahandful of currency pairs, most of which include either theU.S. dollar or the euro, but the most important are liquidityand stability. It’s often said the forex market is the most liq-uid in the world, and that liquidity is based on the stabilityof a few countries and regions that, through history and for-tune, have come to dominate global trade and finance. It isno coincidence that oil and gold are priced globally in dol-lars.
For example, Brazil is a developing country at the fore-front of a Latin American boom — several countries arebucking for “first-world” status. But despite the fact it’s hadone of the hottest currencies in recent years, Brazil has gonethrough a few “new” currencies in the past two decades asits economy has busted and boomed.
Nonetheless, some emerging market currencies are edg-ing into the mainstream of the forex world.
Why trade exotics?Some analysts contend exotic currencies tend to trend bet-ter than the majors because their economies are often nar-rowly focused, or even dependent on one specific industryor investment theme.
GFT Forex and Oanda.com currently include exotic cur-rency trading on their retail trading platforms.
“Exotic currency pairs provide traders with the ability totake advantage of trends that can be established by largemoney taking positions in these less-liquid currencies,”says Paul Jamgotch, dealing desk manager at GFT. “Exoticsare also attractive to traders who keep their eyes on the fun-damental factors that can affect these smaller financial mar-kets. Also, it gives retail traders a way to speculate in theeconomies of countries that don’t offer easy access to othertrading vehicles, such as bonds or stocks.”
Diversification is another argument in favor of expand-ing into the exotic arena.
“Having exposure to just the major pairs really narrowsthe scope of a trader’s portfolio,” says Richard Lee, curren-cy strategist at FXCM. “Portfolio returns in emerging mar-kets are also outpacing major-currency investments.”
While FXCM currently does not provide access to emerg-ing market currencies on their retail platform, they do pro-vide research in the Hong Kong and Singapore dollars, aswell as the Chinese yuan.
“Additional instruments are good because they offer
GLOBAL MARKETS
Beyond the majors: The exotic waters
of emerging market currencies
8 August 2007 • CURRENCY TRADER
BY CURRENCY TRADER STAFF
Experience required: There are opportunities in emerging-market currencies, but traders should
nonetheless be careful about venturing outside the highly liquid major currency pairs.
Some strategists caution that only the
most seasoned retail players should
enter the exotic currency arena
because of its higher volatility, lower
liquidity, and wider spreads.

CURRENCY TRADER • August 2007 9
diversification,” says Richard Olsen, co-founder ofOanda.com. “Anyone trading any market wants to diversi-fy.”
Oanda gradually began adding exotic cross rates to itsretail platform starting in 2006 and Olsen says it has beenmet with “an astonishing amount of interest.” Oanda has a fairly wide offering of exotic currency crosses, includingcrosses with the euro dollar vs. emerg-ing market currencies. (For a list of Oanda’s current exotic pairs offer-ings see: https://fxtrade.oanda.com/spreads/all_spreads.shtml.)
Higher risk levelsWith opportunity, of course, comesrisk. Brian Dolan, chief currencystrategist at Forex.com, a division ofGain Capital, says his firm currentlydoes not offer emerging market cur-rencies to retail clientele because of liq-uidity and the lack of running prices.
“There is tremendous potential insome of the [exotic currencies], but it isa whole new level of risk versus the G-10 currencies,” he says.
Wider spreads, more volatilityForex traders should not jump into theworld of the exotics without a greatdeal of research and understanding ofthe risks associated with these curren-cies. Some strategists caution that onlythe most seasoned retail playersshould enter this arena because of thehigher volatility, lower liquidity, andwider spreads these currencies tend todisplay.
“The spreads on exotics can be fair-ly wide because these markets are lessliquid,” says GFT’s Jamgotch. “Retailtraders need to keep in mind there islimited liquidity in many exotic pairs,which means spreads tend to widenwhen these local financial markets arenot open.
“The typical GFT spread for theUSD/ZAR (U.S. dollar/South Africanrand pair) is 150 pips, and during somemarket conditions, such as when theSouth African market is closed, it is notuncommon for the spread to widen tomore than 500 pips.”
FXCM’s Lee says volatility and liq-uidity are bigger concerns than people
think when trading emerging markets because retailtraders are not used to violent fluctuations.
”Unless retail investors trade crosses such as thepound/yen, they are more [accustomed to] 30-pip dailyfluctuations,” he says. “The rand moves almost 10 timesthat in single session. However, you always have to take
continued on p. 10

into account the pip cost, which essentially puts things backinto perspective.”
A pip in the ZAR currently is worth about $1.45 vs., say,roughly $10 for a pip in the euro/dollar pair.
“Another factor retail traders should be aware of is thevolatility in exotic currencies around fundamental newsreleases can be much higher than in major currencies,” saysGFT’s Jamgotch. “This means market gaps and slippage aremore common.”
Keep things smallAs market conditions can shift rapidly in the exotic curren-cy environment, strategists advise retail customers to mon-itor and limit position sizes carefully.
“Exotic currencies can become very volatile and illiquidwithout warning,” Jamgotch says.
For example, he pointed to when the Thai baht fell morethan four percent against the U.S. dollar in December 2006when the Bank of Thailand imposed penalties on invest-ments held for less than a year. Spreads on the U.S. dol-lar/Thai baht cross spiked from 5 pips to 100 or more,depending on the institution. Jamgotch says many marketmakers chose not to offer Thai baht crosses during this tur-bulent time.
Exotic currency traders also have to face the reality that itmay be difficult to exit positions because of lack of liquidi-ty outside of local trading hours.
“At the end of the day, it is almost like a futures marketposition, when the futures close at 2 o’clock and you can’tget out until the next day,” warns Forex.com’s Dolan. Forexample, he notes that outside of North American tradinghours, liquidity is “pretty poor” in the Mexican peso.
“Whatever you do, put on smalltrades,” suggests Oanda co-founderOlsen.
Longer-term playsGiven the wider spreads and reducedliquidity of some exotic currencies,some strategists feel the longer-termtime frame is a better choice than daytrading in this arena. Dolan cautionsthose interested in expanding into theexotics.
“For the retail guy, the risks probablyoutweigh the rewards,” he says. “If theydo get into it, it has to be more of astrategic and longer-term play.”
Olsen agrees on the time frame out-look.
“While a euro/dollar trader mighttrade a two- to three-hour position, ayuan play could last two to five weeks,”he says. “Trades put on in emergingmarket currencies are different in
nature, and tend to be on more of a long-term time frame.”
Do your homeworkGaining access to the appropriate fundamental informationneeded to make trading decisions may be harder whenlooking at the exotic currency landscape.
“There are fewer news announcements and bankresearch available for some of these exotic currencies,” saysGFT’s Jamgotch. “This means that it can be more difficultfor retail traders to conduct proper research needed tomake informed decisions based on fundamental data.”
“Exotic” to watch: South African randFXCM’s Lee says the South African rand (ZAR) is a curren-cy to watch near-term (Figure 1).
“Given the recent attention on carry trades and interestrates, I still think that the ZAR has some potential,” he says.”Technically, however, I might be waiting a bit for a betterprice, as we’re approaching a major support level (in lateJuly).”
The South African Reserve Bank hiked interest rates inearly June from 9.0 percent to the current 9.5 percent.Bullish interest-rate differentials alone favor the rand vs.the U.S. dollar’s 5.25 percent fed funds rate.
Looking at the differential, Lee says it’s still a good per-centage to play.
Rand: Key fundamentalsGold and platinum prices are two factors that drive theSouth African rand; some traders essentially use the rand asa proxy for the world gold market.
Clyde Wardle, senior emerging market FX strategist at
GLOBAL MARKETS continued
10 August 2007 • CURRENCY TRADER
In late July the U.S. dollar/South African rand pair was just beginning to penetratethe bottom of its long-term range and was trading at its lowest level in a year.
FIGURE 1 — DOLLAR/RAND
Source: ADVFN (http://www.advfn.com)

CURRENCY TRADER • August 2007 11
HSBC, notes the rand strengthened roughly five percentfrom June to July.
“It was at 7.20-7.30 in early June and now it has movedbelow 7.00,” he says.
As of late July, the USD/ZAR was trading at 6.88. Wardlepointed to the rally in the gold market from late June as onefactor supporting the rand in recent weeks.
HSBC forecasts overall grossdomestic product (GDP) growth at 5.4percent for South Africa in 2007, vs.2006’s 5.0-percent reading. Inflationremains high, which has been a drivertoward tighter monetary policy. TheMay CPI ex-food and energy figureposted a 6.4-percent reading year-over-year in South Africa.
“The economy is improving andhas been improving for the past cou-ple of years,” Lee says. “GDP andmanufacturing are healthy and con-sumer spending has picked up.”
Wardle adds in the past the SouthAfrican Reserve Bank had discomfortwith currency strength below 7.00amid worries that it would hurtdomestic manufacturing.
“Given rising inflation, the centralbank should be comfortable with thestrengthening currency,” he says.
Rand: Key price levelsOverall, HSBC forecasts continuedstrengthening in the rand toward 6.75by the end of third quarter. Weaknessis seen into early 2008, with a first-quarter forecast of 7.25.
“I’m looking for a technical break ofthe support the currency pair is cur-rently trading at, around the 6.8606(the May 8 low),” Lee says. “If thislevel is broken, I would be looking toinitiate a long around that area withtargets set at 6.4050, just below the6.427, 76.4-percent Fibonacci retrace-ment of the 5.9446-7.983 bull wave.”
Global risk appetite helps,tooThe global environment remainsfavorable toward emerging markets,which is positive for the rand. Also,given its relatively high interest rate,the rand has been a player in the glob-al carry trade, as well.
“The global risk appetite has
improved,” Wardle says. “Liquidity is still very looseacross the globe, which encourages managers to search foryield.”
The main risk, Wardle warns, is the external environ-ment. If global stock markets were to come under pressure,money managers could trim exposure to emerging-marketpositions, which would likely result in a weaker rand.�
12 August 2007 • CURRENCY TRADER
Last month’s article (“The hammer and the yen,”Currency Trader, July 2007) discussed a potentialtrend reversal in the Japanese yen (JPY) that isdeveloping the way we feared. So far the yen
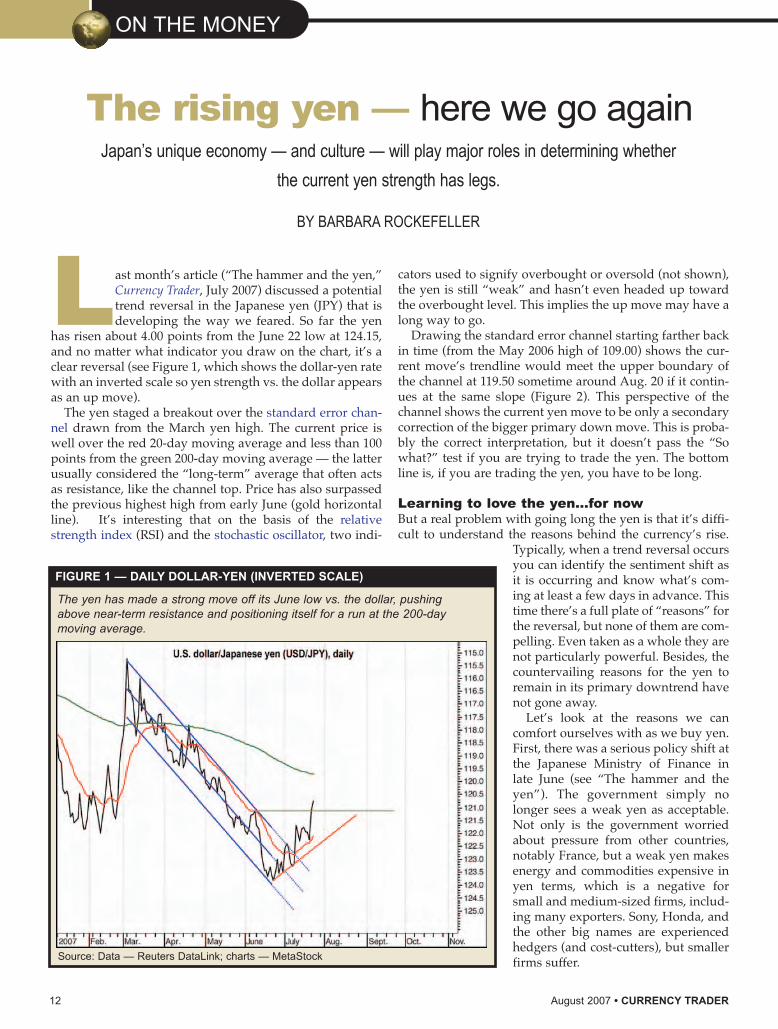
has risen about 4.00 points from the June 22 low at 124.15,and no matter what indicator you draw on the chart, it’s aclear reversal (see Figure 1, which shows the dollar-yen ratewith an inverted scale so yen strength vs. the dollar appearsas an up move).
The yen staged a breakout over the standard error chan-nel drawn from the March yen high. The current price iswell over the red 20-day moving average and less than 100points from the green 200-day moving average — the latterusually considered the “long-term” average that often actsas resistance, like the channel top. Price has also surpassedthe previous highest high from early June (gold horizontalline). It’s interesting that on the basis of the relativestrength index (RSI) and the stochastic oscillator, two indi-
cators used to signify overbought or oversold (not shown),the yen is still “weak” and hasn’t even headed up towardthe overbought level. This implies the up move may have along way to go.
Drawing the standard error channel starting farther backin time (from the May 2006 high of 109.00) shows the cur-rent move’s trendline would meet the upper boundary ofthe channel at 119.50 sometime around Aug. 20 if it contin-ues at the same slope (Figure 2). This perspective of thechannel shows the current yen move to be only a secondarycorrection of the bigger primary down move. This is proba-bly the correct interpretation, but it doesn’t pass the “Sowhat?” test if you are trying to trade the yen. The bottomline is, if you are trading the yen, you have to be long.
Learning to love the yen…for nowBut a real problem with going long the yen is that it’s diffi-cult to understand the reasons behind the currency’s rise.
Typically, when a trend reversal occursyou can identify the sentiment shift asit is occurring and know what’s com-ing at least a few days in advance. Thistime there’s a full plate of “reasons” forthe reversal, but none of them are com-pelling. Even taken as a whole they arenot particularly powerful. Besides, thecountervailing reasons for the yen toremain in its primary downtrend havenot gone away.
Let’s look at the reasons we cancomfort ourselves with as we buy yen.First, there was a serious policy shift atthe Japanese Ministry of Finance inlate June (see “The hammer and theyen”). The government simply nolonger sees a weak yen as acceptable.Not only is the government worriedabout pressure from other countries,notably France, but a weak yen makesenergy and commodities expensive inyen terms, which is a negative forsmall and medium-sized firms, includ-ing many exporters. Sony, Honda, andthe other big names are experiencedhedgers (and cost-cutters), but smallerfirms suffer.
ON THE MONEY
The rising yen — here we go againJapan’s unique economy — and culture — will play major roles in determining whether
the current yen strength has legs.
BY BARBARA ROCKEFELLER
The yen has made a strong move off its June low vs. the dollar, pushingabove near-term resistance and positioning itself for a run at the 200-daymoving average.
FIGURE 1 — DAILY DOLLAR-YEN (INVERTED SCALE)
Source: Data — Reuters DataLink; charts — MetaStock

CURRENCY TRADER • August 2007 13
It’s wise to respect a stated policyshift such as this because governmentscan be powerful influences, althoughwe hardly ever see the influence atwork. It’s done behind the scenesusing what is euphemistically called“moral suasion.” In a phone call, overdrinks, or at the golf course, an officialmakes a gentle suggestion to a bankeror broker, (“…and Bob’s your uncle”),and the disliked behavior stopsinstantly. Governments regulate banksand brokers, plus they tax everybody.You disobey a government official’ssuggestion at your peril. And in Japan,respect for authority runs high.
There are numerous ways the gov-ernment could nudge institutionsaway from a weaker yen. Japaneseretail investors are avidly pursuingaccounts denominated in other curren-cies, for example, but that would tendnot to be the focus. Instead, attentionwould likely turn to cutting lines ofcredit to speculators, chiefly hedgefunds, especially if they invested inU.S. sub-prime paper. This would killtwo birds with one stone — halting anoutflow from yen and reducing expo-sure to high-risk paper.
The sub-prime housing problem inthe U.S. has already hit a number ofhedge funds, the main players in thecarry trade. An Australian hedge fundhired Blackstone to advise it on sub-prime investments, and immediatelyeveryone suspects these investmentswere made with borrowed yen. Wedon’t know that for a fact, but the meresuspicion suffices to goad sometraders into imagining that if there isone firm doing this, there might bedozens.
As far as we know, no hedge fundusing borrowed yen to invest in U.S.sub-prime has actually gone under,and we do not know if the sub-primeproblem is going to contaminate othercollateralized debt funds to the pointof failure. But from the hysteria in theblogosphere, you’d think widespreadinstitutional failure is imminent.Nearly all hedge funds are non-Japanese, but if Japanese banks areproviding the funding, they are at risk,too.
Japan has no intention of letting its
banks fall victim to dud loans to suchinstitutions — or forex trades, either.Presumably, lending to hedge fundshas been curtailed, along with creditlines for simple position-taking trad-ing. As for lending to domesticJapanese funds, Japan’s nine biggestbanking groups have more than ¥1 tril-lion ($8.3 billion) in various instru-ments backed by U.S. sub-prime mort-gages, according to the JiJi newswire.
In late July, Financial ServicesAgency (FSA) chief Yuji Yamamototold the press the government is close-ly monitoring Japanese financial insti-tution risk-management practices. TheFSA finds the banks “well-prepared.”Considering the entire banking sectorwas in the tank only 10 years ago andsurvived only with massive govern-ment bailouts, we wonder whetherthis can be true, but never mind. Weshould probably assume thatYamamoto told the banks to stopinvesting in the sector and perhapseven to dump some of the paper. Suchtrades are, in effect, repatriation, andautomatically entail buying yen.
This presupposes the Japanese insti-tutions do not just switch to better-quality foreign paper. After all, theyield differential is still vastly in the
The reversal on the daily time frame currently is nothing more than a correctionin the yen’s long-term downtrend.
FIGURE 2 — WEEKLY DOLLAR-YEN (INVERTED SCALE)
Source: Data — Reuters DataLink; charts — MetaStock
continued on p. 14
ON THE MONEY continued
14 August 2007 • CURRENCY TRADER
favor of the Australian dollar, New Zealand dollar, Britishpound, euro, and U.S. dollar. If the Japanese government wereasking its financial institutions to forego that additional yield,it would be a shocking interference with private business.(That doesn’t mean they wouldn’t do it.)
Another “reason” behind the yen’s rise is the widely expect-ed Bank of Japan (BOJ) rate hike in September or October,although possibly as early as August. This argument reallydoesn’t hold water. A rate hike would still leave a very largegulf between Japanese and foreign paper, although we canadmit that if the famously reticent BOJ were to raise rates in theabsence of inflationary pressure in the name of “normaliza-tion” and a nod to superior growth, then we need to pay atten-tion; more hikes will be on the way. This is a tremendously con-tentious issue: Under what circumstances should a centralbank, facing zero inflation, raise rates?
One answer is that Japan has failed to become a global finan-cial center on par with New York or London, but has not aban-doned the objective. Japan has the world’s second-largest econ-omy but Tokyo is not the world’s second largest financial cen-ter. In fact, Tokyo has lost rank over the past 15 years. TheTokyo Stock Exchange is the world’s second-largest after theNew York Stock Exchange, but its capitalization is only 10 per-cent of world capitalization, even as emerging markets rockethigher. It had one-third of world capitalization in 1990.
Foreigners don’t want to list their companies in Tokyo, withonly 25 listing last year, from 125 the year before. New York,even with the deterrent of Sarbanes-Oxley rules, attractedmore than 440 in 2006. Worse, in recent years the Tokyo StockExchange has had some huge technology failures that shutdown trading for entire days. Despite being the land of elec-tronics, the exchange is considered technologically deficient.Singapore and Hong Kong, with tiny economies, are biggerand more dynamic — and associated by language, history, andculture with China, which is rapidly displacing Germany asthe third largest economy.
The first study group on enhancing Japan’s position as aninternational financial center was held in 2003, but it seems tobe new FSA chief Yamamoto who is reviving the initiative. Headheres to the belief that you can’t be a major world financialcenter with a falling currency that fails to reflect good econom-ic fundamentals, which in Japan’s case is the highest growthrate in the world in 2006. However, wishing to be a worldfinancial center is not the same thing as knowing how to getthere.
Is it even remotely reasonable to assume that engineering astronger yen can be viewed as a prerequisite to this goal, andlet’s worry about the rest of the components of becoming aworld center later on? Yes. It is exactly the kind of straight-linethinking we have seen from Japan in the past — and oddly, itoften succeeds.
Working on becoming a world financial center could remainan objective of whatever government is in office, and PrimeMinister Shinzo Abe and his coalition government risk losingpower in the July 29 elections. Even if Yamamoto does notremain the FSA chief, the next guy would be bound by the
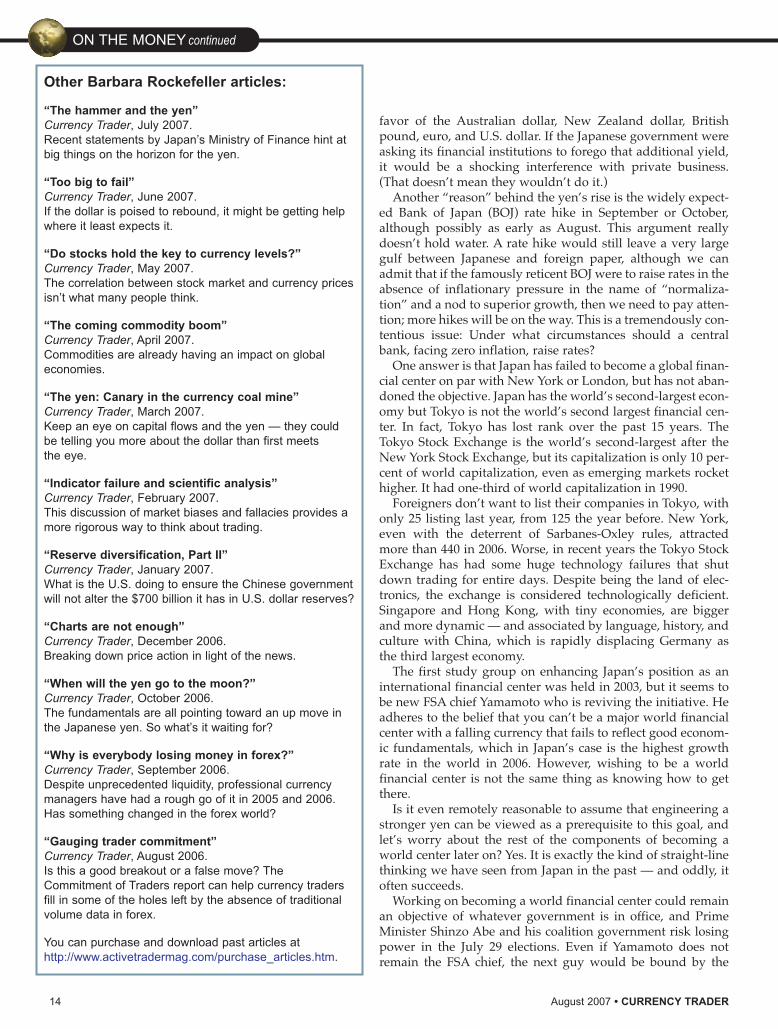
Other Barbara Rockefeller articles:
“The hammer and the yen”Currency Trader, July 2007.Recent statements by Japan’s Ministry of Finance hint atbig things on the horizon for the yen.
“Too big to fail”Currency Trader, June 2007.If the dollar is poised to rebound, it might be getting helpwhere it least expects it.
“Do stocks hold the key to currency levels?” Currency Trader, May 2007.The correlation between stock market and currency pricesisn’t what many people think.
“The coming commodity boom” Currency Trader, April 2007.Commodities are already having an impact on globaleconomies.
“The yen: Canary in the currency coal mine” Currency Trader, March 2007.Keep an eye on capital flows and the yen — they couldbe telling you more about the dollar than first meets the eye.
“Indicator failure and scientific analysis” Currency Trader, February 2007.This discussion of market biases and fallacies provides amore rigorous way to think about trading.
“Reserve diversification, Part II” Currency Trader, January 2007.What is the U.S. doing to ensure the Chinese governmentwill not alter the $700 billion it has in U.S. dollar reserves?
“Charts are not enough” Currency Trader, December 2006. Breaking down price action in light of the news.
“When will the yen go to the moon?” Currency Trader, October 2006. The fundamentals are all pointing toward an up move inthe Japanese yen. So what’s it waiting for?
“Why is everybody losing money in forex?” Currency Trader, September 2006. Despite unprecedented liquidity, professional currencymanagers have had a rough go of it in 2005 and 2006.Has something changed in the forex world?
“Gauging trader commitment” Currency Trader, August 2006. Is this a good breakout or a false move? TheCommitment of Traders report can help currency tradersfill in some of the holes left by the absence of traditionalvolume data in forex.
You can purchase and download past articles athttp://www.activetradermag.com/purchase_articles.htm.
overarching government objective.Japan has a splendid history of long-term planning. The next FSA head willpick up the internationalization effortwhere Yamamoto left off.
Having a stronger currency based inpart on higher interest rates is not theonly obstacle Yamamoto faces in try-ing to make Tokyo a global financialcenter. He also has to overcome a pen-chant for regulatory red tape that sti-fles innovation and encourages peopleto find ways around regulatory agen-cies (including the FSA itself) insteadof simply asking for exceptions andhelp.
Most observers say the biggestproblems are cultural. To be an inter-national center, you have to attract for-eigners to live and work in Tokyo. Butthe language is difficult to learn andhas complex nuances — the word for“risk” didn’t exist in Japanese, andcomes from English. Women are sec-ond-rate citizens and not representedat executive levels, a waste of half themanpower of the country. Japan hasits fair share of smart people, but argu-ing and disagreeing with others issocially unacceptable. It makes brain-storming particularly difficult. Andrespect for older people, while laud-able, restrains brash youngsters frommaking a splash. But splashiness anddisorder are what you need to sponsorchange.
The story is the storyOf all the reasons for the yen to be onthe upswing, the sub-prime hedgefund story seems to be the one that hascaptured traders’ imagination. Thatwe have no hard evidence of yen-funded hedge-fund failures and noevidence of a lending pullback,whether government-mandated ornot, is no deterrent to traders. It’s ajuicy story. It makes sense. All it willtake is one outright yen-fundedhedge-fund failure to send the yen tothe moon.
The yen can also go to the moon ifcarry trades actually do get unwound.We have been pooh-poohing thatstory, which has been used to explainany and every minor bounce upward
in the yen for the past six months,because hedge fund managers have a“strong hand.” It's not easy to stam-pede them out of lucrative positions.But each manager has a breakevenpoint and nerves get frayed evenwhen the yen is hundreds of pointsaway. After all, currencies can movehundreds of points in a short whileand currencies are famous for over-shooting, too.
More importantly, folks riding thecoattails of the yen carry trade, includ-ing those with plain vanilla futuresand forwards, are easy to panic. Asrisk aversion rises with every newstory about losses in subprime andother collateralized debt that was mis-priced, incompetently rated by the rat-ings agencies, or can’t be marked tomarket with any confidence, the carrytrade gets lumped in with other paperdeemed “high-risk.” This is not accu-rate — with the carry trade, all youneed to know is your breakeven point.You can count on the forex market toprovide sufficient liquidity for anorderly exit at just about any hour ofthe day or night. With truly high-riskpaper, the unknowns are plentiful,including markets so thin (illiquid)that no trading gets done at all. But therelative ease of exit doesn't matter tothose prone to panic — the yen carrytrade is considered speculative, andplenty of traders will simply dumppositions.
Add to that a possible rate hike anda government determined to rise inthe ranking of global financial centerson the back of a high currency and youhave a recipe for further gains.
Is this a castle built out of spunsugar? You bet. The whole thing cancome crashing down if the sub-primeproblem fades away with no big insti-tutional failures, Abe loses the elec-tion, the BOJ refuses to raise ratesbecause there is no inflationary reasonto raise rates, and the timetable forrestoring Tokyo to world status is seento be a project for a decade, not thenext three months. But in the mean-time, you have to go with the flow.�
For information on the author see p. 6.
CURRENCY TRADER • August 2007 15

TRADING STRATEGIES
16 August 2007 • CURRENCY TRADER
Acommon problem in the markets is tradingwith hindsight. For example, you make atrade, book a profit, and then watch themove continue — realizing you left money
on the table by not being more patient. Other times you waitfor that nice run that never materializes.
Trading with hindsight can introduce psychologicalissues when managing a trade. You might think you canjudge by the current conditions whether a big move is athand or not. But if you second-guess yourself for gettingout too early or too late, you’ll have problems taking thenext trade.
TRADING STRATEGIES
Analyzing both the duration and size of different price moves can clue you
in to more accurate trade setups.
BY CURRENCY TRADER STAFF
Short-term trendsin the EUR/USD pair
FIGURE 1 — DAILY EUR/USD
Source: CQGNet (http://www.cqg.com)
Two sharp runs — one up, one down — are marked on the chart. How often does this currency pair make consecutive dailyhigher highs or lows?

The best way to avoid this is to per-form a thorough analysis of marketbehavior and get some hard numberson which to base your trades. You willknow what typical market behavior isand can develop strategies aroundthat knowledge. In addition, perform-ing this type of market analysis on aregular basis will alert you to changesin market volatility.
For example, in Figure 1, the pricerun next to arrow “A” is a run of 13consecutive higher highs but only sixconsecutive higher closes. Arrow “B”marks a run of four consecutive lowerlows, but only three consecutive lowercloses. The question is, just how oftendo such runs occur?
This analysis dissects trend runsusing daily bars of the euro/U.S. dol-lar (EUR/USD) pair from July 1, 2003through June 29, 2007 and identifiesthe number of consecutive higher orlower highs, higher or lower lows,and higher or lower closes in different
continued on p. 18
FIGURE 2 — WEEKLY EUR/USD
Source: CQGNet (http://www.cqg.com)
The review period spanned July 2003 through June 2007.
CURRENCY TRADER • August 2007 17

18 August 2007 • CURRENCY TRADER
price moves, as well as other patterns. Figure 2 shows the review period using weekly bars, but
the analysis was performed on daily data.
Up moves vs. down movesTo get a handle on typical moves vs. what could be consid-ered outliers, Tables 1 and 2 show the EUR/USD’s basic
daily price range behavior. The top half of Table 1 compares one day’s session
to the next day’s session, detailing the number oftimes there were consecutive higher highs (HH),higher lows (HL), higher closes (HC), higher highsand higher closes (HH +HC), and higher highs, high-er lows, and higher closes (HH+HL+HC)
The bottom half of Table 1 shows the number oftimes there were consecutive lower lows (LL), lowerhighs (LH), lower closes (LC), lower lows and lowercloses (LL +LC), and lower lows, lower highs, andlower closes (LL+LH+LC).
First, the percentage change (on a closing basis) forthe entire review period was a gain of just over 17 percent.The table shows the influence of this long-term trend, but itis relatively minor — the numbers in the top half of thetable are slightly larger than the bottom. A closer look at thenumbers points to some interesting price action.
The market made either a higher high, higher low, orhigher close more than 50 percent of the time — unsurpris-
ing given the long-term trend.However, combining higher highsand higher closes dropped the per-centage to 35 percent of the time, andback-to-back higher highs, higherlows, and higher closes occurred justunder 29 percent of the time. This sug-gests that despite the buying pressurefrom one session to the next, traderstended to take profits going into theclose over 70 percent of the time.
None of the statistics in the bottomhalf of the table break the 50-percentlevel. However, the percentage oflower closes was higher than the per-centage of lower lows or lower highs.This implies there were inside dayswhen the market essentially paused;when the market could not generatean up move, traders moved out oflong positions, producing lower clos-es.
The percentage of consecutivelower lows and lower closes is justunder 32 percent and the percentageof consecutive lower lows, lowerhighs, and lower closes is slightly lessthan 25 percent. The bullish trend is
TRADING STRATEGIES continued
The EUR/USD trend was up for more than four years, which isreflected by the slight edge in the numbers for higher prices (tophalf of the table) vs. lower prices (bottom half of the table).
TABLE 1 — HIGHER HIGHS VS. LOWER LOWS
HH HL HC HH+HC HH+HL+HC
543 531 524 367 300
52.11% 50.96% 50.29% 35.22% 28.79%
LL LH LC LL+LC LL+LH+LC
503 492 512 332 256
48.27% 47.22% 49.14% 31.86% 24.57%

CURRENCY TRADER • August 2007 19
also reflected in these two statistics, because they suggestthere were times the market traded lower than the previoussession, but buyers came in and bid the market up to a high-er closing price.
Table 2 displays a more detailed breakdown of the fre-quency and length of runs in the EUR/USD pair. The “No.of days” row is the number of sessions that met the criteria.For example, “7” means a run of seven (or more) consecu-tive days; “6” means a run of six ormore sessions, etc.
Although, the table does not explic-itly show the exact number of occur-rences in each category, simple arith-metic reveals the answers. For exam-ple, there were 117 runs of three ormore consecutive higher closes (HC);these 117 runs are also part of the 254runs of two or more consecutive high-er closes (254 occurrences). As a result,there were 137 (254 - 117) runs of onlytwo consecutive days of higher closes.
The top half of Table 2 shows themarket made seven consecutive high-er closes only three times, or just 0.29percent of the time. The same statisticsare detailed for consecutively higherhighs and higher closes (HH+HC),and higher highs, higher lows, andhigher closes (HH+HL+HC). The bot-tom half of the table shows the infor-mation for lower closes (LC), lowerlows and lower closes (LL+LC), andlower highs, lower lows, and lowercloses (LH+LL+LC).
In light of the fact the long-term
trend was up during the review period, Table 2 has someinteresting details. First, there were more times the marketclosed down seven consecutive times than up. Of course,the difference (two) is not statistically significant, but thenumber of runs of consecutive lower closes is larger thanthe number of consecutive higher closes from lengths offour to seven days. (However, the percentage price changes
Despite the EUR/USD’s upward bias, the market posted seven consecutive higher closes (HC) only three times, while it madeseven consecutive lower closes on five different occasions.
TABLE 2 — EUR/USD RUNS
HC HH+HC HH+HL+HC
No. of days 7 6 5 4 3 2 7 6 5 4 3 2 7 6 5 4 3 2
Count 3 13 28 56 117 254 0 2 8 25 69 150 0 0 4 15 46 109
% 0.29% 1.25% 2.69% 5.37% 11.23% 24.38% 0.00% 0.19% 0.77% 2.40% 6.62% 14.40% 0.00% 0.00% 0.38% 1.44% 4.41% 10.46%
LC LL+LC LH+LL+LC
No. of days 7 6 5 4 3 2 7 6 5 4 3 2 7 6 5 4 3 2
Count 5 15 31 58 111 242 0 3 10 22 53 131 0 2 7 16 35 87
% 0.48% 1.44% 2.98% 5.57% 10.65% 23.22% 0.00% 0.29% 0.96% 2.11% 5.09% 12.57% 0.00% 0.19% 0.67% 1.54% 3.36% 8.35%
continued on p. 20

20 August 2007 • CURRENCY TRADER
TRADING STRATEGIES continued
during these runs is not included here.)There’s a similar pattern in the number of higher highs
and higher closes (HH+HC) relative to lower lows andlower closes (LL+LC). Neither category had any runs last-ing seven consecutive days, but the percentage of six- andfive-day runs of lower lows and lower closes edged out thepercentage of higher highs and higher closes.
The final comparison is higher highs, higher lows, andhigher closes (HH+HL+HC) vs. lower highs, lower lows,and lower closes (LC). There were two runs of six consecu-tive LH+LL+LC days on the bear side, and the five-day andfour-day runs outnumbered the HH+HL+HC counterparts.
Size of price movesTable 3 details the percentage size of price moves from oneto five days in length for the entire review period, as well asin 12-month increments. Included are the average, median,maximum, minimum, and standard deviation for eachclose-to-close move, largest up move (LUM), and largestdown move (LDM) for each period (see “UnderstandingTable 3” for details about the statistics).
For example, for the entire analysis period, the averagethree-day close-to-close change was a gain of 0.05 percent,the maximum gain was +2.99 percent (which occurred inthe July 1, 2003 to June 30, 2004 period) and the largest
The percentage price moves from one to five days is shown for the total review period as well as for 12-month sub-periods.
TABLE 3 — MARKET PERFORMANCE
Total D1 LUM LDM D2 LUM LDM D3 LUM LDM D4 LUM LDM D5 LUM LDMAvg 0.02% 0.41% -0.42% 0.03% 0.60% -0.59% 0.05% 0.74% -0.72% 0.07% 0.86% -0.82% 0.08% 0.97% -0.90%Med 0.01% 0.31% -0.32% 0.02% 0.49% -0.46% 0.08% 0.59% -0.55% 0.08% 0.71% -0.63% 0.11% 0.81% -0.68%STD 0.56% 0.35% 0.35% 0.77% 0.47% 0.49% 0.93% 0.57% 0.59% 1.08% 0.65% 0.68% 1.19% 0.73% 0.75%7/1/2003-6/30/2004Avg 0.02% 0.51% -0.53% 0.05% 0.74% -0.75% 0.08% 0.92% -0.92% 0.10% 1.07% -1.05% 0.14% 1.21% -1.17%Med 0.04% 0.41% -0.45% 0.10% 0.64% -0.58% 0.17% 0.81% -0.70% 0.27% 0.95% -0.80% 0.35% 1.12% -0.87%Max 1.91% 1.99% 0.00% 2.39% 2.62% 0.00% 2.99% 3.25% 0.00% 3.49% 3.62% 0.00% 3.94% 3.99% 0.00%Min -1.93% 0.00% -2.11% -2.80% 0.00% -3.19% -2.97% 0.00% -3.47% -3.32% 0.00% -3.47% -3.69% 0.00% -3.85%STD 0.71% 0.41% 0.44% 0.96% 0.55% 0.61% 1.12% 0.65% 0.73% 1.31% 0.76% 0.83% 1.43% 0.84% 0.92
7/1/2004-6/30/2005Avg -0.01% 0.39% -0.44% -0.01% 0.57% -0.63% -0.02% 0.70% -0.77% -0.03% 0.82% -0.89% -0.04% 0.91% -1.00%Med -0.02% 0.30% -0.35% -0.02% 0.46% -0.50% 0.02% 0.57% -0.62% 0.00% 0.68% -0.71% 0.02% 0.81% -0.77%Max 1.84% 1.95% 0.00% 1.90% 2.01% 0.00% 2.12% 2.20% 0.00% 2.35% 2.53% 0.00% 2.50% 2.68% 0.00%Min -1.44% 0.00% -1.66% -2.36% 0.00% -2.53% -3.21% 0.00% -3.37% -3.05% 0.00% -3.37% -3.68% 0.00% -3.90%STD 0.56% 0.34% 0.36% 0.79% 0.45% 0.51% 0.98% 0.53% 0.63% 1.14% 0.61% 0.72% 1.28% 0.67% 0.81%
7/1/2005-6/30/2006Avg 0.03% 0.42% -0.42% 0.06% 0.62% -0.58% 0.08% 0.78% -0.70% 0.11% 0.92% -0.78% 0.14% 1.04% -0.86%Med 0.00% 0.33% -0.33% 0.02% 0.49% -0.49% 0.04% 0.60% -0.60% 0.05% 0.74% -0.66% 0.06% 0.84% -0.71%Max 1.70% 1.91% 0.00% 2.52% 2.73% 0.00% 2.56% 3.03% 0.00% 2.79% 3.03% 0.00% 2.76% 3.03% 0.00%Min -1.23% 0.00% -1.38% -2.15% 0.00% -2.24% -2.23% 0.00% -2.46% -2.42% 0.00% -3.01% -2.56% 0.00% -3.01%STD 0.54% 0.36% 0.31% 0.77% 0.51% 0.40% 0.92% 0.62% 0.49% 1.05% 0.69% 0.55% 1.15% 0.76% 0.61%
7/1/2006-6/30/2007Avg 0.02% 0.31% -0.28% 0.04% 0.44% -0.40% 0.07% 0.54% -0.47% 0.09% 0.63% -0.53% 0.11% 0.71% -0.58%Med 0.01% 0.25% -0.23% 0.03% 0.39% -0.33% 0.09% 0.50% -0.37% 0.09% 0.56% -0.42% 0.14% 0.61% -0.45%Max 1.15% 1.27% 0.00% 1.48% 1.73% 0.00% 1.97% 2.06% 0.00% 2.26% 2.51% -0.01% 2.76% 2.84% -0.01%Min -1.05% 0.00% -1.12% -1.42% 0.00% -1.48% -2.04% 0.00% -2.19% -2.01% 0.00% -2.25% -2.13% 0.01% -2.36%STD 0.36% 0.23% 0.21% 0.52% 0.32% 0.30% 0.62% 0.38% 0.37% 0.71% 0.44% 0.43% 0.79% 0.49% 0.47%
continued on p. 22
bringing Deutsche Bank, the world’s No.1 FX bank, to the retail market
Now the retail market can benefit from Deutsche Bank’s award-winning
expertise in foreign exchange. dbFX, the state-of-the-art foreign exchange
trading platform, allows individuals and small institutions to trade FX with
the world’s leading FX liquidity provider on a platform tailored to their needs.
Why trade with Deutsche Bank?
� Deutsche Bank is the world’s largest
foreign exchange liquidity provider and
has been voted No.1 Foreign Exchange
House in the world for three years in
a row by Euromoney magazine.
� When you trade through dbFX, you
receive direct access to the world's
foreign exchange market. dbFX is as
close to the inter-bank market as a
individual trader can be.
� 24-hour online access through the dbFX
Trading Station, competitive pricing and
market access with the highest level
of client support, including professional
services in 9 languages 24 hours a day.
� Direct access to research from Deutsche
Bank’s award winning analysts.
Why trade FX on dbFX?
� Streaming real-time executable rates
� Funds are deposited directly with
Deutsche Bank AG, London
� Account funding starting at $5,000
or the equivalent in GBP, EUR or JPY
� Margin as low as 1% for qualified
clients, one simple margin level
� Minimum trade size of 100,000 units
� Optional Position Management Tool,
allowing you to have simultaneous
long and short positions in the same
currency pair
� Online news and research
� Real time charts and charting tools
How to get started?
Getting started with dbFX is simple: please visit dbfx.com/CT forcomplete information on the service. Start with an online demo account.
dbFX sales staff are available to give you a personalized demo of the full functionality
and power of dbFX. Open an account online with the self service application for
individuals and corporations.
Contact Us.
dbFX Instant Messenger at dbfx.com
Toll-Free US Sales1-866-519-3239
Why trade with Deutsche Bank?
This advertisement has been approved and/or communicated by Deutsche Bank AG London. The services described in this advertisement are provided by Deutsche Bank AG or by its subsidiariesand/or affiliates in accordance with appropriate local legislation and regulation. Deutsche Bank AG is authorised under German Banking Law (competent authority: BaFin – Federal FinancialSupervising Authority) and with respect to UK commodity derivatives business by the Financial Services Authority; regulated by the Financial Services Authority for the conduct of UK business.© Deutsche Bank 2007
www.dbfx.com/CT
TRADING STRATEGIES continued
three-day, close-to-close decline was -3.21 percent (from theJuly 1, 2004 to June 30, 2005 period). The average three-dayLUM was +0.74 percent and the average three-day LDMwas -0.72 percent.
Because the long-term trend was up, let’s see if some ofthe information from Table 3 can pro-vide insight as to what the market didfollowing pullbacks.
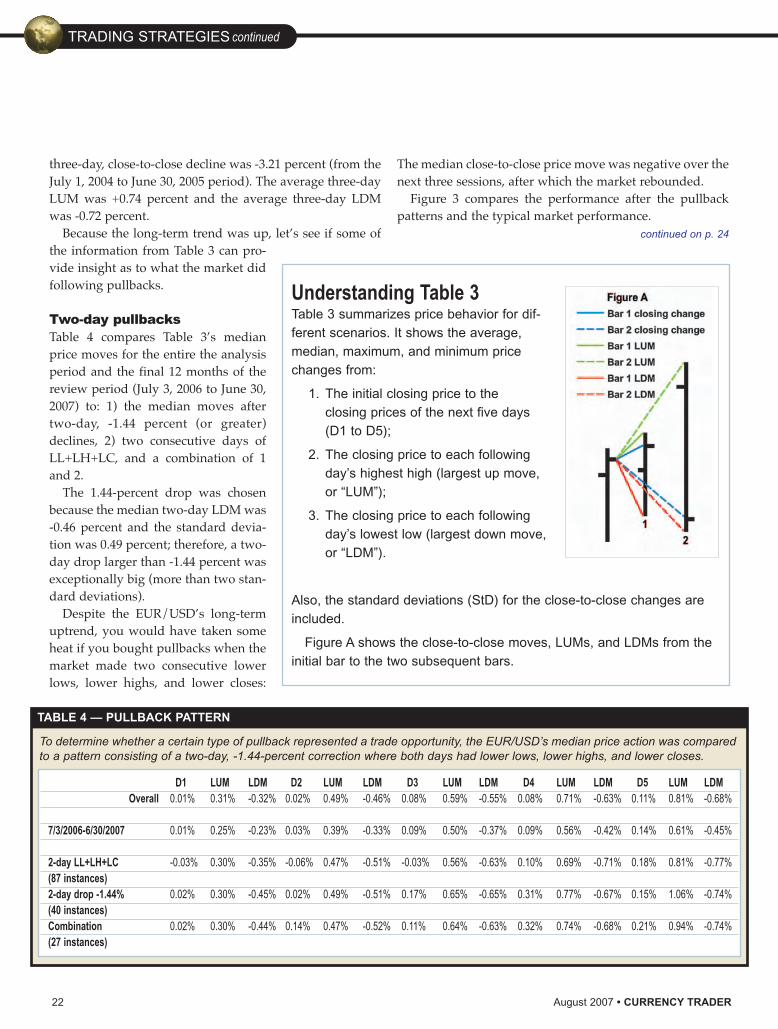
Two-day pullbacksTable 4 compares Table 3’s medianprice moves for the entire the analysisperiod and the final 12 months of thereview period (July 3, 2006 to June 30,2007) to: 1) the median moves aftertwo-day, -1.44 percent (or greater)declines, 2) two consecutive days ofLL+LH+LC, and a combination of 1and 2.
The 1.44-percent drop was chosenbecause the median two-day LDM was-0.46 percent and the standard devia-tion was 0.49 percent; therefore, a two-day drop larger than -1.44 percent wasexceptionally big (more than two stan-dard deviations).
Despite the EUR/USD’s long-termuptrend, you would have taken someheat if you bought pullbacks when themarket made two consecutive lowerlows, lower highs, and lower closes:
The median close-to-close price move was negative over thenext three sessions, after which the market rebounded.
Figure 3 compares the performance after the pullbackpatterns and the typical market performance.
continued on p. 24
22 August 2007 • CURRENCY TRADER
Understanding Table 3Table 3 summarizes price behavior for dif-ferent scenarios. It shows the average,median, maximum, and minimum pricechanges from:
1. The initial closing price to the closing prices of the next five days (D1 to D5);
2. The closing price to each following day’s highest high (largest up move, or “LUM”);
3. The closing price to each following day’s lowest low (largest down move,or “LDM”).
Also, the standard deviations (StD) for the close-to-close changes areincluded.
Figure A shows the close-to-close moves, LUMs, and LDMs from theinitial bar to the two subsequent bars.
To determine whether a certain type of pullback represented a trade opportunity, the EUR/USD’s median price action was comparedto a pattern consisting of a two-day, -1.44-percent correction where both days had lower lows, lower highs, and lower closes.
TABLE 4 — PULLBACK PATTERN
D1 LUM LDM D2 LUM LDM D3 LUM LDM D4 LUM LDM D5 LUM LDMOverall 0.01% 0.31% -0.32% 0.02% 0.49% -0.46% 0.08% 0.59% -0.55% 0.08% 0.71% -0.63% 0.11% 0.81% -0.68%
7/3/2006-6/30/2007 0.01% 0.25% -0.23% 0.03% 0.39% -0.33% 0.09% 0.50% -0.37% 0.09% 0.56% -0.42% 0.14% 0.61% -0.45%
2-day LL+LH+LC -0.03% 0.30% -0.35% -0.06% 0.47% -0.51% -0.03% 0.56% -0.63% 0.10% 0.69% -0.71% 0.18% 0.81% -0.77%(87 instances)2-day drop -1.44% 0.02% 0.30% -0.45% 0.02% 0.49% -0.51% 0.17% 0.65% -0.65% 0.31% 0.77% -0.67% 0.15% 1.06% -0.74%(40 instances)Combination 0.02% 0.30% -0.44% 0.14% 0.47% -0.52% 0.11% 0.64% -0.63% 0.32% 0.74% -0.68% 0.21% 0.94% -0.74%(27 instances)

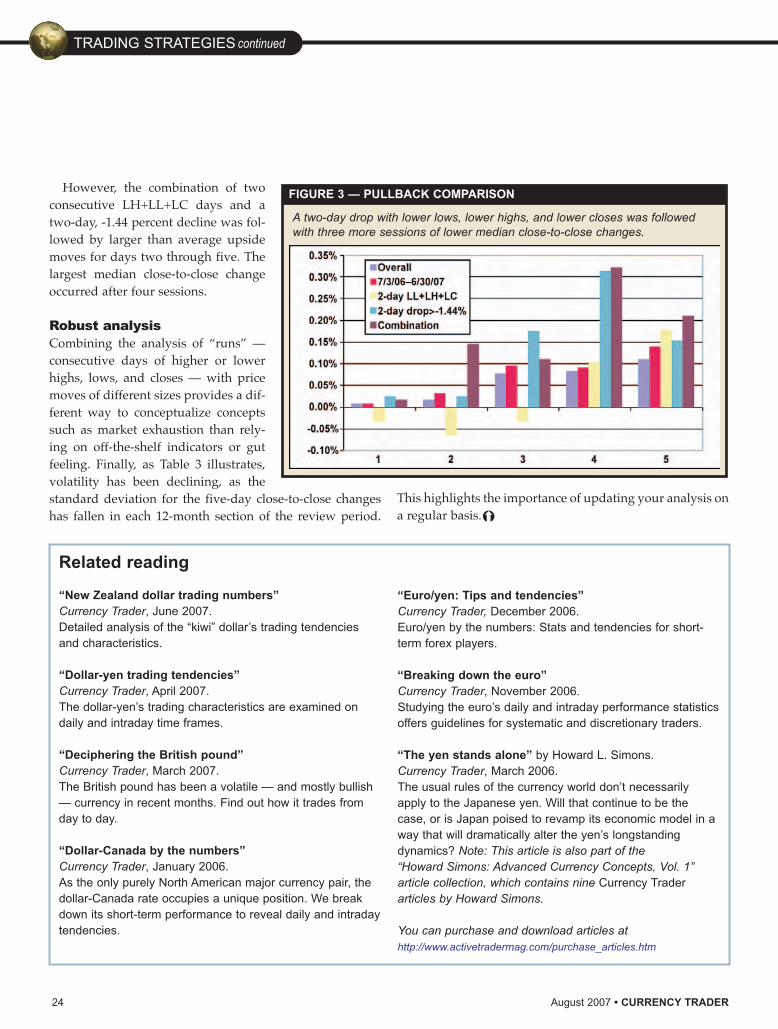
However, the combination of twoconsecutive LH+LL+LC days and atwo-day, -1.44 percent decline was fol-lowed by larger than average upsidemoves for days two through five. Thelargest median close-to-close changeoccurred after four sessions.
Robust analysisCombining the analysis of “runs” —consecutive days of higher or lowerhighs, lows, and closes — with pricemoves of different sizes provides a dif-ferent way to conceptualize conceptssuch as market exhaustion than rely-ing on off-the-shelf indicators or gutfeeling. Finally, as Table 3 illustrates,volatility has been declining, as thestandard deviation for the five-day close-to-close changeshas fallen in each 12-month section of the review period.
This highlights the importance of updating your analysis ona regular basis.�
Related reading
“New Zealand dollar trading numbers”Currency Trader, June 2007.Detailed analysis of the “kiwi” dollar’s trading tendenciesand characteristics.
“Dollar-yen trading tendencies”Currency Trader, April 2007. The dollar-yen’s trading characteristics are examined ondaily and intraday time frames.
“Deciphering the British pound” Currency Trader, March 2007. The British pound has been a volatile — and mostly bullish— currency in recent months. Find out how it trades fromday to day.
“Dollar-Canada by the numbers”Currency Trader, January 2006. As the only purely North American major currency pair, thedollar-Canada rate occupies a unique position. We breakdown its short-term performance to reveal daily and intradaytendencies.
“Euro/yen: Tips and tendencies”Currency Trader, December 2006. Euro/yen by the numbers: Stats and tendencies for short-term forex players.
“Breaking down the euro” Currency Trader, November 2006. Studying the euro’s daily and intraday performance statisticsoffers guidelines for systematic and discretionary traders.
“The yen stands alone” by Howard L. Simons.Currency Trader, March 2006. The usual rules of the currency world don’t necessarilyapply to the Japanese yen. Will that continue to be thecase, or is Japan poised to revamp its economic model in away that will dramatically alter the yen’s longstandingdynamics? Note: This article is also part of the “Howard Simons: Advanced Currency Concepts, Vol. 1” article collection, which contains nine Currency Traderarticles by Howard Simons.
You can purchase and download articles at http://www.activetradermag.com/purchase_articles.htm
FIGURE 3 — PULLBACK COMPARISON
A two-day drop with lower lows, lower highs, and lower closes was followedwith three more sessions of lower median close-to-close changes.
24 August 2007 • CURRENCY TRADER
TRADING STRATEGIES continued

26 August 2007 • CURRENCY TRADER
ADVANCED STRATEGIES
Minor currencies and federal reserve trade weights
The verdict is in: Currency rates don’t affect trade.
BY HOWARD L. SIMONS
Last month’s article “Currencies and federal reservetrade weights” (Currency Trader, July 2007), whichexamined major currencies’ impact on Federal
Reserve trade weights, concluded: “A review of U.S. tradepatterns with major currency trading partners reveals littleevidence that a weaker currency leads to greater exportcompetitiveness and a lower ability to import.” In short, the
entire premise behind the floating exchange-rate regime ofthe past 35 years is wrong.
As all currency traders learn quickly, major currencieshave different trading patterns and represent differentunderlying economies than minor currencies, which arebuffeted more by speculative capital flows even as theirmarkets are shallower than the majors’. Will analysis of the
minors support the findings of thestudy of the majors, or are FederalReserve trade weights for theminor currencies more sensitive tochanges in the currencies them-selves?
Recap of data and methodologyFirst, the analysis process usedhere is identical to that used lastmonth:
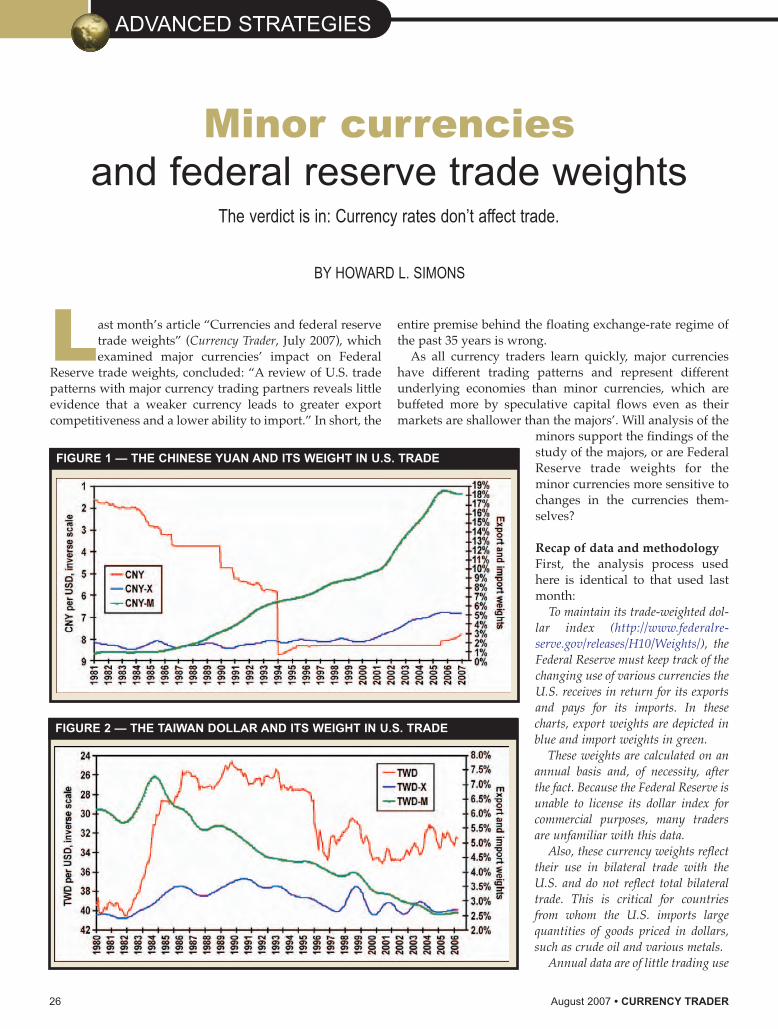
To maintain its trade-weighted dol-lar index (http://www.federalre-serve.gov/releases/H10/Weights/), theFederal Reserve must keep track of thechanging use of various currencies theU.S. receives in return for its exportsand pays for its imports. In thesecharts, export weights are depicted inblue and import weights in green.
These weights are calculated on anannual basis and, of necessity, afterthe fact. Because the Federal Reserve isunable to license its dollar index forcommercial purposes, many tradersare unfamiliar with this data.
Also, these currency weights reflecttheir use in bilateral trade with theU.S. and do not reflect total bilateraltrade. This is critical for countriesfrom whom the U.S. imports largequantities of goods priced in dollars,such as crude oil and various metals.
Annual data are of little trading use
FIGURE 1 — THE CHINESE YUAN AND ITS WEIGHT IN U.S. TRADE
FIGURE 2 — THE TAIWAN DOLLAR AND ITS WEIGHT IN U.S. TRADE

CURRENCY TRADER • August 2007 27
in a continuous market such as cur-rencies. We can create smoothed seriesof import and export weights via a sta-tistical technique called “cubic splineinterpolation.” This technique is usedtwice in the charts below — once tocreate quarterly series from the annu-al numbers and a second time to createmonthly numbers from the quarterlyresults.
The resulting interpolations are fareasier to absorb than the annual num-bers, but as they involve two separatedata transformations, we did notattempt any further statistical analy-sis against monthly currency values(presented in red in the charts). Inaddition, please be advised all curren-cies are displayed in the “USD per”convention familiar to traders of theeuro, the British pound, and currencyfutures. The currency scale is invertedfor currencies commonly expressed as“per USD,” so a rising red line alwaysconveys strength vs. the dollar and afalling red line always conveys weak-ness.
A second passage from lastmonth is mentioned here for clari-ty:
Even though the principal advocateof floating exchange rates, the lateMilton Friedman, was the antithesisof a protectionist, his arguments havebeen seized by this faction to the extentthat the notion a weaker currency
continued on p. 28
FIGURE 3 — THE HONG KONG DOLLAR AND ITS WEIGHT IN U.S. TRADE
FIGURE 4 — THE SINGAPORE DOLLAR AND ITS WEIGHT IN U.S. TRADE
FIGURE 5 — THE KOREAN WON AND ITS WEIGHT IN U.S. TRADE
The entire premise
behind the floating
exchange-rate
regime of the past
35 years is wrong.

28 August 2007 • CURRENCY TRADER
should stimulate exports and reduceimports will be referred to as the “pro-tectionist argument.”
East Asian currenciesWith all the political rhetoric call-ing for a stronger Chinese yuan, itis easy to lose sight of the fact thatexport weights to China rosesteadily between 2000 and 2006.Moreover, as China’s wealth levelgrows, so should both the volumeand the value-added content of itsimports from the U.S. This so-called “marginal propensity toimport” is characteristic of allgrowing economies.
The surge in import weightsfrom China is, of course, the dom-inant feature in Figure 1. Nonation on earth has China’s costadvantages in labor, a state-con-trolled banking system with over$1 trillion in foreign exchangereserves, low levels of environ-mental and safety costs, and pro-ductivity advantages from newplants and equipment. Giventhese advantages, we do need toask whether any level of the yuan(CNY) would have offset theseformidable advantages; the bet-ting here is the yuan could bemuch stronger with no adverseeffects on Chinese exports.
Taiwan’s importance as anexporter to the U.S. has beendeclining steadily since the mid-1980s. In all likelihood, exportsfrom Taiwan have been displacedby exports from China. Theisland’s share in U.S. exportweights has tracked changes inthe TWD to a degree (Figure 2).This indicates some measure ofcurrency price elasticity inTaiwan’s import decisions.
Hong Kong provides an inter-esting rebuttal to the protectionistargument. Although its currencyhas been locked in a tight range since the mid-1980s, itsimport weights have fallen steadily since then (Figure 3). Ifthe protectionist argument was correct, we would have toconclude the Hong Kong dollar (HKD) was overvalued atthis lower range. Moreover, we also would have to con-
clude the uptrend in export weights between 1986 and 1996meant the HKD was overvalued.
Neither is likely. As in the Taiwan example, the simplestexplanation is the best. Hong Kong’s exports to the U.S.have been displaced by exports from China.
ADVANCED STRATEGIES continued
FIGURE 6 — THE THAI BAHT AND ITS WEIGHT IN U.S. TRADE
FIGURE 7 — THE MALAYSIAN RINGGIT AND ITS WEIGHT IN U.S. TRADE
FIGURE 8 — THE INDONESIAN RUPIAH AND ITS WEIGHT IN U.S. TRADE

CURRENCY TRADER • August 2007 29
We can draw the same conclusion by examiningSingapore, which we will group with the East Asian ratherthan the South Asian countries by virtue of its largelyChinese population. The 1997-2001 decline in the SGD didnothing to arrest its falling importweights, and the 2002-2006 rallydidn’t do anything to accelerate thedowntrend already in place (Figure4). These simply reflect China’sascendancy. Export weights toSingapore rose modestly in themid-1990s “Asian Tiger” epoch,but have flattened since.
The final East Asian currency isthe Korean won (KRW, Figure 5).This currency was hugely affectedby the 1997-1998 Asian crisis.Although import weights fromKorea — which had been in declinesince 1988 — reversed after theKRW’s plunge and declined afterthe KRW’s post-2004 rally, the realimpact was the large drop in exportweights to Korea during the Asiancrisis. This reflected both changesin the currency and the large dropin Korean national income duringthis period.
South Asian currenciesSpeaking of the Asian crisis, let’slook at the currency that started itall, the Thai baht (THB). Prior to1998, both the import and theexport weights for the baht weretrending higher (Figure 6). Thecheaper baht did nothing toincrease its import weights, and theloss of purchasing power inThailand did surprisingly little toreduce export weights to Thailand.Overall, Thailand’s contribution toU.S. trade is and has been fairlyminor.
The picture for Malaysia is simi-lar to that of Thailand (Figure 7).Both import weights fromMalaysia and export weights to itgrew rapidly between 1986 and1996 — and were unaffected by theringgit’s (MYR) sharp drop.Neither the MYR nor the course ofthe Malaysian economy affected itstrade weights with the U.S.
Indonesia also suffered in the
Asian crisis (Figure 8). The 1997 collapse of the rupiah (IDR)preceded a decline — not the theorized increase — inimport weights. The same cannot be said for exportweights, however: Indonesia’s sudden impoverishment led
continued on p. 30
FIGURE 9 — THE PHILIPPINE PESO AND ITS WEIGHT IN U.S. TRADE
FIGURE 10 — THE MEXICAN PESO AND ITS WEIGHT IN U.S. TRADE
FIGURE 11 — THE BRAZILIAN REAL AND ITS WEIGHT IN U.S. TRADE

ADVANCED STRATEGIES continued
30 August 2007 • CURRENCY TRADER
to a swift decline in export weights, one that has yet torecover.
The last South Asian currency to be examined is thePhilippine peso (PHP), which is yet another refutation ofthe protectionists (Figure 9). Its import weights fell sharply
after the PHP fell in 1997, butexport weights to the suddenlypoorer country actually trendedhigher between 1998 and 2003before falling sharply in 2004.
Latin American currenciesMexico is a special case on severallevels. Its peso (MXN) has col-lapsed on three separate occasionswithout triggering the macroeco-nomic collapses normally associ-ated with such events. As a mem-ber of NAFTA, its trade with theU.S. on both the import andexport sides has grown regardlessof the currency. Its major source offoreign exchange, crude oilexports, is priced in USD, and ithas another major source of dol-lars, the remittances of Mexicannationals living and working inthe U.S. And like Colombia,Mexico has large, undocumentedsources of U.S. dollars.
U.S. export weights to Mexicosurged after NAFTA and have lev-eled off near a large 15 percentlevel (Figure 10). Import weightsfrom Mexico have fallen as manyof the light manufactured exportsfrom Mexican maquiladora plantshave been displaced by cheapergoods from China. All of these fac-tors combine to make the MXNrate largely irrelevant as the U.S.’sfourth-largest trading partner.
The Brazilian real (BRL) has ashort history. It came into being in1994 following the untimelydemise of a long list of predeces-sors, but even so it has managed tocollapse three times in 12 years. Indefiance of the protectionists’ the-ories, the impact on importweights has been minimal (Figure11). Export weights to Brazil havedeclined since 1997, a period inwhich economic growth in Brazil
has been strong. This may be a rare case when the currencyprice elasticity of demand exceeds income elasticity ofdemand.
Argentina, like Brazil, has gone through multiple curren-cies. These have included the peso ley, the austral, and a
FIGURE 12 — THE ARGENTINE PESO AND ITS WEIGHT IN U.S. TRADE
FIGURE 13 — THE VENEZUELAN BOLIVAR AND ITS WEIGHT IN U.S. TRADE
FIGURE 14 — THE CHILEAN PESO AND ITS WEIGHT IN U.S. TRADE

CURRENCY TRADER • August 2007 31
direct peg to the USD. There is also the little matter of fre-quent defaults, nationalizations, and other non-currencyimpediments to the free flow of goods and services.
Import weights from Argentina scarcely have budgedsince 1992 (Figure 12). Exportweights to Argentina began to fallin 1999 as the country sufferedduring its dollar-peg epoch, andthen collapsed going into the 2002debt default. They have rebound-ed somewhat with the peso (ARS);this is an income effect, not a cur-rency effect.
Import weights from Venezuelahave been quite low, asVenezuela’s chief export to theU.S., crude oil, is priced in USD(Figure 13). Export weights havefallen as the bolivar has weakenedduring the Chavez era; it’s diffi-cult to discern whether this is cur-rency-related, income-related, orpolitical.
Chile enjoys so much a reputa-tion as South America’s successstory that first-time observershave trouble absorbing the extentof the peso’s (CLP) decline since1988. Export weights to Chile rosebetween 1988 and 1996 even asthe CLP fell, and then fell into2003 as the CLP fell (Figure 14).Factors other than currency move-ments likely were involved.
In addition, the weights ofimports from Chile haveincreased even as the CLP roseafter 2003. Chile’s efficiencies inagricultural exports — its leadingexport, copper, is priced in USD— probably account for this.
Export weights to Colombiahave tracked movements in thepeso (COP) in a manner consis-tent with standard theory (Figure15). Import weights fromColombia have increased since2002 even in the face of a firmerCOP. The U.S.-Colombia tradepicture is so distorted by undocu-mented flows that further com-ments will be withheld.
Other currenciesThe final group of currencies for
India, Russia, Saudi Arabia, and Israel represent specialcases and thus are discussed on a non-geographic basis.
The growing importance of the U.S.-India bilateral eco-nomic relationship is not reflected well in the trade data; it
continued on p. 32
FIGURE 15 — THE COLOMBIAN PESO AND ITS WEIGHT IN U.S. TRADE
FIGURE 16 — THE INDIAN RUPEE AND ITS WEIGHT IN U.S. TRADE
FIGURE 17 — THE RUSSIAN RUBLE AND ITS WEIGHT IN U.S. TRADE

32 August 2007 • CURRENCY TRADER
is increasingly a “post-industrial” relationship. Includedare skilled labor imported from India and informationservices outsourced to India.
Import weights have been increasing steadily since thelate 1980s, which in all likelihood reflects the moderniza-
tion of the Indian economy farmore than the decline in the rupee(INR, Figure 16). Export weights toIndia have jumped since 2001 evenas the rupee has remained near itslows.
Export weights to Russia fellduring the country’s 1998 defaultand have rebounded since theruble’s (RUB) modest recovery(Figure 17). Bilateral trade betweenthe U.S. and Russia is very smalland is confined to specialty goodsand minerals.
The increasing import weightsfrom Israel during the shekel’s(ILS) 1982-2002 decline are asexpected in classic theory (Figure18). The generally increasingexport weights to Israel duringthis same period are antithetical toclassic theory. Too much U.S.-Israel trade is dollar-denominatedor is confined to sectors such astechnology and military hardwarefor currency movements to be areal factor.
Finally, we come to a specialcase — Saudi Arabia. The riyal(SAR) is de facto fixed — note therange — and import weights skirtnear zero (Figure 19). Their princi-
pal export is priced in USD. Export weights to SaudiArabia have declined somewhat over the years, but giventhe importance of military hardware and other sensitiveexports to Saudi Arabia, this data stream probably doesnot reveal much.
Can’t fight the dataWe have reviewed 26 currencies with as many as 34 yearsof trade data accounting for 100 percent of the FederalReserve’s trade-weighting scheme.
We found some isolated instances wherein exportweights to countries whose currencies had appreciatedrose and some isolated instances wherein import weightsfrom countries whose currencies had depreciated rose.These were noted duly.
The preponderance of evidence, however, is incomeelasticities, trade agreements, economic integration, andthe terms in which goods and services are priced, amongother factors, are all more important than currencies inaffecting trade flows.�
For information on the author see p. 6.
ADVANCED STRATEGIES continued
FIGURE 18 — THE ISRAELI SHEKEL AND ITS WEIGHT IN U.S. TRADE
FIGURE 19 — THE SAUDI RIYAL AND ITS WEIGHT IN U.S. TRADE
Related reading
“Currencies and Federal Reserve trade weights”Currency Trader, July 2007.The theory that a weaker dollar makes U.S. goods and services more competitive abroad sounds nice, but the factsargue otherwise.
“Howard Simons: Advanced Currency Concepts, Vol. 1”A discounted collection that includes many of the articles listed here.
You can purchase and download past articles at http://www.activetradermag.com/purchase_articles.htm.

The Premier Convention for Forex Traders
• Learn Specific Trading Strategies You Can Use Immediately:Learn realistic and repeatable methods for making successful trading decisionsduring a weekend dedicated to improving your chances for success.
• Exchange Ideas With Fellow Traders Who’ve Been Where YouAre Now: Some of the best traders in the country are coming to the Expo andthis is your chance to sit down and learn what works for them and how theybecame confident traders.
• Find the Best Services and Tools to Help You Succeed: The Expoallows you to evaluate all of the best tools available to you in the exhibit hall.Meet company representatives to ask specific questions and get the answers youneed to make intelligent decisions about which services you want to use.
September 15–16, 2007Mandalay Bay Resort & CasinoLas Vegas, Nevada
Gold SponsorsPlatinum Sponsor Media Partner
Attend The ONLY Expo Exclusively For Currency Traders—FREE!
Register Online! www.ForexTradingExpo.com(Priority Code 008931)
Three Reasons Why Attending The ForexTrading Expo Will Improve Your Trading:
RobBooker
JohnCarter
Todd Gordon
RagheeHorner
WayneMcDonell
John Person
EdwardPonsi
Russell LaScala
Speakers Include:
...and many more!
Register To Attend FREE!
Technology Sponsor
A Production of InterShow • 1258 N. Palm Avenue, Sarasota, FL 34236 • 800/970-4355 • www.InterShow.com

34 August 2007 • CURRENCY TRADER
Following the direction of short-term interestrates is a vital part of determining the likelydirection of a particular currency or currencypair. But what can long-term interest rates tell
us about the future price behavior of currencies? Rising long-term interest rates have been very much in
the news lately. On June 13, the yield on the 10-year T-noteclimbed to a five-year high of 5.327 percent. The 4.50-per-cent note finished June at a yield of 5.03 percent — 54 basispoints higher than its March 7 low of 4.49 percent. (For areview of T-notes and their terminology, see “Treasurybackgrounder.”)
Normally, the yield curve — which depicts the differencebetween short-term and long-term Treasury yields — rises,reflecting the higher yields usually associated with longerTreasury maturities (Figure 1). When short-term yields arehigher than long-term yields, as has recently been the case,the curve is referred to as “inverted” — a condition that has
historically been interpreted as a warning sign that a reces-sion is looming. With the recent increase in long-term rates,however, the yield curve has returned to its normal shape.
What’s behind the jump in long-term interest rates?
Supported by a strong May retail sales report (the bestshowing in more than a year), traders have become lessconvinced the Federal Reserve will cut short-term interestrates. At least one interpretation, then, of the rise in long-
term rates is that it portends improvement in the prospectsfor economic growth (see “Doom, gloom, and long-terminterest rates,” Active Trader, September 2007).
Another interpretation is that improved economic
TRADING BASICS
Long-term interest ratesand the U.S. dollar
Comparing the yield curve on July 2 and March 5 shows thecurve has regained its “normal” shape — upward sloping, with long-term interest rates higher than short-term rates.
FIGURE 1 — CHANGING YIELD CURVE
One interpretation is the rise in long-term rates portends improvement
in the prospects for economic growth; another is that improved
economic growth could be accompanied by higher inflation.
Rising long-term Treasury yield should imply a higher dollar — at some point — but history shows
many other factors can get in the way of that easy assumption.
BY DAVID MANTELL

CURRENCY TRADER • August 2007 35
growth could be accompanied by higher infla-tion. However, recent price data suggests infla-tion remains mild and appears to be undercontrol. The personal consumption expendi-tures index (excluding food and energy), a keyinflation measure, increased 1.9 percent in Mayvs. the same period last year. This is the small-est year-over-year increase since March 2004.
The currency connectionWhat are the ramifications for the U.S. dollar?If higher long-term rates are indicative of animproving U.S. economy, that would be bullishfor the greenback. If there is an inflation com-ponent to stronger economic growth, and ifhigher long-term rates are indicative of that,the Fed will be more likely to raise short-termrates. That, too, would be positive for the U.S.dollar, causing investors searching for highshort-term yields to put their cash in the U.S.
Overall, higher long-term rates are fairlypromising for the U.S. dollar. Thus far, howev-er, this has not been reflected in the dollar’saction against most major currencies, includ-ing the euro (Figure 2).
What does the past tell us? The U.S. economy experienced a similar sce-nario in April of 2006. On Jan. 23, 2006, the 10-year T-note yielded 4.36 percent — one basispoint lower than its yield on the first day of2006. By April 26 (roughly the same time peri-od as our current scenario), its yield hadclimbed 76 basis points to 5.12 percent, and itremained at or above 5 percent through July28. Strong new home sales and robust ordersfor durable goods helped propel long-terminterest rates higher.
How did the dollar perform vs. the Euroduring this time period? On Jan. 23, theeuro/dollar (EUR/USD) rallied strongly to
continued on p. 36
Despite the recent long-term rate increase, the dollar has remainedweak vs. most major currencies — reflected in the new highs reachedby the euro/dollar pair.
FIGURE 2 — DOLLAR WEAK VS. EURO
Source: TradeStation
Treasury backgrounder
Treasury notes and bonds are debt securities issued by the UnitedStates Treasury. They are considered debt instruments because bypurchasing them you are loaning money to the Treasury depart-ment, which then pays you interest (determined by a “coupon rate”)on a semiannual basis and returns the principal when the bond ornote matures on the maturity date. T-bonds and T-notes are alsocalled “fixed-income” securities because of the fixed coupon pay-ment an investor receives while holding the bond or note.
T-notes are issued in maturities of two, three, five, and 10 years;T-bonds have maturities greater than 10 years (e.g., the 30-year T-bond). The minimum bond or note size is $1,000. For example, ifyou purchased a $1,000 10-year T-note with a 4-percent coupon(the “4-percent note”), you would receive $20 every six months,totaling $40 per year; the $1,000 would be paid back to you on thematurity date 10 years from now. A bond or note’s yield is itscoupon payment divided by the price — in this case, $40/$1,000 =4 percent.
Treasury futures prices indicate a percentage of “par” price,which for any Treasury bond or note is 100. T-bond prices consistof the “handle” (e.g., 100) and 32nds of 100. For example, 98-14 isa price that translates to 98-14/32nds or $984.38 for a $1,000 T-bond. T-notes are priced in a similar fashion, except they caninclude one-half of a 32nd — for example, 98-14+ is 98-14.5/32nds, or 984.53 for a $1,000 T-note.

close at 1.2303 (Figure 3). By April 26 ithad rallied to 1.2453 — meaning, thedollar had weakened vs. the euro. TheEUR/USD pair continued to rally intoMay before pausing and eventuallyreaching a high of 1.2979 in early June2006.
Arguably, the improving health ofthe U.S. economy should have beenreflected in a strengthening dollar. Asit turned out, U.S. economic activitywas so robust the Federal Reserveraised the federal funds rate at both itsMay 2006 (to 5.00 percent) and June2006 meetings (to 5.25 percent, whereit currently stands).
At the same time, though, theEurozone economy was quickly gain-ing steam and the European CentralBank (ECB) had embarked on a cam-paign to raise short-term interest rates.
One possible explanation for the rela-tive strength in the euro vs. the dollaris that traders were expecting the gapbetween short-term interest rates inEurope and the U.S. to narrow.
In theory and generally speaking,the dollar should strengthen whenlong-term rates are rising. But asshown here, other factors may out-weigh or completely override any pos-sible lift the dollar might expect to seefrom rising long-term rates.
Nonetheless, although short-terminterest rates are usually the focus ofcurrency analysis, long-term interestrates bear watching, especially inregard to fundamental economic con-cerns that drive the big-picture actionin the forex market.�
For information on the author see p. 6.
36 August 2007 • CURRENCY TRADER
TRADING BASICS continued
After a jump in long term rates last year, the dollar also weakened vs.the euro — and for the most part has continued to do so since.
FIGURE 3 — 2006 SCENARIO
Source: TradeStation
Related reading
“The obscure key to successfulFX trading”Currency Trader, November 2004.Watch what the pros watch: Explorethe relationship between currencies,bond yields, and interest rates.Note: This article is also part of thediscounted article set “BarbaraRockefeller ‘Big Picture’ collection,Vol. 1: 2004-2005.”
“Interest rate shuffle”Currency Trader, February 2006. Interest rates are a key forex marketcatalyst, and from the U.S. toJapan, some central banks arepoised to adjust their interest ratepolicies. Note: This article is also part of theKathy Lien currency collection.
“Trading a steeper yield curve”Active Trader, July 2006.With the Fed giving signals the endof the rate-hike cycle is near, weexplore two techniques — one well-known, the other more obscure —to trade a widening spread betweenshort-term and long-term interestrates.
“Treasury bonds and notes”Active Trader, June 2005. T-bonds and T-notes are used as asource of income for investors andas a trading vehicle by speculators.Here’s an overview of the Treasurymarket, from the cash market tobond ETFs and futures.
You can purchase and download pastarticles at http://www.activetradermag.com/purchase_articles.htm.


38 August 2007 • CURRENCY TRADER
SPOT CHECK
Spot check: U.S. dollar indexAs dollar-denominated currency
pairs continue to set new records,
the dollar index is testing long-term
support levels. Some indicators
point down, but there are mixed
signals further out.
BY CURRENCY TRADER STAFF
As of the week ending July 20, the dollar index had fallen more than 3 percent from the high five weeks earlier and had established a new a seven-week low.
FIGURE 2 — WEEKLY RUN
Source: TradeStation
The long-battered dollar found lit-tle respite in July, falling to a newall-time low vs. the euro (EUR)and setting multi-decade lows
against the Canadian dollar (CAD), Britishpound (GBP), Australian dollar (AUD), andNew Zealand dollar (NZD).
The last time things looked this grim forthe buck was in December 2004, when the
U.S. dollar index (DXY) fell to 80.39 (Figure1). At the time, pundits predicted apocalypsefor the currency, citing the deficit(s), the IraqWar, and growing reserve diversification,among other factors, but were quicklysilenced by a year-long rally that, while hard-ly reversing the dollar’s overwhelming long-term downtrend, sent dollar bears into hiber-nation for a while.
Here we are again. As of mid- to late-July,the dollar index had just penetrated theDecember 2004 low, with the next milestone— the April 1995 low of 80.0 — in its sights.After that, the index’s next target is its alltime low, 78.33, established in 1992.
Is the dollar going to pull off another headfake, a la 2005, or is downside follow-throughmore probable this time?
Rather than dwell on the possible effects ofeconomic intangibles such as the collapse ofthe sub-prime lending market, let’s look atwhat the price action in the U.S. dollar indexportends for the future.
After penetrating the December 2004 low, the dollar index fell 0.03 below the April 1995 low of 80.05 on July 24.
FIGURE 1 — CONSPICUOUS LOW
Source: TradeStation
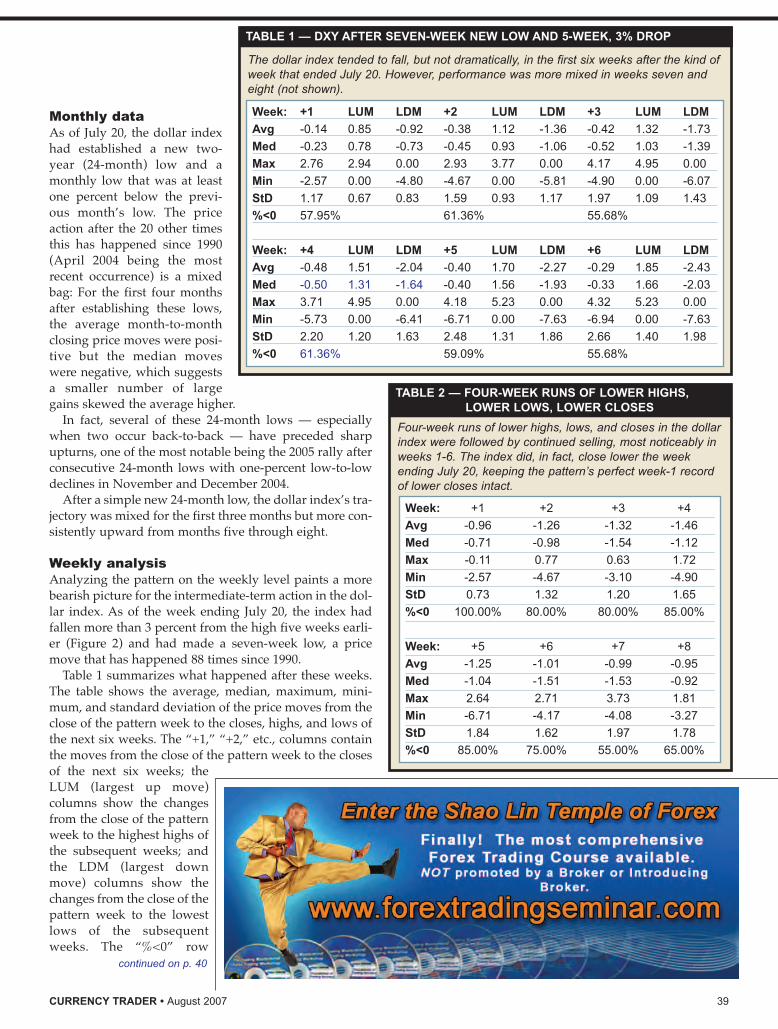
CURRENCY TRADER • August 2007 39
Monthly dataAs of July 20, the dollar indexhad established a new two-year (24-month) low and amonthly low that was at leastone percent below the previ-ous month’s low. The priceaction after the 20 other timesthis has happened since 1990(April 2004 being the mostrecent occurrence) is a mixedbag: For the first four monthsafter establishing these lows,the average month-to-monthclosing price moves were posi-tive but the median moveswere negative, which suggestsa smaller number of largegains skewed the average higher.
In fact, several of these 24-month lows — especiallywhen two occur back-to-back — have preceded sharpupturns, one of the most notable being the 2005 rally afterconsecutive 24-month lows with one-percent low-to-lowdeclines in November and December 2004.
After a simple new 24-month low, the dollar index’s tra-jectory was mixed for the first three months but more con-sistently upward from months five through eight.
Weekly analysisAnalyzing the pattern on the weekly level paints a morebearish picture for the intermediate-term action in the dol-lar index. As of the week ending July 20, the index hadfallen more than 3 percent from the high five weeks earli-er (Figure 2) and had made a seven-week low, a pricemove that has happened 88 times since 1990.
Table 1 summarizes what happened after these weeks.The table shows the average, median, maximum, mini-mum, and standard deviation of the price moves from theclose of the pattern week to the closes, highs, and lows ofthe next six weeks. The “+1,” “+2,” etc., columns containthe moves from the close of the pattern week to the closesof the next six weeks; theLUM (largest up move)columns show the changesfrom the close of the patternweek to the highest highs ofthe subsequent weeks; andthe LDM (largest downmove) columns show thechanges from the close of thepattern week to the lowestlows of the subsequentweeks. The “%<0” row
continued on p. 40
The dollar index tended to fall, but not dramatically, in the first six weeks after the kind ofweek that ended July 20. However, performance was more mixed in weeks seven andeight (not shown).
TABLE 1 — DXY AFTER SEVEN-WEEK NEW LOW AND 5-WEEK, 3% DROP
Week: +1 LUM LDM +2 LUM LDM +3 LUM LDM
Avg -0.14 0.85 -0.92 -0.38 1.12 -1.36 -0.42 1.32 -1.73
Med -0.23 0.78 -0.73 -0.45 0.93 -1.06 -0.52 1.03 -1.39
Max 2.76 2.94 0.00 2.93 3.77 0.00 4.17 4.95 0.00
Min -2.57 0.00 -4.80 -4.67 0.00 -5.81 -4.90 0.00 -6.07
StD 1.17 0.67 0.83 1.59 0.93 1.17 1.97 1.09 1.43
%<0 57.95% 61.36% 55.68%
Week: +4 LUM LDM +5 LUM LDM +6 LUM LDM
Avg -0.48 1.51 -2.04 -0.40 1.70 -2.27 -0.29 1.85 -2.43
Med -0.50 1.31 -1.64 -0.40 1.56 -1.93 -0.33 1.66 -2.03
Max 3.71 4.95 0.00 4.18 5.23 0.00 4.32 5.23 0.00
Min -5.73 0.00 -6.41 -6.71 0.00 -7.63 -6.94 0.00 -7.63
StD 2.20 1.20 1.63 2.48 1.31 1.86 2.66 1.40 1.98
%<0 61.36% 59.09% 55.68%
Four-week runs of lower highs, lows, and closes in the dollarindex were followed by continued selling, most noticeably inweeks 1-6. The index did, in fact, close lower the week ending July 20, keeping the pattern’s perfect week-1 recordof lower closes intact.
TABLE 2 — FOUR-WEEK RUNS OF LOWER HIGHS, LOWER LOWS, LOWER CLOSES
Week: +1 +2 +3 +4
Avg -0.96 -1.26 -1.32 -1.46
Med -0.71 -0.98 -1.54 -1.12
Max -0.11 0.77 0.63 1.72
Min -2.57 -4.67 -3.10 -4.90
StD 0.73 1.32 1.20 1.65
%<0 100.00% 80.00% 80.00% 85.00%
Week: +5 +6 +7 +8
Avg -1.25 -1.01 -0.99 -0.95
Med -1.04 -1.51 -1.53 -0.92
Max 2.64 2.71 3.73 1.81
Min -6.71 -4.17 -4.08 -3.27
StD 1.84 1.62 1.97 1.78
%<0 85.00% 75.00% 55.00% 65.00%

shows the percentage of the close-to-close changes thatwere negative for each week.
For example, Table 1 shows the median move from thepattern week’s close to the week 4 close was -0.50, while themedian LUM was 1.31 and the median LDM was -1.64(highlighted in blue). Finally, the dollar index closed week
4 below the pattern week’s close 61.36 percent of the time. Although these numbers point downward, the standard
deviations show there is a great deal of variability, especial-ly in regard to the closing moves at each interval. Also, thebearish edge declined in weeks 7 and 8 (not shown), both ofwhich had mixed results — neither bearish nor bullish.
Table 2 shows the results of a different test ofweekly data — the performance after four con-secutive weeks of lower weekly highs, lows, andcloses. This time the statistics are shown only forthe closes eight weeks after the pattern. Therewere only 21 previous examples of such runs(dating back to 1998), but the subsequent priceaction was fairly consistently downward for thenext eight weeks, although less so in weeks 7and 8 (reminiscent of the previous study). Also,week 1 closed lower in every instance.
Short-term analysisResearch on the daily time frame resulted inlooking at a pattern centered on the July 18 out-side bar (higher high and lower low than pre-ceding bar). This day, which is the third-to-lastbar in Figure 3, was also the lowest low of thepast 30 bars and was more than 0.025 percentbelow the previous low.
Table 3 shows the dollar index’s performancein the first 10 days after 20 examples of this pat-tern dating back to 2000. The percentages associ-ated with lower closes and larger LUMs thanLDMs is evident. (This analysis was the reasonbehind a trade detailed in the Forex Trade
40 August 2007 • CURRENCY TRADER
SPOT CHECK continued
TABLE 3 — DOLLAR INDEX AFTER OUTSIDE DAY, 30-DAY LOW
Day: +1 LUM LDM +2 LUM LDM +3 LUM LDM +4 LUM LDM +5 LUM LDMAvg -0.28 0.21 -0.49 -0.28 0.33 -0.67 -0.44 0.36 -0.84 -0.42 0.38 -0.93 -0.53 0.39 -1.06Med -0.13 0.18 -0.24 -0.23 0.27 -0.59 -0.35 0.27 -0.71 -0.30 0.27 -0.81 -0.39 0.29 -0.96Max 0.28 0.90 -0.04 1.36 1.53 -0.04 1.14 1.73 -0.18 0.58 1.73 -0.21 1.37 1.73 -0.29Min -1.51 0.00 -1.85 -1.96 0.00 -2.10 -1.71 0.00 -2.13 -2.82 0.00 -2.97 -2.68 0.00 -3.19StD 0.46 0.20 0.47 0.70 0.35 0.53 0.66 0.39 0.56 0.74 0.41 0.69 0.81 0.40 0.72%<0 75% 60% 80% 70% 80%
Day: +6 LUM LDM +7 LUM LDM +8 LUM LDM +9 LUM LDM +10 LUM LDMAvg -0.65 0.42 -1.18 -0.79 0.45 -1.29 -0.73 0.46 -1.39 -0.58 0.55 -1.48 -0.69 1.11 -1.65Med -0.77 0.29 -1.15 -1.01 0.31 -1.30 -0.67 0.31 -1.30 -0.56 0.34 -1.53 -0.97 0.96 -1.53Max 1.80 2.11 -0.29 1.43 2.14 -0.29 1.64 2.14 -0.29 2.95 3.18 -0.29 3.15 3.96 -0.65Min -2.97 0.00 -3.19 -2.91 0.00 -3.28 -2.80 0.00 -3.28 -3.59 0.00 -3.72 -3.82 0.23 -4.57StD 0.96 0.49 0.72 0.84 0.51 0.73 0.90 0.50 0.70 1.31 0.70 0.75 1.45 0.93 0.86
%<0 80% 89% 89% 74% 74%
The dollar index continued to decline after outside bars that were also 30-day lows that were 0.025 percent below the previouslow. These statistics led to a trade in the dollar index futures.
Near-term action on the daily chart also pointed lower. The low of theJuly 18 outside bar (third-to-last bar) was the lowest low of the past 30bars and was more than 0.025 percent below the previous low. The finalbar (July 20) was another outside day that fulfilled the pattern criteria.
FIGURE 3 — DAILY PERSPECTIVE
Source: TradeStation
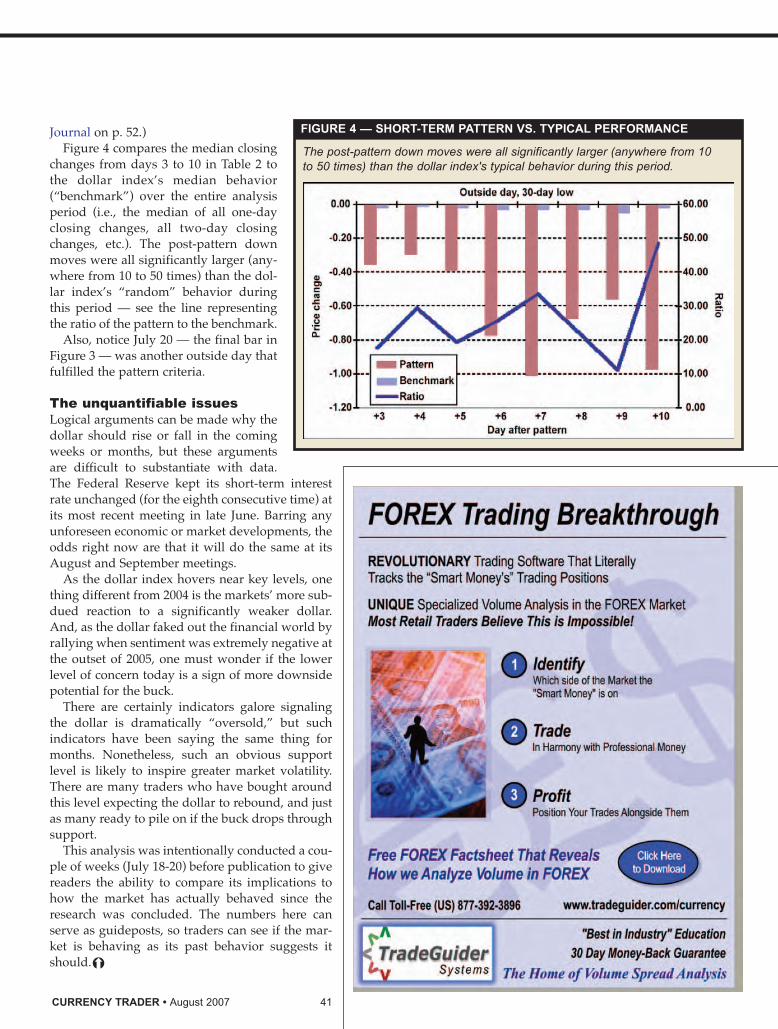
CURRENCY TRADER • August 2007 41
Journal on p. 52.)Figure 4 compares the median closing
changes from days 3 to 10 in Table 2 tothe dollar index’s median behavior(“benchmark”) over the entire analysisperiod (i.e., the median of all one-dayclosing changes, all two-day closingchanges, etc.). The post-pattern downmoves were all significantly larger (any-where from 10 to 50 times) than the dol-lar index’s “random” behavior duringthis period — see the line representingthe ratio of the pattern to the benchmark.
Also, notice July 20 — the final bar inFigure 3 — was another outside day thatfulfilled the pattern criteria.
The unquantifiable issuesLogical arguments can be made why thedollar should rise or fall in the comingweeks or months, but these argumentsare difficult to substantiate with data.The Federal Reserve kept its short-term interestrate unchanged (for the eighth consecutive time) atits most recent meeting in late June. Barring anyunforeseen economic or market developments, theodds right now are that it will do the same at itsAugust and September meetings.
As the dollar index hovers near key levels, onething different from 2004 is the markets’ more sub-dued reaction to a significantly weaker dollar.And, as the dollar faked out the financial world byrallying when sentiment was extremely negative atthe outset of 2005, one must wonder if the lowerlevel of concern today is a sign of more downsidepotential for the buck.
There are certainly indicators galore signalingthe dollar is dramatically “oversold,” but suchindicators have been saying the same thing formonths. Nonetheless, such an obvious supportlevel is likely to inspire greater market volatility.There are many traders who have bought aroundthis level expecting the dollar to rebound, and justas many ready to pile on if the buck drops throughsupport.
This analysis was intentionally conducted a cou-ple of weeks (July 18-20) before publication to givereaders the ability to compare its implications tohow the market has actually behaved since theresearch was concluded. The numbers here canserve as guideposts, so traders can see if the mar-ket is behaving as its past behavior suggests itshould.�
The post-pattern down moves were all significantly larger (anywhere from 10 to 50 times) than the dollar index's typical behavior during this period.
FIGURE 4 — SHORT-TERM PATTERN VS. TYPICAL PERFORMANCE

INDUSTRY NEWS
T he United States Futures Exchange (USFE) will beginoffering spot equivalent futures (SEF) on Sept. 21. Thecontracts will trade 23 hours per day.
The USFE will begin with six contracts — U.S. dollar/euro,U.S. dollar/British pound, U.S. dollar/Australian dollar,Japanese yen/U.S. dollar, Swiss franc/U.S. dollar, andCanadian dollar/U.S. dollar.
The contracts are retail-sized, with a tick worth $5 for thethree U.S.-dollar based contracts, 500 yen for the JPY/USDcontract, and five Swiss franc and five Canadian dollars forthe CHF/USD and CAD/USD contracts, respectively.
SEFs are structured to automatically allocate the cost-of-carry associated with holding a spot forex position openovernight, making them identical to a spot position.�
42 August 2007 • CURRENCY TRADER
INDUSTRY NEWSINDUSTRY NEWS
New rule changes proposed by the National FuturesAssociation (NFA) could have a significant effect onseveral brokerages that trade foreign exchange.
The NFA wants to raise capital requirements for all regis-tered Forex Dealer Members (FDM) to $5 million, plus itwants improved accounting standards. The NFA is hopingthe increased standards will prevent the ongoing problem offorex brokerages going bankrupt and/or committing fraud.
The proposal could potentially wipe out 90 percent ofexisting forex brokerages, although it’s likely major consoli-dation would occur if the rule passes. Forex brokerage FXCMhas been the most vocal supporter of the rule, although theyhave received support from some other big firms.
Naturally, there is opposition from the less-capitalizedfirms. In a comment letter to the NFA, Knight Capital Group,which owns Hotspot FX, agreed that greater oversight isneeded but doesn’t think a “one-size-fits-all” solution willwork.
“Certain FDMs, like Hotspot, do not operate their businesslike a traditional dealer. They automatically offset (real-time)all client trades with bank market makers or client sub-scribers.
As such, Hotspot effectively operates on a ‘riskless princi-pal’ basis on behalf of its clients, thereby reducing dramati-cally any associated risk with that transaction and its clients’funds,” Knight said in the letter.
“Thus, since Hotspot and other FDMs similarly situateddo not directly offset client trades, they are not subject to thesame market volatility and risk as are FDMs that take theother side of client trades and put their client accounts(deposits) at risk.”
Since 2000, the NFA has authorized Forex Dealing licensesto more than 50 firms. However, many of these firms wentout of business because they were undercapitalized, andfraud continues to be a problem in the forex brokerage arena.
As of July 2007, there were 43 licensed FDMs operating.According to the NFA, 30 have adjusted net capital of lessthan $5 million, and only four of those 30 have more than $3million. The average adjusted net capital of those 30 firms isless than $1.5 million.
The NFA estimates the new rules, combined with existingrules, will force firms to have at least $10 million in adjustednet capital to remain in business.
According to data obtained from the CFTC, the new ruleswould leave only six forex brokerages: FXCM, GFT Forex,Oanda, FXSolutions, Gain Capital, and CMS.
NFA’s concernsThe NFA listed four specific reasons for the rule change.First, trading spot forex, which FDMs do, creates more riskthan trading futures and options listed on an exchange.
Second, since spot forex is not a priority under the NFA’sBankruptcy Code, it’s particularly important for FDMs tohave adequate capital.
Plus, two of the three bankruptcy proceedings in whichthe NFA has taken part in the past four years have involvedsmaller FDMs, and with the cumulative amount of retailfunds under account surpassing $1 billion, the NFA is con-cerned that an FDM might be unable to meet its financialobligations to its customers.
Earlier in the year, Concorde Forex Group (CFG Trader)was shut down by the NFA and forced to liquidate all openpositions because it was undercapitalized. CFG Trader cus-tomers collectively lost about $1 million, and the NFA saysthis incident was a catalyst for the new rule, particularly thenew accounting requirements.
When CFG’s books were examined after its trading wassuspended, it was discovered the firm’s assets were held inmultiple accounts, company and customer funds were com-mingled, CFG had no anti-money laundering program andno internal compliance staff, and it had never been audited.
As a result, firms that meet the new capital requirementswill also have to file an internal control report prepared by anindependent auditor, and the NFA would have limited abili-ty to request certification of an FDM’s finances. Also, eachFDM would have to designate an individual to oversee thefirm’s finances, and that person would be subject to disci-pline if accounting and capitalization rules are notfollowed.�
A capital idea
New NFA proposal could cause significant shakeup among forex brokerages
Spot on
USFE to list forex futures

BookstoreGO TO: www.invest-store.com/currencytradermag
www.invest-store.com/currencytradermag ❖ 800.272.2855 ext B1173 ❖ FAX: 800.727.0003OrderNow:
The Complete Guide to Technical IndicatorsMark LarsonLength: 6 hoursItem #5197572 Price $795
6+ hours on 4 DVDs! Now you can easily carve through the hundreds of indicators and get right to the ones that make money most often and help you achieve success in trading in this comprehensive guide to cracking the code of technical indicators.
The Insider's Guide to Forex TradingKathy LienLength: 90 minItem #5197573 Price $99
This course that gives you the tools, tactics and expertise you need to tap into the huge potential forex trading offers—from the return boosting advantage of interest paid out on currencies to the flexibility of the 24/7 markets.
Seven Set-ups that Consistently Make MoneyJeff CooperLength: 90 minItem #5197574 Price: $129
A reliable trading set-up can be worth a fortune in winning trades. Jeff Cooper, hands over his seven most consistently profitable set-ups that will work in a wide variety of market conditions.
Predicting Market Trends Alan FarleyLength: 90 minItem #5197575 Price: $99
To master the complexity of our modern financial markets, traders need innovative timing tech-niques and sound trade management in order to profit. In this 90-minute presentation, the Master Swing Trader, Alan Farley, shows you how to incorporate market trends and timing into every single trade you make.
Proven Candlestick PatternsSteve PalmquistLength: 90 minItem #5197576 Price: $99After testing every known candlestick pattern, Steve Palmquist has determined which candle-sticks are the most effective and gives you exten-sive data and techniques for how to best incorpo-rate them into your trading strategy.
New Tactics in Technical AnalysisJeff GreenblattLength 90 minItem #5197586 Price: $99
In this innovative DVD course, Jeff Greenblatt brings you new tactics to see the big moves before they happen, so you are ready to make big trades time after time again like a machine.
Technical Analysis for Short-Term Traders, 2nd Ed.Marting PringLength 90 minItem #5197587 Price: $99One of the greatest technicians in the industry has taken one of his best courses and made it even bet-ter with new tactics, new examples and his sharp and straight-forward insights. Traders' Hall of Fame Award Winner, Martin Pring, walks you through how to identify the trend, confirm the trends and then apply short term tactics to exploit the trend.
ETF Trading Tactics: Using the Power of the Market to Make Money David VomundLength: 90 minItem #5197588 Price: $99Vomund's rock-solid and simple strategies for evaluating and rotating ETFs will have you on your way to profiting in no time. Don't get left behind… make ETFs a part of your trading strategy and start seeing returns.
Options Strategies for Consistent IncomeRoss JardineLength 90 minItem #5197589 Price: $99Perfect for novice investors just getting started with options or for active traders who want to hone their options trading skills, Ross Jardine's new 90-minute course shows you how to accomplish every investor's goal -- how to earn consistent and reliable income from the stock market.
Brand New DVD Trading Courses
2007 Trading FORUMrecorded at the

CURRENCY FUTURES
This information is for educational purposes only. Currency Trader provides this datain good faith, but assumes no responsibility for the use of this information. CurrencyTrader does not recommend buying or selling any market, nor does it solicit orders tobuy or sell any market. There is a high level of risk in trading, especially for traderswho use leverage. The reader assumes all responsibility for his or her actions in themarket.
LEGEND:Sym: Ticker symbol.Vol: 30-day average daily volume, in thousands.OI: 30-day open interest, in thousands.10-day move: The percentage price move from the close 10 days ago to today’s close.20-day move: The percentage price move from the close 20 days ago to today’s close.60-day move: The percentage price move from the close 60 days ago to today’s close.The “% rank” fields for each time window (10-day moves, 20-day moves, etc.) show thepercentile rank of the most recent move to a certain number of the previous moves of thesame size and in the same direction. For example, the % rank for 10-day move showshow the most recent 10-day move compares to the past twenty 10-day moves; for the 20-day move, the % rank field shows how the most recent 20-day move compares to the
CURRENCY FUTURES SNAPSHOT as of July 26
The information does NOT constitute trade signals. It is intended only to provide a brief synopsis of each market’sliquidity, direction, and levels of momentum and volatility. See the legend for explanations of the different fields.
past sixty 20-day moves; for the 60-day move, the % rank field shows how the most recent60-day move compares to the past one-hundred-twenty 60-day moves. A reading of 100%means the current reading is larger than all the past readings, while a reading of 0% meansthe current reading is lower than the previous readings. Volatility ratio /% rank: The ratio is the short-term volatility (10-day standard deviation ofprices) divided by the long-term volatility (100-day standard deviation of prices). The %rank is the percentile rank of the volatility ratio over the past 60 days.
Managed money: Barclay Trading Group’s currency trader rankings for June 2007
Top 10 currency traders managing more than $10 million as of June 30, ranked by June 2007 return
2007 Rank Trading June YTD $ Under
(millions) advisor return return mgmt. 1. Stark Quant. Inv. (Currency Fund) 8.26 18.7 57.1M2. Wooster Asset Mgmt (Portage Fund) 6.80 22.58 79.3M3. Stonebrook Structured Products (FXC) 5.82 11.10 25.1M4. Appleton Cap'l (Appleton 25% Risk) 5.40 10.04 199.3M5. ABN AMRO Asset Mgmt (Curr USD) 5.01 8.25 152.4M6. FX Concepts (DMC) 4.57 4.51 7600.0M7. DKR Capital (DKR Strat. Currency) 4.40 4.13 40.0M8. Grossman Asset Mgmt (IPS Currency) 3.54 5.49 1110.0M9. Harmonic Capital (Gl. Currency) 3.33 19.17 N/A
10. Sunrise Cap'l Partners (Currency Fund) 3.15 9.77 125.9Top 10 currency traders managing less than $10 million and more than $1 million
as of June 30, ranked by June 2007 return1. Metro Forex Inc (Tri Gl FX) 5.07 18.54 4.0M2. High Desert Currency Mgmt 3.57 22.99 2.7M3. Spectrum Asset Mgmt LLC (Currency) 2.71 3.60 6.0M4. MIGFX Inc (Retail) 2.70 20.56 5.1M5. Marek D. Chelkowski (Forex) 2.50 17.82 1.0M6. UMJ Tekniko Fund 2.20 -8.52 7.6M7. FEM Currency Portfolio Ltd 2.20 -2.29 2.3M8. SSgA Absolute Return Currency Fund 1.91 4.65 9.2M9. EMC Capital Mgmt (Currency) 0.70 0.91 2.1M
10. Capricorn Advisory Mgmt (fxMT Growth) 0.62 7.72 5.2M
Source: The Barclay Group (www.barclaygrp.com)
Based on estimates of the composite of all accounts or the fully funded subset method. Does not reflect the performance of any single account.PAST RESULTS ARE NOT NECESSARILY INDICATIVE OF FUTURE PERFORMANCE.
Currency traders are taking baby steps toward prof-itability, as the Barclay’s Currency Traders Index (CTI)crept up 0.52 percent in July, bringing its 2007 gain to0.9 percent.
That may not send investors in the 114 managedmoney programs (currency futures and spot forex)that comprise the index racing for a withdrawal slip,but it does represent the highest level of profit the CTIhas enjoyed this year.
The CTI still lags behind seven of the six otherindices comprised by Barclay’s. The CTA index,Barclay’s catch-all index, is up 2.2 percent throughJuly.
The CTI is trying to avoid its third straight losingyear, which would be a first in the 20-year history ofthe index.
The Barclay BTOP FX Index, which tracks thelargest investable currency trading programs andaccounts for at least half of the investable assets of allprograms tracked by Barclay, gained 0.2 percent inJuly and is up 3.3 percent for the year.
The index, which has been calculated since thebeginning of 2005, made an all-time high of 1,053.60on July 23. It fell in the final week of the month, clos-ing July at 1.040.79.�
Contract Pit Elec Exch Vol OI 10-day % 20-day % 60-day % Volatility sym sym move rank move rank move rank ratio /% rank
Eurocurrency EC 6E CME 155.6 199.8 -0.36% 0% 2.08% 65% 0.86% 17% .22 / 55%Japanese yen JY 6J CME 120.7 288.0 3.04% 100% 2.81% 100% 1.01% 56% .48 / 100%British pound BP 6B CME 83.3 151.1 0.95% 20% 2.61% 67% 2.43% 78% .30 / 30%Swiss franc SF 6S CME 66.4 105.8 -0.12% 0% 1.79% 65% 0.79% 41% .37 / 58%Canadian dollar CD 6C CME 49.3 141.0 -0.84% 100% 1.42% 22% 5.18% 30% .13 / 32%Australian dollar AD 6A CME 38.0 113.1 0.61% 0% 4.22% 94% 5.06% 60% 21 / 58%Mexican peso MP 6M CME 19.5 76.2 -2.16% 100% -1.39% 90% -0.66% 40% .60 / 90%New Zealand dollar NE 6N CME 3.6 41.7 -0.04% 100% 3.38% 53% 5.41% 47% .28 / 73%U.S. dollar index DX NYBOT 3.6 30.2 -0.19% 5% -2.19% 65% -1.58% 52% .17 / 38%Euro / Japanese yen EJ NYBOT 1.2 28.7 -3.21% 100% -1.21% 100% -0.20% 38% .42 / 97%
Note: Average volume and open interest data includes both pit and side-by-side electronic contracts (where applicable). Price activity is based on pit-traded contracts.
Light at end of tunnelfor currency traders?
44 August 2007 • CURRENCY TRADER

GLOBAL NEWS BRIEFS
� Germany’s June jobless rate fell 0.3 percent from theprevious month to 8.8 percent, a drop of 1.7 percent fromJune 2006.
� The UK’s unemployment rate for March to May fell0.1 percent from the previous three-month period to 5.4percent. The rate was unchanged from the same three-month period in 2006.
EUROPE
�Australia’s June unemployment rate grew 0.1 percentto 4.3 percent compared to the previous month, a drop of0.5 percent compared to the same month in 2006.
� Preliminary data shows that Hong Kong’s jobless ratefor the second quarter dropped 0.1 percent from the pre-vious quarter to 4.2 percent, the lowest rate in nine years.The rate was 0.5-percent lower than the second quarter of2007. According to a government press release, “In thenext few months, the entry of fresh graduates and schoolleavers will continue to affect the labor force and unem-ployment figures. The near-term outlook of the labormarket will depend on whether the pace of job creationin the economy is sufficient to absorb the newcomers.”
� Singapore’s Q1 unemployment rate rose 0.3 percentfrom the previous quarter to 2.9 percent and also gained0.3 percent from the first quarter a year ago.
�Brazil’s Q1 2007 GDP increased 0.8 percent year-over-year as the services sector produced a 1.7-percentincrease in its GDP contribution.
� Canada’s Q1 2007 unemployment rate remainedunchanged at 6.1 percent from the previous quarter andthe same quarter a year earlier. “Employment growthresumed in June, up an estimated 35,000, following littlechange in April and May,” Statistics Canada said in apress release. ”Despite this gain, the national unemploy-ment rate remained at 6.1 percent for the fifth consecu-tive month, as more people entered the labor force inJune in search of work.”
AMERICAS
CURRENCY TRADER August 2007 45
The Bank of England raised its bank rate in July by0.25 percent to 5.75 percent, continuing a cycle ofincreases that began in August 2006 when the ratewas raised to 4.75 percent. A booming UK economyhas caused the BOE to keep raising rates.
The Bank of Canada increased its overnight fund-ing rate in July 0.25 percent to 4.5 percent, ending along period of rate neutrality. The last rate hike for theGreat White North came in May 2006, when ratesincreased to a multi-year high of 4.75 percent.
The Central Bank of Brazil dropped its selic rate0.50 percent in July to an all-time low of 11.5 percent.The cut is the 17th since September 2005, when theSelic was 19.75 percent.
The Central Bank of Chile raised its discount rate0.25 percent in July to 5.25 percent. The rate hikecomes after Chile dropped rates 0.25 percent inJanuary for the first time in five years.
The Bank of Israel increased its short-term lend-ing rate in July, ending a long period of looseningrates with a 0.25-percent hike to 3.75 percent. It wasthe first rate increase in a year after seven straightdecreases.
The People’s Bank of China increased its one-year yuan lending rate 0.27 percent to 6.84 percentin July.
The Bank of Indonesia dropped its reference rateagain in July 25 basis points to 8.25 percent. The ratecut was the third in as many months, the 12th in 13months, and the 13th since April 2006 when the ratestood at 12.75 percent.
The Bank of Korea raised its overnight call rate 25basis points in July 4.75 percent. The hike was thefirst in a year but is the sixth increase since the end of2004.
The Central Bank of the Philippines dropped itsovernight borrowing rate significantly, cutting therate 1.5 percent to 6 percent in July. The Philippineshad not dropped rates in more than five years.
The Bank of Thailand dropped its 1-day (repo) rate0.25 percent to 3.25 percent in July, its fifth rate cut in2007. The cuts follow more than four years of steadyincreases.
Interest Rates
��
��
��
��
��
��
��
��
��
��
ASIA & AUSTRALIA

INTERNATIONAL MARKET SUMMARY
Currentprice vs. 1-month 3-month 6-month 52-week 52-week Previous
Rank* Country Currency U.S. dollar gain/loss gain/loss gain/loss high low rank
1 Thai baht 0.03394 8.64% 9.10% 19.30% 0.03394 0.02625 3
2 New Zealand dollar 0.8081 5.81% 8.84% 15.64% 0.8106 0.6141 1
3 Brazil real 0.5434 4.40% 10.47% 15.49% 0.5434 0.4362 13
4 Australian dollar 0.8845 4.34% 6.84% 12.73% 0.8862 0.7413 2
5 South African rand 0.1468 4.34% 3.82% 4.56% 0.1487 0.1253 12
6 British pound 2.0624 3.13% 3.14% 4.37% 2.0653 1.8383 6
7 Swedish krona 0.1501 2.95% 1.56% 4.89% 0.151 0.1344 14
8 Euro 1.3823 2.59% 1.76% 6.28% 0.13852 1.2482 10
9 Japanese yen 0.008283 2.58% -1.79% 0.52% 0.00877 0.00805 16
10 Canadian dollar 0.9584 2.31% 7.54% 13.15% 0.9644 0.842 5
11 Singapore dollar 0.6644 2.20% 0.58% 2.01% 0.6647 0.6278 15
12 Swiss franc 0.8304 2.03% 0.23% 3.36% 0.8415 0.7829 11
13 Russian ruble 0.03939 1.94% 1.42% 4.37% 0.03941 0.03702 7
14 Indian rupee 0.02484 1.22% 2.69% 9.96% 0.02485 0.02125 17
15 Chinese yuan 0.1324 0.84% 2.16% 2.80% 0.1324 0.1247 9
16 Taiwan dollar 0.03051 -0.07% 1.29% 0.46% 0.03098 0.02983 4
17 Hong Kong dollar 0.1279 -0.08% -0.08% -0.23% 0.1288 0.1264 8
FOREX (vs. U.S. DOLLAR)
ACCOUNT BALANCE
Rank Country 2007 Ratio* 2006 2008+
1 Singapore 39.644 27.1 36.288 41.9392 Switzerland 68.511 17.6 69.825 68.1393 China 303.651 10 238.536 356.6174 Hong Kong 19.449 9.6 19.388 19.9245 Netherlands 55.176 7.7 46.989 58.0076 Taiwan 25.924 7.1 25.187 27.8757 Sweden 28.06 6.6 28.447 30.0968 Russia 72.902 6.2 95.6 67.7979 Germany 161.938 5.3 146.361 164.7110 Japan 166.586 3.9 170.355 159.14211 Brazil 8.939 0.8 13.648 3.2612 Canada 9.351 0.7 21.464 7.612
Rank Country 2007 Ratio* 2006 2008+
13 Mexico -9.197 -1 -1.475 -13.46114 France -51.972 -2.2 -46.304 -58.515 India -23.768 -2.4 -19.298 -24.56816 UK -81.402 -3.1 -68.122 -87.98317 Australia -46.24 -5.6 -40.856 -46.74318 U.S. -834.623 -6.1 -856.661 -866.14519 South Africa -17.418 -6.4 -16.415 -17.38520 Spain -127.459 -9.4 -108.019 -142.416
Totals in billions of U.S. dollars
*Account balance in percent of GDP +EstimateSource: International Monetary Fund, World Economic OutlookDatabase, April 2007
As of July 25 *based on one-month gain/loss
46 August 2007 • CURRENCY TRADER
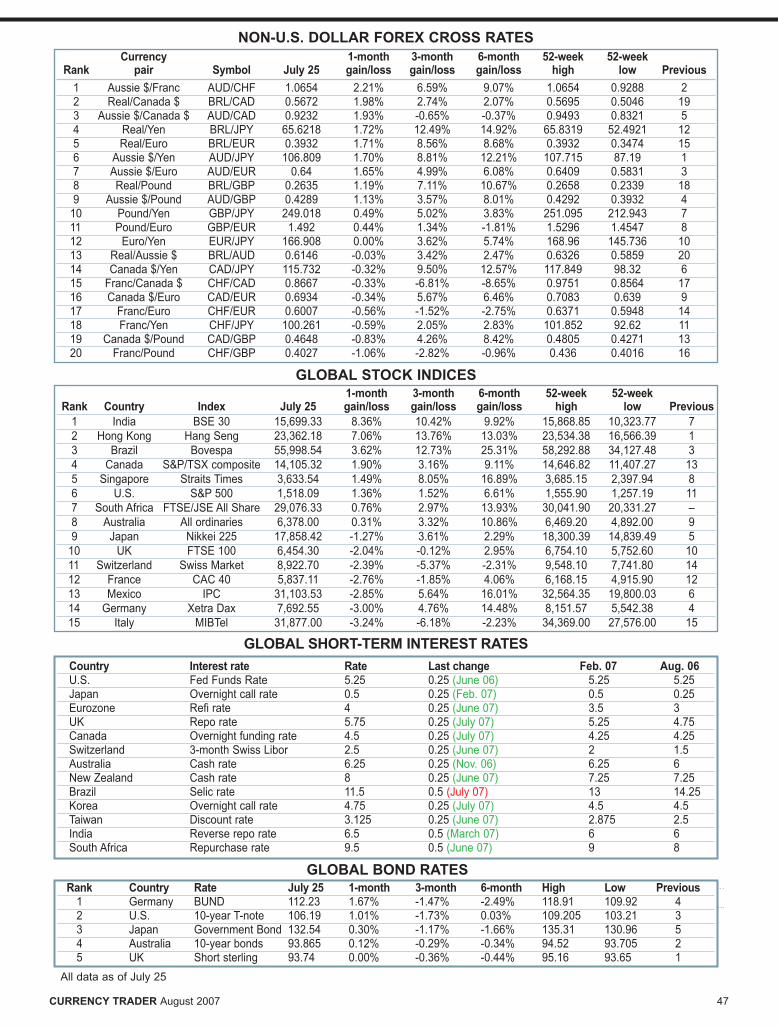
CURRENCY TRADER August 2007 47
NON-U.S. DOLLAR FOREX CROSS RATES
GLOBAL STOCK INDICES
GLOBAL BOND RATESRank Country Rate July 25 1-month 3-month 6-month High Low Previous
1 Germany BUND 112.23 1.67% -1.47% -2.49% 118.91 109.92 42 U.S. 10-year T-note 106.19 1.01% -1.73% 0.03% 109.205 103.21 33 Japan Government Bond 132.54 0.30% -1.17% -1.66% 135.31 130.96 54 Australia 10-year bonds 93.865 0.12% -0.29% -0.34% 94.52 93.705 25 UK Short sterling 93.74 0.00% -0.36% -0.44% 95.16 93.65 1
Country Interest rate Rate Last change Feb. 07 Aug. 06U.S. Fed Funds Rate 5.25 0.25 (June 06) 5.25 5.25Japan Overnight call rate 0.5 0.25 (Feb. 07) 0.5 0.25Eurozone Refi rate 4 0.25 (June 07) 3.5 3UK Repo rate 5.75 0.25 (July 07) 5.25 4.75Canada Overnight funding rate 4.5 0.25 (July 07) 4.25 4.25Switzerland 3-month Swiss Libor 2.5 0.25 (June 07) 2 1.5Australia Cash rate 6.25 0.25 (Nov. 06) 6.25 6New Zealand Cash rate 8 0.25 (June 07) 7.25 7.25Brazil Selic rate 11.5 0.5 (July 07) 13 14.25Korea Overnight call rate 4.75 0.25 (July 07) 4.5 4.5Taiwan Discount rate 3.125 0.25 (June 07) 2.875 2.5India Reverse repo rate 6.5 0.5 (March 07) 6 6South Africa Repurchase rate 9.5 0.5 (June 07) 9 8
GLOBAL SHORT-TERM INTEREST RATES
All data as of July 25
1-month 3-month 6-month 52-week 52-weekRank Country Index July 25 gain/loss gain/loss gain/loss high low Previous
1 India BSE 30 15,699.33 8.36% 10.42% 9.92% 15,868.85 10,323.77 72 Hong Kong Hang Seng 23,362.18 7.06% 13.76% 13.03% 23,534.38 16,566.39 13 Brazil Bovespa 55,998.54 3.62% 12.73% 25.31% 58,292.88 34,127.48 34 Canada S&P/TSX composite 14,105.32 1.90% 3.16% 9.11% 14,646.82 11,407.27 135 Singapore Straits Times 3,633.54 1.49% 8.05% 16.89% 3,685.15 2,397.94 86 U.S. S&P 500 1,518.09 1.36% 1.52% 6.61% 1,555.90 1,257.19 117 South Africa FTSE/JSE All Share 29,076.33 0.76% 2.97% 13.93% 30,041.90 20,331.27 –8 Australia All ordinaries 6,378.00 0.31% 3.32% 10.86% 6,469.20 4,892.00 99 Japan Nikkei 225 17,858.42 -1.27% 3.61% 2.29% 18,300.39 14,839.49 5
10 UK FTSE 100 6,454.30 -2.04% -0.12% 2.95% 6,754.10 5,752.60 1011 Switzerland Swiss Market 8,922.70 -2.39% -5.37% -2.31% 9,548.10 7,741.80 1412 France CAC 40 5,837.11 -2.76% -1.85% 4.06% 6,168.15 4,915.90 1213 Mexico IPC 31,103.53 -2.85% 5.64% 16.01% 32,564.35 19,800.03 614 Germany Xetra Dax 7,692.55 -3.00% 4.76% 14.48% 8,151.57 5,542.38 415 Italy MIBTel 31,877.00 -3.24% -6.18% -2.23% 34,369.00 27,576.00 15
Currency 1-month 3-month 6-month 52-week 52-weekRank pair Symbol July 25 gain/loss gain/loss gain/loss high low Previous
1 Aussie $/Franc AUD/CHF 1.0654 2.21% 6.59% 9.07% 1.0654 0.9288 22 Real/Canada $ BRL/CAD 0.5672 1.98% 2.74% 2.07% 0.5695 0.5046 193 Aussie $/Canada $ AUD/CAD 0.9232 1.93% -0.65% -0.37% 0.9493 0.8321 54 Real/Yen BRL/JPY 65.6218 1.72% 12.49% 14.92% 65.8319 52.4921 125 Real/Euro BRL/EUR 0.3932 1.71% 8.56% 8.68% 0.3932 0.3474 156 Aussie $/Yen AUD/JPY 106.809 1.70% 8.81% 12.21% 107.715 87.19 17 Aussie $/Euro AUD/EUR 0.64 1.65% 4.99% 6.08% 0.6409 0.5831 38 Real/Pound BRL/GBP 0.2635 1.19% 7.11% 10.67% 0.2658 0.2339 189 Aussie $/Pound AUD/GBP 0.4289 1.13% 3.57% 8.01% 0.4292 0.3932 4
10 Pound/Yen GBP/JPY 249.018 0.49% 5.02% 3.83% 251.095 212.943 711 Pound/Euro GBP/EUR 1.492 0.44% 1.34% -1.81% 1.5296 1.4547 812 Euro/Yen EUR/JPY 166.908 0.00% 3.62% 5.74% 168.96 145.736 1013 Real/Aussie $ BRL/AUD 0.6146 -0.03% 3.42% 2.47% 0.6326 0.5859 2014 Canada $/Yen CAD/JPY 115.732 -0.32% 9.50% 12.57% 117.849 98.32 615 Franc/Canada $ CHF/CAD 0.8667 -0.33% -6.81% -8.65% 0.9751 0.8564 1716 Canada $/Euro CAD/EUR 0.6934 -0.34% 5.67% 6.46% 0.7083 0.639 917 Franc/Euro CHF/EUR 0.6007 -0.56% -1.52% -2.75% 0.6371 0.5948 1418 Franc/Yen CHF/JPY 100.261 -0.59% 2.05% 2.83% 101.852 92.62 1119 Canada $/Pound CAD/GBP 0.4648 -0.83% 4.26% 8.42% 0.4805 0.4271 1320 Franc/Pound CHF/GBP 0.4027 -1.06% -2.82% -0.96% 0.436 0.4016 16
48 August 2007 • CURRENCY TRADER
GLOBAL ECONOMIC CALENDAR MONTH
Legend
CPI: Consumer price index
ECB: European Central Bank
FOMC: Federal open marketcommittee
GDP: Gross domestic product
ISM: Institute for supply management
PPI: Producer price index
GLOBAL ECONOMIC CALENDAR AUGUST/SEPTEMBER
August1 U.S.: ISM
Japan: Account balances
Great Britain: Monetary policy
committee meeting
Australia: Index of commodity prices
2 ECB: Governing council meeting
Japan: Monetary base
Great Britain: Monetary policy
committee meeting
3 U.S.: Employment report
Germany: Retail turnover
456 Germany: Orders received and
manufacturing turnover
7 U.S.: FOMC meeting
Germany: Production index
Australia: Reserve bank meeting
8 U.S.: Wholesale inventories
Great Britain: Inflation report
Germany: Foreign trade; bankruptcies
Australia: Official reserve assets
910 Japan: Corporate goods price index
111213 U.S.: Retail sales
Japan: Balance of payments
Great Britain: PPI
Australia: Statement on monetary policy
14 U.S.: PPI; trade balance
Japan: Monetary survey
Great Britain: CPI
15 U.S.: CPI
Canada: Manufacturing survey
Great Britain: Employment report
Norway: Monetary policy meeting
South Africa: Monetary policy council
meeting
16 Germany: CPI
South Africa: Monetary policy council
meeting
17 Germany: PPI
Canada: Wholesale trade
181920 U.S.: Leading indicators
Great Britain: Capital issues
21 Germany: Employment report
Canada: CPI; retail trade;
leading indicators
22 Japan: Monetary policy meeting
23 Japan: Monetary policy meeting
Germany: National accounts
Philippines: Monetary board meeting
24 U.S.: Durable goods
Japan: Corporate service price index
25 Mexico: Monetary policy announcement
2627 Israel: Announcement of changes in the
interest rate
28 Canada: Employment report
Poland: Monetary policy council meeting
29 Poland: Monetary policy council meeting
Thailand: Monetary policy committee
meeting
30 U.S.: GDP
Canada: Balance of payments
Czech Republic: Czech National Bank
board meeting
31 Canada: GDP
Australia: International reserves and
foreign currency liquidity
September123 Japan: Account balances
Germany: Retail turnover
Australia: Index of commodity prices
4 U.S.: ISM
Japan: Monetary base
Australia: Reserve bank meeting
Brazil: Monetary policy committee
meeting
5 Great Britain: Monetary policy
committee meeting
Canada: Interest rate announcement
Brazil: Monetary policy committee
meeting
6 ECB: Governing council meeting
Great Britain: Monetary policy
committee meeting
Germany: Orders received and
manufacturing turnover
Economic Release time release (U.S.) (ET)
GDP 8:30 a.m.CPI 8:30 a.m.ECI 8:30 a.m.PPI 8:30 a.m.ISM 8:30 a.m.Unemployment 8:30 a.m.Personal income 8:30 a.m.Durable goods 8:30 a.m.Retail sales 8:30 a.m.Trade balance 8:30 a.m.Leading indicators 10 a.m.
The information on this page issubject to change. CurrencyTrader is not responsible forthe accuracy of calendar datesbeyond press time.
AUGUST 2007
29 30 31 1 2 3 4
5 6 7 8 9 10 11
12 13 14 15 16 17 18
19 20 21 22 23 24 25
26 27 28 29 30 31 1
SEPTEMBER 2007
26 27 28 29 30 31 1
2 3 4 5 6 7 8
9 10 11 12 13 14 15
16 17 18 19 20 21 22
23 24 25 26 27 28 29
30 1 2 3 4 5 6

NEW PRODUCTS & SERVICES
� TradeStation has launched its new forex trading plat-form, one that enables the design, back-testing and automa-tion of forex trading strategies based on inside, interbankspreads. Forex trades may now be executed directly fromthe TradeStation order bar or market depth window, orthrough the use of macros or full automation. TradeStation’snew pricing plan offers tighter “inside” spreads — as smallas $10 per 100,000 deal lot for the most liquid currency pairs— in exchange for a reasonable “round-turn” commissionthat will typically be $5.00 per 100,000 deal lot. In additionto the new forex offering, this release of the TradeStationplatform, TradeStation 8.3, contains numerous fundamentaldata indicators, PaintBar Studies, and strategy componentsthat support the design and testing of fundamental datastrategies, and increased optimization of analysis techniquecalculations for Chart Analysis and RadarScreen. A detaileddescription of the new features, functions, and enhance-ments in TradeStation 8.3 is available athttps://www.tradestation.com.
� The Nasdaq plans to launch a new investor analyticsservice through its Shareholder.com subsidiary — “PinpointMarket Intelligence,” which is analysis of institutional pur-chases and sales of a specific stock. This analysis is provid-ed confidentially to the issuer and is used for measuringand benchmarking investor relations program effectiveness
and prioritizing management and staff time spent withinvestors. Pinpoint Market Intelligence will be available toall public companies and delivered to Nasdaq-listed companies through the Market Intelligence Desk (MID).Pinpoint Market Intelligence is expected to launch in the fourth quarter of 2007 and will be available to com-panies listed on all U.S. exchanges. Pricing is based on trad-ing volume, market cap, and additional Shareholder.comservices purchased. For more information visithttp://www.nasdaq.com.
� InstantBull Inc. has implemented a new ranking sys-tem that continuously monitors the top 100 stock marketbloggers on the Web. The system is based on impartial rank-ings from services at Alexa and Technorati. The new soft-ware release is free and also features “daily ticker trends”under InstantBull.com’s “Hot” tab. Investors can viewsearch trends for the most popular tickers over the course ofthe last four days. For more information, visithttp://www.InstantBull.com.
Note: New Products and Services is a forum for industry businesses to announce new products and upgrades. Listings are adapted from press releases and are not endorsements or recommendations from the Active Trader Magazine Group. E-mail press releases to [email protected]. Publication is not guaranteed.
CURRENCY TRADER • August 2007 49
THE FACE OF TRADING
BY CURRENCY TRADER STAFF
Name: Steve MisicAge: 50Lives/works in: Hoffman Estates, Ill.
S teve Misic first got into stock market investing inthe early 1990s, but like many other traders hebecame more active as the tech-stock bubble
expanded into 2000. Misic would often call in buy-and-holdtrades from his cell phone while driving a bakery salesroute. There wasn’t much to it, he remembers.
“I was trading from my truck,” he says. “It was one-way— you just bought it and it went up.”
As everyone knows, however, the ride didn’t last forever.When the bubble burst, Misic, like many others, rode mosthis holdings down. After that, he decided to learn how totrade.
“After I lost money in the bubble, I wanted to learn a way
to make sure that never happened again,” he says. He attended seminars and studied technical analysis. In
early 2004, Misic decided to trade full-time. For many yearshe had worked nights, and even after he quit his job hisbody clock was still set to awaken in the early hours of themorning. Trading around 2 a.m in the forex market was agood fit for him. He relied on traditional technical analysis,basing his short-term trading on support and resistanceconcepts.
Most important lesson learned: “Trading makes aperson humble. I’ll never get it all taken away from meagain because I learned from the last bubble. Right now,momentum trading is all the rage again, but eventuallythere will be a sell-off. I’ve learned how to trade technically.”
To read the complete profile, see the October 2007 issue of ActiveTrader magazine (http://www.activetradermag.com).
Rolling with the punches
KEY CONCEPTS
50 August 2007 • CURRENCY TRADER
Carry trades involve buying (or lending) a currency with ahigh interest rate and selling (or borrowing) a currency with alow interest rate. Traders looking to “earn carry” will buy ahigh-yielding currency while simultaneously selling a low-yielding currency.
Outlier: An anomalous data point or reading that is not rep-resentative of the majority of a data set.
Relative strength index (RSI): Developed by WellesWilder, the relative strength index (RSI) is an indicator in the“oscillator” family designed to reflect shorter-term momen-tum. It ranges from zero to 100, with higher readings suppos-edly corresponding to overbought levels and low readingsreflecting the opposite. The formula is:
RSI = 100 – (100/[1+RS])whereRS = relative strength = the average of the up closes over
the calculation period (e.g., 10 bars, 14 bars) divided by theaverage of the down closes over the calculation period.
For example, when calculating a 10-day RSI, if six of thedays closed higher than the previous day’s close, you wouldsubtract the previous close from the current close for thesedays, add up the differences, and divide the result by 10 to getthe up-close average. (Note that the sum is divided by the totalnumber of days in the look-back period and not the number ofup-closing days.)
For the four days that closed lower than the previous day’sclose, you would subtract the current close from the previouslow, add these differences, and divide by 10 to get the down-close average. If the up-close average was .8 and the downclose average was .4, the relative strength over this periodwould be 2. The resulting RSI would be 100 - (100/[1+2]) = 100- 33.3 = 66.67.
Standard error channel: The linear regression line is astraight line that minimizes the distance between itself andevery data point in the series you are working with. A standarderror measures the variance from the linear regression.Subtracting the standard error from the linear regression lineyields the bottom of the standard error channel, and adding itto the linear regression value gives you the top of the channel.
The standard error channel is a parallel concept to BollingerBands, which use the standard deviation calculation to setboundaries above and below a moving average to capture vari-ance away from the average. Because the moving average is awavy line, the Bollinger Bands are wavy, too, and also widenor narrow as variability rises or falls. The standard error doesthe same thing, only with straight lines.
The critical difference is that you don’t need to choose astarting and ending point for Bollinger Bands, because theytrack a moving average that constantly discards old data andrefreshes itself with new data. To construct a useful linearregression channel, however, you have to pick reasonablestarting and ending points. It’s still “mathematics” and thus abetter way to draw a trendline than using your eye alone, butyour choice of starting and ending points is inherently judg-mental. Most practitioners chose an obvious lowest low orhighest high.
Stochastic oscillator: A technical tool designed to high-light shorter-term momentum and “overbought” and “over-sold” levels (points at which a price move has, theoretically atleast, temporarily exhausted itself and is ripe for a correctionor reversal).
Calculation: The stochastic oscillator consists of two lines:%K and a moving average of %K called %D. The basic sto-chastic calculation compares the most recent close to the pricerange (high of the range - low of the range) over a particularperiod.
For example, a 10-day stochastic calculation (%K) would bethe difference between today’s close and the lowest low of thelast 10 days divided by the difference between the highest highand the lowest low of the last 10 days; the result is multipliedby 100. The formula is:
%K = 100*{(Ct-Ln)/(Hn-Ln)} whereCt is today’s closing price Hn is the highest price of the most recent n days (the default
value is five days) Ln is the lowest price of the most recent n days The second line, %D, is a three-period simple moving
average of %K. The resulting indicator fluctuates between 0and 100.
Fast vs. slow: The formula above is sometimes referred to as“fast” stochastics. Because it is very volatile, an additionallysmoothed version of the indicator –– where the original %Dline becomes a new %K line and a three-period average of thisline becomes the new %D line –– is more commonly used (andreferred to as “slow” stochastics, or simply “stochastics”).
Any of the parameters –– either the number of periods usedin the basic calculation or the length of the moving averagesused to smooth the %K and %D lines –– can be adjusted tomake the indicator more or less sensitive to price action.
Horizontal lines are used to mark overbought and oversoldstochastic readings. These levels are discretionary; readings of80 and 20 or 70 and 30 are common, but different market con-ditions and indicator lengths will dictate different levels.
Variance and standard deviation: Variance measureshow spread out a group of values are — in other words, howmuch they vary. Mathematically, variance is the averagesquared “deviation” (or difference) of each number in thegroup from the group’s mean value, divided by the numberof elements in the group.
For example, for the numbers 8, 9, and 10, the mean is 9and the variance is:
{(8-9)2 + (9-9)2 + (10-9)2}/3 = (1 + 0 + 1)/3 = .667Now look at the variance of a more widely distributed set
of numbers — 2, 9, and 16:{(2-9)2 + (9-9)2 + (16-9)2}/3 = (49 + 0 + 49)/3 = 32.67The more varied the prices, the higher their variance — the
more widely distributed they will be. The more varied a mar-ket’s price changes from day to day (or week to week, etc.),the more volatile that market is.
A common application of variance in trading is standarddeviation, which is the square root of variance. The standarddeviation of 8, 9, and 10 is: .667 = 0.82; the standard devia-tion of 2, 9, and 16 is: 32.67 = 5.72.

51 August 2007 • CURRENCY TRADER
EVENTS
Event: Forex Trading ExpoDate: Sept. 15-16Location: Mandalay Bay Hotel and Casino, Las VegasFor more information: Visit http://www.forextradingexpo.com
Event: FIA and OIC New York Equity Options ConferenceDate: Sept. 19-20Location: Grand Hyatt New YorkFor more information: Visit http://www.futuresindustry.org and click on “Conferences.”
Event: Paris Trading ShowDate: Sept. 21-22Location: Espace Champerret, Paris, FranceFor more information: Visit http://www.salonat.com
Event: Wealth ExpoFor more information: Dates and locations are listedhere or visit http://www.thewealthexpo.com
Date: Sept. 29-Oct. 1Location: Seattle, Wash.
Date: Nov. 30-Dec. 2Location: Schaumburg, Ill.
Event: TradeStation Futures SymposiumFor more information: Dates and locations are listedhere or visit http://www.tradestation.com/strategy
Date: Oct. 18-20Location: Costa Mesa, Calif.
Date: Dec. 6-8Location: Hallandale, Fla.
Event: 20th Annual IFTA ConferenceDate: Nov. 8-11Location: Sharm el Sheikh, EgyptFor more information: Visithttp://www.ifta.org/events/next-conference/
Event: The Traders Expo Las VegasDate: Nov. 15-18Location: Mandalay Bay Resort and Casino, Las Vegas, Nev.For more information: Visithttp://www.tradersexpo.com
Event: 23rd Annual Futures & Options ExpoDate: Nov. 27-29Location: Hyatt Regency Chicago, Chicago, Ill.For more information: Visit http://www.futuresindustry.org and click on “Conferences.”
HHIITT YYOOUURR MMAARRKK!!Advertise in Active Trader Magazine
Contact Bob DormanAd sales East Coast
(312) 775-5421
Allison EllisAd sales West Coast
(626) 497-9195
Mark SegerAccount Executive
[email protected](312) 377-9435

Date Contract Entry Initial Initial IRR Exit Date P/L LOP LOL Trade stop target length
7/19/07 DXU07 80.22 80.49 79.10 4.15 80.52 7/25/07 -0.30 (0.4%) +0.35 -0.30 4 days
TRADE SUMMARY
Legend: IRR — initial reward/risk ratio (initial target amount/initial stop amount); LOP — largest open profit (maximum available profitduring lifetime of trade); LOL — largest open loss (maximum potential loss during life of trade).
FOREX TRADE JOURNAL
Even at historically low levels,
analysis demands taking a short
position in the dollar index futures.
TRADE
Date: Thursday, July 19.
Entry: Short September dollar indexfutures (DXU07) at 80.22.
Reason(s) for trade/setup: The dollarindex is at multi-year lows (see “Spotcheck,” p. 38), but signs point toward con-tinued weakness. Patterns similar to theJuly 18 low bar have been followed bylower closes more than 70 percent of thetime on each of the following 10 days (20patterns tested since 2000). If the trade is wrong, it shouldbecome apparent relatively quickly: The dollar should rallyquickly off this obvious chart support if dollar bulls (whono doubt have been buying around this level) have theirway with the market.
Initial stop: A close above 80.49, which is the July 18 high.The market could very well move sideways or slightly high-er to try to fake out traders before making another down-side thrust.
Initial target: 79.10, which is 0.10 above the next round-number price below 80.00. Take partial profits and trail astop behind the remainder of the position.
RESULT
Exit: 80.52.
Reason for exit: Initial stop triggered.
Profit/loss: -0.27.
Trade executed according to plan? Yes.
Outcome: After recouping much of its big decline on July20, the dollar index futures gapped lower on July 24 andtraded as low as 79.87 (the buck fell more than 1 percent vs.
the Canadian dollar on this day). However, the dollar indexwas showing signs of strength toward the end of the sessionand had bounced back almost to 80.00.
We kept the stop at its original level, as the market has notmoved enough to merit lowering it by a significant amount.The risk on this trade is very small, and reducing it to noth-ing would serve no purpose except to virtually eliminateany profit potential. Further volatility is likely, but the initialprofitable move will make it easier to absorb.
Update, July 25: The market made a decisive move to theupside, with the dollar index futures gapping more than0.30 higher and closing at 80.52, stopping out the trade. Thenext day price turned back down and was trading at 80.35around midday.
Although this jump looks like it could be the beginning ofa move off resistance, we will consider re-entering on theshort side if follow-through does not materialize. It wouldbe just like the market to attempt to throw traders off trackwith a move like this before continuing lower.�
Note: Initial trade targets are typically based on things such as thehistorical performance of a price pattern or trading system signal.However, because individual trades are dictated by immediate cir-cumstances, price targets are flexible and are often used as points atwhich to liquidate a portion of a trade to reduce exposure. As a result,initial (pre-trade) reward-risk ratios are conjectural by nature.
52 August 2007 • CURRENCY TRADER
Source: TradeStation

THIS MONTH’S ADVERTISERS
Click on these boxes
to link directly
to these advertiser’s
web sites
CURRENCY TRADER • August 2007 53

54 August 2007 • CURRENCY TRADER
NewsTrader ProHistorical price action for 7 major currency pairs
and over 40 U.S. and International economic indicators.Charts, detailed data analysis and more.
More information, screen shots and a demo are at
www.NewsTraderPro.com
ADVERTISERS continued