cup mostly full austin 4q13 report and 2014 forecast mark sprague state director of information...
TRANSCRIPT

Cup Mostly Full
Austin 4Q13 report and 2014 forecast
Mark SpragueState Director of Information CapitalIndependence Title

2013 Was a Good Year!• Record year for Austin home resale's• 2013 was the year Austinites felt and saw the recovery• Austin economy is in expansion mode, rather than recovery• More demand than inventory in most channels• Austin is one of nations top job markets• Austin residential investment properties 95+% occupancy with
continued rental income increases. Commercial, retail, industrial at 90+% occupancy
• Austin has enjoyed double-digit growth in GDP, jobs, population and birthrate since 2007
• Milken Institute named Austin top performing metro 2013• Austin leads nation in economic and job growth – Forbes• Austin is No. 1 on list of the Cities Creating the Most Middle Class Jobs
– Forbes
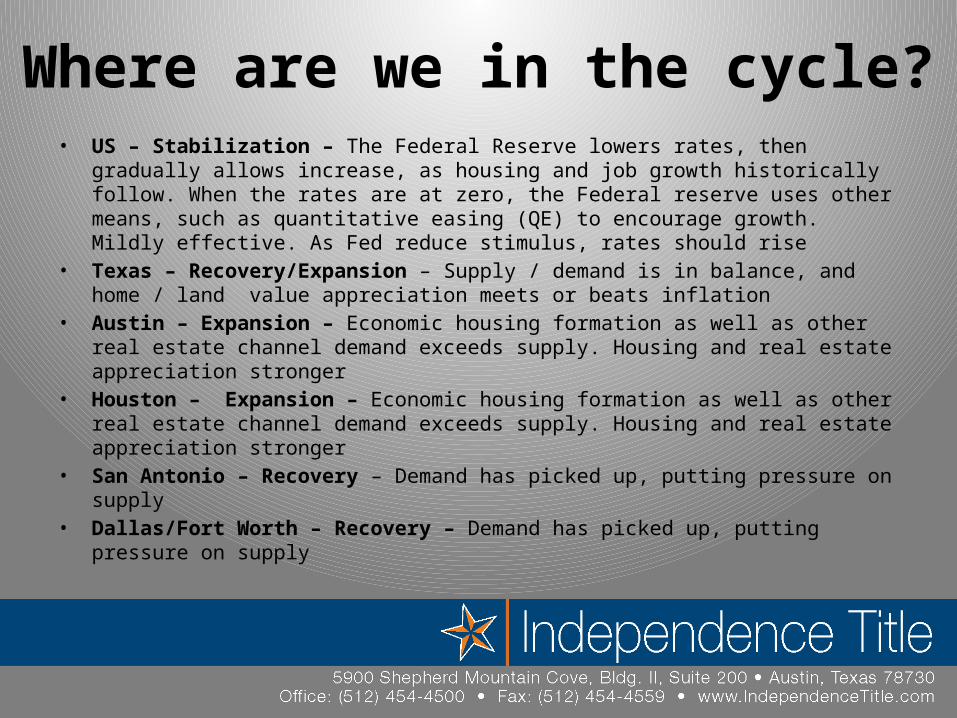
Where are we in the cycle?• US – Stabilization – The Federal Reserve lowers rates, then gradually allows
increase, as housing and job growth historically follow. When the rates are at zero, the Federal reserve uses other means, such as quantitative easing (QE) to encourage growth. Mildly effective. As Fed reduce stimulus, rates should rise
• Texas – Recovery/Expansion – Supply / demand is in balance, and home / land value appreciation meets or beats inflation
• Austin – Expansion – Economic housing formation as well as other real estate channel demand exceeds supply. Housing and real estate appreciation stronger
• Houston – Expansion – Economic housing formation as well as other real estate channel demand exceeds supply. Housing and real estate appreciation stronger
• San Antonio – Recovery – Demand has picked up, putting pressure on supply• Dallas/Fort Worth – Recovery – Demand has picked up, putting pressure on supply
All of this is caused by dynamic job growth in Texas.

2014 key strengths• American economy improving. Slow national recovery• Texas economy strong. 7 other states to prerecession numbers• Energy and new technology have put US on top of oil/gas producers
Texas energy businesses lead nation• Federal Reserve begins slowing tapering• Mortgage and interest rates historically low
– Mortgage interest rates in the 4-percent range were unheard of until 2010, and rates in the 5-percent range were unknown prior to 2003
– 1970s, rates hovered in the 7-percent range and spiked up above 9 percent in late 1975, late 1976 and most of 1978
– In the early 1980s, mortgage interest rates brushed the stratospheric highs of 18 percent and even 19 percent– During the 1990s, mortgage interest rates ranged from around 7 percent to roughly 9 percent.. They held at less
than 9 percent in 2000, less than 8 percent in 2001 and less than 7 percent in 2003
• 6+ years of economic negativity, replaced by positive outlook• Consumers and businesses spending• Texas sustains economic growth through year into 2015• Low inventory – better than the alternative• Resale / new homes sales continue positive appreciation / sales• Other real estate channels strong though 2014• Sustained GDP growth (below average)

2014 key strengths• Continued low inflation• Job creation. More people are working, more jobs created• On average in the past 12 months employer payrolls have increased 182,000 a
month, almost exactly the rate of gain we saw in 2012. All the gains took place in the private sector. Government employment fell slightly over the year
• Interest rates will continue at low levels but gradual increase to low 5’s. Consumers continue to watch Federal Reserve
• Americans have credit capacity again, but lenders slow to lend • Mortgage rates still low. What’s the mortgage market going to look like post
Dodd-Frank, post QE taper? • Regulatory uncertainty & political risk continue to fuel business indecision• National rebound started in 2011, slow progress 2012, 1st 8 months 2013
– Austin and other major Texas metros rebound started in 2Q2010 – Regional real estate and economy show strength 2013, continue through
2014– Slow improvement nationally from worst economy in 60+ years
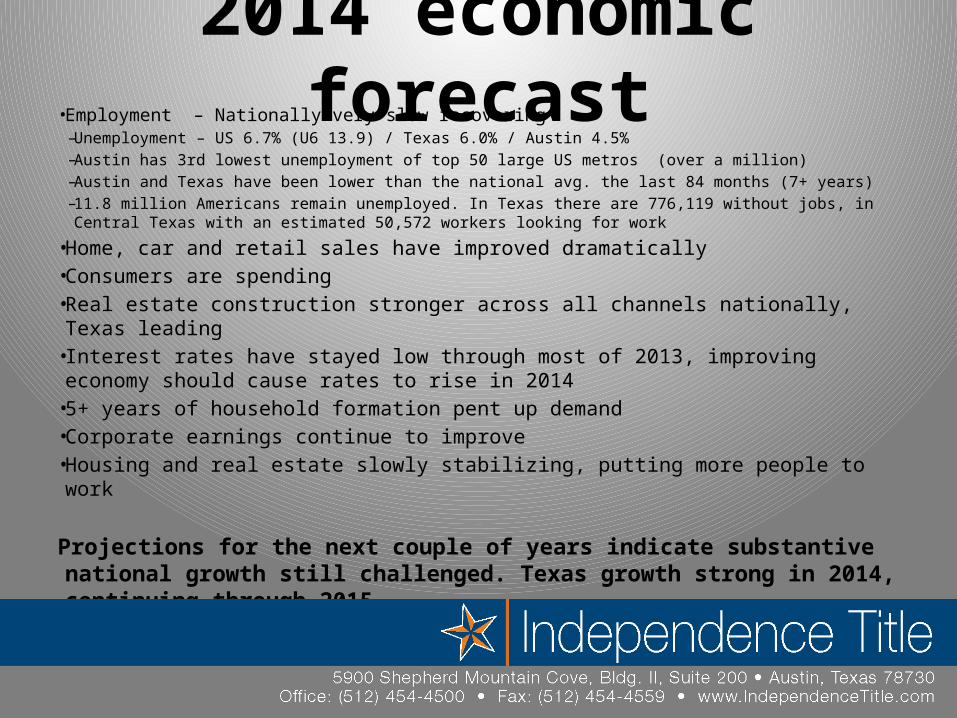
2014 economic forecast• Employment – Nationally very slow recovering
– Unemployment – US 6.7% (U6 13.9) / Texas 6.0% / Austin 4.5%– Austin has 3rd lowest unemployment of top 50 large US metros (over a million) – Austin and Texas have been lower than the national avg. the last 84 months (7+ years)– 11.8 million Americans remain unemployed. In Texas there are 776,119 without jobs, in Central
Texas with an estimated 50,572 workers looking for work
• Home, car and retail sales have improved dramatically• Consumers are spending• Real estate construction stronger across all channels nationally, Texas leading• Interest rates have stayed low through most of 2013, improving economy
should cause rates to rise in 2014• 5+ years of household formation pent up demand • Corporate earnings continue to improve• Housing and real estate slowly stabilizing, putting more people to work
Projections for the next couple of years indicate substantive national growth still challenged. Texas growth strong in 2014, continuing through 2015

2014 economic concerns • Concern over below average GDP growth• Continued low inflation / deflation? US & global• National job recovery slow. More people are working and more jobs created, but we
are still 2+ million short of peak• Interest rate shock, consumer hopes that rates won’t increase. Watch Federal
Reserve closely. End of QE tapering. Fed actions key• Interest rates probably increase. Impact?• Cautious optimism by households and businesses through 2014• Home mortgage financing concern. New QRM guidelines stricter than past 10 years• Regulatory guidelines for small business and lending slowing growth. • Regulatory uncertainty & political uncertainty continue to fuel price uncertainty.• Higher consumer credit leading to increased spending without increased income• Lifting US export restrictions on oil and natural gas• Regulations on private investment in Mexican oil and gas by (US) companies• Another debt crisis in congress ( spring & summer) • Implementation effects of Dodd Frank, CFPB and Healthcare initiative

2013 ends with weakest job growth in years

When will payroll exceed prerecession peak?
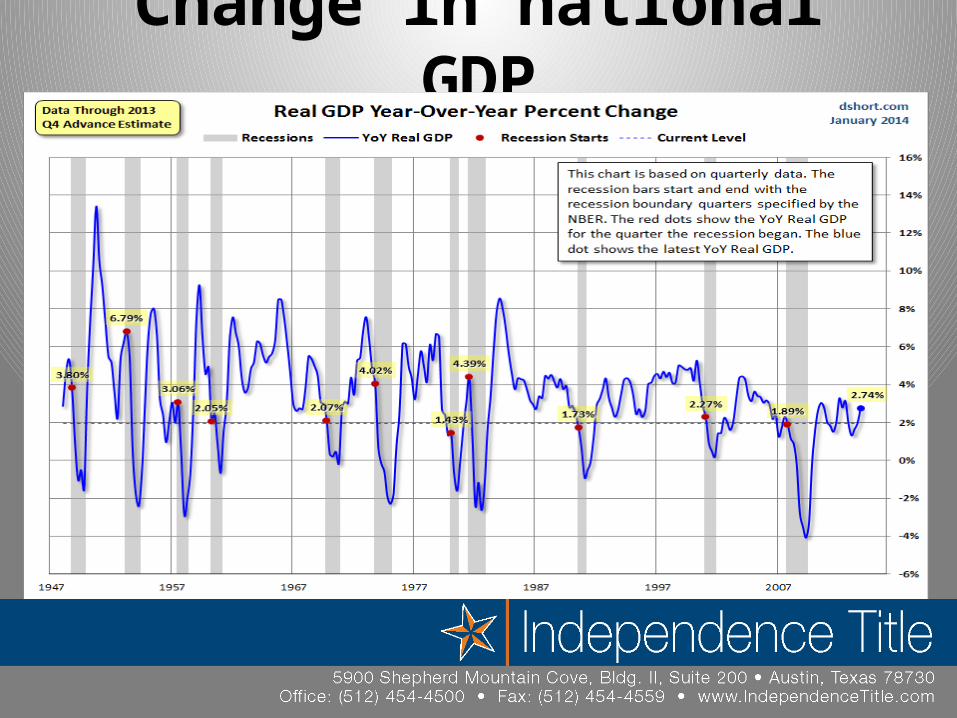
Change in national GDP
The average rate oAverage GDP growth is 3.2% per quarter since 1947

Change in national GDP
The average rate oAverage GDP growth is 3.2% per quarter since 1947

Historic interest rates since 3000BC
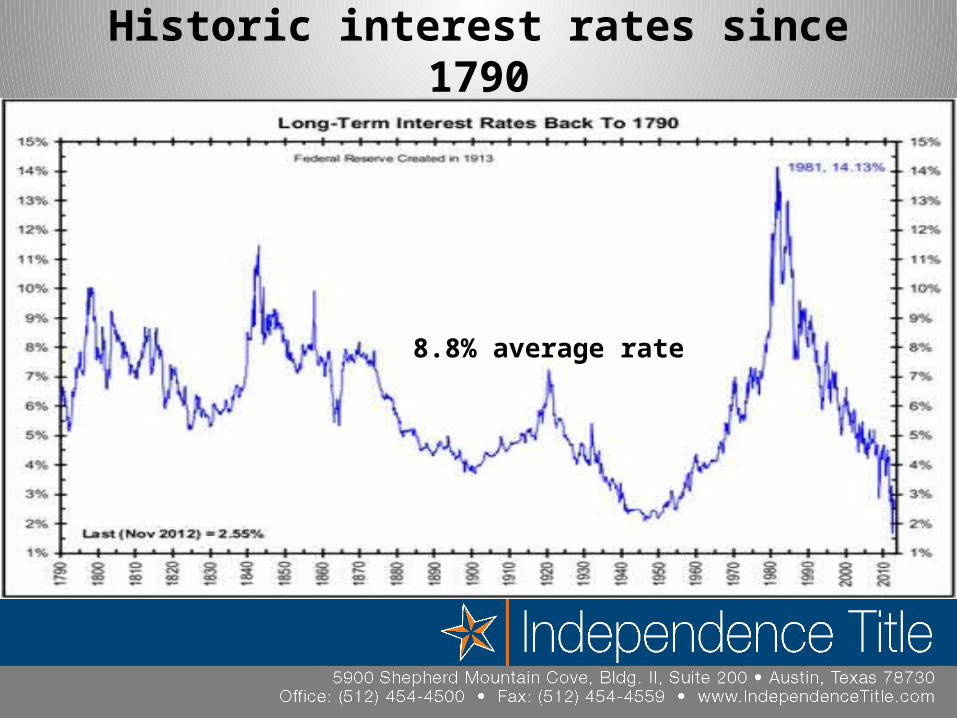
Historic interest rates since 1790
8.8% average rate

Mortgage RatesWhy wait?
Freddie Mac / Haver Analytics 8/ 13
1st sign of economic wave
1951 was the last time rates were this low.

Reasons mortgage rates will continue to rise
•No more cheap money. Fed has announced the move to higher borrowing costs• The End of Freddie and Fannie;
•Don’t know what it will be, but every one wants a change•95% of all loans are done by the government presently, 60% prerecession. Hard to replace or compete against
• Inflation is on the march•Mortgage rates have a direct correlation to demand•As the economy improves, inflation will begin to set in naturally. To offset the risk of drastic rising inflation, the federal government (Federal Reserve) will be forced to raise their interest rates
•Supply and demand•Something's go to give and it doesn’t look like it will be inflation
• History•Interest rates have risen….however they are still at near 60 year lows•30 year mortgage rates have averaged 8.88 percent over time. They have been under 5 percent in just 41 of the 524 months on record or about 4+/-% of the time. Just a return to the lower 25 th percentile of all time mortgage rates would see rates rise to 6.92%•Interest rates are expected to go up! Not down!•For every point increase, there is a loss of 12% buying power

Four big national economic indicators continue to be positive

Texas region continues to lead nation in GDP growth

True National Unemployment vs. Headline
Source: BLS 8 2013
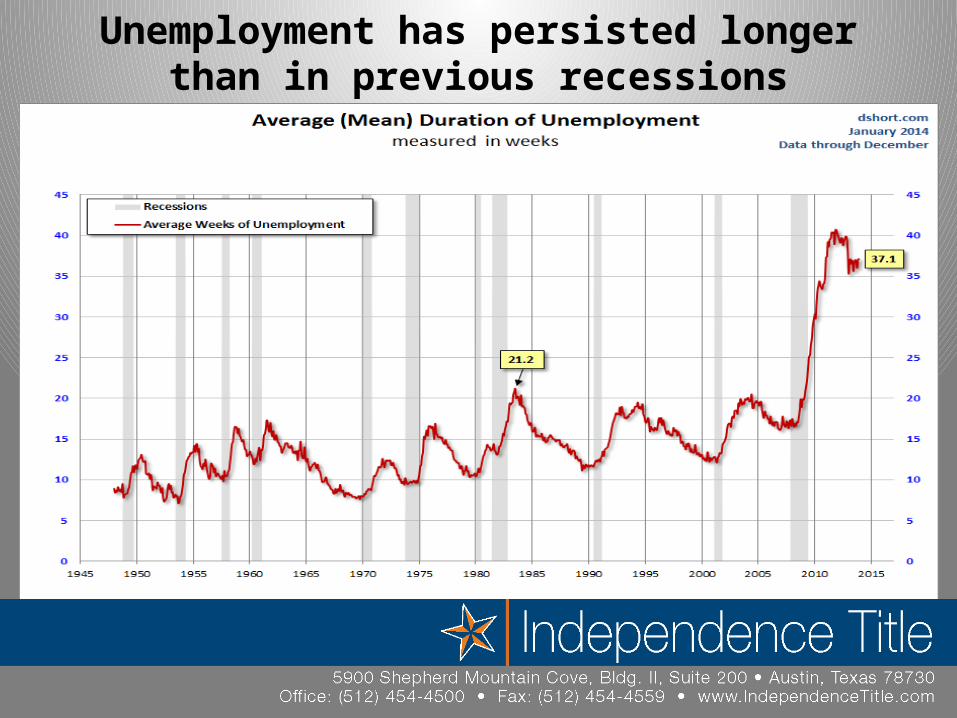
Unemployment has persisted longer than in previous recessions

Small Business Looking to Hire in Next 3 Months

Small Business OptimismRebounding to 2003 recession trough
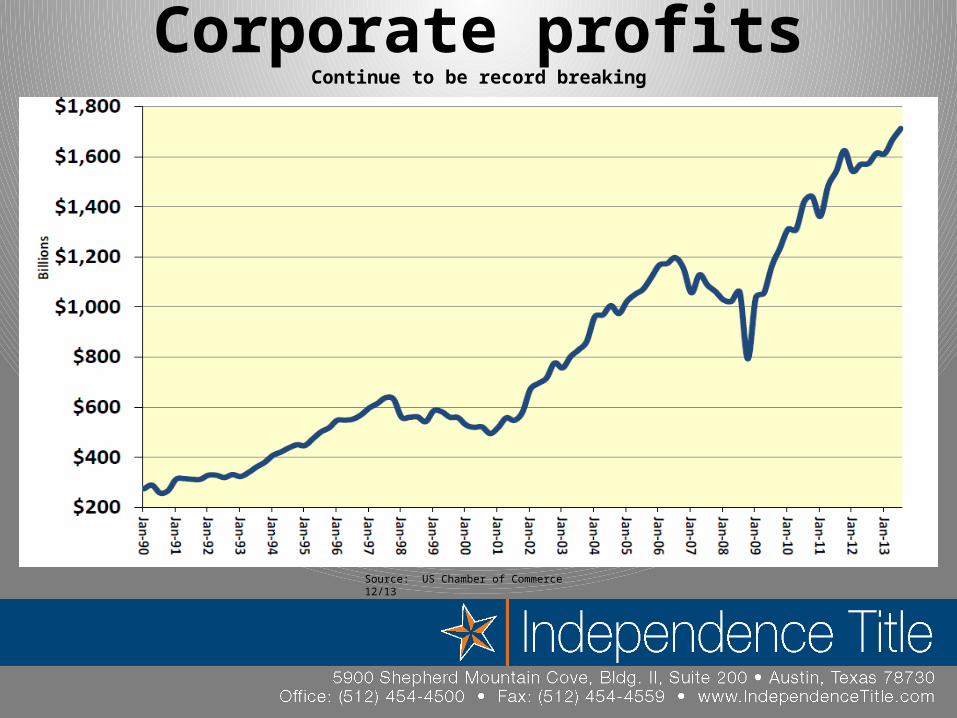
Corporate profitsContinue to be record breaking
90.8
70.4
Source: US Chamber of Commerce 12/13

Non-Financial Corporate Cash at All Time High
90.8
70.4
Source: US Chamber of Commerce 12/13
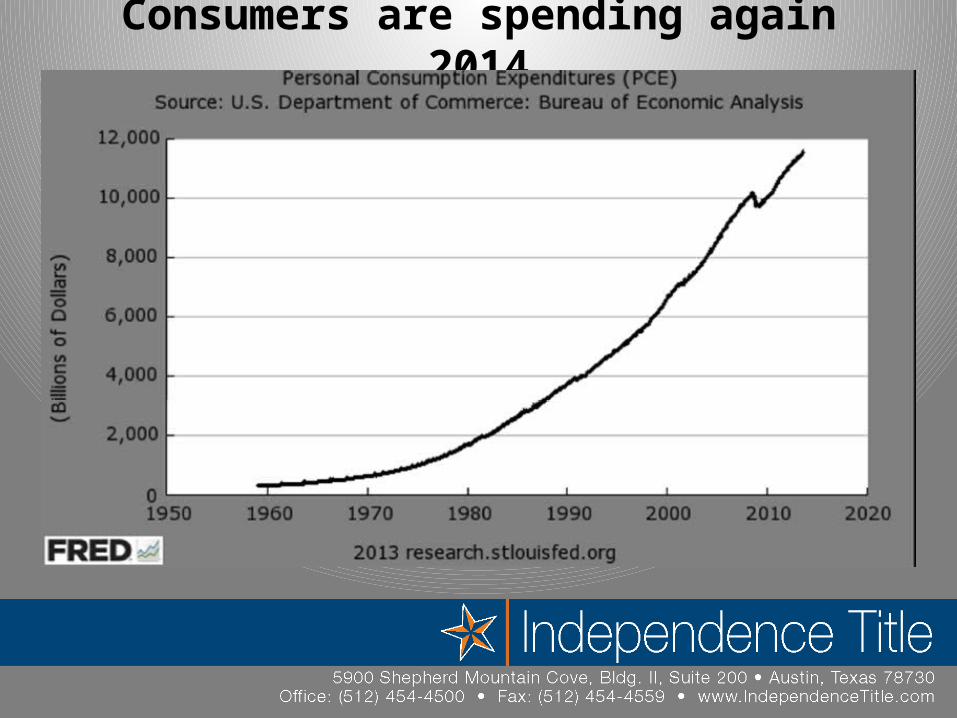
Consumers are spending again 2014
90.8
70.4

Household Net Worth Recovering 2014
90.8
70.4

Households Lost $8 Trillion in Real Estate Equity During this Recession
90.8
70.4

Payment on Long Term Debt vs. Personal Income
90.8
70.4

Inflation Remains Relatively Low
90.8
70.4

Traditional real estate economic indicators in Texas remain strong
• Texas and Austin indicators continue to show strength• Job gains• Improving real estate values (residential, commercial, retail, industrial, etc.)• General business growth• Continued population growth• Demand greater than supply in all Texas metros• Real estate and land values continue improvement• All channels have appreciated this last 2 years
– Central and south central Texas area leading the state with a 6+% increase in rural values sold over the previous year, 2012. Texas leads the nation in number of farms and ranches, with 247,500 farms and ranches covering 130.4 million acres as well as the highest average value of farm and ranch real estate in any state.

Housing market conditions• Affordability – price / payment to income (rates still at near historic lows)• Pent up demand. Household formations – 1 million+ in 2012, 550K to
600K annually last 5+ years • Rising rents (nationally, regionally and locally)• Fewer distressed sales. Foreclosures on downward spiral (especially in
Austin / Texas where they make up less than 1% of market)• Smaller inventory of new and resale homes• A sellers market locally and regionally• Nationally improving, but not yet whole. Texas continues to improve• Mortgage and bank rates creeping up• Expectations – the market has turned. Set proper expectations
‘The house or apartment you look at today will be gone tomorrow!’

Now is the time to buy!• Austin area resale home inventory is at 2.0 months (seller’s market)
– 4545 single family listings.
• New and resale home inventory levels tight– Values appreciating in most Austin sub markets
• Austin home values remained positive during recession and continue to gain value
• Record affordability, 2nd lowest mortgage rates in 60+ years• 1 out of 3295 properties in Travis County, 1 in 4338 in Austin are in
foreclosure• Residential, rental and office entitlements at lowest levels in 6+ years• Lending requirements still tight, causing fewer opportunities• Rentals –95% occupancy / less than 7,384 units left in five county area• 56,000+ people annually moving to Austin annually• Lower Supply + Higher Demand = Value improvement

The numbers…• 147,684 total rental units in Austin
• 95% occupancy = 7384 units available + 5880 units under construction to be completed 2014
Total of 13,264 rental units available in the next 12 months.
• 9,000 to 12,000 home starts this year• For every 2 jobs / one home start
• 4,545 listings presently• Total shelter 29,809 units available• Total annual immigration 56,000+

Top Selling MLS Areas 2013MLS Area Sales
RRE 1722PF 1676
CLN 1658RRW 1569CLS 1416HH 1380LS 1320
GTW 1320NW 91610S 791

Annual Employment Growth Texas and US

Unemployment Rates for Austin, Texas, and US
1 out of 2 jobs in US created in Texas

Unemployment Rates for Texas Metros

State Unemployment Rate and Max for 2007 Recession
1 out of 2 jobs in US created in Texas

Texas Jobs at Record High
Source: Texas A&M Real Estate Center


Monthly Unemployment Rate vs. Labor Participation Rate
Source: BLS and DShort

Source: BLS / Conference Board

Consumer Confidence Level
94.2
81.2

2014-15 outlook for Texas economy• Downside risks:
• National (global) recession• National slow economic growth and recovery• Energy sector slower growth• Tech decline and new technology
• Texas job growth continues to outpace national rate• Energy industry slowing expansion• State and local budget deficits and level spending• Federal furloughs – defense, education, etc.• Population growth continues even stronger with continued job
creation– The need for ‘tech’ workers in all metros, across the state– Continued immigration from California due to ‘business friendly’ / less tax burden
environment
• New construction rebound continues, but far from ‘recovered’• Pent up demand for all channels of real estate driven by investment,
affordability, low interest rates

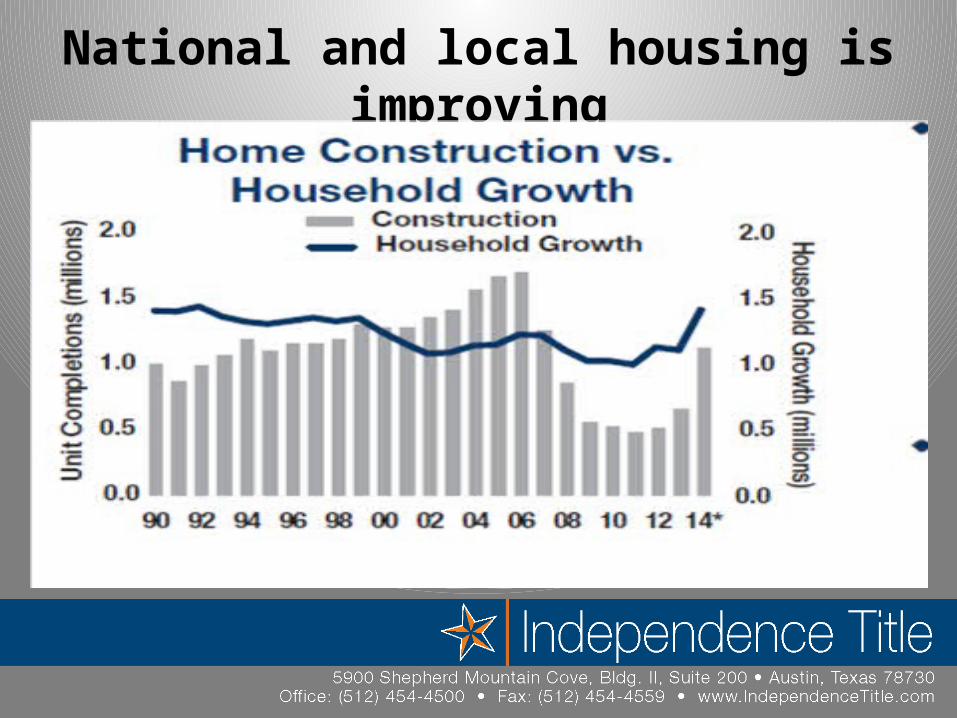
National and local housing is improving Nationally the housing market is improving
• National 2013 –914,000 projected starts (off 49%)• Austin SMSA - forecast 2013 – 9800 to 12,000 (Austin could do 15,000+ if
desirable lots were available.) Nationally and locally, lack of inventory still a challenge Housing inventory back to more balanced levels
• Resale listing inventory• US avg. 5.1 months / 2.09 Million • Austin SMSA 2.0 months / 4,545 listings
– Inner Core Neighborhoods: tight– Close in Neighborhoods: tight– Suburban Neighborhoods: Improved to tight. Most have become ‘sellers’
market House price trends (annual basis / median value)
• US 4 to 6% / Texas 8% / Austin 8 to 12+% SMSA
National and local housing is improving


National economic outlook 2014
• Most indicators positive, but not robust– Job formations & employment slow nationally– Real income not increasing
• Local example: last 10 years / home appreciation 58% / rent appreciation 38% / wages flat– Personal consumption / economic activity (GDP) slow– Inflation dangerously low
• Sluggish growth through end of the year• Interest rates increase but stay low comparatively thru 2014• Bank and mortgage credit attractive, but still tight
– Still dependent on major government support: interest rates, MBS purchases by Fed, FHA and GSES
• Housing challenged with lack of inventory as well as appraisals nationally thru 2015
• Construction Recovery mostly in MF as rental markets remain strong• Only 7 states are at prerecession employment• International and national economy uncertainty• Good news – you live in Texas! You live in Austin!

Outlook for 2014

Where are we comparatively?Nationally• Home prices down 35+% since 2006
peak• $7.5 trillion, over 49% lost equity in
housing meltdown• Defaults, delinquencies, and
foreclosures improving• New home starts improved for last 12
months, 34.5 % annually. 50+% less than 2006 starts
• New household formation 25% of historic annual rate
• Federal government mortgage programs have had little impact to national economy
• Federal Reserve policies have helped• CFRB continues to affect mortgage /
bank lending
Texas• Home prices improving statewide.
Austin maintains good appreciation• All major Texas metros have turned
positive• Labor and materials costs
dramatically up• Texas foreclosures minimal, small
impact• Austin foreclosures minimal• Texas and metros doubling in
population next 20 years• Not enough inventory in most real
estate channels in Texas metros• State job creation 43+% of national
growth• Regional banks are healthy

Foreclosure process and its challenges
Source ; Realty Trac 5 /13
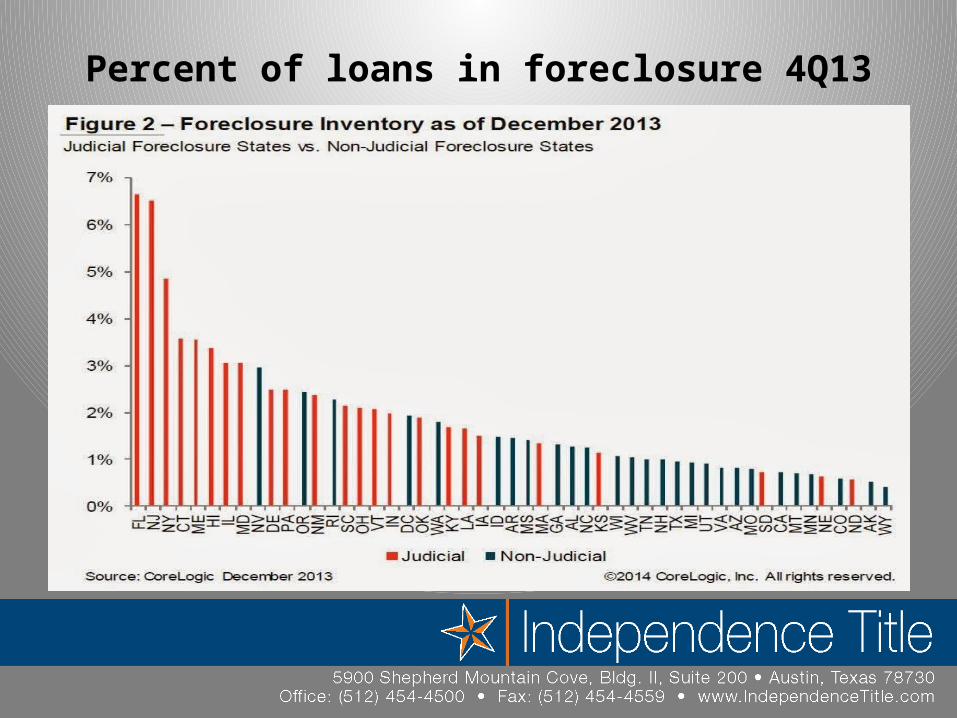
Percent of loans in foreclosure 4Q13
US 4.43
Texas 1.9
Over 55% of all foreclosures are in 32 counties

Monthly Foreclosure Listings
Source: RealtyTrac 5/13
Foreclosures are less than 1 ½% of Texas market
US
TX

Where housing markets have recovered


Texas on the top of many lists!

Months Inventory of Unsold HomesAustin
Source: RealtyTrac 5/13
Foreclosures are less than 1 ½% of Texas market
US
TX

Metro Comparison Housing

Austin Sales Price Distribution2003 - 2013
Source: RealtyTrac 5/13
Foreclosures are less than 1 ½% of Texas market
US
TX
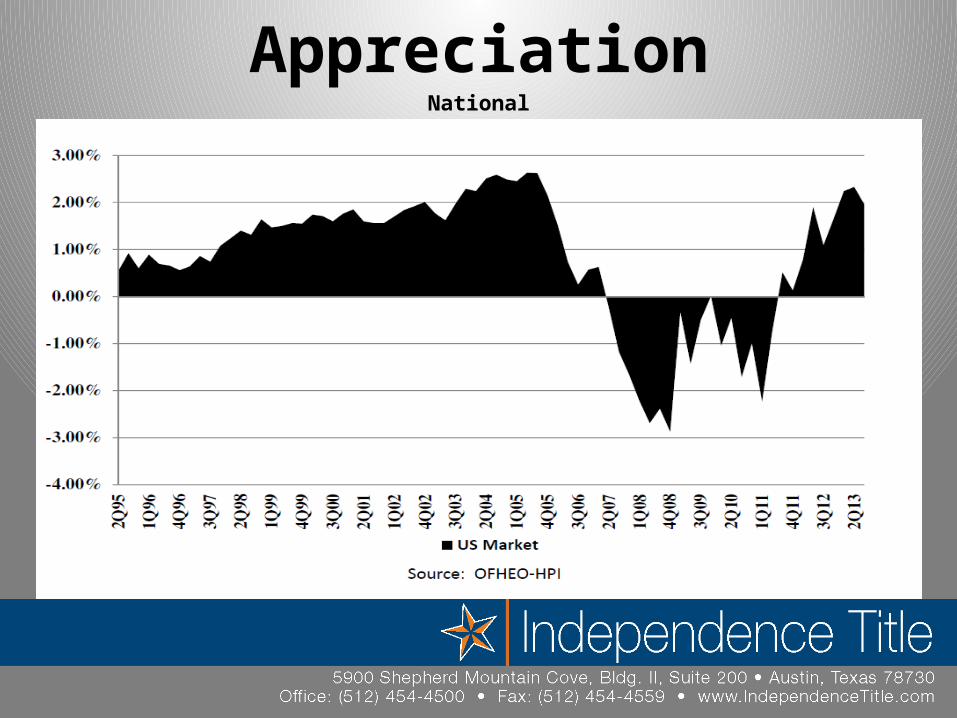
House Price AppreciationNational

House Price Appreciation

National perspective
Mortgage qualification changes
• In wake of credit issues, mortgage originators raised the bar on the qualification process for those buyers that were on the peripheral. (Low doc / no doc / no credit score / no down payment, etc.)
• Sub – prime is non existent. Jumbo has eased up• No down payment loans with FICO scores <740 very difficult to obtain.• Modest down payment loans will not work without documentation.
• American Mortgage Bankers Association research indicates that latest changes in mortgage qualification standards will increase percentage of buyers unable to qualify.
• Previously thought that 10% of buyers that purchased in 2006 would not qualify today

QRMWhat are the new rules?
QM loans cannot:Contain risky features, such as terms that exceed 30 years, interest-only payments or payments that are less than the full amount of interest so that the home loan debt grows each month.Carry more than 3% in upfront points and fees for loans above $100,000.Push a borrower's total debt load above 43% of his or her monthly income, unless the loan is eligible to be backed by Fannie Mae or Freddie Mac, or a federal housing agency such as the FHA, or is made by a small lender that keeps the loan on its books.
Ability to repay standards QRM / ATR guidelines are as follows;Current or reasonably expected income or assetsCurrent employment statusMonthly payment on the covered transactionMonthly payment on any simultaneous loanMonthly payment for mortgage-related obligationsCurrent debt obligations, alimony, and child supportMonthly debt-to-income ratio or residual incomeCredit history

Reasons mortgage rates will continue to rise
•No more cheap money. Fed has announced the move to higher borrowing costs•The End of Freddie and Fannie;
•Don’t know what it will be, but every one wants a change
•Inflation is on the march•Mortgage rates have a direct correlation to demand.•As the economy improves, inflation will begin to set in naturally. To offset the risk of drastic rising inflation, the federal government (Federal Reserve) will be forced to raise their interest rates.•Supply and demand•Something's go to give and it doesn’t look like it will be inflation.
•History•Interest rates have risen….however they are still at 60 year lows•30 year mortgage rates have averaged 8.88 percent over time. They have been under 5 percent in just 41 of the
520 months on record or about 4+/-% of the time. Just a return to the lower 25 th percentile of all time mortgage rates would see rates rise to 6.92%.•Interest rates are expected to go up! Not down!•For every point increase, there is a loss of 12% buying power

How do you build confidence in the housing market?
• Realtors / mortgage professionals need to explain to buyers why the market has changed and now is the time to buy
• It would be helpful to see what the months inventory number looks like in their community and the city as a whole. Explain why prices are firm when monthly inventory drops below 6 months
• It would be helpful to show buyers the mortgage interest rate chart to help buyers to get a perspective of the current rates and affordability. Be sure to use more than 5 years of history
• Purpose of this is to show them there never will be a better time to buy!

Conclusions• Austin and Texas Metros continue to grow in jobs and population
– How much more can it grow with constrained supply?
• Years of pent up demand – 5+ years– We are 2+ years into local recovery
• Interest rates stay low through 2014, great time to buy– Affordability; prices and interest rates. Rate increase will slow sales temporarily– QE3 and monetary policy changing. In healthy economy, rates should go up
• Real estate to get stronger and hotter– Under supply of homes. less downward price pressure– Not many ‘A’ opportunities left; housing, land, commercial. Where is the opportunity?– Rents are up, as are values. Bottom of market was 3 years ago– For qualified buyers, an ideal time to buy, selection and inventory a problem– Housing inventory looks like it bottomed in 2013
• National housing market will remain slow and steady, local and regional continue to strengthen through 2014
– Homebuilding and Realtors more optimistic than previous 5+ years– Homebuilders constrained to respond
• National and regional rental market will strengthen through mid 2014• National economy slow improvement, Regionally and locally the economy should
remain strong 2014/15• Best Austin market in 35 years+

If not now, when?• The market is not going to improve for buyers. Waiting will be easily a 12+% annual
cost. Just because they couldn’t buy at the bottom, no reason to wait.• The supply of U/C inventory is dropping; won’t be able to replace at values sold.
Resale has picked up in all neighborhoods this year, showing strength of market• Rates are inching up………(These are the lowest rates in 60+ years)
– 12% rule• Owning is cheaper than renting!• Finished vacant housing and real estate inventory is a thing of the past! Its either
sold or leased, creating a limited purchasing opportunity• Builders aggressive on land, concerned about enough capacity in 2015, driving
values up• Labor and materials increasing in cost• There is not many deals in the market today. If on the market more than 45 days,
value or product needs to be ‘reviewed’.• Discounted housing is a thing of the past.

Texas and Austin are different from the rest of the country!
Home and real estate prices continue to appreciate in Austin The wide value swings of the rest of the country were never present
here Austin is still an affordable metro market in comparison to the nation Texas has one of the lowest tax burdens in the country (46th) Continued positive job growth Over 50% of all jobs created last two years were in Texas Limited supply of Inventory / rental homes / apartments
– Rent values increasing– Rental occupancy has been steady at 94+ % average last 3+ years– Not enough developed land and lots
More Fortune 500 corporate headquarters are located in Texas than any other state

Why buy Austin today?• Of all the markets, Austin has seen little to no price
erosion over the past few years• Hard costs for development and housing continue to rise
at about 18% to 22%• Austin and Texas are strong short and long term
investments• Barring a catastrophic event, values will continue to
improve in Austin and other Texas Metros• Investment income has continued to rise in Austin, and
they have stabilized in the Texas Metros. As the national economy improves, Austin, etc. is at the top of most lists for relocation, corporate and personal.

Thank you